Embed Size (px)
Citation preview
i
Characteristics of Tight Reservoirs in the Oligocene Huagang Formation, Xihu Sag, East China Sea Basin
A Thesis
Submitted to the Faculty of Graduate Studies and Research
In Partial Fulfillment of the Requirements
for the Degree of
Master of Science
in Geology
University of Regina
by
Fanghao Xu
Regina, Saskatchewan
July 27, 2015
Copyright 2015: Fanghao Xu.

UNIVERSITY OF REGINA
FACULTY OF GRADUATE STUDIES AND RESEARCH
SUPERVISORY AND EXAMINING COMMITTEE
Fanghao Xu, candidate for the degree of Master of Science in Geology, has presented a thesis titled, Characteristics of Tight Reservoirs in the Oligocene Huagang Formation, Xihu Sag, East China Sea Basin, in an oral examination held on July 17, 2015. The following committee members have found the thesis acceptable in form and content, and that the candidate demonstrated satisfactory knowledge of the subject material. External Examiner: Dr. Peter Gu, Faculty of Engineering and Applied Science
Supervisor: Dr. Hairuo Qing, Department of Geology Committee Member: Dr. Osman Salad –Hersi, Department of Geology
Chair of Defense: Dr. Nader Mobed, Faculty of Science
i
Abstract
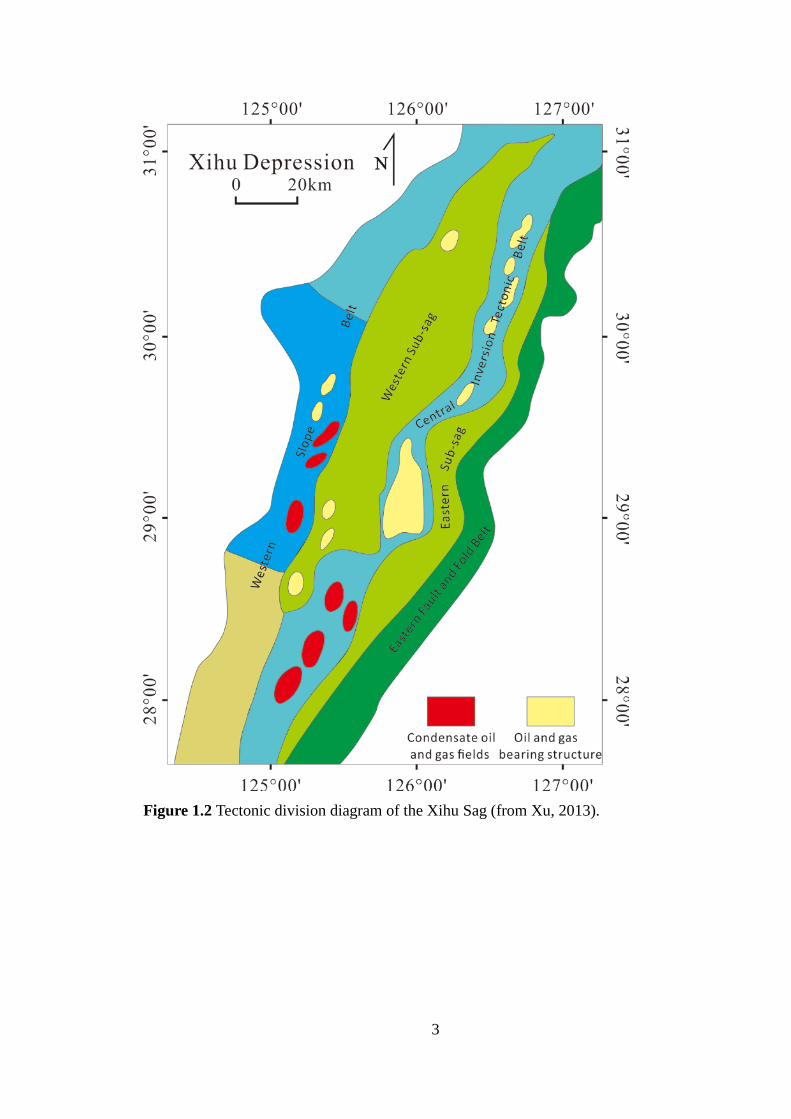
The Xihu Sag in the East China Sea Basin can be divided into five structural belts.
From west to east, they are western slope belt, western sub-sag, central inversion tectonic
belt, eastern sub-sag and eastern fault and fold belt. The petrographical, diagenetic and
petrophysical properties of the Oligocene Huagang Formation were studied in terms of
the structural belts.
The Huagang Formation is characterized by the depositional facies of delta and
lacustrine facies. The main rock types are feldspathic litharenite and lithic subarkose with
low compositional and texture maturity. Based on the scanning electronic microscopy
(SEM) and thin section observations, it was found that the reservoir rock went through
moderate compaction, and reservoir porosity decreased with increasing depth. The
cement of the sandstones is relatively simple, containing mainly carbonate minerals, such
as calcite, ferrocalcite, dolomite and ankerite, together with some kaolinite and authigenic
quartz. Carbon and oxygen isotope data suggested that the calcite cement in the reservoir
was generated from the early diagenetic to the mid diagenetic stages associated with
meteoric water. The average porosity in the different structural belts of the study ranged
from approximately 3% to 13%, with 20% porosity zones being rare. The permeability
ranged from 0.1×10⁻³μm2 (mD) to 10×10-3μm2 (mD), which indicates the Huagang
Formation belongs to a low to ultra-low permeability reservoir.
Reservoir development of the Huagang Formation was mainly influenced by

ii
deposition and diagenesis. The depositional characteristics of the environment was the
primary factor in controlling petrophysical properties of the reservoir, whereas the
diagenetic processes were the secondary factor in controlling quality of the reservoir. The
strong extent dissolution results in the development of secondary porosities, such as
intergranular pores, feldspar intra-granular pores and the kaolinite crystalline pores. This
study also found that the secondary porosity resulted from dissolution is more than the
porosity loss due to the precipitation of authigenic minerals.
Key words: East China Sea Basin, Xihu Sag, Huagang Formation, low-permeability
reservoir characteristics, controlling factors of reservoir development

iii
Acknowledgments
In writing this paper, I have benefited from the presence of my teachers and my
classmates. They generously helped me a lot with collecting and sorting materials,
searching references and data and so on. I obtained many invaluable suggestions from
them. I hereby extend my grateful thanks to them for their kind help, without which the
thesis would not exist.
My deepest gratitude goes first and foremost to Dr. Hairuo Qing, my supervisor, for
his constant encouragement and guidance. He has walked me through all the stages of the
writing of this thesis. Without his consistent and professional instruction, this thesis could
not have reached its present form. Moreover, Dr. Qing is very patient for answering my
questions over and over, it is the solutions of those questions which made my thesis to be
relatively completed today.
Second, I would like to express my heartfelt gratitude to Dr. Osman Salad Hersi,
who is one of the expert reviewers of my thesis. He gave me a lot of suggestions, which
change my thesis to a large extent. Particularly, he gave me advice on some basic
concepts which had set a foundation for my thesis.
I am also grateful to my parents, it is them who give me the motivation and
encouragements of completing my thesis. Furthermore, none of this would have been
possible without the help of any others such as my classmates, laboratory assistants etc. It
is my great honor to graduate from the University of Regina, this is undoubtedly an
unforgettable memory in my lifetime.
iv
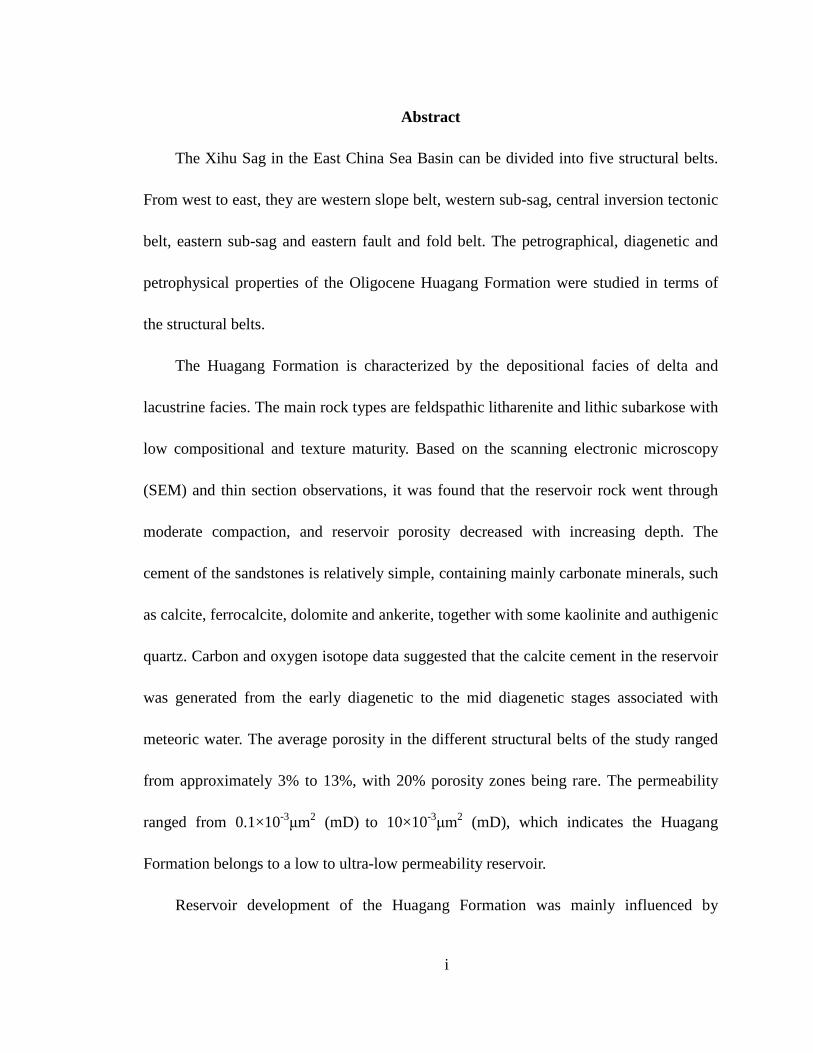
Contents
Abstract .......................................................................................................................... i
Acknowledgments ....................................................................................................... iii
CHAPTER ONE: INTRODUCTION ..................................................................... 1 1.1 Preface ....................................................................................................... 1 1.2 Regional Tectonic Settings ........................................................................ 4 1.3 Previous Work and Publications ............................................................... 6 1.4 Problems and Objectives ........................................................................... 9
CHAPTER TWO: DATA BASE, METHODS, AND APPROACHES ............... 12 2.1 Data Base ................................................................................................ 12 2.2 The Work Capacity and Technical Approaches ...................................... 16
CHAPTER THREE: PETROLOGY OF THE HUAGANG TIGHT RESERVOIR ...................................................................................................................................... 19
3.1 Sedimentology and depositional environment of the Huagang Formation 3.2 Characteristics of Grain Components ..................................................... 25 3.4 The Major Rock Types ............................................................................ 31 3.5 The Characteristics of the Rock Texture ................................................. 31 3.6 Discussion ............................................................................................... 45
CHAPTER FOUR: DIAGENESIS OF THE HUAGANG TIGHT RESERVOIR .............................................................................................................. 48
4.1 Introduction of Diagenesis ...................................................................... 48 4.2 Calcite Cementation and its Mechanisms ............................................... 63 4.3 Dissolution .............................................................................................. 83 4.4 Diagenetic Paragenesis ........................................................................... 90
CHAPTER FIVE: PETROPHYSICAL PROPERTIES OF THE HUAGANG TIGHT RESERVOIR ................................................................................................ 99
5.1 Types and Characteristics of Reservoir Space ........................................ 99 5.2 Petrophysical Properties of the Reservoir ............................................. 104 5.3 Discussion ............................................................................................. 115
CHAPTER SIX: INFLUENCES ON RESERVOIR DEVELOPMENT ......... 118 6.1 Provenance Influences on Reservoir Development .............................. 118
v
6.2 Influence of Diagenesis on Reservoir Development ............................ 122
CHAPTER SEVEN: CONCLUSIONS ............................................................... 128 REFERENCES ......................................................................................................... 130
1
CHAPTER ONE INTRODUCTION
1.1 Preface
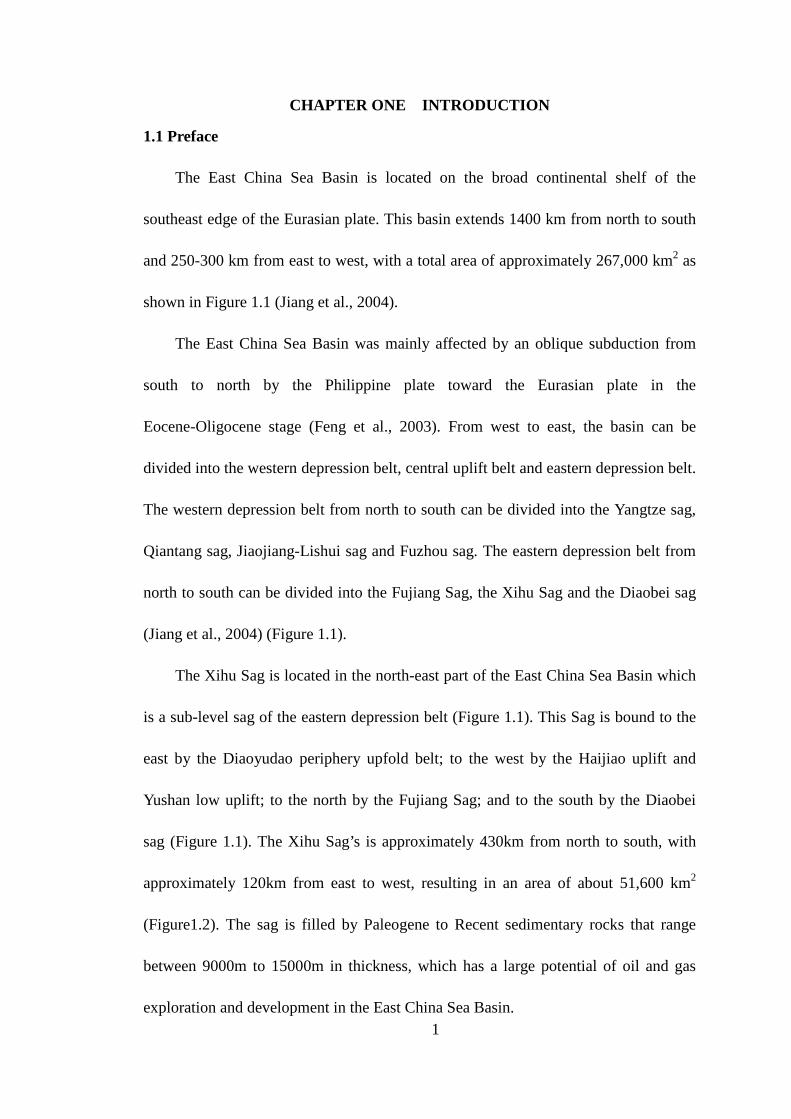
The East China Sea Basin is located on the broad continental shelf of the
southeast edge of the Eurasian plate. This basin extends 1400 km from north to south
and 250-300 km from east to west, with a total area of approximately 267,000 km2 as
shown in Figure 1.1 (Jiang et al., 2004).
The East China Sea Basin was mainly affected by an oblique subduction from
south to north by the Philippine plate toward the Eurasian plate in the
Eocene-Oligocene stage (Feng et al., 2003). From west to east, the basin can be
divided into the western depression belt, central uplift belt and eastern depression belt.
The western depression belt from north to south can be divided into the Yangtze sag,
Qiantang sag, Jiaojiang-Lishui sag and Fuzhou sag. The eastern depression belt from
north to south can be divided into the Fujiang Sag, the Xihu Sag and the Diaobei sag
(Jiang et al., 2004) (Figure 1.1).
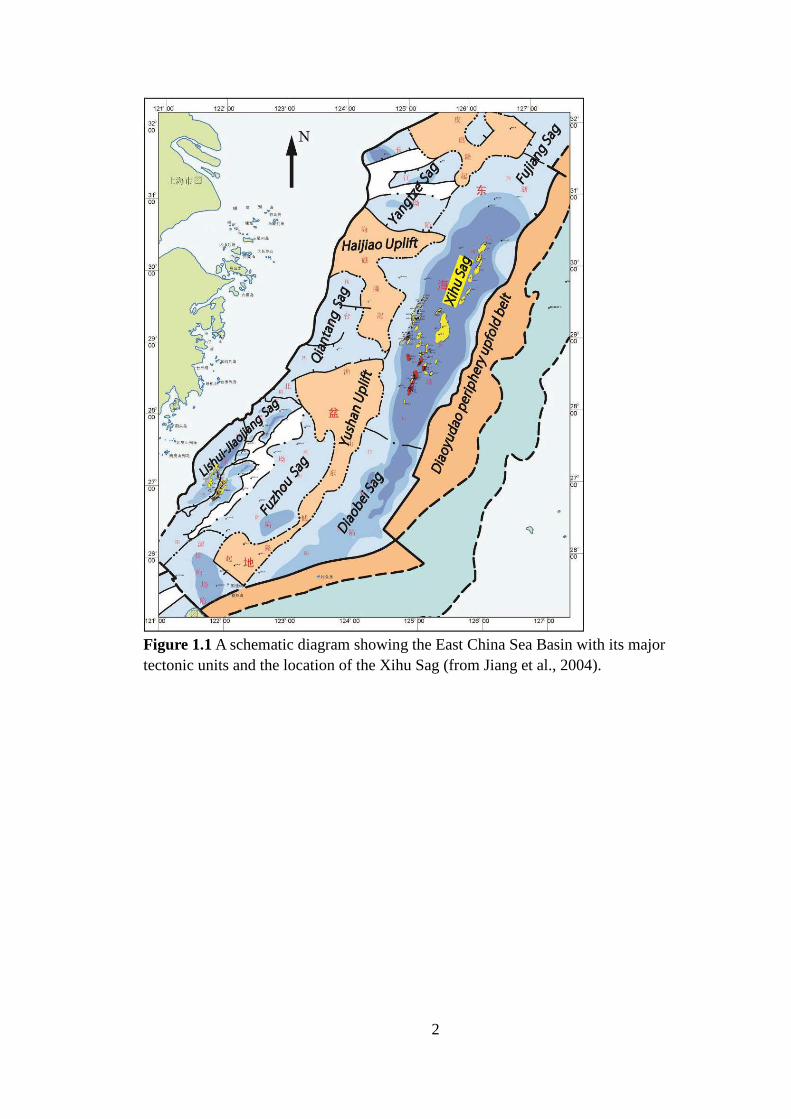
The Xihu Sag is located in the north-east part of the East China Sea Basin which
is a sub-level sag of the eastern depression belt (Figure 1.1). This Sag is bound to the
east by the Diaoyudao periphery upfold belt; to the west by the Haijiao uplift and
Yushan low uplift; to the north by the Fujiang Sag; and to the south by the Diaobei
sag (Figure 1.1). The Xihu Sag’s is approximately 430km from north to south, with
approximately 120km from east to west, resulting in an area of about 51,600 km2
(Figure1.2). The sag is filled by Paleogene to Recent sedimentary rocks that range
between 9000m to 15000m in thickness, which has a large potential of oil and gas
exploration and development in the East China Sea Basin.
2
Figure 1.1 A schematic diagram showing the East China Sea Basin with its major tectonic units and the location of the Xihu Sag (from Jiang et al., 2004).
3
Figure 1.2 Tectonic division diagram of the Xihu Sag (from Xu, 2013).

4
1.2 Regional Tectonic Settings
The East China Sea Basin is a Mesozoic-Caenozoic basin with superimposed oil
and gas bearing basin, which was developed on the complex basements of the
Proterozoic and the Paleozoic strata (Lin, 2007). The structural evolution and
sedimentary evolution of the East China Sea Basin were closely related to collision
among the Eurasian, Philippine and Pacific plates (Lin, 2007). The major effects on
the East China Sea Basin are the subduction of the Eocene-Oligocene Philippine plate
toward the Eurasian plate, being superimposed by the sinistral strike-slip of the Tanlu
faults (Gong et al., 2007) and the clockwise rotation of the Philippine Plate (Zhang
and Chen, 1983) of the same stage. The East China Sea Basin is also characterized by
extensional and sinistral strike-slip, which is defined as a strike-slip, pull-apart
back-arc relict continental rift basin (Zheng et al., 2005, Figure 1.3).
The Xihu Sag of the East China Sea Basin has experienced a complex tectonic
evolutional process including early multi-stage of rifting, fault-depression, late stage
depression, and multi-stage tectonic compression and inversion (Feng et al., 2003).
The early rifting formed a half-graben structure with a fault to the east and an overlap
to the west. The depositional strata from the Paleocene to Eocene, including
Pre-Oujiang, Oujiang, and Pinghu formations, mainly developed in the lower part of
the rift (Liu et al., 2003). The thickness and facies of these strata were controlled by
the fault, and showed a pattern of thinner strata in the west than the strata in the east,
which resulted from the combined asymmetrical half-graben structure (Jiang et al.,
2001). The depositional strata from the Oligocene to Miocene, containing Huagang

5
Figure 1.3 Tectonic settings of the East China Sea Basin (from Lin, 2007).
6
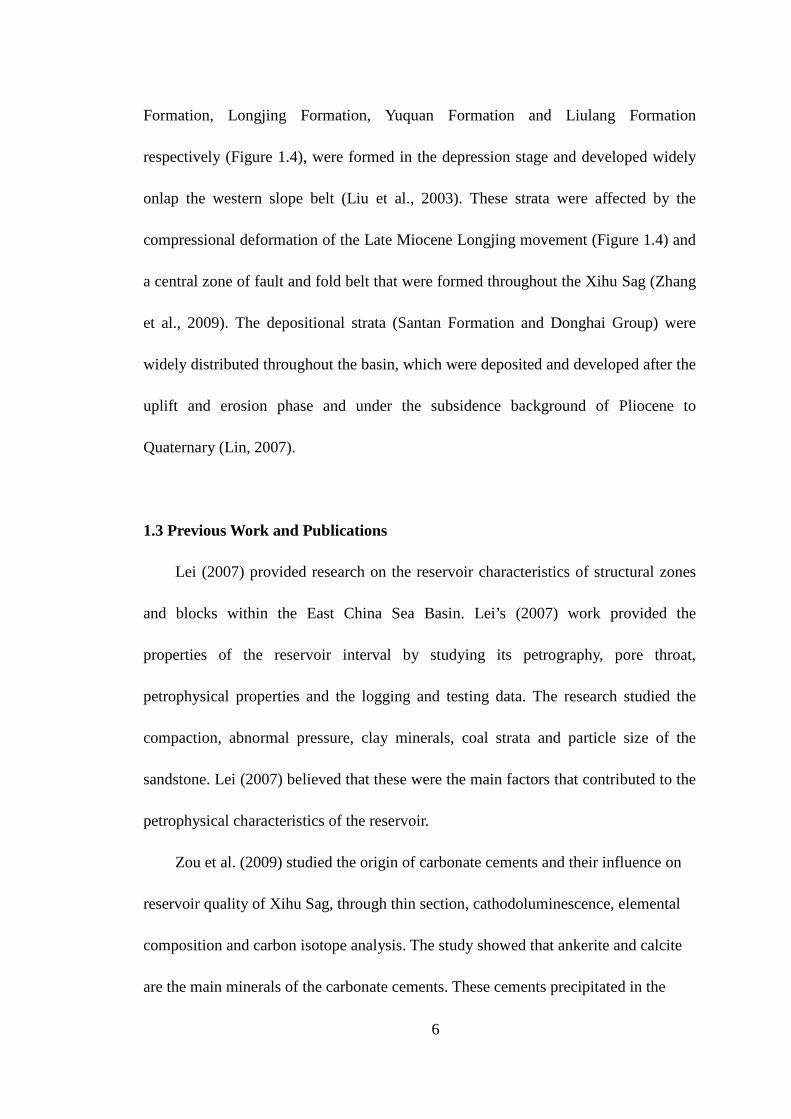
Formation, Longjing Formation, Yuquan Formation and Liulang Formation
respectively (Figure 1.4), were formed in the depression stage and developed widely
onlap the western slope belt (Liu et al., 2003). These strata were affected by the
compressional deformation of the Late Miocene Longjing movement (Figure 1.4) and
a central zone of fault and fold belt that were formed throughout the Xihu Sag (Zhang
et al., 2009). The depositional strata (Santan Formation and Donghai Group) were
widely distributed throughout the basin, which were deposited and developed after the
uplift and erosion phase and under the subsidence background of Pliocene to
Quaternary (Lin, 2007).
1.3 Previous Work and Publications
Lei (2007) provided research on the reservoir characteristics of structural zones
and blocks within the East China Sea Basin. Lei’s (2007) work provided the
properties of the reservoir interval by studying its petrography, pore throat,
petrophysical properties and the logging and testing data. The research studied the
compaction, abnormal pressure, clay minerals, coal strata and particle size of the
sandstone. Lei (2007) believed that these were the main factors that contributed to the
petrophysical characteristics of the reservoir.
Zou et al. (2009) studied the origin of carbonate cements and their influence on
reservoir quality of Xihu Sag, through thin section, cathodoluminescence, elemental
composition and carbon isotope analysis. The study showed that ankerite and calcite
are the main minerals of the carbonate cements. These cements precipitated in the
7
Figure 1.4 A schematic diagram showing major stratigraphic units and tectonic events of the Xihu Sag (modified after Ye et al., 2007;Codes: E1-Pliocene, E2b-Bajiaoting Formation of the lower Eocene, E2p-Pinghu Formation of the upper Eocene, E3h-Huagang Formation of the Oligocene, N1
1l-Longjing Formation of the lower Miocene, N1
2y-Yuquan Formation of the Middle Miocene, N13l-Liulang Formation of
the upper Miocene, N2s-Santan Formation of the Pliocene, Qd-Donghai Formation of the Quarternary).

8
early diagenetic stage, enhancing the mechanical strength of rock and resistance to
compaction, which is favourable for the reservoir quality.
Zhang et al. (2009) studied the characteristics of authigenic kaolinite in
sandstone of Xihu Sag and its impact on reservoir physical properties. They believe
that kaolinite is one of the most common authigenic clay minerals in sandstone
reservoirs from the point of view of reservoir evolution. Kaolinite generally existed in
pore-throat and is an indicative mineral of dissolution of feldspars and development of
secondary pores (Zhang et al., 2009). They also found that the distribution of
authigenic kaolinite was related to the dissolution of aluminosilicate minerals; the
content of kaolinite was well correlated to reservoir physical properties. An important
conclusion by Zhang et al. 2009 is that in the southern area of the Xihu Sag,
secondary pores are more developed than that of other areas because of the higher
content of kaolinite.
Hu et al. (2010) studied the characteristics and pattern of sedimentary facies of
the Huagang Formation in Xihu Sag. Based on core observation, in combination with
well logging and seismic data analysis, the sedimentary facies type and distribution of
the Huagang Formation was studied in detail. The results show that fluvial facies,
lacustrine facies and fan delta facies are identified in the Huagang Formation. In the
study area, river and delta deposits are mainly distributed in the western edge of the
Sag. Fan delta deposits are mainly distributed in the eastern edge of the Sag, while
lacustrine facies are distributed in the center of the Sag.
Several researchers, e.g. Xu (2010), Hao (2011) and Gao (2013) studied the
provenance of the sandstone in the Xihu Sag, East China Sea Basin. They all agree
that the main provenance of the sandstone in this Sag is from Haijiao uplift province,
Yushan uplift province in the west and Eastern periphery upfold belt province in the

9
east. They analyzed the different rock types of each province which is very important
in the study of lithology of reservoir sandstones of each structural area within the
Xihu Sag.
Liu et al. (2012) studied the sedimentary facies and the characteristics of tight
sandstone reservoirs of the Huagang Formation in the Xihu Sag. They found that the
river-lake-delta depositional system develops in the Huagang Formation, and they
made a conclusion that the leading factors of causing reservoir to be more dense
include high matrix content and large extent of carbonate cementation, whereas
dissolution plays a constructive role in the development of the relatively high-quality
sections of the tight sandstone reservoir.
Cai et al. (2013) studied the reservoir characteristics and evolution of diagenetic
porosity of the Huagang Formation of Oligocene in the Central inversion tectonic belt
of Xihu Sag. They found that the main rock type is feldspathic litharenite and
characterized by medium maturity of texture and composition. They also had
concluded the diagenetic evolution paragenesis of reservoir sandstone of two
structural areas of Xihu Sag.
A number of researchers, including Friedman and O’Neil (1977), Veizer (1999),
Surdam et al. (1989), Boles and Hayes (1993), Gat (1981), Yurtsever (1975), Hower et
al. (1976), and Emery and Robinson (1993) had studied the carbon and oxygen stable
isotopes of calcite in reservoir rocks and the relationships between feldspar
dissolution and kaolinite generation. Their study results provided input for the case
study of the Huagang Formation.
1.4 Problems and Objectives
The recent hydrocarbon exploration and development of the East China Sea

10
Basin by the Shanghai Branch of CNOOC have identified a variety of hydrocarbon
prospects in the tight Oligocene reservoirs in the Xihu Sag within this basin (Li and Li,
2003; Figure 1.5). However, the lithology, spatial distribution, diagenetic history, and
their impact on the porosity and permeability of the Huagang tight reservoir are not
yet well studied.
The questions to be addressed in this study of reservoir of the Oligocene
Huagang Formation of the Xihu Sag include:
(1) Whether the development of secondary dissolution pores within the Huagang
Formation reservoir resulted mainly from meteoric water or organic acids;
(2) How much the diagenetic sequences and the evolution processes contributing
to the porosity of the tight reservoir of the Huagang Formation; and
(3) What are the main controlling factors affecting the development of the
reservoir quality of the Huagang Formation.
In this study, the analysis of the characteristics of the tight reservoir was based on
the study of the geological conditions and sedimentary background of the target zone
(Xu et al., 2003; Figure 1.4). The regional distribution of tight reservoirs is identified;
the origin of these tight reservoirs and factors that influence the development of the
tight reservoir are discussed. The result of this study is intended to contribute to the
exploration and development of hydrocarbons within the tight reservoirs of the Xihu
Sag in the East China Sea Basin. The study of the characteristics and the mechanism
of this tight reservoir of the Huagang Formation has both theoretical and practical
significance.
11
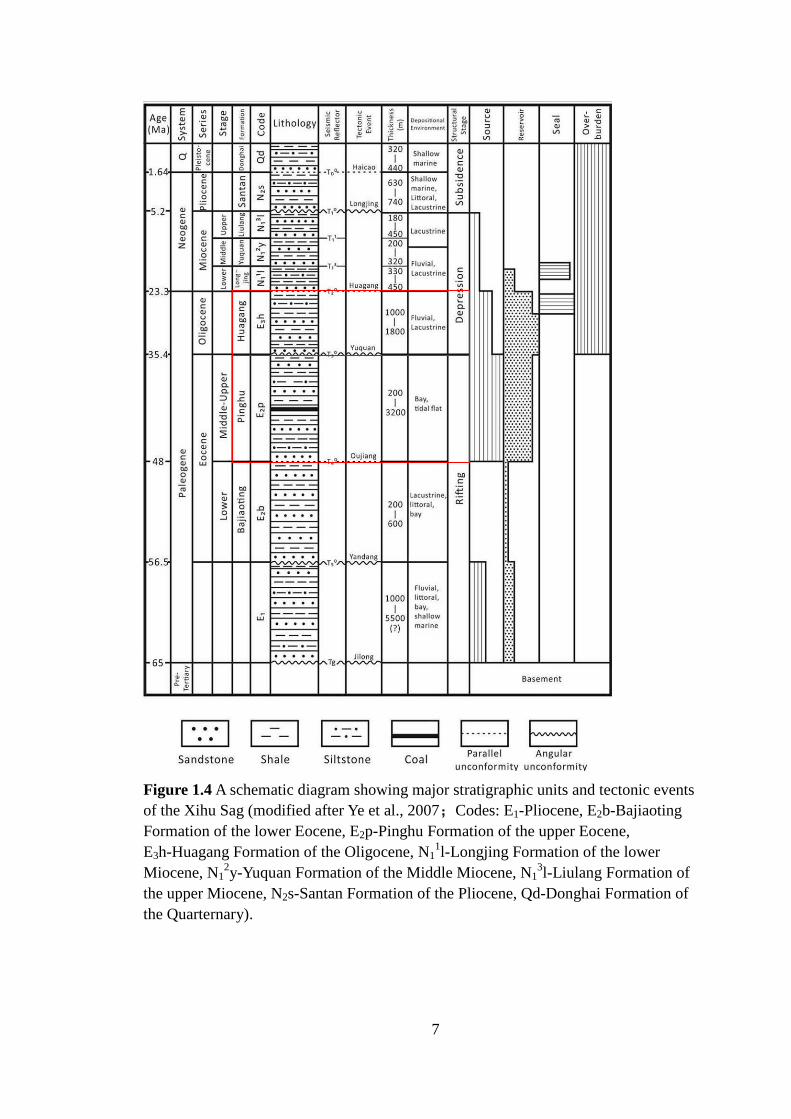
Figure 1.5 Location of the Xihu Sag (closed curve on green) in the East China Sea Basin (modified after Ye et al., 2007).
12
CHAPTER TWO DATA BASE, METHODS, AND APPROACHES
2.1 Data Base
The proposed research was based on the examination and analysis of core
samples. Core samples from 11 wells (Figure 1.5, wells with red underline) of
Huagang Formation were examined from the Xihu Sag. A total of 211 core samples
were collected from the following 11 wells.
In addition to core examination, 1110 thin sections (211 made from the 11 well
core samples and 899 from another 13 wells were borrowed from CNOOC of
Shanghai branch) were examined for the petrography of reservoirs under standard
microscopy, cathodoluminescence (CL) microscopy and fluorescence microscopy.
Fifty-two thin sections were examined for SEM analysis.
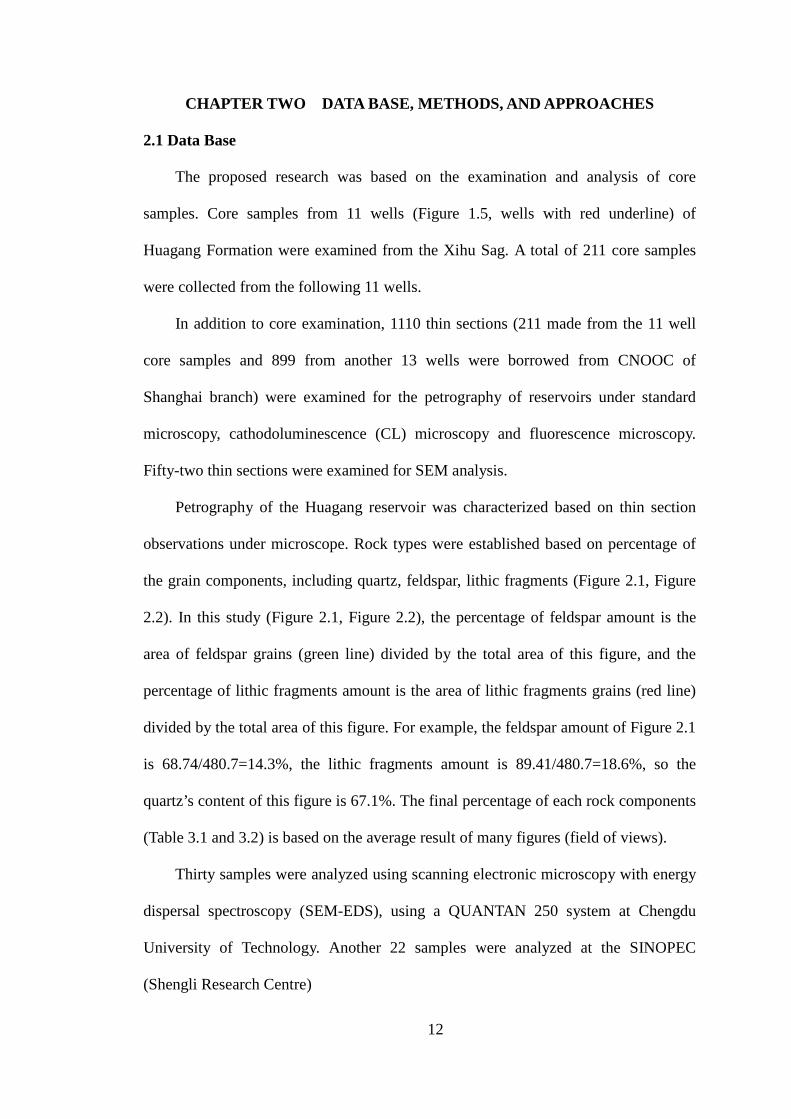
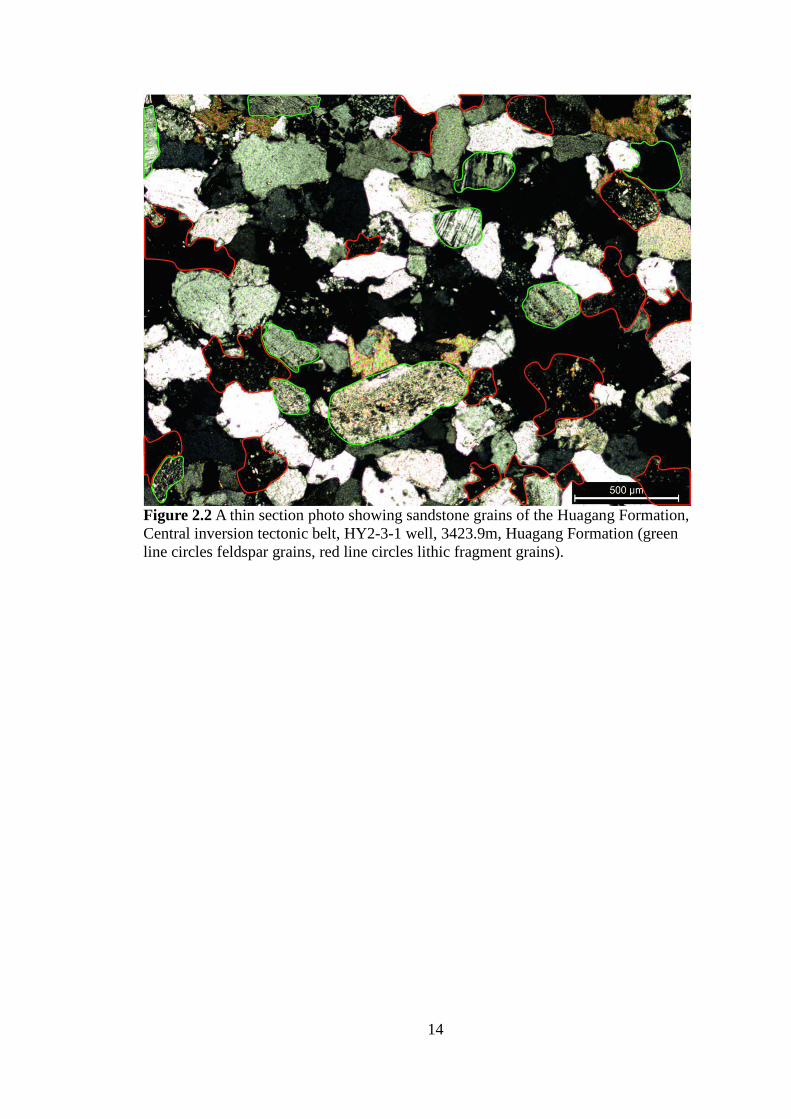
Petrography of the Huagang reservoir was characterized based on thin section
observations under microscope. Rock types were established based on percentage of
the grain components, including quartz, feldspar, lithic fragments (Figure 2.1, Figure
2.2). In this study (Figure 2.1, Figure 2.2), the percentage of feldspar amount is the
area of feldspar grains (green line) divided by the total area of this figure, and the
percentage of lithic fragments amount is the area of lithic fragments grains (red line)
divided by the total area of this figure. For example, the feldspar amount of Figure 2.1
is 68.74/480.7=14.3%, the lithic fragments amount is 89.41/480.7=18.6%, so the
quartz’s content of this figure is 67.1%. The final percentage of each rock components
(Table 3.1 and 3.2) is based on the average result of many figures (field of views).
Thirty samples were analyzed using scanning electronic microscopy with energy
dispersal spectroscopy (SEM-EDS), using a QUANTAN 250 system at Chengdu
University of Technology. Another 22 samples were analyzed at the SINOPEC
(Shengli Research Centre)

13
Figure 2.1 A thin section photo showing sandstone grains of the Huagang Formation, Central inversion tectonic belt, HY2-3-1 well, 3422.9m, Huagang Formation (green line circles feldspar grains, red line circles lithic fragment grains).
14
Figure 2.2 A thin section photo showing sandstone grains of the Huagang Formation, Central inversion tectonic belt, HY2-3-1 well, 3423.9m, Huagang Formation (green line circles feldspar grains, red line circles lithic fragment grains).
15
using a SEM QUANTAN 200 system. The acceleration voltage, set at 25kV and
counting time at 100 seconds, calculated the relative intensity ratio of the X-ray of
each elements. They then corrected them against the standard in order to determine
their abundance in the samples.
Oxygen and Carbon isotopes of calcicite cement from 21 samples were analyzed
at the University of Windsor (Table 4.5). Samples were weighed into exetainers and
0.1 mL of H3PO4 (S.P. 1.91) added to the side. Exetainers were capped and
Helium-flushed while horizontal. Reaction at 25.0oC for 24 hours was followed by
extraction in continuous flow. The measurments were performed on a Delta XP and a
Gas Bench II, both from Thermo Finnigan. Data for C and O were normalized using
international standards NBS-18, NBS-19, and LSVEC (C only). Analytical precision
(2 sigma) is +/- 0.1permil.
A set of 200 samples from the Huagang Formation were analyzed for porosity
and permeability (Table 5.5 and 5.6) using a gas permeameter and an automatic
electronic scale at CDUT in SY/T5336-2006 standard. For compressible gas, the fluid
can be compressed with increasing pressure expanded with decreasing pressure,
supposing temperature is a constant. The expansion of fluid then obeys the Boyle’s
law, PV=constant. Assuming the entrance pressure is P1 and the exit pressure is P2,
the gas volume changes with the pressure changes from P1 to P2, as well as the gas
flow velocity. Adding the average volume flow rate Q into the Darcy law:
Q1P1=Q2P2=……=P0Q0=P Q
In which represents average pressure, MPa;
represents average volume flow rate under average pressure, ml/s;
16
P0 represents atmospheric pressure, MPa;
Q0 represents volume flow rate under atmospheric pressure, ml/s.
Then the permeability K was obtained:
K=2P0Q0μgL
A·(P1- P2)2 2
In which µg represents the gas viscosity.
2.2 The Work Capacity and Technical Approaches
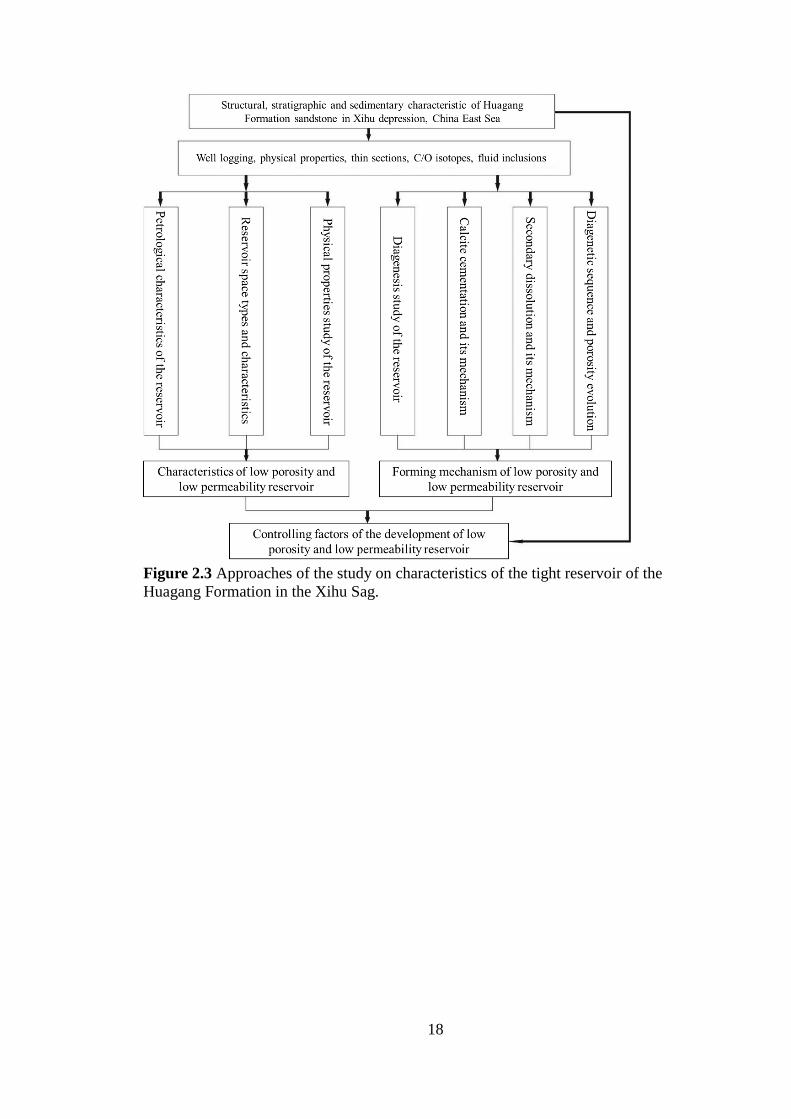
In addition to the collection and organization of previous research, this thesis
obtained new data from core samples, thin sections, porosity and permeability testing,
C & O analysis, and SEM analysis as summarized in Table 2.1. The technical details
are given in Figure 2.3.

17
Table 2.1 Workload account of analysis and test on accomplished sample of the Huagang Formation
No. Content Workload Comment
1 Previous thin section data Regular thin sections: 1067; casting thin sections: 125
2 Core samples 211, from 11 wells
3 Thin sections 1110: 211 (produced) + 899 (borrowed), 24 wells in total
4 Porosity/Permeability
testing, Carbon/Oxygen isotope analysis
200, 21
5 SEM-EDS analysis 30 + 22
18
Figure 2.3 Approaches of the study on characteristics of the tight reservoir of the Huagang Formation in the Xihu Sag.

19
CHAPTER THREE
PETROLOGY OF THE HUAGANG TIGHT RESERVOIR
The petrology of the reservoir interval of the Huagang Formation was an
important facet of the study of reservoir sedimentary facies, sandstone diagenesis and
the characteristics of the reservoir (Fang and Hou, 1998). The differences of the
mineral components were important for the diagenesis and the preservation of primary
and secondary porosities. The study of the composition of the particles of the
reservoir sandstone and the study of the composition of the interstitial matter of the
sandstone were considered as the basis of the study of the diagenesis and reservoir
characteristics (Feng, 1993).
The study of the petrography of the Huagang Formation reservoirs was based on
the analysis and observations with the data of thin sections examination and SEM
analysis of the samples from 24 wells of different tectonic belts.
3.1 Sedimentology and depositional environment of the Huagang Formation
The sediments of the Huagang Formation in the study area can be divided into
two depositional units: delta and lacustrine (Table 3.1).
The gentle slope delta and lacustrine depositions occur in the Pingbei area,
Pinghu area and the Central inversion tectonic belt (Figure 3.1) with provenance from
the Haijiao uplift and Yushan uplift. The steep slope delta and lacustrine depositions
are founded in the Yuquan, Chunxiao-Tianwaitian area (Figure 3.1) with provenance
area from the eastern periphery upfold belt. The Xihu Sag was a lacustrine one fed by
rivers from the continental, uplifted highlands. The main sedimentary facies of the
Huagang Formation are as follows:
1. The delta plain sub-unit is the upper part of the delta which developed in the

20
Table 3.1 Main sedimentary units of the Huagang Formation in the Xihu Sag (Hu et al., 2010) Units Sub-units Micro-units Main distribution areas
Delta
Delta plain distributary channel, interdistributary channel Pingbei, Pinghu; Yuquan
Delta front
mouth bar, underwater distributary channel,
underwater inerdistributary channel
Pingbei, Pinghu, Central inversion tectonic belt, Western sub-sag; Yuquan, CHX-TWT
Prodelta prodelta mud, sheet sand Western sub-sag
Lacustrine (Sub) Deep lacustrine
lacustrine sediment(mud), sheet sand Western sub-sag
21
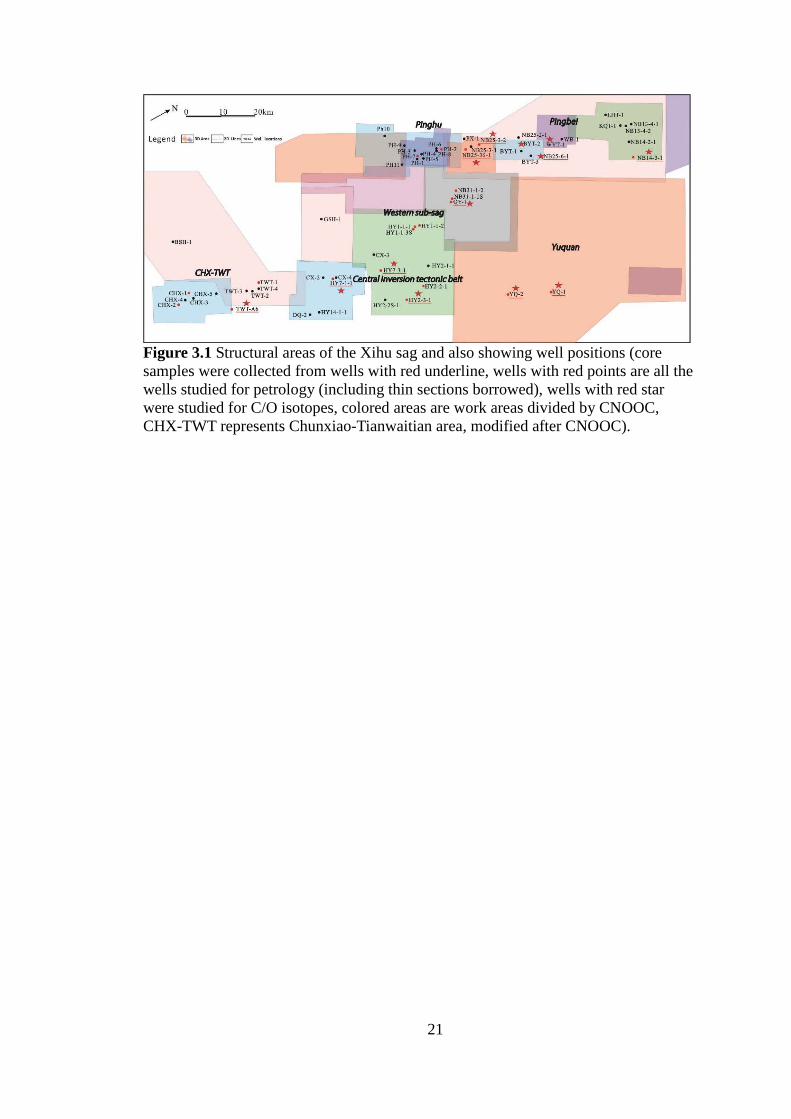
Figure 3.1 Structural areas of the Xihu sag and also showing well positions (core samples were collected from wells with red underline, wells with red points are all the wells studied for petrology (including thin sections borrowed), wells with red star were studied for C/O isotopes, colored areas are work areas divided by CNOOC, CHX-TWT represents Chunxiao-Tianwaitian area, modified after CNOOC).
22
lower Huagang Formation of the Pingbei and Pinghu area of the study area. The delta
plain included the micro-facies of distributary channels and the inter-distributary
channels.
2. The delta front sub-unit is the lower part of the delta, which is the main part of
the delta deposition. The delta front was widely developed, which included the mouth
bar, the subaqueous distributary channels, the subaqueous inter-distributary channels
and the sand sheet. The mouth bar, the subaqueous distributary channels and the sand
sheet deposited arenaceous sediments.
3. The pro-delta sub-unit is mainly developed in the outskirts of delta (toward the
lake or the sea), which is one of the intermediate facies of the semi-deep lake
(continental shelf). The micro-facies of the braid river delta pro-delta are composed of
pro-delta clay and sheet sand.
4. The lacustrine unit - during the deposition of the Huagang Formation, the
southern Xihu Sag was not connected to the open sea, which lead to the development
of the lacistrine facies of the Xihu Sag.
The lake edges were not symmetric but rather steeper in its western side and
gentler in its eastern side. Deltas developed at both the western and eastern margins of
the lake. The delta morphologies and their facies distribution were influenced by the
steepness of the lake margins, the shore and shallow lakes were not developed, and
the semi-deep lake was only found in the western sub-sag.
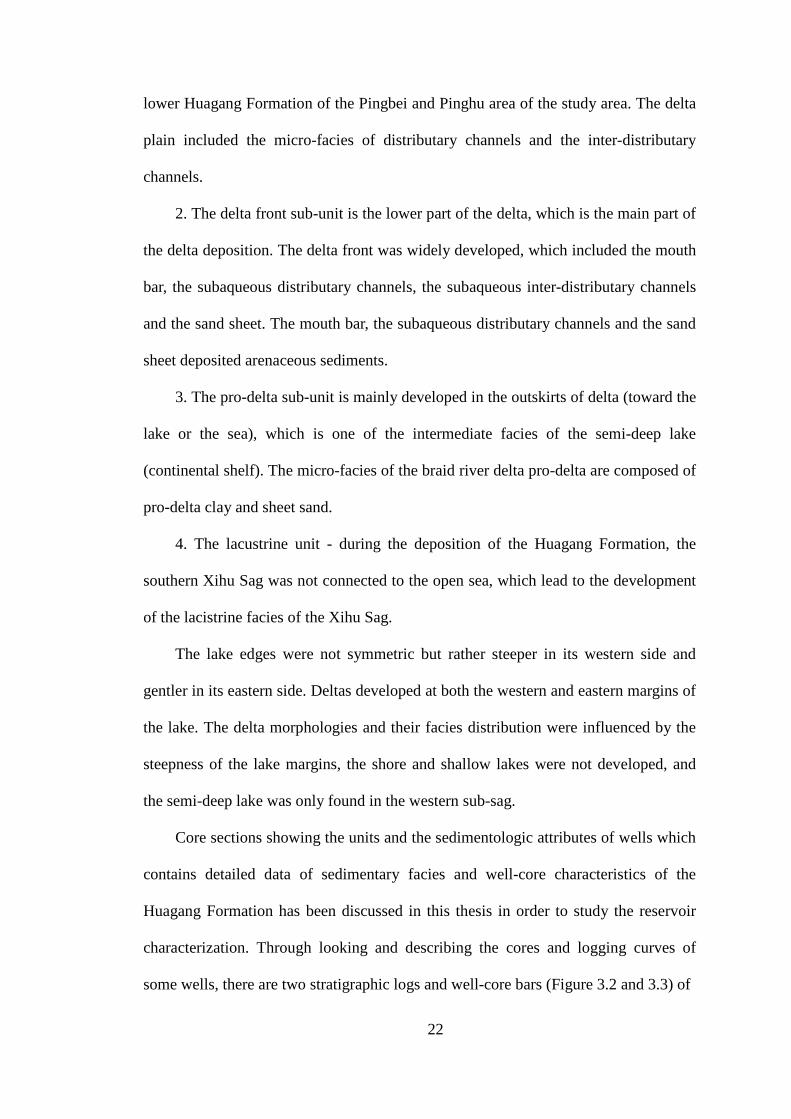
Core sections showing the units and the sedimentologic attributes of wells which
contains detailed data of sedimentary facies and well-core characteristics of the
Huagang Formation has been discussed in this thesis in order to study the reservoir
characterization. Through looking and describing the cores and logging curves of
some wells, there are two stratigraphic logs and well-core bars (Figure 3.2 and 3.3) of
23
Figure 3.2 Logging curves and well-cores showing the sedimentary attributes of well CHX-2, Huagang Formation.
24
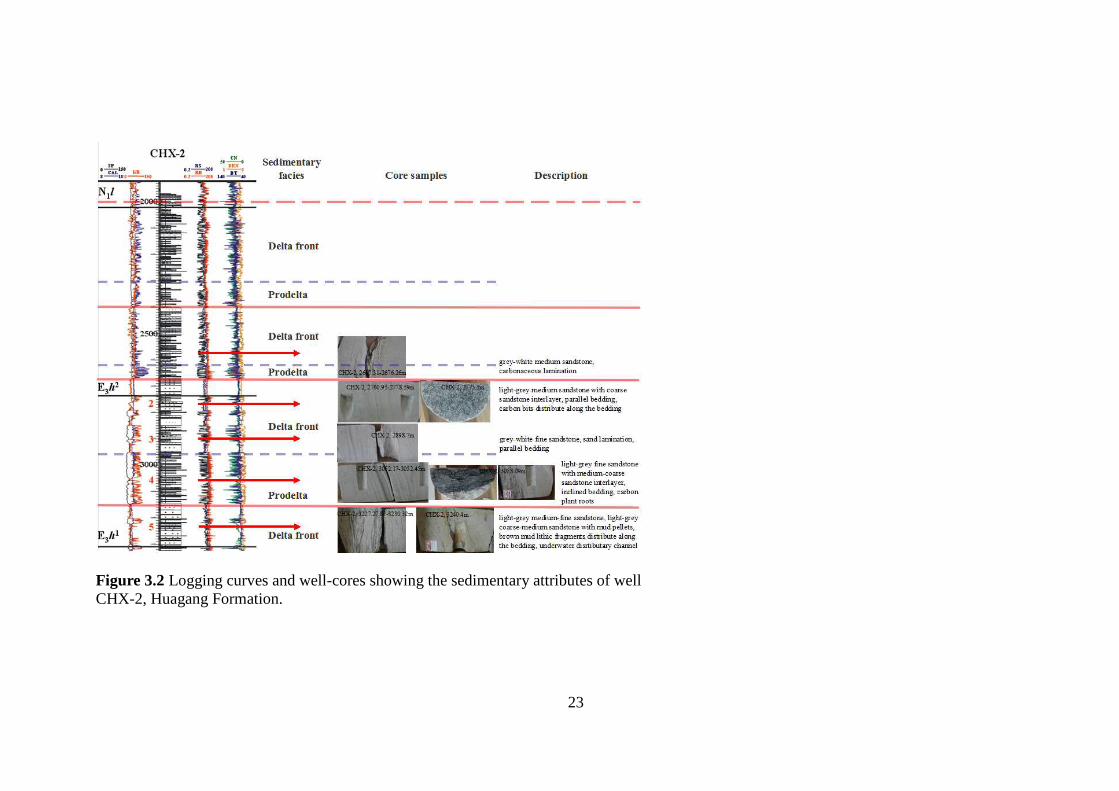
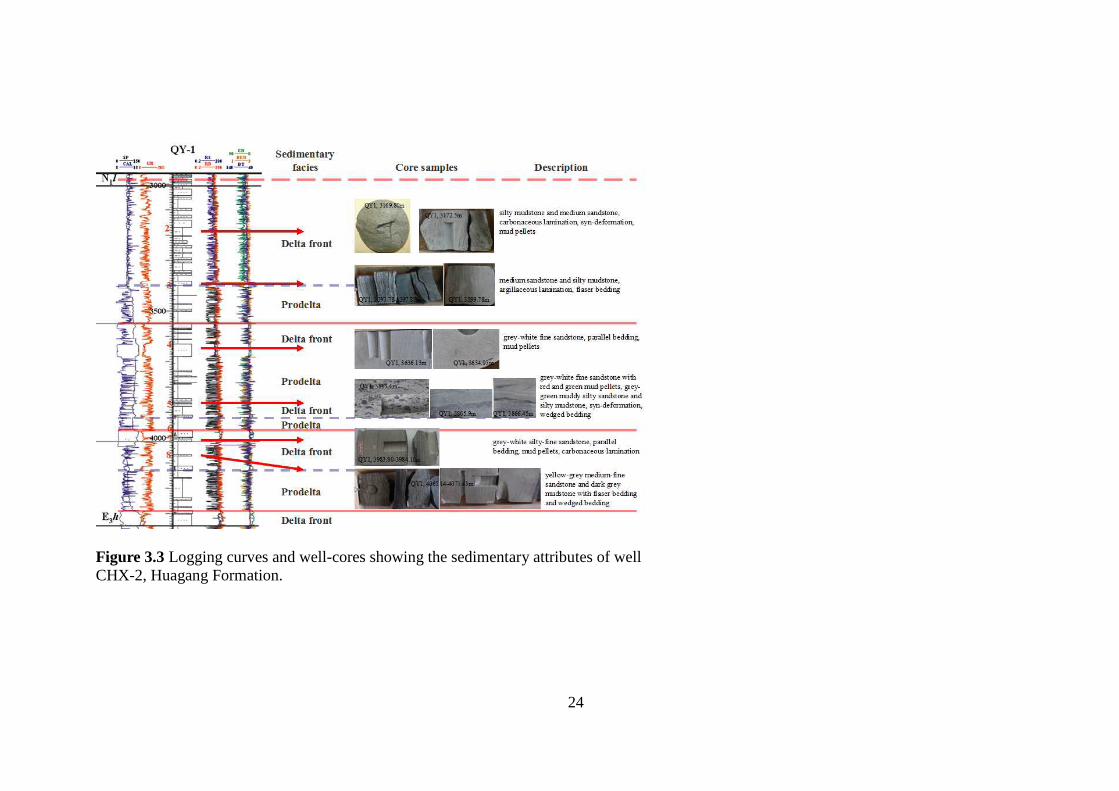
Figure 3.3 Logging curves and well-cores showing the sedimentary attributes of well CHX-2, Huagang Formation.

25
well CHX-2 (CHX-TWT area) and QY-1 (Huangyan area).
3.2 Characteristics of Grain Components
Through several observations of the standard thin sections of Huagang
Formation under microscope, it can be revealed that the average quartz amount within
the reservoir of the Huagang Formation ranges from 42.8% to 75.2%, while the
average feldspar amount ranges between 11.2% and 33%, and the lithic grains
accounted for 4.9% to 22.5% (Table 3.2).
3.2.1 Quartz
Quartz grains are the dominate minerals in most clastic sedimentary rocks. This
is because they have exceptional physical properties, such as, hardness and chemical
stability (Boggs et al., 2000). The quartz grains of the Huagang Formation evolved
from plutonic rock (Hao et al., 2011), which are felsic in origin and also from older
sandstones that have been recycled. The average quartz content of the reservoir of the
study area ranged from 42.8% to 75.2%, however, they differed among tectonic belts
and different rock types. The highest quartz content was found in the
Chunxiao-Tianwaitian area (Figure 3.4), which averaged 68.3% to 93%. The lowest
quartz content was found in the Pingbei and Pinghu areas (Figure 3.4), with averages
of 65.6% and 46%, respectively (Table 3.2). The quartz content of different rock types
was quite different. In the Huagang Formation study area, the quartz content of the
lithic subarkose and feldspathic litharenite ranged from 62% to 72%, while the quartz
content of the feldspathic quartz sandstone was 76% to 80%.
26
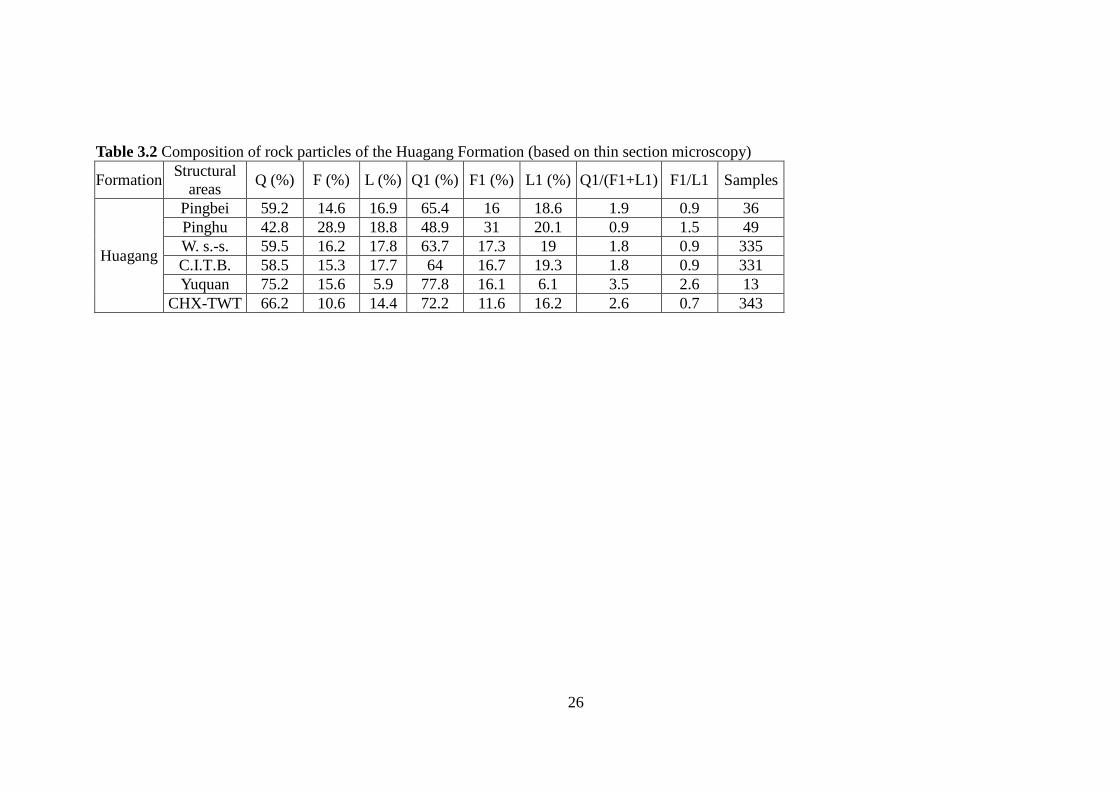
Table 3.2 Composition of rock particles of the Huagang Formation (based on thin section microscopy)
Formation Structural areas Q (%) F (%) L (%) Q1 (%) F1 (%) L1 (%) Q1/(F1+L1) F1/L1 Samples
Huagang
Pingbei 59.2 14.6 16.9 65.4 16 18.6 1.9 0.9 36 Pinghu 42.8 28.9 18.8 48.9 31 20.1 0.9 1.5 49 W. s.-s. 59.5 16.2 17.8 63.7 17.3 19 1.8 0.9 335 C.I.T.B. 58.5 15.3 17.7 64 16.7 19.3 1.8 0.9 331 Yuquan 75.2 15.6 5.9 77.8 16.1 6.1 3.5 2.6 13
CHX-TWT 66.2 10.6 14.4 72.2 11.6 16.2 2.6 0.7 343

27
3.2.2 Feldspar
Feldspar framework grains are commonly the second most abundant mineral in
sandstones (Boggs et al., 2000). They are rock-forming minerals typically occurring
as colorless or pale-colored crystals and consisting of aluminosilicates of potassium,
sodium, and calcium. In the Huagang Formation sandstone, the feldspar content was
18.5% to 33% for lithic subarkose; 11.2% to 16.2% for feldspathic litharenite; 11.5%
to 15% for feldspathic quartz sandstone (Table 3.3).
On the whole, feldspar was volumetrically well presented in the Huagang
Formation in the Xihu Sag, followed by lithic grains (Figure 3.4). In addition, the
cathodoluminescence analysis showed that the potassium feldspar and plagioclase
were common in the sandstone. The study also found intra-particle dissolution and
moldic pores formed by feldspar dissolution.
3.2.3 Lithic Grain
Lithic grains are pieces of ancient source rock that have not yet disintegrated to
yield individual mineral grains in sedimentary rock (Boggs et al., 2000). Lithic grains
can be any fine-grained igneous, metamorphic, or sedimentary rock, although the
most common lithic grain found in sedimentary rocks are clasts of volcanic rocks
(Boggs et al., 2000). In the Huagang Formation reservoir, the lithic grains in different
rock types showed different content, with 17.6% to 22.5% in feldspathic litharenite,
13.2% to 21% in lithic subarkose, 14% in lithic quartz sandstone and 4.9% to 9.8% in
feldspathic quartz sandstone. The lithic grains generally consisted of volcanic,
metamorphic, and sedimentary origin. Also found were mica with compressional
deformation, charcoal grains and mud grains. The content of quartz, feldspar and
lithic grains in the sandstone from the six tectonic belts of the Huagang Formation in

28
Table 3.3 Q/F/L compositions chart in reservoir rocks of six different structural areas (Based on thin section observations, rock types see Figure 3.1)
Formation Structural areas Rock types Q (%) F (%) L (%) Samples
Huagang
Pingbei lithic subarkose 66.2 17.6 16.2 10
feldspathic litharenite 65.1 15.5 19.4 26
Pinghu lithic subarkose 46 33 21 49
W. s.-s.
lithic subarkose 64.4 20 15.6 91 feldspathic litharenite 62.8 16.2 21 239
feldspathic quartz sandstone 76.7 15.6 7.7 6
lithic quartz sandstone 75.8 10.4 13.8 5
C.I.T.B.
lithic subarkose 64.6 18.9 16.5 147 feldspathic litharenite 62.2 15.3 22.5 174
feldspathic quartz sandstone 78.4 11.8 9.8 6
lithic sandstone 66 8 26 1
Yuquan lithic subarkose 72.7 18.5 8.8 4
feldspathic quartz sandstone 80.1 15 4.9 9
CHX-TWT
lithic subarkose 68.3 18.5 13.2 30 feldspathic litharenite 71.2 11.2 17.6 247
feldspathic quartz sandstone 79.7 11.5 8.8 19
lithic quartz sandstone 77.1 8.9 14 44
quartz sandstone 93 1 6 1 feldspathic sandstone 68.5 27.5 4 2
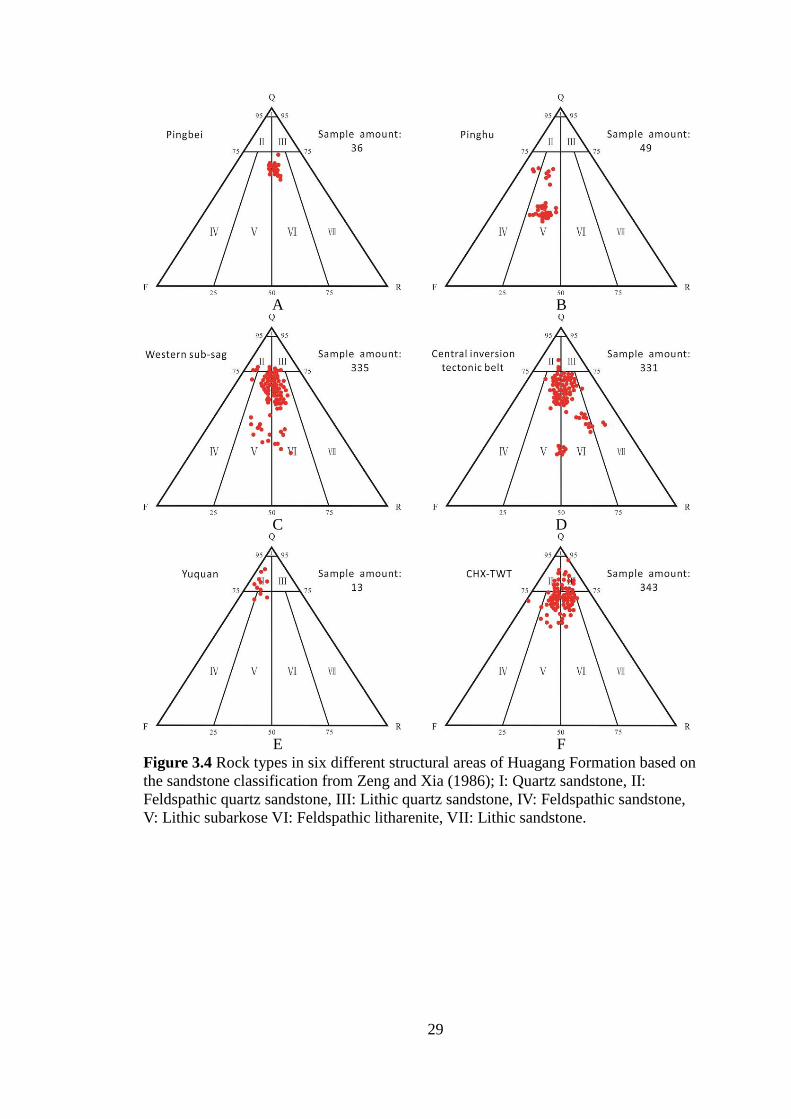
29
Figure 3.4 Rock types in six different structural areas of Huagang Formation based on the sandstone classification from Zeng and Xia (1986); I: Quartz sandstone, II: Feldspathic quartz sandstone, III: Lithic quartz sandstone, IV: Feldspathic sandstone, V: Lithic subarkose VI: Feldspathic litharenite, VII: Lithic sandstone.
A B
C D
E F
30
the Xihu Sag are shown in Table 3.3 and Figure 3.4.
3.3 The Compositional Maturity of the Grain Component
Quartz (Q) represents the stable component of the composition and feldspar (F)
and lithic grains (L) represent the unstable component. In addition, Q1, F1 and L1
represent the quartz, feldspar and lithic grains amounts whereas assuming there are
only these three components in the rocks. The index of Q1 / (F1+L1) could represent
the compositional maturity of the sandstone, and the index of F1/L1 could tell us the
relative amount of feldspars and lithic grains in the sandstone (Pettijohn, 1949). The
compositional maturity index of the Huagang Formation from six tectonic belts in the
Xihu Sag was summarized in Table 3.2 and presented in Figures 3.4, which showed a
high feldspar and lithic grains content in all six tectonic belts, with the lowest
compositional maturity from the lithic subarkose and the feldspathic litharenite
(maturity index 0.9 to 2.7, average of 1.9). The compositional maturity of the
feldspathic and lithic quartz sandstones ranged from 3.1 to 4.0, with an average of 3.6.
Figure 3.4 shows the Q/F/L amount of different structural areas in the horizontal bar
chart, which clearly indicates the difference.
The compositional maturity of the Huagang Formation could be affected by the
feature of the provenance and the distance of transportation (Cai et al., 2013) to the
Xihu Sag. The compositional maturity of the framework grains of the Huagang
Formation could be affected by the intensity of the dissolved aluminosilicate minerals
during diagenesis, such as feldspar. Through the analysis of thin sections observation,
the compositional maturity of the reservoir sandstone is moderate.

31
3.4 The Major Rock Types
Lithic subarkose is the most abundant type of sandstone in the Huagang
Formation reservoirs among the six structural areas (Table 3.4; and Figure 3.4),
followed by feldspathic litharenite, feldspathic quartz, and lithic quartz sandstone. The
rock types were quite different among different structural areas.
The major rock types of the western sub-sag, central-south part of the central
inversion tectonic belt and Chunxiao-Tianwaitian area are feldspathic litharenite and
the lithic subarkose. The major rock type of the Pingbei area is feldspathic litharenite,
with 72% of the samples plotted as feldspathic litharenite and 28% as lithic subarkose
(Table 3.4; and Figure 3.4A). In the Pinghu area, all sample points were plotted as
lithic subarkose (Table 3.4; Figure 3.4B). In the western sub-sag, 69% of samples
were feldspathic litharenite, followed by 26% of lithic subarkose, and 5% samples as
feldspathic quartz sandstone and lithic quartz sandstone (Table 3.4 and Figure 3.4C).
In the central inversion tectonic belt, 53% of samples were feldspathic litharenite,
45% were lithic subarkose and 4% were feldspathic quartz sandstone (Table 3.4 and
Figure 3.4D). In the Yuquan area (Figure 3.4E), rock sample were mainly feldspathic
quartz sandstone with a small number of points located on lithic subarkose (Table 3.4).
In the Chunxiao and Tianwaitian areas, 72% samples were feldspathic litharenite,
13% were lithic quartz sandstone, 9% as lithic subarkose and 6% as feldspathic quartz
sandstone (Table 3.4 and Figure 3.4F).
3.5 The Characteristics of the Rock Texture
3.5.1 The Characteristics of the Grain Components
(1) Grain size: The characteristics of the grain sizes from the different structural
areas of the Huagang Formation are shown in Table 3.5 and Figure 3.5. The Huagang
32
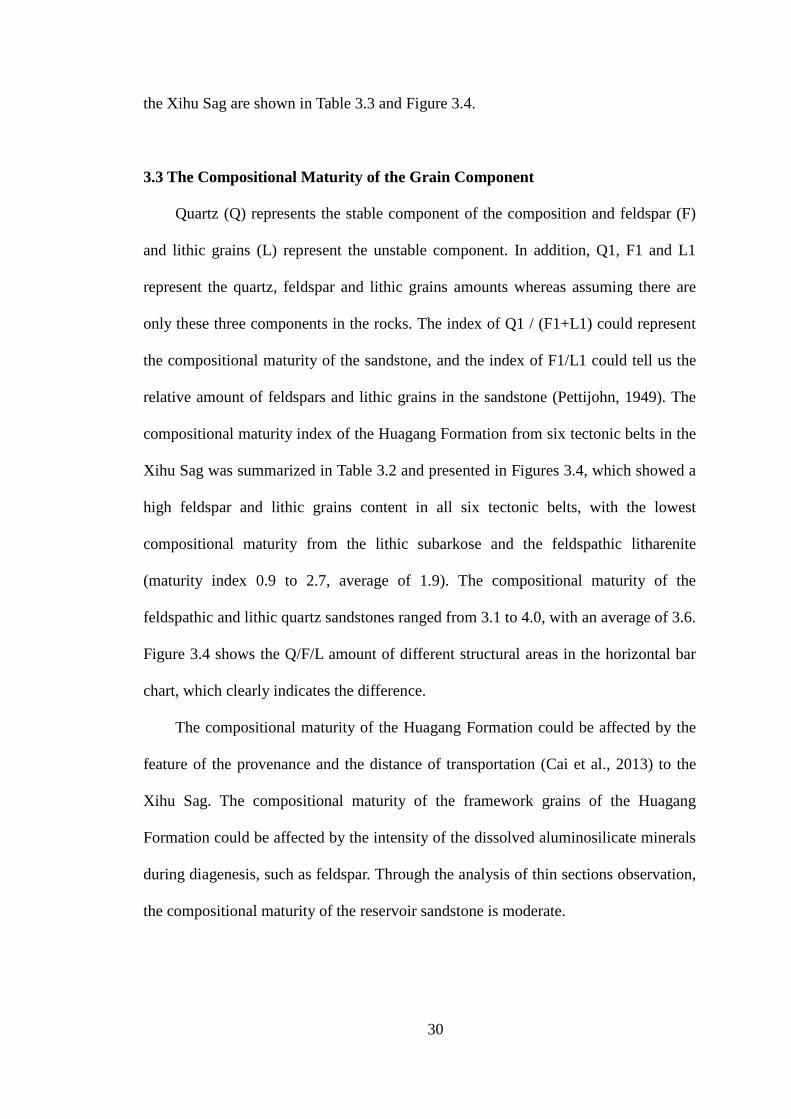
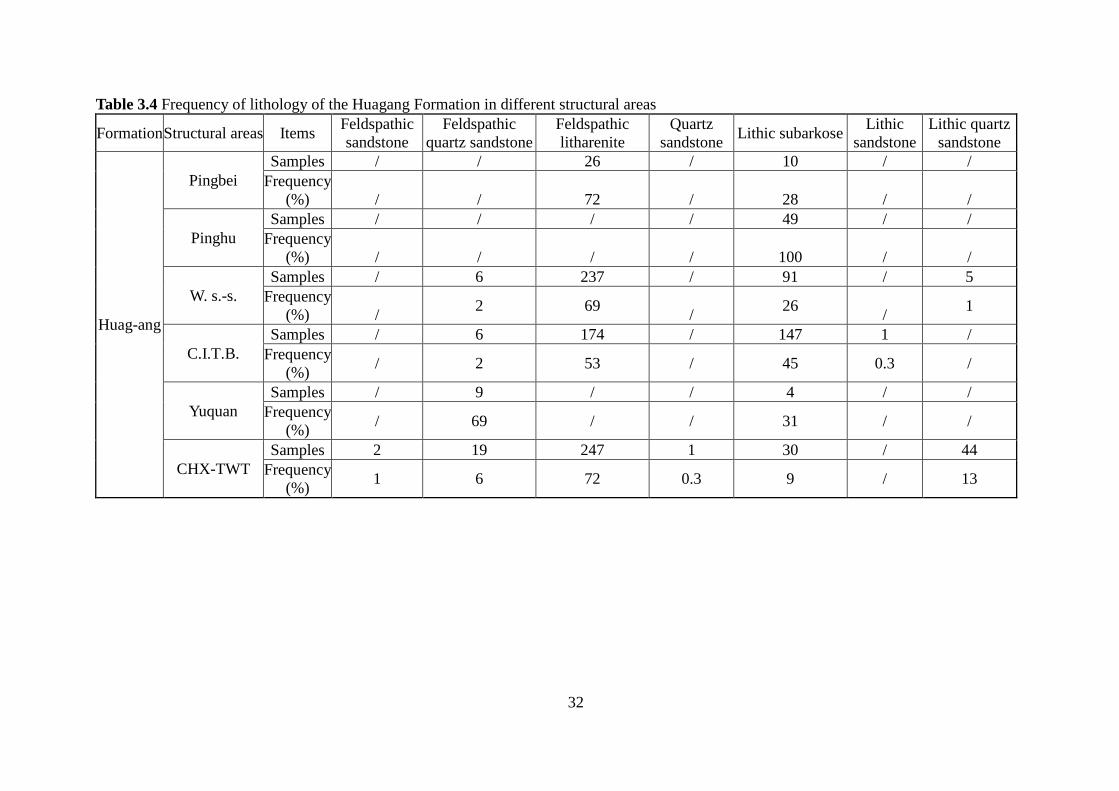
Table 3.4 Frequency of lithology of the Huagang Formation in different structural areas
Formation Structural areas Items Feldspathic sandstone
Feldspathic quartz sandstone
Feldspathic litharenite
Quartz sandstone Lithic subarkose Lithic
sandstone Lithic quartz
sandstone
Huag-ang
Pingbei Samples / / 26 / 10 / /
Frequency (%) / / 72 / 28 / /
Pinghu Samples / / / / 49 / /
Frequency (%) / / / / 100 / /
W. s.-s. Samples / 6 237 / 91 / 5
Frequency (%) / 2 69 / 26 / 1
C.I.T.B. Samples / 6 174 / 147 1 /
Frequency (%) / 2 53 / 45 0.3 /
Yuquan Samples / 9 / / 4 / /
Frequency (%) / 69 / / 31 / /
CHX-TWT Samples 2 19 247 1 30 / 44
Frequency (%) 1 6 72 0.3 9 / 13
33
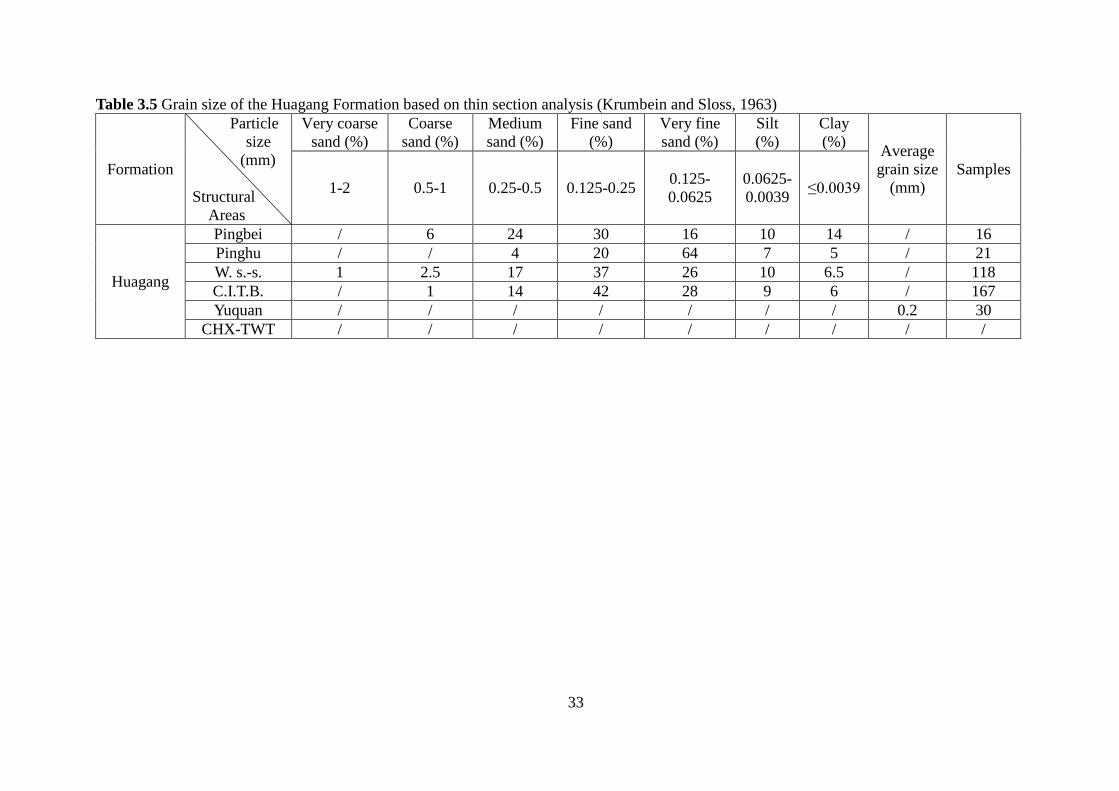
Table 3.5 Grain size of the Huagang Formation based on thin section analysis (Krumbein and Sloss, 1963)
Formation
Particle size
(mm) Structural
Areas
Very coarse sand (%)
Coarse sand (%)
Medium sand (%)
Fine sand (%)
Very fine sand (%)
Silt (%)
Clay (%) Average
grain size (mm)
Samples 1-2 0.5-1 0.25-0.5 0.125-0.25 0.125-
0.0625 0.0625- 0.0039 ≤0.0039
Huagang
Pingbei / 6 24 30 16 10 14 / 16 Pinghu / / 4 20 64 7 5 / 21 W. s.-s. 1 2.5 17 37 26 10 6.5 / 118 C.I.T.B. / 1 14 42 28 9 6 / 167 Yuquan / / / / / / / 0.2 30
CHX-TWT / / / / / / / / /
34
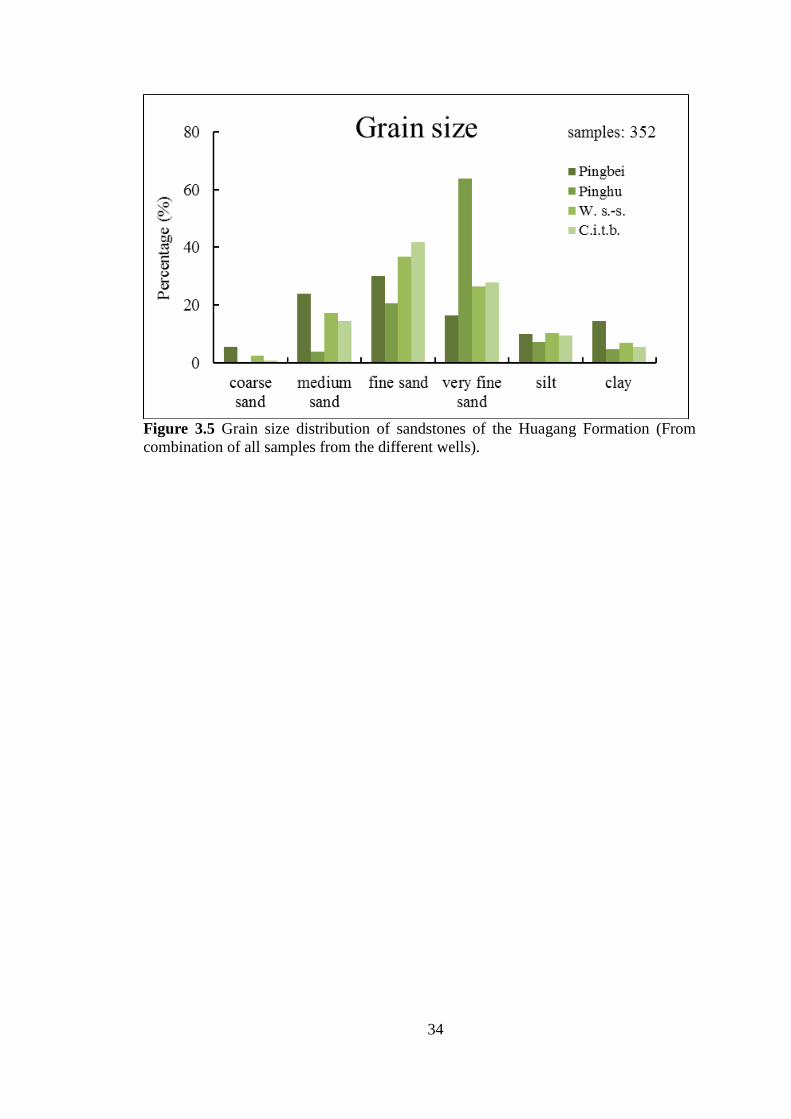
Figure 3.5 Grain size distribution of sandstones of the Huagang Formation (From combination of all samples from the different wells).

35
sandstones from the different tectonic belts were characterized as fine and very fine
sandstones (Figure 3.5). Specifically, the lithology was mainly medium to fine
sandstone in the Pingbei area (30% of fine sandstone); fine to very fine sandstone in
the Pinghu area (64% of very fine sandstone); fine to very fine sandstone in the
western sub-sag (26% of very fine sandstone, 37% of fine sandstone); fine to very fine
sandstone in the central inversion tectonic belt (with 28% very fine sandstone, 42%
fine sandstone); and in the Yuquan area where the data is limited, the reservoir
sandstone was generally fine. The fine to very fine sandstones of the Huagang
Formation in the central inversion tectonic belt and the western sub-depression were
interpreted as delta front and pro-delta sediments deposited in low energy
environments (Hu et al., 2010).
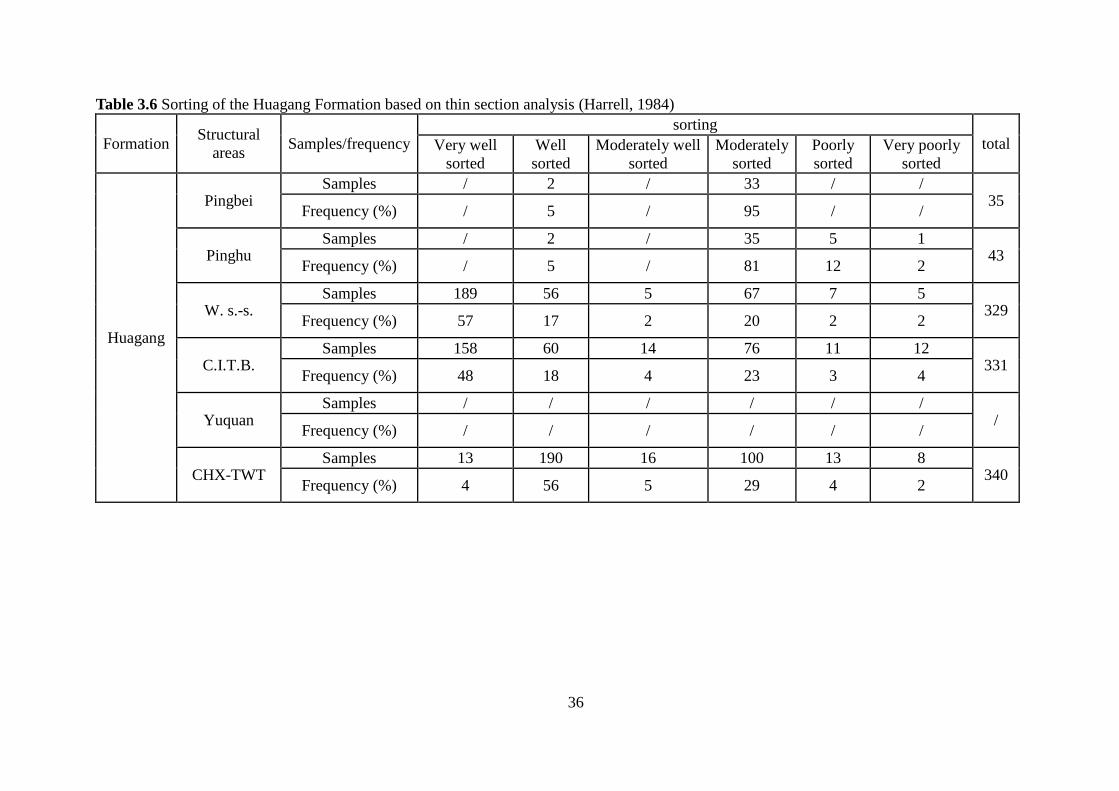
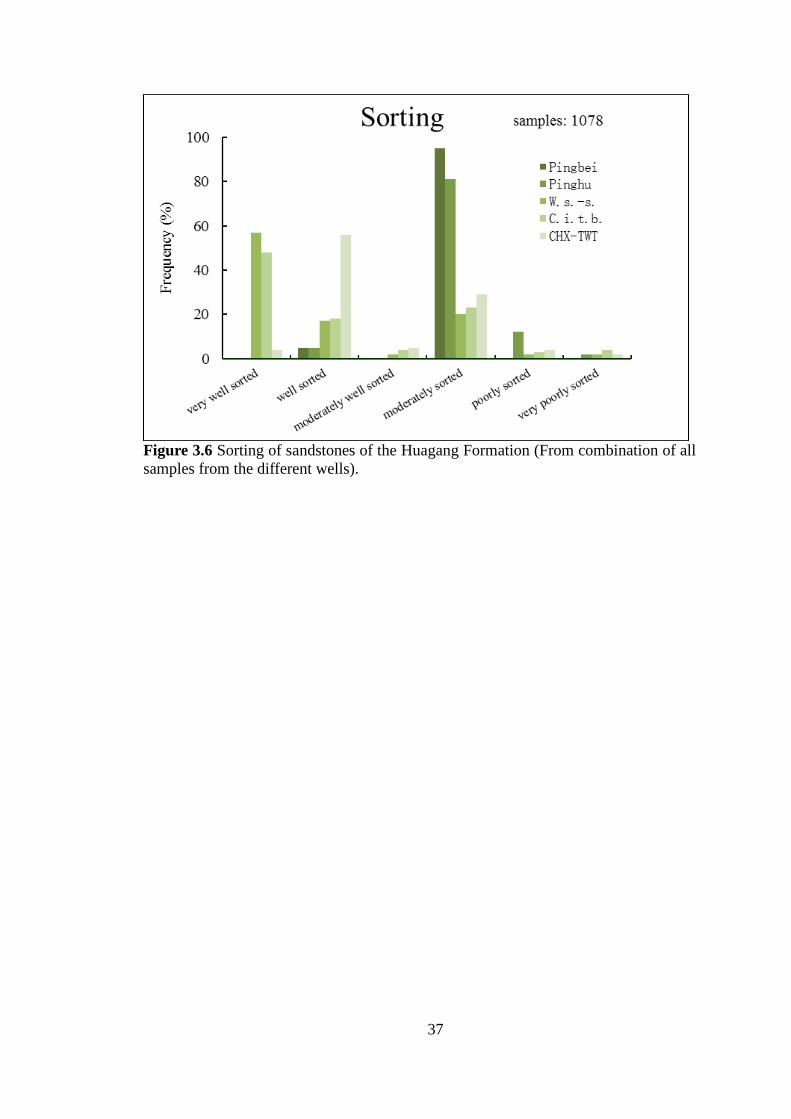
(2) Sorting: The sorting of the sandstones were related to their depositional
environment. The sorting of sandstones from different areas in the Huagang
Formation reservoir are shown in Table 3.6 and Figure 3.6. The sorting of Huagang
sandstone reservoir ranges from moderately sorted to well sorted, with 95% (out of 35
samples) from the Pingbei area being moderately sorted, 81% (of 43 samples) from
the Pinghu area are moderately sorted. In the western sub-sag, 57% (of 329 samples)
are well sorted, 17% moderately to well sorted, and 20% moderately sorted. In the
mid-south part of the central inversion tectonic belt, the data from 331 samples
showed the sandstone was 48% well sorted, 18% moderately-well sorted and 23%
moderately sorted, which was quite similar with that in the western sub-sag. The
Chunxiao and Tianwaitian area were classed as 56% well sorted and 29% moderately
sorted.
(3) Roundness: The roundness of the grain is the degree of grain rounding after
erosion, transportation, over-rolling or collision. The roundness is an important
36
Table 3.6 Sorting of the Huagang Formation based on thin section analysis (Harrell, 1984)
Formation Structural areas Samples/frequency
sorting total Very well
sorted Well sorted
Moderately well sorted
Moderately sorted
Poorly sorted
Very poorly sorted
Huagang
Pingbei Samples / 2 / 33 / /
35 Frequency (%) / 5 / 95 / /
Pinghu Samples / 2 / 35 5 1
43 Frequency (%) / 5 / 81 12 2
W. s.-s. Samples 189 56 5 67 7 5
329 Frequency (%) 57 17 2 20 2 2
C.I.T.B. Samples 158 60 14 76 11 12
331 Frequency (%) 48 18 4 23 3 4
Yuquan Samples / / / / / /
/ Frequency (%) / / / / / /
CHX-TWT Samples 13 190 16 100 13 8
340 Frequency (%) 4 56 5 29 4 2
37
Figure 3.6 Sorting of sandstones of the Huagang Formation (From combination of all samples from the different wells).
38
parameter of reservoir sandstone, and has indicative significance for the study of the
depositional environment. In this study, the roundness was divided into well rounded,
rounded, sub-rounded, sub-angular, angular and very angular (Pettijohn et al., 1987).
The data of the 734 samples from the Huagang Formation study area are shown in
Table 3.7 and Figure 3.7. The roundness of the sandstone of the Huagang Formation
was 58% sub-rounded and 23% sub-angular, the rest are rounded, angular and very
angular particles.
3.5.2 The Characteristics of the Interstitial Materials
The study of the interstitial materials, including amount of matrix, type and
distribution of the authigenic mineral, was based on the thin sections and the SEM
sample analyses. A better understanding of the nature of matrix and authigenic
minerals will help evaluate their effects on reservoirs and prediction of the quality of
the reservoirs.
The cement of the Huagang Formation in Xihu Sag mainly consists of authigenic
clay and carbonate minerals. The authigenic clay minerals are mainly chlorite,
kaolinite and illite, etc. (Table 3.8, Figure 3.8). The authigenic carbonate minerals are
mainly calcite and dolomite.
(1) The characteristics of the matrix of the Huagang Formation: The matrix is
made up of very fine materials that deposited at the same time as the framework
grains of the sandstone, it is present within interstitial pore space between the
framework grains (Boggs et al., 2000). Arenite is texturally clean sandstone that is
free of or has very little matrix (Prothero et al., 2004) whereas wackes are texturally
dirty sandstones that have a significant amount of matrix (Pettijohn et al., 1987). The
average contents of the matrix of the reservoir sandstone from the six tectonic belts in

39
Table 3.7 Roundness of the Huagang Formation based on thin section analysis (Pettijohn et al., 1987)
Formation samples/ Roundness total
frequency Well rounded Rounded Sub-rounded Sub-angular Angular Very angular
Huagang Samples / 39 421 168 98 8 734
frequency / 5 58 23 13 1 /
(%)

40
Figure 3.7 Roundness of sandstones of the Huagang Formation.

41
Table 3.8 Authigenic mineral compositions of reservoir sandstone of the Huagang Formation
Formation Structural areas Content Matrix (%) Authigenic mineral types and content (%)
samples kaolinite calcite dolomite silicate chlorite total interstitial
Huagang
Pingbei in rocks 5.6 0.2 / 1 4.3 / 11.1 34 in total authigenic minerals 50 2 / 9 39 / /
Pinghu in rocks 5.4 0.1 2.1 / 0.1 / 7.7 40 in total authigenic minerals 70 1 27 / 1 / /
W. s.-s. in rocks 3.4 0.56 1.6 0.7 0.8 0.7 7.76 334 in total authigenic minerals 44 7 21 9 10 9 /
C.I.T.B. in rocks 4.5 0.4 2 0.7 0.8 0.5 8.9 331 in total authigenic minerals 50.5 4.5 22.5 8 9 5.5 /
Yuquan in rocks 0.8 1.2 0.1 1 0.3 / 3.4 13 in total authigenic minerals 24 35 3 29 9 / /
CHX-TWT in rocks 4.1 2.8 1.8 0.03 0.3 0.4 9.43 343 in total authigenic minerals 43.5 30 19 0.3 3.2 4 /

42
Figure 3.8 Interstitial minerals and their abundance of the Huagang Formation.

43
this formation ranges from 0.8% to 5.6% (Table 3.8, Figure 3.9).
The matrix content is lowest in the Yuquan area, and increases towards the
northwest. The matrix content in the reservoir sandstone in the mid-south part of the
central inversion tectonic belt and the Chunxiao-Tianwaitian areas were similar
volumetrically. The highest matrix content was found in the Pingbei area, with a
decreasing trend towards the southwest and southeast.
(2) The characteristics of the cement of the Huagang Formation: Cement is what binds
the siliciclastic framework grains together. It is a secondary mineral that forms after
deposition and during burial of the sandstone (Boggs et al., 2000). These cementing
materials may be either silicate minerals or non-silicate minerals, such as calcite
(Boggs et al., 2000). Cementation is an important part of the diagenesis that occurred
in different stages of the diagenesis. The formation of the cement was related to the
temperature, pressure and the chemical properties of the pore fluid. The observed
cement of the Huagang Formation in the Xihu Sag generally consisted of calcite,
dolomite, kaolinite, chlorite, illite, siderite, pyrite and siliceous cements.
The clay minerals cement including authigenic kaolinite, chlorite and illite is
most abundant, followed by carbonate and siliceous cements (Table 3.8, Figure 3.8).
The authigenic chlorite, up to 0.7%, was found mainly in the western sub-sag and the
central inversion tectonic belt. The authigenic kaolinite was common in the study area.
The highest amount of the authigenic kaolinite was found in the Chunxiao and
Tianwaitain areas, with an average amount of 2.8%, followed by the Yuquan area and
the mid-south part of the central inversion tectonic belt, with an average amount of
1.2% and 1.1%, respectively (Table 3.8). The amount of the carbonate cements differ
from belt to belt. In the Pingbei area, the sandstone contains 1% dolomite and 4.3%
siliceous cement. Secondary overgrowth of quartz was also common in the study area.

44
Figure 3.9 Average matrix amount of the Huagang Formation from different structural areas.
45
Based on the thin section examinations, Huagang Formation in the Pinghu area
contained 2.1% calcite and 0.1% siliceous cements. In the western sub-sag, the
sandstone pores were filled with carbonate and siliceous cements (1.6% calcite, 0.7%
dolomite and 0.8% siliceous cements). In the mid-south part of the central inversion
tectonic belt, there are 2.7% carbonate cements and 0.8% siliceous cements, which
was quite similar to the cements in western sub-sag. In the Yuquan area, there are
0.8% matrix and 1.1% carbonate cements. In the Chunxiao and Tianwaitian areas,
there are relatively high amount of matrix with a moderate to low amount of cement.
The different amounts of matrix and cement from the structural areas in the Huagang
Formation were related to different depositional environments and different
authigenic minerals during diagenesis.
3.6 Discussion
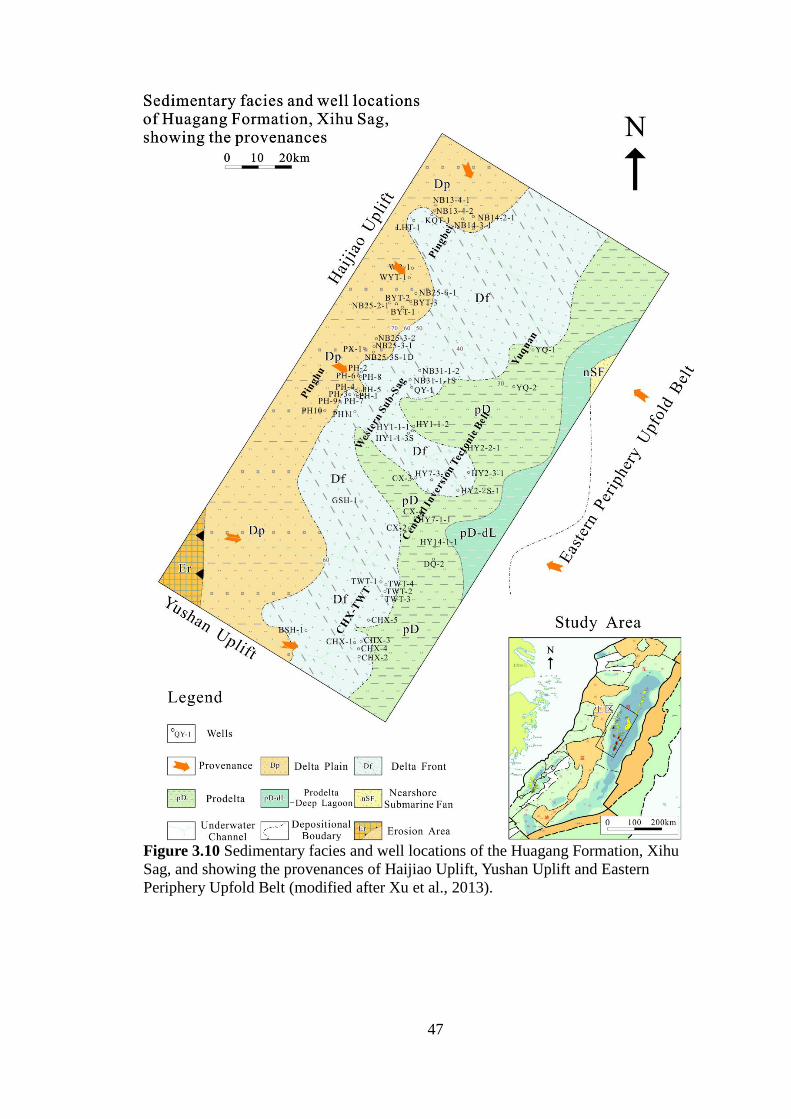
The provenance of the sandstone in the Xihu Sag is mainly influenced by the
western edge, i.e. rocks of Haijiao Uplift province and rocks of Yushan Uplift
province. The rocks in the Eastern Periphery Upfold Belt province has only a limited
impact. By the lithic fragments analysis under microscope and previous studies (Hao
et al., 2011), the major source rock of the Xihu Sag is igneous whereas metamorphic
rocks form a secondary clastic source rocks, specifically, in the western area of the
sag. For example, in the Pinghu area, the provenance of the sandstone is mainly from
the metamorphic rocks of Haijiao uplift province, e.g. chlorite, while in the
mid-southern area of the sag, i.e. Central inversion tectonic belt, the provenance of the
sandstone is mainly from the igneous rock of south-west Haijiao uplift province and
Yushan uplift province, e.g. gabbro and granite. In the northern area of the sag, the
provenance of the sandstone could from the rocks of Haijiao uplift province and the
46
sedimentary rocks of the Eastern periphery upfold belt province (Hao et al., 2011,
Figure 3.10).
Based on thin section microscopy, the sandstones of the Huagang Formation in
the Xihu Sag are mainly feldspathic litharenite and lithic subarkose. In the western
and northern areas, e.g. Pinghu and Pingbei areas, the reservoir sandstone are mainly
lithic sandstones and they have relatively poor sorting and roundness (Figure 3.7)
because these areas are closer to one of the sandstone provenance, i.e. Haijiao Uplift
province (Figure 3.10); the mid-southern areas, e.g. CHX-TWT area and Central
inversion tectonic belt, are dominated with feldspathic litharenite and they have
relatively better sorting and roundness (Figure 3.7) because these areas are further
away from the sandstone provenance of Haijiao and Yushan uplift province (Figure
3.10).
The reservoir sandstones of the Huagang Formation in the Xihu Sag mainly
developed in a fluvial-lacustrine-delta sedimentary system. The upper part of the
Huagang Formation dominated with delta front deposits, the micro sedimentary units
are mainly mouth bar and underwater distributary channel (Figure 3.10). Within these
micro-units, the lithology are mainly fine sandstone and siltstone, and both are
composed of a large amount of feldspar, this feature is similar to the rock types and
grain components characteristics of the reservoir sandstones in the Xihu Sag (Figure
3.4). The amount of feldspar decreases from west to east, i.e. Pinghu> Western
sub-sag> Central inversion tectonic belt (Table 3.3), and the amount of feldspar
increases from south to north.
47
Figure 3.10 Sedimentary facies and well locations of the Huagang Formation, Xihu Sag, and showing the provenances of Haijiao Uplift, Yushan Uplift and Eastern Periphery Upfold Belt (modified after Xu et al., 2013).

48
CHAPTER FOUR DIAGENESIS OF THE HUAGANG TIGHT RESERVOIR
4.1 Introduction of Diagenesis
Diagenesis is an important geologic process which controls reservoir porosity
and permeability. Diagenetic study attempts to identify the diagenetic events, their
time and their effect on the reservoir porosities and permeability (Kitty, 2001). The
diagenesis that the rocks experienced are compaction, cementation, dissolution and
precipitation of authigenic minerals (Schmid et al., 2004).
4.1.1 Compaction
Compaction refers to sediments responding to overburden pressure by changing
the packing of the particles (Nichols, 1999). When sediments are initially deposited,
the framework of particles contain the pore space usually filled with water. As more
sediments are deposited above, the increased loading results in porosity reduction
primarily through an efficient packing of the particles and to a lesser extent through
elastic compression and pressure solution. The initial porosity depends on lithology,
typically 40% for uncompacted / unconsolidated sands (Sclater et al., 1980).
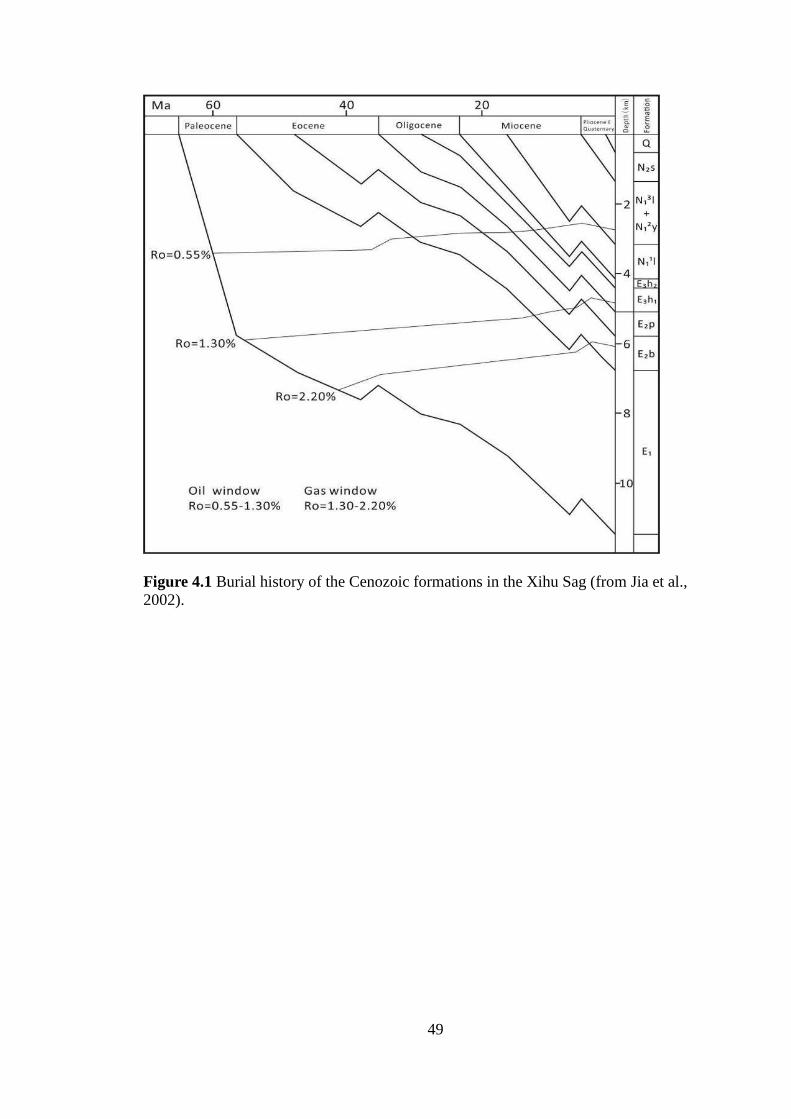
Based on the reconstruction of burial history in the Xihu sag (Figure 4.1) by Jia
et al (2002), the Paleocene and Eocene deposition occurred during active faulting and
depression with a thick depositional succession. The Yuquan movement has formed a
large scale of unconformity and lots of fold-uplift structures in the basin. After the
Eocene deposition, the reservoir went through a widespread uplift and erosion. The
present burial depth is the deepest of the Huagang and Pinghu Formations, i.e., 2000m
to 4878m.
As discussed in Chapter 3, the Huagang Formation in the Xihu Sag mainly
49
Figure 4.1 Burial history of the Cenozoic formations in the Xihu Sag (from Jia et al., 2002).

50
consists of lithic subarkose and feldspathic litharenite. The reservoir sandstone
comprises 4% to 20% of igneous or metamorphic sourced lithic grains. The plastic
deformation of mica, schist, phyllite grains and some igneous lithic grains during the
burial process is important evidences of compaction of sandstone in the Huagang
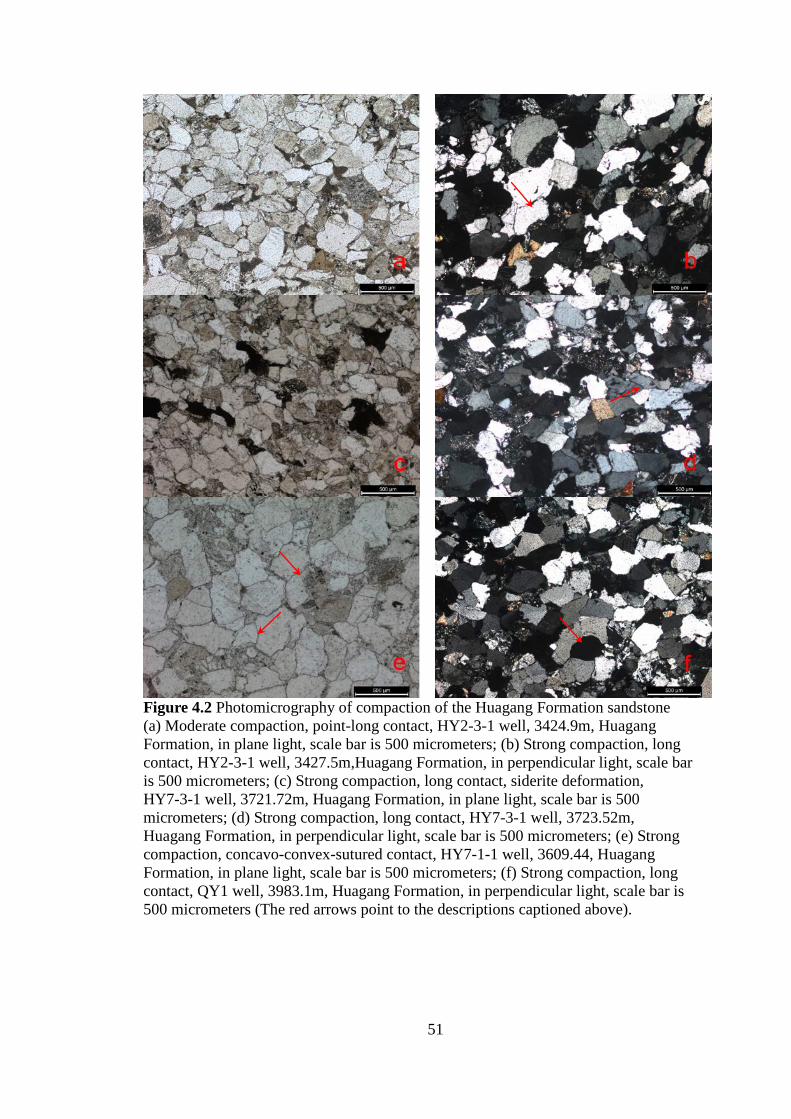
formation. In addition, the point-to-sutured contact (Figure 4.2) among particles and
mudstone grains transformed into pseudo-matrix, also showed that the reservoir
sandstone has experienced a relatively strong compaction.
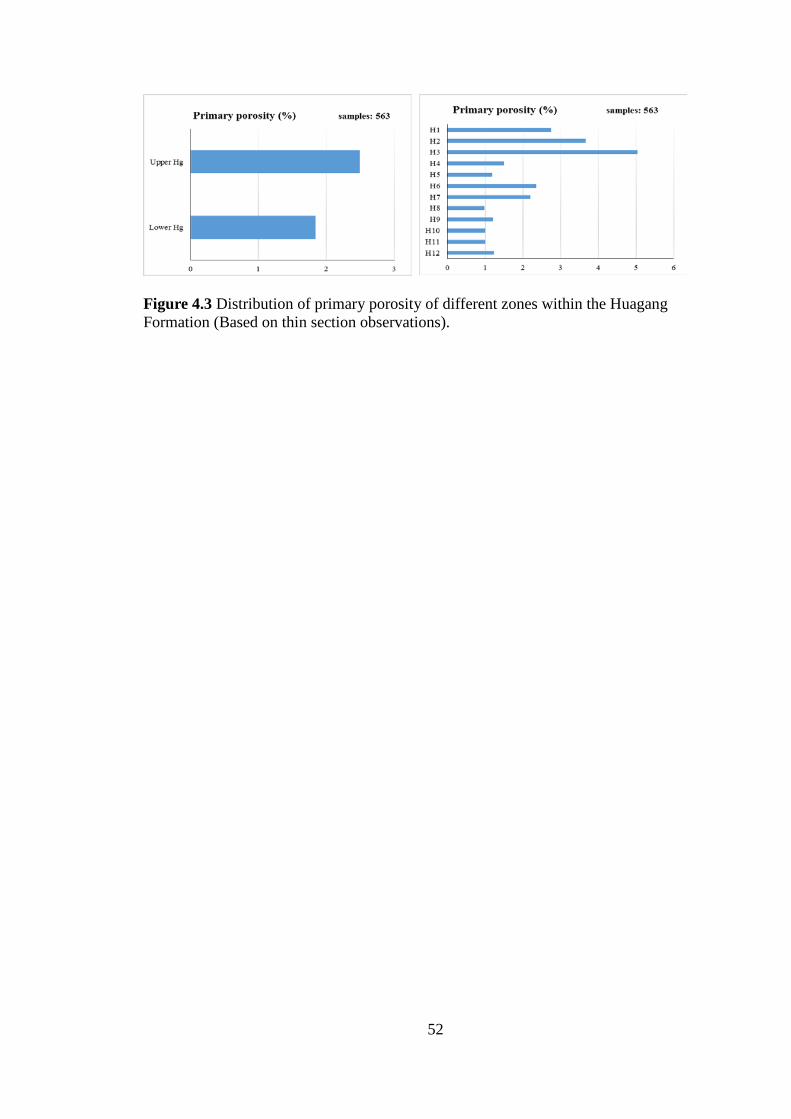
The Huagang Formation, is divided into 12 stratigraphic zones with H12 at the
bottom and H1 at the top. The division of the 12 stratigraphic zones are based on
CNOOC division. The reservoir porosity decreased with increasing depth from the H1
zone to H12 zone (Figure 4.3).
Compaction is the main factor contributing to decreasing porosity with
increasing depth within the Huagang Formation of the Xihu Sag, but its impact is
different in different parts of the basin.
Based on thin section observations on grain contacts, the degree of compaction
varies from low to high in the Pingbei, the Pinghu, the Western sub-sag, the Yuquan
area, the Central inversion tectonic belt and in the Chunxiao-Tianwaitian, . On
tectonic settings, there is an decreasing thickness of sedimentary successions from
west to east (Pingbei, Pinghu- CHX-TWTW, W.s.s.- C.I.T.B., Yuquan), thus it has a
higher compaction in the west of the study area than that of in the east. The analysis
showed that the primary porosities of the sandstones in the Pingbei,
Chunxiao-Tianwaitian areas are higher than those of other areas. According to the
method of reconstruction of geologic history (Scherer, 1987 and Beard, 1973), the
primary porosity in the Central inversion tectonic belt is about 36%. The secondary
porosity of reservoir sandstones in all the structural areas are well-developed except
51
Figure 4.2 Photomicrography of compaction of the Huagang Formation sandstone (a) Moderate compaction, point-long contact, HY2-3-1 well, 3424.9m, Huagang Formation, in plane light, scale bar is 500 micrometers; (b) Strong compaction, long contact, HY2-3-1 well, 3427.5m,Huagang Formation, in perpendicular light, scale bar is 500 micrometers; (c) Strong compaction, long contact, siderite deformation, HY7-3-1 well, 3721.72m, Huagang Formation, in plane light, scale bar is 500 micrometers; (d) Strong compaction, long contact, HY7-3-1 well, 3723.52m, Huagang Formation, in perpendicular light, scale bar is 500 micrometers; (e) Strong compaction, concavo-convex-sutured contact, HY7-1-1 well, 3609.44, Huagang Formation, in plane light, scale bar is 500 micrometers; (f) Strong compaction, long contact, QY1 well, 3983.1m, Huagang Formation, in perpendicular light, scale bar is 500 micrometers (The red arrows point to the descriptions captioned above).
52
Figure 4.3 Distribution of primary porosity of different zones within the Huagang Formation (Based on thin section observations).
53
for the western sub-sag (Figure 4.4). This is related to the paleo-topography of the
Xihu Sag (Cai et al., 2013), and it may also be related to the amount of cement (Table
4.3).
In order to quantitatively describe the degree of compaction, a compaction
coefficient was used. Based on Athy (1930), the compaction coefficient is defined as
(primary porosity-present intergranular porosity-cement content)/(primary porosity)].
With this coefficient, reduction of porosity increases with an increasing compaction
coefficient. Normally, the primary porosity of sandy sediments ranges around 40%
(Nichols, 1999). Based on inter-granular porosity and cement amount estimated under
the microscope, the compaction coefficient ranges from 0.50 to 0.71 (Table 4.1), with
an average of 0.58, or 58% of porosity loss due to compaction. With the same amount
of cement, compaction coefficient increases with decreasing grain size.
Because of deeper burial depth of the lower Huagang Formation, it has
experienced a stronger compaction than that of the upper Huagang Formation, where
the upper Huagang Formation has been better preserved and has higher porosity. With
respect to the different structural areas, the central Xihu Sag (Western sub-sag and
Central-Southern part of central inversion tectonic belt) has experienced a stronger
compaction than that of the Northern and Southern parts in the study area (Pingbei
and Chunxiao-tianwaitian). In fact, the western sub-sag has experienced the highest
compaction as inferred from thin section observations. While other areas, such as
Pingbei, with a high amount of cement (relatively early stage dolomite, siderite,
chlorite and quartz overgrowth contributed some effects toward compaction resistance)
and a low amount of matrix, have a relatively lower extent of compaction than that of
the western sub-sag (Zou et al., 2008).
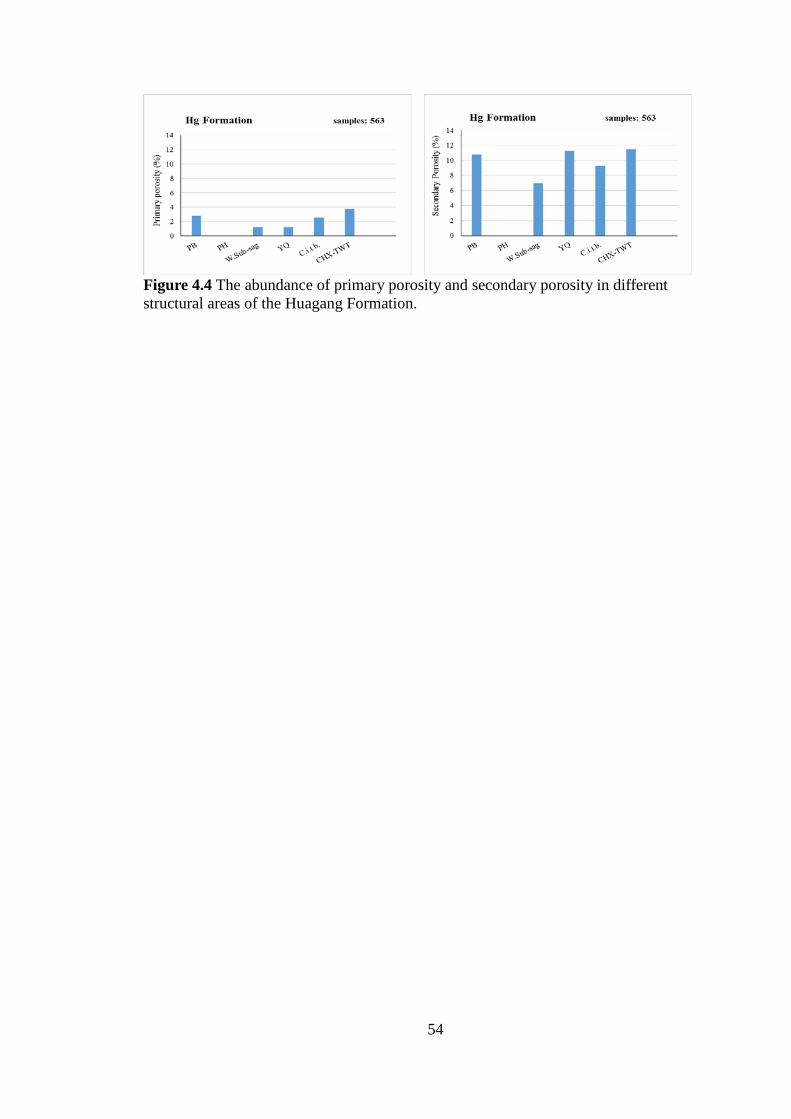
54
Figure 4.4 The abundance of primary porosity and secondary porosity in different structural areas of the Huagang Formation.

55
Table 4.1 Compaction coefficient of sandstone in different structural areas of the Huagang Formation
Formations Areas Compaction Coefficient Samples Compaction characteristics Wells
Hg Formation
Pingbei 0.51 20 High content of cement and low
content of matrix makes it a relatively weaker compaction
NB13-4-1、NB13-4-2、NB14-2-1、NB14-3-1、NB25-2-1、NB25-3-2、
NB25-3S-1D、BYT-3、BYT-2 Western Sub-sag 0.71 291 Low relief, located in delta front,
strongest compaction NB31-1-1S、NB31-1-2、QY-1、HY1-1-1、HY1-1-2、HY1-1-3S
Yuquan 0.61 13
Low content of cement and high content of matrix makes it a
relatively stronger compaction, rank only second to that of W.
Sub-sag
YQ-1、YQ-2
C.-S. C.I.T.B. 0.57 213 High content of cement and low content of intergranular porosity,
moderate compaction
CX-3、HY7-3-1、HY2-2-1、HY2-3-1、HY2-2S-1、DQ-1、
DQ-2、CX-2、HY7-1-3、HY7-1-1
CHX-TWT 0.5 26 Weakest compaction, may related
to deposition and pressure distribution
TWT-1、TWT-2、TWT-3、TWT-4、TWT-A6、CHX-1、CHX-2、CHX-3、CHX-4、
CHX-5
56
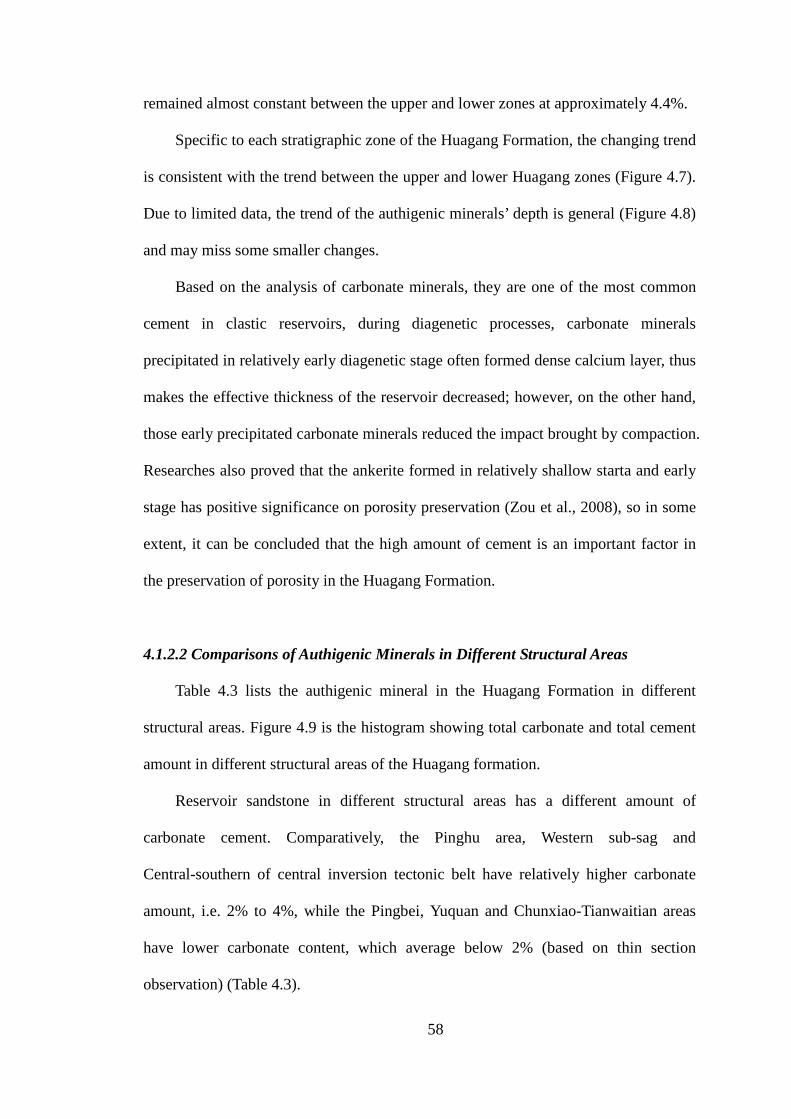
4.1.2 Precipitation of Authigenic Minerals
Authigenic minerals are minerals generated during deposition or formed within
the deposits in situ after deposition. They are distinct from all the detrital minerals
formed by igneous or metamorphic processes and were subsequently reworked into
the sedimentary realm. Many carbonate minerals form authigenically while other
minerals, such as, glauconite are also formed in this way (Nichols, 1999). Authigenic
minerals can occupy a large amount of the pore space and significantly reduce the
original porosity and permeability of the reservoir. The authigenic minerals in
Huagang sandstones in the Xihu Sag are mainly carbonate minerals (calcite,
ferrocalcite, dolomite, ankerite and siderite), silicate (mainly composed of authigenic
quartz), kaolinite, chlorite and others. The type and abundance of authigenic minerals
vary vertically and spatially in Huagang sandstone reservoirs of the Xihu Sag.
4.1.2.1 Vertical Variation of Authigenic Mineral in Different Stratigraphic Zone
The thin section observations provided the authigenic mineral compositions of
reservoir sandstone in the study area and are shown in Table 4.2.
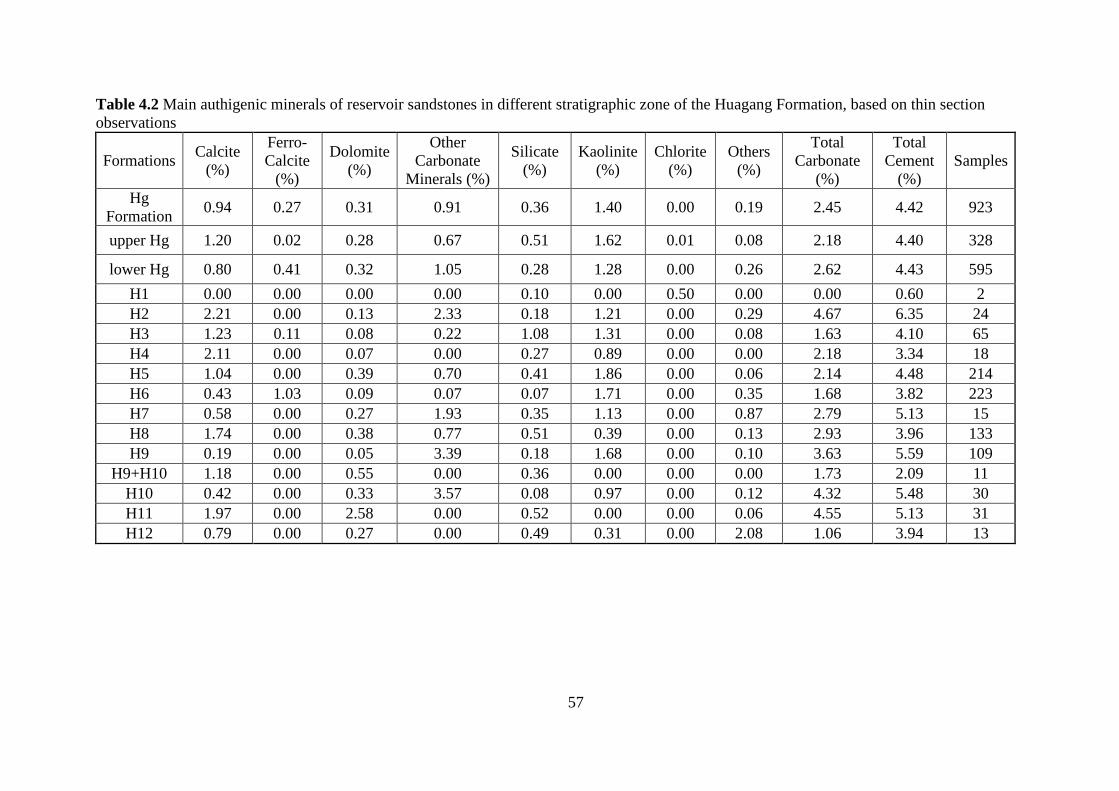
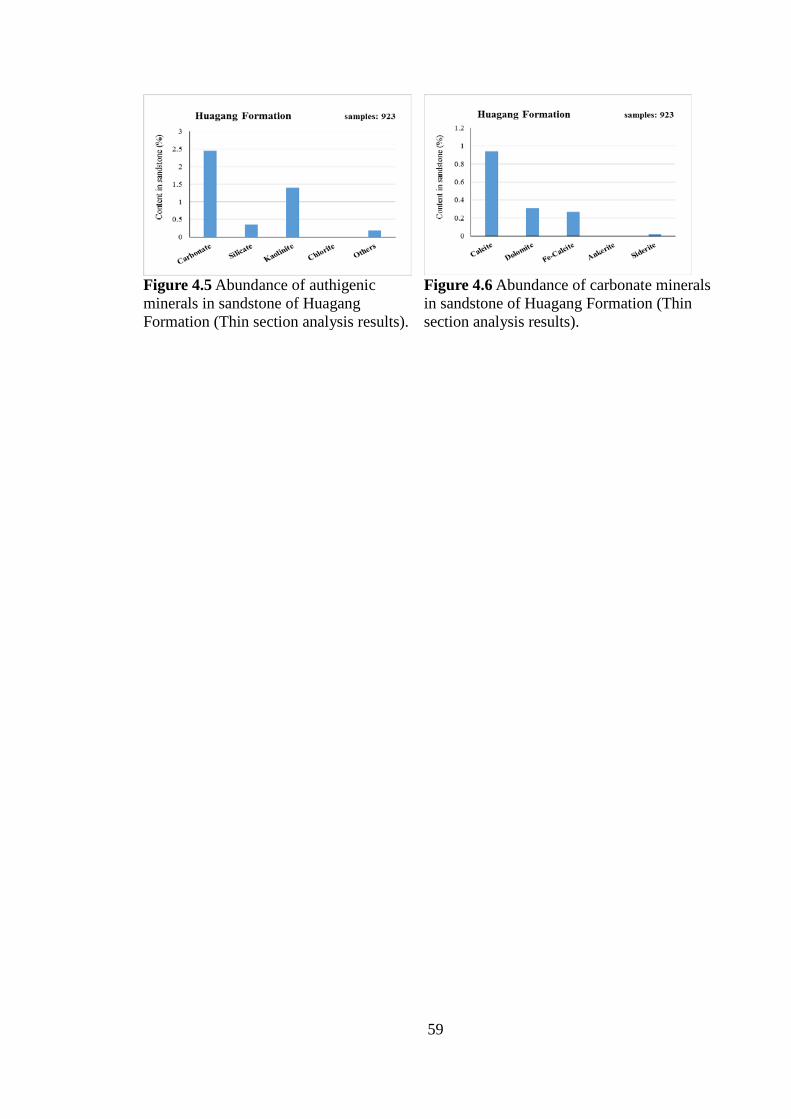
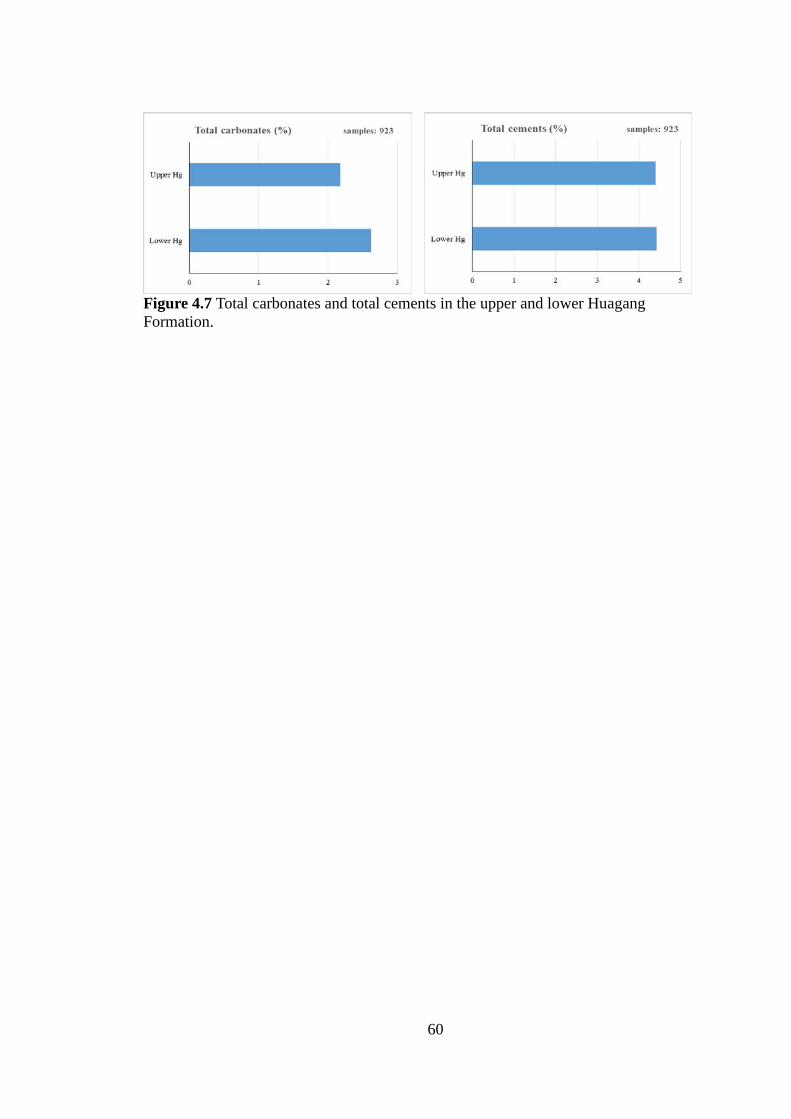
The authigenic mineral compositions of the 923 thin sections were analyzed in
this study. Carbonate cement had an average content of 2.5% (Figure 4.5) in reservoir
rocks and accounted for about 57% of the total cement (Table 4.2). Calcite and
dolomite were the main types of carbonate cement (Figure 4.6), accounting for 61%
and 20% of total carbonate, respectively. Kaolinite composed 32% of total authigenic
minerals, second only to carbonate minerals, which also have an important impact on
reservoir quality of the Huagang Formation in the Xihu Sag.
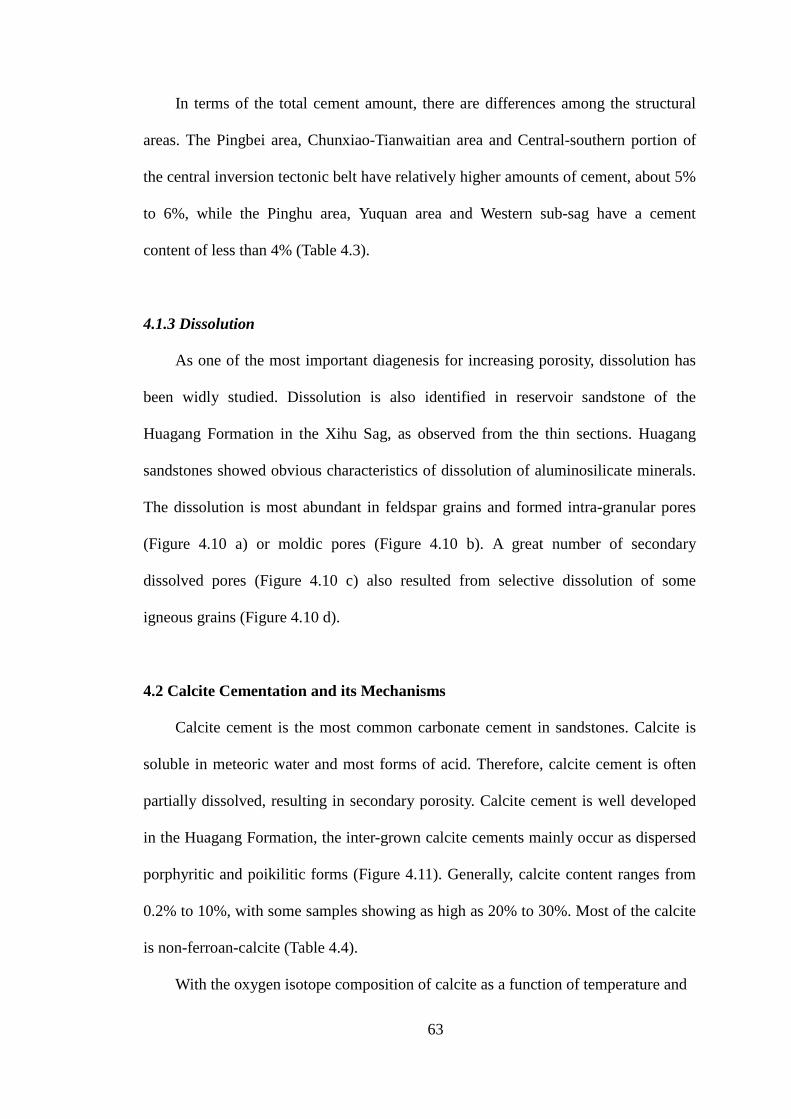
In terms of the upper and lower Huagang Formation, the content of carbonate
minerals increased with increasing depth (Figure 4.7) but the total cement content
57
Table 4.2 Main authigenic minerals of reservoir sandstones in different stratigraphic zone of the Huagang Formation, based on thin section observations
Formations Calcite (%)
Ferro- Calcite
(%)
Dolomite (%)
Other Carbonate
Minerals (%)
Silicate (%)
Kaolinite (%)
Chlorite (%)
Others (%)
Total Carbonate
(%)
Total Cement
(%) Samples
Hg Formation 0.94 0.27 0.31 0.91 0.36 1.40 0.00 0.19 2.45 4.42 923
upper Hg 1.20 0.02 0.28 0.67 0.51 1.62 0.01 0.08 2.18 4.40 328
lower Hg 0.80 0.41 0.32 1.05 0.28 1.28 0.00 0.26 2.62 4.43 595 H1 0.00 0.00 0.00 0.00 0.10 0.00 0.50 0.00 0.00 0.60 2 H2 2.21 0.00 0.13 2.33 0.18 1.21 0.00 0.29 4.67 6.35 24 H3 1.23 0.11 0.08 0.22 1.08 1.31 0.00 0.08 1.63 4.10 65 H4 2.11 0.00 0.07 0.00 0.27 0.89 0.00 0.00 2.18 3.34 18 H5 1.04 0.00 0.39 0.70 0.41 1.86 0.00 0.06 2.14 4.48 214 H6 0.43 1.03 0.09 0.07 0.07 1.71 0.00 0.35 1.68 3.82 223 H7 0.58 0.00 0.27 1.93 0.35 1.13 0.00 0.87 2.79 5.13 15 H8 1.74 0.00 0.38 0.77 0.51 0.39 0.00 0.13 2.93 3.96 133 H9 0.19 0.00 0.05 3.39 0.18 1.68 0.00 0.10 3.63 5.59 109
H9+H10 1.18 0.00 0.55 0.00 0.36 0.00 0.00 0.00 1.73 2.09 11 H10 0.42 0.00 0.33 3.57 0.08 0.97 0.00 0.12 4.32 5.48 30 H11 1.97 0.00 2.58 0.00 0.52 0.00 0.00 0.06 4.55 5.13 31 H12 0.79 0.00 0.27 0.00 0.49 0.31 0.00 2.08 1.06 3.94 13
58
remained almost constant between the upper and lower zones at approximately 4.4%.
Specific to each stratigraphic zone of the Huagang Formation, the changing trend
is consistent with the trend between the upper and lower Huagang zones (Figure 4.7).
Due to limited data, the trend of the authigenic minerals’ depth is general (Figure 4.8)
and may miss some smaller changes.
Based on the analysis of carbonate minerals, they are one of the most common
cement in clastic reservoirs, during diagenetic processes, carbonate minerals
precipitated in relatively early diagenetic stage often formed dense calcium layer, thus
makes the effective thickness of the reservoir decreased; however, on the other hand,
those early precipitated carbonate minerals reduced the impact brought by compaction.
Researches also proved that the ankerite formed in relatively shallow starta and early
stage has positive significance on porosity preservation (Zou et al., 2008), so in some
extent, it can be concluded that the high amount of cement is an important factor in
the preservation of porosity in the Huagang Formation.
4.1.2.2 Comparisons of Authigenic Minerals in Different Structural Areas
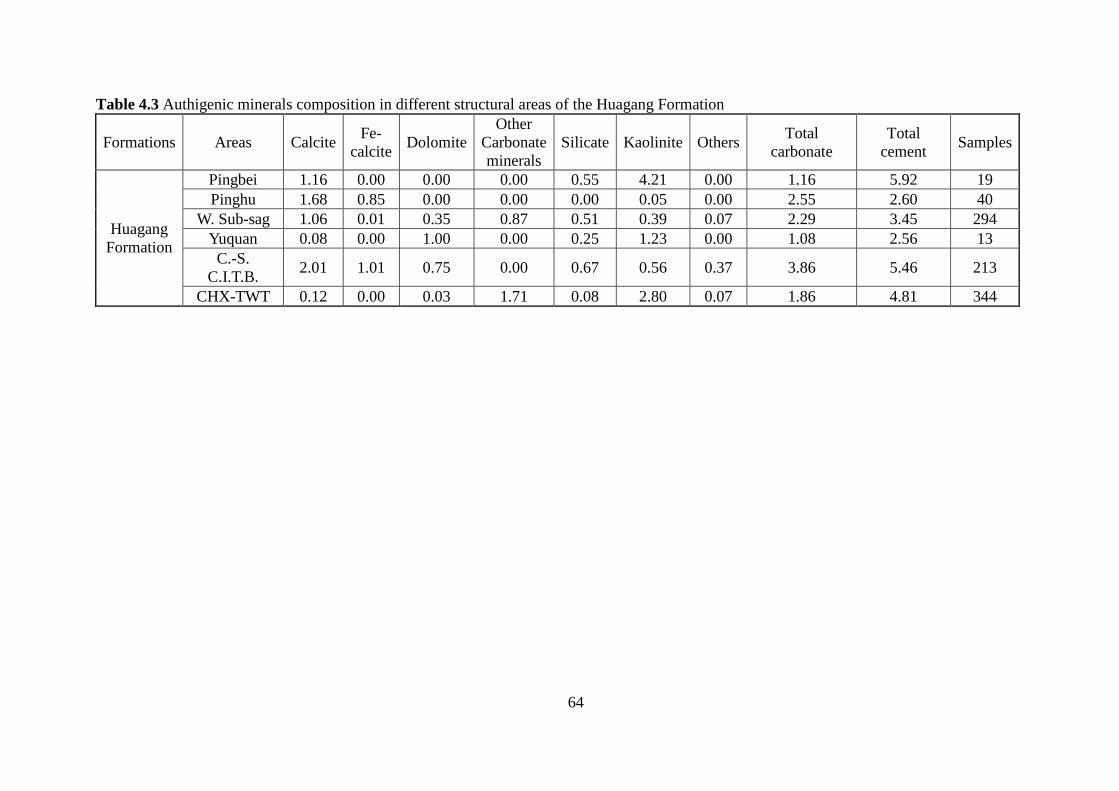
Table 4.3 lists the authigenic mineral in the Huagang Formation in different
structural areas. Figure 4.9 is the histogram showing total carbonate and total cement
amount in different structural areas of the Huagang formation.
Reservoir sandstone in different structural areas has a different amount of
carbonate cement. Comparatively, the Pinghu area, Western sub-sag and
Central-southern of central inversion tectonic belt have relatively higher carbonate
amount, i.e. 2% to 4%, while the Pingbei, Yuquan and Chunxiao-Tianwaitian areas
have lower carbonate content, which average below 2% (based on thin section
observation) (Table 4.3).
59
Figure 4.5 Abundance of authigenic minerals in sandstone of Huagang Formation (Thin section analysis results).
Figure 4.6 Abundance of carbonate minerals in sandstone of Huagang Formation (Thin section analysis results).
60
Figure 4.7 Total carbonates and total cements in the upper and lower Huagang Formation.

61
Figure 4.8 Total carbonates and total cements in each small zone of Huagang Formation.

62
Figure 4.9 Total carbonates and total cements in each structural areas of the Huagang Formation.
63
In terms of the total cement amount, there are differences among the structural
areas. The Pingbei area, Chunxiao-Tianwaitian area and Central-southern portion of
the central inversion tectonic belt have relatively higher amounts of cement, about 5%
to 6%, while the Pinghu area, Yuquan area and Western sub-sag have a cement
content of less than 4% (Table 4.3).
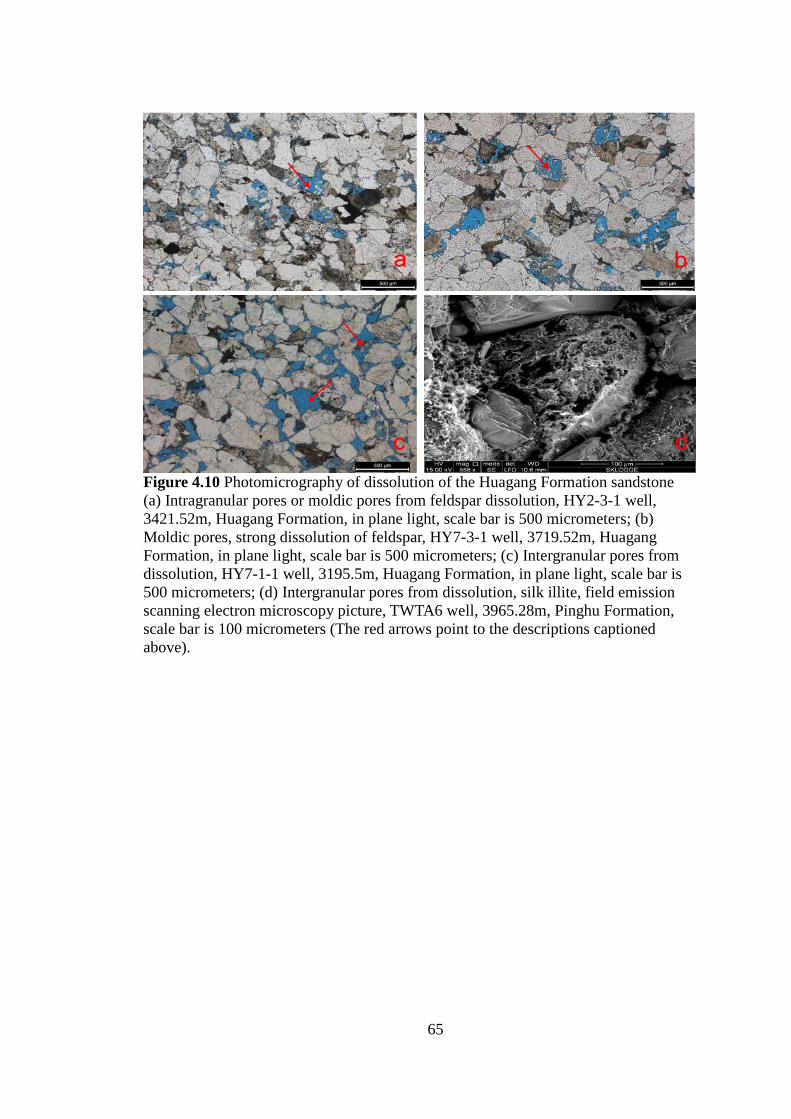
4.1.3 Dissolution
As one of the most important diagenesis for increasing porosity, dissolution has
been widly studied. Dissolution is also identified in reservoir sandstone of the
Huagang Formation in the Xihu Sag, as observed from the thin sections. Huagang
sandstones showed obvious characteristics of dissolution of aluminosilicate minerals.
The dissolution is most abundant in feldspar grains and formed intra-granular pores
(Figure 4.10 a) or moldic pores (Figure 4.10 b). A great number of secondary
dissolved pores (Figure 4.10 c) also resulted from selective dissolution of some
igneous grains (Figure 4.10 d).
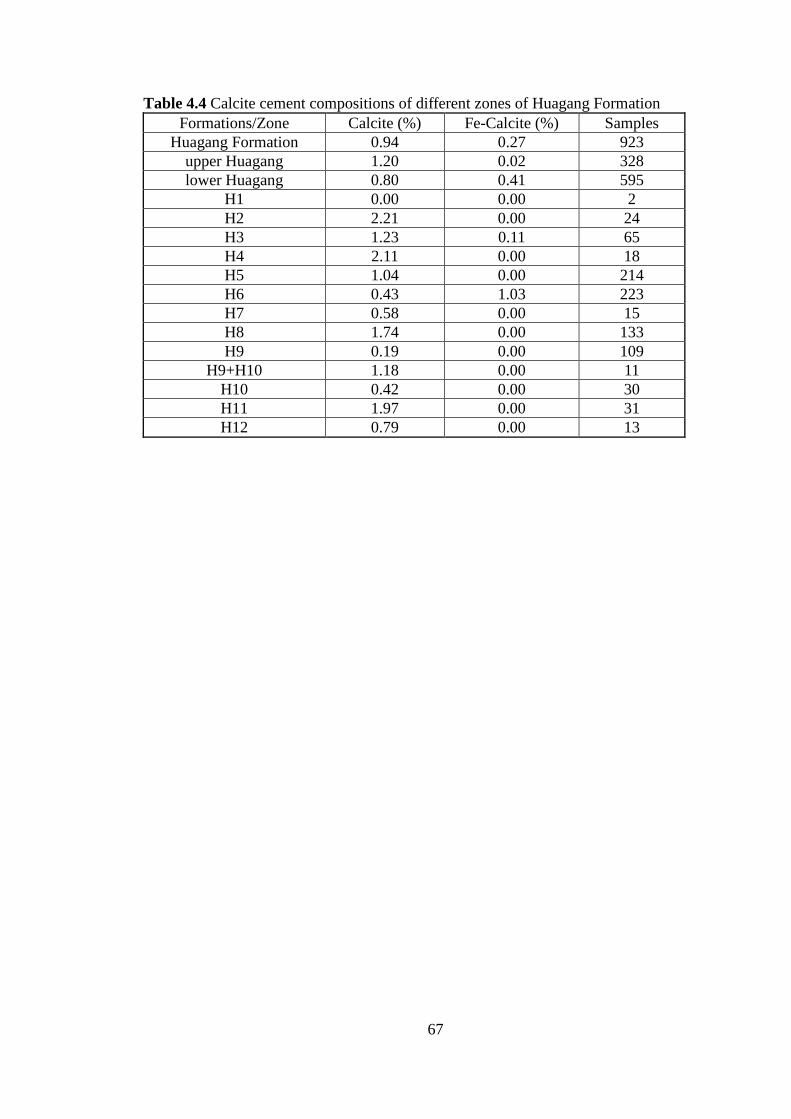
4.2 Calcite Cementation and its Mechanisms
Calcite cement is the most common carbonate cement in sandstones. Calcite is
soluble in meteoric water and most forms of acid. Therefore, calcite cement is often
partially dissolved, resulting in secondary porosity. Calcite cement is well developed
in the Huagang Formation, the inter-grown calcite cements mainly occur as dispersed
porphyritic and poikilitic forms (Figure 4.11). Generally, calcite content ranges from
0.2% to 10%, with some samples showing as high as 20% to 30%. Most of the calcite
is non-ferroan-calcite (Table 4.4).
With the oxygen isotope composition of calcite as a function of temperature and
64
Table 4.3 Authigenic minerals composition in different structural areas of the Huagang Formation
Formations Areas Calcite Fe- calcite Dolomite
Other Carbonate minerals
Silicate Kaolinite Others Total carbonate
Total cement Samples
Huagang Formation
Pingbei 1.16 0.00 0.00 0.00 0.55 4.21 0.00 1.16 5.92 19 Pinghu 1.68 0.85 0.00 0.00 0.00 0.05 0.00 2.55 2.60 40
W. Sub-sag 1.06 0.01 0.35 0.87 0.51 0.39 0.07 2.29 3.45 294 Yuquan 0.08 0.00 1.00 0.00 0.25 1.23 0.00 1.08 2.56 13 C.-S.
C.I.T.B. 2.01 1.01 0.75 0.00 0.67 0.56 0.37 3.86 5.46 213
CHX-TWT 0.12 0.00 0.03 1.71 0.08 2.80 0.07 1.86 4.81 344
65
Figure 4.10 Photomicrography of dissolution of the Huagang Formation sandstone (a) Intragranular pores or moldic pores from feldspar dissolution, HY2-3-1 well, 3421.52m, Huagang Formation, in plane light, scale bar is 500 micrometers; (b) Moldic pores, strong dissolution of feldspar, HY7-3-1 well, 3719.52m, Huagang Formation, in plane light, scale bar is 500 micrometers; (c) Intergranular pores from dissolution, HY7-1-1 well, 3195.5m, Huagang Formation, in plane light, scale bar is 500 micrometers; (d) Intergranular pores from dissolution, silk illite, field emission scanning electron microscopy picture, TWTA6 well, 3965.28m, Pinghu Formation, scale bar is 100 micrometers (The red arrows point to the descriptions captioned above).

66
Figure 4.11 Photomicrography of calcite cement of the Huagang Formation sandstone (a) Calcite cements filled in intergranular pores, HY2-3-1 well, 3425.8m, Huagang Formation, in perpendicular light, scale bar is 500 micrometers; (b) Calcite cements filled in intergranular pores, intergrown cement, HY2-3-1 well, 3426.61m, Huagang Formation, in perpendicular light, scale bar is 500 micrometers; (c) Calcite cements filled in intergranular pores, HY7-3-1 well, 3722.92m, Huagang Formation, in perpendicular light, scale bar is 500 micrometers; (d) Authigenic calcite filled in intra-granular pores of feldspar, HY7-3-1 well, 3726.19m, Huagang Formation, in perpendicular light, scale bar is 500 micrometers (The red arrows point to the descriptions captioned above).
67
Table 4.4 Calcite cement compositions of different zones of Huagang Formation
Formations/Zone Calcite (%) Fe-Calcite (%) Samples Huagang Formation 0.94 0.27 923
upper Huagang 1.20 0.02 328 lower Huagang 0.80 0.41 595
H1 0.00 0.00 2 H2 2.21 0.00 24 H3 1.23 0.11 65 H4 2.11 0.00 18 H5 1.04 0.00 214 H6 0.43 1.03 223 H7 0.58 0.00 15 H8 1.74 0.00 133 H9 0.19 0.00 109
H9+H10 1.18 0.00 11 H10 0.42 0.00 30 H11 1.97 0.00 31 H12 0.79 0.00 13

68
water composition (Friedman and O'Neil, 1977) and the isoline map for the historical
distribution of the δ18O precipitation values from the IAEA network data, Gat (1996),
if oxygen isotope composition of fluid can be estimated, the calcite cement-forming
temperatures can be determined. Respecting the dissolution agents of the reservoir,
Boles and Hayes (1993) U.S.A., they found organic acid could be responsible for
feldspar dissolution of sandstone in the San Joaquin Basin, California.
4.2.1 Occurrence of Calcite Cements
Based on the thin section examination, SEM analyses and field emission
scanning electron microscopy, the calcite cement occurres (1) as cement in
intergranular pores: when calcite cement fills intergranular pores, it often appears in a
continuous concretion, with large grains (Figure 4.11.a, b); (2) as cement in
intra-granular pores: commonly, calcite cement fills in soluble aluminum silicate
grains, such as, feldspar (Figure 4.11 c, d).
4.2.2 Carbon and Oxygen Isotopes of calcite cement
The δ13C values of the calcite cements (Table 4.5) range from -7.40‰ vPDB to
-1.94‰ vPDB, averaging -4.06‰. The δ13C values of normal marine carbonate from
Paleogene of inorganic carbon sources ranged from -1‰ vPDB to 4‰ vPDB (Figure
4.12, Zhang and Le, 1981, from data integration by Emery and Robinson, 1993). The
δ13C value of organic carbon is -25‰ vPDB (Veizer et al., 1999). Since the δ13C
values of calcite cements in the Huagang Formation (Table 4.5) were between marine
carbonate and atmospheric CO2, and much higher than the δ13C value of organic
carbon (Figure 4.13), it is suggested that the Huagang reservoir was influenced by
meteoric water. According to Figure 4.12, it can be seen that the δ13C values of calcite
69
cements were in the expected δ13C range of fresh water carbonate, which also
suggests there was obvious meteoric water in the reservoir. The lower δ13C values of
the upper Huagang Formation (average -6.38‰) compared to -2.87‰ vPDB of the
lower Huagang Formation suggest the upper formation experienced a stronger
meteoric water influence, while the lower formation experienced a weaker meteoric
water influence.
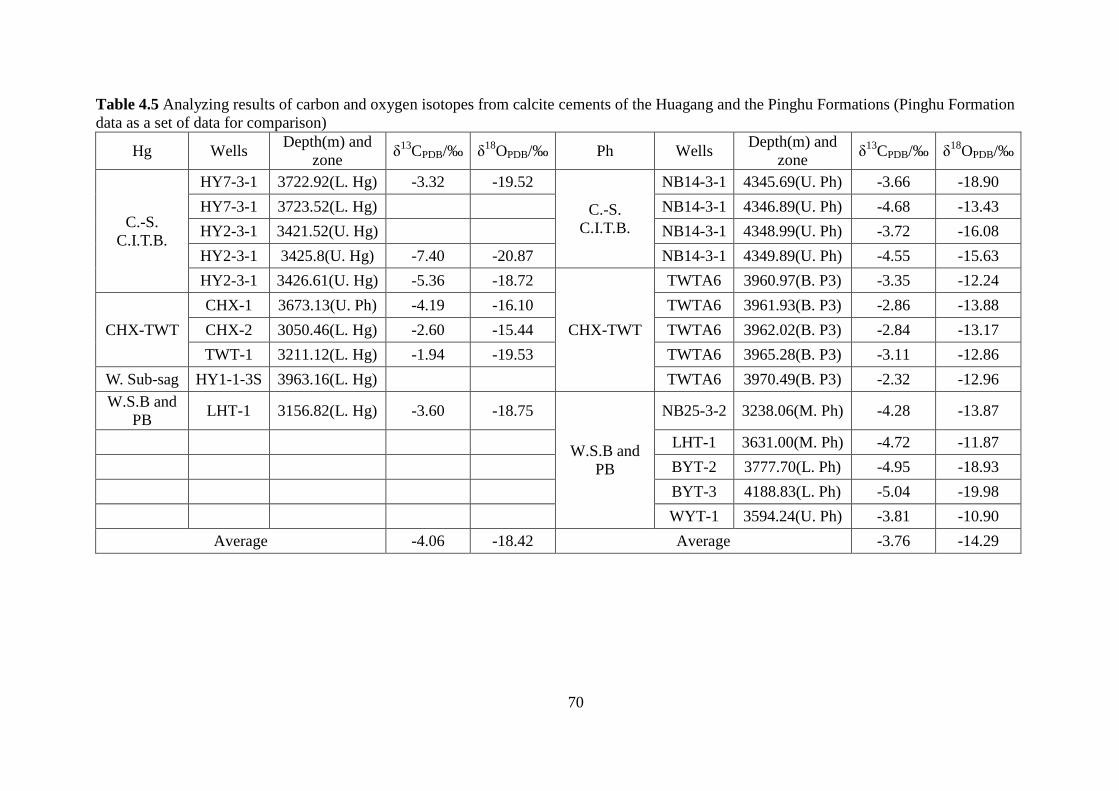
The δ18O values of the calcite cements (Table 4.5) in the Huagang Formation
ranged from -20.87‰ vPDB to -15.44‰ vPDB, averaging -18.42‰ vPDB. The
calculated temperature of the calcite cements would be between 35℃ and 107℃
(average 67.45℃) if the oxygen isotopic compositions of fluid were assumed to be
-6‰ vPDB and the equation from Friedman and O’Neil (1977) was used (Table 4.6
and Figure 4.14). The salinity was calculated using the formula (Keith and Weber,
1964), Salinity= 2.048(δ13CPDB+50) + 0.498(δ18OPDB+50) is 111.36, suggesting that
the fluid is mainly composed of fresh water (Keith and Weber, 1964).
The data show a weak positive correlation of carbon and oxygen isotopes (Figure
4.13). The calcite cement with lower δ13C values and lower δ18O values were
probably formed in a relatively late stage of diagenetic stage, as low δ18O values
could represent high temperatures if the O isotopic composition of fluids remained
unchanged.
4.2.3 Origin of Calcite Cements
Dissolved feldspars partially contributed Ca2+ in the carbonate cements, where
the anorthite’s dissolving formula (Siebert, 1985) is:
CaAl2Si2O8 (anorthite) + 2H+ + H2O → Al2Si2O5(OH)4 (kaolinite) + Ca2+.
Reservoir sandstones of the Huagang Formation are very rich in feldspars, after
70
Table 4.5 Analyzing results of carbon and oxygen isotopes from calcite cements of the Huagang and the Pinghu Formations (Pinghu Formation data as a set of data for comparison)
Hg Wells Depth(m) and zone δ13CPDB/‰ δ18OPDB/‰ Ph Wells Depth(m) and
zone δ13CPDB/‰ δ18OPDB/‰
C.-S. C.I.T.B.
HY7-3-1 3722.92(L. Hg) -3.32 -19.52
C.-S. C.I.T.B.
NB14-3-1 4345.69(U. Ph) -3.66 -18.90 HY7-3-1 3723.52(L. Hg) NB14-3-1 4346.89(U. Ph) -4.68 -13.43 HY2-3-1 3421.52(U. Hg) NB14-3-1 4348.99(U. Ph) -3.72 -16.08 HY2-3-1 3425.8(U. Hg) -7.40 -20.87 NB14-3-1 4349.89(U. Ph) -4.55 -15.63 HY2-3-1 3426.61(U. Hg) -5.36 -18.72
CHX-TWT
TWTA6 3960.97(B. P3) -3.35 -12.24
CHX-TWT CHX-1 3673.13(U. Ph) -4.19 -16.10 TWTA6 3961.93(B. P3) -2.86 -13.88 CHX-2 3050.46(L. Hg) -2.60 -15.44 TWTA6 3962.02(B. P3) -2.84 -13.17 TWT-1 3211.12(L. Hg) -1.94 -19.53 TWTA6 3965.28(B. P3) -3.11 -12.86
W. Sub-sag HY1-1-3S 3963.16(L. Hg) TWTA6 3970.49(B. P3) -2.32 -12.96 W.S.B and
PB LHT-1 3156.82(L. Hg) -3.60 -18.75
W.S.B and PB
NB25-3-2 3238.06(M. Ph) -4.28 -13.87
LHT-1 3631.00(M. Ph) -4.72 -11.87 BYT-2 3777.70(L. Ph) -4.95 -18.93 BYT-3 4188.83(L. Ph) -5.04 -19.98 WYT-1 3594.24(U. Ph) -3.81 -10.90
Average -4.06 -18.42 Average -3.76 -14.29

71
Figure 4.12 Distribution range of δ13C values of some carbon-containing material in nature, the shadow in this figure shows the range of δ13C values of calcite cement samples of the Huagang Formation (modified after Zhang and Le, 1981, from data integration by Emery and Robinson, 1993).

72
Figure 4.13 Plot of carbon and oxygen isotopes from calcite cements of Huagang and Pinghu Formations in the Xihu Sag (Carbon and oxygen isotope results of sea water is from Veizer, 1999).

73
Table 4.6 Salinities and temperatures of calcite cements of the Huagang and Pinghu Formations (the Pinghu Formation’s data as a set of data for comparison)
Wells Formations δ13CPDB/‰ δ18OPDB/‰ Z T(℃) HY7-3-1
Hg
-3.32 -19.52 110.78 94.40 HY2-3-1 -7.4 -20.87 101.75 107.35 HY2-3-1 -5.36 -18.72 107.00 87.34 CHX-1 -4.19 -16.10 110.70 66.80 CHX-2 -2.6 -15.44 114.29 62.16 TWT-1 -1.94 -19.53 113.60 94.49 LHT-1 -3.6 -18.75 110.59 87.59
TWTA6
Ph
-3.35 -12.24 114.34 42.14 TWTA6 -2.86 -13.88 114.53 51.93 TWTA6 -2.84 -13.17 114.93 47.58 TWTA6 -3.11 -12.86 114.53 45.73 TWTA6 -2.32 -12.96 116.09 46.33
NB14-3-1 -3.66 -18.90 110.39 88.89 NB14-3-1 -4.68 -13.43 111.03 49.15 NB14-3-1 -3.72 -16.08 111.67 66.65 NB14-3-1 -4.55 -15.63 110.20 63.48 Nb25-3-2 -4.28 -13.87 111.63 51.87
BYT-2 -4.95 -18.93 107.74 89.15 BYT-3 -5.04 -19.98 107.03 98.66 LHT-1 -4.72 -11.87 111.72 40.05 WYT-1 -3.81 -10.90 114.07 34.77
Average -3.92 -15.89 111.36 67.45
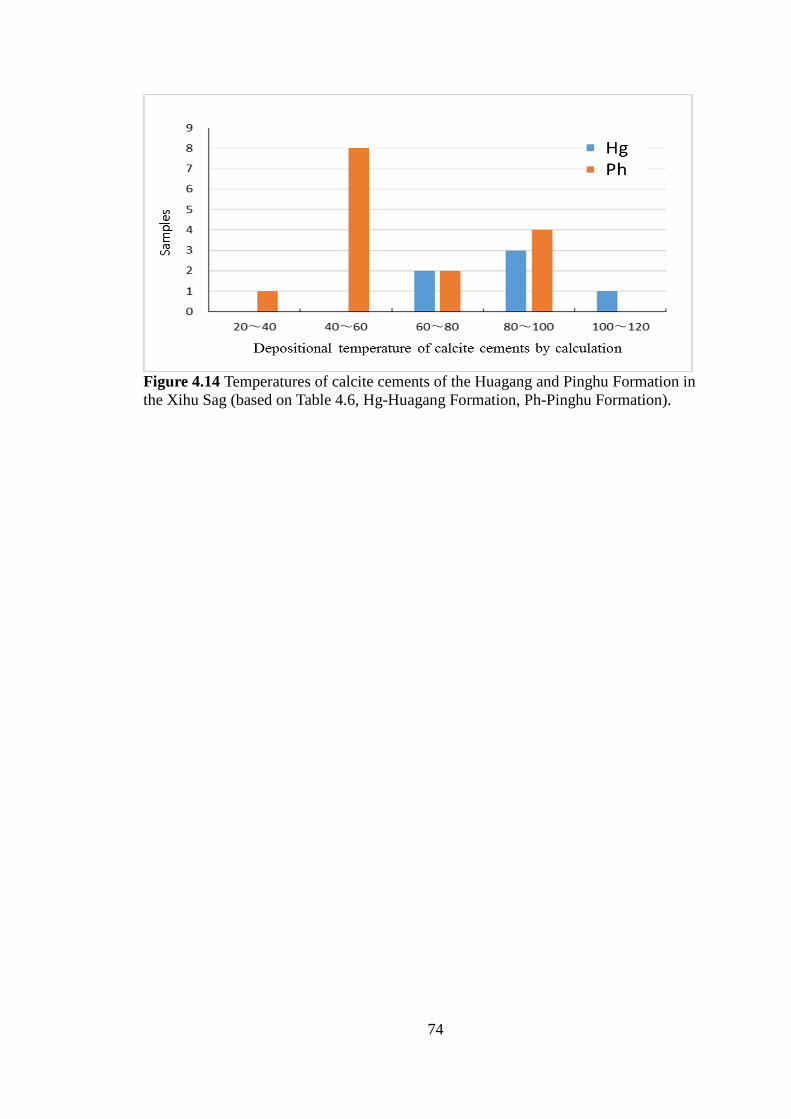
74
Figure 4.14 Temperatures of calcite cements of the Huagang and Pinghu Formation in the Xihu Sag (based on Table 4.6, Hg-Huagang Formation, Ph-Pinghu Formation).

75
feldspars dissolution, it may promote calcite precipitation, because it likely providing
Ca2+ for calcite cements, substantiated by calcites filling the intra-granular pores of
feldspars.
Ca2+, Fe3+ and Mg2+ released from smectite-illite transformation provides an
important material source of carbonate cements (Hower et al, 1976):
4.5K++8Al3++smectite→illite +Na++2Ca2++2.5Fe3++2Mg2++3Si4+,
the transformation reaction of clay minerals occurs at higher temperatures during
deeper burial depth (Hower et al, 1976), suggesting that the calcite cements sourced
from this mechanism may have happened in a relatively late diagenetic stage.
4.2.4 Temperatures and Time of Calcite Cements
The relationship of the temperature, O isotopic composition of fluids, and O
isotopic composition of calcite can be expressed as the following equation (Friedman
and O’Neil, 1977):
1000lnα=2.78×10⁶/T(K)2-2.89,
α=(1+δ18O SMOWCalcite/1000)/(1+δ18O SMOWFluid/1000),
The δ18O value of calcite cement is related to the depositional temperature and
the δ18O value of fluid. If the oxygen isotopic compositions of calcite is measured and
if oxygen isotopic compositions of fluid from which calcite precipitated can be
estimated, the temperature of calcite precipitation can be calculated using the equation
by Friedman and O’Neil (1977) or estimated using the chart that was constructed with
this equation (Table 4.6 and Figure 4.14). The oxygen isotopic compositions of
meteoric water is possibly around -6‰ SMOW (Figure 4.15), which can be used as
the minimum values of O isotopic compositions of fluid from which calcite
precipitated. The calculated temperature for precipitation of the calcite cements would
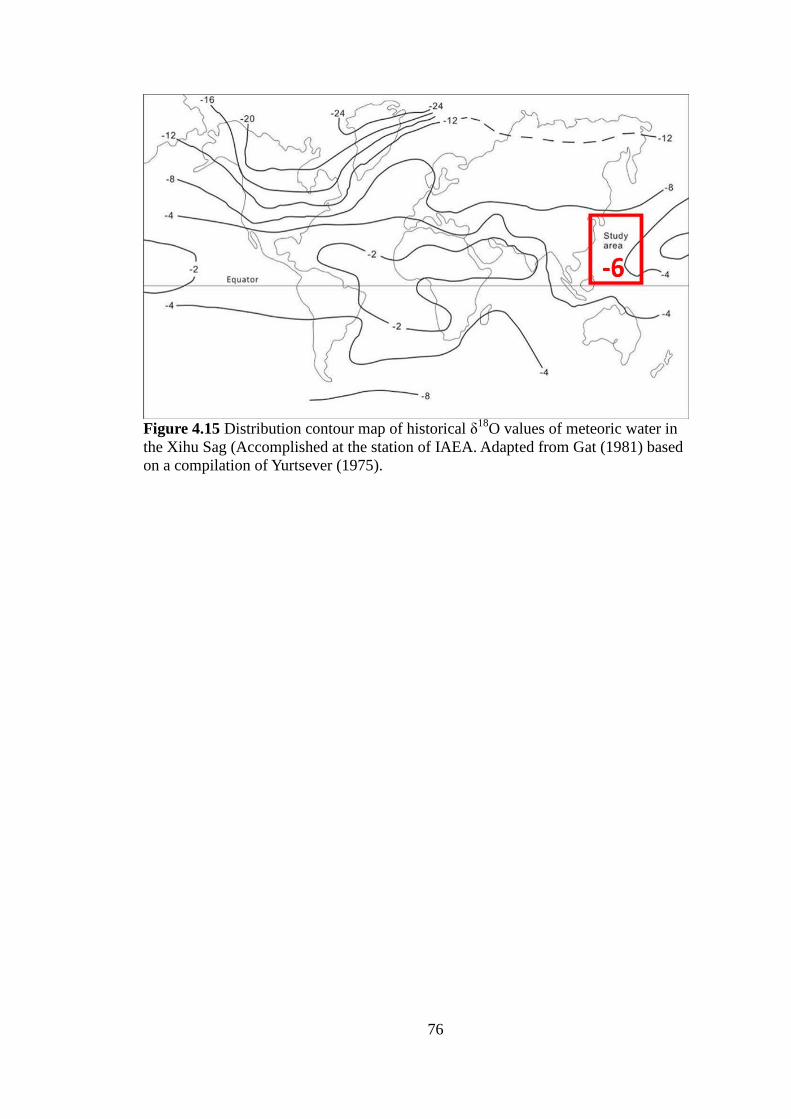
76
Figure 4.15 Distribution contour map of historical δ18O values of meteoric water in the Xihu Sag (Accomplished at the station of IAEA. Adapted from Gat (1981) based on a compilation of Yurtsever (1975).

77
be between 35℃ and 107℃ (Figure 4.16).
The isotope data was combined with previous fluid inclusion data from selected
wells in the Xihu Sag (Table 4.7; Figure 4.17) to reconstruct the geothermal and burial
history and to understand hydrocarbon migration in the Xihu Sag.
Based on Figure 4.17, burial history of the Huagang Formation of two wells
(TWTA6 and CHX-1) was reconstructed. The time of calcite cements and oil-gas
filling history of each well is discussed respectively.
The temperature of calcite cements’ precipitation of well TWTA6 was 86.4℃
(45.5℃~107.5℃) (Table 4.8). The diagenetic stage of this well was from stage A of
the early diagenetic stage to stage B of the intermediate digenetic stage (Figure 4.18).
The precipitation of calcite cements is from Early Miocene to Late Pliocene (Figure
4.18). The temperature of fluid inclusions from carbonate cements or quartz
overgrowth ranged from 106℃~ 142℃ (Table 4.7), corresponding to burial
temperature from the Late Pliocene to Quaternary (Table 4.9). There were three
oil-gas filling stages in well TWTA6 (Figure 4.18, Table 4.9). The first stage of
charging of oil and gas corresponds to fluid inclusion temperatures 106℃~115℃,
Ro of 0.7 and burial depth of 2950m during the Early Miocene to Mid Miocene. The
second stage charging of oil and gas corresponds to fluid inclusion temperatures
118℃~126℃, Ro of 1.0 and burial depth of 3550m during the Late Miocene to Late
Pliocene. The third stage charging of oil and gas corresponds to fluid inclusion
temperatures 134℃~142℃, Ro of 1.1 and burial depth of 3900m, occurring from the
Quaternary to the present.
Well CHX-1 is similar to well TWTA6 in that it is located in the same area and
has the same formation temperature of calcite cements, i.e. 86.4℃(45.5℃~107.5℃)
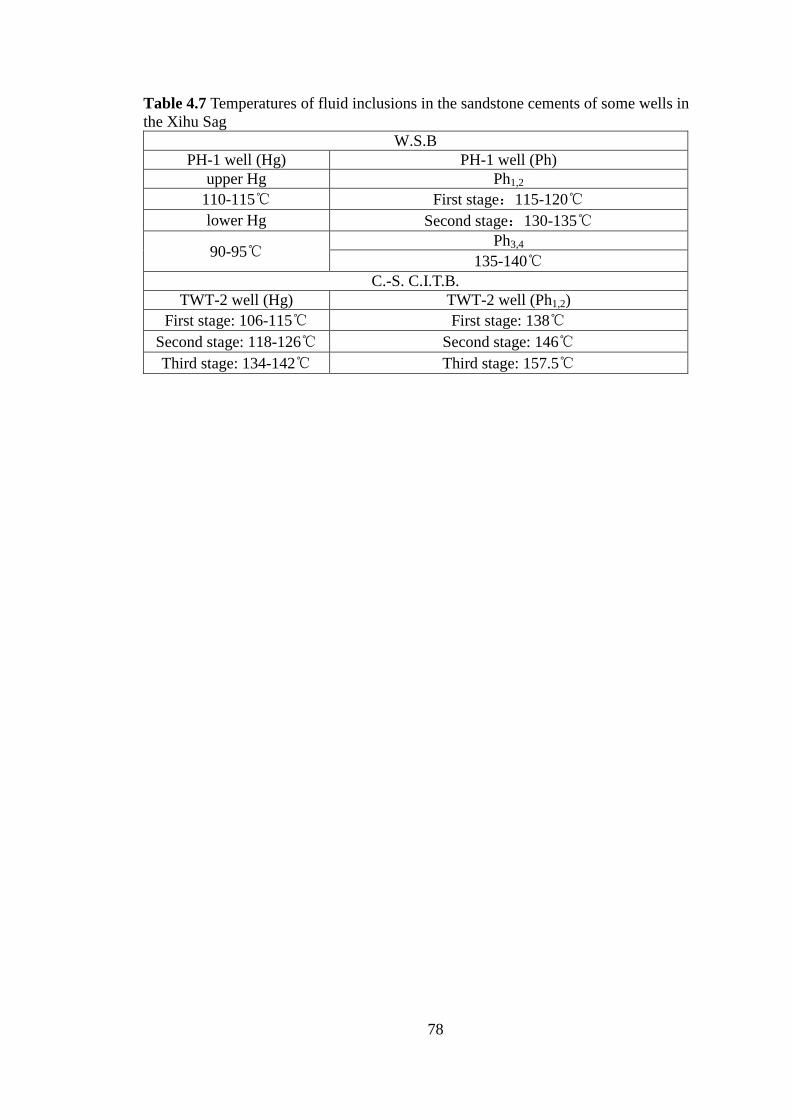
78
Table 4.7 Temperatures of fluid inclusions in the sandstone cements of some wells in the Xihu Sag
W.S.B PH-1 well (Hg) PH-1 well (Ph)
upper Hg Ph1,2
110-115℃ First stage:115-120℃ lower Hg Second stage:130-135℃
90-95℃ Ph3,4
135-140℃ C.-S. C.I.T.B.
TWT-2 well (Hg) TWT-2 well (Ph1,2) First stage: 106-115℃ First stage: 138℃
Second stage: 118-126℃ Second stage: 146℃ Third stage: 134-142℃ Third stage: 157.5℃

79
Figure 4.16 Correlation chart of δ18Ocalcite,T(℃) and δ18Ofluid (Friedman and O’Neil, 1977).
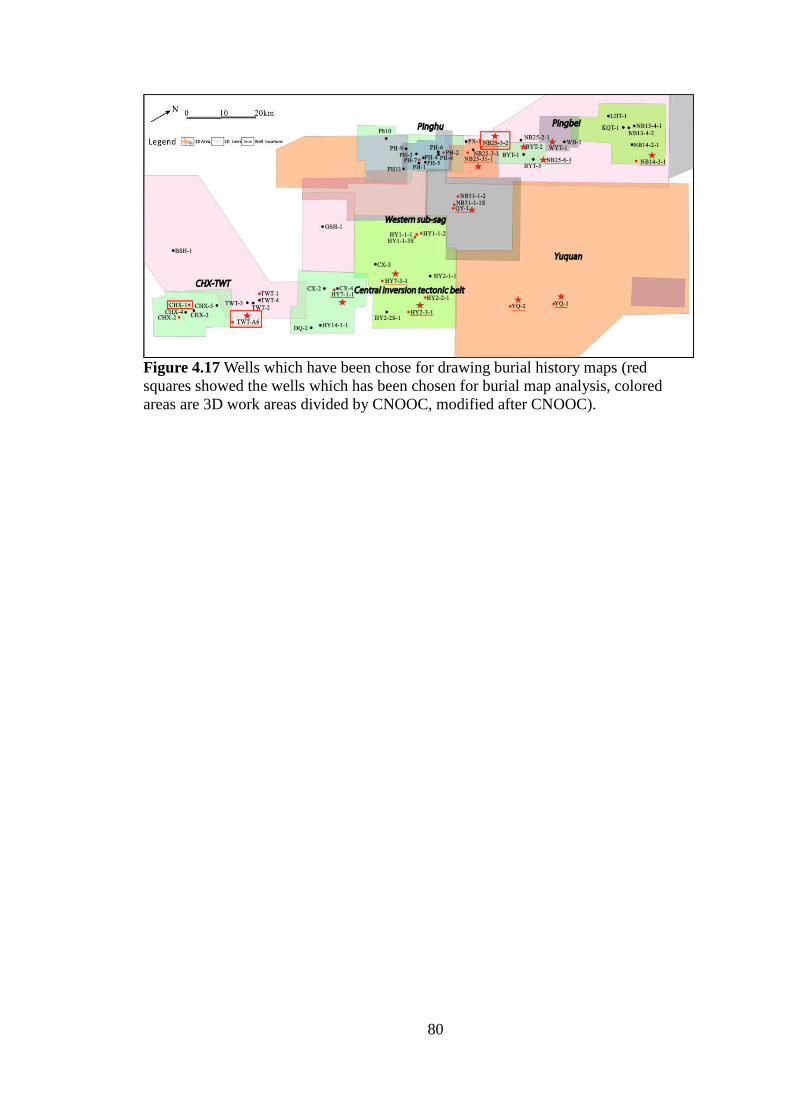
80
Figure 4.17 Wells which have been chose for drawing burial history maps (red squares showed the wells which has been chosen for burial map analysis, colored areas are 3D work areas divided by CNOOC, modified after CNOOC).

81
Figure 4.18 Time of the calcite cements and burial map of well TWTA6 of the Huagang Formation (Paleo-temperatures are based on CNOOC, modified after CNOOC).

82
Table 4.8 Temperatures of calcite cements of the Huagang and Pinghu Formations in the Xihu Sag (correlation chart: Figure 4.16) Hg Wells Depth(m) and zone T(℃) Ph Wells Depth(m) and zone T(℃)
C.-S. C.I.T.B.
HY7-3-1 3722.92 (L. Hg) 107.5 C.-S. C.I.T.B.
NB14-3-1 4345.69 (U. Ph) 54,68,
73.5,97.5 HY7-3-1 3723.52 (L. Hg) NB14-3-1 4346.89 (U. Ph) HY2-3-1 3421.52 (U. Hg) 95,
107.5
NB14-3-1 4348.99 (U. Ph) HY2-3-1 3425.8 (U. Hg) NB14-3-1 4349.89 (U. Ph) HY2-3-1 3426.61 (U. Hg)
CHX-TWT
TWTA6 3960.97 (B. P3)
47.5,50, 52.5,56 CHX-TWT
CHX-1 3673.13 (U. Ph) 73.5 TWTA6 3961.93 (B. P3) CHX-2 3050.46 (L. Hg) 68 TWTA6 3962.02 (B. P3) TWT-1 3211.12 (L. Hg) 107.5 TWTA6 3965.28 (B. P3)
W. Sub-sag HY1-1-3S 3963.16 (L. Hg) TWTA6 3970.49 (B. P3) W.S.B and
PB LHT-1 3156.82 (L. Hg) 45.5
W.S.B and PB
NB25-3-2 3238.06 (M. Ph) 56
LHT-1 3631.00 (M. Ph) 95 BYT-2 3777.70 (L. Ph) 97.5 BYT-3 4188.83 (L. Ph) 107.5 WYT-1 3594.24 (U. Ph) 39
Average 86.4 Average 68.8

83
(Table 4.8). The diagenetic stage is also from stage A (the early diagenetic stage) to
stage B (the intermediate diagenetic stage) (Figure 4.19). The timing of precipitation
of calcite cements is estimated from the Late Oligocene to the Late Pliocene periods
(Figure 4.19). The homogenization temperature of fluid inclusions from carbonate
cements or quartz overgrowth ranged from133℃~142℃ (Table 4.7), corresponding
to the Late Pliocene to Quaternary periods (Table 4.9). There were three oil-gas filling
stages for well CHX-1 (Figure 4.19, Table 4.9). The charging of oil and gas
corresponds to fluid inclusion temperatures 133℃~142℃, Ro of 0.8~0.95 and
burial depth of 3000m to 3250m from Mid Miocene to the present.
4.3 Dissolution
Dissolution is the most important factor in the strengthening of secondary
porosities. The dissolution phenomena were quite common in the reservoir within the
Huagang Formation in the Xihu Sag. Based on the thin section observation,
dissolution of primarily aluminosilicate minerals has occurred, with feldspars being
the principal mineral dissolved. Feldspars were often dissolved along the cleavages,
crystalline fractures and edges, and then formed into intra-granular pores or moldic
pores (Figure 4.20 a, b). Some irregular secondary pores from dissolution can also be
seen (Figure 4.20 d). Dissolution is a major diagenetic event which could change
reservoir properties. In addition, the dissolution of aluminosilicate minerals, such as
feldspar, is often accompanied by the precipitation of authigenic kaolinites (Figure
4.20 e, f).
4.3.1 Dissolution agent
It is widely accepted that meteoric water and organic acid are important agents
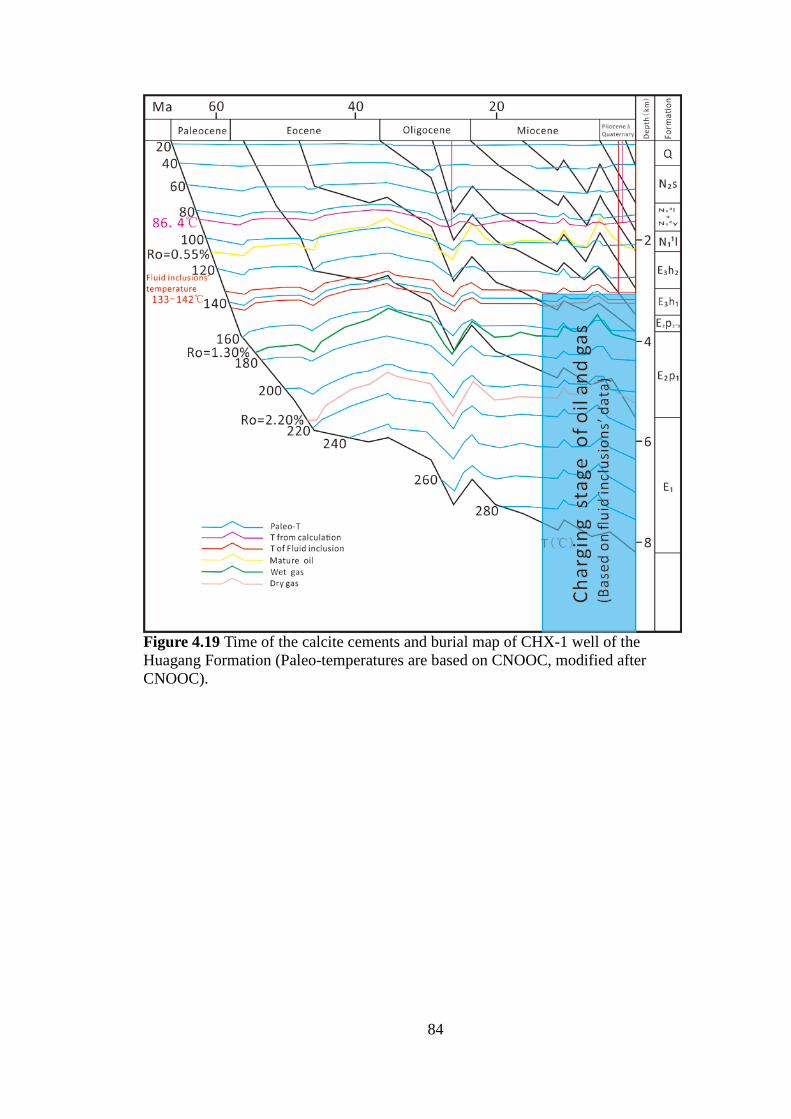
84
Figure 4.19 Time of the calcite cements and burial map of CHX-1 well of the Huagang Formation (Paleo-temperatures are based on CNOOC, modified after CNOOC).
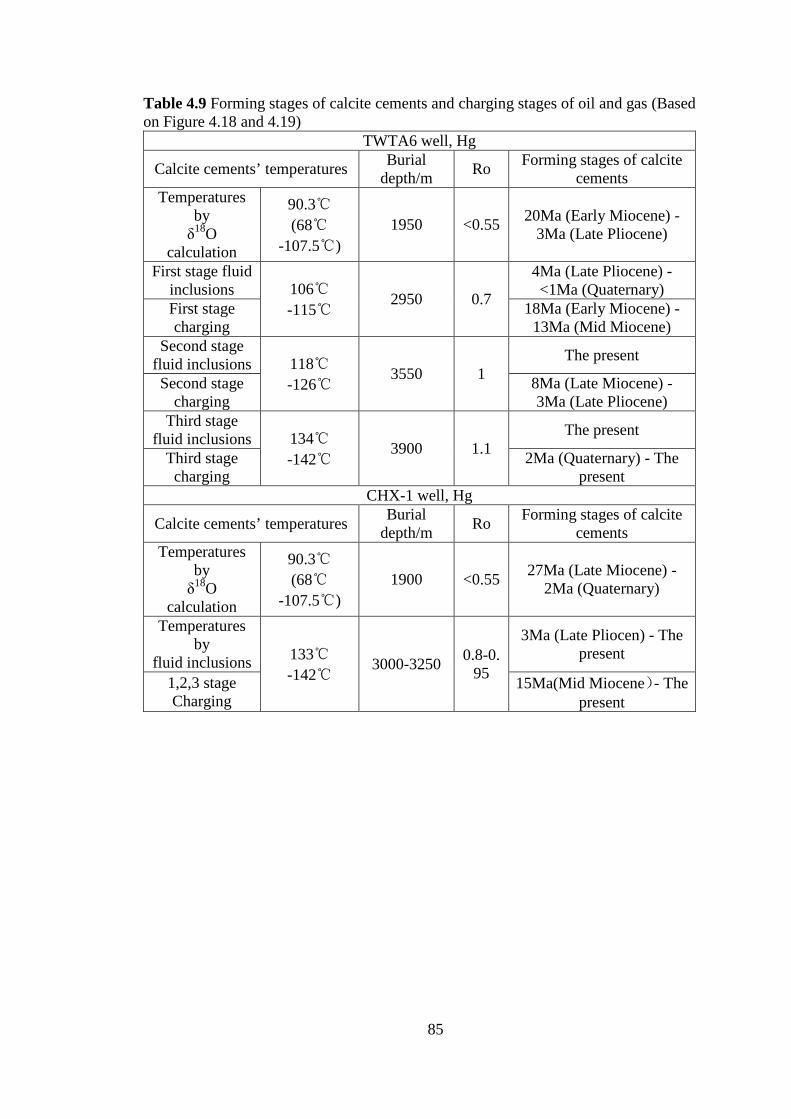
85
Table 4.9 Forming stages of calcite cements and charging stages of oil and gas (Based on Figure 4.18 and 4.19)
TWTA6 well, Hg
Calcite cements’ temperatures Burial depth/m Ro Forming stages of calcite
cements Temperatures
by δ18O
calculation
90.3℃ (68℃
-107.5℃) 1950 <0.55 20Ma (Early Miocene) -
3Ma (Late Pliocene)
First stage fluid inclusions 106℃
-115℃ 2950 0.7
4Ma (Late Pliocene) - <1Ma (Quaternary)
First stage charging
18Ma (Early Miocene) - 13Ma (Mid Miocene)
Second stage fluid inclusions 118℃
-126℃ 3550 1
The present
Second stage charging
8Ma (Late Miocene) - 3Ma (Late Pliocene)
Third stage fluid inclusions 134℃
-142℃ 3900 1.1
The present
Third stage charging
2Ma (Quaternary) - The present
CHX-1 well, Hg
Calcite cements’ temperatures Burial depth/m Ro Forming stages of calcite
cements Temperatures
by δ18O
calculation
90.3℃ (68℃
-107.5℃) 1900 <0.55 27Ma (Late Miocene) -
2Ma (Quaternary)
Temperatures by
fluid inclusions 133℃-142℃
3000-3250 0.8-0.95
3Ma (Late Pliocen) - The present
1,2,3 stage Charging
15Ma(Mid Miocene)- The present
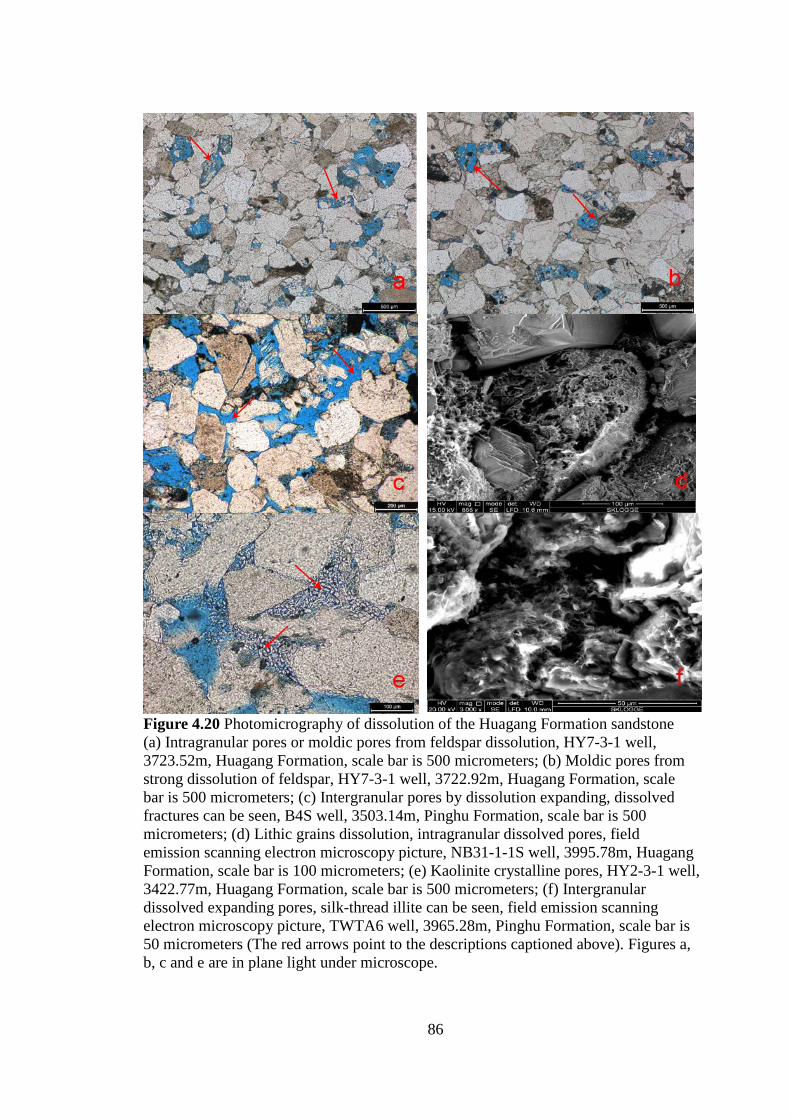
86
Figure 4.20 Photomicrography of dissolution of the Huagang Formation sandstone (a) Intragranular pores or moldic pores from feldspar dissolution, HY7-3-1 well, 3723.52m, Huagang Formation, scale bar is 500 micrometers; (b) Moldic pores from strong dissolution of feldspar, HY7-3-1 well, 3722.92m, Huagang Formation, scale bar is 500 micrometers; (c) Intergranular pores by dissolution expanding, dissolved fractures can be seen, B4S well, 3503.14m, Pinghu Formation, scale bar is 500 micrometers; (d) Lithic grains dissolution, intragranular dissolved pores, field emission scanning electron microscopy picture, NB31-1-1S well, 3995.78m, Huagang Formation, scale bar is 100 micrometers; (e) Kaolinite crystalline pores, HY2-3-1 well, 3422.77m, Huagang Formation, scale bar is 500 micrometers; (f) Intergranular dissolved expanding pores, silk-thread illite can be seen, field emission scanning electron microscopy picture, TWTA6 well, 3965.28m, Pinghu Formation, scale bar is 50 micrometers (The red arrows point to the descriptions captioned above). Figures a, b, c and e are in plane light under microscope.
87
for the development of dissolution porosities.
Meteoric water is one of the fluids generating secondary porosities, where the
dissolution may have happened in the relatively early diagenetic stage and may also
occur in formations that connected to unconformity. In many sedimentary basins,
meteoric water solution is a major process of feldspar dissolution (Bjørlykke and
Angaard, 1992). Meteoric water flow can have a mass transfer effect in the basin,
having a relatively high flow velocity (Giles, 1987).
Reservoir sandstone of the Huagang Formation was under the unconformity
caused by the Huagang movement, the reservoir was exposed to a prolonged stage of
conditions favorable for meteoric water solution (France et al., 2003). Moreover, the
meteoric water solution may have involved a large area, including all the Huagang
formations that experienced this unconformity (Huang et al., 2003).
In deep buried formations, the dissolution by organic acid is another important
process for porosity generation (Surdam et al., 1982; Surdam et al., 1989). In the late
1980s, it is widely believed that organic acids played an important role of forming
secondary porosities for three reasons: (1) During the thermal evolution processes of
organic matter in sedimentary basins, a great deal of organic acid would have been
generated prior to liquid hydrocarbon generation (Surdam et al., 1989); (2) Compared
to carbonic acid, organic acid was more effective in dissolving minerals (Surdam et al.,
1989); (3) The anions from organic acid could complex the cations of aluminosilicate
and then take the cations away (Surdam et al., 1989). The ideal dissolving
temperatures for most carbonate and aluminosilicate minerals range between 80℃
and 120℃ (Surdam et al., 1989), which occurs approximately in the mid-late
diagenetic stages (Figure 4.21).

88
Figure 4.21 Diagenetic sequence and porosity evolution of CHX-TWT structure.
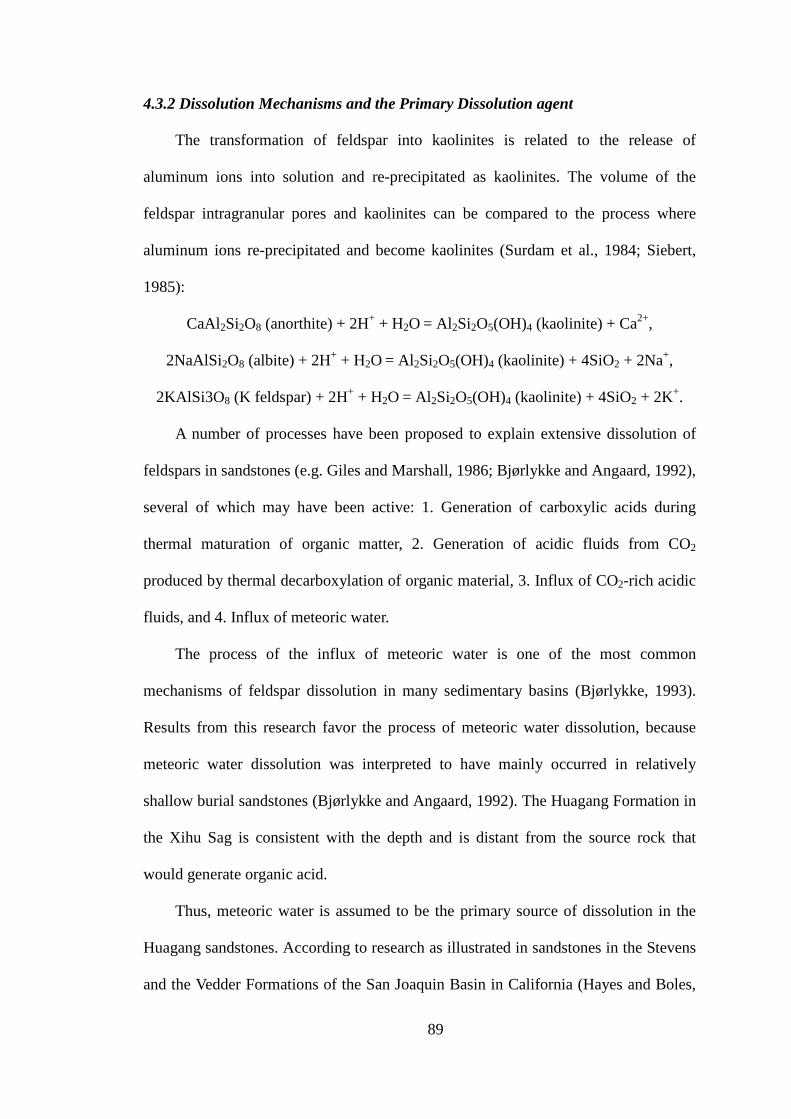
89
4.3.2 Dissolution Mechanisms and the Primary Dissolution agent
The transformation of feldspar into kaolinites is related to the release of
aluminum ions into solution and re-precipitated as kaolinites. The volume of the
feldspar intragranular pores and kaolinites can be compared to the process where
aluminum ions re-precipitated and become kaolinites (Surdam et al., 1984; Siebert,
1985):
CaAl2Si2O8 (anorthite) + 2H+ + H2O = Al2Si2O5(OH)4 (kaolinite) + Ca2+,
2NaAlSi2O8 (albite) + 2H+ + H2O = Al2Si2O5(OH)4 (kaolinite) + 4SiO2 + 2Na+,
2KAlSi3O8 (K feldspar) + 2H+ + H2O = Al2Si2O5(OH)4 (kaolinite) + 4SiO2 + 2K+.
A number of processes have been proposed to explain extensive dissolution of
feldspars in sandstones (e.g. Giles and Marshall, 1986; Bjørlykke and Angaard, 1992),
several of which may have been active: 1. Generation of carboxylic acids during
thermal maturation of organic matter, 2. Generation of acidic fluids from CO2
produced by thermal decarboxylation of organic material, 3. Influx of CO2-rich acidic
fluids, and 4. Influx of meteoric water.
The process of the influx of meteoric water is one of the most common
mechanisms of feldspar dissolution in many sedimentary basins (Bjørlykke, 1993).
Results from this research favor the process of meteoric water dissolution, because
meteoric water dissolution was interpreted to have mainly occurred in relatively
shallow burial sandstones (Bjørlykke and Angaard, 1992). The Huagang Formation in
the Xihu Sag is consistent with the depth and is distant from the source rock that
would generate organic acid.
Thus, meteoric water is assumed to be the primary source of dissolution in the
Huagang sandstones. According to research as illustrated in sandstones in the Stevens
and the Vedder Formations of the San Joaquin Basin in California (Hayes and Boles,
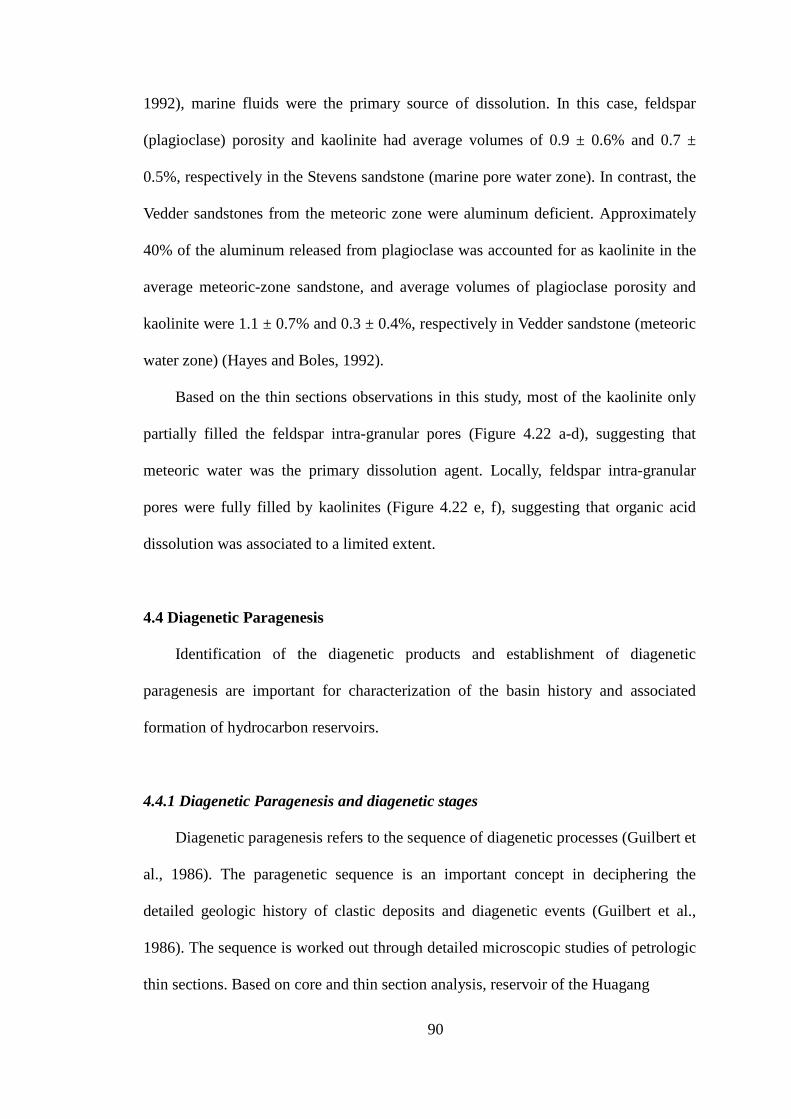
90
1992), marine fluids were the primary source of dissolution. In this case, feldspar
(plagioclase) porosity and kaolinite had average volumes of 0.9 ± 0.6% and 0.7 ±
0.5%, respectively in the Stevens sandstone (marine pore water zone). In contrast, the
Vedder sandstones from the meteoric zone were aluminum deficient. Approximately
40% of the aluminum released from plagioclase was accounted for as kaolinite in the
average meteoric-zone sandstone, and average volumes of plagioclase porosity and
kaolinite were 1.1 ± 0.7% and 0.3 ± 0.4%, respectively in Vedder sandstone (meteoric
water zone) (Hayes and Boles, 1992).
Based on the thin sections observations in this study, most of the kaolinite only
partially filled the feldspar intra-granular pores (Figure 4.22 a-d), suggesting that
meteoric water was the primary dissolution agent. Locally, feldspar intra-granular
pores were fully filled by kaolinites (Figure 4.22 e, f), suggesting that organic acid
dissolution was associated to a limited extent.
4.4 Diagenetic Paragenesis
Identification of the diagenetic products and establishment of diagenetic
paragenesis are important for characterization of the basin history and associated
formation of hydrocarbon reservoirs.
4.4.1 Diagenetic Paragenesis and diagenetic stages
Diagenetic paragenesis refers to the sequence of diagenetic processes (Guilbert et
al., 1986). The paragenetic sequence is an important concept in deciphering the
detailed geologic history of clastic deposits and diagenetic events (Guilbert et al.,
1986). The sequence is worked out through detailed microscopic studies of petrologic
thin sections. Based on core and thin section analysis, reservoir of the Huagang
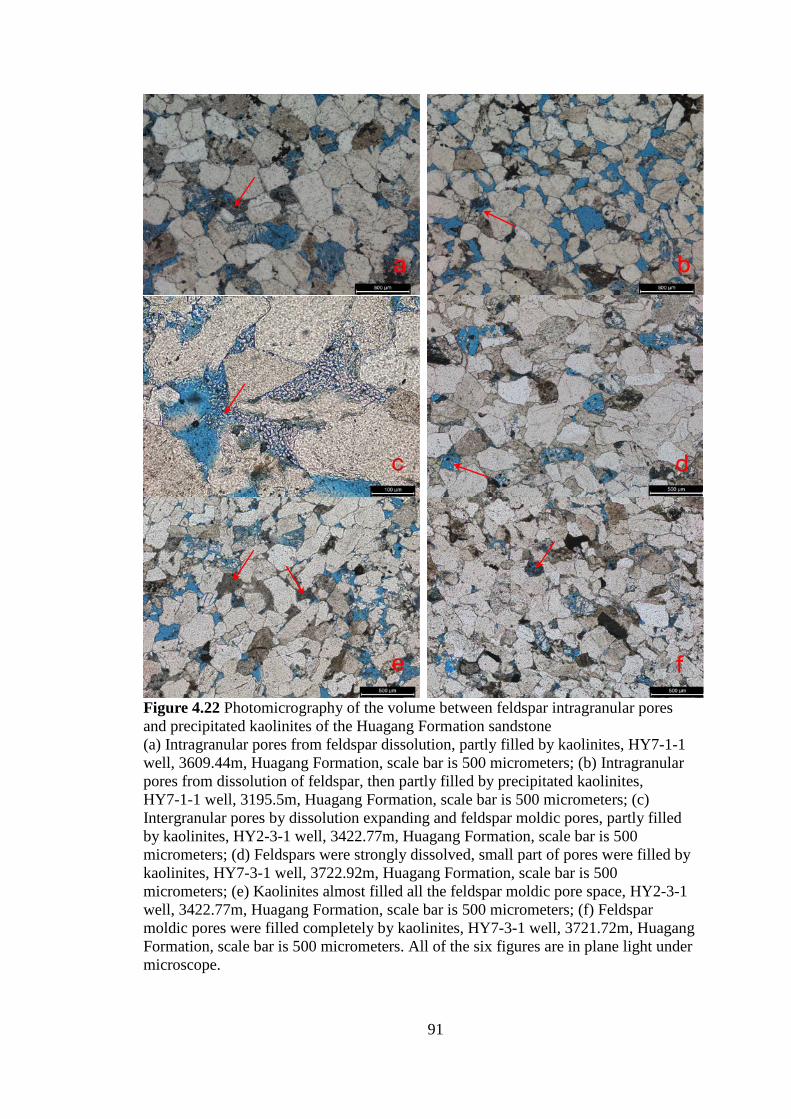
91
Figure 4.22 Photomicrography of the volume between feldspar intragranular pores and precipitated kaolinites of the Huagang Formation sandstone (a) Intragranular pores from feldspar dissolution, partly filled by kaolinites, HY7-1-1 well, 3609.44m, Huagang Formation, scale bar is 500 micrometers; (b) Intragranular pores from dissolution of feldspar, then partly filled by precipitated kaolinites, HY7-1-1 well, 3195.5m, Huagang Formation, scale bar is 500 micrometers; (c) Intergranular pores by dissolution expanding and feldspar moldic pores, partly filled by kaolinites, HY2-3-1 well, 3422.77m, Huagang Formation, scale bar is 500 micrometers; (d) Feldspars were strongly dissolved, small part of pores were filled by kaolinites, HY7-3-1 well, 3722.92m, Huagang Formation, scale bar is 500 micrometers; (e) Kaolinites almost filled all the feldspar moldic pore space, HY2-3-1 well, 3422.77m, Huagang Formation, scale bar is 500 micrometers; (f) Feldspar moldic pores were filled completely by kaolinites, HY7-3-1 well, 3721.72m, Huagang Formation, scale bar is 500 micrometers. All of the six figures are in plane light under microscope.
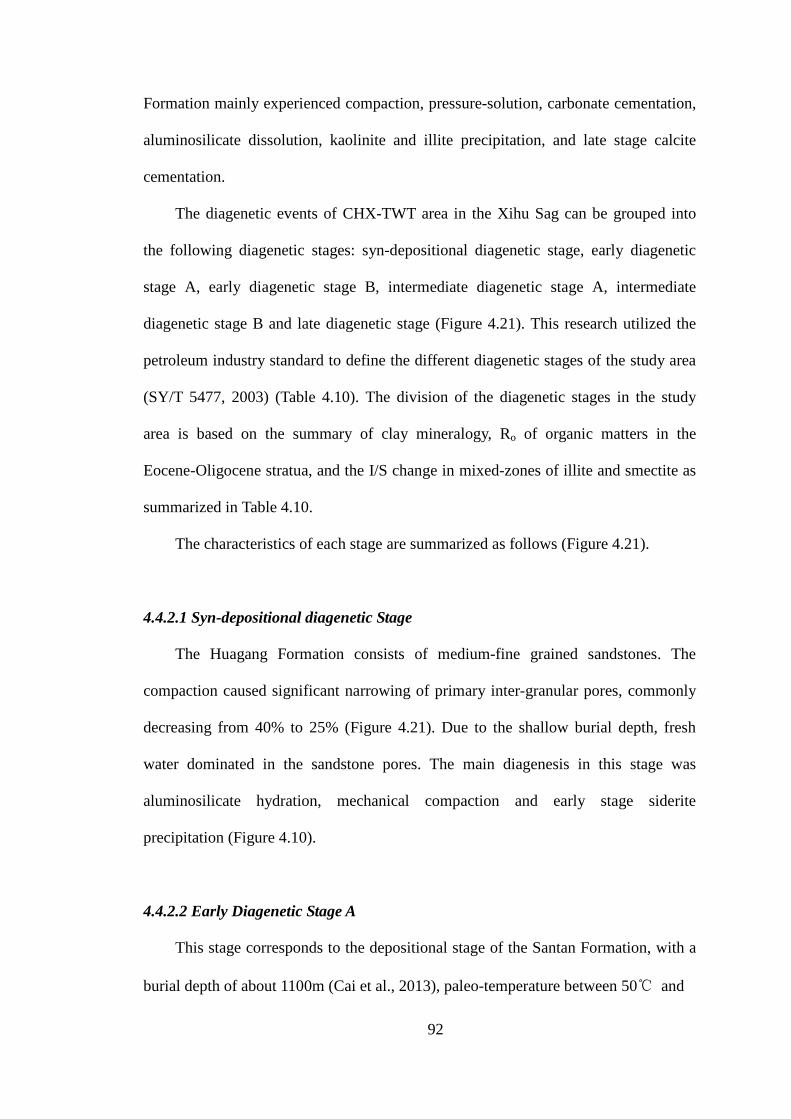
92
Formation mainly experienced compaction, pressure-solution, carbonate cementation,
aluminosilicate dissolution, kaolinite and illite precipitation, and late stage calcite
cementation.
The diagenetic events of CHX-TWT area in the Xihu Sag can be grouped into
the following diagenetic stages: syn-depositional diagenetic stage, early diagenetic
stage A, early diagenetic stage B, intermediate diagenetic stage A, intermediate
diagenetic stage B and late diagenetic stage (Figure 4.21). This research utilized the
petroleum industry standard to define the different diagenetic stages of the study area
(SY/T 5477, 2003) (Table 4.10). The division of the diagenetic stages in the study
area is based on the summary of clay mineralogy, Ro of organic matters in the
Eocene-Oligocene stratua, and the I/S change in mixed-zones of illite and smectite as
summarized in Table 4.10.
The characteristics of each stage are summarized as follows (Figure 4.21).
4.4.2.1 Syn-depositional diagenetic Stage
The Huagang Formation consists of medium-fine grained sandstones. The
compaction caused significant narrowing of primary inter-granular pores, commonly
decreasing from 40% to 25% (Figure 4.21). Due to the shallow burial depth, fresh
water dominated in the sandstone pores. The main diagenesis in this stage was
aluminosilicate hydration, mechanical compaction and early stage siderite
precipitation (Figure 4.10).
4.4.2.2 Early Diagenetic Stage A
This stage corresponds to the depositional stage of the Santan Formation, with a
burial depth of about 1100m (Cai et al., 2013), paleo-temperature between 50℃ and
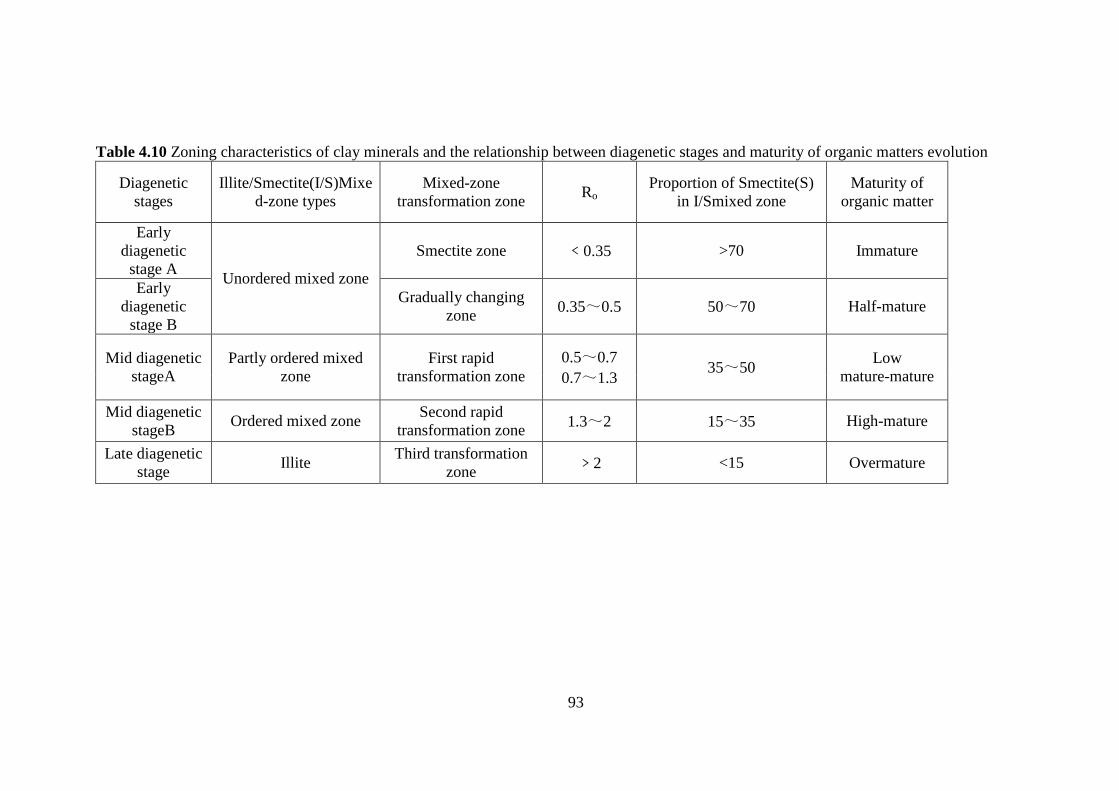
93
Table 4.10 Zoning characteristics of clay minerals and the relationship between diagenetic stages and maturity of organic matters evolution
Diagenetic stages
Illite/Smectite(I/S)Mixed-zone types
Mixed-zone transformation zone Ro
Proportion of Smectite(S) in I/Smixed zone
Maturity of organic matter
Early diagenetic
stage A Unordered mixed zone
Smectite zone ﹤0.35 >70 Immature
Early diagenetic
stage B
Gradually changing zone 0.35~0.5 50~70 Half-mature
Mid diagenetic stageA
Partly ordered mixed zone
First rapid transformation zone
0.5~0.7 0.7~1.3 35~50 Low
mature-mature
Mid diagenetic stageB Ordered mixed zone Second rapid
transformation zone 1.3~2 15~35 High-mature
Late diagenetic stage Illite Third transformation
zone ﹥2 <15 Overmature
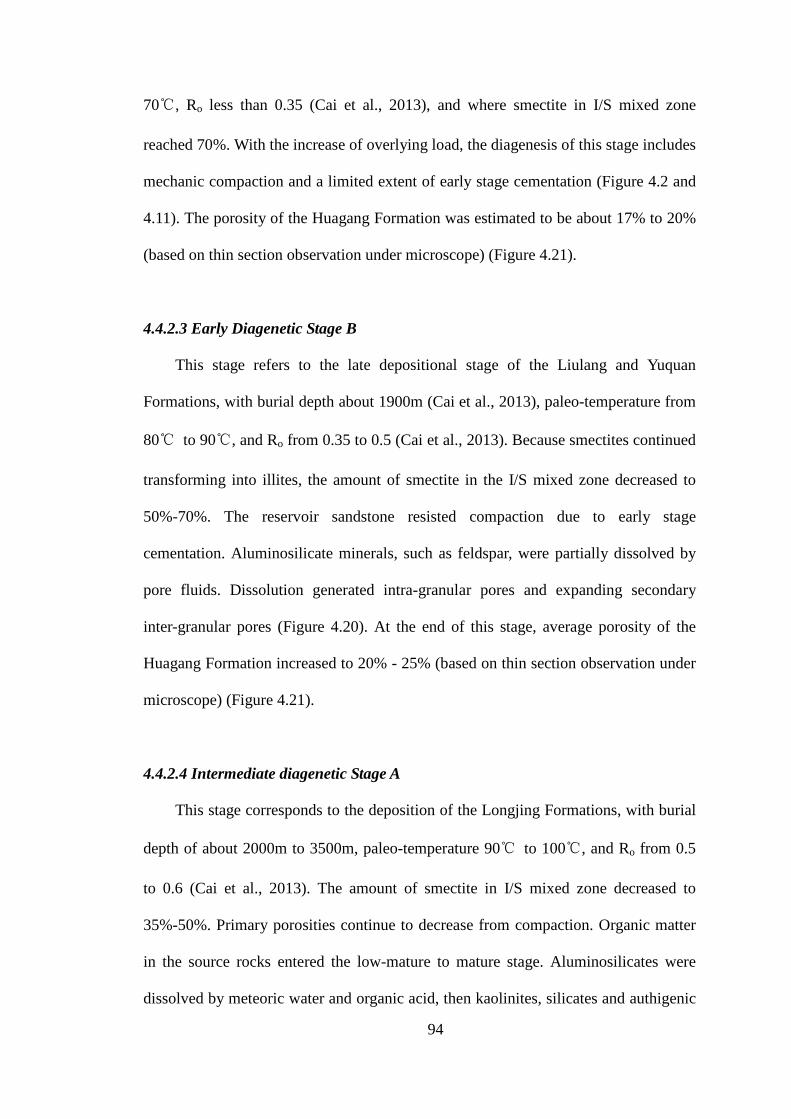
94
70℃, Ro less than 0.35 (Cai et al., 2013), and where smectite in I/S mixed zone
reached 70%. With the increase of overlying load, the diagenesis of this stage includes
mechanic compaction and a limited extent of early stage cementation (Figure 4.2 and
4.11). The porosity of the Huagang Formation was estimated to be about 17% to 20%
(based on thin section observation under microscope) (Figure 4.21).
4.4.2.3 Early Diagenetic Stage B
This stage refers to the late depositional stage of the Liulang and Yuquan
Formations, with burial depth about 1900m (Cai et al., 2013), paleo-temperature from
80℃ to 90℃, and Ro from 0.35 to 0.5 (Cai et al., 2013). Because smectites continued
transforming into illites, the amount of smectite in the I/S mixed zone decreased to
50%-70%. The reservoir sandstone resisted compaction due to early stage
cementation. Aluminosilicate minerals, such as feldspar, were partially dissolved by
pore fluids. Dissolution generated intra-granular pores and expanding secondary
inter-granular pores (Figure 4.20). At the end of this stage, average porosity of the
Huagang Formation increased to 20% - 25% (based on thin section observation under
microscope) (Figure 4.21).
4.4.2.4 Intermediate diagenetic Stage A
This stage corresponds to the deposition of the Longjing Formations, with burial
depth of about 2000m to 3500m, paleo-temperature 90℃ to 100℃, and Ro from 0.5
to 0.6 (Cai et al., 2013). The amount of smectite in I/S mixed zone decreased to
35%-50%. Primary porosities continue to decrease from compaction. Organic matter
in the source rocks entered the low-mature to mature stage. Aluminosilicates were
dissolved by meteoric water and organic acid, then kaolinites, silicates and authigenic
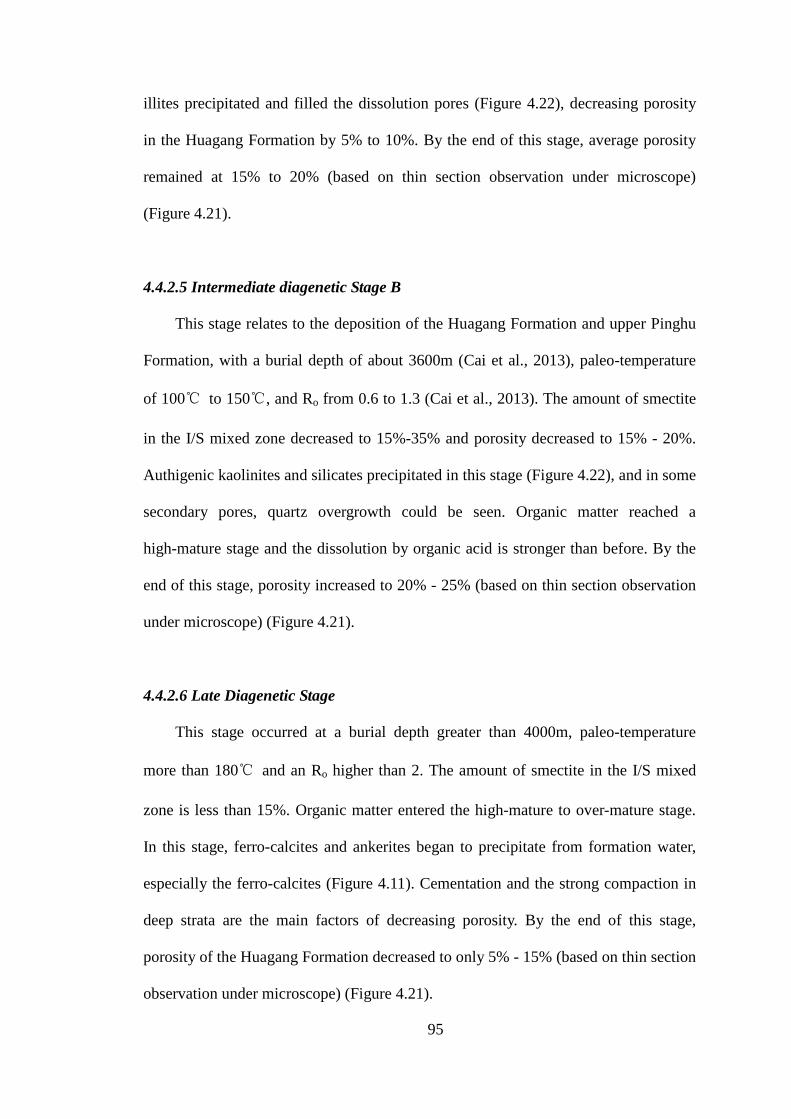
95
illites precipitated and filled the dissolution pores (Figure 4.22), decreasing porosity
in the Huagang Formation by 5% to 10%. By the end of this stage, average porosity
remained at 15% to 20% (based on thin section observation under microscope)
(Figure 4.21).
4.4.2.5 Intermediate diagenetic Stage B
This stage relates to the deposition of the Huagang Formation and upper Pinghu
Formation, with a burial depth of about 3600m (Cai et al., 2013), paleo-temperature
of 100℃ to 150℃, and Ro from 0.6 to 1.3 (Cai et al., 2013). The amount of smectite
in the I/S mixed zone decreased to 15%-35% and porosity decreased to 15% - 20%.
Authigenic kaolinites and silicates precipitated in this stage (Figure 4.22), and in some
secondary pores, quartz overgrowth could be seen. Organic matter reached a
high-mature stage and the dissolution by organic acid is stronger than before. By the
end of this stage, porosity increased to 20% - 25% (based on thin section observation
under microscope) (Figure 4.21).
4.4.2.6 Late Diagenetic Stage
This stage occurred at a burial depth greater than 4000m, paleo-temperature
more than 180℃ and an Ro higher than 2. The amount of smectite in the I/S mixed
zone is less than 15%. Organic matter entered the high-mature to over-mature stage.
In this stage, ferro-calcites and ankerites began to precipitate from formation water,
especially the ferro-calcites (Figure 4.11). Cementation and the strong compaction in
deep strata are the main factors of decreasing porosity. By the end of this stage,
porosity of the Huagang Formation decreased to only 5% - 15% (based on thin section
observation under microscope) (Figure 4.21).
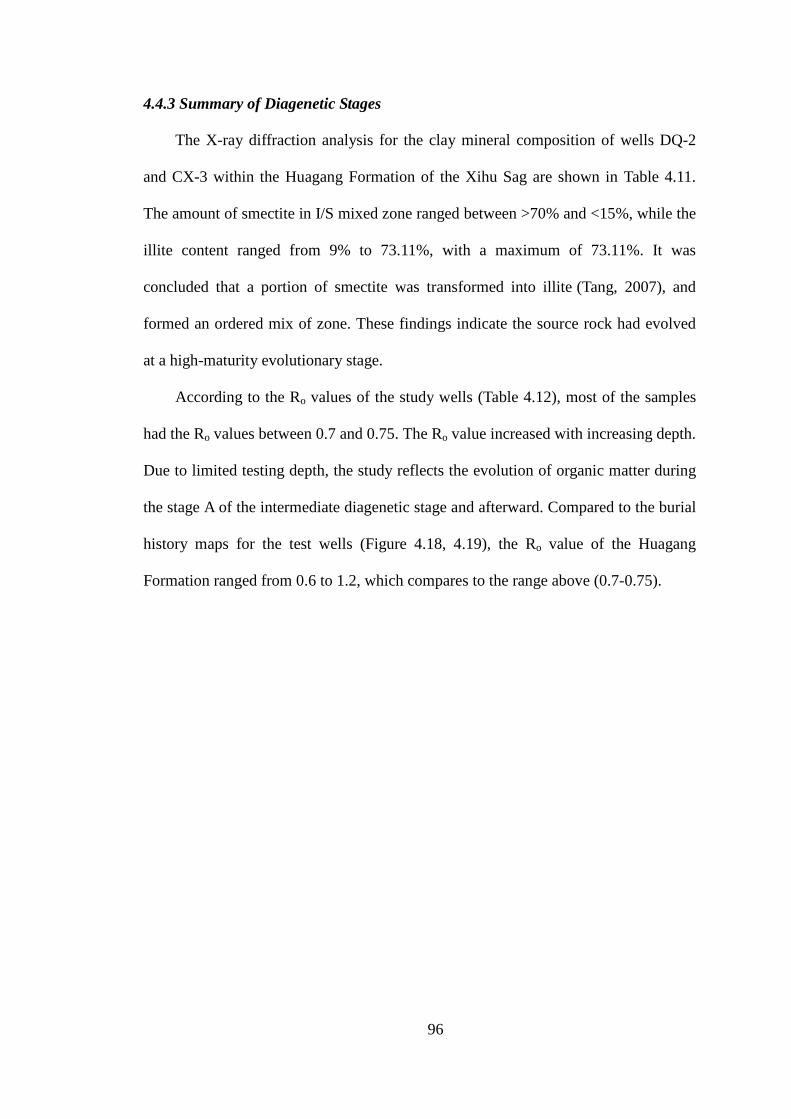
96
4.4.3 Summary of Diagenetic Stages
The X-ray diffraction analysis for the clay mineral composition of wells DQ-2
and CX-3 within the Huagang Formation of the Xihu Sag are shown in Table 4.11.
The amount of smectite in I/S mixed zone ranged between >70% and <15%, while the
illite content ranged from 9% to 73.11%, with a maximum of 73.11%. It was
concluded that a portion of smectite was transformed into illite (Tang, 2007), and
formed an ordered mix of zone. These findings indicate the source rock had evolved
at a high-maturity evolutionary stage.
According to the Ro values of the study wells (Table 4.12), most of the samples
had the Ro values between 0.7 and 0.75. The Ro value increased with increasing depth.
Due to limited testing depth, the study reflects the evolution of organic matter during
the stage A of the intermediate diagenetic stage and afterward. Compared to the burial
history maps for the test wells (Figure 4.18, 4.19), the Ro value of the Huagang
Formation ranged from 0.6 to 1.2, which compares to the range above (0.7-0.75).
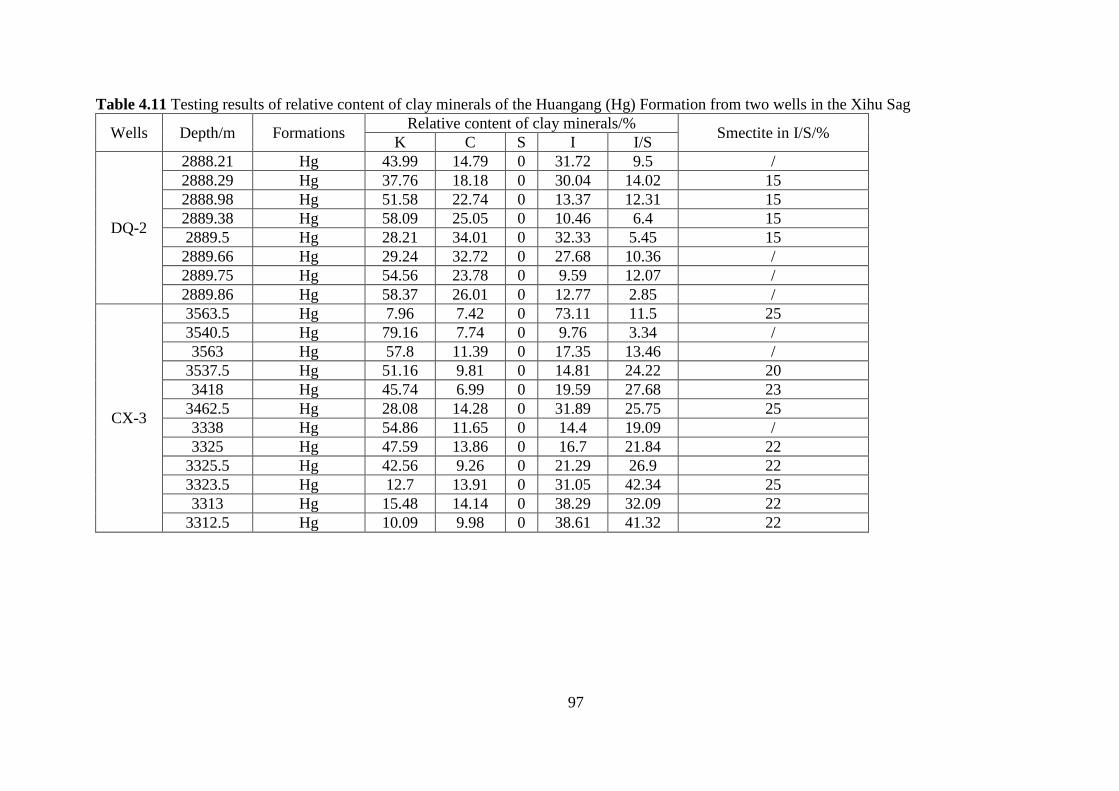
97
Table 4.11 Testing results of relative content of clay minerals of the Huangang (Hg) Formation from two wells in the Xihu Sag
Wells Depth/m Formations Relative content of clay minerals/% Smectite in I/S/% K C S I I/S
DQ-2
2888.21 Hg 43.99 14.79 0 31.72 9.5 / 2888.29 Hg 37.76 18.18 0 30.04 14.02 15 2888.98 Hg 51.58 22.74 0 13.37 12.31 15 2889.38 Hg 58.09 25.05 0 10.46 6.4 15 2889.5 Hg 28.21 34.01 0 32.33 5.45 15 2889.66 Hg 29.24 32.72 0 27.68 10.36 / 2889.75 Hg 54.56 23.78 0 9.59 12.07 / 2889.86 Hg 58.37 26.01 0 12.77 2.85 /
CX-3
3563.5 Hg 7.96 7.42 0 73.11 11.5 25 3540.5 Hg 79.16 7.74 0 9.76 3.34 / 3563 Hg 57.8 11.39 0 17.35 13.46 /
3537.5 Hg 51.16 9.81 0 14.81 24.22 20 3418 Hg 45.74 6.99 0 19.59 27.68 23
3462.5 Hg 28.08 14.28 0 31.89 25.75 25 3338 Hg 54.86 11.65 0 14.4 19.09 / 3325 Hg 47.59 13.86 0 16.7 21.84 22
3325.5 Hg 42.56 9.26 0 21.29 26.9 22 3323.5 Hg 12.7 13.91 0 31.05 42.34 25 3313 Hg 15.48 14.14 0 38.29 32.09 22
3312.5 Hg 10.09 9.98 0 38.61 41.32 22

98
Table 4.12 Testing results of Ro values of four wells in the Xihu Sag Wells Depth/m Formations Average Ro Ro, max Test-points
HY7-3-1 3322~3330 H 0.766 0.815 20 NB25-3-1 3040~3640 P 0.7 0.78 7-20
PH-11 2927~3873.68 H6、P8 0.75 0.84 5-22 LHT-1 2922~4176 Lo.H-P1-4 0.7 0.81 20-63

99
CHAPTER FIVE
PETROPHYSICAL PROPERTIES OF THE HUAGANG TIGHT RESERVOIR
5.1 Types and Characteristics of Reservoir Space
Classification of porosity from the samples collected from the Huangang
Formation is studied based on thin sections as listed in Table 5.1. The statistical
results show that the main reservoir space within the sandstone lithofacies primarily
consists of primary porosity, secondary porosity and micro-fractures. The main pore
space types in these clastic rocks are pores, cavities and fractures (Table 5.2).
Most of the pore spaces of the Huagang Formation in the Xihu Sag are secondary
porosities consisting of inter-granular, intra-granular and moldic pores (Table 5.3)
with post-depositional diagenetic dissolution as the main factor that influence the
reservoir quality. The Xihu Sag, except in the Western sub-sag and Yuquan areas, has
relatively well-developed primary porosity that is controlled by the sedimentary facies
(Hu et al., 2011) and compaction extent.
5.1.1 Primary Porosities
In siliciclastic sediments, primary porosity refers to the pores present i between
the original framework grains at the time of deposition. Those pores were often
expanded by diagenesis and transformed into inter-granular dissolution pores (Zhang
et al., 2012). This reservoir sandstone of the Huangang Formation demonstrated a
small number of well-preserved primary pores (Figure 5.1 a, b). However, most of the
primary pores were triangularly-shaped, polygonal-shaped, bar-shaped or
fracture-shaped (Figure 5.1 c, d). Some of them were filled or partly filled by
authigenic minerals (Figure 5.1 e, f).

100
Figure 5.1 Photomicrography of primary porosity and its associated characteristics of the Huagang Formation sandstone (a) Well-preserved primary porosities in Huagang Formation, HY7-1-1 well, 3195.5m, Huagang Formation, scale bar is 500 micrometers; (b) Point contact among particles, primary porosities which preserved relatively well, YQ-2 well, 3835.14m, Huagang Formation, scale bar is 500 micrometers; (c) Primary pore deformation, dominated by intergranular pores, NB25-2-1 well, 4203.57m, Pinghu Formation, scale bar is 500 micrometers; (d) Primary pore deformation, intergranular dissolution pores can be seen, NB31-1-1S well, 3988.28m, Huagang Formation, scale bar is 500 micrometers; (e) Primary pore were filled by authigenic kaolinites, HY2-3-1 well, 3423.9m, Huagang Formation, scale bar is 500 micrometers; (f) Locally zoomed in picture of picture (e), the diameter of the pore in the center is 700 micrometers. All of the six figures are in plane light under microscope.

101
Table 5.1 Summary of porosity (%) in different zone of the Huagang Formation sandstone in the Xihu Sag (Based on casting thin sections observation)
Formation Total
primary pore (%)
Total secondary pore (%)
Total micro-fracture
(%)
Surface porosity
(%)
Primary pore ratio
(%)
Secondary pore ratio
(%)
Micro-fracture ratio
(%) Samples
H1 2.75 23.20 0.00 25.95 10.60 89.40 0.00 2 H2 3.67 4.33 0.00 8.00 45.83 54.17 0.00 3 H3 5.04 8.44 0.01 13.49 37.38 62.56 0.06 24 H4 1.50 8.42 0.00 9.92 15.12 84.88 0.00 13 H5 1.19 5.83 0.00 7.02 16.96 83.04 0.00 31 H6 2.35 9.77 0.10 12.22 19.21 79.97 0.82 85 H7 2.20 6.96 0.00 9.16 24.02 75.98 0.00 5 H8 0.98 8.90 0.13 10.01 9.77 88.93 1.30 23 H9 1.21 8.61 0.02 9.83 12.29 87.54 0.17 12 H10 1.00 6.61 0.67 8.28 12.08 79.87 8.05 9 H11 1.00 2.95 0.00 3.95 25.32 74.68 0.00 2 H12 1.23 8.02 0.07 9.32 13.21 86.04 0.74 13
upper Hg 2.49 8.07 0.02 10.58 23.50 76.29 0.21 78 lower Hg 1.84 8.94 0.13 10.90 16.85 82.00 1.15 163 Total Hg 2.05 8.66 0.09 10.80 18.96 80.19 0.85 241
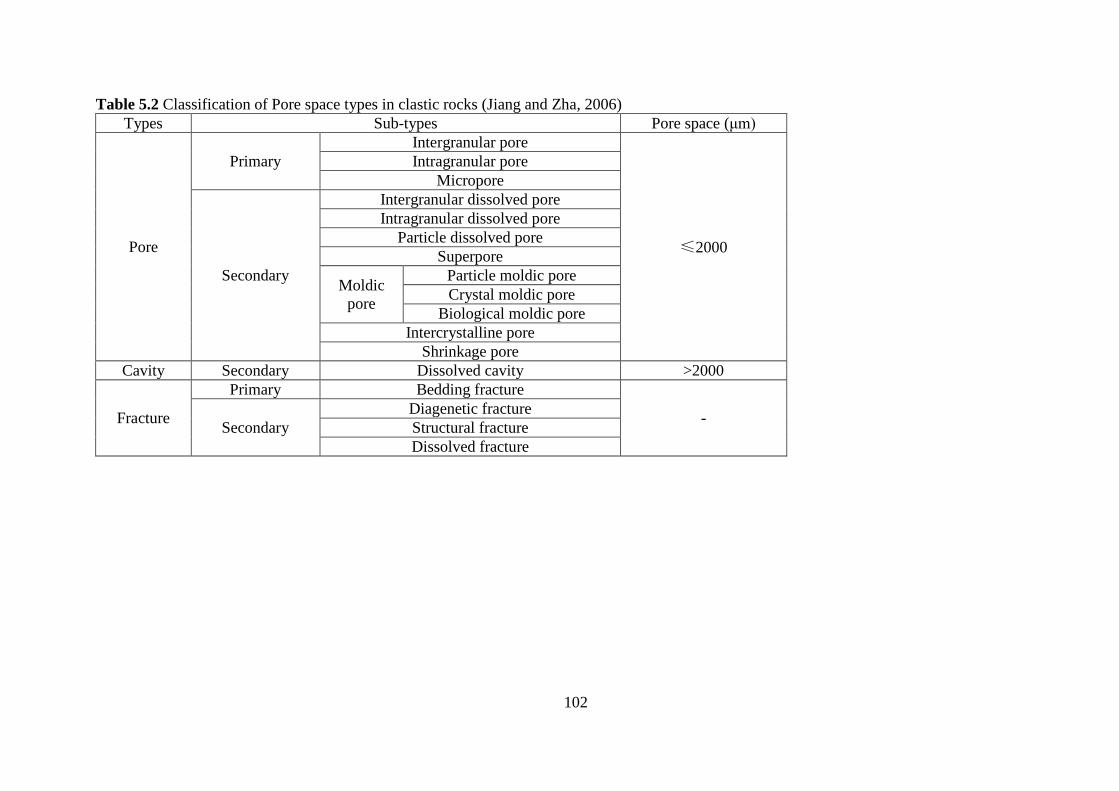
102
Table 5.2 Classification of Pore space types in clastic rocks (Jiang and Zha, 2006) Types Sub-types Pore space (μm)
Pore
Primary Intergranular pore
≤2000
Intragranular pore Micropore
Secondary
Intergranular dissolved pore Intragranular dissolved pore
Particle dissolved pore Superpore
Moldic pore
Particle moldic pore Crystal moldic pore
Biological moldic pore Intercrystalline pore
Shrinkage pore Cavity Secondary Dissolved cavity >2000
Fracture
Primary Bedding fracture
- Secondary Diagenetic fracture Structural fracture Dissolved fracture
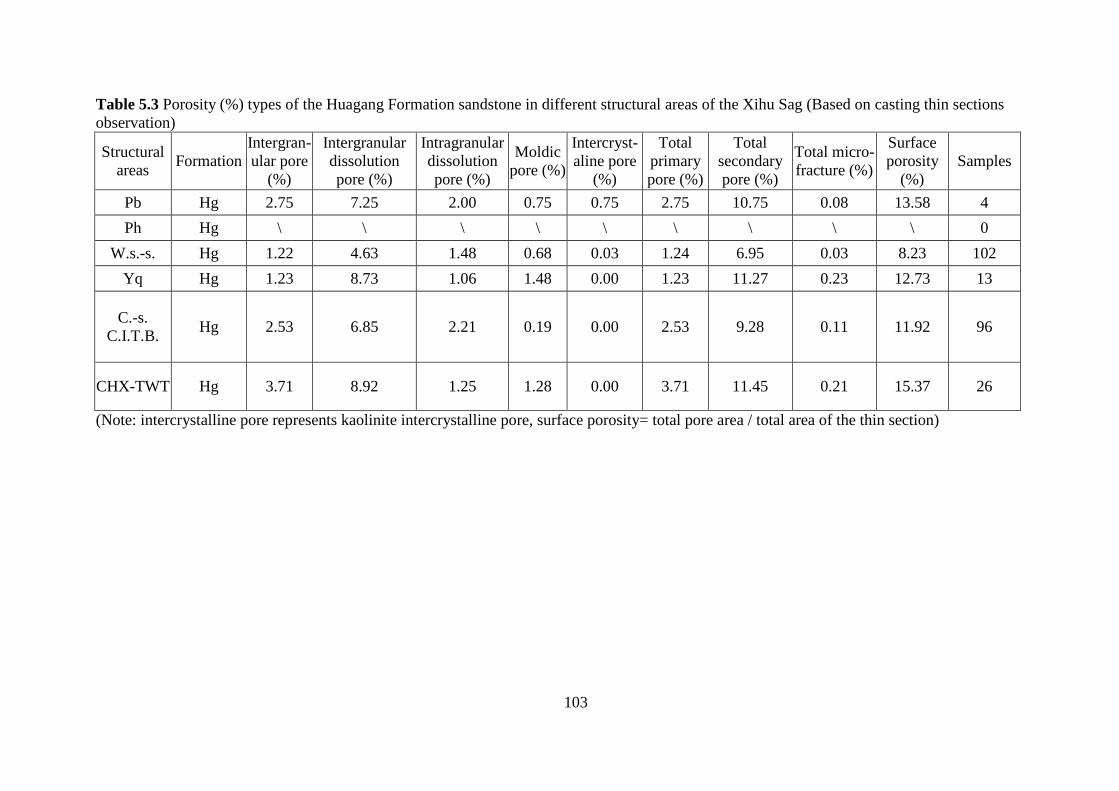
103
Table 5.3 Porosity (%) types of the Huagang Formation sandstone in different structural areas of the Xihu Sag (Based on casting thin sections observation)
Structural areas Formation
Intergran-ular pore
(%)
Intergranular dissolution pore (%)
Intragranular dissolution pore (%)
Moldic pore (%)
Intercryst-aline pore
(%)
Total primary pore (%)
Total secondary pore (%)
Total micro- fracture (%)
Surface porosity
(%) Samples
Pb Hg 2.75 7.25 2.00 0.75 0.75 2.75 10.75 0.08 13.58 4 Ph Hg \ \ \ \ \ \ \ \ \ 0
W.s.-s. Hg 1.22 4.63 1.48 0.68 0.03 1.24 6.95 0.03 8.23 102 Yq Hg 1.23 8.73 1.06 1.48 0.00 1.23 11.27 0.23 12.73 13
C.-s. C.I.T.B. Hg 2.53 6.85 2.21 0.19 0.00 2.53 9.28 0.11 11.92 96
CHX-TWT Hg 3.71 8.92 1.25 1.28 0.00 3.71 11.45 0.21 15.37 26
(Note: intercrystalline pore represents kaolinite intercrystalline pore, surface porosity= total pore area / total area of the thin section)
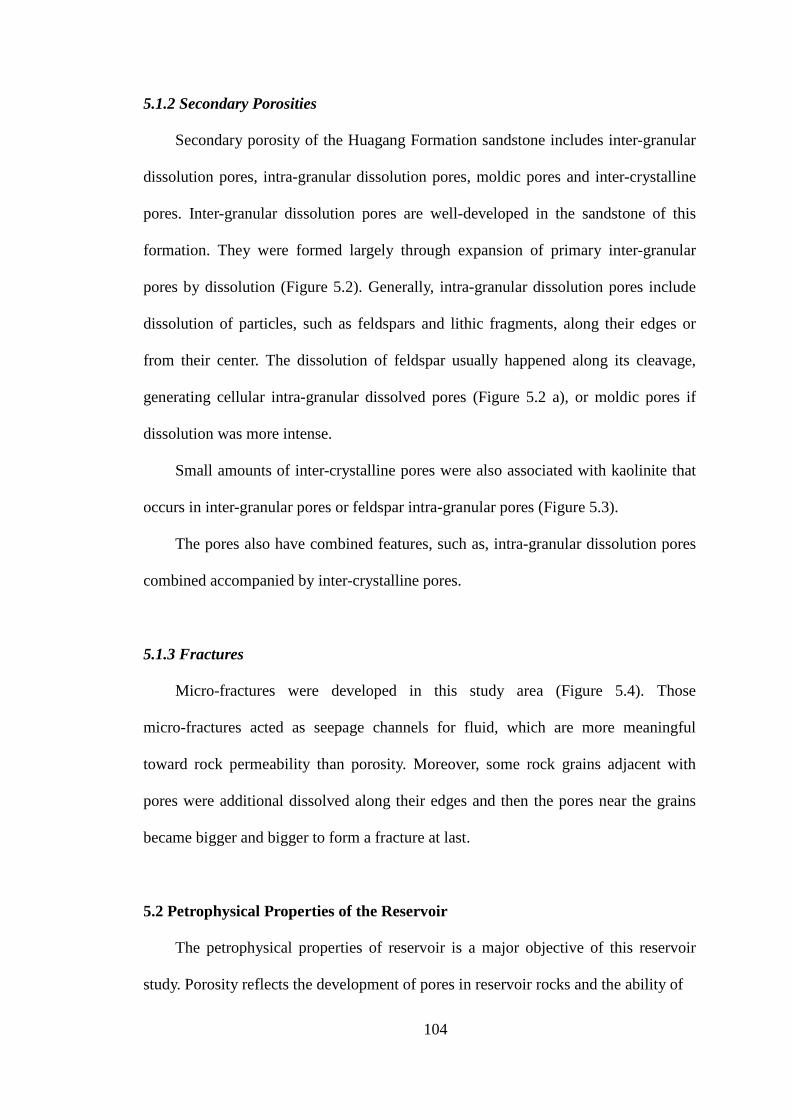
104
5.1.2 Secondary Porosities
Secondary porosity of the Huagang Formation sandstone includes inter-granular
dissolution pores, intra-granular dissolution pores, moldic pores and inter-crystalline
pores. Inter-granular dissolution pores are well-developed in the sandstone of this
formation. They were formed largely through expansion of primary inter-granular
pores by dissolution (Figure 5.2). Generally, intra-granular dissolution pores include
dissolution of particles, such as feldspars and lithic fragments, along their edges or
from their center. The dissolution of feldspar usually happened along its cleavage,
generating cellular intra-granular dissolved pores (Figure 5.2 a), or moldic pores if
dissolution was more intense.
Small amounts of inter-crystalline pores were also associated with kaolinite that
occurs in inter-granular pores or feldspar intra-granular pores (Figure 5.3).
The pores also have combined features, such as, intra-granular dissolution pores
combined accompanied by inter-crystalline pores.
5.1.3 Fractures
Micro-fractures were developed in this study area (Figure 5.4). Those
micro-fractures acted as seepage channels for fluid, which are more meaningful
toward rock permeability than porosity. Moreover, some rock grains adjacent with
pores were additional dissolved along their edges and then the pores near the grains
became bigger and bigger to form a fracture at last.
5.2 Petrophysical Properties of the Reservoir
The petrophysical properties of reservoir is a major objective of this reservoir
study. Porosity reflects the development of pores in reservoir rocks and the ability of
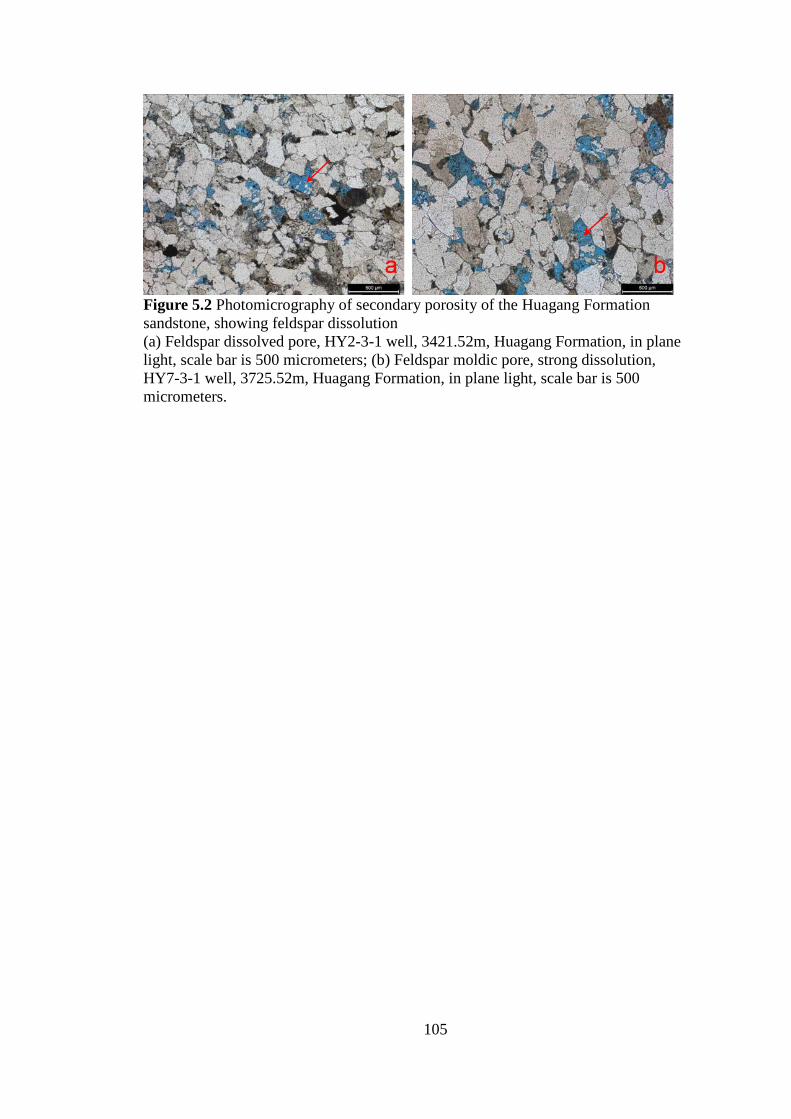
105
Figure 5.2 Photomicrography of secondary porosity of the Huagang Formation sandstone, showing feldspar dissolution (a) Feldspar dissolved pore, HY2-3-1 well, 3421.52m, Huagang Formation, in plane light, scale bar is 500 micrometers; (b) Feldspar moldic pore, strong dissolution, HY7-3-1 well, 3725.52m, Huagang Formation, in plane light, scale bar is 500 micrometers.
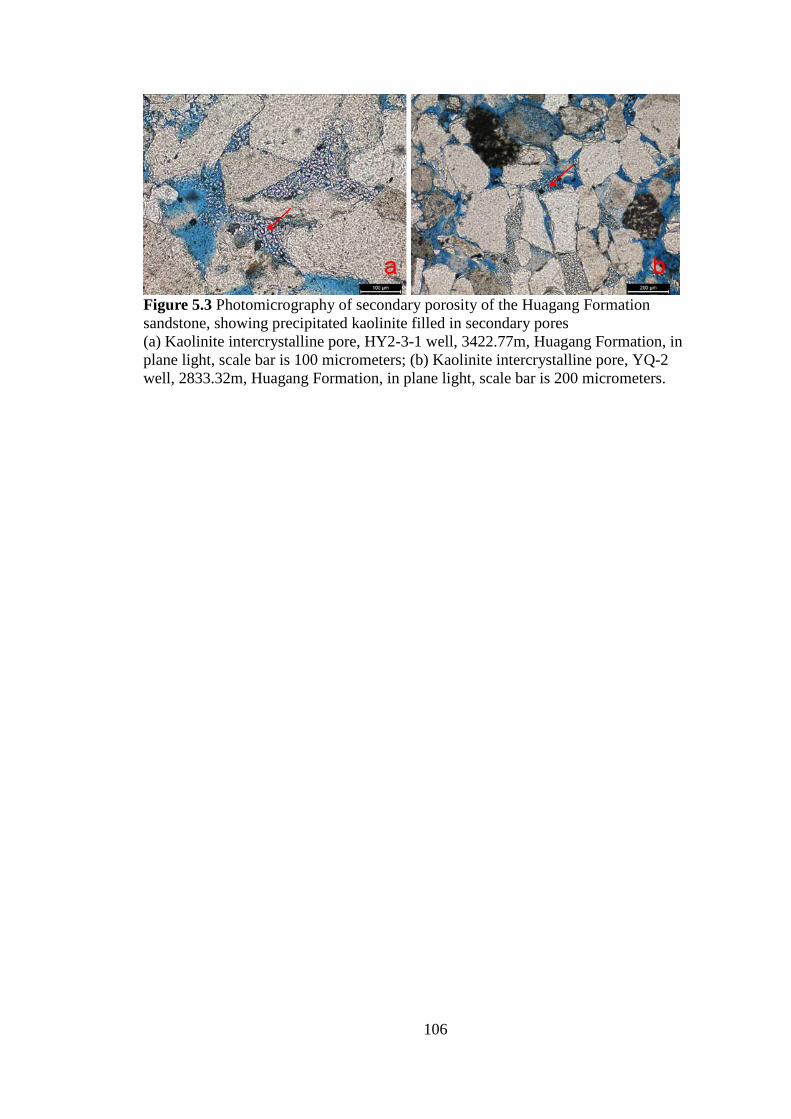
106
Figure 5.3 Photomicrography of secondary porosity of the Huagang Formation sandstone, showing precipitated kaolinite filled in secondary pores (a) Kaolinite intercrystalline pore, HY2-3-1 well, 3422.77m, Huagang Formation, in plane light, scale bar is 100 micrometers; (b) Kaolinite intercrystalline pore, YQ-2 well, 2833.32m, Huagang Formation, in plane light, scale bar is 200 micrometers.
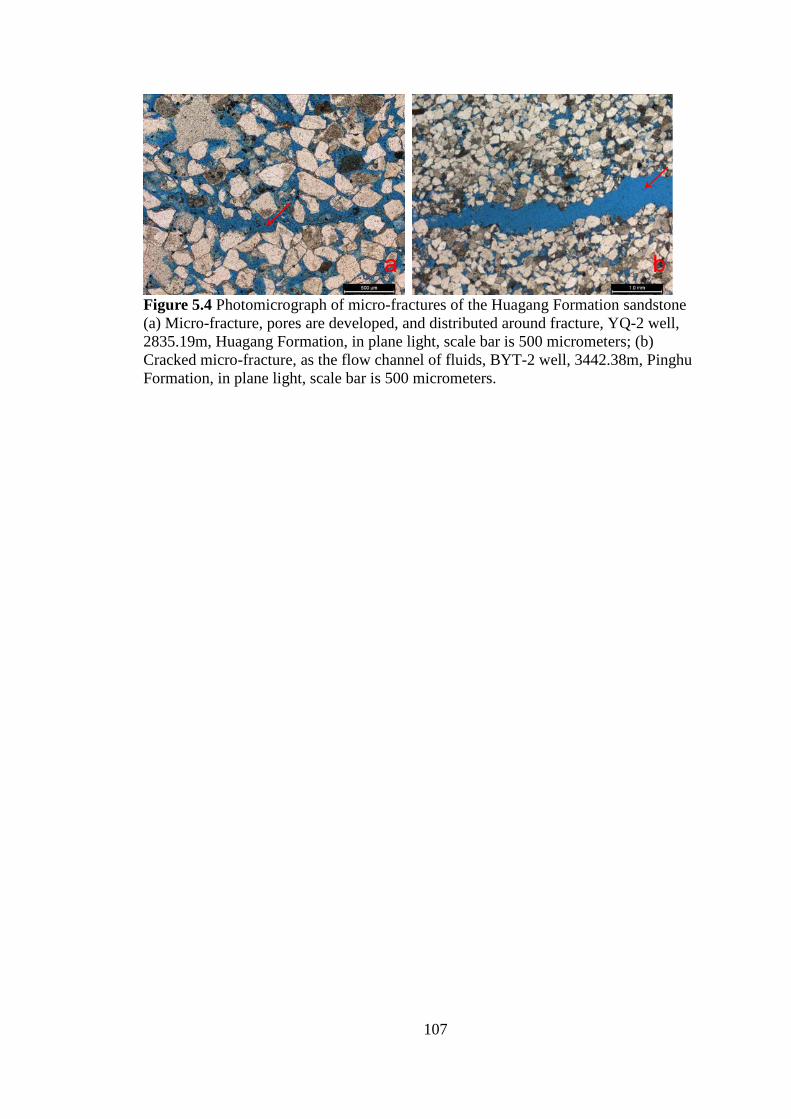
107
Figure 5.4 Photomicrograph of micro-fractures of the Huagang Formation sandstone (a) Micro-fracture, pores are developed, and distributed around fracture, YQ-2 well, 2835.19m, Huagang Formation, in plane light, scale bar is 500 micrometers; (b) Cracked micro-fracture, as the flow channel of fluids, BYT-2 well, 3442.38m, Pinghu Formation, in plane light, scale bar is 500 micrometers.
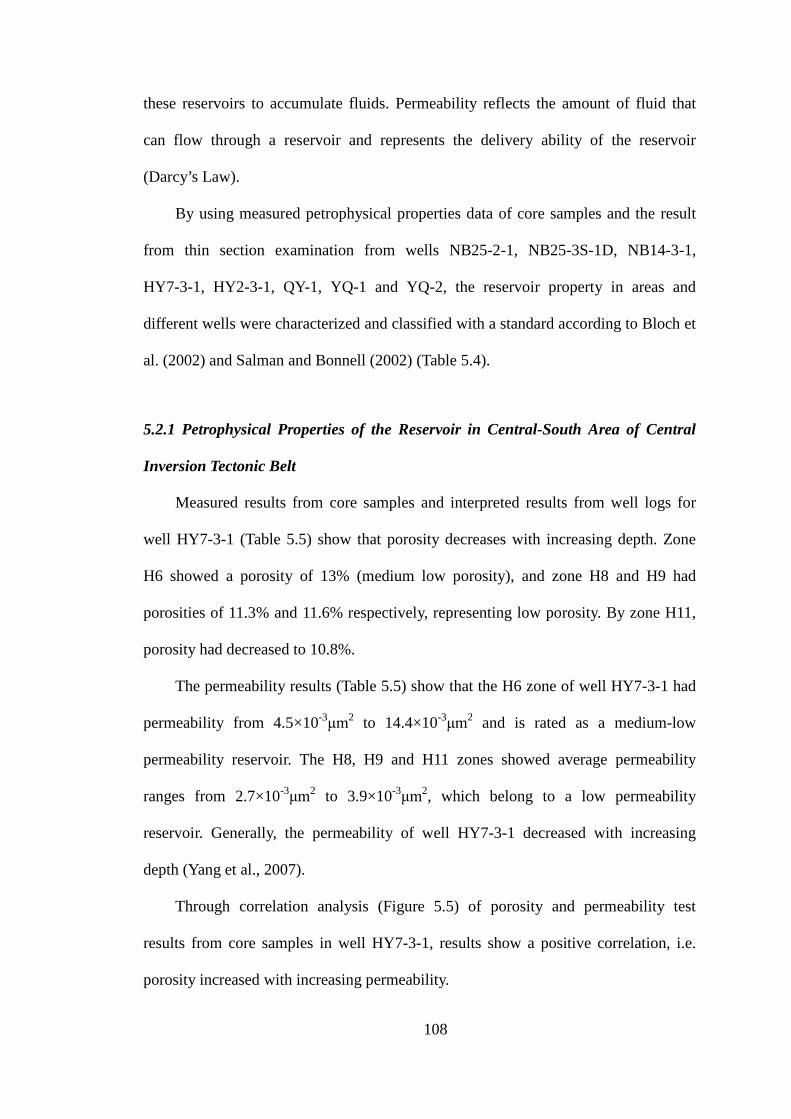
108
these reservoirs to accumulate fluids. Permeability reflects the amount of fluid that
can flow through a reservoir and represents the delivery ability of the reservoir
(Darcy’s Law).
By using measured petrophysical properties data of core samples and the result
from thin section examination from wells NB25-2-1, NB25-3S-1D, NB14-3-1,
HY7-3-1, HY2-3-1, QY-1, YQ-1 and YQ-2, the reservoir property in areas and
different wells were characterized and classified with a standard according to Bloch et
al. (2002) and Salman and Bonnell (2002) (Table 5.4).
5.2.1 Petrophysical Properties of the Reservoir in Central-South Area of Central
Inversion Tectonic Belt
Measured results from core samples and interpreted results from well logs for
well HY7-3-1 (Table 5.5) show that porosity decreases with increasing depth. Zone
H6 showed a porosity of 13% (medium low porosity), and zone H8 and H9 had
porosities of 11.3% and 11.6% respectively, representing low porosity. By zone H11,
porosity had decreased to 10.8%.
The permeability results (Table 5.5) show that the H6 zone of well HY7-3-1 had
permeability from 4.5×10⁻³μm2 to 14.4×10⁻³μm2 and is rated as a medium-low
permeability reservoir. The H8, H9 and H11 zones showed average permeability
ranges from 2.7×10⁻³μm2 to 3.9×10⁻³μm2, which belong to a low permeability
reservoir. Generally, the permeability of well HY7-3-1 decreased with increasing
depth (Yang et al., 2007).
Through correlation analysis (Figure 5.5) of porosity and permeability test
results from core samples in well HY7-3-1, results show a positive correlation, i.e.
porosity increased with increasing permeability.
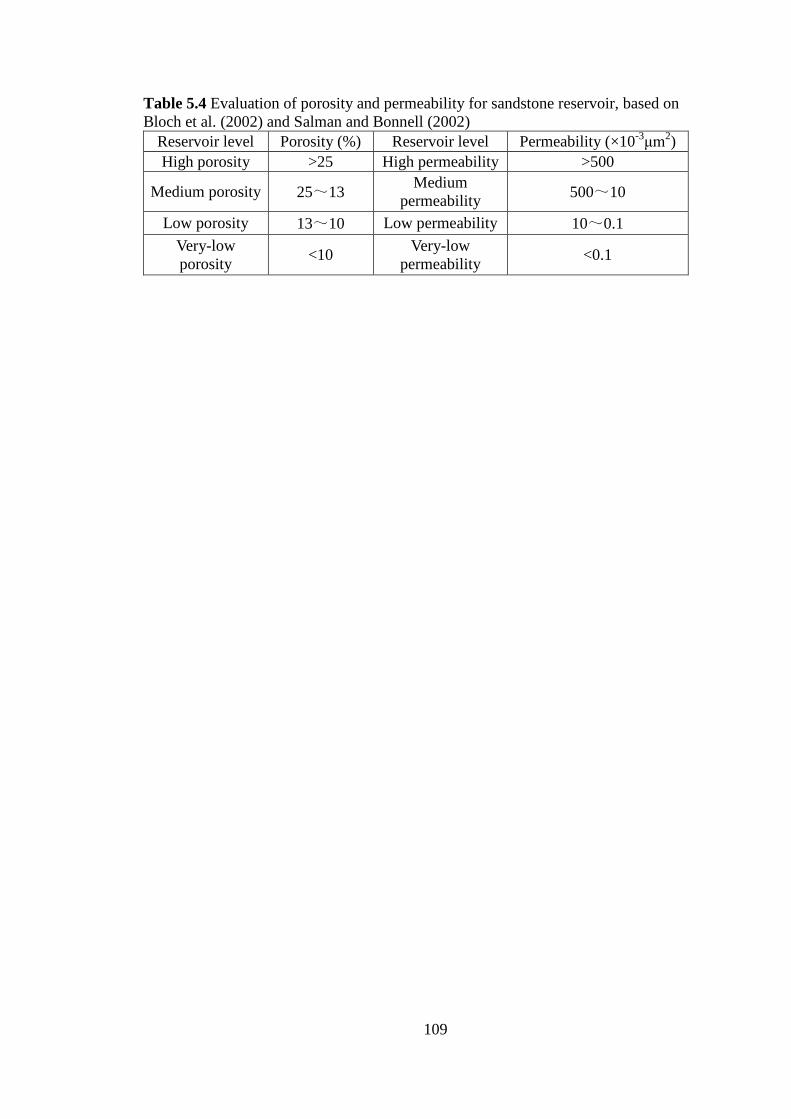
109
Table 5.4 Evaluation of porosity and permeability for sandstone reservoir, based on Bloch et al. (2002) and Salman and Bonnell (2002)
Reservoir level Porosity (%) Reservoir level Permeability (×10-3μm2) High porosity >25 High permeability >500
Medium porosity 25~13 Medium permeability 500~10
Low porosity 13~10 Low permeability 10~0.1 Very-low porosity <10 Very-low
permeability <0.1

110
Table 5.5 Petrophysical properties of the Huagang Formation sandstone (porosity are based on thin section microscopy, permeability are based on testing results)
Wells Zones Porosity (%) Permeability (×10-3μm2) Max. Min. Average Max. Min. Average
HY7-3-1
H6 15 12.2 13 14.4 4.5 8.2 H8 12.2 10.2 11.3 4.8 2.3 3.5 H9 12.5 10 11.6 4.6 1.9 3.9 H11 11.5 10.4 10.8 3.6 2.3 2.7
HY1-1-3S
H3 16.2 10.4 13.3 33.7 2.1 17.9 H4 15.6 13.9 14.9 26.2 12 20 H5 13 10 11.2 7.9 2.2 5.1 H6 10.1 10.1 10.1 2.7 2.4 2.55 H7 10.6 9.7 10.15 0.3 0.2 0.25 H8 10 7.7 9.1 0.2 0.1 0.18 H9 9.9 6.4 9 0.2 0.1 0.183 H11 9.8 9.1 9.45 0.2 0.2 0.2 H12 10 8 9.1 0.2 0.1 0.186
QY-1
H1 21.6 18.2 19.6 45.5 13.3 32 H3 16.5 14.4 15.55 36 24.3 30.1 H5 13.26 10.1 11.99 9.4 1 3.1 H6 12.7 3.4 9 4.9 1 1.98 H7 14.9 5 9.8 2.3 0 1.35 H8 12.7 12.7 12.7 4.9 4.9 4.9

111
Figure 5.5 Correlation relationship map of porosity and permeability of HY7-3-1 well, Huagang Formation.
112
5.2.2 Petrophysical Properties of the reservoir in Western Sub-sag
According to the core sample test data and well logging for well HY1-1-3S
(Table 5.5), the porosities of this well decreased with increasing depth, which mainly
performed as H3 and H4 zones with an average porosity of 14%, and zone H5 to H12
averaging a porosity of 10%.
Porosity in well QY-1 showed greater variability (Table 5.5) but followed the
pattern of decreasing porosity with increasing depth. Porosities in this well changed
more significant than other wells, the average porosity is 19.6% to 9% from H1 to H6,
however, from H6 to H8, the porosity increases a little from 9% to 12.7%, through
thin section observations, it is probably because of the dissolution of kaolinites and
then the kaolinite intercrystalline pores increases.
The permeability of well HY1-1-3S (Table 5.5) showed that, the permeability of
this well also decreased with increasing depth. Specifically, H3 and H4 zones had
relatively good permeability (17.9×10⁻³μm2 to 20×10-3μm2 on average) and H5 and
H6 zones had low permeability averaging 2.55×10⁻³μm2 to 5.1×10⁻³μm2. From H7 to
H12 zones, average permeability was approximately 0.2×10⁻³μm2, close to a very-low
permeability reservoir.
The permeability for well QY-1 (Table 5.5) shows that H1 to H3 zones have the
average permeability of 30.1×10⁻³μm2 to 32×10-3μm2, which belong to medium
permeability reservoir; and H5 to H8 zones have the average permeability of only
3×10⁻³μm2, which represents a low permeability reservoir.
The porosity and permeability for wells HY1-1-3S and QY-1 are also positively
coordinated (Figure 5.6, 5.7).

113
Figure 5.6 Correlation relationship map of porosity and permeability of HY1-1-3S well, Huagang Formation.
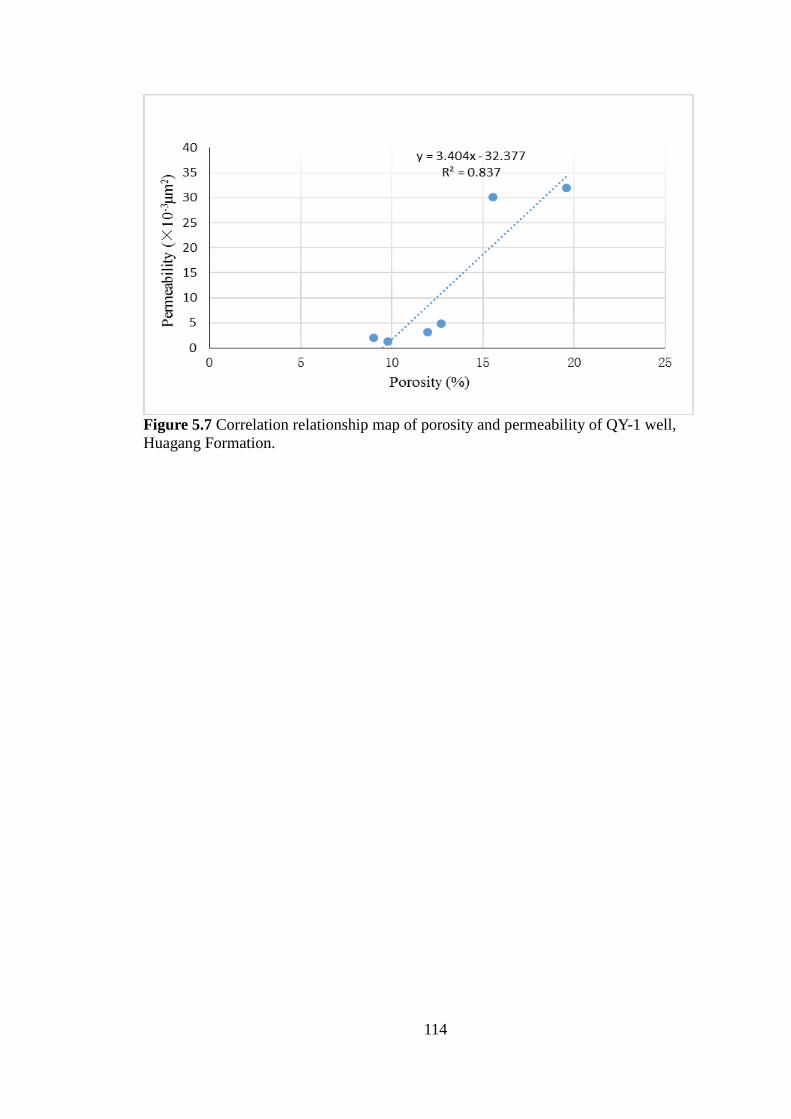
114
Figure 5.7 Correlation relationship map of porosity and permeability of QY-1 well, Huagang Formation.
115
5.3 Discussion
As inferred from petrographic and petrophysical analyses, there is an important
relationship between the amount of kaolinite and the petrophysical properties of
reservoir. Kaolinite is an indicating mineral for the dissolution of feldspar and the
development of secondary porosity (Zhang et al., 2009). In the study area, the amount
of kaolinite and the reservoir porosity and permeability is obviously positively
correlated, however the relationship between the amount of kaolinite and the amount
of feldspars is negatively correlated, showing the importance of kaolinite in terms of
the development of secondary porosities in the Huagang reservoir. In the study area,
the average amount of kaolinite is decreasing from west to east, i.e. W.S.-S.> C.I.T.B.
(Table 3.8, Figure 3.12), and decreasing from south to north, i.e. CHX-TWT> Yuquan
area, the amount of kaolinites in CHX-TWT area reaches the largest in the study area
(Table 3.8, Figure 3.12). This also agrees with the feldspar content of each structural
area (Table 3.2).
Generally speaking, the porosity of reservoir sandstones of the Huagang
Formation is mainly decreasing with increasing depth, i.e. the general trend of the
porosity and permeability from H1 to H12 is decreasing (Table 5.5). On the other
hand, among all the structural belts (Table 5.6 and 6.4), there is generally a decreasing
trend of porosity and permeability from west to east and from south to north. More
specifically, taking into consideration the microfacies of the underwater distributary
channel of Pingbei, Pinghu, Western sub-sag and Central inversion tectonic belt as
examples, it can be seen that the trends of porosity and permeability are decreasing
from west to east (Table 5.6), i.e. the physical properties are decreasing from west
(Pinghu and Pingbei area) to east (Western sub-sag and Central inversion tectonic
belt). This is related to the sedimentary sequence. The western sub-sag is the

116
depositional center, which has relatively fine sand and has a higher amount of mud.
This is increasing eastward, thus the physical properties of the structural areas in the
east are poorer than that of the structural areas in the west. In the same way, there is
also a decreasing trend of porosity and permeability from south to north.
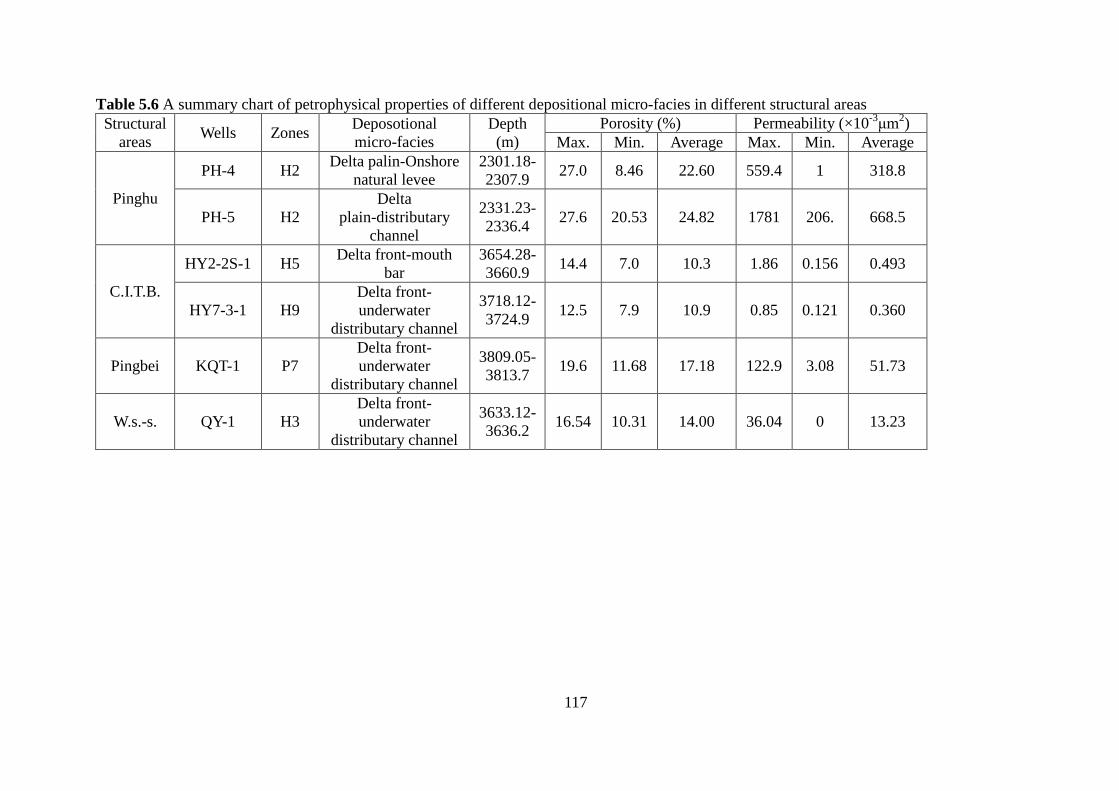
117
Table 5.6 A summary chart of petrophysical properties of different depositional micro-facies in different structural areas Structural
areas Wells Zones Deposotional micro-facies
Depth (m)
Porosity (%) Permeability (×10-3μm2) Max. Min. Average Max. Min. Average
Pinghu
PH-4 H2 Delta palin-Onshore natural levee
2301.18-2307.9 27.0 8.46 22.60 559.4 1 318.8
PH-5 H2 Delta
plain-distributary channel
2331.23-2336.4 27.6 20.53 24.82 1781 206. 668.5
C.I.T.B.
HY2-2S-1 H5 Delta front-mouth bar
3654.28-3660.9 14.4 7.0 10.3 1.86 0.156 0.493
HY7-3-1 H9 Delta front- underwater
distributary channel
3718.12-3724.9 12.5 7.9 10.9 0.85 0.121 0.360
Pingbei KQT-1 P7 Delta front- underwater
distributary channel
3809.05-3813.7 19.6 11.68 17.18 122.9 3.08 51.73
W.s.-s. QY-1 H3 Delta front- underwater
distributary channel
3633.12-3636.2 16.54 10.31 14.00 36.04 0 13.23
118
CHAPTER SIX INFLUENCES ON RESERVOIR DEVELOPMENT
6.1 Provenance Influences on Reservoir Development
The composition and texture of the sediments are related to the processes that
happened prior to the burial of sediments, including weathering denudation of the
provenance area, type of rock in the provenances and, distance of transporting and
deposition environments which are the foundation of reservoir development and
influences reservoir properties (Hao et al., 2011).
Reservoir properties differed in composition and texture of the sediments due to
different provenances and different transporting distances. In the study area, the
provenances from the Haijiao and Yushan uplifts principally influenced the Pinghu,
Pingbei, CHX-TWT and Western sub-sag structural areas. The provenances from the
eastern periphery upfold belt mainly influenced the Yuquan area and the Central inversion
tectonic belt (Figure 3.7).
6.1.1 Provenance Controlled Compositional Maturity
The Huagang Formation reservoir has a high content of feldspar and lithic fragments
while quartz content is relatively low. The different structural areas have differing
compositional maturity (Figure 3.1) due to lithologies variances of their provenances and
transporting distances (Figure 3.7). Specifically, the Pinghu area has the least
compositional maturity, followed by the Pingbei area, the Western sub-sag, the Central
inversion tectonic belt, and the CHX-TWT. The Yuquan areas have the highest
compositional maturity (Figure 3.1) because they are controlled by the transporting
distance from two provenances, i.e. eastern and western provenances (Figure 3.7). The
119
provenance of the eastern periphery upfold belt provides the Yuquan area with a high
compositional maturity (high F1/L1 value means it has a relatively high amount of
feldspar) because of the longer transporting distance from the provenance.
6.1.2 Provenance Controlled Texture Maturity
The Huagang Formation sandstone usually has high textural maturities, but different
structural areas have unique characteristics (Table 3.6 and 3.7).
6.1.2.1 Sorting
The Pingbei and Pinghu areas were close to the provenance from the Haijiao uplift
(Figure 3.7), therefore the material transported there has not been thoroughly separated
and occurs as “unimodal” (Table 3.6). The Western sub-sag is farther from the
provenance (Figure 3.7), so it has better sorting, with a sample frequency reaching 57%
(Table 3.6). The Central inversion tectonic belt and CHX-TWT area were controlled by
the provenance from the eastern periphery upfold belt (Figure 3.7). Both have good
sorting, with 66% and 60% good and medium-good sample frequencies, respectively. In
the Western sub-sag, Central inversion tectonic belt and CHX-TWT area, sorting was
slightly better than that of other structural areas because the transporting distances of
sediments are longer (Figure 3.7), resulting in a higher degree of rock rounding (smooth
edges).
6.1.2.2 Rounding
From the analysis of rounding, 83% of samples from the Huagang Formation were

120
sub-rounded, 10% were sub-angular, and samples of rounded and angular were also
present (Table 3.7). In general, rounding is mainly influenced by the distance from the
provenance to the study area and the changing sea levels.
The Pinghu area is closest to the provenance of the Haijiao uplift (Figure 3.7). The
sediments of this area were transported the shortest distance, with its sub-angular
frequency reaching to 93%. In the Western sub-sag, the sub-angular frequency of samples
were only 5.8%, with 86.2% sub-rounded, which has a better rounding than that of the
Pinghu area. The Central inversion tectonic belt and CHX-TWT area generally contain
sub-rounded and sub-angular grains.
6.1.3 Provenance Controlled Reservoir Properties
The differences between compositional and texture maturity of rocks also reflect in
petrophysical properties. In order to eliminate the special cases of cores in local areas, the
average porosity and permeability of reservoir sandstones of the Huagang Formation
were chosen for comparison (Table 5.6 and 6.1), and using the reference “Oil and gas
industry standard of China - The evaluation method of natural gas reservoir”
(SY/T5601-93), the sandstone reservoir quality is classified.
According to analysis, the Pinghu area is the closest to the provenance of the Haijiao
uplift (Figure 3.12). It has the lowest compositional maturity and texture maturity with
medium porosity and medium permeability. The Western sub-sag and Central inversion
tectonic belt are both rated as very-low porosity and low permeability; The CHX-TWT
area has low porosity and medium permeability.
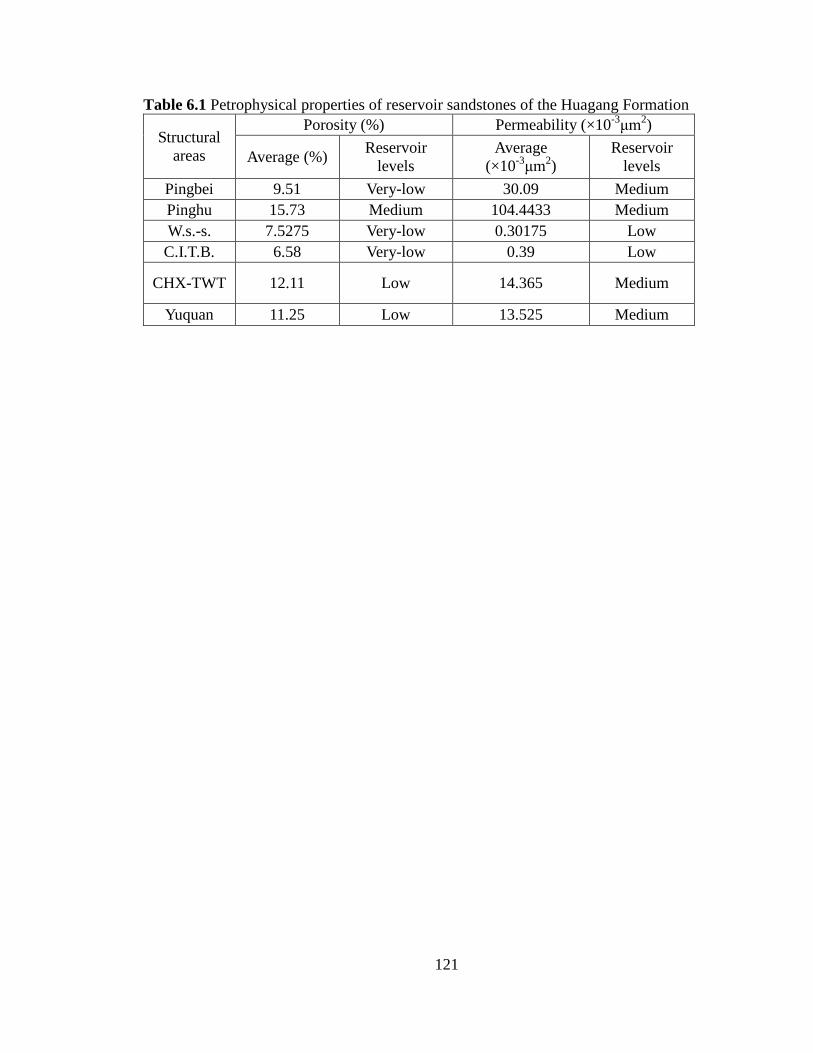
121
Table 6.1 Petrophysical properties of reservoir sandstones of the Huagang Formation
Structural areas
Porosity (%) Permeability (×10-3μm2)
Average (%) Reservoir levels
Average (×10-3μm2)
Reservoir levels
Pingbei 9.51 Very-low 30.09 Medium Pinghu 15.73 Medium 104.4433 Medium W.s.-s. 7.5275 Very-low 0.30175 Low C.I.T.B. 6.58 Very-low 0.39 Low
CHX-TWT 12.11 Low 14.365 Medium
Yuquan 11.25 Low 13.525 Medium

122
6.2 Influence of Diagenesis on Reservoir Development
The sedimentary characteristics of rocks are the intrinsic factors that influence the
primary petrophysical properties of the reservoir whereas diagenesis commonly
influences the secondary porosity generation in sandstone reservoirs (Scherer, 1987;
Schmid, 2004; Ying et al., 2004). The most important diagenetic processes that influence
reservoir development include compaction, cementation and dissolution.
6.2.1 Influences of Compaction on Reservoir Development
Compaction is a diagenetic process resulting in a decrease of primary porosity as
illustrated from data collected from wells HY1-1-2 and HY2-2-1 (Figure 6.1). Based on
the casting thin section observation, there was a stronger compaction in the lower
Huagang Formation. In HY1-1-2 and HY2-2-1 wells, the upper Huagang Formation has
primary porosity ranging from 5.5% to 7%, while the lower Huagang Formation has
porosity of only 3.6% to 3.8%. The thin section observations and SEM also illustrated
that the reservoir sandstone of the Huagang Formation has experienced a relatively
moderate extent of compaction as indicated by point-long contact among grains (Figure
4.2).
6.2.2 Influences of Authigenic Clay Minerals on Reservoir Development
6.2.2.1 Chlorites
Chlorites occur locally in some reservoir zones in the study area. They existed
primarily as clay film along porosities, and in some cases, filling the pores. Although the
chlorite film would block a portion of throats, they prevented overgrowth of quartz
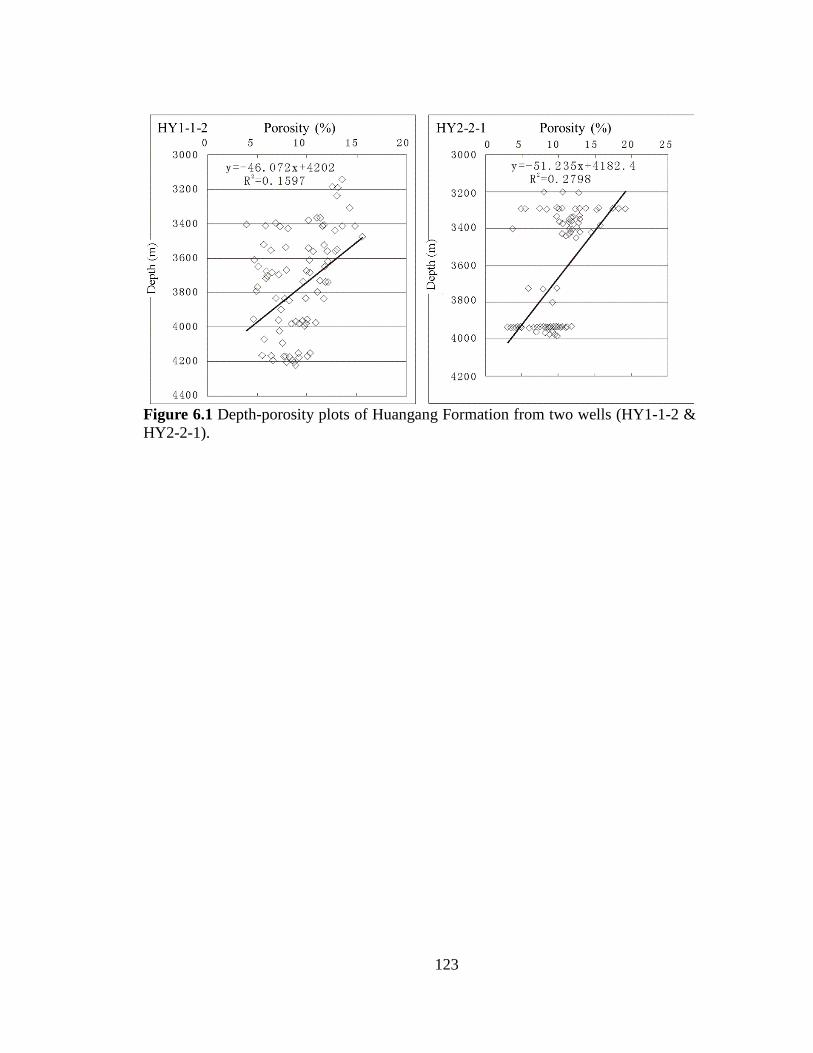
123
Figure 6.1 Depth-porosity plots of Huangang Formation from two wells (HY1-1-2 & HY2-2-1).
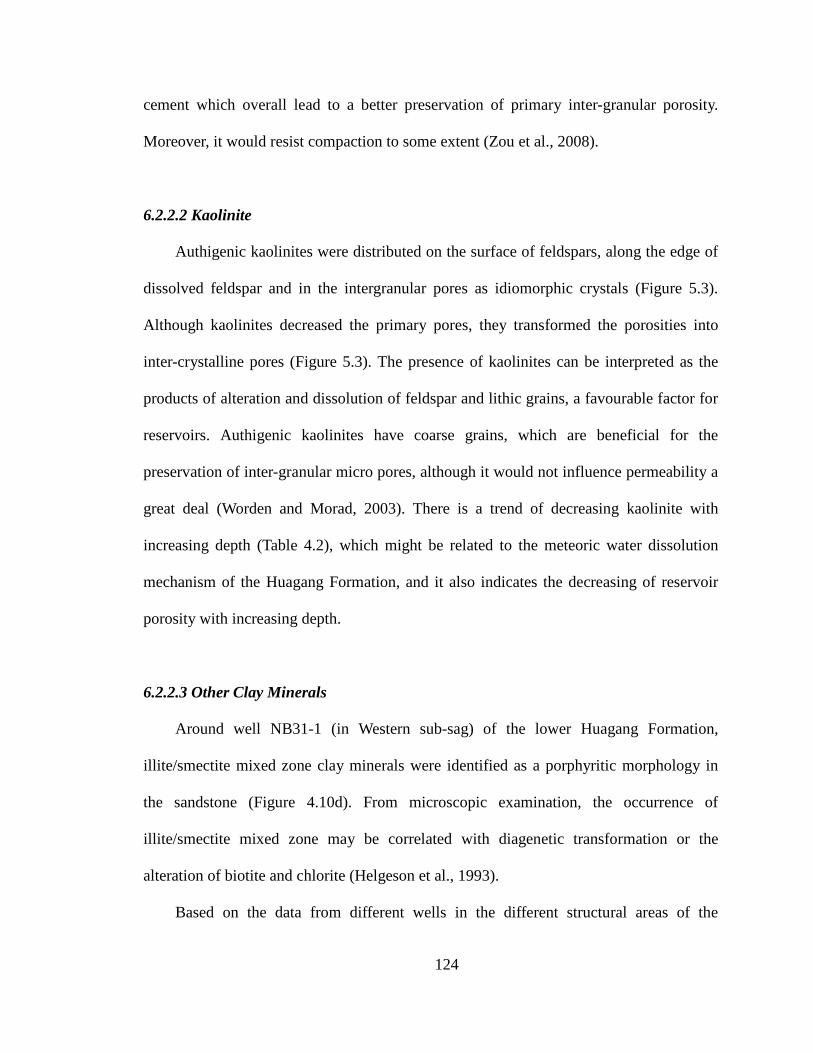
124
cement which overall lead to a better preservation of primary inter-granular porosity.
Moreover, it would resist compaction to some extent (Zou et al., 2008).
6.2.2.2 Kaolinite
Authigenic kaolinites were distributed on the surface of feldspars, along the edge of
dissolved feldspar and in the intergranular pores as idiomorphic crystals (Figure 5.3).
Although kaolinites decreased the primary pores, they transformed the porosities into
inter-crystalline pores (Figure 5.3). The presence of kaolinites can be interpreted as the
products of alteration and dissolution of feldspar and lithic grains, a favourable factor for
reservoirs. Authigenic kaolinites have coarse grains, which are beneficial for the
preservation of inter-granular micro pores, although it would not influence permeability a
great deal (Worden and Morad, 2003). There is a trend of decreasing kaolinite with
increasing depth (Table 4.2), which might be related to the meteoric water dissolution
mechanism of the Huagang Formation, and it also indicates the decreasing of reservoir
porosity with increasing depth.
6.2.2.3 Other Clay Minerals
Around well NB31-1 (in Western sub-sag) of the lower Huagang Formation,
illite/smectite mixed zone clay minerals were identified as a porphyritic morphology in
the sandstone (Figure 4.10d). From microscopic examination, the occurrence of
illite/smectite mixed zone may be correlated with diagenetic transformation or the
alteration of biotite and chlorite (Helgeson et al., 1993).
Based on the data from different wells in the different structural areas of the
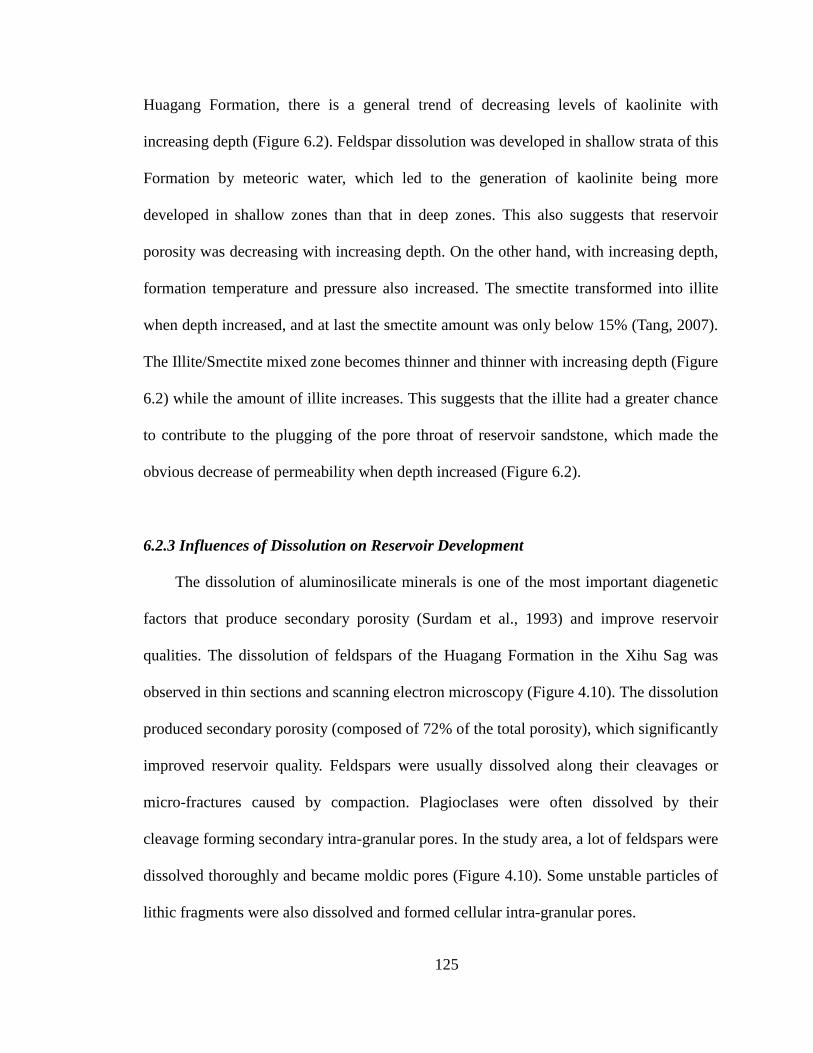
125
Huagang Formation, there is a general trend of decreasing levels of kaolinite with
increasing depth (Figure 6.2). Feldspar dissolution was developed in shallow strata of this
Formation by meteoric water, which led to the generation of kaolinite being more
developed in shallow zones than that in deep zones. This also suggests that reservoir
porosity was decreasing with increasing depth. On the other hand, with increasing depth,
formation temperature and pressure also increased. The smectite transformed into illite
when depth increased, and at last the smectite amount was only below 15% (Tang, 2007).
The Illite/Smectite mixed zone becomes thinner and thinner with increasing depth (Figure
6.2) while the amount of illite increases. This suggests that the illite had a greater chance
to contribute to the plugging of the pore throat of reservoir sandstone, which made the
obvious decrease of permeability when depth increased (Figure 6.2).
6.2.3 Influences of Dissolution on Reservoir Development
The dissolution of aluminosilicate minerals is one of the most important diagenetic
factors that produce secondary porosity (Surdam et al., 1993) and improve reservoir
qualities. The dissolution of feldspars of the Huagang Formation in the Xihu Sag was
observed in thin sections and scanning electron microscopy (Figure 4.10). The dissolution
produced secondary porosity (composed of 72% of the total porosity), which significantly
improved reservoir quality. Feldspars were usually dissolved along their cleavages or
micro-fractures caused by compaction. Plagioclases were often dissolved by their
cleavage forming secondary intra-granular pores. In the study area, a lot of feldspars were
dissolved thoroughly and became moldic pores (Figure 4.10). Some unstable particles of
lithic fragments were also dissolved and formed cellular intra-granular pores.
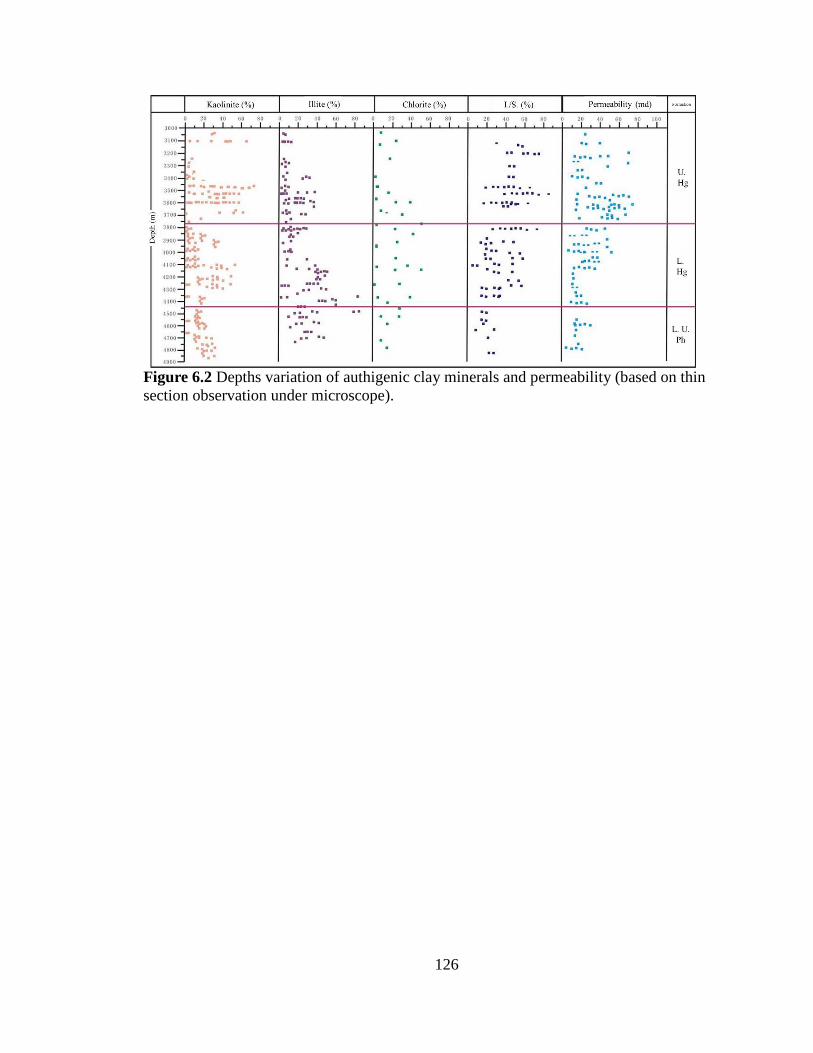
126
Figure 6.2 Depths variation of authigenic clay minerals and permeability (based on thin section observation under microscope).

127
The Huagang Formation is situated beneath the unconformity caused by the
Huagang tectonic uplift. Various research studies showed that the unconformity had a
positive influence on reservoir quality (Zhang et al., 2009). Giles and de-Boer (1990)
found that the increase in porosity was mainly caused by the dissolution of feldspars and
lithic fragments. Surdam et al. (1982) also found that the porosity in Miocene sandstone
beneath the unconformity increased by 10% and the dissolution related to meteoric water
could reach 1500m to 2300m. In the Xihu Sag, meteoric water was interpreted as an
important dissolution media in the Huagang Formation sandstones because these
sandstones are situated beneath an unconformity with a long-time exposure. This long
period of exposure has provided time for the interaction of the Huagang Formation with
meteoric water, resulting in dissolution.

128
CHAPTER SEVEN CONCLUSIONS
1. The Huagang uplift (parallel unconformity) contributed the largest impact on the
tectonic and sedimentary evolution of the Huagang Formation. The provenances
responsible for sediments in the Pinghu area, Pingbei area and Central inversion tectonic
belt were the Haijiao and Yushan uplifts. The provenance that contributed most of the
sediments for the Yuquan and Chunxiao-Tianwaitian areas was the Eastern periphery
upfold belt.
2. Reservoir sandstone from the Huagang Formation has a low compositional maturity
with a high content of feldspar and lithic grains, averaging 20% to 40%. The main
lithology in the Xihu Sag are feldspathic litharenite and lithic subarkose. The Huagang
Formation sandstone has a fine grain size with moderate to well sorting.
3. According to thin section observations and scanning electron microscopy, the Huagang
Formation sandstone has experienced a relatively moderate compaction. Based on
porosity measured from core samples, there is a general trend of decreasing porosities
with increasing depth. The average porosities are in the range of 3% to 3.8% for the
lower Huagang Formation and 5.5% to 13% for the upper Huagang Formation. This is
interpreted to be related to stronger compaction in the lower Huagang Formation
compared to the upper Huagang Formation as well as the different depositional facies and
different extent of cementation.
Carbonate minerals (calcite, dolomite, etc), kaolinites and authigenic quartz occur as
cement in the reservoir. Other minerals, such as, smectite, illite and chlorites are present
129
in very low amounts.
The strong dissolution of feldspars and the occurrence of kaolinites suggest that the
Huagang Formation sandstone experienced a significant dissolution, resulting in
significant amounts of secondary porosities.
4. Based on carbon/oxygen isotopes and fluid inclusion data, the calcite cements of the
Huagang Formation were interpreted to be formed during the Early diagenetic stage A to
Intermediate diagenetic stage B and Late diagenetic stage. The dissolution media is
primarily meteoric water with a minor contribution from organic acid.
5. The average porosity in different structural areas within the study area ranged between
3% and 13%, classifying the reservoir as low porosity. The average permeability was 0.1
×10-3μm2 to 10×10-3μm2, indicating a low to very-low permeability reservoir. The low
permeability of Huagang Formation in the Xihu Sag is interpreted to be related to a
complex process of diagenesis that reduced pore-throat. Comparatively, the Pingbei area
has better petrophysical properties than those of the Central inversion tectonic belt which
contains a typical tight gas reservoir.
130
REFERENCES Athy, L. F., 1930, Density, porosity and compaction of sedimentary rocks. Bull. Amer.
Assoc. Petrol. Geol., v. 14, p. 1-24. Beard, D. C., and Weyl, P. K., 1973, Influence of texture on porosity and permeability of
unconsolidated sand. AAPG Bulletin, v. 57, no. 2, p. 349-369. Bloch, S., Lander, R. H., and Bonnell, L., 2002, Anomalously high porosity and
permeability in deeply buried sandstone reservoirs: origin and predictability. AAPG Bulletin, v. 86, no. 2, p. 301-328.
Boggs, J. R., 2000, Principles of sedimentology and stratigraphy, 3rd ed. Toronto: Merril
Publishing Company. Cai, Q. S., Hu, M. Y., Hu, Z. G., and Wang, D., 2013, Reservoir characteristics and
evolution of diagenetic porosity of Huagang Formation of Paleogene in the central anticlinal belt of Xihu Sag, Donghai Basin. Natural Gas Geoscience, v. 24, no. 4, p. 733-740.
Cat, J. R., 1996, Oxygen and hydrogen isotopes in the hydrologic cycle. Annu. Rev. Earth
Planet. Sci, v. 24, p. 225-62. Cuddy, J., 2000, Litho-facies and permeability prediction from electrical logs using fuzzy
logic. SPE Resermoir Eval. & Eng, v. 3, no. 4, p. 319-324. Dutton, S. P., and Diggs, T. N., 1992, Evolution of porosity and permeability in the lower
Cretaceous Travis Peak Formation, East Texas. AAPG Bulletin, v. 76, no. 2, p. 252-269.
Fang, S. X., and Hou, F. H., 1998, Reservoir geology of oil and gas. Press of Dongying
Petroleum University, p. 145-161. Feng, X. J., Cai, D. S., Wang, C. X., and Gao, L., 2003, Structural evolutional
characteristics of mid-Cenozoic of East China Sea shelf basin. China Offshore Oil & Gas(Geology), v. 17, no. 1, p. 35-39.
Feng, Z. Z., 1993, Sedimentary rocks (First part). Beijing: Press of Petroleum Industry, p.
198-221. Franca, A. B., Araujo, L. M., Maynard, J. B., and Potter, P. E., 2003, Secondary porosity
formed by deep meteoric leaching: Botucatu eolicanite, southern South America. AAPG Bulletin, v. 87, no. 7, p. 1073-1082.
Friedman, I., and O’Neil, J. R., 1977, Oxygen isotope composition of calcite as a function
of temperature and water composition. Railback’s Some Fundamentals of

131
Mineralogy & Geochemistry, p. 1-3. Giles, M. R., and Marshall, J. D., 1986, Constrains on the development of secondary
porosity in the subsurface: Re-evaluation of processes. Marine & Petroleum Geology, v. 3, no. 3, p. 243-255.
Gong, Z. S., Cai, D. S., and Zhang, G. C., 2007, Dominating action of Tanlu Fault on
hydrocarbon accumulation in eastern Bohai Sea area. Acta Petrolei Sinica, 2007, v. 28, no. 4, p. 5-14.
Hao, L. W., Liu, C., Wang, Q., Wang, H., Ma, X. F., Tang, J., and Liao, P., 2011,
Provenance characteristics of Huagang Formation (Paleogene) in Xihu Sag, East China Sea. Natural gas geoscience, v. 22, no. 2, p. 315-323.
Harrell, J., 1984, A visual comparator for degree of sorting in thin and plane sections.
Journal of Sedimentary Petrology, v. 54, p. 646-650. Hayes, M. J., and Boles, J. R., 1992, Volumetric relations between dissolved plagioclase
and kaolinite in sandstones: implications for aluminum mass transfer in the San Joaquin basin, California. Society for Sedimentary Geology.
He, C. Z., and Hua, M. Q., 2005, Pore structures and physical properties of the low
permeability sandstone gas reservoir. Xinjiang Petroleum Geology, v. 26, no. 3, p. 280-285.
Helgeson, H. C., Knox, A. M., Owens, C. E., and Shock, E. L., 1993, Petroleum, oilfield
waters, and equthigenic mineral assemblages: are they in metastable equilibrium in hydrocarbon reservoirs. Geochimica er Cosmochimica Ata, v. 57, p. 3295-3339.
Huang, S. J., Wu, W. H., and Liu, J., 2003, The role of meteoric water in the generation of
secondary porosities of clastic rocks: take the Triassic Yanchang Formation of Ordos Basin as an example. Geoscience: Journal of China University of Geoscience, v. 28, no. 4, p. 419-425.
Hu, M. Y., Ke, L., and Liang, J. S., 2010, Sedimentary characteristics and facies model of
Huagang Formation, Xihu Sag. Journal of Oil & Gas Technology(J. JPI), v. 32, no. 5, p. 6-10, 404.
Hu, Z. Q., and Zhu, X. M., 2006, Diagenesis and porosity evolution of Jurassic reservoirs
of west-north Junggar Basin. Journal of Petroleum University(Science & Technology Edition), v. 26, no. 3, p. 17-20.
Jiang, H. J., Hu, M. Y., Hu, Z. G., Ke, L., Xu, Y. X., and Wu, L. Q., 2011, Sedimentary
environment of Palaeogene in Xihu Sag: Microfossil as the main foundation. Lithologic Oil & Gas Reservoir, v. 23, no. 1, p. 74-79.

132
Jiang, L. Z., Gu, J. Y., and Guo, B. C., 2004, Characteristics and forming mechanisms of the low permeability clastic reservoirs in oil-gas bearing basins, China. Acta Sedimentologica Sinica, v. 22, no. 1, p. 13-18.
Jiang, W. W., Hao, T. Y., Liu, S. H., and Zhu, D. Y., 2004, The correlation analysis of
geologic structures between eastern land of China and East China Sea. Geophysical Development, v. 19, no. 1, p. 75-91.
Jiang, W. W., Song, H. B., Hao, T. Y., and Liu, S. H., 2001, Geologic and geophysical
field characteristic of East China Sea shelf basin and its surrounding sea regions. Geophysical Development, v. 16, no. 2, p. 19-28.
Jiang, Y. L., and Zha, M., 2006, Oil and Gas Geology and Exploration, Beijing: Press of
Petroleum Industry. Krumbein, W. C., and Sloss, L. L., 1963, Stratigraphy and Sedimentation, 2nd edition,
Freeman, San Francisco. Lin, C. S., 2006, Analysis of tectonic formations of sedimentary basins: take Chinese
tectonic basins as examples. Geoscience, v. 20, no. 2, p. 3-12. Liu, B. J., and Zhang, J. Q., 1992, Sedimentary diagenesis. Beijing: Press of Science, p.
74-77. Liu, D. L., Sun, X. R., and Li, Z. S., 2006, C/O isotopes analysis of Ordovician dolomite
in Ordos Basin. Petroleum experimental geology, v. 28, no. 2, p. 155-161. Liu, G. Y., Liu, Y., and Zhang, L. P., 2006, Influence of the compaction on petrophysical
properties of sandstone reservoir. Journal of Xi’an Petroleum University(Science & Technology Edition), v. 21, no. 4, p. 24-28.
Liu, J. S., Cao, B., Xu, Z. X., 2012, Qin Lanzhi, Xu Fanghao and Tang Jiancheng.
Depositional facies and reservoir characteristics of the tight sandstone reservoir of a structure in Xihu Sag. Journal of Chengdu University of Technology(Science & Technology Edition), v. 39, no. 2, p. 130-137.
Liu, J. S., Liao, Z. T., Jia, J. Y., Zhou, Z. Y., and Yang, J., 2003, Geologic structure and
tectonic evolution of East China Sea shelf basin. Shanghai Geology, v. 3, p. 5-10. Liu, M. H., Zhao, J. L., and Ji, Y. L., 1993, Diagenetic evolutional models of clastic
reservoirs. Beijing: Press of University of Petroleum. Li, S. Q., and Li, C. J., 2003, The analysis of oil and gas resourses distribution and
exploration potential of Xihu Sag, East China Sea. Petroleum Geology & Experiment, v. 25, no. 6, p. 721-728.
133
Matyas, J., and Matter, A., 1997, Diagenetic indicators of meteoric flow in the Pannonian Basin, Southeast Hungary. Society for Sedimentary Geology (SEPM), Geochemical and Hydrologic Considerations (SEPM), Special Publication no. 57, p. 2-282.
Milliken, K. L., 2001, Diagenetic heterogeneity in sandstone at the outcrop scale,
Breathitt Formation (Pennsylvanian), eastern Kentucky. AAPG Bulletin, v. 85, no. 5, p. 795-815.
Mu, S. G., and Zhang, Y. M., 1994, The control of diagenesis and its stages on porosity
evolution of clastic reservoirs. Journal of South-west Petroleum University, v. 16, no. 3, p. 22-27.
Nichols, G., 1999, Sedimentology and Stratigraphy, 1st edition, Blackwell Science Ltd,
Hong Kong Printed and bound in the United Kingdom at the University Press, Cambridge.
Pang, X. Q., Luo, X. R., Jiang, Z. X., Lin, C. S., Zhang, Y. C., Zhong, N. N., and Li, Z.,
2007, Research progress and problems of oil and gas accumulation in complex superimposed basin, western China. Advances in Earth Science, v. 22, no. 9, p. 5-13.
Pettijohn, F. J., 1949, Sedimentary Rocks. Harper and Row, 2nd edn., 1957; 3rd edn.,
1975. Pettijohn, F. J., 1975, Sedimentary Rocks, 3rd ed. 718 pp. Harper and Row, New York. Pettijohn, F. J., Potter, P. E., and Siever, R., 1987, Sand and Sandstone, Springer,
Retrieved 11 May 2012. Prothero, D., 2004, Sedimentary Geology. New York, NN: W.H. Freeman and Company. Scherer, M., 1987, Parameters influencing porosity in sandstones: a model for sandstone
porosity prediction. AAPG Bulletin, v. 71, no. 5, p. 485-491. Schmid, S., Worden, R. H., and Fisher, Q. J., 2004, Diagenesis and reservoir quality of
the Sherwood Sandstone(Triassic), Corrib Field, Slyne Basin, west of Ireland. Marine & Petroleum Geology, v. 21, no. 3, p. 299-315.
Sclater, J. G., and Christie, P. A. F., 1980, Continental stretching: an explanation of the
post-mid-Cretaceous subsidence of the Central North Sea Basin. Journal of Geophysical Research, v. 85, p. 3711–3739.
Shanmugam, G., 1985, Significance of secondary porosity in interpreting sandstone
composition. The American Association of Petroleum Geologists Bulletin, v. 69, no. 3, p. 378-384.
Surdam, R. C., Boese, S., and Crossey, L. J., 1982, Role of organic and inorganic
134
reactions in development of secondary porosity in sandstone. AAPG Bulletin, v. 66, no. 5, p. 635-642.
Surdam, R. C., Crossey, L. J., and Hagen, E. S., 1989, Organic-inorganic interaction and
sandstone diagenesis. AAPG, v. 73, no. 1, p. 1-23. Surdam, R. C., and MacGowan, D. B., 1993, Redoxand reaction involving hydrycarbons
and mineral oxidants: A mechanism for significant porosity enhancement in sandstones. AAPG Bulletin, v. 77, no. 99, p. 1509-1915.
SY/T 5368-2000, 2000, Thin sections identification. Beijing: Press of Petroleum
Industry. SY/T 5477-2003, 2003, Diagenetic stages division of clastic rock, industry standard of oil
and gas. Beijing: Press of Petroleum Industry. Tang, H. M., 2007, Mineralogy. Petroleum Industry Press, p. 148-337. Veizer, J., Ala, D., Azmy, K., Bruckschen, P., Buhl, D., Bruhn, F., and Carden, G. A. F.,
1999, 87Sr/86Sr, 13C and 18O evolution of Phanerozoic seawater. Chemical Geology, v. 161, p. 59-88.
Wang, Y. F., and Ling, J. J., 1999, The parameters analysis of pore structure
characteristics of low permeability sandstone reservoir. Special Oil & Gas Reservoirs, v. 6, no. 4, p. 25-28.
Worden, R. H., and Morad, S., 2003, Clay minerals in sandstones: Control on formation,
distribution and evolution. Special Publication of the International Association of Sedimentologists, v. 34, no. 2, p. 3-41.
Xiao, G. L., and Zhou, C. F., 1995, Discuss of the Yuquan movement of East China Sea
shelf basin. Journal of Ocean University of Qingdao, v. 25, no. 4, p. 488-494. Xu, H., Ma, H. F., Pu, Q. N., Liang, R. B., and Zheng, J., 2003, Characteristics of oil-gas
bearing and Cenozoic strata of the East China Sea shelf basin. Marine Geology Trend, v. 19, no. 4, p. 22-25.
Yang, X. P., Zhao, W. Z., Zou, C. N., Chen, M. J., and Guo, Y. R., 2007, Forming
mechanisms of low permeability reservoir and the generation and distribution of high quality reservoirs. Acta Petrolei Sinica, v. 28, no. 4, p. 57-60.
Ye, J. R., Qing, H. R., and Bend, S. L., 2007, Petroleum systems in the offshore Xihu
Basin on the continental shelf of the East China Sea. AAPG Bulletin, v. 91, no. 8, p. 1167-1188.
Ying, F. X., 2003, Industrial standard of China: Diagenetic stages division of clastic rocks,
135
SY/T 5477-2003. Beijing: Press of Petroleum Industry. Ying, F. X., Luo, P., and He, D. B., 2004, Diagenesis and diagenetic numerical modeling
of clastic reservoirs of oil-gas bearing basins, China. Beijing: Press of Petroleum Industry, p. 91-94.
Zachos, J. C., McCarren, H., and Murphy, B., 2010, Tempo and scale of late Paleocene
and early Eocene carbon isotope cycles: Implications for the origin of hyperthermals. Earth & Planetary Science Letters, v. 299, p. 242–249.
Zeng, D. Q., and Li, S. Z., 1994, Reservoir types and geologic characteristics of the low
permeability sandstone reservoirs, China. Acta Petrolei Sinica, v. 15, no. 1, p. 38-45. Zhang, H. N., and Cheng, W. G., 1983, Quanzhou-Shantou seismic belt and Philippine
Palte. Seism, p. 25-29. Zhang, J. P., Ge, H. P., and Qi, B. W., 2009, Characteristics of authigenic kaolinite in
sandstones of Xihu Sag and its impact on reservoir physical properties. Offshore Oil, v. 29, no. 1, p. 1-8.
Zhang, W., Xu, F., Xu, G. S., Gao, W. Z., and Tang, J. C., 2012, Diagenesis and pore
evolution of Huagang Formation tight sandstone reservoirs in a structure of Xihu depression in East China Sea Basin. Journal of Chengdu University of Technology (Science and Technology Edition), v. 39, no. 2, p. 122-129.
Zhang, Y. X., Ye, J. R., Su, K. L., Li, L. X., and Xu, J. J., 2009, The subsidence history
and tectonic evolution of Xihu Sag, East China Sea. Geotectonica & Metallogenia, v. 2, no. 33, p. 215-223.
Zheng, Q. G., Zhou, Z. Y., Cai, L. G., Lu, Y. D., and Cao, Q. G., 2005, Meso-Cenozoic
tectonic setting and evolution of East China Sea shelf basin. Oil & Gas Geology, v. 26, no. 2, p. 70-74.
Zhou, Z. W., Zhao, J. H., and Yin, P. L., 1990, Structural characteristics and oil-gas
bearing properties of East China Sea shelf basin, Cenozoic sedimentary basins of China. Beijing: Press of Petroleum Industry, p. 226-242.
Zou, M. L., Huang, S. J., Hu, Z. W., Feng, W. L., and Liu, H. N., 2008, The origin of
carbonate cements and the influence on reservoir quality of Pinghu Formation in Xihu Sag, East China Sea. Lithologic Reservoirs, v. 20, no. 1, p. 51-56.


![New Empirical Models for Estimating Permeability in One of ... › article_76195_444b59c8737dd... · [28] in tight reservoirs, Zhu et al. [29] in tight sandstone reservoir using artificial](https://img.pdfslide.net/doc/110x75/5f1cb5ac436c4363065fc6f4/new-empirical-models-for-estimating-permeability-in-one-of-a-article76195444b59c8737dd.jpg)