Embed Size (px)
Citation preview
Economic and Financial Consulting and Expert Testimony
Characteristics of U.S. Natural Gas Transactions
Insights from FERC Form 552 Submissions as of July 1, 2021
i Cornerstone Research | Characteristics of U.S. Natural Gas Transactions—Insights from FERC Form 552 Submissions
Table of Contents
Executive Summary 1
Trends in Natural Gas Production and Consumption 2
Natural Gas Production 4
Liquefied Natural Gas 5
Market Volume 7
Exchange Trading 8
Transaction Volume 9
Purchase and Sale Volume 10
Top 20 Companies 11
Transaction Types 12
Reporting to Price Index Publishers 14
Fixed Price Volume by Industry Segments 16
Glossary 18
Appendices 20
Endnotes 21
About the Authors 24
ii Cornerstone Research | Characteristics of U.S. Natural Gas Transactions—Insights from FERC Form 552 Submissions
Table of Figures and Appendices
Figure 1: U.S. Natural Gas Balance Sheet 3
Figure 2: U.S. Natural Gas in Underground Storage 3
Figure 3: U.S. Natural Gas Marketed Production and Average Natural Gas Henry Hub Spot Price 4
Figure 4: U.S. Liquefied Natural Gas Exports and LNG Prices by Country 5
Figure 5: Evolution of Spot Gas Prices 6
Figure 6: Total Reported Volume 7
Figure 7: ICE and CME Natural Gas Contracts Traded 8
Figure 8: Transaction Volume by Industry Segment 9
Figure 9: Purchase and Sale Volume by Industry Segment 10
Figure 10: Top 20 Companies by Total Reported Volume 11
Figure 11: Transaction Volume by Transaction Type 12
Figure 12: Next-Month and Next-Day Transaction Volume across Both Fixed-Price and Index-Priced Transactions 13
Figure 13: Total Volumes Potentially Reported to Indices versus Transaction Volumes Priced Based on Indices 14
Figure 14: Fixed-Price Volume by Reporting versus Non-Reporting Companies 15
Figure 15: Fixed-Price Volume for Entities Reporting to Price Index Publishers by Company Type 16
Figure 16: Percentage of Fixed-Price Volume Reported to Price Index Publishers by Industry Segment 17
Appendix 1: Energy Policy Act of 2005, Form 552 Submissions, and Cornerstone Research’s Proprietary Analysis 20
Appendix 2: Data Submitted to FERC 20
The Federal Energy Regulatory Commission (FERC) receives and compiles the most comprehensive information on trading activity and pricing methods in U.S. natural gas trading markets. The information, collected from market participants’ FERC Form 552 submissions, provides a database of trading activity that spans both physical and financial trading by a range of companies, from producers to end users.
By supplementing the data with proprietary classifications of market participants, Cornerstone Research adds deeper insight into market activities and characteristics across the various types of participants. See Appendix 1 for additional information.
1 Cornerstone Research | Characteristics of U.S. Natural Gas Transactions—Insights from FERC Form 552 Submissions
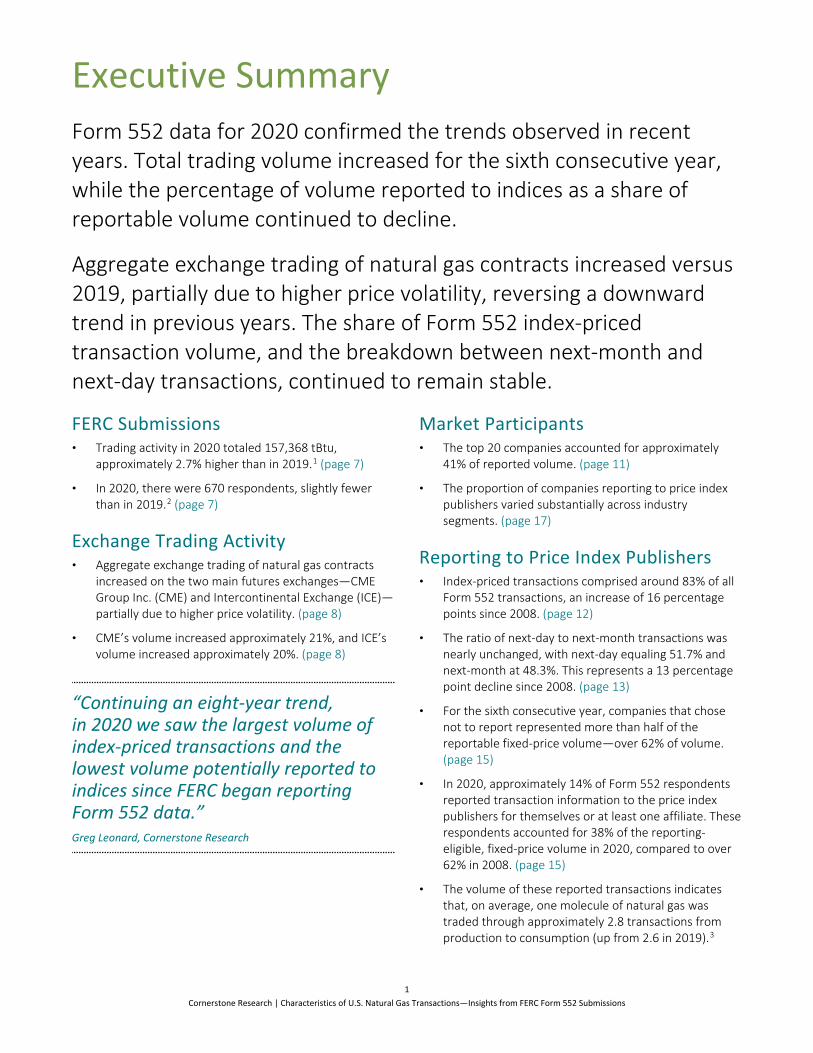
Executive Summary Form 552 data for 2020 confirmed the trends observed in recent years. Total trading volume increased for the sixth consecutive year, while the percentage of volume reported to indices as a share of reportable volume continued to decline.
Aggregate exchange trading of natural gas contracts increased versus 2019, partially due to higher price volatility, reversing a downward trend in previous years. The share of Form 552 index-priced transaction volume, and the breakdown between next-month and next-day transactions, continued to remain stable.
FERC Submissions • Trading activity in 2020 totaled 157,368 tBtu,
approximately 2.7% higher than in 2019.1 (page 7)
• In 2020, there were 670 respondents, slightly fewer than in 2019.2 (page 7)
Exchange Trading Activity • Aggregate exchange trading of natural gas contracts
increased on the two main futures exchanges—CME Group Inc. (CME) and Intercontinental Exchange (ICE)—partially due to higher price volatility. (page 8)
• CME’s volume increased approximately 21%, and ICE’s volume increased approximately 20%. (page 8)
“Continuing an eight-year trend, in 2020 we saw the largest volume of index-priced transactions and the lowest volume potentially reported to indices since FERC began reporting Form 552 data.” Greg Leonard, Cornerstone Research
Market Participants • The top 20 companies accounted for approximately
41% of reported volume. (page 11)
• The proportion of companies reporting to price index publishers varied substantially across industry segments. (page 17)
Reporting to Price Index Publishers • Index-priced transactions comprised around 83% of all
Form 552 transactions, an increase of 16 percentage points since 2008. (page 12)
• The ratio of next-day to next-month transactions was nearly unchanged, with next-day equaling 51.7% and next-month at 48.3%. This represents a 13 percentage point decline since 2008. (page 13)
• For the sixth consecutive year, companies that chose not to report represented more than half of the reportable fixed-price volume—over 62% of volume. (page 15)
• In 2020, approximately 14% of Form 552 respondents reported transaction information to the price index publishers for themselves or at least one affiliate. These respondents accounted for 38% of the reporting-eligible, fixed-price volume in 2020, compared to over 62% in 2008. (page 15)
• The volume of these reported transactions indicates that, on average, one molecule of natural gas was traded through approximately 2.8 transactions from production to consumption (up from 2.6 in 2019).3
2 Cornerstone Research | Characteristics of U.S. Natural Gas Transactions—Insights from FERC Form 552 Submissions
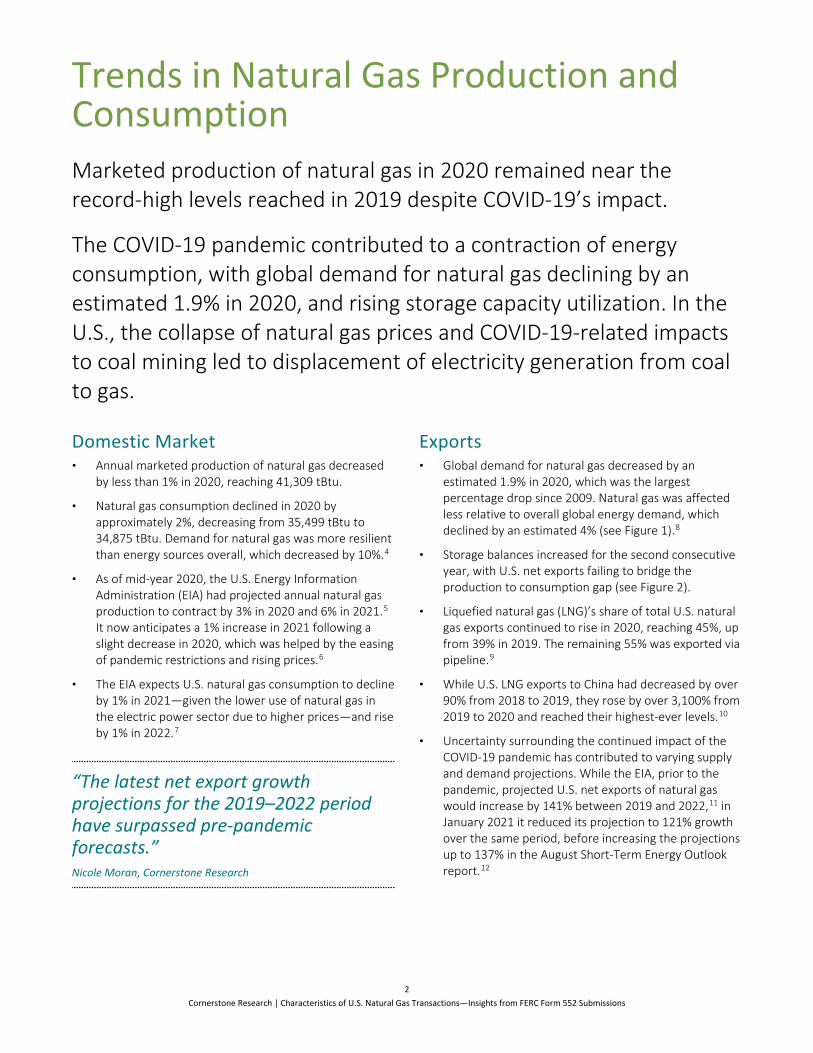
Trends in Natural Gas Production and Consumption Marketed production of natural gas in 2020 remained near the record-high levels reached in 2019 despite COVID-19’s impact.
The COVID-19 pandemic contributed to a contraction of energy consumption, with global demand for natural gas declining by an estimated 1.9% in 2020, and rising storage capacity utilization. In the U.S., the collapse of natural gas prices and COVID-19-related impacts to coal mining led to displacement of electricity generation from coal to gas.
Domestic Market • Annual marketed production of natural gas decreased
by less than 1% in 2020, reaching 41,309 tBtu.
• Natural gas consumption declined in 2020 by approximately 2%, decreasing from 35,499 tBtu to 34,875 tBtu. Demand for natural gas was more resilient than energy sources overall, which decreased by 10%.4
• As of mid-year 2020, the U.S. Energy Information Administration (EIA) had projected annual natural gas production to contract by 3% in 2020 and 6% in 2021.5 It now anticipates a 1% increase in 2021 following a slight decrease in 2020, which was helped by the easing of pandemic restrictions and rising prices.6
• The EIA expects U.S. natural gas consumption to decline by 1% in 2021—given the lower use of natural gas in the electric power sector due to higher prices—and rise by 1% in 2022.7
“The latest net export growth projections for the 2019–2022 period have surpassed pre-pandemic forecasts.” Nicole Moran, Cornerstone Research
Exports • Global demand for natural gas decreased by an
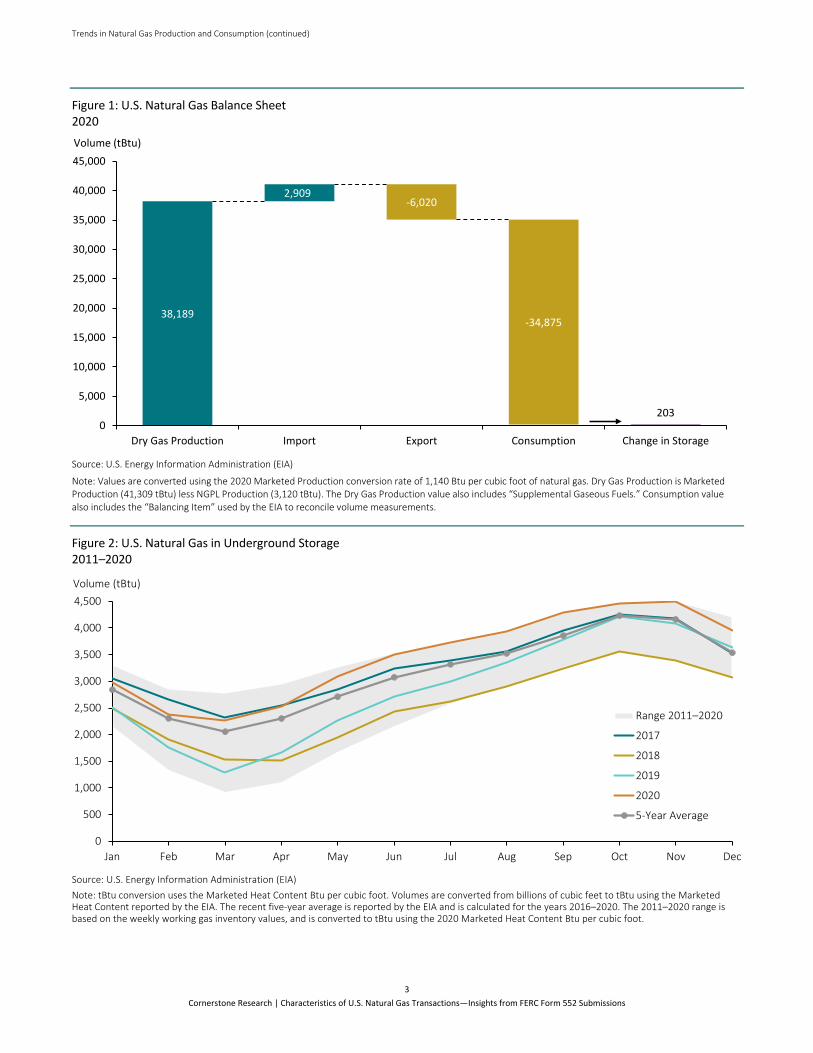
estimated 1.9% in 2020, which was the largest percentage drop since 2009. Natural gas was affected less relative to overall global energy demand, which declined by an estimated 4% (see Figure 1).8
• Storage balances increased for the second consecutive year, with U.S. net exports failing to bridge the production to consumption gap (see Figure 2).
• Liquefied natural gas (LNG)’s share of total U.S. natural gas exports continued to rise in 2020, reaching 45%, up from 39% in 2019. The remaining 55% was exported via pipeline.9
• While U.S. LNG exports to China had decreased by over 90% from 2018 to 2019, they rose by over 3,100% from 2019 to 2020 and reached their highest-ever levels.10
• Uncertainty surrounding the continued impact of the COVID-19 pandemic has contributed to varying supply and demand projections. While the EIA, prior to the pandemic, projected U.S. net exports of natural gas would increase by 141% between 2019 and 2022,11 in January 2021 it reduced its projection to 121% growth over the same period, before increasing the projections up to 137% in the August Short-Term Energy Outlook report.12
Trends in Natural Gas Production and Consumption (continued)
3 Cornerstone Research | Characteristics of U.S. Natural Gas Transactions—Insights from FERC Form 552 Submissions
Figure 1: U.S. Natural Gas Balance Sheet 2020
Source: U.S. Energy Information Administration (EIA)
Note: Values are converted using the 2020 Marketed Production conversion rate of 1,140 Btu per cubic foot of natural gas. Dry Gas Production is Marketed Production (41,309 tBtu) less NGPL Production (3,120 tBtu). The Dry Gas Production value also includes “Supplemental Gaseous Fuels.” Consumption value also includes the “Balancing Item” used by the EIA to reconcile volume measurements.
Figure 2: U.S. Natural Gas in Underground Storage 2011–2020
Source: U.S. Energy Information Administration (EIA) Note: tBtu conversion uses the Marketed Heat Content Btu per cubic foot. Volumes are converted from billions of cubic feet to tBtu using the Marketed Heat Content reported by the EIA. The recent five-year average is reported by the EIA and is calculated for the years 2016–2020. The 2011–2020 range is based on the weekly working gas inventory values, and is converted to tBtu using the 2020 Marketed Heat Content Btu per cubic foot.
-6,020
-34,875
203
38,189
2,909
0
5,000
10,000
15,000
20,000
25,000
30,000
35,000
40,000
45,000
Dry Gas Production Import Export Consumption Change in Storage
Volume (tBtu)
0
500
1,000
1,500
2,000
2,500
3,000
3,500
4,000
4,500
Jan Feb Mar Apr May Jun Jul Aug Sep Oct Nov Dec
Range 2011–2020
2017
2018
2019
2020
5-Year Average
Volume (tBtu)
4 Cornerstone Research | Characteristics of U.S. Natural Gas Transactions—Insights from FERC Form 552 Submissions
Natural Gas Production
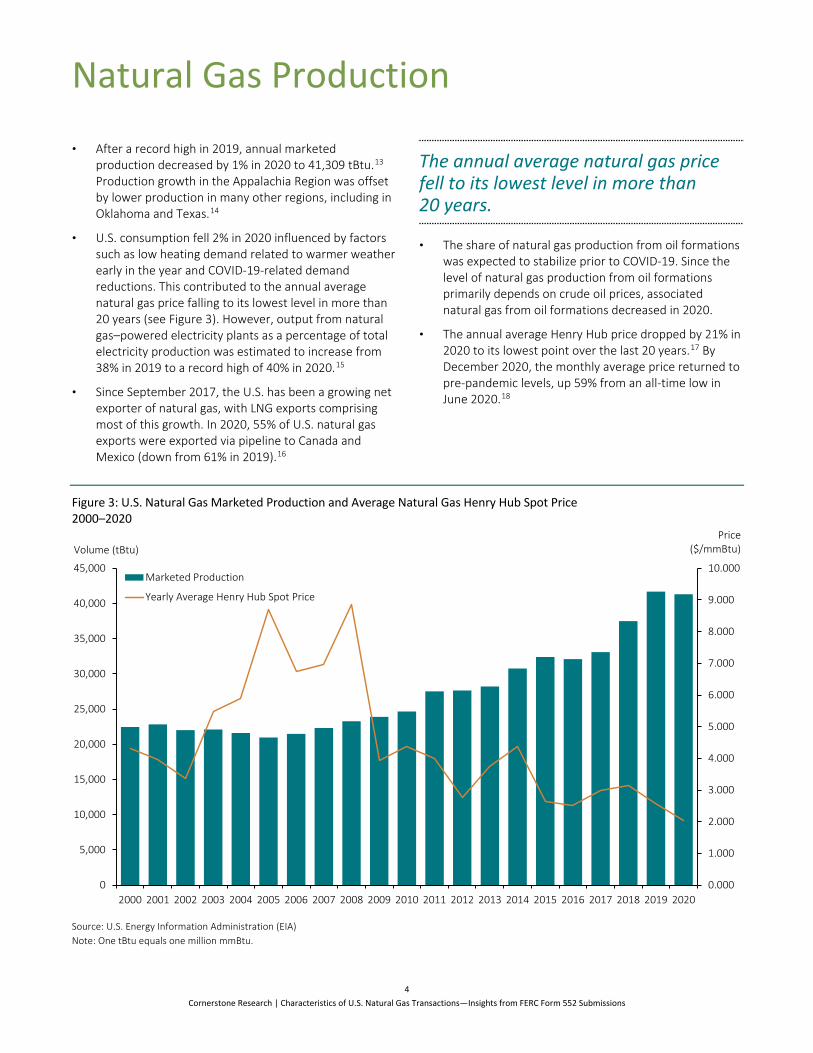
• After a record high in 2019, annual marketed production decreased by 1% in 2020 to 41,309 tBtu.13 Production growth in the Appalachia Region was offset by lower production in many other regions, including in Oklahoma and Texas.14
• U.S. consumption fell 2% in 2020 influenced by factors such as low heating demand related to warmer weather early in the year and COVID-19-related demand reductions. This contributed to the annual average natural gas price falling to its lowest level in more than 20 years (see Figure 3). However, output from natural gas–powered electricity plants as a percentage of total electricity production was estimated to increase from 38% in 2019 to a record high of 40% in 2020.15
• Since September 2017, the U.S. has been a growing net exporter of natural gas, with LNG exports comprising most of this growth. In 2020, 55% of U.S. natural gas exports were exported via pipeline to Canada and Mexico (down from 61% in 2019).16
The annual average natural gas price fell to its lowest level in more than 20 years.
• The share of natural gas production from oil formations was expected to stabilize prior to COVID-19. Since the level of natural gas production from oil formations primarily depends on crude oil prices, associated natural gas from oil formations decreased in 2020.
• The annual average Henry Hub price dropped by 21% in 2020 to its lowest point over the last 20 years.17 By December 2020, the monthly average price returned to pre-pandemic levels, up 59% from an all-time low in June 2020.18
Figure 3: U.S. Natural Gas Marketed Production and Average Natural Gas Henry Hub Spot Price 2000–2020
Source: U.S. Energy Information Administration (EIA) Note: One tBtu equals one million mmBtu.
0.000
1.000
2.000
3.000
4.000
5.000
6.000
7.000
8.000
9.000
10.000
0
5,000
10,000
15,000
20,000
25,000
30,000
35,000
40,000
45,000
2000 2001 2002 2003 2004 2005 2006 2007 2008 2009 2010 2011 2012 2013 2014 2015 2016 2017 2018 2019 2020
Marketed Production
Yearly Average Henry Hub Spot Price
Price ($/mmBtu)Volume (tBtu)
5 Cornerstone Research | Characteristics of U.S. Natural Gas Transactions—Insights from FERC Form 552 Submissions
Liquefied Natural Gas
• Global natural gas demand declined by 1.9% in 2020, while the International Energy Agency (IEA) estimated that global LNG trading grew by 1.4% despite the impact of COVID-19.19 This contrasts with the double-digit LNG annual growth rates of recent years.
• The U.S. exported more than 2,410 billion cubic feet of LNG in 2020, up 31% from 2019, trailing only Australia and Qatar in total exports.20
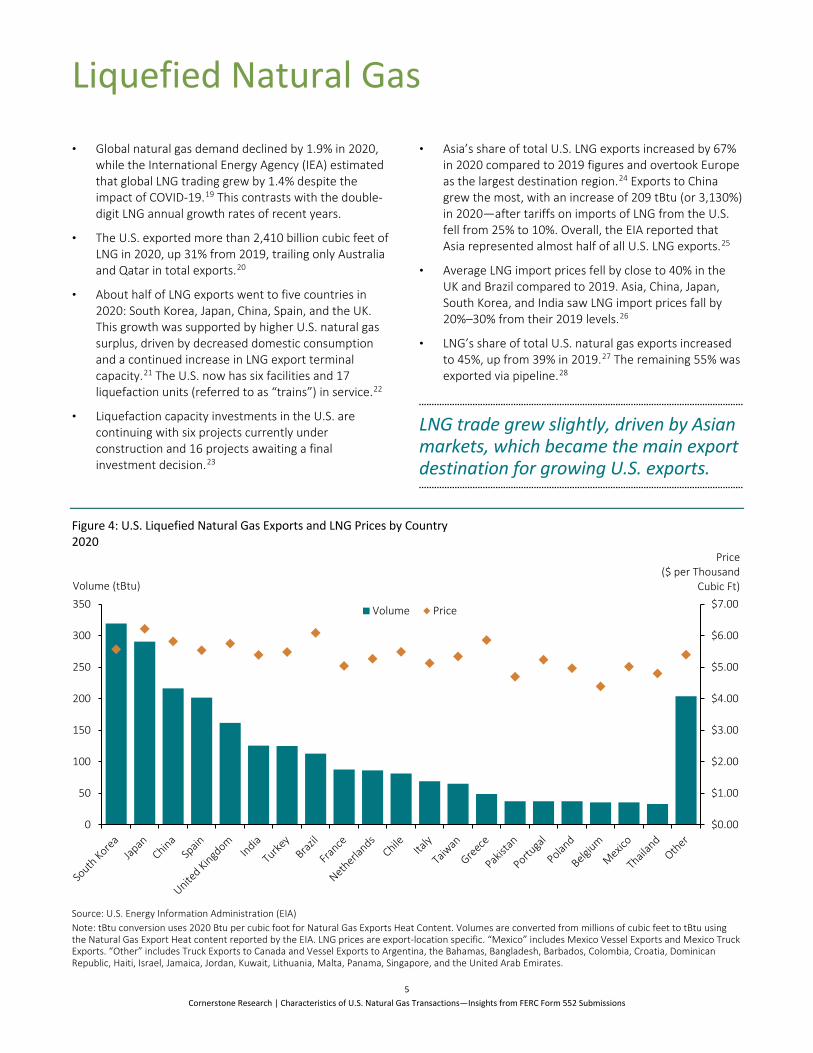
• About half of LNG exports went to five countries in 2020: South Korea, Japan, China, Spain, and the UK. This growth was supported by higher U.S. natural gas surplus, driven by decreased domestic consumption and a continued increase in LNG export terminal capacity.21 The U.S. now has six facilities and 17 liquefaction units (referred to as “trains”) in service.22
• Liquefaction capacity investments in the U.S. are continuing with six projects currently under construction and 16 projects awaiting a final investment decision.23
• Asia’s share of total U.S. LNG exports increased by 67% in 2020 compared to 2019 figures and overtook Europe as the largest destination region.24 Exports to China grew the most, with an increase of 209 tBtu (or 3,130%) in 2020—after tariffs on imports of LNG from the U.S. fell from 25% to 10%. Overall, the EIA reported that Asia represented almost half of all U.S. LNG exports.25
• Average LNG import prices fell by close to 40% in the UK and Brazil compared to 2019. Asia, China, Japan, South Korea, and India saw LNG import prices fall by 20%–30% from their 2019 levels.26
• LNG’s share of total U.S. natural gas exports increased to 45%, up from 39% in 2019.27 The remaining 55% was exported via pipeline.28
LNG trade grew slightly, driven by Asian markets, which became the main export destination for growing U.S. exports.
Figure 4: U.S. Liquefied Natural Gas Exports and LNG Prices by Country 2020
Source: U.S. Energy Information Administration (EIA) Note: tBtu conversion uses 2020 Btu per cubic foot for Natural Gas Exports Heat Content. Volumes are converted from millions of cubic feet to tBtu using the Natural Gas Export Heat content reported by the EIA. LNG prices are export-location specific. “Mexico” includes Mexico Vessel Exports and Mexico Truck Exports. “Other” includes Truck Exports to Canada and Vessel Exports to Argentina, the Bahamas, Bangladesh, Barbados, Colombia, Croatia, Dominican Republic, Haiti, Israel, Jamaica, Jordan, Kuwait, Lithuania, Malta, Panama, Singapore, and the United Arab Emirates.
$0.00
$1.00
$2.00
$3.00
$4.00
$5.00
$6.00
$7.00
0
50
100
150
200
250
300
350
Volume Price
Volume (tBtu)
Price($ per Thousand
Cubic Ft)
Liquefied Natural Gas (continued)
6 Cornerstone Research | Characteristics of U.S. Natural Gas Transactions—Insights from FERC Form 552 Submissions
• Growth of U.S. LNG exports to Europe, while not as strong as in Asia, increased by 12% in 2020, with Greece and the UK registering the largest increases at 231% and 33%, respectively. In contrast, exports to France dropped by 26%.
• U.S. LNG exports to Central and South America declined by 24%.
• The IEA reported a steep drop in natural gas consumption through the first half of 2020 due to the COVID-19 pandemic, with prices plummeting to decade lows across all major gas-consuming regions in Q2 2020.29
High prices in Asia and Europe relative to Henry Hub in late 2020 increased opportunities for interregional arbitrage.
• Henry Hub prices in Q1 2020 reached $1.44/mmBtu in late June, the lowest inflation-adjusted price in over 30 years.30
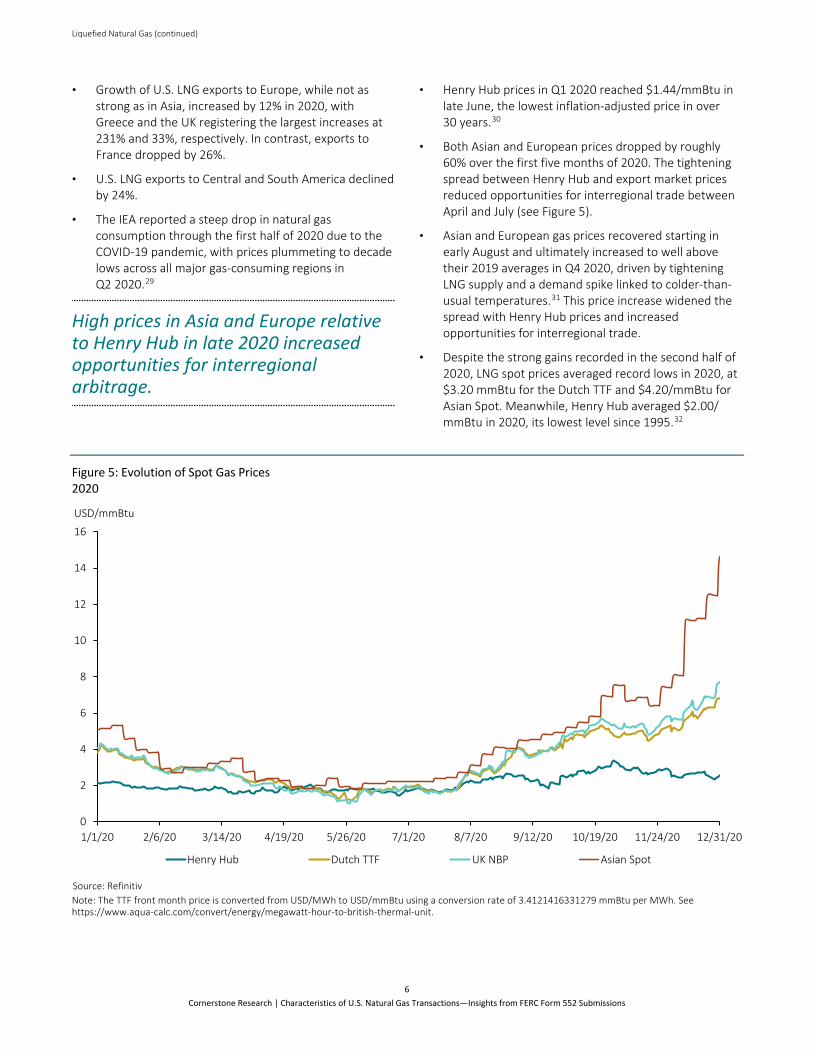
• Both Asian and European prices dropped by roughly 60% over the first five months of 2020. The tightening spread between Henry Hub and export market prices reduced opportunities for interregional trade between April and July (see Figure 5).
• Asian and European gas prices recovered starting in early August and ultimately increased to well above their 2019 averages in Q4 2020, driven by tightening LNG supply and a demand spike linked to colder-than-usual temperatures.31 This price increase widened the spread with Henry Hub prices and increased opportunities for interregional trade.
• Despite the strong gains recorded in the second half of 2020, LNG spot prices averaged record lows in 2020, at $3.20 mmBtu for the Dutch TTF and $4.20/mmBtu for Asian Spot. Meanwhile, Henry Hub averaged $2.00/ mmBtu in 2020, its lowest level since 1995.32
Figure 5: Evolution of Spot Gas Prices 2020
Source: Refinitiv Note: The TTF front month price is converted from USD/MWh to USD/mmBtu using a conversion rate of 3.4121416331279 mmBtu per MWh. See https://www.aqua-calc.com/convert/energy/megawatt-hour-to-british-thermal-unit.
0
2
4
6
8
10
12
14
16
1/1/20 2/6/20 3/14/20 4/19/20 5/26/20 7/1/20 8/7/20 9/12/20 10/19/20 11/24/20 12/31/20
Henry Hub Dutch TTF UK NBP Asian Spot
USD/mmBtu
7 Cornerstone Research | Characteristics of U.S. Natural Gas Transactions—Insights from FERC Form 552 Submissions
Market Volume
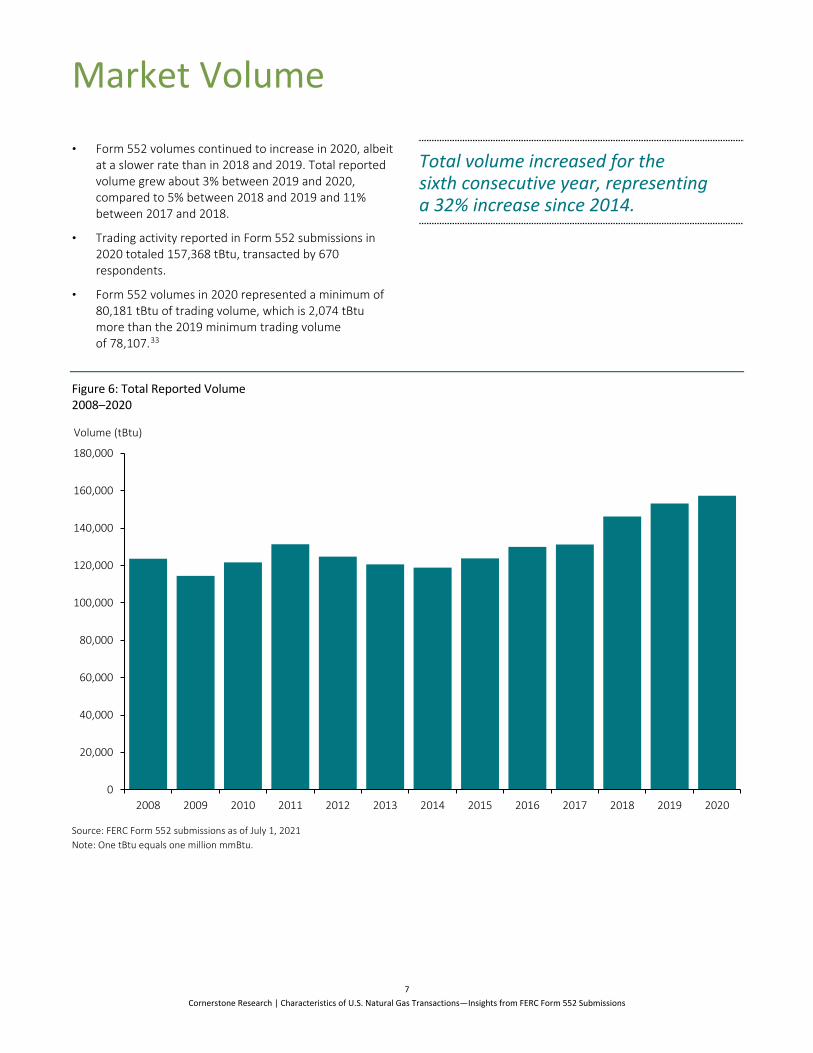
• Form 552 volumes continued to increase in 2020, albeit at a slower rate than in 2018 and 2019. Total reported volume grew about 3% between 2019 and 2020, compared to 5% between 2018 and 2019 and 11% between 2017 and 2018.
• Trading activity reported in Form 552 submissions in 2020 totaled 157,368 tBtu, transacted by 670 respondents.
• Form 552 volumes in 2020 represented a minimum of 80,181 tBtu of trading volume, which is 2,074 tBtu more than the 2019 minimum trading volume of 78,107.33
Total volume increased for the sixth consecutive year, representing a 32% increase since 2014.
Figure 6: Total Reported Volume 2008–2020
Source: FERC Form 552 submissions as of July 1, 2021 Note: One tBtu equals one million mmBtu.
0
20,000
40,000
60,000
80,000
100,000
120,000
140,000
160,000
180,000
2008 2009 2010 2011 2012 2013 2014 2015 2016 2017 2018 2019 2020
Volume (tBtu)
8 Cornerstone Research | Characteristics of U.S. Natural Gas Transactions—Insights from FERC Form 552 Submissions
Exchange Trading
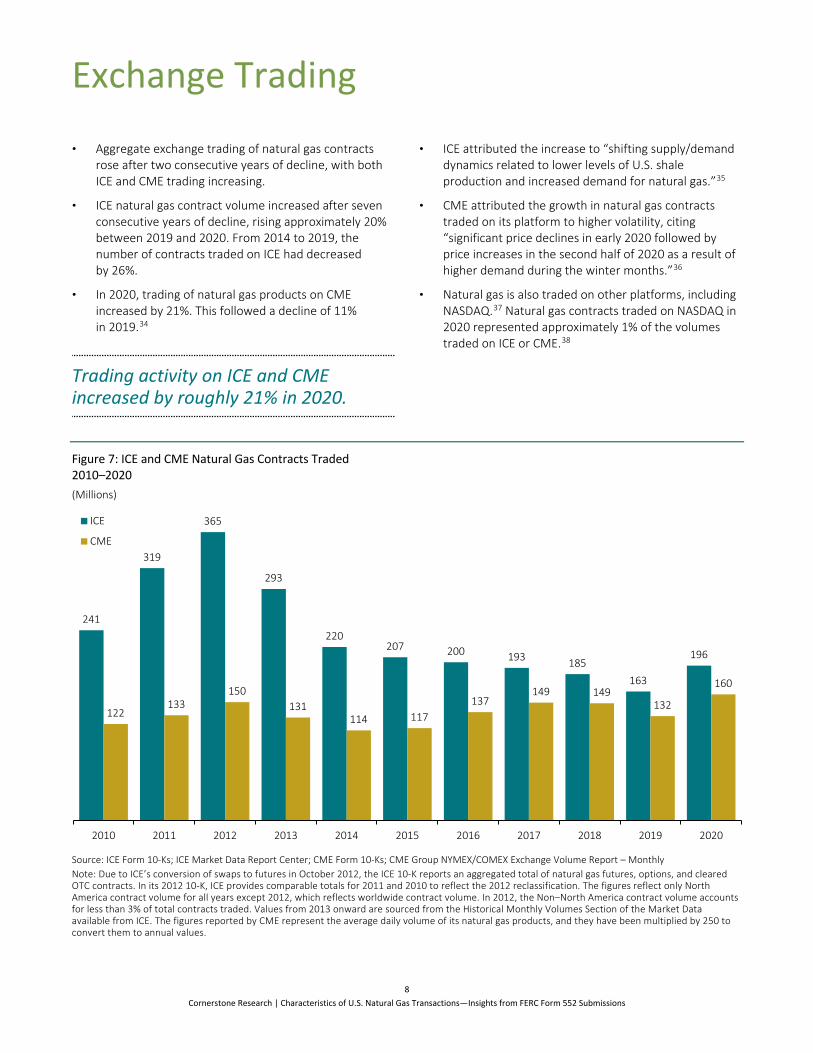
• Aggregate exchange trading of natural gas contracts rose after two consecutive years of decline, with both ICE and CME trading increasing.
• ICE natural gas contract volume increased after seven consecutive years of decline, rising approximately 20% between 2019 and 2020. From 2014 to 2019, the number of contracts traded on ICE had decreased by 26%.
• In 2020, trading of natural gas products on CME increased by 21%. This followed a decline of 11% in 2019.34
Trading activity on ICE and CME increased by roughly 21% in 2020.
• ICE attributed the increase to “shifting supply/demand dynamics related to lower levels of U.S. shale production and increased demand for natural gas.”35
• CME attributed the growth in natural gas contracts traded on its platform to higher volatility, citing “significant price declines in early 2020 followed by price increases in the second half of 2020 as a result of higher demand during the winter months.”36
• Natural gas is also traded on other platforms, including NASDAQ.37 Natural gas contracts traded on NASDAQ in 2020 represented approximately 1% of the volumes traded on ICE or CME.38
Figure 7: ICE and CME Natural Gas Contracts Traded 2010–2020 (Millions)
Source: ICE Form 10-Ks; ICE Market Data Report Center; CME Form 10-Ks; CME Group NYMEX/COMEX Exchange Volume Report – Monthly Note: Due to ICE’s conversion of swaps to futures in October 2012, the ICE 10-K reports an aggregated total of natural gas futures, options, and cleared OTC contracts. In its 2012 10-K, ICE provides comparable totals for 2011 and 2010 to reflect the 2012 reclassification. The figures reflect only North America contract volume for all years except 2012, which reflects worldwide contract volume. In 2012, the Non–North America contract volume accounts for less than 3% of total contracts traded. Values from 2013 onward are sourced from the Historical Monthly Volumes Section of the Market Data available from ICE. The figures reported by CME represent the average daily volume of its natural gas products, and they have been multiplied by 250 to convert them to annual values.
241
319
365
293
220207 200 193 185
163
196
122133
150131
114 117137
149 149132
160
2010 2011 2012 2013 2014 2015 2016 2017 2018 2019 2020
ICE
CME
9 Cornerstone Research | Characteristics of U.S. Natural Gas Transactions—Insights from FERC Form 552 Submissions
Transaction Volume
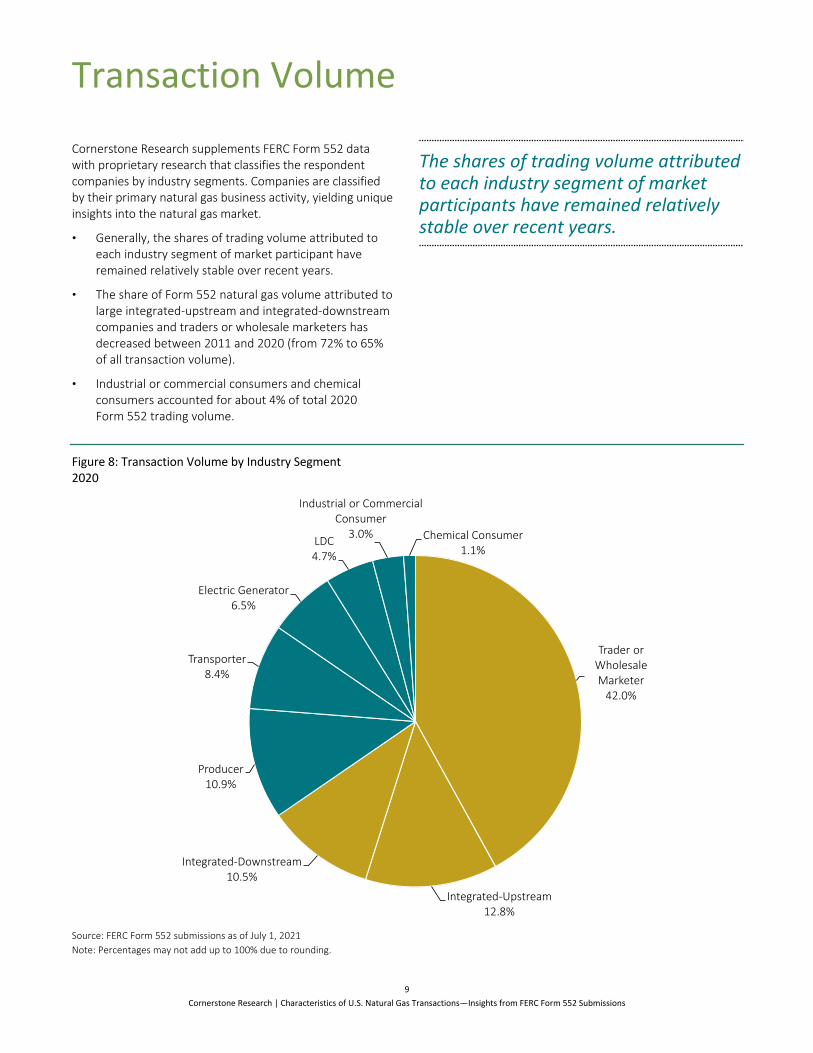
Cornerstone Research supplements FERC Form 552 data with proprietary research that classifies the respondent companies by industry segments. Companies are classified by their primary natural gas business activity, yielding unique insights into the natural gas market.
• Generally, the shares of trading volume attributed to each industry segment of market participant have remained relatively stable over recent years.
• The share of Form 552 natural gas volume attributed to large integrated-upstream and integrated-downstream companies and traders or wholesale marketers has decreased between 2011 and 2020 (from 72% to 65% of all transaction volume).
• Industrial or commercial consumers and chemical consumers accounted for about 4% of total 2020 Form 552 trading volume.
The shares of trading volume attributed to each industry segment of market participants have remained relatively stable over recent years.
Figure 8: Transaction Volume by Industry Segment 2020
Source: FERC Form 552 submissions as of July 1, 2021 Note: Percentages may not add up to 100% due to rounding.
Trader or Wholesale Marketer
42.0%
Integrated-Upstream12.8%
Integrated-Downstream10.5%
Producer10.9%
Transporter8.4%
Electric Generator6.5%
LDC4.7%
Industrial or Commercial Consumer
3.0% Chemical Consumer1.1%
10 Cornerstone Research | Characteristics of U.S. Natural Gas Transactions—Insights from FERC Form 552 Submissions
Purchase and Sale Volume
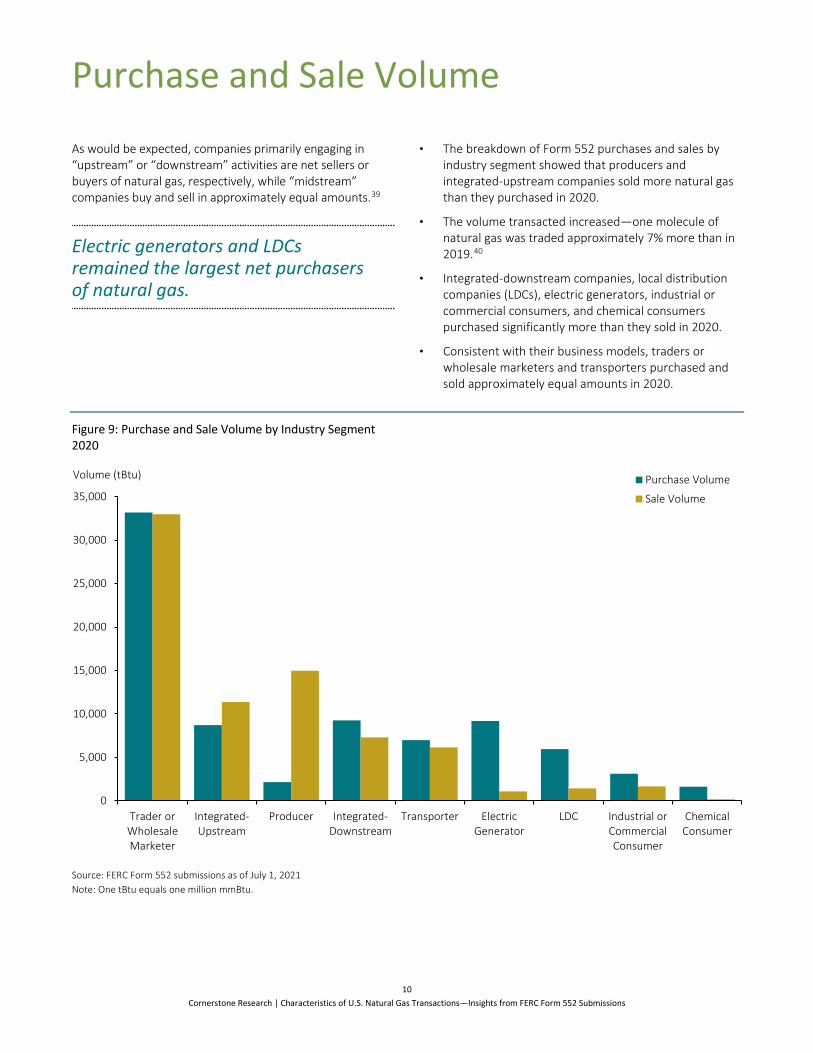
As would be expected, companies primarily engaging in “upstream” or “downstream” activities are net sellers or buyers of natural gas, respectively, while “midstream” companies buy and sell in approximately equal amounts.39
Electric generators and LDCs remained the largest net purchasers of natural gas.
• The breakdown of Form 552 purchases and sales by industry segment showed that producers and integrated-upstream companies sold more natural gas than they purchased in 2020.
• The volume transacted increased—one molecule of natural gas was traded approximately 7% more than in 2019.40
• Integrated-downstream companies, local distribution companies (LDCs), electric generators, industrial or commercial consumers, and chemical consumers purchased significantly more than they sold in 2020.
• Consistent with their business models, traders or wholesale marketers and transporters purchased and sold approximately equal amounts in 2020.
Figure 9: Purchase and Sale Volume by Industry Segment 2020
Source: FERC Form 552 submissions as of July 1, 2021 Note: One tBtu equals one million mmBtu.
0
5,000
10,000
15,000
20,000
25,000
30,000
35,000
Trader orWholesaleMarketer
Integrated-Upstream
Producer Integrated-Downstream
Transporter ElectricGenerator
LDC Industrial orCommercialConsumer
ChemicalConsumer
Purchase Volume
Sale Volume
Volume (tBtu)
11 Cornerstone Research | Characteristics of U.S. Natural Gas Transactions—Insights from FERC Form 552 Submissions
Top 20 Companies
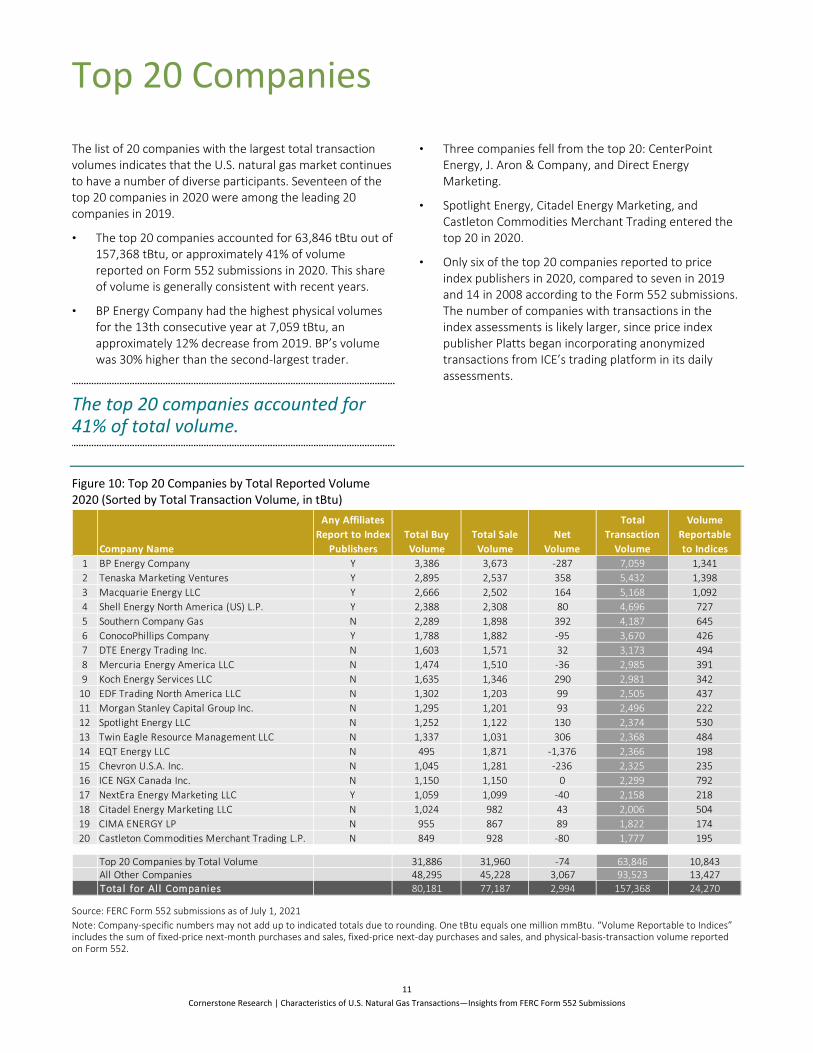
The list of 20 companies with the largest total transaction volumes indicates that the U.S. natural gas market continues to have a number of diverse participants. Seventeen of the top 20 companies in 2020 were among the leading 20 companies in 2019.
• The top 20 companies accounted for 63,846 tBtu out of 157,368 tBtu, or approximately 41% of volume reported on Form 552 submissions in 2020. This share of volume is generally consistent with recent years.
• BP Energy Company had the highest physical volumes for the 13th consecutive year at 7,059 tBtu, an approximately 12% decrease from 2019. BP’s volume was 30% higher than the second-largest trader.
The top 20 companies accounted for 41% of total volume.
• Three companies fell from the top 20: CenterPoint Energy, J. Aron & Company, and Direct Energy Marketing.
• Spotlight Energy, Citadel Energy Marketing, and Castleton Commodities Merchant Trading entered the top 20 in 2020.
• Only six of the top 20 companies reported to price index publishers in 2020, compared to seven in 2019 and 14 in 2008 according to the Form 552 submissions. The number of companies with transactions in the index assessments is likely larger, since price index publisher Platts began incorporating anonymized transactions from ICE’s trading platform in its daily assessments.
Figure 10: Top 20 Companies by Total Reported Volume 2020 (Sorted by Total Transaction Volume, in tBtu)
Source: FERC Form 552 submissions as of July 1, 2021 Note: Company-specific numbers may not add up to indicated totals due to rounding. One tBtu equals one million mmBtu. “Volume Reportable to Indices” includes the sum of fixed-price next-month purchases and sales, fixed-price next-day purchases and sales, and physical-basis-transaction volume reported on Form 552.
Company Name
Any Affiliates Report to Index
PublishersTotal BuyVolume
Total Sale Volume
NetVolume
Total Transaction
Volume
Volume Reportable to Indices
1 BP Energy Company Y 3,386 3,673 -287 7,059 1,3412 Tenaska Marketing Ventures Y 2,895 2,537 358 5,432 1,3983 Macquarie Energy LLC Y 2,666 2,502 164 5,168 1,0924 Shell Energy North America (US) L.P. Y 2,388 2,308 80 4,696 7275 Southern Company Gas N 2,289 1,898 392 4,187 6456 ConocoPhillips Company Y 1,788 1,882 -95 3,670 4267 DTE Energy Trading Inc. N 1,603 1,571 32 3,173 4948 Mercuria Energy America LLC N 1,474 1,510 -36 2,985 3919 Koch Energy Services LLC N 1,635 1,346 290 2,981 342
10 EDF Trading North America LLC N 1,302 1,203 99 2,505 43711 Morgan Stanley Capital Group Inc. N 1,295 1,201 93 2,496 22212 Spotlight Energy LLC N 1,252 1,122 130 2,374 53013 Twin Eagle Resource Management LLC N 1,337 1,031 306 2,368 48414 EQT Energy LLC N 495 1,871 -1,376 2,366 19815 Chevron U.S.A. Inc. N 1,045 1,281 -236 2,325 23516 ICE NGX Canada Inc. N 1,150 1,150 0 2,299 79217 NextEra Energy Marketing LLC Y 1,059 1,099 -40 2,158 21818 Citadel Energy Marketing LLC N 1,024 982 43 2,006 50419 CIMA ENERGY LP N 955 867 89 1,822 17420 Castleton Commodities Merchant Trading L.P. N 849 928 -80 1,777 195
Top 20 Companies by Total Volume 31,886 31,960 -74 63,846 10,843All Other Companies 48,295 45,228 3,067 93,523 13,427Total for Al l Companies 80,181 77,187 2,994 157,368 24,270
12 Cornerstone Research | Characteristics of U.S. Natural Gas Transactions—Insights from FERC Form 552 Submissions
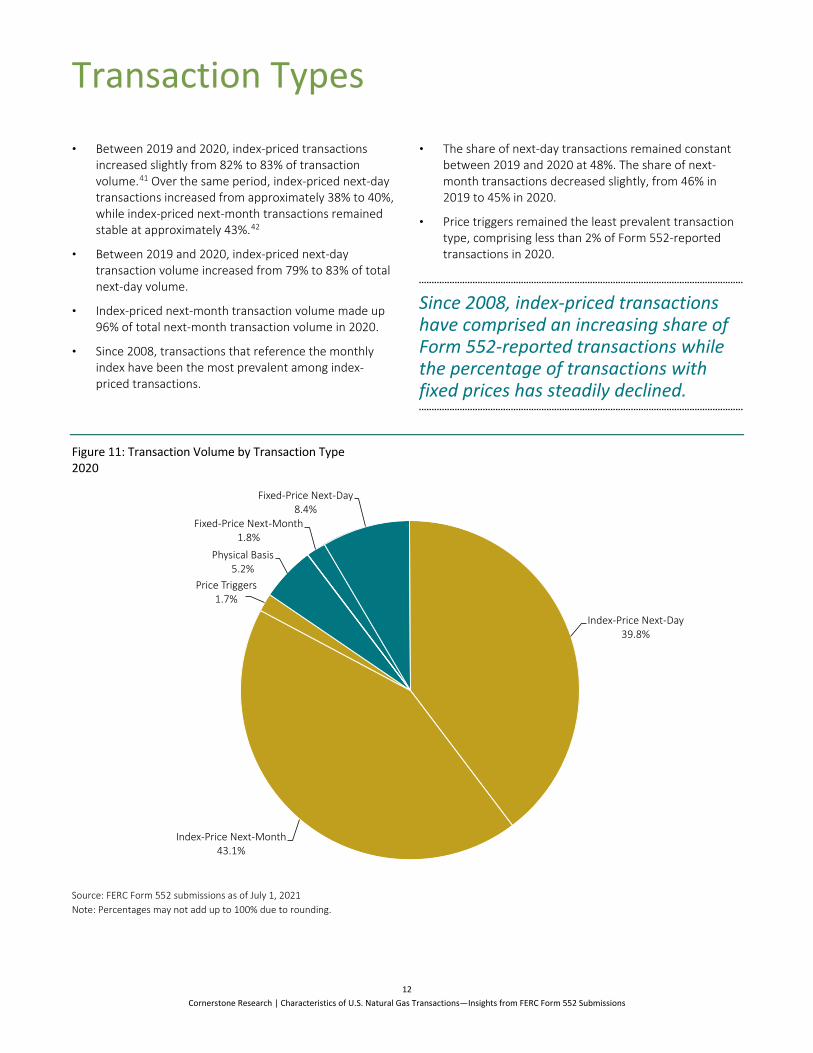
Transaction Types
• Between 2019 and 2020, index-priced transactions increased slightly from 82% to 83% of transaction volume.41 Over the same period, index-priced next-day transactions increased from approximately 38% to 40%, while index-priced next-month transactions remained stable at approximately 43%.42
• Between 2019 and 2020, index-priced next-day transaction volume increased from 79% to 83% of total next-day volume.
• Index-priced next-month transaction volume made up 96% of total next-month transaction volume in 2020.
• Since 2008, transactions that reference the monthly index have been the most prevalent among index-priced transactions.
• The share of next-day transactions remained constant between 2019 and 2020 at 48%. The share of next-month transactions decreased slightly, from 46% in 2019 to 45% in 2020.
• Price triggers remained the least prevalent transaction type, comprising less than 2% of Form 552-reported transactions in 2020.
Since 2008, index-priced transactions have comprised an increasing share of Form 552-reported transactions while the percentage of transactions with fixed prices has steadily declined.
Figure 11: Transaction Volume by Transaction Type 2020
Source: FERC Form 552 submissions as of July 1, 2021 Note: Percentages may not add up to 100% due to rounding.
Fixed-Price Next-Month1.8%
Fixed-Price Next-Day8.4%
Index-Price Next-Day39.8%
Index-Price Next-Month43.1%
Price Triggers1.7%
Physical Basis5.2%
Transaction Types (continued)
13 Cornerstone Research | Characteristics of U.S. Natural Gas Transactions—Insights from FERC Form 552 Submissions
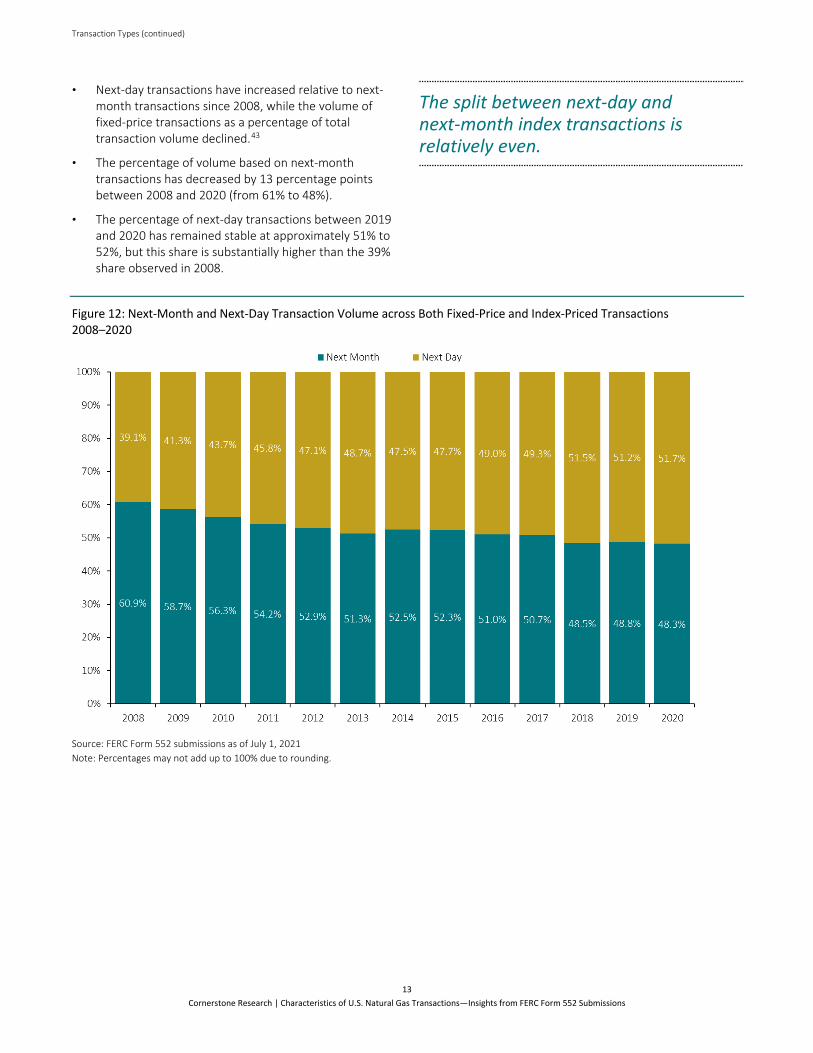
• Next-day transactions have increased relative to next-month transactions since 2008, while the volume of fixed-price transactions as a percentage of total transaction volume declined.43
• The percentage of volume based on next-month transactions has decreased by 13 percentage points between 2008 and 2020 (from 61% to 48%).
• The percentage of next-day transactions between 2019 and 2020 has remained stable at approximately 51% to 52%, but this share is substantially higher than the 39% share observed in 2008.
The split between next-day and next-month index transactions is relatively even.
Figure 12: Next-Month and Next-Day Transaction Volume across Both Fixed-Price and Index-Priced Transactions 2008–2020
Source: FERC Form 552 submissions as of July 1, 2021 Note: Percentages may not add up to 100% due to rounding.
14 Cornerstone Research | Characteristics of U.S. Natural Gas Transactions—Insights from FERC Form 552 Submissions
Reporting to Price Index Publishers
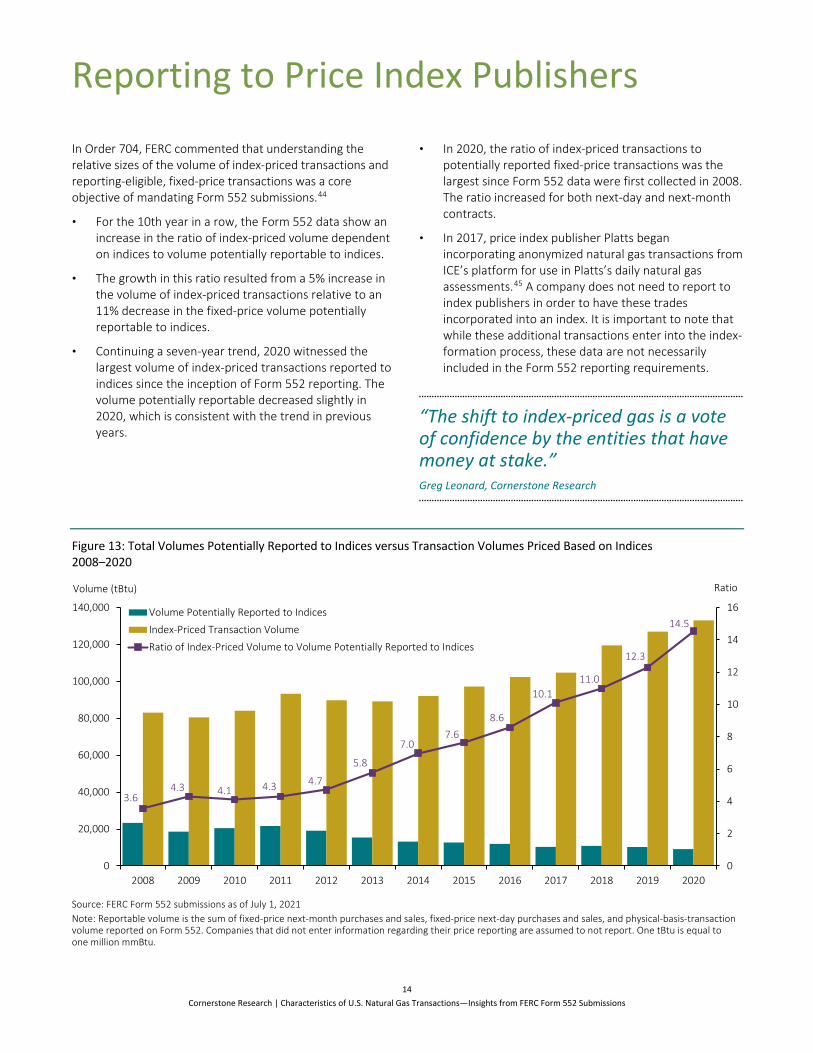
In Order 704, FERC commented that understanding the relative sizes of the volume of index-priced transactions and reporting-eligible, fixed-price transactions was a core objective of mandating Form 552 submissions.44
• For the 10th year in a row, the Form 552 data show an increase in the ratio of index-priced volume dependent on indices to volume potentially reportable to indices.
• The growth in this ratio resulted from a 5% increase in the volume of index-priced transactions relative to an 11% decrease in the fixed-price volume potentially reportable to indices.
• Continuing a seven-year trend, 2020 witnessed the largest volume of index-priced transactions reported to indices since the inception of Form 552 reporting. The volume potentially reportable decreased slightly in 2020, which is consistent with the trend in previous years.
• In 2020, the ratio of index-priced transactions to potentially reported fixed-price transactions was the largest since Form 552 data were first collected in 2008. The ratio increased for both next-day and next-month contracts.
• In 2017, price index publisher Platts began incorporating anonymized natural gas transactions from ICE’s platform for use in Platts’s daily natural gas assessments.45 A company does not need to report to index publishers in order to have these trades incorporated into an index. It is important to note that while these additional transactions enter into the index-formation process, these data are not necessarily included in the Form 552 reporting requirements.
“The shift to index-priced gas is a vote of confidence by the entities that have money at stake.” Greg Leonard, Cornerstone Research
Figure 13: Total Volumes Potentially Reported to Indices versus Transaction Volumes Priced Based on Indices 2008–2020
Source: FERC Form 552 submissions as of July 1, 2021 Note: Reportable volume is the sum of fixed-price next-month purchases and sales, fixed-price next-day purchases and sales, and physical-basis-transaction volume reported on Form 552. Companies that did not enter information regarding their price reporting are assumed to not report. One tBtu is equal to one million mmBtu.
3.64.3 4.1 4.3 4.7
5.8
7.07.6
8.6
10.111.0
12.3
14.5
0
2
4
6
8
10
12
14
16
0
20,000
40,000
60,000
80,000
100,000
120,000
140,000
2008 2009 2010 2011 2012 2013 2014 2015 2016 2017 2018 2019 2020
Volume Potentially Reported to Indices
Index-Priced Transaction Volume
Ratio of Index-Priced Volume to Volume Potentially Reported to Indices
Volume (tBtu)
Ratio
Reporting to Price Index Publishers (continued)
15 Cornerstone Research | Characteristics of U.S. Natural Gas Transactions—Insights from FERC Form 552 Submissions
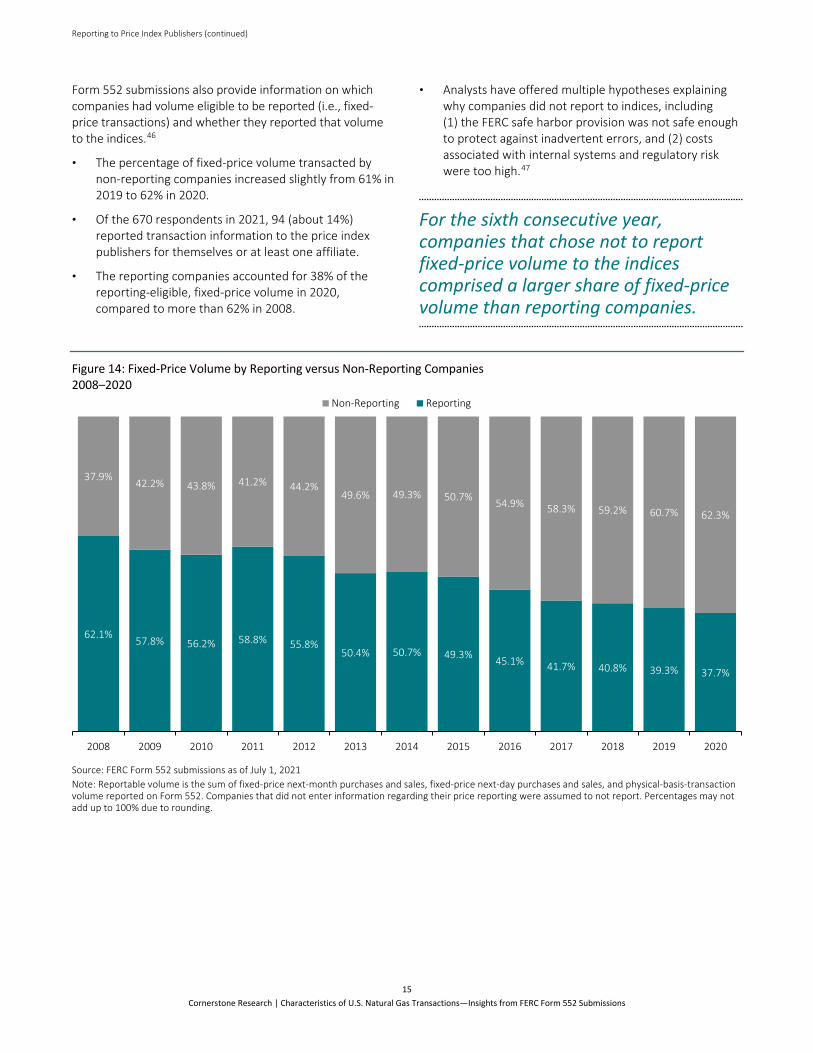
Form 552 submissions also provide information on which companies had volume eligible to be reported (i.e., fixed-price transactions) and whether they reported that volume to the indices.46
• The percentage of fixed-price volume transacted by non-reporting companies increased slightly from 61% in 2019 to 62% in 2020.
• Of the 670 respondents in 2021, 94 (about 14%) reported transaction information to the price index publishers for themselves or at least one affiliate.
• The reporting companies accounted for 38% of the reporting-eligible, fixed-price volume in 2020, compared to more than 62% in 2008.
• Analysts have offered multiple hypotheses explaining why companies did not report to indices, including (1) the FERC safe harbor provision was not safe enough to protect against inadvertent errors, and (2) costs associated with internal systems and regulatory risk were too high.47
For the sixth consecutive year, companies that chose not to report fixed-price volume to the indices comprised a larger share of fixed-price volume than reporting companies.
Figure 14: Fixed-Price Volume by Reporting versus Non-Reporting Companies 2008–2020
Source: FERC Form 552 submissions as of July 1, 2021 Note: Reportable volume is the sum of fixed-price next-month purchases and sales, fixed-price next-day purchases and sales, and physical-basis-transaction volume reported on Form 552. Companies that did not enter information regarding their price reporting were assumed to not report. Percentages may not add up to 100% due to rounding.
62.1% 57.8% 56.2% 58.8% 55.8%50.4% 50.7% 49.3% 45.1% 41.7% 40.8% 39.3% 37.7%
37.9% 42.2% 43.8% 41.2% 44.2%49.6% 49.3% 50.7% 54.9% 58.3% 59.2% 60.7% 62.3%
2008 2009 2010 2011 2012 2013 2014 2015 2016 2017 2018 2019 2020
Non-Reporting Reporting
16 Cornerstone Research | Characteristics of U.S. Natural Gas Transactions—Insights from FERC Form 552 Submissions
Fixed Price Volume by Industry Segments
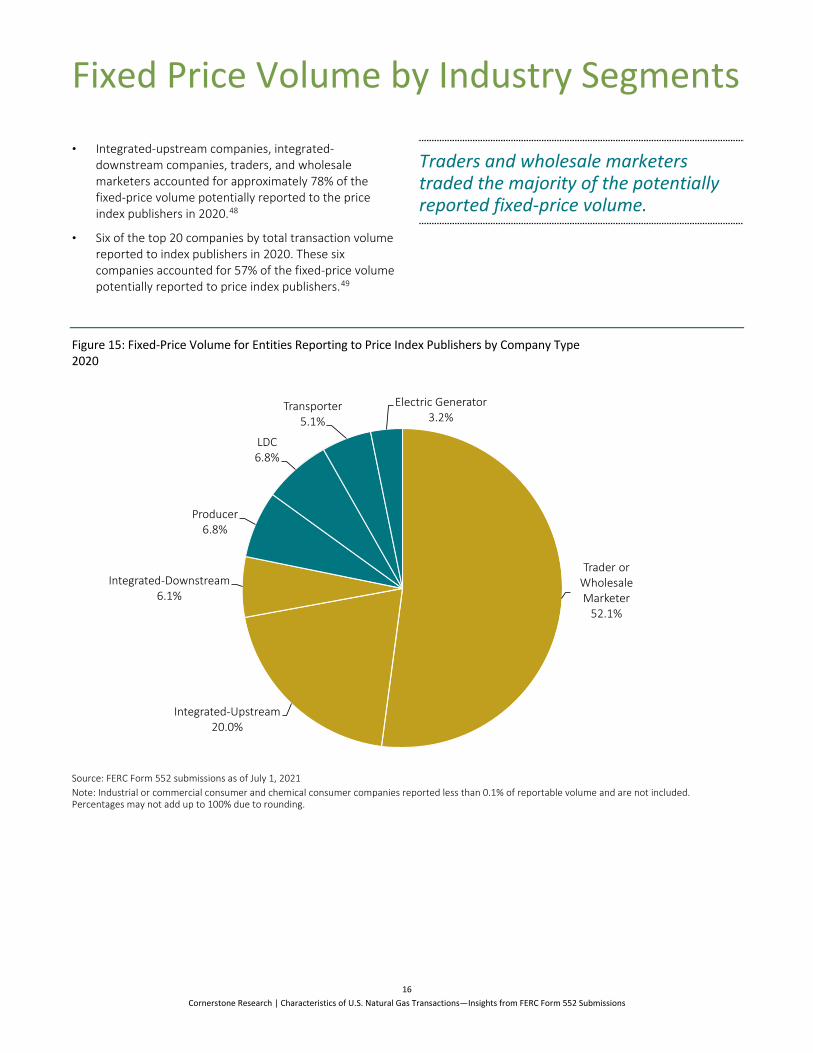
• Integrated-upstream companies, integrated-downstream companies, traders, and wholesale marketers accounted for approximately 78% of the fixed-price volume potentially reported to the price index publishers in 2020.48
• Six of the top 20 companies by total transaction volume reported to index publishers in 2020. These six companies accounted for 57% of the fixed-price volume potentially reported to price index publishers.49
Traders and wholesale marketers traded the majority of the potentially reported fixed-price volume.
Figure 15: Fixed-Price Volume for Entities Reporting to Price Index Publishers by Company Type 2020
Source: FERC Form 552 submissions as of July 1, 2021 Note: Industrial or commercial consumer and chemical consumer companies reported less than 0.1% of reportable volume and are not included. Percentages may not add up to 100% due to rounding.
Trader or Wholesale Marketer
52.1%
Integrated-Upstream20.0%
Integrated-Downstream6.1%
Producer6.8%
LDC6.8%
Transporter5.1%
Electric Generator3.2%
Fixed Price Volume by Industry Segments (continued)
17 Cornerstone Research | Characteristics of U.S. Natural Gas Transactions—Insights from FERC Form 552 Submissions
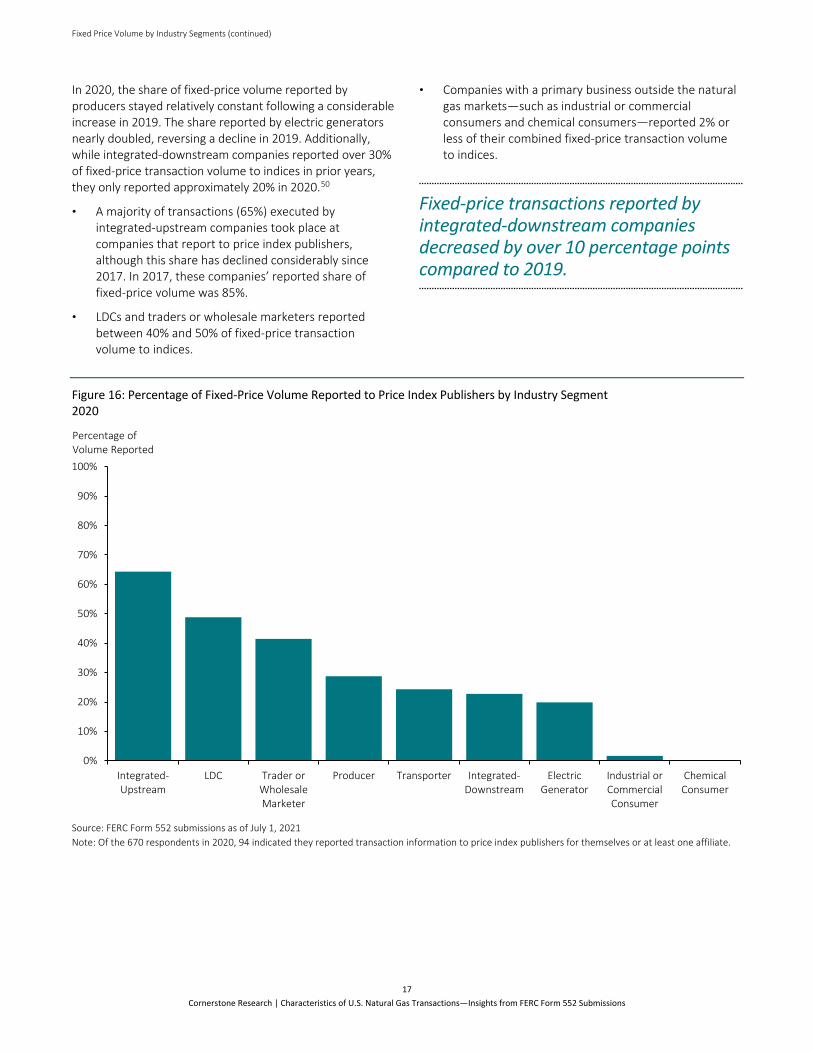
In 2020, the share of fixed-price volume reported by producers stayed relatively constant following a considerable increase in 2019. The share reported by electric generators nearly doubled, reversing a decline in 2019. Additionally, while integrated-downstream companies reported over 30% of fixed-price transaction volume to indices in prior years, they only reported approximately 20% in 2020.50
• A majority of transactions (65%) executed by integrated-upstream companies took place at companies that report to price index publishers, although this share has declined considerably since 2017. In 2017, these companies’ reported share of fixed-price volume was 85%.
• LDCs and traders or wholesale marketers reported between 40% and 50% of fixed-price transaction volume to indices.
• Companies with a primary business outside the natural gas markets—such as industrial or commercial consumers and chemical consumers—reported 2% or less of their combined fixed-price transaction volume to indices.
Fixed-price transactions reported by integrated-downstream companies decreased by over 10 percentage points compared to 2019.
Figure 16: Percentage of Fixed-Price Volume Reported to Price Index Publishers by Industry Segment 2020
Source: FERC Form 552 submissions as of July 1, 2021 Note: Of the 670 respondents in 2020, 94 indicated they reported transaction information to price index publishers for themselves or at least one affiliate.
0%
10%
20%
30%
40%
50%
60%
70%
80%
90%
100%
Integrated-Upstream
LDC Trader orWholesaleMarketer
Producer Transporter Integrated-Downstream
ElectricGenerator
Industrial orCommercialConsumer
ChemicalConsumer
Percentage of Volume Reported
18 Cornerstone Research | Characteristics of U.S. Natural Gas Transactions—Insights from FERC Form 552 Submissions
Glossary
Btu: A British thermal unit (Btu) is the amount of heat energy needed to raise the temperature of one pound of water by one degree Fahrenheit. Millions of this unit are written as mmBtu, and trillions as tBtu.
CME Group Inc. (CME): A “diverse derivatives marketplace” that offers “global benchmark products across all major asset classes” so that businesses can “manage risk and achieve growth.” https://www.cmegroup.com/company/history/
Downstream: “A term used in the petroleum industry referring to the refining, transportation, and marketing side of the business.” https://www.energy.ca.gov/resources/energy-glossary
Dutch Title Transfer Facility (TTF): A principal natural gas trading hub in Europe. It is the virtual trading hub for the natural gas market in the Netherlands. The TTF “has become the unrivaled leading hub in the European gas market landscape, leaving the UK NBP (‘National Balancing Point’—the TTF equivalent for the UK) and other hubs far behind.” https://www.cmegroup.com/education/articles-and-reports/a-story-of-success-the-evolution-of-ttf-trading.html
EIA: U.S. Energy Information Administration. “EIA provides a wide range of information and data products covering energy production, stocks, demand, imports, exports, and prices; and prepares analyses and special reports on topics of current interest.” http://www.eia.gov/about/
FERC Form 552: Annual Report of Natural Gas Transactions. “FERC Form No. 552 collects transactional information from natural gas market participants. The filing of this information is necessary to provide information regarding physical natural gas transactions that use an index and transactions that contribute to, or may contribute to gas price indices. This form is considered to be a non-confidential public use form.” https://www.ferc.gov/sites/default/files/2020-04/form-552.pdf
Fixed price: “A ‘Physical Natural Gas Transaction’ price determined by agreement between buyer and seller and not benchmarked to any other source of information.” https://www.ferc.gov/sites/default/files/2020-04/form-552.pdf
Fixed-price, next-day transaction: “[D]elivery of natural gas pursuant to a transaction executed prior to NAESB [North American Energy Standards Board] nomination deadline (1:00 pm Central Prevailing Time) on one day for uniform physical delivery over the next pipeline day.” https://www.ferc.gov/sites/default/files/2020-04/form-552.pdf
Fixed-price, next-month transaction: “[D]elivery of natural gas pursuant to a transaction executed during the last five (5) business days of one month (bidweek) for uniform physical delivery over the next month.” https://www.ferc.gov/sites/default/files/2020-04/form-552.pdf
Gross withdrawals: “Full well stream volume from both oil and gas wells, including all natural gas plant liquids and nonhydrocarbon gases after oil, lease condensate, and water have been removed. Also includes production delivered as royalty payments and production used as fuel on the lease.” https://www.eia.gov/tools/glossary/?id=gross_withdrawals
Henry Hub: A principal natural gas trading hub in North America, with connections to nine interstate and four intrastate pipelines. Henry Hub serves as the delivery point for the U.S. natural gas futures contract traded on the New York Mercantile Exchange (NYMEX). https://www.theice.com/publicdocs/ICE_NatGas_Brochure.pdf; http://www.cmegroup.com/trading/energy/natural-gas/natural-gas_contract_specifications.html
Intercontinental Exchange Inc. (ICE): An “electronic marketplace” that connects participants in major markets and offers “the ability to manage risk and make informed decisions.” https://www.intercontinentalexchange.com/about
Index price: A price obtained from an industry publication, which is intended to represent an average price of gas delivered to a specific point on the pipeline at or during a specified period of time.
Liquefied natural gas (LNG): “Natural gas (primarily methane) that has been liquefied by reducing its temperature to [negative] 260 degrees Fahrenheit at atmospheric pressure.” http://www.eia.gov/tools/glossary/index.cfm?id=L
Glossary (continued)
19 Cornerstone Research | Characteristics of U.S. Natural Gas Transactions—Insights from FERC Form 552 Submissions
Local distribution company (LDC): “A legal entity engaged primarily in the retail sale and/or delivery of natural gas through a distribution system that includes main lines (that is, pipelines designed to carry large volumes of gas, usually located under roads or other major right-of-ways) and laterals (that is, pipelines of smaller diameter that connect the end user to the mainline). Since [the] structuring of the gas industry, the sale of gas and/or delivery arrangements may be handled by other agents, such as producers, brokers, and marketers that are referred to as ‘non-LDC.’” http://www.eia.gov/tools/glossary/index.cfm?id=L
Marketed production: “Gross withdrawals less gas used for repressuring, quantities vented and flared, and nonhydrocarbon gases removed in treating or processing operations. Includes all quantities of gas used in field and processing plant operations.” https://www.eia.gov/tools/glossary/index.php?id=M
Midstream: Activity involving “transportation on intrastate and interstate pipeline systems,” “processing the gas to remove liquids and impurities,” and “storage facilities.” https://www.ferc.gov/sites/default/files/2020-06/energy-primer-2020.pdf
Natural gas plant liquids (NGPL): “Those hydrocarbons in natural gas that are separated as liquids at natural gas processing, fractionating, and cycling plants. Products obtained include ethane, liquefied petroleum gases (propane, normal butane, and isobutane), and natural gasoline.” https://www.eia.gov/tools/glossary/index.php?id=N
Physical-basis transactions: “[T]ransactions in which the basis value is negotiated on one of the first three days of bidweek and the price is set by the final closing value of the near-month NYMEX Natural Gas Futures contract plus or minus the negotiated basis. These transactions are for uniform physical delivery over the next month.” https://www.ferc.gov/sites/default/files/2020-04/form-552.pdf
Price trigger: According to FERC Form 552, a trigger agreement is “a NYMEX trigger transaction that is contingent upon a futures contract that trades on an exchange, resulting in an automatic physical trade at an agreed upon price.” https://www.ferc.gov/sites/default/files/2020-04/form-552.pdf
Shale gas: “Natural gas produced from wells that are open to shale formations. Shale is a fine-grained, sedimentary rock composed of mud from flakes of clay minerals and tiny fragments (silt-sized particles) of other materials. The shale acts as both the source and the reservoir for the natural gas.” https://www.eia.gov/tools/glossary/index.php?id=S
Upstream: “A term used in the petroleum industry referring to the exploration and production side of the business.” https://www.energy.ca.gov/resources/energy-glossary
20 Cornerstone Research | Characteristics of U.S. Natural Gas Transactions—Insights from FERC Form 552 Submissions
Appendices
Appendix 1: Energy Policy Act of 2005, Form 552 Submissions, and Cornerstone Research’s Proprietary Analysis
In 2005, Congress passed the Energy Policy Act of 2005 (EPAct 2005), which authorized FERC to “facilitate price transparency in markets for the sale or transportation of physical natural gas in interstate commerce” (§ 316). The EPAct 2005 allowed FERC to issue rules to “provide for the dissemination, on a timely basis, of information about the availability and prices of natural gas sold at wholesale and in interstate commerce to the Commission, State commissions, buyers and sellers of wholesale natural gas, and the public” (§ 316). After an extensive rule-making process, FERC issuedOrder 704-A, which established reporting requirements.
In the summer of 2009, FERC received the first round of Form 552 submissions covering 2008 natural gas transactions from more than 1,121 respondents. On June 17, 2010, FERC issued Order 704-C, which provided for slightly revised reporting rules that eased some reporting requirements.51 For 2020 natural gas transactions, Form 552 submissions covered 670 firms.
The data contained on the Form 552 submissions, described more fully in Appendix 2, provide a unique view into the size and nature of the physical natural gas market. First, these forms quantify the number of trade participants and trade volumes of firms that report to the price index publishers. Second, the data provide insight into the relative proportion of fixed-price and index-priced transactions. Third, while FERC did not request information on all natural gas transactions, the data yield an outline of the size of the physical natural gas market, especially at the trading and wholesale levels.
Cornerstone Research supplements the FERC Form 552 data with proprietary research that classifies the respondent companies by industry segments. These industry segments are producer, transporter, electric generator, industrial or commercial consumer, chemical consumer, trader or wholesale marketer, LDC, integrated-downstream, and integrated-upstream.52 The latter two categories capture companies that span multiple industry segments.53
Appendix 2: Data Submitted to FERC
Order 704-C requires natural gas market participants with purchases or sales of physical “reportable” natural gas of at least 2.2 tBtu in the prior calendar year to report these activities on Form 552. Specifically, these market participants must submit volumes of physical natural gas transactions that “are only those transactions that refer to an index, or that contribute to, or could contribute to the formation of a gas index during the calendar year.”54 Order 704-A (p. 9) further defines the transactions that could be reported to an index publisher as any “bilateral, arms-length, fixed[-]price physical natural gas transactions between nonaffiliated companies at all trading locations.”
Order 704-C excludes any transaction that does not depend on a published price index or that could not be reported to a price index publisher. The criteria for reporting to a price index publisher specifically exclude transactions for balance-of-month supply, intraday trades consummated after the pipeline nomination deadline, monthly fixed-price transactions conducted prior to bidweek, fixed-price
transactions for terms longer than one month, and fixed-price transactions including other services or features (such as volume flexibility) that would render them ineligible for price reporting. Further, Order 704-C excludes transactions by affiliates from the submission requirements.
While respondents aggregate their reported transaction volumes across locations and for the entire calendar year, they must submit purchase and sale volumes separately for each of the following types of transactions: fixed-price for next-day delivery; index-price referencing next-day indices; fixed-price for next-month delivery; and index-price referencing next-month indices, transactions with price triggers,55 and physical-basis transactions.56 In addition to volumes of physical transactions, market participants are required to state whether they report transaction information to the price index publishers.
Endnotes 1 Data as of July 1, 2021, were used for all respondents. 2 A respondent is defined as a unique reporting company-respondent combination as reported on FERC Form 552. 3 Calculated as minimum trading volume of 80,181 tBtu from Figure 10 divided by 28,753 tBtu of natural gas delivered to consumers
reported by the EIA. See Endnote 33 for an explanation of how minimum trading volume is calculated from Figure 10. “U.S. Natural Gas Consumption by End Use,” EIA, http://www.eia.gov/dnav/ng/NG_CONS_SUM_DCU_NUS_A.htm. Converted to trillion Btu (tBtu) from million cubic feet (mmcf). One cubic foot = 1,037 Btu, the annual Total Consumption conversion factor in the EIA time series “Approximate Heat Content of Natural Gas (Btu per Cubic Foot),” EIA, https://www.eia.gov/dnav/ng/ng_cons_heat_dcu_nus_a.htm.
4 “Annual Energy Outlook 2021,” EIA, February 3, 2021, https://www.eia.gov/outlooks/aeo/pdf/AEO_Narrative_2021.pdf. 5 “Short-Term Energy Outlook (STEO),” EIA, July 7, 2020, https://www.eia.gov/outlooks/steo/archives/jul20.pdf (“2020 EIA STEO
Report”). 6 “Short-Term Energy Outlook (STEO),” EIA, July 7, 2021, https://www.eia.gov/outlooks/steo/archives/jul21.pdf (“2021 July EIA STEO
Report”). 7 2021 July EIA STEO Report. 8 “Gas Market Report Q2-2021,” IEA, p. 10, https://iea.blob.core.windows.net/assets/5aa5170d-8dcd-4b99-b8b9-
c761ad3a84ed/GasMarketReportQ22021.pdf. 9 Percentage for 2019: 1,819,399 mmcf total LNG exports / 4,656,324 mmcf total natural gas exports = 39%. Percentage for 2020:
2,389,838 mmcf total LNG exports / 5,281,017 mmcf total natural gas exports = 45%. See “ U.S. Natural Gas Exports and Re-Exports by Country,” EIA, accessed July 31, 2021, https://www.eia.gov/dnav/ng/NG_MOVE_EXPC_S1_A.htm (“EIA U.S. Natural Gas Exports Data”).
10 EIA U.S. Natural Gas Exports Data. 11 “Annual Energy Outlook 2021 Table 13,” EIA, accessed August 27, 2021, https://www.eia.gov/outlooks/aeo/data/browser/#/?id=13-
AEO2021&sourcekey=0; “Annual Energy Outlook 2021 Table 13,” EIA, accessed August 27, 2021, https://www.eia.gov/outlooks/aeo/data/browser/#/?id=13-AEO2020&sourcekey=0.
12 “Short-Term Energy Outlook (STEO),” EIA, August 10, 2021, https://www.eia.gov/outlooks/steo/archives/aug21.pdf (“2021 August EIA STEO Report”); 2021 July EIA STEO Report.
13 The EIA has revised the 2018 and 2019 numbers reported for U.S. Natural Gas Marketed Production from those previously reported in “Characteristics of U.S. Natural Gas Transactions: Insights from FERC Form Submissions as of June 6, 2019,” Cornerstone Research, July 2019, https://www.cornerstone.com/Publications/Reports/Characteristics-of-U-S-Natural-Gas-Transactions-FERC-Form-552-Submissions-as-of-June-2019.pdf.
14 “Annual U.S. Natural Gas Production Decreased by 1% in 2020,” EIA, March 2, 2021, https://www.eia.gov/todayinenergy/detail.php?id=46956.
15 “Annual Energy Outlook 2021,” EIA, February 3, 2021, p. 17, https://www.eia.gov/outlooks/aeo/pdf/AEO_Narrative_2021.pdf. 16 EIA U.S. Natural Gas Exports Data. 17 “Henry Hub Natural Gas Spot Price,” EIA, accessed May 17, 2021, https://www.eia.gov/dnav/ng/hist/rngwhhdA.htm. 18 “Henry Hub Natural Gas Spot Price,” EIA, accessed August 27, 2021, https://www.eia.gov/dnav/ng/hist/rngwhhdM.htm. 19 “Global Gas Review 2020,” IEA, https://www.iea.org/reports/gas-market-report-q2-2021/global-gas-review-2020 (“Global Gas Review
2020”), p. 26. 20 “LNG Trade Rises to Record in 2020 but Growth Slowed by COVID-19–IGU,” Reuters, June 3, 2021,
https://www.reuters.com/business/energy/lng-trade-rises-record-2020-growth-slowed-by-covid-19-igu-2021-06-03/. 21 “Natural Gas Explained: Liquefied Natural Gas,” EIA, July 2020, 2021, https://www.eia.gov/energyexplained/natural-gas/liquefied-
natural-gas.php (“2021 Natural Gas Explained”); Global Gas Review 2020, p. 4. 22 U.S. Liquefaction Capacity, July 15, 2021, https://www.eia.gov/naturalgas/U.S.liquefactioncapacity.xlsx. 23 U.S. Liquefaction Capacity, July 15, 2021, https://www.eia.gov/naturalgas/U.S.liquefactioncapacity.xlsx. 24 “Today in Energy,” EIA, March 15, 2021, https://www.eia.gov/todayinenergy/detail.php?id=47136 (“EIA Today in Energy”). 25 EIA Today in Energy. 26 Global Gas Review 2020, p. 28. 27 EIA U.S. Natural Gas Exports Data.
21 Cornerstone Research | Characteristics of U.S. Natural Gas Transactions—Insights from FERC Form 552 Submissions
22 Cornerstone Research | Characteristics of U.S. Natural Gas Transactions—Insights from FERC Form 552 Submissions
28 Percentage for 2019: 1,819,399 mmcf total LNG exports / 4,656,324 mmcf total natural gas exports = 39%. Percentage for 2020: 2,389,838 mmcf total LNG exports / 5,281,017 mmcf total natural gas exports = 45%. See EIA U.S. Natural Gas Exports Data.
29 Global Gas Review 2020, p. 28. 30 2020 EIA STEO Report. 31 “Factbox: Asian Spot LNG Prices Hit Record Highs on Supply Glitches, Demand Spike,” S&P Global, January 13, 2021,
https://www.spglobal.com/platts/en/market-insights/latest-news/natural-gas/011321-factbox-asian-spot-lng-prices-hit-record-highs-on-supply-glitches-demand-spike.
32 Global Gas Review 2020, p. 28. 33 If both parties to a transaction submit a Form 552, the total volume submitted to FERC will be double the volume of that transaction.
For example, a trade for 10,000 mmBtu between two companies, each submitting a Form 552, will add 20,000 mmBtu to the total submitted volume. The minimum volume that could be represented by Form 552 is the maximum of the buy and sale totals shown in Figure 10, which in 2020 was 80,181 tBtu. Adding the buy and sale volume can double count transactions if both the buyer and seller file a Form 552. A potential limitation of this is that estimating volume with only sales or only purchases may underrepresent the volume of transactions represented by Form 552, since some transactions involve market participants that do not submit a Form 552.
34 The figures reported by CME represent the average daily volume of its natural gas products, and have been multiplied by 250 to convert them to annual values. CME reports the total number of contracts, and the volume represented by each contract may vary in size. See CME Form 10-Ks.
35 ICE 2020 10-K, p. 54. 36 CME 2020 10-K, p. 40. 37 “Nasdaq Futures Products,” NASDAQ, retrieved from Wayback Machine,
https://web.archive.org/web/20181201185710/https://business.nasdaq.com/nasdaq-futures/products. Note that NFX ceased listing these futures as of June 2, 2020.
38 “Exchange Volume by Class,” OCC, https://www.theocc.com/Market-Data/Market-Data-Reports/Volume-and-Open-Interest/Exchange-Volume-by-Class.
39 Midstream refers to integrated-upstream, integrated-downstream, and transporters. Traders and wholesale marketers also have nearly equal levels of buying and selling through their role in market-making.
40 See Endnote 3 for an explanation on how to estimate the number of times one molecule of natural gas is traded through from production to consumption.
41 The index-priced transaction percentage does not include price triggers. For 2019 transaction volume percentages, see “Characteristics of U.S. Natural Gas Transactions: Insights from FERC Form Submissions as of July 3, 2020,” Cornerstone Research, August 2020, https://www.cornerstone.com/Publications/Reports/Characteristics-of-US-Natural-Gas-Transactions-FERC-Form-552-Submissions-July-2020.pdf.
42 Data do not cover all transactions in the OTC market, since Form 552 excludes certain types of non-index-priced transactions. See Appendix 2.
43 Physical basis and price trigger trades are not included in this analysis. 44 At page 4, Order 704 (see Appendix 1) states that Form 552 submissions should be used “to determine important volumetric
relationships between (a) the fixed price, day-ahead or month-ahead transactions that form price indices; and (b) transactions that use price indices. Without the most basic information about these volumetric relationships, the Commission has been hampered in its oversight and its ability to assess the adequacy of price-forming transactions.”
45 “S&P Global Platts Announces North America Natural Gas Assessment Methodology Details Following Its Agreement with Intercontinental Exchange to Improve Price Transparency and Bolster Benchmarks,” S&P Global Platts, February 9, 2017, https://www.prnewswire.com/news-releases/sp-global-platts-announces-north-america-natural-gas-assessment-methodology-details-following-its-agreement-with-intercontinental-exchange-to-improve-price-transparency-and-bolster-benchmarks-300405153.html; “Natural Gas Trade Activity Numbers Leap after ICE Agreement,” S&P Global Platts, June 7, 2018, https://blogs.platts.com/2018/06/07/natural-gas-trade-activity-leap-ice-agreement/#more-27725.
46 For the purposes of this analysis, physical-basis transactions are also included in the category of fixed-priced volume. 47 FERC Technical Conference, Developments in Natural Gas Index Liquidity and Transparency, June 29, 2017, Docket No. AD17-12-000,
25:19–25, 151:9–23. 48 Calculated based on Figure 15: integrated-downstream plus integrated-upstream plus traders or wholesale marketers: 6.1% + 20.0% +
52.1% = 78.2%. 49 Calculated based on Figure 10 and Figure 13. From Figure 10: six of the top 20 companies have any affiliates that report to index
publishers, which totals 5,201 tBtu. From Figure 13: the 2020 volume potentially reported to indices totals 9,150 tBtu. The top 20 companies with volume reportable to indices and an affiliate that reports to index publishers divided by total volume potentially reported to index publishers: 5,201 ÷ 9,150 = 56.8%.
23 Cornerstone Research | Characteristics of U.S. Natural Gas Transactions—Insights from FERC Form 552 Submissions
50 “Characteristics of U.S. Natural Gas Transactions: Insights from FERC Form Submissions as of June 5, 2018,” Cornerstone Research, July 2018, https://www.cornerstone.com/Publications/Reports/Characteristics-of-US-Natural-Gas-Transactions-FERC-Form-552-Submissions-June-2018.pdf; “Characteristics of U.S. Natural Gas Transactions: Insights from FERC Form Submissions as of June 6, 2019,” Cornerstone Research, July 2019, https://www.cornerstone.com/Publications/Reports/Characteristics-of-U-S-Natural-Gas-Transactions-FERC-Form-552-Submissions-as-of-June-2019.pdf; “Characteristics of U.S. Natural Gas Transactions: Insights from FERC Form Submissions as of July 3, 2020,” Cornerstone Research, August 2020, https://www.cornerstone.com/Publications/Reports/Characteristics-of-US-Natural-Gas-Transactions-FERC-Form-552-Submissions-July-2020.pdf.
51 Among other minor revisions, Order 704-C exempts transactions involving unprocessed natural gas as well as cash-out and imbalance transactions. Further, for 2009, companies that hold blanket marketing certificates but do not meet the minimum transaction volume threshold are no longer required to file a Form 552. For 2008, more than 300 companies filed a Form 552 and did not report any transaction volume. For 2009, only 16 companies filed a Form 552 without reporting transaction volumes.
52 The categorization process was necessarily judgmental and based on company websites and financial filings. Companies were categorized as closely as possible to their most significant natural gas market activity.
53 Since these integrated companies typically have a focus at either the industry segment that is upstream (such as production, gathering, or processing) or downstream (such as electric generation, marketing to wholesale users, or industrial consumption), two categories were created to allow for investigation of any differences between these types of companies.
54 FERC Form 552 (2019 version). Note that Form 552 covers only physical natural gas transactions. Financial transactions, such as swaps and options, are excluded, as are futures contracts, regardless of whether they are taken to physical delivery.
55 FERC includes NYMEX plus contracts among trigger contracts. In these contracts, the price is typically set at a specified index value as a default. The buyer, however, has the option to fix (or trigger) the price at any given point in time based on the prevailing market prices.
Typically, the buyer can fix the price at the prevailing NYMEX price for the delivery month plus a predetermined premium. When they are triggered, these contracts become fixed-price trades. Thus, while trigger contracts are initially dependent on an index price, they often shed this dependence and give the buyer the price certainty of a fixed-price transaction.
56 Physical-basis transactions are physical transactions that have prices set as a predetermined amount plus the NYMEX settlement price. The price index publishers state that they incorporate physical-basis transactions into their price assessments.
About the Authors
Greg Leonard Ph.D., University of Rochester; M.A., University of Rochester; B.A., University of Texas at Austin
Greg Leonard, a senior vice president in the firm’s London office and head of the firm’s European Finance practice, has more than 15 years of experience consulting to clients in complex commercial litigation and regulatory proceedings involving energy, commodities, finance, antitrust, and intellectual property. In the energy and commodity markets, Dr. Leonard has extensive experience in analyzing market manipulation claims, analyzing trading patterns and strategies, valuing trading businesses and portfolios, valuing alleged breaches of contract, evaluating risk management practices, and analyzing the price impacts of alleged wrongful conduct. Dr. Leonard has led consulting projects involving the trading of natural gas, natural gas liquids, liquefied natural gas, crude oil, refined products, agricultural products, electric power, and electric generation capacity on futures exchanges as well as in the OTC market. On behalf of clients, he has appeared before the enforcement staffs of the U.S. Commodity Futures Trading Commission, the Federal Energy Regulatory Commission, the Federal Bureau of Investigation, and the U.S. Department of Justice.
Nicole M. Moran Ph.D., University of Illinois at Urbana–Champaign; B.S., University of Wisconsin
Nicole Moran is a principal in the energy and commodities practice in Cornerstone Research’s Washington, D.C. office. She provides financial and economic analysis in complex commercial litigation and regulatory proceedings and supports experts in preparing for deposition and trial testimony. Her experience spans several industries including energy, agriculture, foreign exchange, consumer lending, and electronics; her case experience includes arbitration, regulatory investigations, market manipulation, antitrust, consumer finance, and financial institutions. Dr. Moran’s emphasis has been on derivative markets for both exchange-traded and OTC products that involve trading activity, order book data, and evaluation of market design intricacies that affect market participant behavior. Prior to joining Cornerstone Research, Dr. Moran was a research economist at the U.S. Commodity Futures Trading Commission, where she conducted statistical and econometric analyses on derivative markets and agricultural futures. Her research is published in leading journals, including the Journal of Futures and the Journal of Agricultural and Applied Economics.
Laurent Samuel M.B.A., Harvard Business School; B.Com., McGill University
Laurent Samuel is a manager in the energy and commodities practice in Cornerstone Research’s Washington, D.C. office. His casework to date has focused on derivative markets for both exchange-traded and OTC products in commodities (energy, metals, and agriculture), fixed income (U.S. Treasury Futures, Interest Rate Swaps, Foreign Exchange), and equity markets. Issues covered include market manipulation allegations, alleged antitrust behavior, and order executions linked to high-frequency trading. Prior to joining Cornerstone Research, Mr. Samuel was a Grains Trader at Louis Dreyfus Company, a leading merchant and processor of agricultural goods. He also worked as an internal consultant (“Inspection Générale”) at Société Générale, a French financial services group, where he carried out consulting and auditing assignments across various business lines ranging from retail banking to corporate investment banking and capital markets.
The views expressed in this report are solely those of the authors, who are responsible for the content, and do not necessarily represent the views of Cornerstone Research.
24 Cornerstone Research | Characteristics of U.S. Natural Gas Transactions—Insights from FERC Form 552 Submissions
Many publications quote, cite, or reproduce data or figures from Cornerstone Research reports. The authors request that you reference Cornerstone Research in any reprint of the figures or findings. Please direct any questions to:
Greg Leonard 202.912.8921 [email protected]
Nicole M. Moran 202.912.8963 [email protected]
Laurent Samuel 202.912.8948 [email protected]
About Cornerstone Research
Cornerstone Research provides economic and financial consulting and expert testimony in all phases of complex litigation and regulatory proceedings. The firm works with an extensive network of prominent faculty and industry practitioners to identify the best-qualified expert for each assignment. Cornerstone Research has earned a reputation for consistent high quality and effectiveness by delivering rigorous, state-of-the-art analysis for more than thirty years. The firm has over 700 staff and offices in Boston, Chicago, London, Los Angeles, New York, San Francisco, Silicon Valley, and Washington.
© 2021 by Cornerstone Research, Inc. All Rights Reserved. Cornerstone Research is a registered service mark of Cornerstone Research, Inc. C logo and design is a registered trademark of Cornerstone Research, Inc.