Embed Size (px)
Citation preview

CHARACTERIZATION AND COMPUTER SIMULATION OF CORN
STOVER / COAL BLENDS FOR CO-GASIFICATION IN A
DOWNDRAFT GASIFIER
A dissertation submitted in fulfilment of the requirements for the degree of
Master of Science in Physics
By
MABIZELA POLYCARP SBUSISO
In the Faculty of Science and Agriculture at the University of Fort Hare
Department of Physics, Fort Hare Institute of Technology
Faculty of Science and Agriculture
University of Fort Hare
Supervisor: Prof E. Meyer
Co-supervisor: Dr N. S. Mamphweli
Year: 2014

i
DEDICATIONS
To my mother, father (late), siblings, wife (Primrose Nosicelo Njingana - Mabizela) and kids.
ii
ACKNOWLEDGEMENTS
It has been possible to produce this dissertation due to significant contributions many people
have made. Notwithstanding the fact that it is not possible to list here the names of all those I
am indebted to in this regard, I want them to know that I really deeply appreciate their
contributions. In particular the following:
My supervisor, Professor E. L. Meyer for his excellent motivation and guidance
throughout the project.
Co-supervisor, Dr N.S. Mamphweli for his tireless and selfless contribution in making
this project a success. Without him, I doubt I was going to succeed.
I would especially like to thank my colleague in the Biomass Gasification Research
Group, Mr Anthony Anukam whose support was tremendous throughout the course of
this project.
I also wish to thank the South African National Energy Research Institute (SANERI),
the Centre for Renewable and Sustainable Energy Studies (CRSES) at Stellenbosch
University for their support.
The Govan Mbeki Research and Development Centre (GMRDC) at University of Fort
Hare.
All members of the Fort Hare Institute of Technology (FHIT) for their assistance with
administrative aspects of the project, constructive criticism during seminar
presentations and encouragements
Mr Albert Borotsi (Late) and Mr Mandla Mboyi (Late) both from the University of
Fort Hare science workshop for their technical assistance.
Special thanks to my wife – Primrose Nosicelo Njingana-Mabizela, my mother and
siblings who constantly encouraged me throughout the project
iii
DECLARATION
I declare that this dissertation is not one for which a degree has been or will be conferred by
any other university or institution. It is not one for which a degree has already been conferred
by this University. The work for this dissertation is my own work and, all non-original
material have been duly acknowledged.
DATE: 1 JUNE 2014
iv
SUMMARY
The need for sustainable alternative energy technology is becoming more urgent as the
demand for clean energy environment increases. For centuries, electricity in South Africa has
been derived mostly from coal with results growing in multifold annually due to concerns
about the impact of fossil fuel utilization related to emission of greenhouse gasses. It is
practically impossible at the moment to replace coal with biomass resources because of the
low energy value of biomass. However, the conversion of coal has experienced some
challenges especially during its gasification which includes, but are not limited to a high
reaction temperature exceeding 900°C which most gasifiers cannot achieve, and if achieved
in most cases, combustion of the resulting syngas usually occur, leading to low conversion
efficiency and the risk of reaching extremely high temperatures that may result in pressure
build up and explosion may also occur. Therefore, this study sought to investigate the
possibility of co-gasifying corn stover with coal with the ultimate aim establishing the best
mixing ratio that would result in optimum co-gasification efficiency after computer
simulation. Proximate and ultimate analysis, including energy values of corn stover and coal
as well as their blends were undertaken and results showed significant differences between
the two feedstocks and narrow range composition betwee their blends in terms of properties
and energy value. Corn stover showed a higher fraction of volatile matter and lower ash
content than coal, whereas those of their blends vary considerably in terms of physical
properties. Differences in chemical composition also showed higher fraction of hydrogen and
oxygen, and less carbon than coal while those of their blends vary according to the ratio of
corn stover to coal and vice versa in the blends. The thermal stability of corn stover and coal
as well as their blends were also established and the maximum temperature reached for
thermal degradation of their blends was 900°C as depicted by TGA analysis. The SEM
v
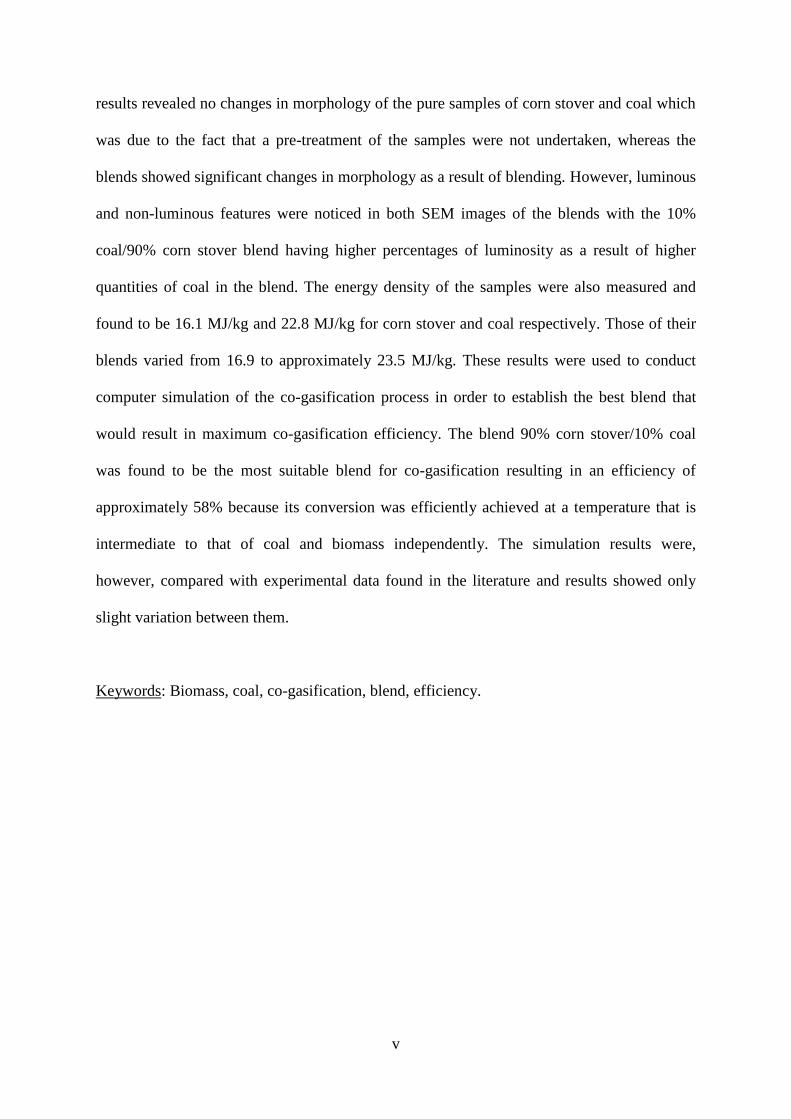
results revealed no changes in morphology of the pure samples of corn stover and coal which
was due to the fact that a pre-treatment of the samples were not undertaken, whereas the
blends showed significant changes in morphology as a result of blending. However, luminous
and non-luminous features were noticed in both SEM images of the blends with the 10%
coal/90% corn stover blend having higher percentages of luminosity as a result of higher
quantities of coal in the blend. The energy density of the samples were also measured and
found to be 16.1 MJ/kg and 22.8 MJ/kg for corn stover and coal respectively. Those of their
blends varied from 16.9 to approximately 23.5 MJ/kg. These results were used to conduct
computer simulation of the co-gasification process in order to establish the best blend that
would result in maximum co-gasification efficiency. The blend 90% corn stover/10% coal
was found to be the most suitable blend for co-gasification resulting in an efficiency of
approximately 58% because its conversion was efficiently achieved at a temperature that is
intermediate to that of coal and biomass independently. The simulation results were,
however, compared with experimental data found in the literature and results showed only
slight variation between them.
Keywords: Biomass, coal, co-gasification, blend, efficiency.
vi
DEFINITION OF TERMS
Biomass – It is defined as any organic matter which is available on a renewable basis
(agricultural crops, agricultural wastes, municipal wastes and animal waste) [Tumuluru et al.,
2011].
Coal - It is defined as a combustible black or dark brown rock consisting chiefly of
carbonized plant matter found mainly in underground seams [Tumuluru et al., 2011].
Co-gasification – It involves blending of coal and biomass, which results in reduction of
gasification temperature and decreasing the environmental impact because biomass is carbon
neutral [Tumuluru et al., 2011].
Thermogravimetric analysis (TG) – It is defined as a method of thermal analysis in which
changes in physical and chemical properties of materials are measured as a function of
temperature (f (T)) or as a function of time (f (t)) [Wikipedia, 2014].
Differential thermogravimetric analysis (DTG) – It is defined as a rate of thermal degradation
(weight loss) as a the temperature changes with time [Wikipedia, 2014].
Greenhouse gas – It is defined as a gas that absorbs infrared radiation (IR) and radiates heat
in all directions [Wikipedia, 2014].
Efficiency – It is defined as the ratio of output power generated divided by input power
[Mamphweli and Meyer, 2009].

vii
1 NOMENCLATURE
CR & W Combustible renewable and waste
HHV Highest heating value
CS Corn Stover
RRDB Renewable Resource Database
CO Carbon Monoxide
CO2 Carbon Dioxide
H2 Hydrogen
CH4 Methane
N2 Nitrogen
SOx Sulfur oxides
SO2 Sulfur Dioxide
SCN Thiocyanide
H2SO3 Sulfurous acid
NH3 Ammonia
H2CO Synthetic gas
GHG Green House Gas
GHGI Green House Gas Index
SNG Synthetic Natural Gas
viii
2 TABLE OF CONTENTS
DEDICATIONS ........................................................................................................................ i
ACKNOWLEDGEMENTS .................................................................................................... ii
DECLARATION.................................................................................................................... iii
SUMMARY ............................................................................................................................. iv
DEFINITION OF TERMS..................................................................................................... vi
NOMENCLATURE ............................................................................................................... vii
TABLE OF CONTENTS .................................................................................................... viii
LIST OF FIGURES ............................................................................................................. xiii
LIST OF TABLES ................................................................................................................ xiv
LIST OF SYMBOLS AND UNITS ...................................................................................... xv
CHAPTER ONE: INTRODUCTION .................................................................................... 1
1.1 BACKGROUND ................................................................................................................... 1
1.2 THE SOUTH AFRICAN CONTEXT OF RENEWABLE ENERGY ...................................... 4
1.3 OVERVIEW OF THE GASIFICATION PROCESS ............................................................. 5
1.4 PROBLEM STATEMENT .................................................................................................... 7
ix
1.5 RESEARCH OBJECTIVES .................................................................................................. 7
1.6 DELINEATION AND LIMITATIONS .................................................................................. 8
1.7 RESEARCH QUESTIONS ................................................................................................... 8
1.8 RATIONALE OF THE STUDY ............................................................................................ 8
1.9 DISSERTATION OUTLINE ................................................................................................ 9
CHAPTER TWO: LITERATURE REVIEW ..................................................................... 11
2.1 INTRODUCTION .............................................................................................................. 11
2.2 BIOMASS ........................................................................................................................... 11
2.2.1 BIOMASS CHARACTERISATION.............................................................................. 11
2.2.1.1 CELLULOSE .......................................................................................................... 11
2.2.1.2 HEMICELLULOSE ................................................................................................ 12
2.2.1.3 LIGNIN ................................................................................................................... 13
2.2.2 THE PROPERTIES OF BIOMASS ........................................................................ 16
2.2.2.1 PROXIMATE ANALYSIS ......................................................................................... 17
2.2.2.1.1 MOISTURE CONTENT .......................................................................... 17
2.2.2.1.2 VOLATILE MATTER ............................................................................. 18
2.2.2.1.3 ASH CONTENT ....................................................................................... 19
2.2.2.1.4 FIXED CARBON ..................................................................................... 19
2.2.2.1.5 EXTRACTABLES ................................................................................... 20
2.2.2.1.6 BULK DENSITY...................................................................................... 20
2.2.2.2 ULTIMATE ANALYSIS ....................................................................................... 21
2.3 ENERGY CONTENT .......................................................................................................... 21
2.4 PROPERTIES OF CORN STOVER ................................................................................... 22
x
2.5 AVAILABILITY AND USE OF BIOMASS RESOURCE .................................................... 25
2.6 TYPES AND SOURCES OF BIOMASS ............................................................................. 27
2.7 THERMAL DEGRADATION OF BIOMASS COMPONENTS .......................................... 28
2.8 ADVANTAGES AND DISADVANTAGES OF BIOMASS AS A FUEL SOURCE .......... 29
2.8.1 ADVANTAGES OF BIOMASS AS A FUEL ....................................................... 30
2.8.2 DISADVANTAGES OF BIOMASS AS A FUEL ................................................. 31
2.9 THEORY OF BIOMASS GASIFICATION ........................................................................ 31
2.10 COAL .............................................................................................................................. 35
2.10.1 THE PROPERTIES OF COAL .................................................................................... 36
2.10.1.1 LIGNITE .................................................................................................................... 36
2.10.1.2 SUB-BITUMINOUS ................................................................................................ 37
2.10.1.3 BITUMINOUS ......................................................................................................... 38
2.10.1.4 ANTHRACITE ......................................................................................................... 38
2.11 AVAILABILITY AND USE OF COAL IN SOUTH AFRICA ........................................... 39
2.12 ADVANTAGES AND DISADVANTAGES OF USING COAL AS A FUEL ............. 40
2.13 COAL GASIFICATION ............................................................................................ 40
2.14 GASIFICATION OF BIOMASS AND COAL .................................................................. 42
2.15. CO-GASIFICATION OF COAL AND BIOMASS ....................................................... 42
2.16 THE FACTORS GOVERNING THE CO-GASIFICATION OF BIOMASS AND COAL . 45
2.17 TYPES OF GASIFIERS / REACTORS ............................................................................. 46
2.17.1 FIXED BED GASIFIER ............................................................................................... 46
2.17.1.1 UPDRAFT / COUNTER CURRENT MOVING BED GASIFIER .......................... 46
2.17.1.2 DOWNDRAFT GASIFIER ....................................................................................... 47
xi
2.17.1.3 CROSS-DRAFT GASIFIER ..................................................................................... 48
2.18 ENVIRONMENTAL BENEFITS OF CO-GASIFICATION ............................................. 50
CHAPTER THREE: RESEARCH METHODOLOGY .................................................... 52
3.1 INTRODUCTION .............................................................................................................. 52
3.2 SAMPLE PREPARATION ................................................................................................. 52
3.3 MATERIAL CHARACTERIZATION .................................................................................. 53
3.3.1 PROXIMATE ANALYSIS OF VARIOUS BIOMASS AND COAL ........................... 53
3.3.2 ULTIMATE ANALYSIS OF VARIOUS BIOMASS AND COAL .............................. 54
3.3.3 SEM ANALYSIS............................................................................................................ 54
3.3.4 CALORIFIC VALUE OF VARIOUS BIOMASS AND COAL .................................... 55
3.3.5 MATERIAL CHOICE .................................................................................................... 56
3.3.6 THERMOGRAVIMETRIC ANALYSIS ....................................................................... 56
3.3.6.1 DERIVATIVE THERMOGRAVIMETRIC ANALYSIS ........................................... 57
3.3.7 COMPUTER SIMULATION OF THE CO-GASIFICATION PROCESS OF
VARIOUS BLENDS OF CORN STOVER/COAL ................................................................ 58
3.3.7.1 Flaming pyrolysis zone sub-model: ............................................................................. 59
3.3.7.2 Sub-model of gasification zone: .................................................................................. 62
CHAPTER FOUR: RESULTS AND DISCUSSION .......................................................... 63
4.1 INTRODUCTION .............................................................................................................. 63
4.2 PROXIMATE ANALYSIS OF PURE AND BLENDED SAMPLES OF CORN STOVER
AND COAL .............................................................................................................................. 63
4.3 ULTIMATE ANALYSIS OF PURE AND BLENDED SAMPLES OF CORN STOVER AND
COAL .................................................................................................................................. 67
xii
4.4 CALORIMETRIC VALUE OF PURE AND BLENDED SAMPLES OF CORN STOVER
AND COAL .............................................................................................................................. 71
4.5 MORPHOLOGICAL CHARACTERIZATION OF CORN STOVER/COAL AND THEIR
BLENDS .................................................................................................................................. 73
4.6 THERMAL INVESTIGATION OF COAL/CORN STOVER BLENDS ............................... 75
4.6.1 DTG EVALUATION OF COAL/CORN STOVER BLENDS ...................................... 77
4.7 COMPUTER SIMULATION OF THE CO-GASIFICATION PROCESS OF VARIOUS
BLENDS OF CORN STOVER AND COAL ............................................................................. 80
4.8 COMPARISON WITH EXPERIMENTAL DATA ............................................................... 82
CHAPTER FIVE: SUMMARY, CONCLUSIONS AND RECOMMENDATIONS ....... 85
5.1 SUMMARY OF RESEARCH FINDINGS........................................................................... 85
5.2 SUMMARY OF CONTRIBUTIONS ................................................................................... 88
5.3 CONCLUSIONS ................................................................................................................. 88
5.4 RECOMMENDATION FOR FUTURE RESEARCH ......................................................... 90
REFERENCES ....................................................................................................................... 91
APPENDIX A: RESEARCH OUTPUTS ASSOCIATED WITH THIS STUDY .......... 103
A1: JOURNAL PUBLICATION ............................................................................................. 103
A2: CONFERENCE PROCEEDINGS ................................................................................... 103
APPENDIX B: MEASUREMENTS USED IN THIS STUDY ........................................ 104

xiii
3 LIST OF FIGURES
Figure 1-1: Figure 1-1: Different routes of biomass conversion ............................................... 2
Figure 1-2: Pie graph showing various energy sources in South Africa.................................... 5
Figure 1-3: Overview of the gasification process ...................................................................... 6
Figure 2-1: Molecular structure of cellulose. .......................................................................... 12
Figure 2-2: Molecular structure of hemicellulose .................................................................... 13
Figure 2-3: Molecular structure of lignin................................................................................. 14
Figure 2-4: Total biomass energy potential for South Africa .................................................. 26
Figure 2-5: The gasification process flow chart ...................................................................... 34
Figure 2-6: Basic schematic for coal gasification. ................................................................... 41
Figure 2-7: Basic step wise processing for the co-gasification of coal and biomass………...44
Figure 2-8: Updraft/counter current gasifier…………………………………………………46
Figure 2.9: Downdraft / co – current gasifier………………………………………………..47
Figure 2-10: Crossdraft gasifier……………………………………………………………...49
Figure 3-1: Oxygen bomb calorimeter ..................................................................................... 55
Figure 3-2: Schematic diagram of a thermo gravimetric analyzer…………………………...57
Figure 4-1: SEM images of pure samples of corn stover and coal……………..…………….73
Figure 4-2: SEM images of blends of corn stover and coal ..................................................... 75
Figure 4-3: TGA curves of pure corn stover and coal as well as their blends. ..................... .. 76
Figure 4-4: Derivative thermogravimetric curves of pure corn stover and coal as well as their
blends .............................................................................................................................. 78
Figure 4-5: Simulated efficiency of the co-gasification process of blends of corn stover/coal
.......................................................................................................................................... 81
xiv
LIST OF TABLES
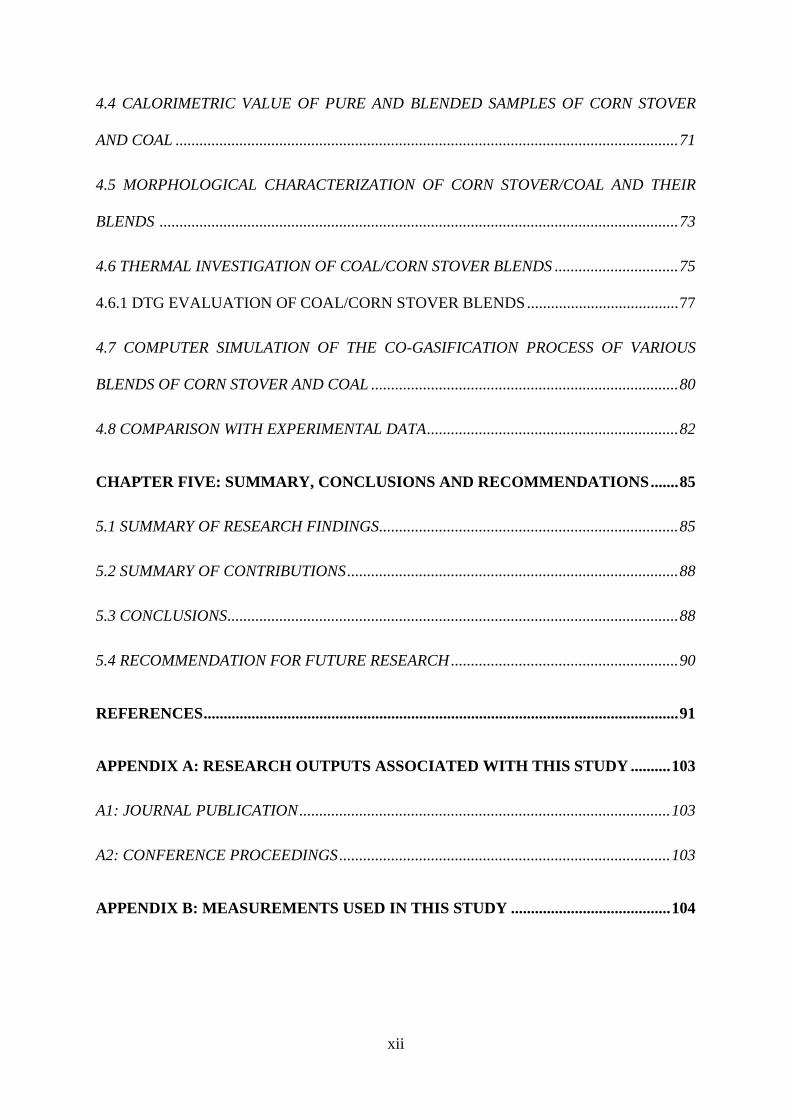
Table 2-1: Biomass composition and chemical properties derived from ultimate analysis... 15
Table 2-2: The properties of corn stover……………………………………………………..24
Table 2-3: Advantages and disadvantages of fixed bed gasifier…………………………….. 47
Table 3-1: Normal operating parameters of a downdarft gasifier………………....................58
Table 4-1: Proximate analysis of pure and blended materials………………………………..64
Table 4-2: Ultimate analysis of pure and blended materials…………………………………68
Table 4-3: Calorific values of pure and blended materials………………………………….. 72
Table 4-4: A comparison of the simulated results from this study with experimental data from
the literature……………………………………………………………………………..83

xv
4 LIST OF SYMBOLS AND UNITS
cm3 cubic centimeter
g grams
GWh Gigawatt hours
oC Degree Celsius
MJ/kg Mega joules per kilogram
KPa kilopascal
MJ/Nm3 Megajoule per Newton cubic meter
kJ/m3 kilojoules per cubic meter
Kg/s kilograms per second
m3/s cubic meter per second
kJ/kg oK kilojoules per kilogram per Kelvin
oC /min Degrees centigrade per minute

1
5 CHAPTER ONE: INTRODUCTION
1.1 BACKGROUND
Gasification of biomass has been reported to have attracted enormous interest for the past
several years within thermochemical conversion technologies as it has been shown to offer
higher efficiency in relation to combustion. Fuels obtained from biomass are considered to be
a remedy to greenhouse gas emission. Biomass gasification is defined as the conversion of
unprocessed raw biomass materials into gaseous energy carriers known as producer or
synthetic gas (syngas).
The producer gas is a mixture of various gases such as carbon monoxide (CO), hydrogen
(H2), methane (CH4), carbon dioxide (CO2), nitrogen (N2) and steam (H2O). The producer gas
is used for heating, electricity generation and fine chemicals production. Biomass is a
renewable energy source which is not only has a potential to meet the energy demands of
both developed and developing countries throughout the world on unprocessed and processed
biomass materials, but also mitigate proliferation of carbon dioxide (CO2) reduction [Anon,
1997]. Biomass fuel can be converted to energy through thermochemical processes
(combustion, pyrolysis, and gasification) and biological means (enzyme/fermentation)
[Maniatias, 1999].
2
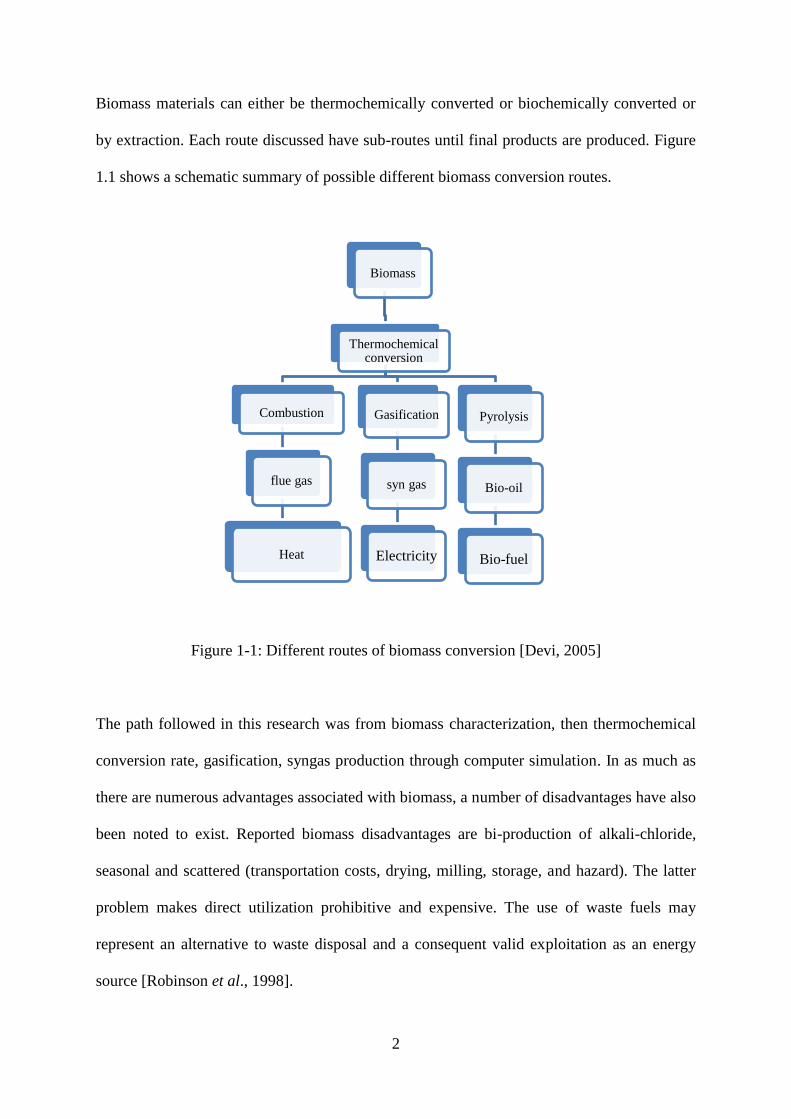
Biomass materials can either be thermochemically converted or biochemically converted or
by extraction. Each route discussed have sub-routes until final products are produced. Figure
1.1 shows a schematic summary of possible different biomass conversion routes.
Figure 1-1: Different routes of biomass conversion [Devi, 2005]
The path followed in this research was from biomass characterization, then thermochemical
conversion rate, gasification, syngas production through computer simulation. In as much as
there are numerous advantages associated with biomass, a number of disadvantages have also
been noted to exist. Reported biomass disadvantages are bi-production of alkali-chloride,
seasonal and scattered (transportation costs, drying, milling, storage, and hazard). The latter
problem makes direct utilization prohibitive and expensive. The use of waste fuels may
represent an alternative to waste disposal and a consequent valid exploitation as an energy
source [Robinson et al., 1998].
Biomass
Thermochemical conversion
Combustion
flue gas
Heat
Gasification
syn gas
Electricity
Pyrolysis
Bio-oil
Bio-fuel
3
Coal is classified as follows: anthracite (highest rank), bituminous, sub-bituminous and
lignite (lowest rank). The chemical composition of coal has a strong influence on its
combustibility. The properties of coal are broadly classified as chmical and physical . Lignite
has been widely used for electricity generation and heat, besides producing various refined
chemicals. Structural characterization of lignite coal was reported to present major challenges
because of the extreme complexity and heterogeneity (different phases) of low ranked coal.
Morphological analysis of lignite is complex and complicated. Thermogravimetric analysis
(TGA) is one of the techniques used for different coal analysis. In coal gasification process
for production of synthetic gas, coal is converted into gases that can be converted into quality
gas having a higher heating value and with the greatest efficiency [Meuzelaar et al, 1996].
The biomass–coal co–combustion is the most promising short term option for renewable
fuels. The existing coal – fuelled power plants may be generally used with very little
modification. The technical challenges associated with co – combustion have been explored
[Baxter, 2005]. Spliethoff et al reported that in the gas phase, the biomass nitrogen
preferable form ammonia (NH3) in contrast to the second (SCN) formed during co –
gasification. The highly volatile matter yield of biomass fuels is an important aspect of the co
– gasification, another process for utilization of residual fuels [Spliethoff et al., 2000].
Biomass is a renewable energy source with a potential to meet the energy needs have
developed and developing countries throughout the world [Anon, 1997]. The unprocessed
biomass material is plant matter, namely wood, twigs, straw, animal dung / waste, vegetable
matter and agricultural waste. Processed biomass materials include charcoal, methane,
sawdust and alcohol produced from fermentation (enzyme catalysis) process [Hall et al.,

4
1991]. Biomass fuel can be converted to energy through thermochemical (chemical reaction
rate kinetics) and biological (enzyme catalyses kinetics) processes [Maniatis, 1999].
Biomass gasification has also been defined as the conversion of wood charcoal, sawdust and
other biomass into gaseous energy carriers known as producer gas [Hoss et al., 1987].
Producer gas (syngas) is defined as a mixture of carbon monoxide (CO), hydrogen (H2),
methane (CH4), carbon dioxide (CO2), nitrogen (N2) and steam (H2O). The producer gas is
used for heating and electricity generation.
1.2 THE SOUTH AFRICAN CONTEXT OF RENEWABLE ENERGY
The bulk of South African energy is derived from coal. Coal is the largest source of electrical
energy in South Africa and about 92% of coal consumed on the African continent is produced
in South Africa [International Energy Outlook, 2009]. There are other sources of energy such
as nuclear, wind power, hydropower, tidal power, hydrothermal, biomass. Biomass contribute
10.2 %. Actually; it is the second largest energy source. The pie graph in Figure 1.2 clearly
depicts this fact.

5
Figure 1-2: Pie graph showing various energy sources in South Africa [International Energy
Agency, 2007]
The white paper on energy policy for South Africa is largely driven by a 10 000 GWh target
of energy derived from renewables which will contribute to final consumption by 2013 and
sets up a target of 40% electricity genetion from renewable energy by the year 2030 [Edkins
et al., 2010]. Small scale gasification has been active in the Republic of South Africa (RSA)
for the past number of years [DME, 1998].
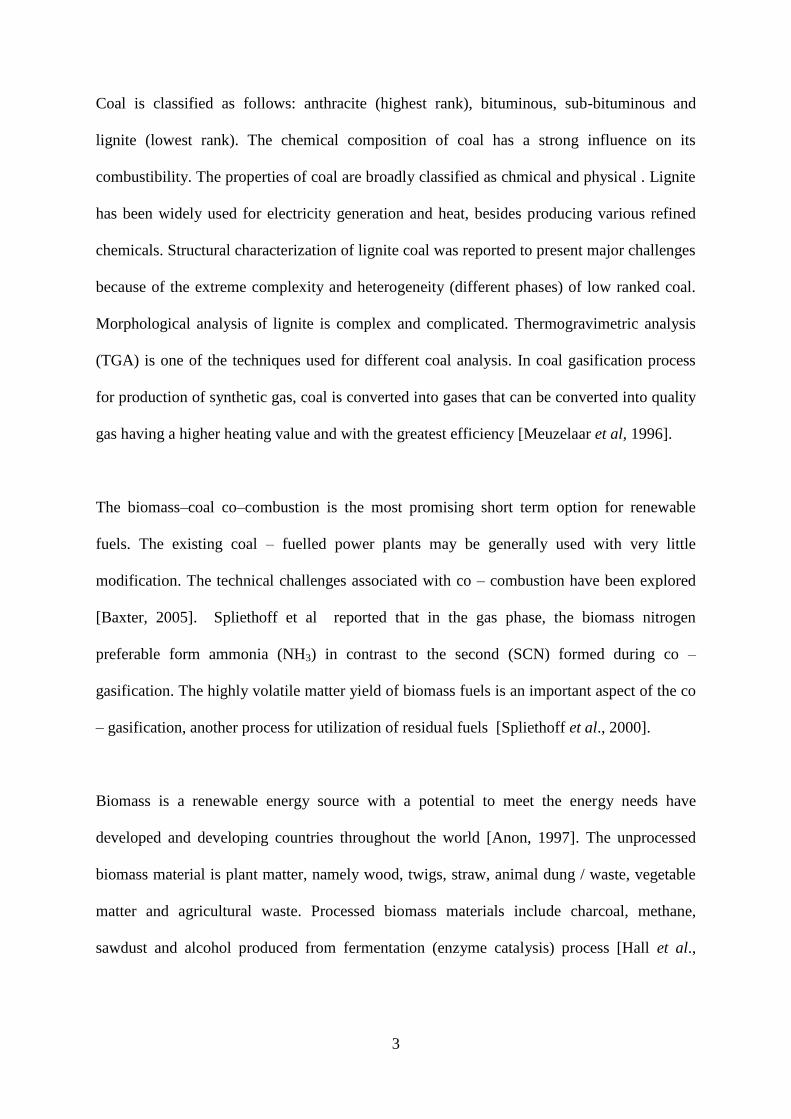
1.3 OVERVIEW OF THE GASIFICATION PROCESS
Figure 1-3 shows an overview of the gasification process together with its products and by-
products.
Coal/Peat,
72.1%
10.2 %
CR&W*
Gas, 2.8 %
Nuclear, 2.2
%
Oil, 12.6 % Hydro, 0.1 %
6
Figure 1-3: Overview of the gasification process [Mamphweli and Meyer, 2009]
Various thermochemical processes take place in a limited supply of oxidizer (air or oxygen)
in a specially designed reactor commonly known as biomass gasifier. The biomass particles
undergo drying, pyrolysis, oxidation and char reduction to generate a gaseous mixture of
combustibles such as carbon monoxide (CO), hydrogen (H2), methane (CH4) and diluents
[Sharma, 2008].
In the drying zone, biomass materials are dried at temperature above 100 oC, carbonization
takes place above the heath zone at a temperature between 600 – 800 oC converting biomass
materials into charcoal while giving off nitrogen (N2), methane (CH4) and some tar. In the
oxidation/heath zone, the combustion of biomass takes place resulting in the release of carbon
dioxide (CO2) and water vapour (H2O) [Mamphweli and Meyer 2009]. Various high
temperature chemical reactions take place in the reduction zone below the oxidation zone.
The carbon dioxide from combustion reacts with carbon and gets reduced to carbon
monoxide and water vapour. The hydrogen also reacts with carbon to form methane. It is the
zone where a large proportion of producer gas is formed [Beall and Eickner, 1970].
Drying
Oxidation Carbonization Reduction
H2O Char, N2, Tar, CH4 CO2, H2O CO, H2 CH4
Producer gas
7
1.4 PROBLEM STATEMENT
All biomass materials including coal are well established feedstocks with potential as fuel for
energy production. However, there are various technical issues related to analysis of the
biomass materials for blending with coal for the purpose of co-gasification. The ratio of
biomass or coal in the co-gasification process is one of these issues. The type and ratio of fuel
in the mixture of both feedstock influences some factors such as the conversion efficiency of
the co-gasification process, the syngas and tar yield, as well as the yield of impurities.
Another practical issue with regard to the analysis of corn stover and coal for co-gasification
purposes is that of the particle size of both feedstocks. The particle size of the biomass and
coal must be uniform for optimum co-gasification efficiency.
1.5 RESEARCH OBJECTIVES
The aim of this research was to investigate the physical and chemical properties of corn
stover blended with coal to establish the best mixing ratio that results in enhanced conversion
efficiency during gasification. The following aspects were investigated to accomplish this
aim:
i. Preparation of various blends of corn stover and coal
ii. Characterization of corn stover and coal and their blends in terms of proximate and
ultimate analysis as well as energy values
iii. Conduct computer simulation of the co-gasification process of the various blends of
corn stover and coal in order to determine the best blend that would result in optimum
efficiency under normal gasifier operating conditions/parameters.
8
1.6 DELINEATION AND LIMITATIONS
The biomass material that has been chosen for this study is corn stover, because of its
availability within the Eastern Cape Province. The coal used was a sub-bituminous one,
which was also readily available than other types of coal. This study sought to investigate
corn stover and coal blends with the aim of selecting a blend for co- gasification in a
downdraft biomass gasifier system. Determination of the physical and chemical properties as
well as energy values of corn stover and coal including their blends were undertaken so as to
guide in the proper selection of the particular blend for the purpose of co-gasification. The
actual co-gasification of the materials was not conducted, instead, the study relied on
computer simulation of the co-gasification process.
1.7 RESEARCH QUESTIONS
i. What are the properties of corn stover and coal as well as the properties of their
blends?
ii. What is the best corn stover/coal blend that results in enhanced conversion efficiency
during gasification in a downdraft gasifier?
1.8 RATIONALE OF THE STUDY
Many co-conversion studies related to co-gasification of biomass and coal have focused on
parametric studies of the gasifier and the feasibility in feedstock availability and supply,
omitting the mechanisms by which mixtures of biomass and coal interact including how they

9
thermally degrade during co-conversion. This interaction is an issue yet to be solved. The
interaction occurring between biomass and coal during thermal conversion have not been
sufficiently investigated. This require further evaluation to clarify the mechanism and
conditions by which the two fuels interact when blended and co-gasified.
1.9 DISSERTATION OUTLINE
This dissertation provided an elucidation on the characterization of various biomass and coal
with the aim of selecting a particular biomass material for co-gasification with coal
employing computer simulation. It has been arranged into the following chapters:
Chapter 1 - This chapter provides an overview of the basic theory behind this work. The
chapter covers the background of the study, the problem statement and rationale of the study
as well as research objectives including delineation and limitation of the study. Research
questions and definition of terms were also covered in this chapter.
Chapter 2 – This chapter provides a synthesis of literature that is relevant to the study. Here,
we looked at published information by various researchers on similar studies.
Chapter 3 – This chapter describes the research methodologies and techniques adopted in
carrying out this research, and justification for the choice and use of the techniques, providing
guidance to achieve the objectives of the research.
Chapter 4 - Presents the results, data analysis, including discussion of findings. The results
were presented and discussed in relation to existing theories and literature.

10
Chapter 5 – This chapter outlines the summary and conclusion drawn from the foregoing as
well as the summary of the drawbacks and limitations, ending with some recommendations
for future work that was beyond the scope of this study.
Appendix A – This provides the research outputs associated with this project in form of
submitted papers for review in peer reviewed journals and conference proceedings.
11
6 CHAPTER TWO: LITERATURE REVIEW
2.1 INTRODUCTION
This chapter contains a synthesis of literature on biomass (corn stover, eucalyptus, cow dung,
chicken litter and pinewood) and coal (coal properties, availability in South Africa as well as
gasification of the two materials separately) and in (c) combination (co – gasification).
2.2 BIOMASS
Properties of biomass and coal relevant to co-gasification are briefly reviewed. It is important
to understand the fuel properties of biomass in order to be able to estimate its energy output
or performance in conversion systems [Anukam et al., 2014].
2.2.1 BIOMASS CHARACTERISATION
Characterization of biomass involves obtaining sufficient information about a specific fuel to
be used before gasification processes. Biomass contains various amounts of lignocellulose
(cellulose, hemicelluloses, and lignin) and a small amount of other extracts.
2.2.1.1 CELLULOSE
Cellulose is generally the largest fraction of the secondary cell wall in wood, representing
about 40–50 weight percentage of the biomass and hemicelluloses portion represents 20–40
12
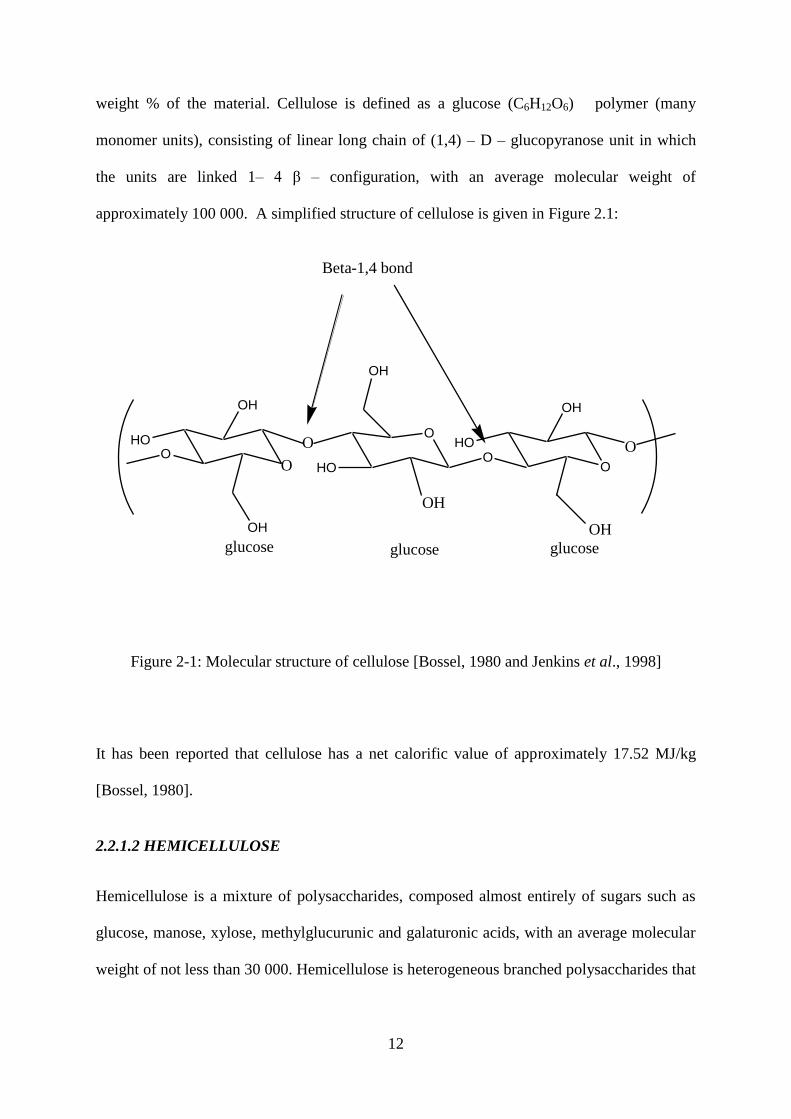
weight % of the material. Cellulose is defined as a glucose (C6H12O6) polymer (many
monomer units), consisting of linear long chain of (1,4) – D – glucopyranose unit in which
the units are linked 1– 4 β – configuration, with an average molecular weight of
approximately 100 000. A simplified structure of cellulose is given in Figure 2.1:
OHO
OH
O
OH
O
HO
OH
OH
OO
OH
HO
OHglucose glucose glucose
O
Beta-1,4 bond
O
Figure 2-1: Molecular structure of cellulose [Bossel, 1980 and Jenkins et al., 1998]
It has been reported that cellulose has a net calorific value of approximately 17.52 MJ/kg
[Bossel, 1980].
2.2.1.2 HEMICELLULOSE
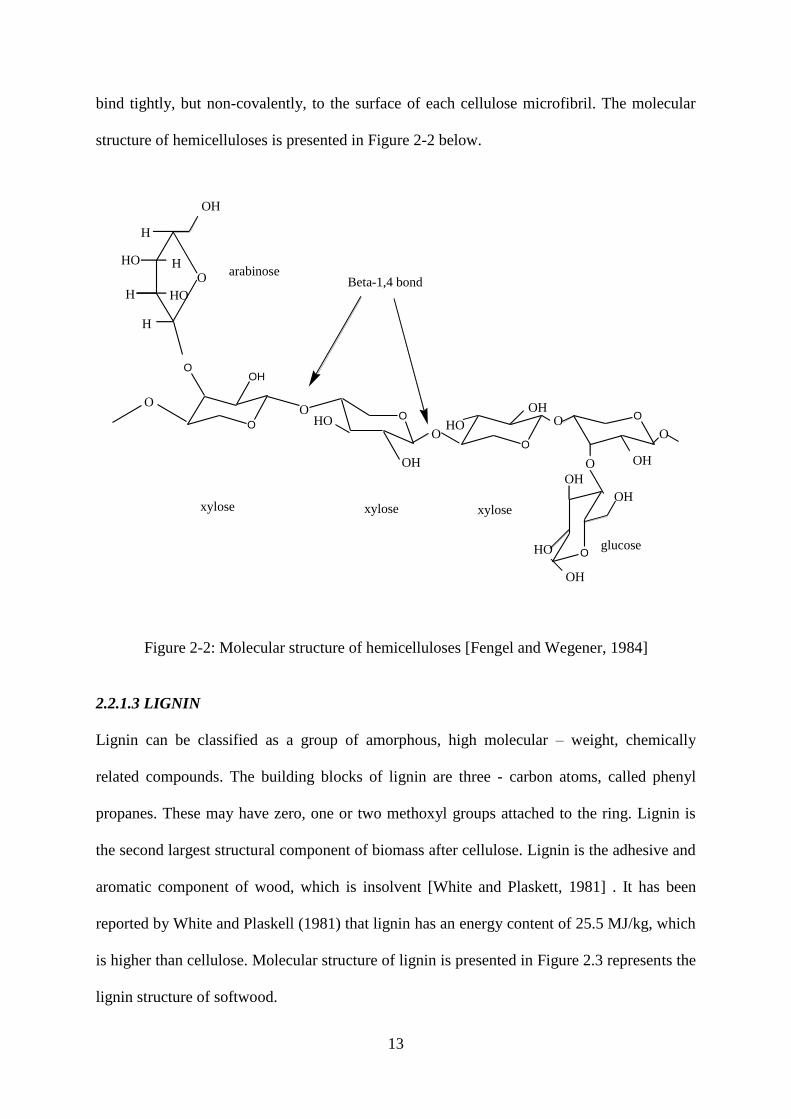
Hemicellulose is a mixture of polysaccharides, composed almost entirely of sugars such as
glucose, manose, xylose, methylglucurunic and galaturonic acids, with an average molecular
weight of not less than 30 000. Hemicellulose is heterogeneous branched polysaccharides that
13
bind tightly, but non-covalently, to the surface of each cellulose microfibril. The molecular
structure of hemicelluloses is presented in Figure 2-2 below.
O
O
HHO
H
H
H
O
OH
HO
OH
OO
O
OH
HOO
O
HO
OHOO
OH
O
O
O
OH
OH
OH
HO glucose
arabinose
xylose xylose xylose
Beta-1,4 bond
Figure 2-2: Molecular structure of hemicelluloses [Fengel and Wegener, 1984]
2.2.1.3 LIGNIN
Lignin can be classified as a group of amorphous, high molecular – weight, chemically
related compounds. The building blocks of lignin are three - carbon atoms, called phenyl
propanes. These may have zero, one or two methoxyl groups attached to the ring. Lignin is
the second largest structural component of biomass after cellulose. Lignin is the adhesive and
aromatic component of wood, which is insolvent [White and Plaskett, 1981] . It has been
reported by White and Plaskell (1981) that lignin has an energy content of 25.5 MJ/kg, which
is higher than cellulose. Molecular structure of lignin is presented in Figure 2.3 represents the
lignin structure of softwood.

14
O
OH
OH HO
O
HO
O
CH3
lignin
lignin
O O
O
H3C
O
CH3
HO
O CH3
O
OH
HO
O
CH3
O
HO
OHO
OH
O CH3
Figure 2-3: Molecular structure of lignin [Safriti, 2005]
It is mainly the properties of the biomass source that determines the choice of the conversion
route and any subsequent processing difficulties that may arise. Each type of biomass source
has specific properties that determine its performance as a fuel in gasification or combustion
devices. These properties include moisture content, volatile matter content, and elemental
composition, heating value, bulk density, nitrogen content, sulfur and chlorine content.
Biomass properties dictate the form of energy conversion route [Safriti, 2005].
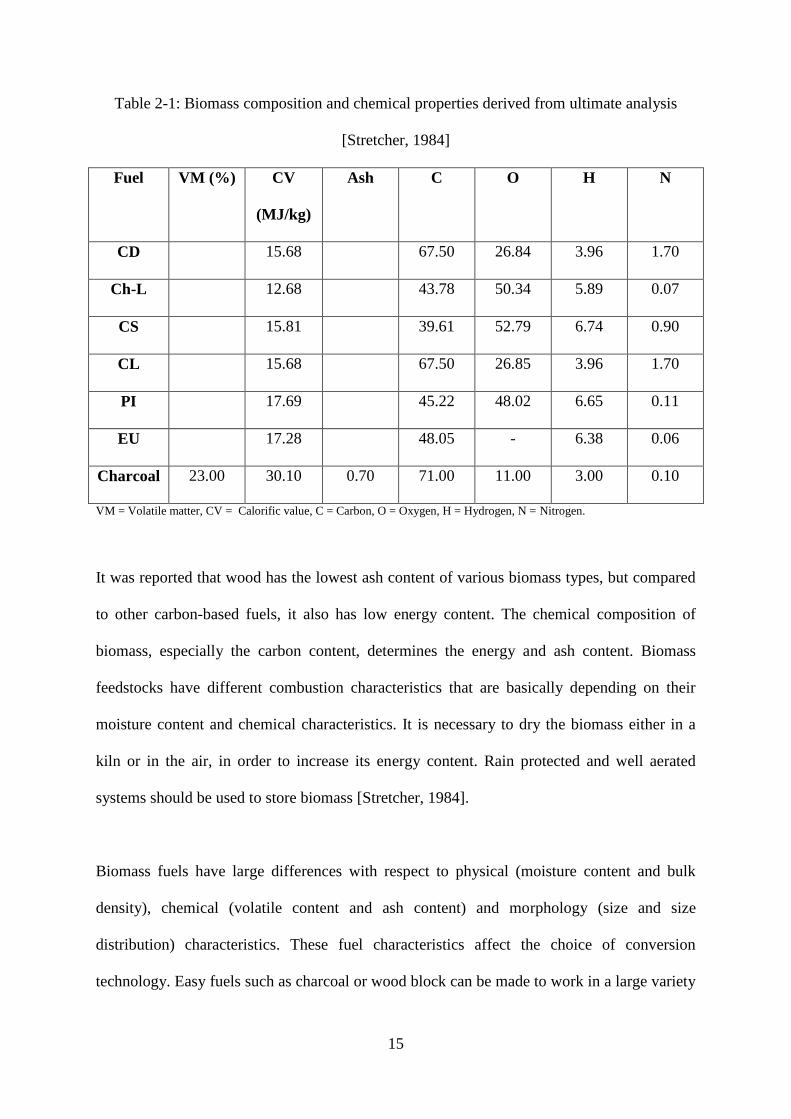
Table 2.1 shows the biomass composition and chemical properties.
15
Table 2-1: Biomass composition and chemical properties derived from ultimate analysis
[Stretcher, 1984]
Fuel VM (%) CV
(MJ/kg)
Ash C O H N
CD 15.68 67.50 26.84 3.96 1.70
Ch-L 12.68 43.78 50.34 5.89 0.07
CS 15.81 39.61 52.79 6.74 0.90
CL 15.68 67.50 26.85 3.96 1.70
PI 17.69 45.22 48.02 6.65 0.11
EU 17.28 48.05 - 6.38 0.06
Charcoal 23.00 30.10 0.70 71.00 11.00 3.00 0.10
VM = Volatile matter, CV = Calorific value, C = Carbon, O = Oxygen, H = Hydrogen, N = Nitrogen.
It was reported that wood has the lowest ash content of various biomass types, but compared
to other carbon-based fuels, it also has low energy content. The chemical composition of
biomass, especially the carbon content, determines the energy and ash content. Biomass
feedstocks have different combustion characteristics that are basically depending on their
moisture content and chemical characteristics. It is necessary to dry the biomass either in a
kiln or in the air, in order to increase its energy content. Rain protected and well aerated
systems should be used to store biomass [Stretcher, 1984].
Biomass fuels have large differences with respect to physical (moisture content and bulk
density), chemical (volatile content and ash content) and morphology (size and size
distribution) characteristics. These fuel characteristics affect the choice of conversion
technology. Easy fuels such as charcoal or wood block can be made to work in a large variety

16
of equipments. Difficult fuels such as rice husks or sugar cane bagasse require very specific
and expensive equipments or in fuel preparation facilities. Biomass materials contain very
few components that can cause environmental problems. Sulfur and chlorine may be present
in small amounts, and contribute to the formation of acid rain (H2SO3) when they are
converted into SO2 and HCl during combustion. For nitrogen content determination, nitrogen
oxides (NO and NO2, collectively referred to as NOx) also contribute to the formation of acid
rain. Two types of NOx formation takes place during combustion namely
A thermally NOx formation which takes place at temperatures above 950 oC from the
nitrogen contained in the combustion air.
A fuel NOx formation which occurs at lower temperatures from the nitrogen contained
in the fuel [Quaack et al., 1999].
2.2.2 THE PROPERTIES OF BIOMASS
Τhe use of any biomass for conversion to energy will be affected by the values of its
physicochemical properties. These values will not only determine the conversion process but
in general the investment evaluation, as a whole. The dependence of those properties on the
different biomass resources which they come from is great and the in-depth understanding of
them is essential before the thermochemical conversion process can be considered [Anukam
et al., 2014].
In general, the biomass properties that are of the greatest importance in energy processes are
moisture content, ash content, volatile matter content and heating value as well as bulk
density and alkali metal content. These properties are usually described in terms of proximate
17
and ultimate analysis. The following sub-sections attempts to describe these concepts in
detail.
2.2.2.1 PROXIMATE ANALYSIS
Proximate analysis indicates the percentage by weight of the fixed carbon, volatiles, ash, and
moisture content in biomass or coal. The amounts of fixed carbon and volatile combustible
matter directly contribute to the heating value of coal [Anukam et al., 2014]. The following
sub-sections describes the composition of biomass and/or coal in terms of proximate analysis.
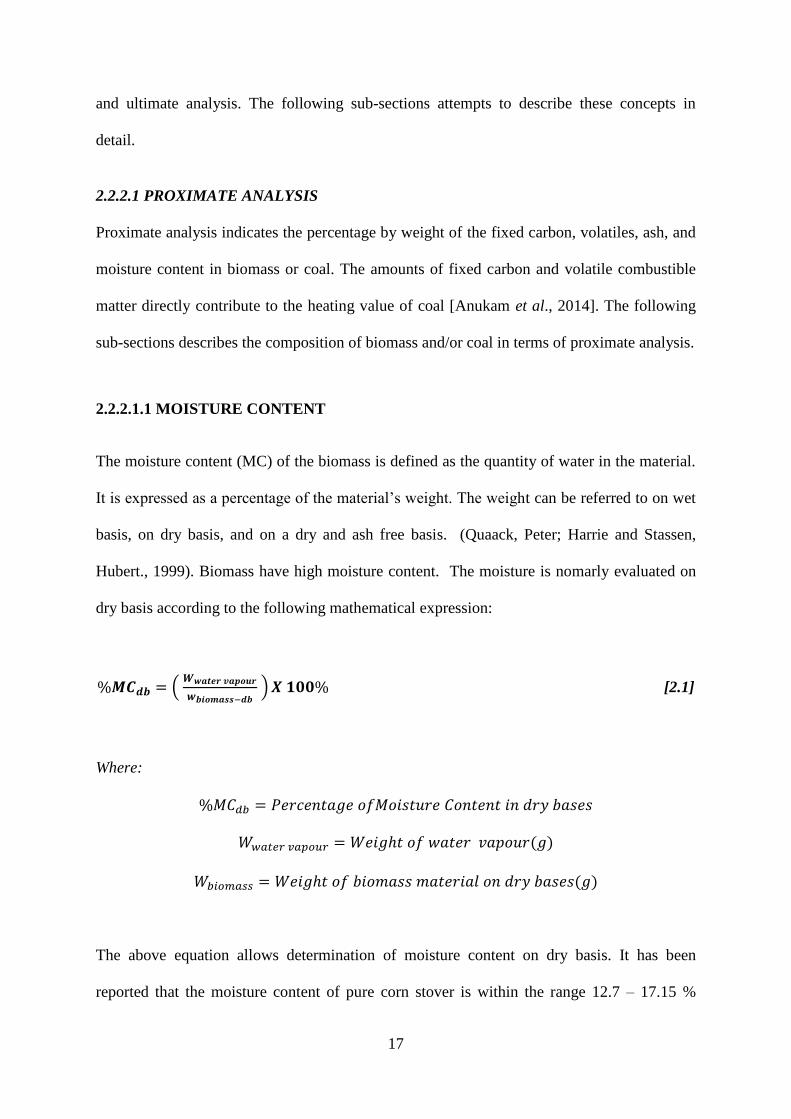
2.2.2.1.1 MOISTURE CONTENT
The moisture content (MC) of the biomass is defined as the quantity of water in the material.
It is expressed as a percentage of the material’s weight. The weight can be referred to on wet
basis, on dry basis, and on a dry and ash free basis. (Quaack, Peter; Harrie and Stassen,
Hubert., 1999). Biomass have high moisture content. The moisture is nomarly evaluated on
dry basis according to the following mathematical expression:
%𝑴𝑪𝒅𝒃 = ( 𝑾𝒘𝒂𝒕𝒆𝒓 𝒗𝒂𝒑𝒐𝒖𝒓
𝒘𝒃𝒊𝒐𝒎𝒂𝒔𝒔−𝒅𝒃 ) 𝑿 𝟏𝟎𝟎% [2.1]
Where:
%𝑀𝐶𝑑𝑏 = 𝑃𝑒𝑟𝑐𝑒𝑛𝑡𝑎𝑔𝑒 𝑜𝑓𝑀𝑜𝑖𝑠𝑡𝑢𝑟𝑒 𝐶𝑜𝑛𝑡𝑒𝑛𝑡 𝑖𝑛 𝑑𝑟𝑦 𝑏𝑎𝑠𝑒𝑠
𝑊𝑤𝑎𝑡𝑒𝑟 𝑣𝑎𝑝𝑜𝑢𝑟 = 𝑊𝑒𝑖𝑔ℎ𝑡 𝑜𝑓 𝑤𝑎𝑡𝑒𝑟 𝑣𝑎𝑝𝑜𝑢𝑟(𝑔)
𝑊𝑏𝑖𝑜𝑚𝑎𝑠𝑠 = 𝑊𝑒𝑖𝑔ℎ𝑡 𝑜𝑓 𝑏𝑖𝑜𝑚𝑎𝑠𝑠 𝑚𝑎𝑡𝑒𝑟𝑖𝑎𝑙 𝑜𝑛 𝑑𝑟𝑦 𝑏𝑎𝑠𝑒𝑠(𝑔)
The above equation allows determination of moisture content on dry basis. It has been
reported that the moisture content of pure corn stover is within the range 12.7 – 17.15 %

18
[Rene et al., 2013] on an air dried basis. That of eucalyptus was reported as between 9 – 11
%, cow dung between 10 – 15 % and chicken litter 18.68 – 51.8% [de Olivier et al., 2013] all
also on an air dried basis. Lynch et al., 2013 reported moisture content of pinewood to be
beween 0.1 – 2 % on a dry basis.
2.2.2.1.2 VOLATILE MATTER
Volatile matter (VM) refers to the part of the biomass that is released when biomass is heated
(up to 400 oC to 500
oC. During the heating process, the biomass decompose into volatile
gases and solid char [Mamphweli, 2009]. Biomass material has a high volatile matter content
(up to 80%), whereas, coal has a low volatile matter (less than 20%). It comprises of all liquid
and tarry residues not fully driven off in the carbonization process [Chen and Azeredo, 2005].
VM can be mathematically determined by the following expression [Mamphweli, 2009]:
%𝑽𝑴𝒅𝒃 = ( 𝑾𝒕𝒐 − 𝑾𝒕𝒙
𝑾𝒕𝒙 ) 𝑿 𝟏𝟎𝟎% [2.2]
Where:
%𝑉𝑀𝑑𝑏 = 𝑃𝑒𝑟𝑐𝑒𝑛𝑡𝑎𝑔𝑒 𝑜𝑓𝑉𝑜𝑙𝑎𝑡𝑖𝑙𝑒 𝑚𝑎𝑡𝑡𝑒𝑟 𝑖𝑛 𝑑𝑟𝑦 𝑏𝑎𝑠𝑒𝑠
𝑊𝑡𝑜 = 𝑊𝑒𝑖𝑔ℎ𝑡 𝑜𝑓 𝑖𝑛𝑖𝑡𝑖𝑎𝑙 𝑚𝑎𝑠𝑠 𝑜𝑓 𝑐𝑢𝑡 − 𝑜𝑓𝑓 𝑠𝑎𝑚𝑝𝑙𝑒 (𝑔)
𝑊𝑡𝑥 = 𝑊𝑒𝑖𝑔ℎ𝑡 𝑜𝑓 𝑐𝑢𝑡 − 𝑜𝑓𝑓 𝑠𝑎𝑚𝑝𝑙𝑒 𝑎𝑡 𝑎 𝑝𝑎𝑟𝑡𝑖𝑐𝑢𝑙𝑎𝑟 𝑡𝑒𝑚𝑝𝑒𝑟𝑎𝑡𝑢𝑟𝑒(𝑔)
19
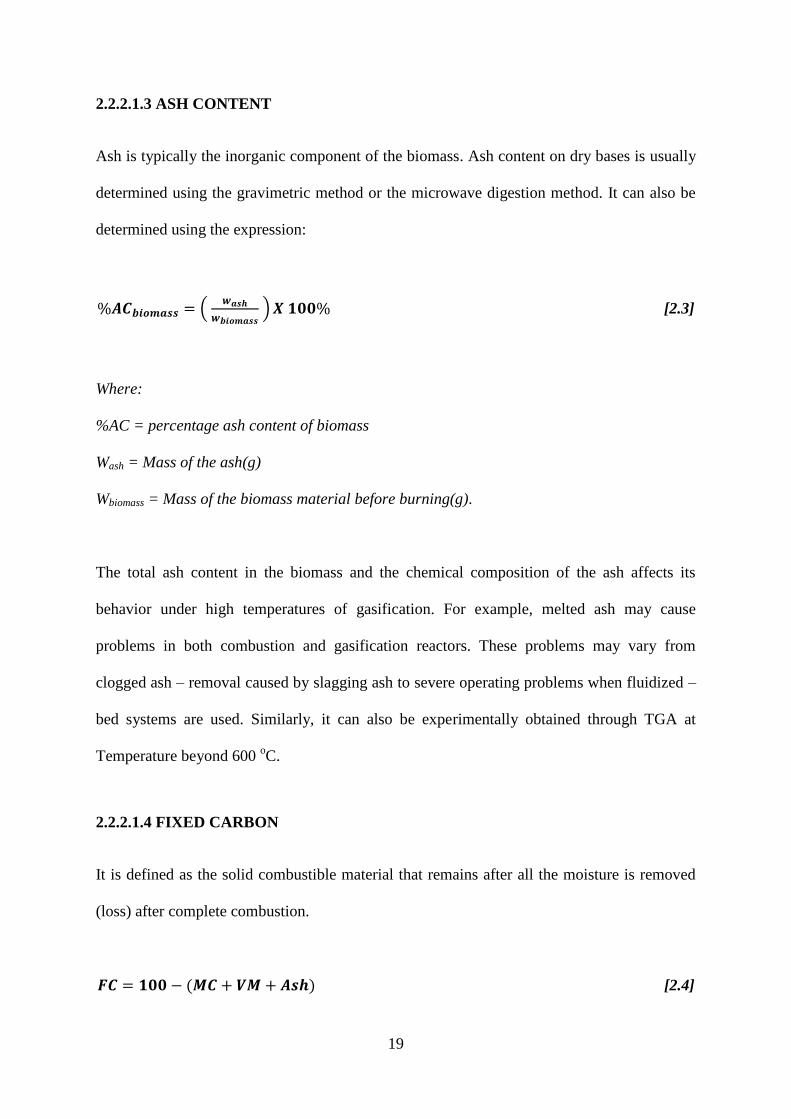
2.2.2.1.3 ASH CONTENT
Ash is typically the inorganic component of the biomass. Ash content on dry bases is usually
determined using the gravimetric method or the microwave digestion method. It can also be
determined using the expression:
%𝑨𝑪𝒃𝒊𝒐𝒎𝒂𝒔𝒔 = ( 𝒘𝒂𝒔𝒉
𝒘𝒃𝒊𝒐𝒎𝒂𝒔𝒔 ) 𝑿 𝟏𝟎𝟎% [2.3]
Where:
%AC = percentage ash content of biomass
Wash = Mass of the ash(g)
Wbiomass = Mass of the biomass material before burning(g).
The total ash content in the biomass and the chemical composition of the ash affects its
behavior under high temperatures of gasification. For example, melted ash may cause
problems in both combustion and gasification reactors. These problems may vary from
clogged ash – removal caused by slagging ash to severe operating problems when fluidized –
bed systems are used. Similarly, it can also be experimentally obtained through TGA at
Temperature beyond 600 oC.
2.2.2.1.4 FIXED CARBON
It is defined as the solid combustible material that remains after all the moisture is removed
(loss) after complete combustion.
𝑭𝑪 = 𝟏𝟎𝟎 − (𝑴𝑪 + 𝑽𝑴 + 𝑨𝒔𝒉) [2.4]
20
Where
FC = Fixed Carbon
M C= Moisture Content
VM = Volatile Matter
AC = Remainder of burnt mixture (Ash content)
2.2.2.1.5 EXTRACTABLES
Extractables are the non-structural materials present in the biomass that can be easily
extracted.
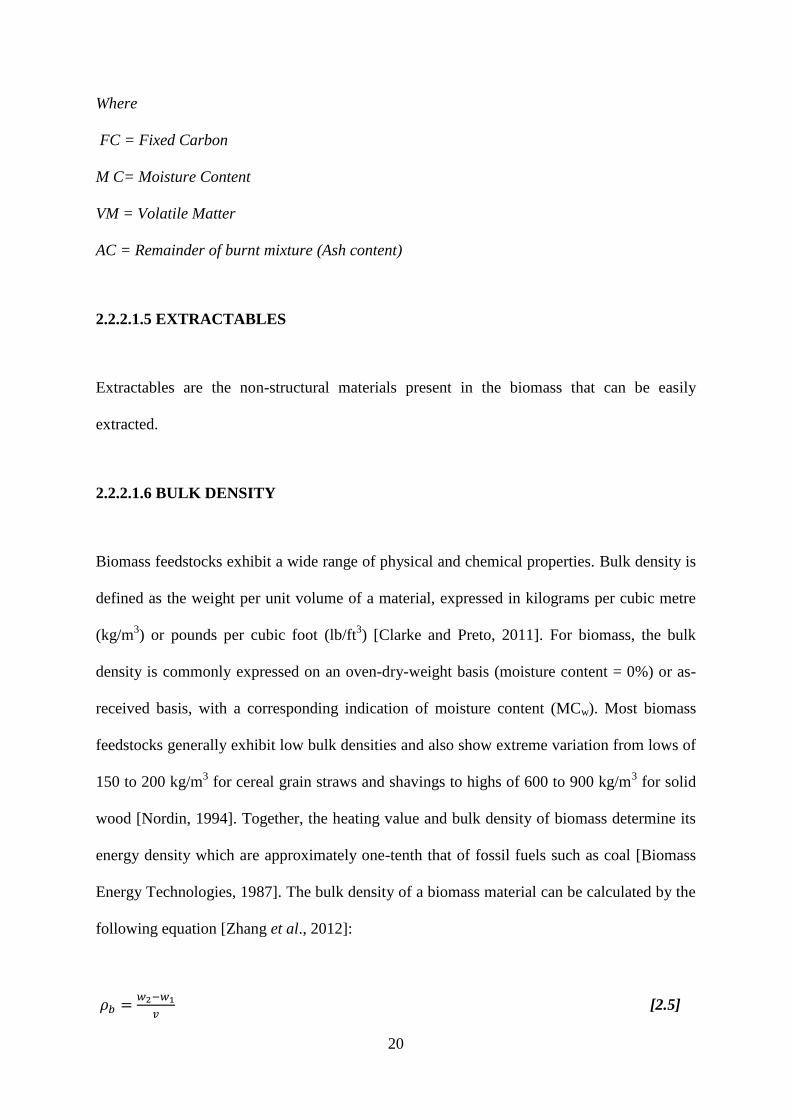
2.2.2.1.6 BULK DENSITY
Biomass feedstocks exhibit a wide range of physical and chemical properties. Bulk density is
defined as the weight per unit volume of a material, expressed in kilograms per cubic metre
(kg/m3) or pounds per cubic foot (lb/ft
3) [Clarke and Preto, 2011]. For biomass, the bulk
density is commonly expressed on an oven-dry-weight basis (moisture content = 0%) or as-
received basis, with a corresponding indication of moisture content (MCw). Most biomass
feedstocks generally exhibit low bulk densities and also show extreme variation from lows of
150 to 200 kg/m3 for cereal grain straws and shavings to highs of 600 to 900 kg/m
3 for solid
wood [Nordin, 1994]. Together, the heating value and bulk density of biomass determine its
energy density which are approximately one-tenth that of fossil fuels such as coal [Biomass
Energy Technologies, 1987]. The bulk density of a biomass material can be calculated by the
following equation [Zhang et al., 2012]:
𝜌𝑏 =𝑤2−𝑤1
𝑣 [2.5]
21
Where:
Рb = The bulk density of the biomass material (g/cm3)
W2 = The weight of the container and biomass material (g)
W1 = The weight of the container (g)
V = the volume of the container (cm3)
2.2.2.2 ULTIMATE ANALYSIS
The ultimate analysis indicates the various elemental constituents such as carbon, hydrogen,
oxygen, nitrogen, sulfur, etc. It is useful in determining the quantity of air required for
combustion and the volume and composition of the combustion gases as well as the heating
performance of the fuel.
2.3 ENERGY CONTENT
The energy content of a fuel is the amount of energy stored per unit volume or mass. Only the
useful or extractable energy is measured, which means that chemically inaccessible energy
such as rest mass energy of the fuel is ignored [Aigner et al., 2011]. This is somewhat
different for the heating value (HV), which is an indication of the energy chemically bound in
the fuel with reference to a standardized environment. The standardization involves
temperature, state of water (vapour or liquid), and combustion products (CO2, H2O, etc.).
These standard conditions are widely available in the literature on the measurement of
heating values. The energy chemically bound in the fuel is given by the heating value of the
fuel in energy per amount of matter (J Kg-1
). This energy cannot be measured directly, but
only with respect to a reference state. Reference states may differ, so a number of different
22
heating values exist. The best known are the lower heating value (LHV) and higher heating
value (HHV). For the LHV, the reference state water is its gaseous state. For the HHV, the
reference state of water is its liquid state.
Bulk density refers to the weight of material per unit volume. For biomass, this is commonly
expressed on an oven-dry-weight basis (moisture content (MC = 0%), or an as –is basis with
corresponding indication of moisture contents (MCw). The heating value and bulk density,
together, determine the energy density (potential energy available per unit volume of the
biomass). In general, biomass energy densities are approximately one-tenth that of fossil fuels
such as petroleum or high quality coal [Quaack, 1999]. The energy is determined from
calorific value measurements. The energy content of biomass is dictated by the amount of
carbon and hydrogen present. Biomass fuels contain more oxygen and less carbon, which
leads to lower calorific values per unit of biomass [Unger, 1994] The energy content of fully
dried biomass is between 15 – 20 MJ/kg. The energy content decreases with increasing
moisture content [Malatji, 2009].
2.4 PROPERTIES OF CORN STOVER
Corn stover is a broad term which describes all of the above ground biomass from the corn
crop except the grain. It is composed of structural components including stalks, leaves, tassel,
husk, and cob, and classified as lignocellulosic biomass with cellulose, hemicellulose and
lignin as its main constituents [Barten, 2013]. It is one crop residue with potential as
alternative fuel source as it could simply be burned or transformed into higher energy
intermediates through gasification. Early settlers often burned corn stover as a heat fuel
source. More recently, this practice has been tried and proven to be a viable practice. A
23
project was undertaken by Pordesimo et al. (2005) to evaluate the combustion energy of
different stover fractions. Another was undertaken by Deere & Co., ADM, and Monsanto Co.
which showed corn stover burned in lieu of coal as 10% of the burner fuel on a dry basis was
feasible in operation of a power plant employing the fluidized bed boiler. The process varied
greatly with the quality of corn stover, particularly with the concentration of moisture in the
stover.
Corn stover has differing botanical fractions with each having its compositional
characteristics. The stalk fraction accounts for more than half of the total stover fraction. This
is followed by leaves, cobs, and husk. Most of the stalk tissue is concentrated in the rind, a
mixture of densely packed vascular bundles embedded in the outer periphery of the
internodes. This tissue accounts for less than 20% of the cross sectional area of the stalk, but
more than 80% of the stalks dried mass [Dhugga, 2007]. Table 2-2 shows the properties of
corn stover.
24
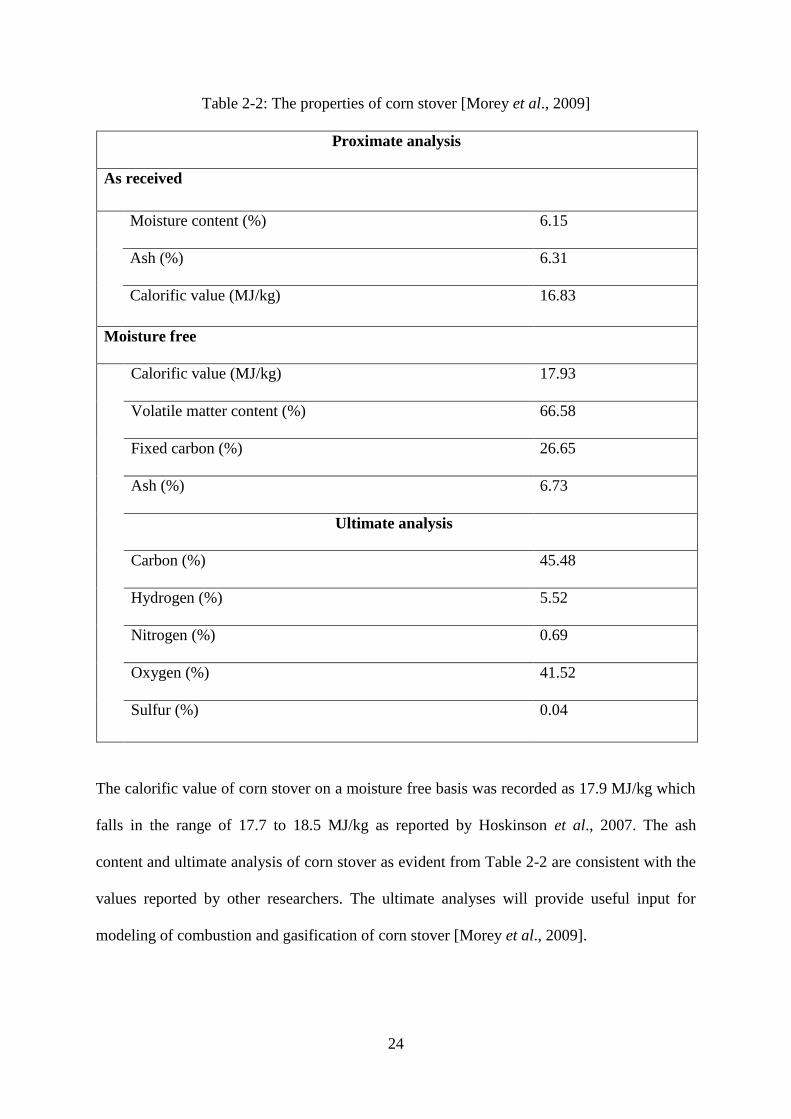
Table 2-2: The properties of corn stover [Morey et al., 2009]
Proximate analysis
As received
Moisture content (%) 6.15
Ash (%) 6.31
Calorific value (MJ/kg) 16.83
Moisture free
Calorific value (MJ/kg) 17.93
Volatile matter content (%) 66.58
Fixed carbon (%) 26.65
Ash (%) 6.73
Ultimate analysis
Carbon (%) 45.48
Hydrogen (%) 5.52
Nitrogen (%) 0.69
Oxygen (%) 41.52
Sulfur (%) 0.04
The calorific value of corn stover on a moisture free basis was recorded as 17.9 MJ/kg which
falls in the range of 17.7 to 18.5 MJ/kg as reported by Hoskinson et al., 2007. The ash
content and ultimate analysis of corn stover as evident from Table 2-2 are consistent with the
values reported by other researchers. The ultimate analyses will provide useful input for
modeling of combustion and gasification of corn stover [Morey et al., 2009].
25
2.5 AVAILABILITY AND USE OF BIOMASS RESOURCE
In Africa, most of the biomass used is harvested informally and only a small part is
commercialized. Wood is the largest energy source of biomass. Contributors include timber
industry, agricultural crop and raw materials from the forest. Waste energy is the second
largest source of biomass energy. The main contributors are municipal solid waste and
manufacturing waste. Alcohol fuels are largely contributor and are mainly derived from corn.
Any source can be used to fuel biomass energy production. Rubbish, manure, animal waste,
wood chips, seaweed, corn stalk and other waste, livestock manure, human waste (faeces).
Traditional technologies predominate.
In many parts of Asia and Latin America, on the other hand, modern and commercial bio
energy options are readily available and significant. The Brazilian ethanol programme, based
largely on sugar cane, is well established and provides alternative fuel to the transportation
sector at highly competitive prices. In addition to wood fuels, other biomass fuels such as
forest and crop residues, as well as animal waste, are a common source of bio-energy. Many
countries still have land available for energy plantations. Integrating biomass harvesting for
energy purpose with forestry and agricultural activities is another option. In most regions, the
use of biomass still needs to be sustainable, this being true both where traditional and modern
technologies are applied [Siveria and Foster, 2008].
In South Africa, renewable energy has been reported to account approximately 9% (1999) of
total energy consumption whereby most of this energy is generated from fuel wood and dung
and not modern renewable energy technologies [DME, 2003]. Figure 2.4 shows the South
African Renewable Energy Resource Database (RRDB) and was based on the analysis of a

26
comprehensive data set, which covered the whole of South Africa [DME, Eskom and CSIR,
2001].
.
Figure 2-4: Total biomass energy potential for South Africa [DME, Eskom and CSIR, 2001]
The total potential biomass energy in South Africa is represented as modelled by Renewable
Resource Database (RRDB). High Energy densities are found around sugar, wood and pulp
mills. It is at these mills where the potential lies for Independent Power Producers (IPP)
[DME, Eskom and CSIR, 2001].
27
2.6 TYPES AND SOURCES OF BIOMASS
The main source of biomass is fuel wood in the rural domestic sector, bagasse in the sugar
industry, energy crops such as maize (corn stover), sunflower and Jatropha tree for bio-fuel
production, and pulp and paper waste in the commercial forestry industry for in-house heat
and electricity generation. Wood is one of the most important biomass. Trees collected from
forest can be logged or cut into appropriate size for direct use as fuel. Woodworking
industries are able to make trees by processing them into construction materials. Debris of
wood from construction is also used as fuel. Residues such as bark, sawdust and odd sized
pieces are economically used as fuel. Many agricultural residues can be used as fuel. These
include straws from grain, husks from rice, coconut or coffee, stalks from maize or cotton,
bagasse from sugar cane. Energy cropping from cultivated biomass (poplar, willow, sugar
cane, sweet sorghum) is also used as fuel. Electricity generated from bagasse contributes
some 60% of Mauritius electricity needs during the 9-month harvesting season [DME and
DANCED, 2001].
Fuel wood is the main source of energy for most rural households. Demand exceeds supply in
many rural areas of South Africa, resulting in environmental degradation caused by
unsustainable harvesting practice and past clearance of land for residential and agricultural
purpose. Targeted intervention in these areas to manage woodlands for the benefit of rural
household is recognized in the White Paper on Energy Policy. The Department of Water
Affairs and Forestry (DWAF) is responsible for community forestry and as such, is currently
preparing a strategy for managing wood supply in the rural areas. According to DWAF, the
key biomass resources in terms of renewable energy are invasive aliens (e.g. exotic acacia
species like black wattle and Port Jackson), commercial plantation and the wood industry,
28
woodlots, trees in the urban environment, woodland and indigenous and trees cultivated as a
fuel crop [DWAF, 2003]. The potential exists to utilize the manure and litter from livestock
to generate methane gas through anaerobic fermentation in biogas plants for electricity
generation. Cattle farms in South Africa are free range and the poultry and pigs have large
amount of manure available on site [DME, Eskom and CSIR, 1999].
2.7 THERMAL DEGRADATION OF BIOMASS COMPONENTS
When biomass are subjected to high temperatures, changes occur in its chemical structure and
the major components are degraded. These changes are heavily dependent on the form of the
material, as well as process parameters, such as heating rate. When biomass such as wood is
progressively heated to a higher temperature, various degradation products are produced.
Loss of water and volatile components takes place in temperature below 140 oC, the
production of CO2 and CO can be detected [Hill, 2006]. Hemicelluloses are known as the
most thermally unstable biomass components. The degradation of hemicelluloses increases
with temperature and heat residence time and happens between 100 oC and 200
oC
[Bourgeois et al., 1989]. Cellulose degradation, on the other hand, occurs at significantly
higher temperature, because of crystalline structure of cellulose. It degrades in a temperature
range of 300 – 340 oC [Kim et al, 2001].
Lignin is accepted as the most thermally stable, although lignin degradation stretches over a
wide temperature range starting at 180 oC [Hill, 2006]. Generally, all volatile matter is
released at temperature above 450–500 oC. The remaining material is char [Beall and
Eickner, 1970].

29
2.8 ADVANTAGES AND DISADVANTAGES OF BIOMASS AS A
FUEL SOURCE
Climate change, global warming conditions and changes in the atmospheric concentration of
sulfur and carbon compounds are leading to an expanding interest towards alternatives to
fossil fuels. Fossil fuel stocks are limited and have a detrimental effect of the environmental
conditions due to pollution caused by emission of greenhouse gases because they cause the
following problems:
i. Increased extremes in climatic conditions
ii. Increase in global temperature
iii. Loss of biodiversity
iv. Increased desertification
v. Changes in sea water level
In the latter mentioned context, biomass could be used as an alternative energy resource,
because it is composed of environmental friendly, renewable compounds [Bezzon and
Cortez, 1999; Strehler, 1998]. The biomass definition encompasses numerous materials that
may be converted into efficient fuels. These materials can be divided into the following:
i. Woody biomass (wood, branches, leaves and waste)
ii. Agricultural biomass and residues
iii. Industrial processing residues
iv. Dedicated energy crops
v. Animal wastes (manure, poultry litter)
30
In this context, biomass is defined as all renewable organic material, whether in the form of
plant materials, animal manure, food processing, forest material or urban waste [Scane, 1993;
Kitani and Hall, 1989].
2.8.1 ADVANTAGES OF BIOMASS AS A FUEL
Biomass materials have many benefits as a fuel. The advantages associated with the use of
biomass as a fuel include the following:
i. Clean combustion
ii. Compact burning equipment
iii. High thermal efficiency
iv. A good degree of control
v. Provides energy security
vi. Generates local employment in the rural sector
In locations where biomass were already available at reasonable low prices (e.g. rice mill) or
in industries using fuel wood, gasifier system offers definite economic advantages. Biomass
gasification technology is also environment-friendly, because of the firewood savings and
reduction in CO2 emissions.

31
2.8.2 DISADVANTAGES OF BIOMASS AS A FUEL
The disadvantages associated with biomass as a fuel according to White and Paskell (1981)
includes:
i. Its low calorific value compared to fossils
ii. The high moisture content, which inhibits the immediate combustion, because of
dehydration requirements
iii. The low density
iv. Heterogeneous size, weight and shape
2.9 THEORY OF BIOMASS GASIFICATION
Biomass gasification was intensively used to operate the farm and transportation systems
during the World War 2. It can be described as a process that involves the incomplete
combustion of biomass to produce combustible gases, which include carbon monoxide,
hydrogen, methane and tar, this blend is called producer gas, which can be utilized to run
internal combustion engines, to substitute furnace oil in direct heat applications or to produce
methanol for industrial or heat engines [Rajvanshi, 1986]. Historically, gasification was
conducted at low temperatures whereby biomass was partially combusted or oxidized. Partial
oxidation yields low energy content gas compared to gasification. The quality of gas derived
was usually poor, as it contained impurities, and too much fuel was required to power any
system. Over the decades, gasification has been improved and is now a high efficient
thermochemical technology of converting biomass into energy. If conducted according to
system specifications, the technology is capable of performing at more than 70% cold gas
32
efficiency. The producer gas retains 70 – 80% of the original biomass energy [Demirbas,
2004].
Walker (2006) reported that the process of gasification occurs by heating biomass to high
temperature (1200 – 1400 oC) by combustion in an oxygen deprived environment, therefore
limiting combustion. The combustion gases are then reduced by being passed through an
incandescent bed of charcoal. The chemical processes occurring in four stages/ zones can be
distinguished namely drying zone, pyrolysis (devolatization) / carbonization zone, reduction
zone and hearth zone. The first phase of heating and drying (drying zone) is unproductive in
terms of energy output, as the energy is used to evaporate remaining moisture content of
biomass. In the second stage (pyrolysis zone), volatile components of the biomass are
removed. The temperature range at this stage is 450 – 600 oC. Volatile materials that are
pyrolysed comprised of water, carbon monoxide, hydrogen, methane, volatile tars and carbon
monoxide. The remaining biomass is a carbonized solid fuel – charcoal with 10 – 25% of
original fuel mass. The final stage at temperature between 700 - 1200oC involves the
conversion of char into producer gas that constitutes about 16% CO, 20% H2, 50%N2, 12%
CO2 and 2% CH4 and products such as ash and powder slag [Malatji, 2009].
The gasifier is divided into four zones according to chemical reactions taking place.
Combustion occurs in the oxidation zone. Introduced air in the oxidation zone contains inert
gases such as nitrogen and argon (besides oxygen and water vapor). These inert gases are
non-reactive to fuel constituents. The oxidation takes place at the temperature of 700 – 2000
oC. Heterogeneous (different phases) reaction takes place between oxygen in the air and solid
carbonized fuel (charcoal), producing carbon monoxide. Hydrogen in the fuel reacts with
33
oxygen in the air blast, producing steam. Combustion is described by the following chemical
formulas [Kumar et al., 2009]:
CHxOyNzSs + Air (79 N2 and 21% O2) + H2O(steam) → CH4 + CO + H2 + H2O (unreacted
steam) + C (Char) + Ash + Tar [2.6]
C + O2 → CO2 `∆H = +401.9 kJ/mol [2.7]
H2 + O2 → H2O = +241,1 kJ/mol [2.8]
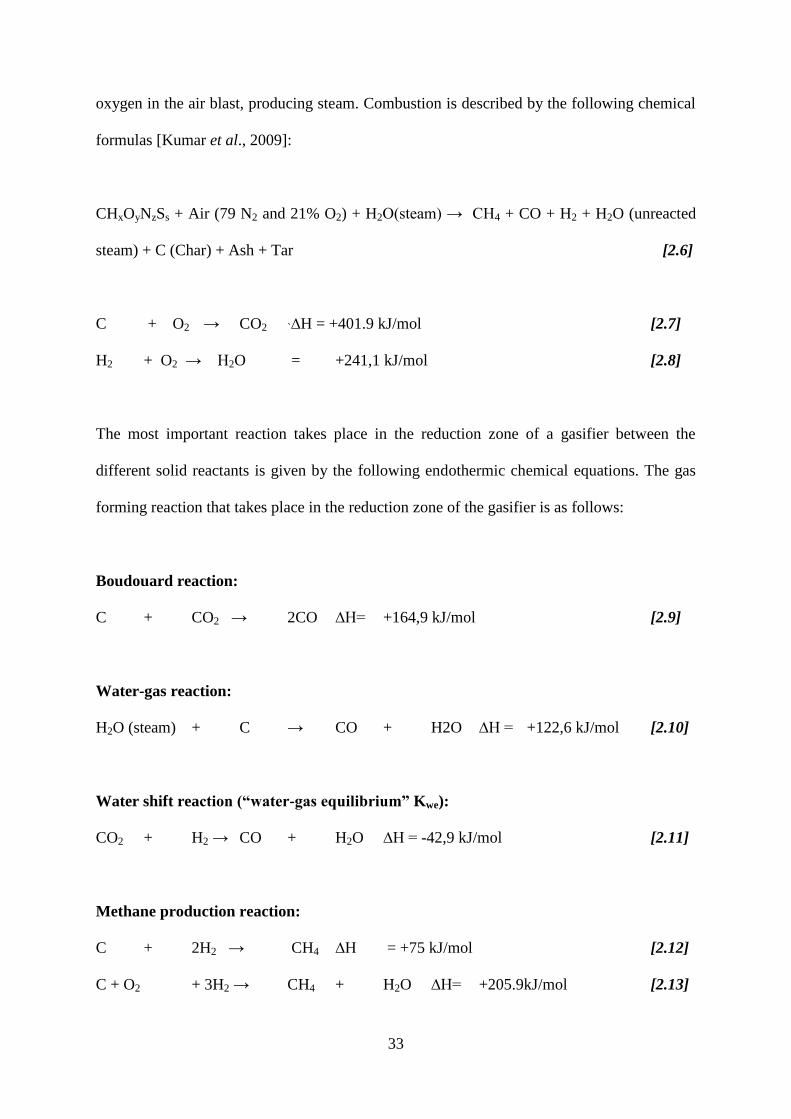
The most important reaction takes place in the reduction zone of a gasifier between the
different solid reactants is given by the following endothermic chemical equations. The gas
forming reaction that takes place in the reduction zone of the gasifier is as follows:
Boudouard reaction:
C + CO2 → 2CO ∆H= +164,9 kJ/mol [2.9]
Water-gas reaction:
H2O (steam) + C → CO + H2O ∆H = +122,6 kJ/mol [2.10]
Water shift reaction (“water-gas equilibrium” Kwe):
CO2 + H2 → CO + H2O ∆H = -42,9 kJ/mol [2.11]
Methane production reaction:
C + 2H2 → CH4 ∆H = +75 kJ/mol [2.12]
C + O2 + 3H2 → CH4 + H2O ∆H= +205.9kJ/mol [2.13]
34
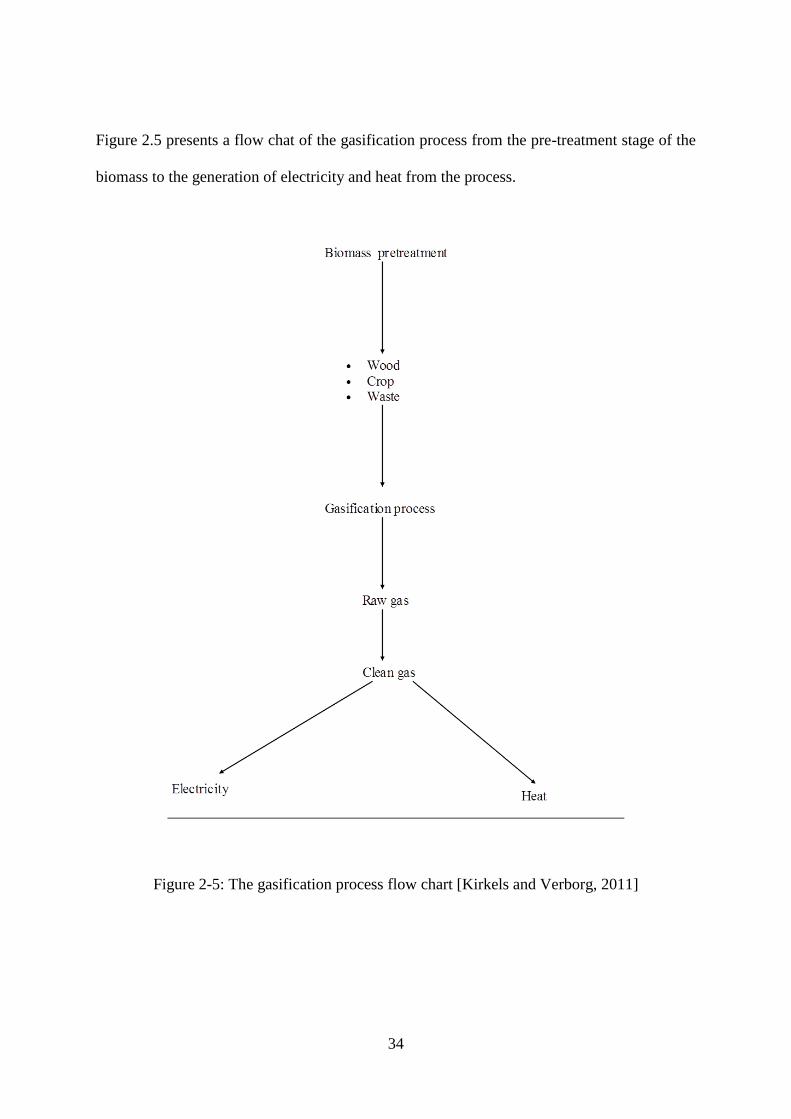
Figure 2.5 presents a flow chat of the gasification process from the pre-treatment stage of the
biomass to the generation of electricity and heat from the process.
Figure 2-5: The gasification process flow chart [Kirkels and Verborg, 2011]
35
2.10 COAL
Coal is mainly formed as the result of slow metamorphosis of biomass over a long period of
time. The degree of that metamorphosis is among the criteria used to determine coal rank. It
is also classified according to the ratio of volatile to fixed carbon and the its heating value as
well as the relative content of elemental carbon [Jayah et al., 2011]. South African coals are
classified and ranges from high to low grade coal. High grade coal is washed and exported
while low grade coal is screened and used locally for electricity generation and fine chemical
production including oil. It has been reported that coal extraction implies non-renewable
energy reserves depletion [Mangena and Brent, 2006].
Coals are organic sedimentary rocks derived from plant remains. The properties of coal
reflect the nature of original plant materials (species and relative proportions of wood, buck
and leaves). Coalification process: peat, lignite, sub-bituminous, bituminous and anthracite.
The rate of coalification is influenced by the combined effects of increased temperature and
pressure over an extended period. The organic components of plant material are principally
cellulose and lignin. Coal is actually derived from lignin. Cellulose biochemically degrades to
CO2 and H2O during accumulation. Petrographically, coal contains microscopically
identifiable components (macros). Lithotypes are classified into three macerals groups
namely vitrinite (from wood), exinite (from pollen and plant waxes) and inertinite. Vitrinite is
present in all coal, hence used as a measure of coal ranking e.g. reflectance measurements
which increases with coal ranking from 0.3 % Peat (brown coal) to 2.5% in anthracite. For
petrographic analysis of reflectance in coal is according to order:
Exinite < vitrinite < inertinite [British Geological Survey, 1989].
36
2.10.1 THE PROPERTIES OF COAL
Coal is a naturally occurring combustible material consisting primarily of the element carbon,
but with low percentage of solid, liquid and gaseous hydrocarbon and other materials such as
nitrogen and sulfur. Coal is usually classified into the sub-groups known as anthracite
(highest rank), bituminous, sub-bituminous, lignite (lowest rank) and peat. The physical,
chemical and other properties vary considerable from sample to sample. Lignite has been
widely used as electricity generation and heat, besides producing various refined chemicals.
Structural characterization of lignite coal presented major challenges because of extreme
complexity and heterogeneity of low rank coal [Meuzelaar et al., 1996]. The properties of
coals as they occur today, reflects the nature and the original plant materials (species and
relative proportion of wood, bark, leaves) and the conditions prevailing during, and
subsequent to, accumulation period. The coalification process is believed to progress through
the sequence: peat, lignite (brown coal), sub-bituminous, bituminous, to anthracite. The rate
of coalification or increase in rank is influenced by the combined effects of increased
temperature and pressures over an extended period, and build-up of overlying, low
conductivity and mineral (organic) sediments. Cellulose and lignin are organic components of
plant material [Durie, 1982]. A description of the different types of coal are provided in the
following sub-sections.
2.10.1.1 LIGNITE
Lignite is the first product of coalification and is intermediate between peat and
subbituminous coal according to the coal classification used in the United States and Canada.
In many countries lignite is considered to be a brown coal. Lignite contains about 60 to 70
percent carbon (on a dry, ash-free basis) and has a calorific value near 17 megajoules per
37
kilogram (7,000 British thermal units per pound). It has been estimated that nearly half of the
world’s total proven coal reserves are made up of lignite and subbituminous coal, but lignite
has not been exploited to any great extent, because it is inferior to higher-rank coals (e.g.,
bituminous coal) in calorific value, ease of handling, and storage stability. In areas where
other fuels are scarce, the production of brown coal far exceeds that of bituminous coal
[Britannica Inc., 2014]. It has been reported that lignite coal (lowest rank) as much as it is
used for electricity generation, it is also providing a variable target for CO2 sequestration and
potential for methane production from it is questionable [Botnen et al., 2009]. Lignite was
reported to release proportionately more CO2 emission than other fossil energy carriers, and
coal will meet the requirements for sustainable climate protection [Thielemann et al., 2007].
2.10.1.2 SUB-BITUMINOUS
Sub-bituminous coal is a type of coal whose properties range from those of lignite to those of
bituminous coal and are used primarily as fuel for steam-electric power generation. It may be
dull, dark brown to black, soft and crumbly at the lower end of the range, to bright jet-black,
hard, and relatively strong at the upper end. They contain 15-30% inherent moisture by
weight and are non-coking (undergo little swelling upon heating) [Babcock & Wilcox
Company, 2014]. Sub-bituminous coals may be dull, dark brown to black, soft and crumbly
at the lower end of the range, to bright jet-black, hard, and relatively strong at the upper end.
They contain 15-30% inherent moisture by weight and are non-coking (undergo little
swelling upon heating) and . have heat content that range from 8300 to 11,500 BTu/lb or
19,306 to 26,749 kJ/kg [Babcock & Wilcox Company, 2014]. Their relatively low density
and high water content renders some types of sub-bituminous coals susceptible to
spontaneous combustion if not packed densely during storage in order to exclude free air
flow. The heat content of sub-bituminous coals range from 8300 to 11,500 BTu/lb or 19,306
38
to 26,749 kJ/kg. Their relatively low density and high water content renders some types of
sub-bituminous coals susceptible to spontaneous combustion if not packed densely during
storage in order to exclude free air flow.
2.10.1.3 BITUMINOUS
Bituminous coal is a relatively soft coal containing a tarlike substance called bitumen. It is of
higher quality than lignite coal but of poorer quality than anthracite coal. Bituminous coal is
an organic sedimentary rock formed by diagenetic and submetamorphic compression of peat
bog material. Bituminous coal has been compressed and heated so that its primary
constituents are macerals vitrinite, exinite, and so on. The carbon content of bituminous coal
is around 60-80%; the rest is composed of water, air, hydrogen, and sulfur, which have not
been driven off from the macerals and its heat content of ranges from 24 to 35 MJ/kg on a
moist,mineral-matter-freebasis [Princeton, 2014].
Bituminous coal is usually black, sometimes dark brown, often with well-defined bands of
bright and dull material. Bituminous coal seams are stratigraphically identified by the
distinctive sequence of bright and dark bands and are classified accordingly as either "dull,
bright-banded" or "bright, dull-banded" and so on. The four most abundant minerals found in
bituminous coals are quartz, kaolinite, illite and pyrite. Size and textural are important
considerations as to whether coal cleaning can remove most sensitive trace elements [Palmer
and Lyons, 1996].
2.10.1.4 ANTHRACITE
Anthracite is a hard natural coal of high luster differing from bituminous coal in containing
less volatile matter and in burning very cleanly (called also hard coal). It contains higher
39
quantities of fixed carbon than any other form of coal and the lowest quantity of volatile
(quickly evaporating) material, giving it the greatest heat value. Anthracites are black and
have a brilliant, almost metallic lustre. Hard and brittle, they can be polished and used for
decorative purposes. They are difficult to ignite but burn with a pale-blue flame and require
little attention to sustain combustion. In the past they were used for domestic heating, but
today they have given way to other sources of energy (e.g., natural gas and electricity)
[Babcock & Wilcox Company, 2014].
2.11 AVAILABILITY AND USE OF COAL IN SOUTH AFRICA
In South Africa, coal is largely found in 19 identified major coal-fields. These coal-fields are
located mainly in KwaZulu-Natal, Mpumalanga, Limpopo and the Free State. Lesser
quantities of coal are found in Gauteng, North, Western and Eastern Cape. In Mpumalanga
province, coal mining fields are based in Witbank, Middleburg, Ermelo and Standerton,
Secunda while in Free State / Gauteng; it is Sasolburg, Vereeniging and North-Western
KwaZulu-Natal [Jeffrey, 2005]. The most coal reserves are found in Mpumalanga. The South
African utility company (Eskom) derives most of its electricity from coal. Electricity power
stations are stationed mostly in Mpumalanga and Northern Cape provinces near coal mining
areas. Generated power supply electricity not only to South Africa, but also beyond its
borders to neighbouring countries such as Zimbabwe, Mozambique, Zambia and Tanzania
(Eskom, 2007).
40
2.12 ADVANTAGES AND DISADVANTAGES OF USING COAL AS A
FUEL
Coal as a fuel source carries both advantages and disadvantages. It can be found in many
places worldwide, and there is plenty in South Africa. It can be easily transported to the
power stations. It is a relatively cheap energy source. Associated disadvantages include but
not limited to creating mines through digging the ground, which can be dangerous, coal
transportation (logistics) by trains or trucks to the power station causes pollution. Burning
coal produces pollution gases such as sulfur dioxide which makes acid rain, burnt coal
releases the most greenhouse gases which may add to global warming, it is non-renewable
source and will run out in about 100 years, coal miners can be affected by black lung diseases
or pneumoconiosis and also emphysema if they breath in the too much coal dust [Babcock &
Wilcox Company, 2014].
2.13 COAL GASIFICATION
Coal gasification technology turns coal and coke feedstocks into a synthetic gas (syngas), a
mixture of hydrogen and carbon monoxide that burns as cleanly as natural gas. Syngas can
then be used to produce a wide range of high-value products such as electricity, fertilizers,
transport fuels and chemicals. Compared to conventional coal-fired power plants, those
producing electricity using coal gasification process emit less CO2 and pollutants. Moreover,
the CO2 from gasification process can be more easily captured from smokestacks-potentially
for storage underground. Syngas is synthesized by mixing pulverized coal with oxygen and
steam at a higher temperature between 1 400–1600 oC. Compressed nitrogen is used to
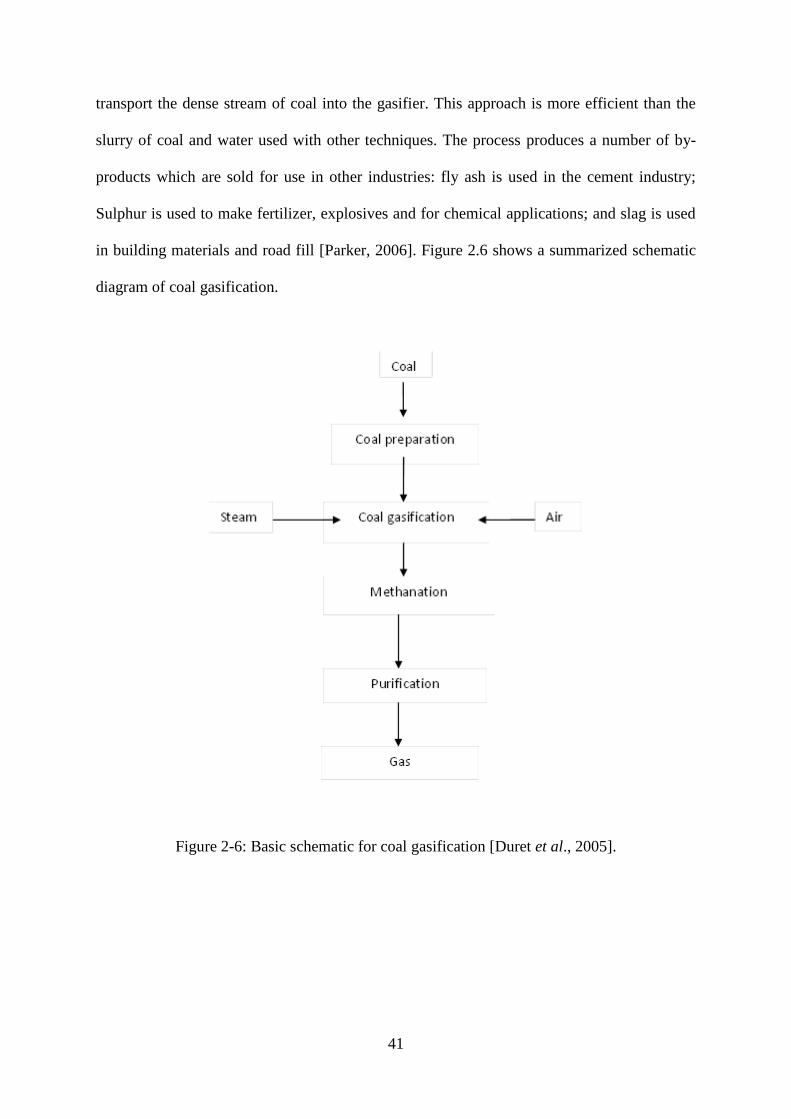
41
transport the dense stream of coal into the gasifier. This approach is more efficient than the
slurry of coal and water used with other techniques. The process produces a number of by-
products which are sold for use in other industries: fly ash is used in the cement industry;
Sulphur is used to make fertilizer, explosives and for chemical applications; and slag is used
in building materials and road fill [Parker, 2006]. Figure 2.6 shows a summarized schematic
diagram of coal gasification.
Figure 2-6: Basic schematic for coal gasification [Duret et al., 2005].

42
2.14 GASIFICATION OF BIOMASS AND COAL
The thermodynamic efficiency of gasifiers and gasification systems is affected by the fuel
composition. Kyoto protocol emphasized the need to combat carbon dioxide emission. Using
biomass (organic feedstock) as fuel is considered as neutral because produced carbon dioxide
is consumed during photosynthesis. It has been reported that as much as it solves CO2
emissions, but it has a lower efficiency in comparison to fossil fuel (coal) [Prins et al., 2007].
The difference in coal and biomass has been noted to lie on their organic matter – woody
biomass contains around 50% weight percentage carbon and 45 percent oxygen while coal
has been reported to contain 60 – 85% weight percentage carbon and 5 – 20% oxygen [Prins
et al., 2007]. Because of biomass high oxygen content, less oxygen is needed for gasification,
but it has a low calorific value thus not beneficial for gasification. Coal has been reported to
have higher calorific values and gives highest efficiency besides its environmental problems.
2.14.1 CO-GASIFICATION OF COAL AND BIOMASS
Co - gasification process involves mixing together coal and biomass and converting the
mixture into the gaseous product stream (synthetic gas), which can be used to produce
electricity, hydrogen, chemicals and liquid transportation fuels. Blending of coal and biomass
in the co-gasification process decreases the environmental impact because biomass are
carbon neutral, if carbon sequestration technology is applied, one actually arrives at a process
that is carbon negative, as carbon is consumed. The main advantage of using coal is the
steady supply of coal supplies a baseline that can be supplemented by biomass whenever
available. Energy crop (Wheat straw and switchgrass) grows quickly.
43
There are technologies to gasify coal and to gasify biomass, but there are uncertainties on
how to mix them. The questions raised include: how does the quality of feedstock affect the
quality of product? What are the optimum percentage of various blends of coal and biomass?
Geographical implication coal and biomass easily also addressed. For any emerging
technology, one of the drivers of commercialization is economics. As energy demand
increases, alternative approaches such as co-gasification becomes more attractive. It is
drawing lots of attention [NETL, 2008]. Co-gasification of waste/biomass and coal
technology offers several benefits such as combining the use of reliable coal supply with
waste/biomass thus qualifying for renewable obligation and climate change benefits, allows
the economies of scale from larger plant than could be supplied just with waste biomass,
capable of achieving high environmental standards on all fuel sources, flexible in choice of
gas to electricity technology reciprocating engine, gas turbine, boiler and in future fuel cell,
potential for petrochemical feedstock besides electricity, potential for sitting at collieries. Gas
cleaning challenges are different from coal and biomass. Sulfur is a major concern for coal
gasification, but chlorine compounds are more important for waste and biomass gasification
[DTI, 2002].
Co-gasification of coal and biomass can be considered as a potential for gasification and
further syngas production and methanol synthesis with excess produced gas, an alternative
liquid fuel which can be directly used for fuel cells. It allows economy of production,
operational stability, optimal thermal efficiency and decreases impact on the environment.
Integrated coal, biomass co-gasification system combined with gas-steam cycle offers various
advantages such as possible continuous operation of coal-gasification reactor at nominal
rates, lowering the cost of electricity production, stabilizing of the quality of the feedstock
44
and gasifier operation and improvement of economic flexibility of the system (two final
products) [Chmielniak, et al., 2003].
Oxygen blown co-gasification (oxy-co-gasification) gasifies coal and biomass by using
oxygen and steam as a gasifying agent after nitrogen removal enables the use of renewable
resource and additional CO2 reduction to produce syngas. This technique increases the
biomass contribution to electricity generation. It is mainly used in large coal-fired power
plants and for production of H2 and fine chemicals. Gasification with air is usually used in
small plants of several megawatts [Valero et al., 2003]. Columbian biomass/coal blends and
mixtures ratios co-gasification in the fluidized bed working at atmospheric pressure studies
show that a mixture of both fuels produces songs that can be used as a chemical precursor,
reduction of greenhouse emission, higher the heating value and higher efficiency It also
showed additional environmental advantage such as reduction of nitrogen oxides and sulfur
emission. Disadvantage of biomass in fluidized beds is the low ash melting point of sawdust
resulting in loss of fluidizability, agglomeration, sintering, deposition, erosion and corrosion
caused by ash [Velez et al., 2008]. Figure 2.7 shows the schematic diagram of co-gasification
of coal and biomass
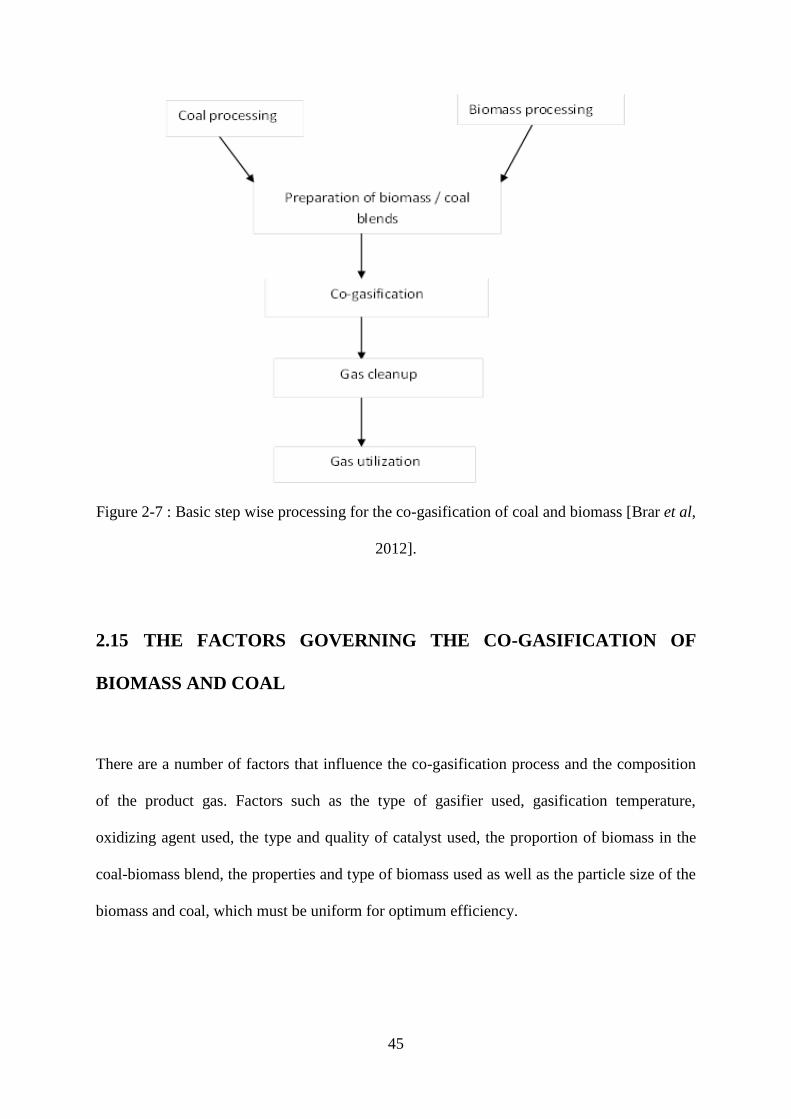
45
Figure 2-7 : Basic step wise processing for the co-gasification of coal and biomass [Brar et al,
2012].
2.15 THE FACTORS GOVERNING THE CO-GASIFICATION OF
BIOMASS AND COAL
There are a number of factors that influence the co-gasification process and the composition
of the product gas. Factors such as the type of gasifier used, gasification temperature,
oxidizing agent used, the type and quality of catalyst used, the proportion of biomass in the
coal-biomass blend, the properties and type of biomass used as well as the particle size of the
biomass and coal, which must be uniform for optimum efficiency.
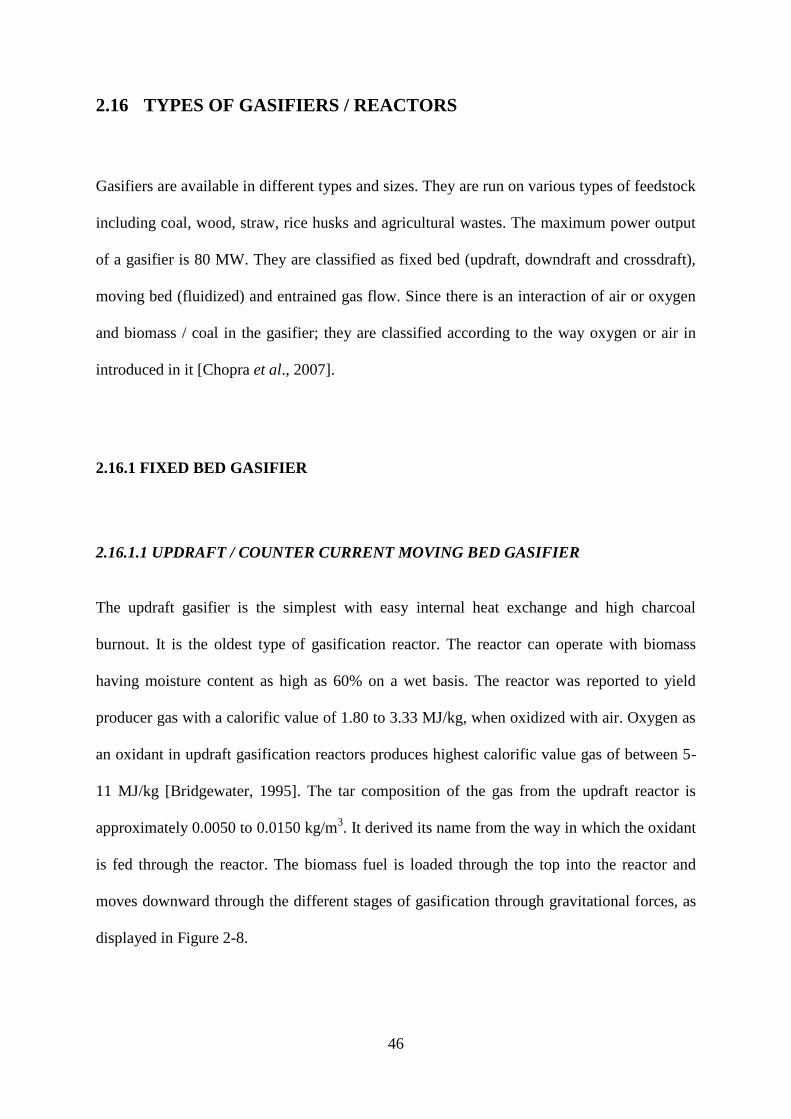
46
2.16 TYPES OF GASIFIERS / REACTORS
Gasifiers are available in different types and sizes. They are run on various types of feedstock
including coal, wood, straw, rice husks and agricultural wastes. The maximum power output
of a gasifier is 80 MW. They are classified as fixed bed (updraft, downdraft and crossdraft),
moving bed (fluidized) and entrained gas flow. Since there is an interaction of air or oxygen
and biomass / coal in the gasifier; they are classified according to the way oxygen or air in
introduced in it [Chopra et al., 2007].
2.16.1 FIXED BED GASIFIER
2.16.1.1 UPDRAFT / COUNTER CURRENT MOVING BED GASIFIER
The updraft gasifier is the simplest with easy internal heat exchange and high charcoal
burnout. It is the oldest type of gasification reactor. The reactor can operate with biomass
having moisture content as high as 60% on a wet basis. The reactor was reported to yield
producer gas with a calorific value of 1.80 to 3.33 MJ/kg, when oxidized with air. Oxygen as
an oxidant in updraft gasification reactors produces highest calorific value gas of between 5-
11 MJ/kg [Bridgewater, 1995]. The tar composition of the gas from the updraft reactor is
approximately 0.0050 to 0.0150 kg/m3. It derived its name from the way in which the oxidant
is fed through the reactor. The biomass fuel is loaded through the top into the reactor and
moves downward through the different stages of gasification through gravitational forces, as
displayed in Figure 2-8.
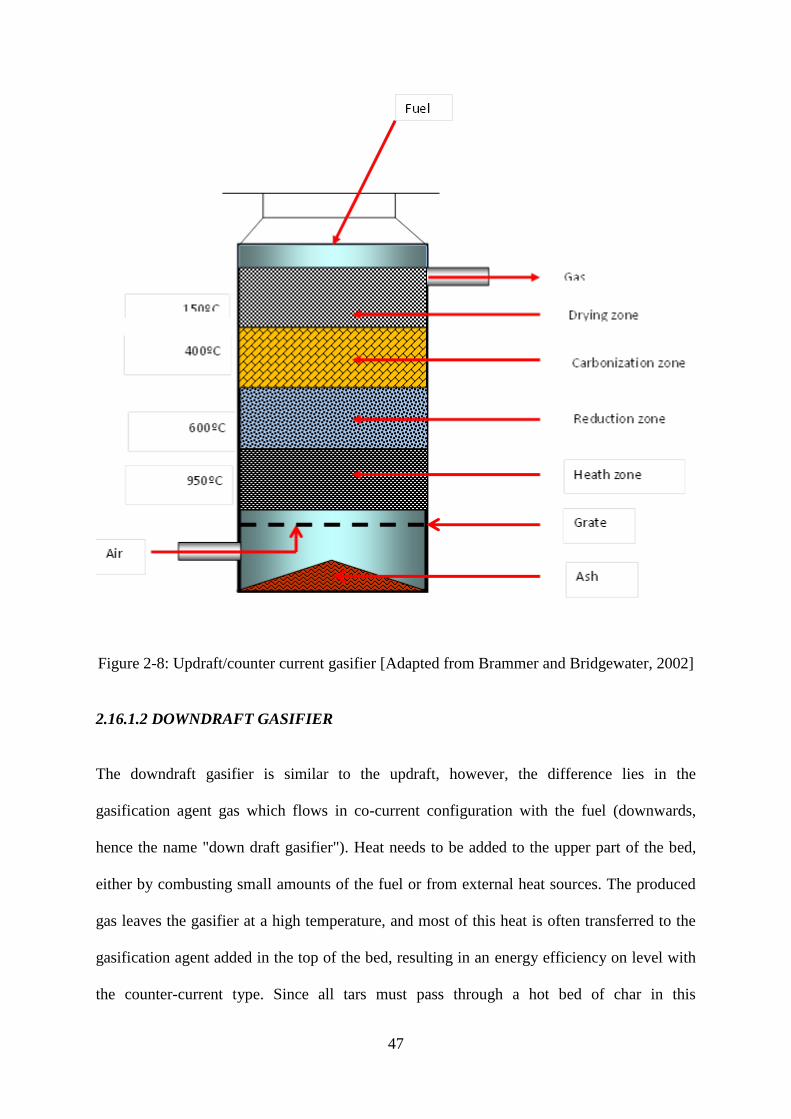
47
Figure 2-8: Updraft/counter current gasifier [Adapted from Brammer and Bridgewater, 2002]
2.16.1.2 DOWNDRAFT GASIFIER
The downdraft gasifier is similar to the updraft, however, the difference lies in the
gasification agent gas which flows in co-current configuration with the fuel (downwards,
hence the name "down draft gasifier"). Heat needs to be added to the upper part of the bed,
either by combusting small amounts of the fuel or from external heat sources. The produced
gas leaves the gasifier at a high temperature, and most of this heat is often transferred to the
gasification agent added in the top of the bed, resulting in an energy efficiency on level with
the counter-current type. Since all tars must pass through a hot bed of char in this

48
configuration, tar levels are much lower than the updraft type [Mamphweli and Meyer, 2009].
A schematic diagram of a typical downdraft biomass gasifier system is presented in Figure
2.9.
Figure 2.9: Downdraft / co – current gasifier [Adapted from Beeneckers, 1999]
2.16.1.3 CROSS-DRAFT GASIFIER
A cross-draft gasifier is adapted for the gasification of charcoal. The advantage of using
charcoal instead of wood in gasification is that charcoal gives virtually no tars. Very few
steps of cleaning equipment are thus needed; only particulates need to be removed. The
crossdraft gasifier operates in small scale; installations are typically of less than 10 kW
electricity. The technology is mainly used in developing countries. The gasifier system is
simple, cheap and easy to operate. The drawback of using charcoal is that high combustion
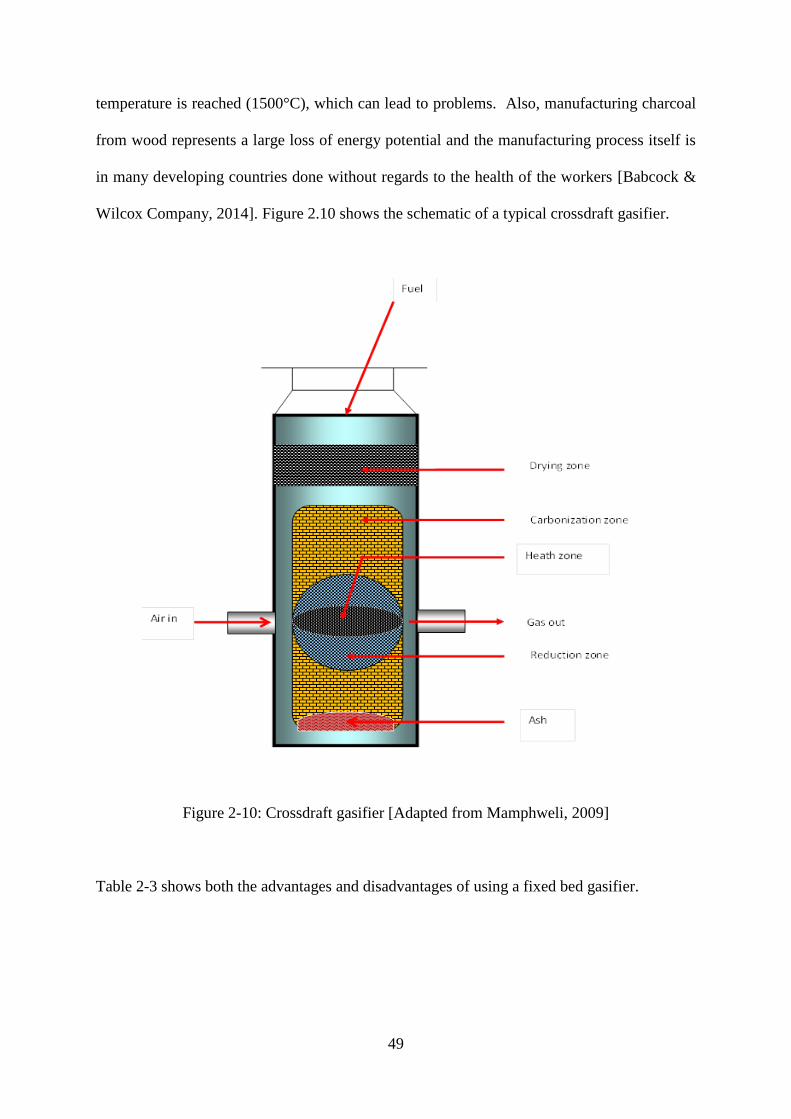
49
temperature is reached (1500°C), which can lead to problems. Also, manufacturing charcoal
from wood represents a large loss of energy potential and the manufacturing process itself is
in many developing countries done without regards to the health of the workers [Babcock &
Wilcox Company, 2014]. Figure 2.10 shows the schematic of a typical crossdraft gasifier.
Figure 2-10: Crossdraft gasifier [Adapted from Mamphweli, 2009]
Table 2-3 shows both the advantages and disadvantages of using a fixed bed gasifier.

50
Table 2-3: Advantages and disadvantages of fixed bed gasifier [Rajvanshi, 1986]
Gasifier type Advantages Disadvantages
Updraft - Small pressure drop
- Good thermal efficiency
- Little tendency towards slag
formation
-Great sensitivity to tar and
moisture and moisture
content of fuel
-Relatively long time
required for startup of IC
engines
-Poor reaction capability with
heavy gas load
Downdraft -Flexible adaptation of gas
production to load
-Low sensitivity to charcoal
dust and tar content of fuel
-Design tends to be tall
-Not feasible for very small
particle size of fuel
Crossdraft - Short design height
- Very fast response time to
load
- Flexible gas production
- Very high sensitivity to slag
formation
- High pressure drop
2.17 ENVIRONMENTAL BENEFITS OF CO-GASIFICATION
Brar et al., 2012 reported that greenhouse emissions from coal are higher than that from
biomass gasification and was mainly due to high carbon content and low volatile percentage

51
in coal. The following equation [2.14] best describes greenhouse gas emission index (GHGI)
measurement which is defined as the life cycle of greenhouse gas associated with the energy
products divided by the life cycle of greenhouse emissions associated with fossil-fuel-derived
products [Brar et al., 2012].
𝑮𝑯𝑮𝑰 = 𝑳𝒊𝒇𝒆 𝒄𝒚𝒄𝒍𝒆 𝒐𝒇 𝒈𝒂𝒔 𝒆𝒎𝒊𝒔𝒔𝒊𝒐𝒏 𝒂𝒔𝒔𝒐𝒄𝒊𝒂𝒕𝒆𝒅 𝒘𝒊𝒕𝒉 𝒆𝒏𝒆𝒓𝒈𝒚
𝑳𝒊𝒇𝒆 𝒄𝒚𝒄𝒍𝒆 𝒐𝒇 𝒈𝒂𝒔 𝒆𝒎𝒊𝒔𝒔𝒊𝒐𝒏𝒔 𝒂𝒔𝒔𝒐𝒄𝒊𝒂𝒕𝒆𝒅 𝒘𝒊𝒕𝒉 𝒇𝒐𝒔𝒔𝒊𝒍−𝒇𝒖𝒆𝒍−𝒅𝒆𝒓𝒊𝒗𝒆𝒅 𝒑𝒓𝒐𝒅𝒖𝒄𝒕𝒔 [2.14]
The study conducted by Brat et al, 2012 for electricity generation from coal and biomass,
reported GHGI from coal gasification to be 1.71 which was eventually reduced to 0.96 when
a mixture of 40% biomass – 60% coal was used as feedstock, hence concluded that using
biomass and coal blend was beneficial for the environment in terms of greenhouse gas
emissions [Brar et al., 2012].
52
7 CHAPTER THREE: RESEARCH METHODOLOGY
3.1 INTRODUCTION
This chapter presents different methods used to generate the data required for this research.
Moisture meter was used to determine moisture content of biomass and coal independently
then followed by blends. The methodology employed involves CHNS analyzer for ultimate
analysis measurements, thermogravimetric analysis (TGA) for fixed carbon determination,
calorimeter (CAL 2K) for calorific / energy value measurements, and gasification simulation
for maximum efficiency determination.
3.2 SAMPLE PREPARATION
The biomass materials used for this study, were eucalyptus wood, pine wood, corn stover,
cow dung and chicken litter. They were obtained in the Eastern Cape Province of South
Africa. The coal used was a low grade sub-bituminous coal with high ash composition, also
obtained in the Eastern Cape Province of South Africa. Some of the biomass samples (cow
dung, chicken litter and corn stover) were received with some amount of moisture (up to
40%) and were air-dried to lower their moisture content so as to make them suitable for
analytical operations using the instruments required for characterization. A coning and
quartering method was applied for size reduction of the samples using a Condux-Werk
Wolfgang bei Hanau mill so as to obtain smaller fractions as required by the analytical
instruments. The size obtained for all samples were in the range of 25µm to approximately
1mm.
53
3.3 MATERIAL CHARACTERIZATION
Calculating the usefulness of a fuel requires an understanding of its properties and
composition [Anukam et al., 2014]. The first step taken to determine the suitability of
biomass and coal for co-gasification purposes is to characterize the samples in terms of
composition. The composition and properties of the various biomass and coal were
characterize in terms of proximate (which gave properties such as moisture, volatile matter
and ash contents of the samples as well as fixed carbon) and ultimate analysis (which
provided elemental composition of the samples). Because one of the objectives of this
research was to establish the best biomass material that would be blended with coal based on
composition and energy value, proximate and ultimate analysis of the pure and blended
samples as well as energy values were undertaken.
3.3.1 PROXIMATE ANALYSIS OF VARIOUS BIOMASS AND COAL
Proximate analysis involves determination of percentage by weight of fixed carbon, volatile
matter, moisture and ash content. Fixed carbon acts as a main source of energy during
burning. The high volatile matter content indicates easy ignition of fuel [Anukam et al.,
2014].
The proximate analysis results of the various biomass and coal including their blends were
obtained from a series of TGA plots which are available in appendix B. These were measured
on a dry basis according to the European standards (EN 15148 for volatiles, EN 14775 for the
ash content, EN 14774-3). The content of fixed carbon (char) was calculated by subtracting
54
from 100 the weight composition of the other three components. This analysis was
undertaken in order to compare the physical properties of the various biomass samples with
that of coal as well as their blends so as to enable proper selection of the biomass sample to
be blended with coal for co-gasification through computer simulation.
3.3.2 ULTIMATE ANALYSIS OF VARIOUS BIOMASS AND COAL
The CHNS analyzer was used to obtain results of the ultimate analysis of the various biomass
and coal as well as their blends. The amount of C, H, N, and O present in the pure and
blended materials were determined. This analysis was necessary in order to compare the
biomass samples and determine which would be suitable for co-gasification with coal as well
as determine their potential thermal conversion. The weight percentage of oxygen was
calculated by difference.
3.3.3 SEM ANALYSIS
Solid fine powdered samples of pure coal (100%), pure corn stover (100%), blends (90% coal
: 10% corn stover and 10% coal : 90% corn stover) were mounted on a stub using a carbon
double-sided tape. Following this, they were coated with gold-palladium using EIKO IB3 Ion
Coater. The samples were then viewed with JEOL JSM 6390 LV Scanning Electron
Microscope using a secondary electron detector operated at 15kV. Images were captured at
different magnifications. The analysis was done by Noran System Six software.
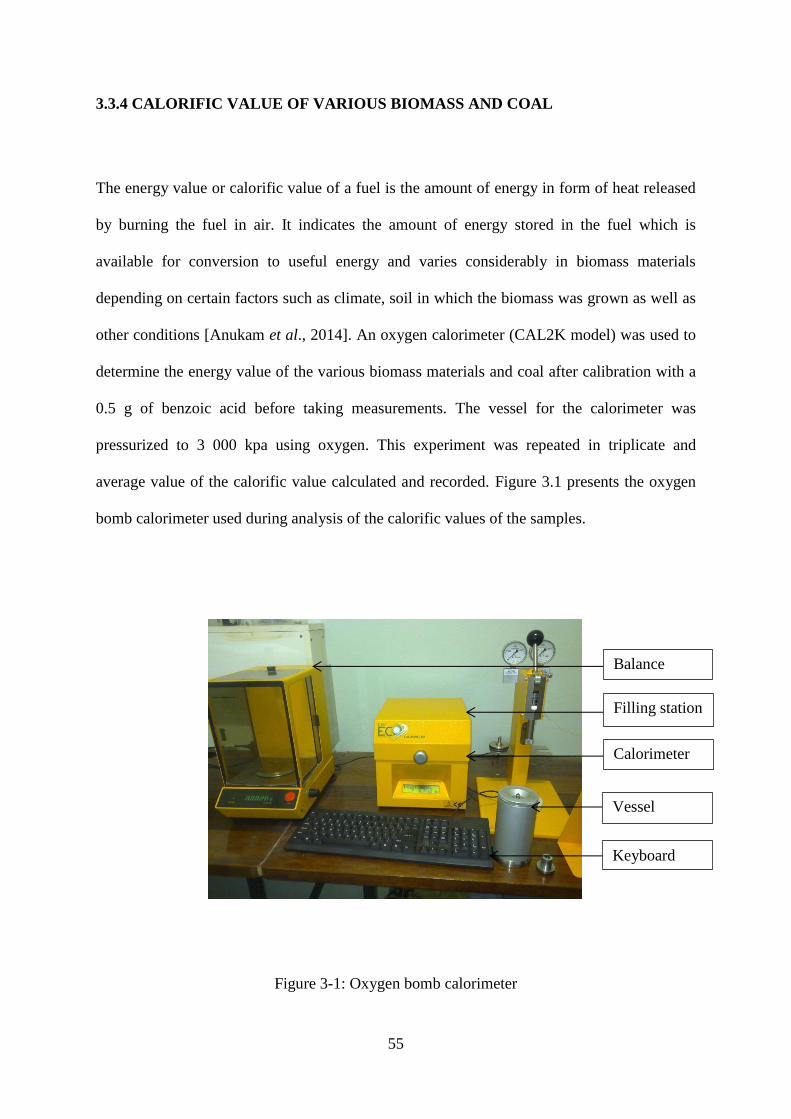
55
3.3.4 CALORIFIC VALUE OF VARIOUS BIOMASS AND COAL
The energy value or calorific value of a fuel is the amount of energy in form of heat released
by burning the fuel in air. It indicates the amount of energy stored in the fuel which is
available for conversion to useful energy and varies considerably in biomass materials
depending on certain factors such as climate, soil in which the biomass was grown as well as
other conditions [Anukam et al., 2014]. An oxygen calorimeter (CAL2K model) was used to
determine the energy value of the various biomass materials and coal after calibration with a
0.5 g of benzoic acid before taking measurements. The vessel for the calorimeter was
pressurized to 3 000 kpa using oxygen. This experiment was repeated in triplicate and
average value of the calorific value calculated and recorded. Figure 3.1 presents the oxygen
bomb calorimeter used during analysis of the calorific values of the samples.
Figure 3-1: Oxygen bomb calorimeter
Balance
Filling station
Calorimeter
Vessel
Keyboard
56
3.3.5 MATERIAL CHOICE
The specific biomass material that was blended with coal was meant to be chosen based on
composition in terms of proximate and ultimate analysis as well as energy values. However,
this was not the case for this study as corn stover was chosen because of its ready availability
in the Eastern Cape Province of South Africa, and because limited data are available on the
co-gasification of coal with corn stover in the literature.
The blends of corn stover with coal were prepared in the following ratios; 90% CS:10% CL,
80% CS:20% CL, 70% CS:30% CL, 60% CS:40% CL, 50% CS:50% CL, 40% CS:60% CL,
30% CS:70% CL, 20% CS:80% CL, 10% CS:90% CL.
3.3.6 THERMOGRAVIMETRIC ANALYSIS
The standard method of measuring the thermal degradation of a sample is through the
thermogravimetric analyzer in which a small sample of the material to be analyzed is heated
at a controlled rate in a controlled atmosphere while simultaneously recording weight, time
and temperature. It provides quantitative measurements of any weight changes (loss/gain)
associated with thermally induced transition as a function of temperature or time.
Thermogravimetric analyses are useful in characterizing materials, thermodynamic
investigation and reaction kinetics as a result of the application of heat to these materials. It is
used to study the thermal behavior of a material when heat is applied to the material [Torre
and Kenny, 1998]. This analysis was undertaken in order to establish the thermal behaviour
of all samples analyzed.
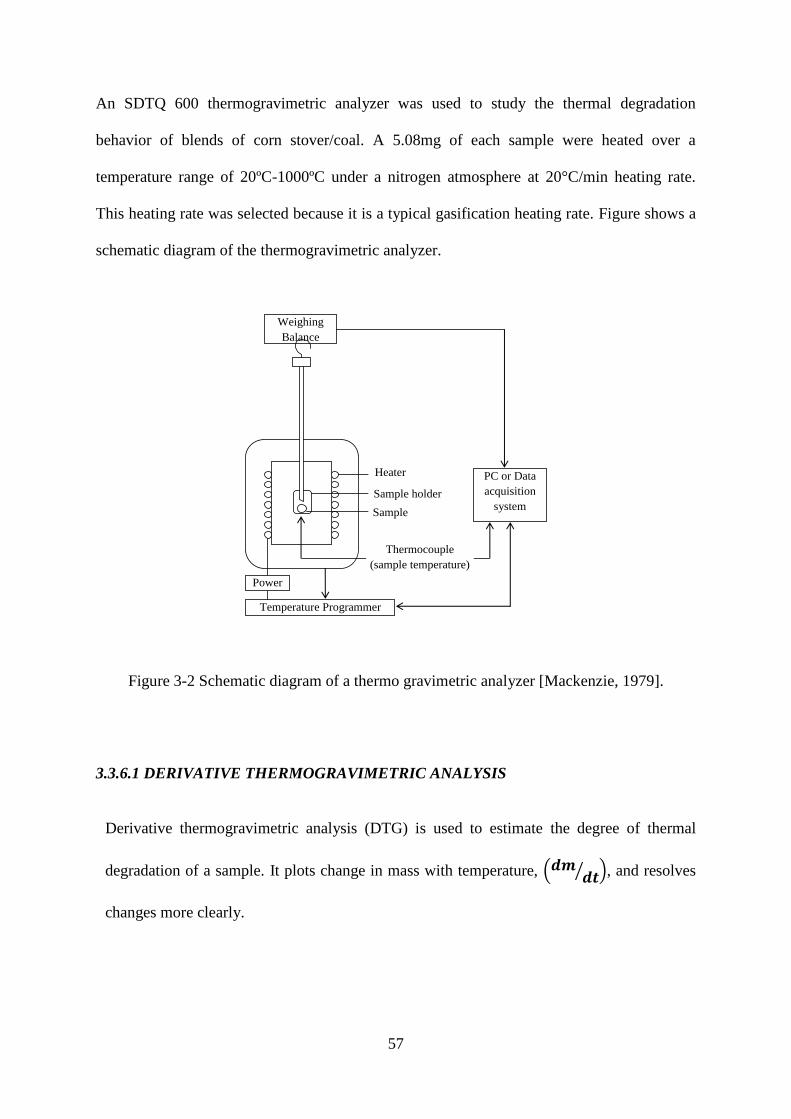
57
An SDTQ 600 thermogravimetric analyzer was used to study the thermal degradation
behavior of blends of corn stover/coal. A 5.08mg of each sample were heated over a
temperature range of 20ºC-1000ºC under a nitrogen atmosphere at 20°C/min heating rate.
This heating rate was selected because it is a typical gasification heating rate. Figure shows a
schematic diagram of the thermogravimetric analyzer.
Figure 3-2 Schematic diagram of a thermo gravimetric analyzer [Mackenzie, 1979].
3.3.6.1 DERIVATIVE THERMOGRAVIMETRIC ANALYSIS
Derivative thermogravimetric analysis (DTG) is used to estimate the degree of thermal
degradation of a sample. It plots change in mass with temperature, (𝒅𝒎𝒅𝒕⁄ ), and resolves
changes more clearly.
Weighing
Balance
PC or Data
acquisition
system
Power
Temperature Programmer
Thermocouple
(sample temperature)
Heater
Sample holder
Sample
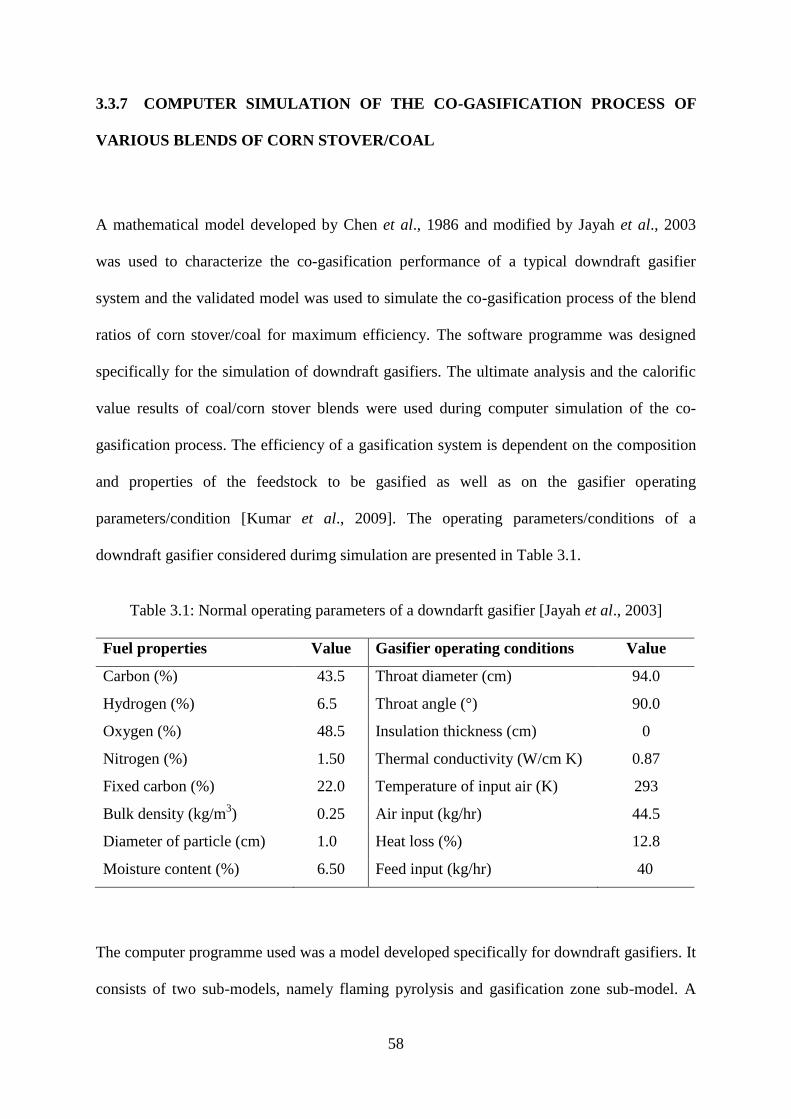
58
3.3.7 COMPUTER SIMULATION OF THE CO-GASIFICATION PROCESS OF
VARIOUS BLENDS OF CORN STOVER/COAL
A mathematical model developed by Chen et al., 1986 and modified by Jayah et al., 2003
was used to characterize the co-gasification performance of a typical downdraft gasifier
system and the validated model was used to simulate the co-gasification process of the blend
ratios of corn stover/coal for maximum efficiency. The software programme was designed
specifically for the simulation of downdraft gasifiers. The ultimate analysis and the calorific
value results of coal/corn stover blends were used during computer simulation of the co-
gasification process. The efficiency of a gasification system is dependent on the composition
and properties of the feedstock to be gasified as well as on the gasifier operating
parameters/condition [Kumar et al., 2009]. The operating parameters/conditions of a
downdraft gasifier considered durimg simulation are presented in Table 3.1.
Table 3.1: Normal operating parameters of a downdarft gasifier [Jayah et al., 2003]
Fuel properties Value Gasifier operating conditions Value
Carbon (%) 43.5 Throat diameter (cm) 94.0
Hydrogen (%) 6.5 Throat angle (°) 90.0
Oxygen (%) 48.5 Insulation thickness (cm) 0
Nitrogen (%) 1.50 Thermal conductivity (W/cm K) 0.87
Fixed carbon (%) 22.0 Temperature of input air (K) 293
Bulk density (kg/m3) 0.25 Air input (kg/hr) 44.5
Diameter of particle (cm) 1.0 Heat loss (%) 12.8
Moisture content (%) 6.50 Feed input (kg/hr) 40
The computer programme used was a model developed specifically for downdraft gasifiers. It
consists of two sub-models, namely flaming pyrolysis and gasification zone sub-model. A

59
flaming pyrolysis zone sub-model is used to determine the product concentration and
temperature of gas leaving the flaming pyrolysis zone. The gasification zone sub-model is
used to predict the output of the product gas and the length of the gasification zone at any
given time [Jayah, 2002]. The principle of mass and energy balance was also applied. Gas
profiles were obtained during simulation of the co-gasification process and were used to
calculate the gas heating value from the percentage composition of the combustible gases in
the syngas as follows [Mamphweli, 2009]:
%100
4422 HVCHCHHVHHHVCOCOHV volvolvol
gas [3.1]
where gasHV is the gas heating value in MJ/kg, volCO is the volume concentration of carbon
monoxide gas in percentage, HVCO is the heating value of carbon monoxide gas (usually
12.64 MJ/kg from standard gas tables) [Bjerketvedt et al., 1997], volH 2 is the volume
concentration of hydrogen gas in percentage, 2HVH is the heating value of hydrogen gas
(10.1 MJ/kg by standard) [Fossum and Beyer, 1998], volCH 4 is the volume concentration of
methane gas in percentage, 4HVCH is the heating value of methane gas (38 MJ/kg from
standard gas tables) [Bjerketvedt et al., 1997].
3.3.7.1 Flaming pyrolysis zone sub-model:
In the flaming pyrolysis zone, the general equation of reaction of the material can be
expressed by Equation 3.2:
𝐶𝐻𝑎𝑂𝑏 + 𝑤𝐻2𝑂 + 𝑚(0.21𝑂2 + 0.79𝑁2)
→ 𝑥𝑐ℎ𝑎𝑟𝐶ℎ𝑎𝑟 + 𝑥𝑡𝑎𝑟𝑇𝑎𝑟 + 𝑥1𝐶𝑂 + 𝑥2𝐻2 + 𝑥3𝐶𝑂2 + 𝑥5𝐶𝐻4
+ 𝑥6𝑁2 [𝟑. 𝟐]
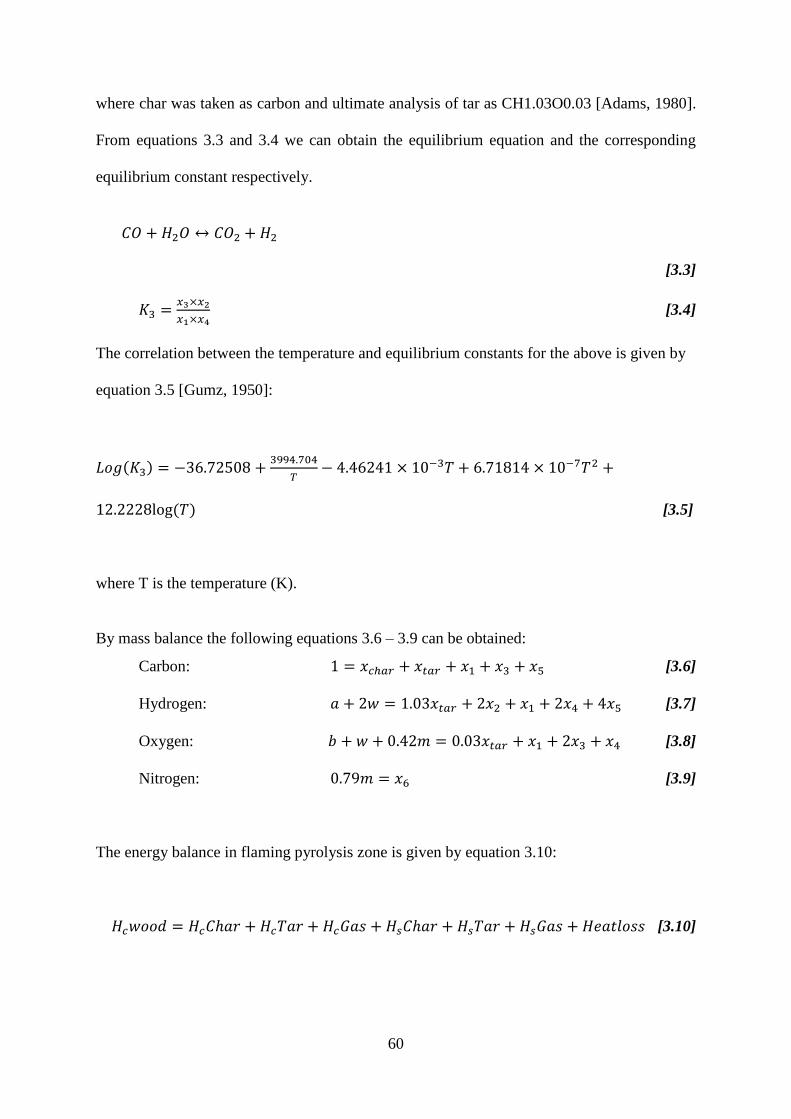
60
where char was taken as carbon and ultimate analysis of tar as CH1.03O0.03 [Adams, 1980].
From equations 3.3 and 3.4 we can obtain the equilibrium equation and the corresponding
equilibrium constant respectively.
𝐶𝑂 + 𝐻2𝑂 ↔ 𝐶𝑂2 + 𝐻2
[3.3]
𝐾3 =𝑥3×𝑥2
𝑥1×𝑥4 [3.4]
The correlation between the temperature and equilibrium constants for the above is given by
equation 3.5 [Gumz, 1950]:
𝐿𝑜𝑔(𝐾3) = −36.72508 +3994.704
𝑇− 4.46241 × 10⁻³𝑇 + 6.71814 × 10⁻⁷𝑇2 +
12.2228log (𝑇) [3.5]
where T is the temperature (K).
By mass balance the following equations 3.6 – 3.9 can be obtained:
Carbon: 1 = 𝑥𝑐ℎ𝑎𝑟 + 𝑥𝑡𝑎𝑟 + 𝑥1 + 𝑥3 + 𝑥5 [3.6]
Hydrogen: 𝑎 + 2𝑤 = 1.03𝑥𝑡𝑎𝑟 + 2𝑥2 + 𝑥1 + 2𝑥4 + 4𝑥5 [3.7]
Oxygen: 𝑏 + 𝑤 + 0.42𝑚 = 0.03𝑥𝑡𝑎𝑟 + 𝑥1 + 2𝑥3 + 𝑥4 [3.8]
Nitrogen: 0.79𝑚 = 𝑥6 [3.9]
The energy balance in flaming pyrolysis zone is given by equation 3.10:
𝐻𝑐𝑤𝑜𝑜𝑑 = 𝐻𝑐𝐶ℎ𝑎𝑟 + 𝐻𝑐𝑇𝑎𝑟 + 𝐻𝑐𝐺𝑎𝑠 + 𝐻𝑠𝐶ℎ𝑎𝑟 + 𝐻𝑠𝑇𝑎𝑟 + 𝐻𝑠𝐺𝑎𝑠 + 𝐻𝑒𝑎𝑡𝑙𝑜𝑠𝑠 [3.10]
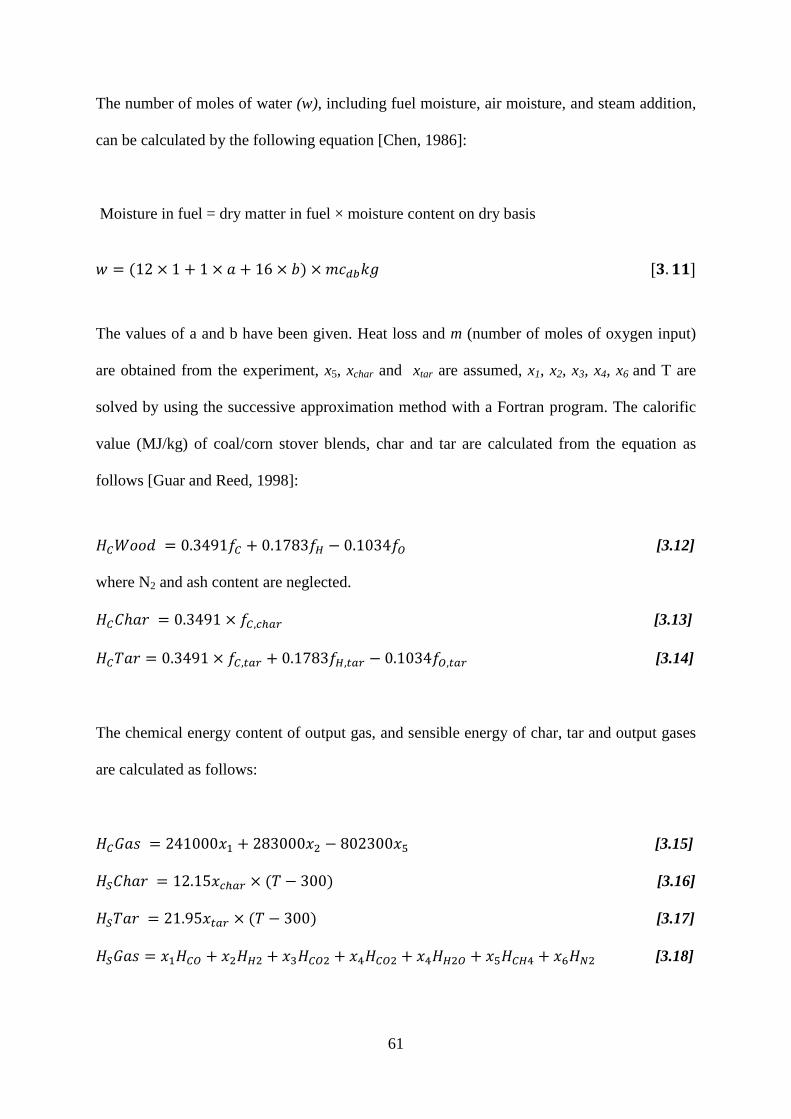
61
The number of moles of water (w), including fuel moisture, air moisture, and steam addition,
can be calculated by the following equation [Chen, 1986]:
Moisture in fuel = dry matter in fuel × moisture content on dry basis
𝑤 = (12 × 1 + 1 × 𝑎 + 16 × 𝑏) × 𝑚𝑐𝑑𝑏𝑘𝑔 [𝟑. 𝟏𝟏]
The values of a and b have been given. Heat loss and m (number of moles of oxygen input)
are obtained from the experiment, x5, xchar and xtar are assumed, x1, x2, x3, x4, x6 and T are
solved by using the successive approximation method with a Fortran program. The calorific
value (MJ/kg) of coal/corn stover blends, char and tar are calculated from the equation as
follows [Guar and Reed, 1998]:
𝐻𝐶𝑊𝑜𝑜𝑑 = 0.3491𝑓𝐶 + 0.1783𝑓𝐻 − 0.1034𝑓𝑂 [3.12]
where N2 and ash content are neglected.
𝐻𝐶𝐶ℎ𝑎𝑟 = 0.3491 × 𝑓𝐶,𝑐ℎ𝑎𝑟 [3.13]
𝐻𝐶𝑇𝑎𝑟 = 0.3491 × 𝑓𝐶,𝑡𝑎𝑟 + 0.1783𝑓𝐻,𝑡𝑎𝑟 − 0.1034𝑓𝑂,𝑡𝑎𝑟 [3.14]
The chemical energy content of output gas, and sensible energy of char, tar and output gases
are calculated as follows:
𝐻𝐶𝐺𝑎𝑠 = 241000𝑥1 + 283000𝑥2 − 802300𝑥5 [3.15]
𝐻𝑆𝐶ℎ𝑎𝑟 = 12.15𝑥𝑐ℎ𝑎𝑟 × (𝑇 − 300) [3.16]
𝐻𝑆𝑇𝑎𝑟 = 21.95𝑥𝑡𝑎𝑟 × (𝑇 − 300) [3.17]
𝐻𝑆𝐺𝑎𝑠 = 𝑥1𝐻𝐶𝑂 + 𝑥2𝐻𝐻2 + 𝑥3𝐻𝐶𝑂2 + 𝑥4𝐻𝐶𝑂2 + 𝑥4𝐻𝐻2𝑂 + 𝑥5𝐻𝐶𝐻4 + 𝑥6𝐻𝑁2 [3.18]
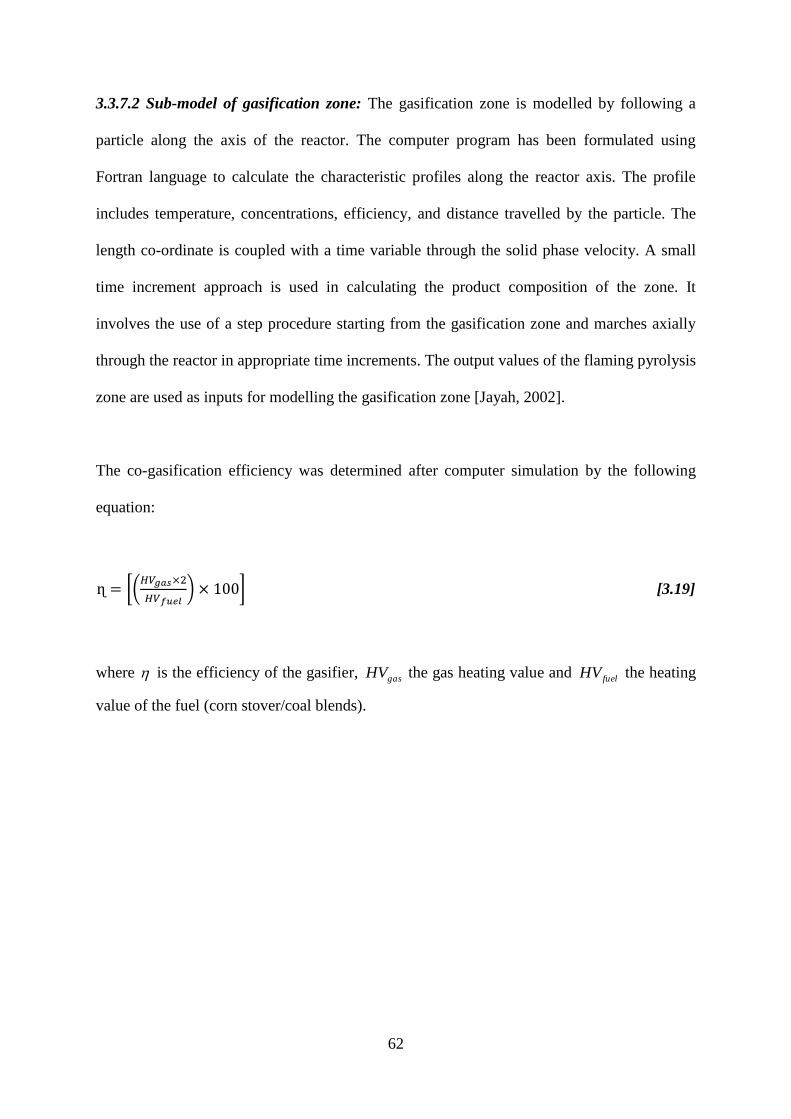
62
3.3.7.2 Sub-model of gasification zone: The gasification zone is modelled by following a
particle along the axis of the reactor. The computer program has been formulated using
Fortran language to calculate the characteristic profiles along the reactor axis. The profile
includes temperature, concentrations, efficiency, and distance travelled by the particle. The
length co-ordinate is coupled with a time variable through the solid phase velocity. A small
time increment approach is used in calculating the product composition of the zone. It
involves the use of a step procedure starting from the gasification zone and marches axially
through the reactor in appropriate time increments. The output values of the flaming pyrolysis
zone are used as inputs for modelling the gasification zone [Jayah, 2002].
The co-gasification efficiency was determined after computer simulation by the following
equation:
ɳ = [(𝐻𝑉𝑔𝑎𝑠×2
𝐻𝑉𝑓𝑢𝑒𝑙) × 100] [3.19]
where is the efficiency of the gasifier, gasHV the gas heating value and fuelHV the heating
value of the fuel (corn stover/coal blends).
63
8 CHAPTER FOUR: RESULTS AND DISCUSSION
4.1 INTRODUCTION
The results obtained using the methods discussed in chapter three are presented and discussed
in relation to existing theory and the objectives of this research in this chapter. The results
were also used to answer the research questions presented in chapter one, justifying the need
for the data presented and the methods employed in this research.
4.2 PROXIMATE ANALYSIS OF PURE AND BLENDED SAMPLES OF
CORN STOVER AND COAL
Table 4.1 shows the proximate analysis results of the pure and blended samples of corn stover
and coal. These were obtained from the TGA plot in Figure 4.5 in section 4.5.3. This analysis
was carried out in order to compare the physical properties of corn stover with that of coal as
well as their blends, and to establish the thermal behavior as well as the co-gasification
temperature of the samples under study. The weight composition of fixed carbon was
obtained by difference in both the pure and blended samples.
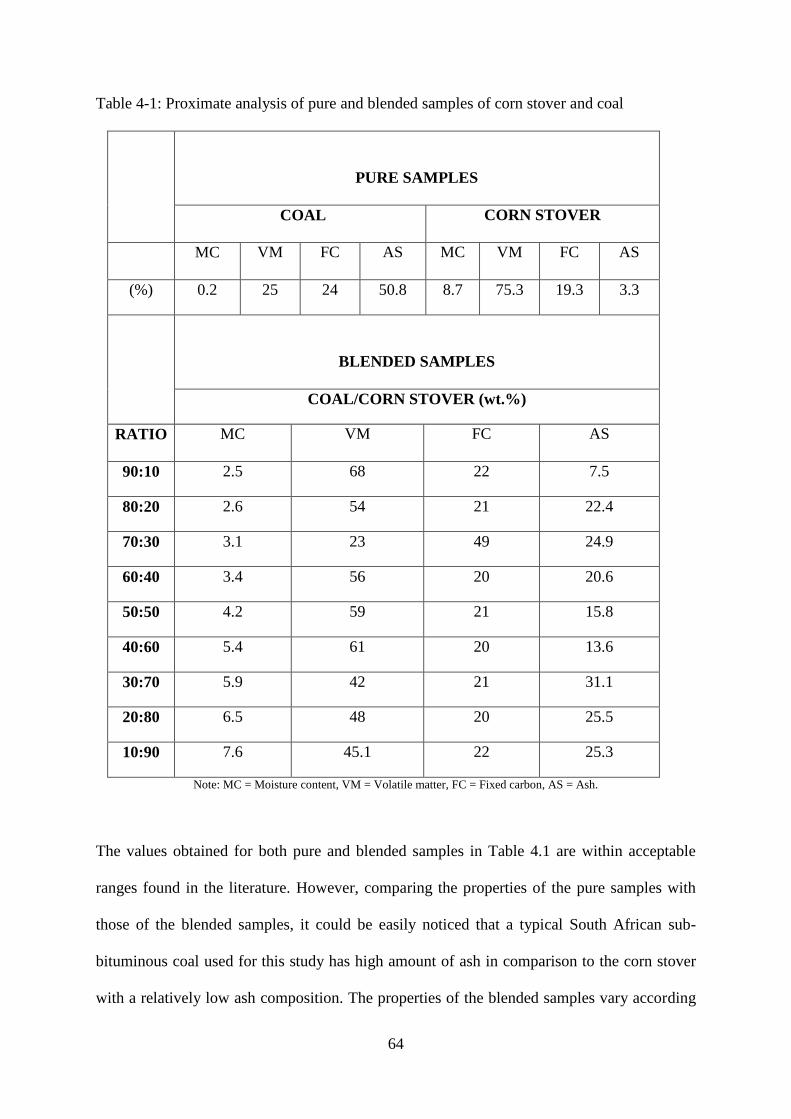
64
Table 4-1: Proximate analysis of pure and blended samples of corn stover and coal
PURE SAMPLES
COAL CORN STOVER
MC VM FC AS MC VM FC AS
(%) 0.2 25 24 50.8 8.7 75.3 19.3 3.3
BLENDED SAMPLES
COAL/CORN STOVER (wt.%)
RATIO MC VM FC AS
90:10 2.5 68 22 7.5
80:20 2.6 54 21 22.4
70:30 3.1 23 49 24.9
60:40 3.4 56 20 20.6
50:50 4.2 59 21 15.8
40:60 5.4 61 20 13.6
30:70 5.9 42 21 31.1
20:80 6.5 48 20 25.5
10:90 7.6 45.1 22 25.3
Note: MC = Moisture content, VM = Volatile matter, FC = Fixed carbon, AS = Ash.
The values obtained for both pure and blended samples in Table 4.1 are within acceptable
ranges found in the literature. However, comparing the properties of the pure samples with
those of the blended samples, it could be easily noticed that a typical South African sub-
bituminous coal used for this study has high amount of ash in comparison to the corn stover
with a relatively low ash composition. The properties of the blended samples vary according

65
to the ratio of corn stover/coal in the blends. Ash content of coal varies over a wide range and
this variation occurs not only in coals from different geographical areas or from different
seams in the same region, but also from different parts of the same mine [Inside Power
Station, 2011]. These variations result primarily from a wide range of conditions that
introduces foreign materials during or following the formation of coal. The reason for the
high amount of ash in the pure coal used for this study, as noted from Table 4.1 is most likely
due to the influence of extraneous mineral matter introduced during mining operations.
The difference in the pure and blended samples is also obvious in Table 4.1 as the blends
with high percentage of coal exhibited high ash content. Ash composition of the blends of
corn stover/coal are also quite high except for the 90:10 (CL:CS) ratio with an ash
composition of approximately 8%. This relatively high amount of ash is due to the
composition of both feedstock (coal and corn stover) which is dependent on various factors
such as source and type of biomass and coal used as well as variation in ash fraction, growth
processes, including the ability of plant species to take up/extract selectively, specific
compounds from water, soil and air, transporting and depositing them within the plant tissues
(in the case of biomass), and mining operations for coal. High amount of ash is undesirable as
it could cause agglomeration, slagging and fouling as well as deposition and corrosion during
co-gasification of coal/corn stover blend [Gustafsson, 2011]. However, combustion
temperature significantly affects the total yield of ash as its yield is determined at a relatively
high temperature (between 100 – 1300°C) lowering the amount of ash produced during co-
gasification [Vassilev et al., 2010]. Therefore, ash composition in any feedstock must be
below 5% for slagging problems to be avoided and for the smooth running of the gasifier
[Anukam et al., 2014].
66
The difference in volatile matter content between coal and corn stover can also be observed,
which can be linked to difference in properties between the two feedstocks. Fuels with high
volatile matter content is always better for gasification because they tend to vapourize before
combustion compared to fuels with low volatile matter content which burns primarily as
glowing char and this affects the performance of the combustion chamber of the gasifier
which is usually taken into account when designing gasification systems [Ciolkosz, 2010].
The ease of ignition during gasification is determined by the volatile matter content of the
fuel and typical biomass material and coal have volatile matter content in the range 60 – 90%
and 20 – 35% respectively [Ganesh, 2006].
Another important fuel property worthy of description when pre-treatment options are not
available or desirable is the moisture content of the fuel. Moisture in the feedstock lowers the
temperature inside the combustion unit and will lead to an increased fuel throughput, thereby
increasing the volume of flue gas released [Khan et al., 2009]. Moisture content of pure coal
is relatively low as can be seen in Table 4.1 while it varies in the biomass materials. It also
varies in the blends which are most likely due to the difference in properties and source of the
corn stover. This was due to the fact that the samples were dried before analysis. The fixed
carbon of coal is higher (24%) than that of corn stover which is as a consequence of the
difference in physical properties between corn stover and coal. In contrast, the fixed carbon
content of the blends showed a slight variation which is due to the ratio of volatiles in the
pure coal. Fixed carbon is calculated as a function of moisture, volatile matter and ash
content, the uncertainties of these properties affects the uncertainty in the concentration of
fixed carbon [Anukam et al., 2014]. The fixed carbon content of the sample (blends of corn
stover/coal) were also in narrow ranges which is due to the amount of volatile matter and
moisture as well as ash driven off in the sample during thermal analysis.
67
4.3 ULTIMATE ANALYSIS OF PURE AND BLENDED SAMPLES OF
CORN STOVER AND COAL
Table 4.2 shows the ultimate analysis data obtained using a CHNS analyzer on pure and
blended materials. Oxygen composition was obtained by difference. This data was necessary
in order to establish the variation in the elemental composition of corn stover, coal, and their
blends so as to determine which mixing ratio would be suitable for co-gasification purposes
as well as establish their potential thermal utilization.
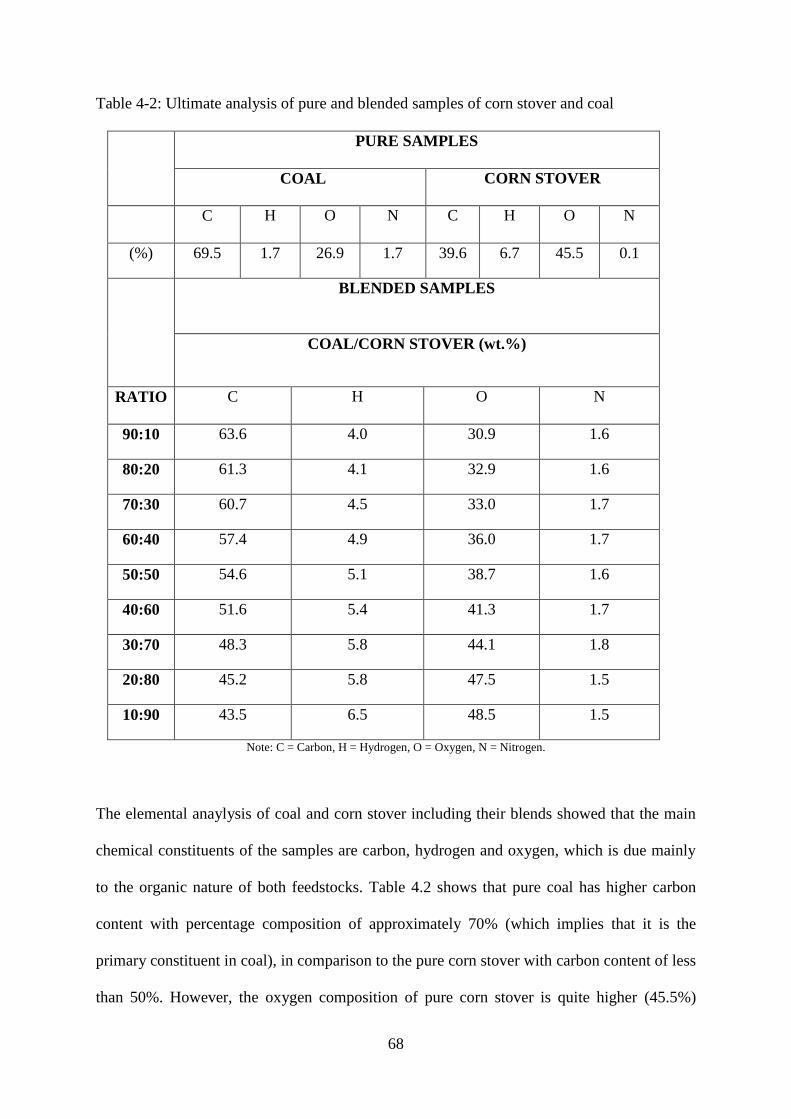
68
Table 4-2: Ultimate analysis of pure and blended samples of corn stover and coal
PURE SAMPLES
COAL CORN STOVER
C H O N C H O N
(%) 69.5 1.7 26.9 1.7 39.6 6.7 45.5 0.1
BLENDED SAMPLES
COAL/CORN STOVER (wt.%)
RATIO C H O N
90:10 63.6 4.0 30.9 1.6
80:20 61.3 4.1 32.9 1.6
70:30 60.7 4.5 33.0 1.7
60:40 57.4 4.9 36.0 1.7
50:50 54.6 5.1 38.7 1.6
40:60 51.6 5.4 41.3 1.7
30:70 48.3 5.8 44.1 1.8
20:80 45.2 5.8 47.5 1.5
10:90 43.5 6.5 48.5 1.5
Note: C = Carbon, H = Hydrogen, O = Oxygen, N = Nitrogen.
The elemental anaylysis of coal and corn stover including their blends showed that the main
chemical constituents of the samples are carbon, hydrogen and oxygen, which is due mainly
to the organic nature of both feedstocks. Table 4.2 shows that pure coal has higher carbon
content with percentage composition of approximately 70% (which implies that it is the
primary constituent in coal), in comparison to the pure corn stover with carbon content of less
than 50%. However, the oxygen composition of pure corn stover is quite higher (45.5%)
69
compared to that of pure coal (27%). This difference in oxygen composition is due to the
carbohydrate nature of corn stover. Hydrogen in the pure corn stover was also found to be
higher than in the pure coal, which can be attributed to the difference in chemical properties
between corn stover and coal. The carbon content in all of the blends is quite lower than that
of the pure coal with carbon content of 69.5%. This is due to the blend ratio as the blends
with a higher ratio of coal has higher carbon content. There is an insignificant decrease in the
composition of carbon and oxygen as the ratio of corn stover increases in the blends. Carbon
and hydrogen in the blends are oxidized during co-gasification by the exothermic reactions
forming carbon dioxide and water. The carbon and hydrogen content has a positive
contribution to the calorific value of the fuel and the carbon dioxide formed is emitted as a
major product of complete combustion because incomplete combustion in the oxidation zone
of the gasifier can lead to emissions of unburnt carbon based pollutants such as hydrocarbons,
polycyclic aromatic hydrocarbons, tar and soot [Anukam et al., 2014].
The composition of oxygen in the blends also varies. This variation is equally due to the ratio
of biomass in the blends. Oxygen will reduce the energy density of the fuel [Kumar et al.,
2009]. However, the presence of oxygen is important to start the syngas formation process as
it reacts with carbon and hydrogen in the feedstock to form carbon dioxide and water.
Nitrogen composition varies both in the pure and blended samples, however, the variation
was found to be insignificant. Nitrogen in the fuel is almost entirely converted into gaseous
nitrogen and nitric oxides (NOx, [NO, NO2]) during co-gasification. Recent studies have
shown that one of the main environmental effects of combustion of coal and biomass is
caused by the emission of NOx [Nussbaumer, 2002]. NOx can be formed through reaction
pathways such as reaction of nitrogen with oxygen radicals at high temperatures (above
70
1300°C) and the amount increases with increasing temperature. It could also be formed from
airborne nitrogen at yet again, temperatures above 1300°C but under low oxygen conditions
in the presence of hydrocarbons [Miller and Bowman, 1989, Fenimore, 1971]. Furthermore
and most important mechanism in gasification systems is the formation of NOx from the
oxidation of fuel nitrogen during a series of elementary reaction steps and emission increases
with increasing fuel nitrogen content [Leckner and Karlsson, 1993]. However, the major
influencing parameters for NOx formation include air supply, combustion zone geometry and
temperature, as well as type of gasification technology used [van Loo and Koppejan, 2002].
Emission related problems for solid fuels exceeding emission limits can be expected at fuel
nitrogen concentrations above 0.6% and the technological possibilities of emission reduction
include primary measures such as air staging in the combustion chamber which results in a 30
to 50% reduction in NOx emission, and a secondary measure which includes selective
catalytic reduction and selective non-catalytic reduction [Obernberger, 2003]. In both
techniques, ammonia (NH3) or urea (CO(NH2)2) is injected to reduce NOx to N2 with or
without a catalyst. Nitrogen composition in the blends are quite minimal and poses no
environmental concern during co-gasification. The chemical composition of a fuel has
manifold impact on their thermal utilization [Obernberger et al., 2006].
The results of the ultimate analysis and the calorific value of coal and corn stover blends were
used in the calculation of the efficiency of the co-gasification process through computer
simulation. A detailed description of the computer simulation program and process have been
presented in chapter 3.
71
4.4 CALORIMETRIC VALUE OF PURE AND BLENDED SAMPLES OF
CORN STOVER AND COAL
The calorific values of the pure and blended samples are presented in Table 4.3. These were
presented in order to compare the energy values of the pure and blended samples so as to
determine the impact of blending the two feedstocks on their calorific values. The calorific
values gave a clear indication of the energy contained in the samples and were obtained after
analysis by the oxygen bomb calorimeter. Increasing the biomass content during co-
gasification enhances calorific value due to higher composition of hydrocarbons in biomass
[Valero and Uson, 2006] and [Fermoso et al., 2009].
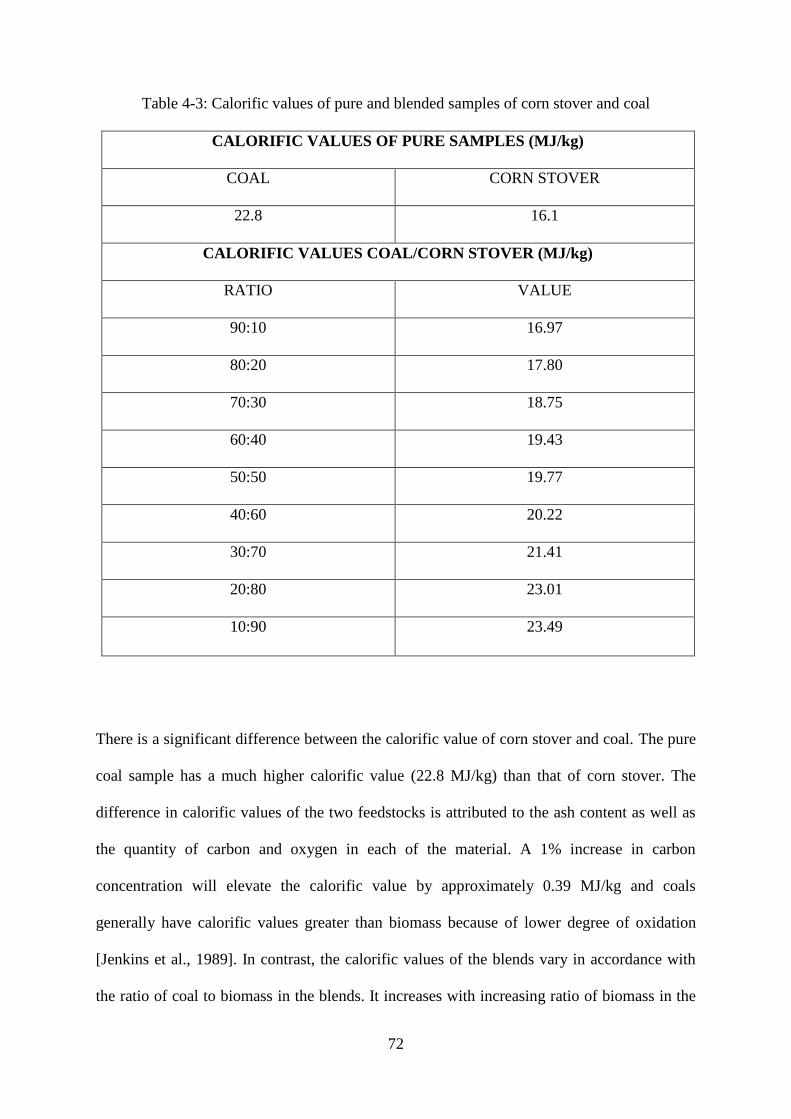
72
Table 4-3: Calorific values of pure and blended samples of corn stover and coal
CALORIFIC VALUES OF PURE SAMPLES (MJ/kg)
COAL CORN STOVER
22.8 16.1
CALORIFIC VALUES COAL/CORN STOVER (MJ/kg)
RATIO VALUE
90:10 16.97
80:20 17.80
70:30 18.75
60:40 19.43
50:50 19.77
40:60 20.22
30:70 21.41
20:80 23.01
10:90 23.49
There is a significant difference between the calorific value of corn stover and coal. The pure
coal sample has a much higher calorific value (22.8 MJ/kg) than that of corn stover. The
difference in calorific values of the two feedstocks is attributed to the ash content as well as
the quantity of carbon and oxygen in each of the material. A 1% increase in carbon
concentration will elevate the calorific value by approximately 0.39 MJ/kg and coals
generally have calorific values greater than biomass because of lower degree of oxidation
[Jenkins et al., 1989]. In contrast, the calorific values of the blends vary in accordance with
the ratio of coal to biomass in the blends. It increases with increasing ratio of biomass in the
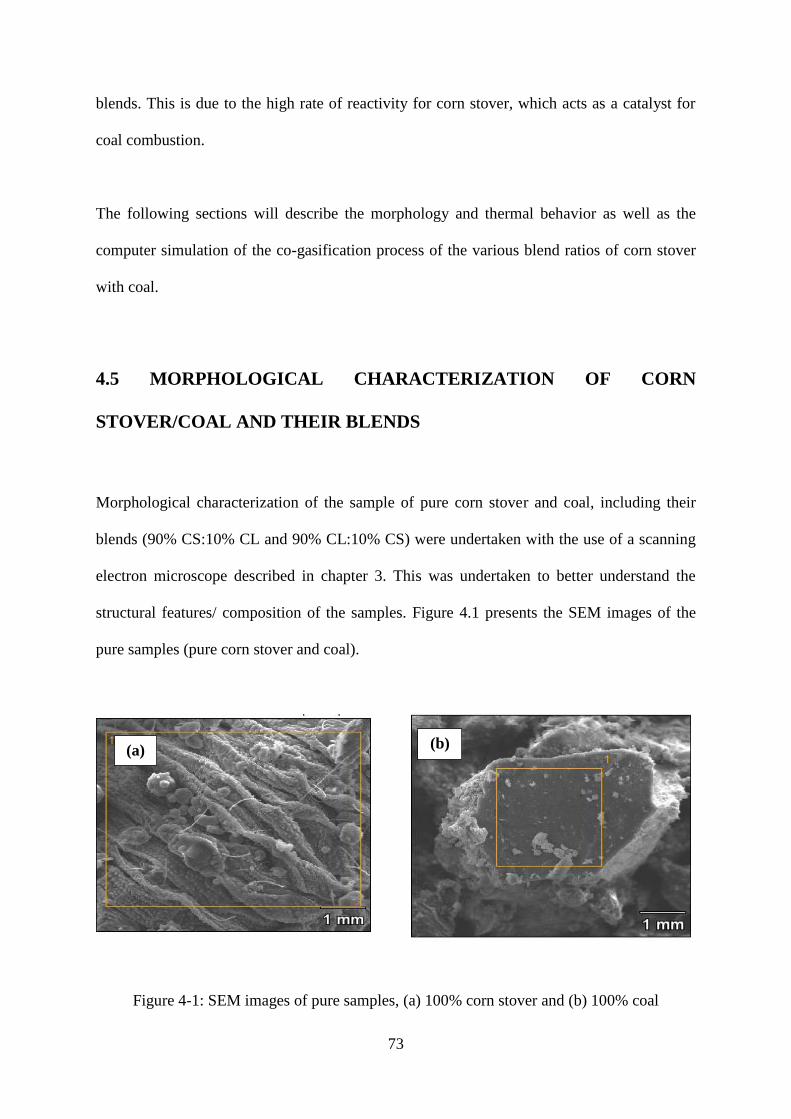
73
blends. This is due to the high rate of reactivity for corn stover, which acts as a catalyst for
coal combustion.
The following sections will describe the morphology and thermal behavior as well as the
computer simulation of the co-gasification process of the various blend ratios of corn stover
with coal.
4.5 MORPHOLOGICAL CHARACTERIZATION OF CORN
STOVER/COAL AND THEIR BLENDS
Morphological characterization of the sample of pure corn stover and coal, including their
blends (90% CS:10% CL and 90% CL:10% CS) were undertaken with the use of a scanning
electron microscope described in chapter 3. This was undertaken to better understand the
structural features/ composition of the samples. Figure 4.1 presents the SEM images of the
pure samples (pure corn stover and coal).
Figure 4-1: SEM images of pure samples, (a) 100% corn stover and (b) 100% coal
(a) (b)
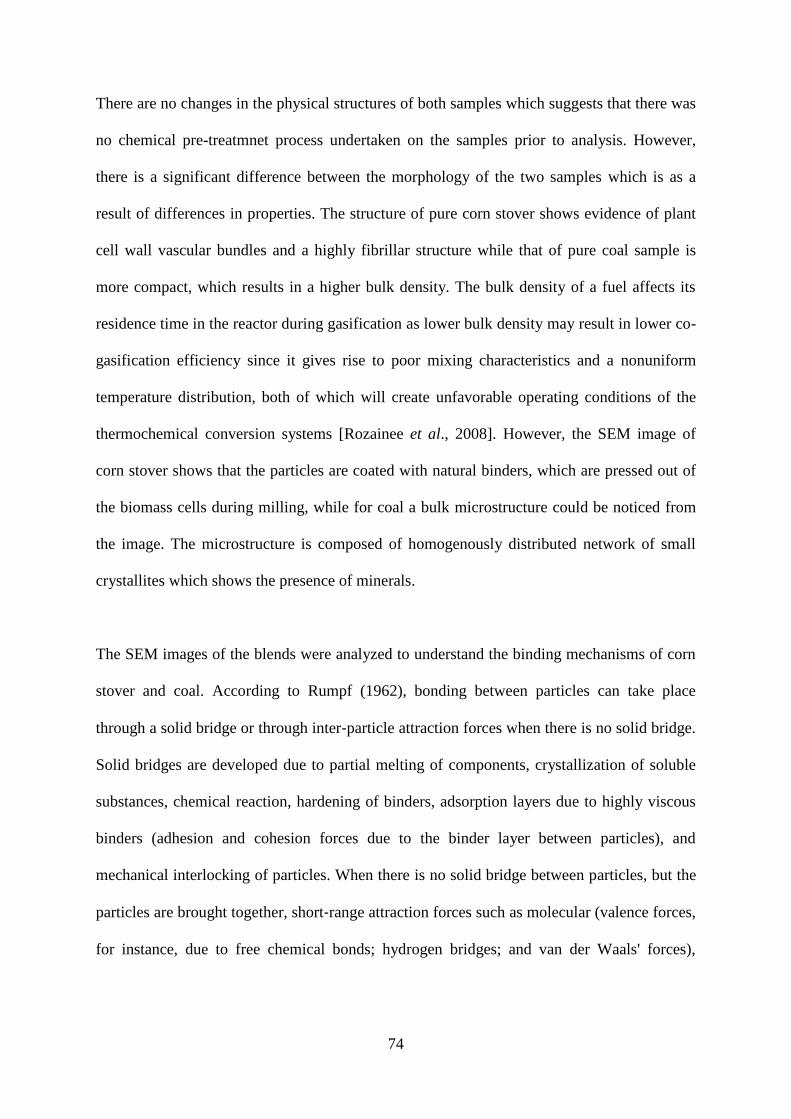
74
There are no changes in the physical structures of both samples which suggests that there was
no chemical pre-treatmnet process undertaken on the samples prior to analysis. However,
there is a significant difference between the morphology of the two samples which is as a
result of differences in properties. The structure of pure corn stover shows evidence of plant
cell wall vascular bundles and a highly fibrillar structure while that of pure coal sample is
more compact, which results in a higher bulk density. The bulk density of a fuel affects its
residence time in the reactor during gasification as lower bulk density may result in lower co-
gasification efficiency since it gives rise to poor mixing characteristics and a nonuniform
temperature distribution, both of which will create unfavorable operating conditions of the
thermochemical conversion systems [Rozainee et al., 2008]. However, the SEM image of
corn stover shows that the particles are coated with natural binders, which are pressed out of
the biomass cells during milling, while for coal a bulk microstructure could be noticed from
the image. The microstructure is composed of homogenously distributed network of small
crystallites which shows the presence of minerals.
The SEM images of the blends were analyzed to understand the binding mechanisms of corn
stover and coal. According to Rumpf (1962), bonding between particles can take place
through a solid bridge or through inter‐particle attraction forces when there is no solid bridge.
Solid bridges are developed due to partial melting of components, crystallization of soluble
substances, chemical reaction, hardening of binders, adsorption layers due to highly viscous
binders (adhesion and cohesion forces due to the binder layer between particles), and
mechanical interlocking of particles. When there is no solid bridge between particles, but the
particles are brought together, short‐range attraction forces such as molecular (valence forces,
for instance, due to free chemical bonds; hydrogen bridges; and van der Waals' forces),
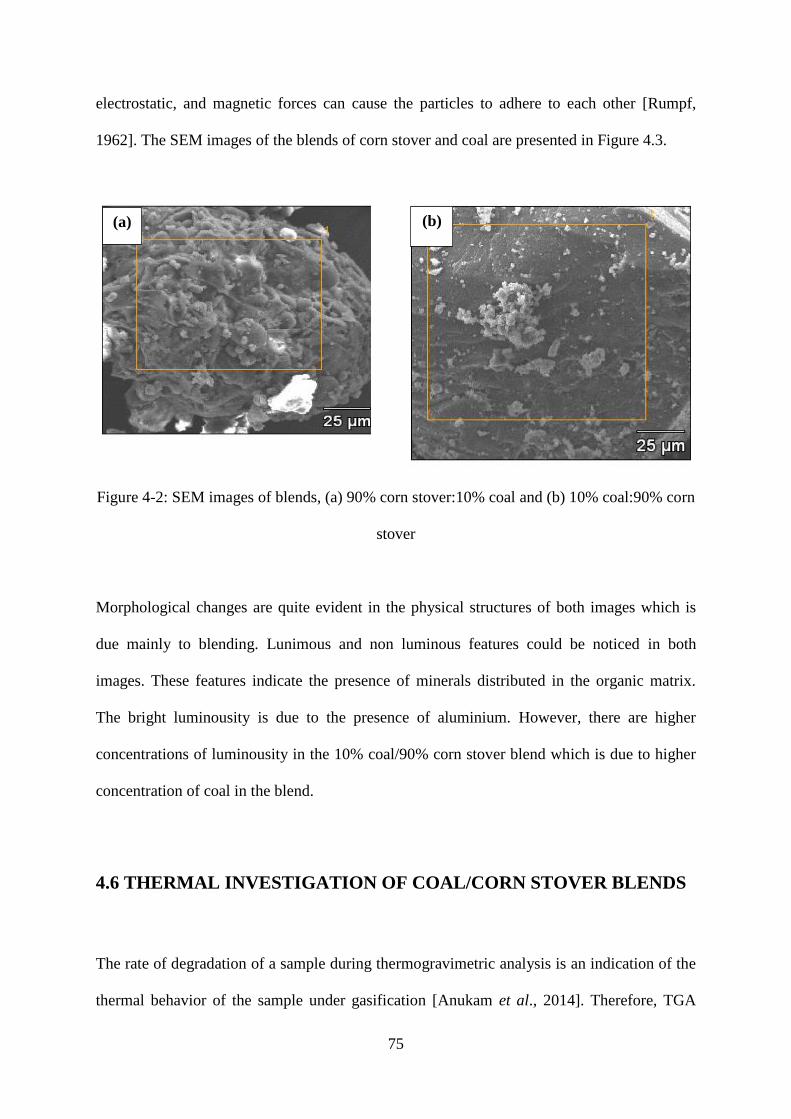
75
electrostatic, and magnetic forces can cause the particles to adhere to each other [Rumpf,
1962]. The SEM images of the blends of corn stover and coal are presented in Figure 4.3.
Figure 4-2: SEM images of blends, (a) 90% corn stover:10% coal and (b) 10% coal:90% corn
stover
Morphological changes are quite evident in the physical structures of both images which is
due mainly to blending. Lunimous and non luminous features could be noticed in both
images. These features indicate the presence of minerals distributed in the organic matrix.
The bright luminousity is due to the presence of aluminium. However, there are higher
concentrations of luminousity in the 10% coal/90% corn stover blend which is due to higher
concentration of coal in the blend.
4.6 THERMAL INVESTIGATION OF COAL/CORN STOVER BLENDS
The rate of degradation of a sample during thermogravimetric analysis is an indication of the
thermal behavior of the sample under gasification [Anukam et al., 2014]. Therefore, TGA
(a) (b)
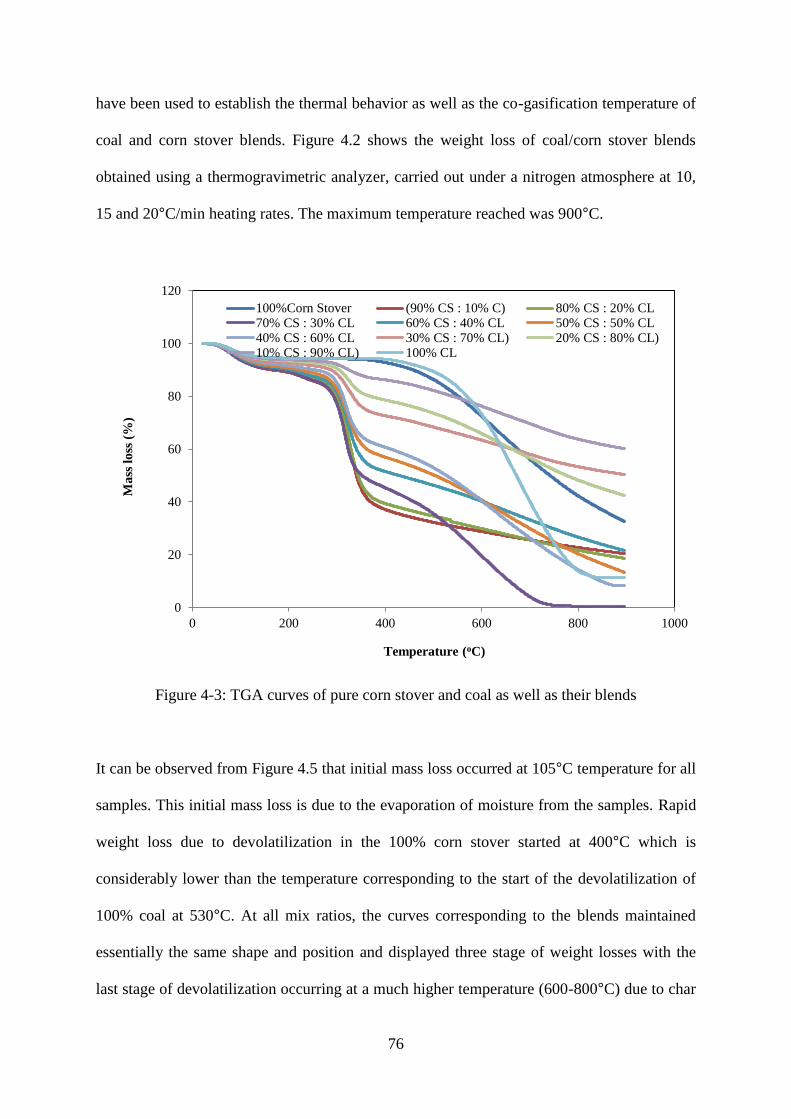
76
have been used to establish the thermal behavior as well as the co-gasification temperature of
coal and corn stover blends. Figure 4.2 shows the weight loss of coal/corn stover blends
obtained using a thermogravimetric analyzer, carried out under a nitrogen atmosphere at 10,
15 and 20°C/min heating rates. The maximum temperature reached was 900°C.
Figure 4-3: TGA curves of pure corn stover and coal as well as their blends
It can be observed from Figure 4.5 that initial mass loss occurred at 105°C temperature for all
samples. This initial mass loss is due to the evaporation of moisture from the samples. Rapid
weight loss due to devolatilization in the 100% corn stover started at 400°C which is
considerably lower than the temperature corresponding to the start of the devolatilization of
100% coal at 530°C. At all mix ratios, the curves corresponding to the blends maintained
essentially the same shape and position and displayed three stage of weight losses with the
last stage of devolatilization occurring at a much higher temperature (600-800°C) due to char
0
20
40
60
80
100
120
0 200 400 600 800 1000
Ma
ss l
oss
(%
)
Temperature (oC)
100%Corn Stover (90% CS : 10% C) 80% CS : 20% CL70% CS : 30% CL 60% CS : 40% CL 50% CS : 50% CL40% CS : 60% CL 30% CS : 70% CL) 20% CS : 80% CL)10% CS : 90% CL) 100% CL
77
oxidation except for the 70% CS:30% CL blend which is characterized by four weight loss
stages due to much higher volatile matter content of corn stover in the blend, with last stage
of weight loss occurring at 715°C. The devolatilization behavior of the blends as revealed by
TGA analysis implies that during co-gasification, the maximum expected temperature for
complete devolatilization of all materials would occur at about 900°C with rapid weight loss
occurring between 300-550°C for all blends.
4.6.1 DTG EVALUATION OF COAL/CORN STOVER BLENDS
This sub-section deals with the derivatives of coal/corn stover blends after being subjected to
heat for a prolong time. The DTG plot of coal/corn stover blends is presented in Figure 4.4. It
was obtained from the TGA plot in Figure 4.3 and was used to estimate the rate at which
thermal degradation of the blends took place over a wide temperature range (900°C).
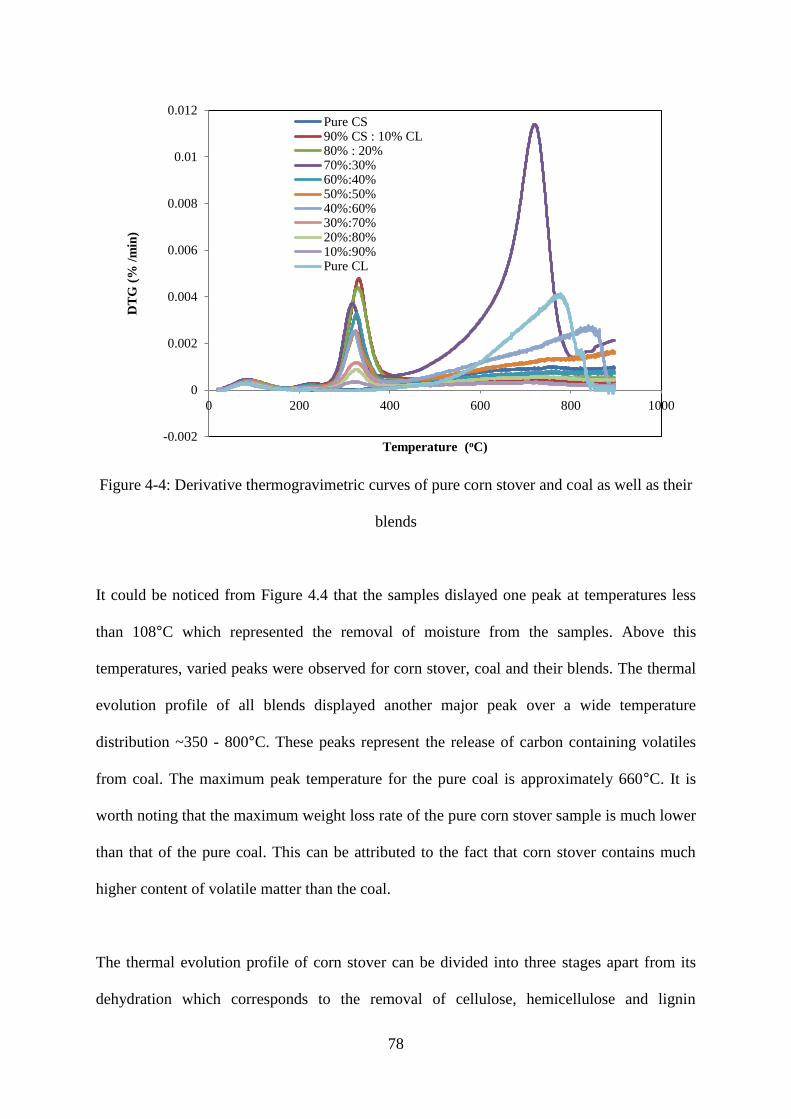
78
Figure 4-4: Derivative thermogravimetric curves of pure corn stover and coal as well as their
blends
It could be noticed from Figure 4.4 that the samples dislayed one peak at temperatures less
than 108°C which represented the removal of moisture from the samples. Above this
temperatures, varied peaks were observed for corn stover, coal and their blends. The thermal
evolution profile of all blends displayed another major peak over a wide temperature
distribution ~350 - 800°C. These peaks represent the release of carbon containing volatiles
from coal. The maximum peak temperature for the pure coal is approximately 660°C. It is
worth noting that the maximum weight loss rate of the pure corn stover sample is much lower
than that of the pure coal. This can be attributed to the fact that corn stover contains much
higher content of volatile matter than the coal.
The thermal evolution profile of corn stover can be divided into three stages apart from its
dehydration which corresponds to the removal of cellulose, hemicellulose and lignin
-0.002
0
0.002
0.004
0.006
0.008
0.01
0.012
0 200 400 600 800 1000
DT
G (
% /
min
)
Temperature (oC)
Pure CS90% CS : 10% CL80% : 20%70%:30%60%:40%50%:50%40%:60%30%:70%20%:80%10%:90%Pure CL
79
components of corn stover. However, as it can be observed from Figure 4.4 and as mentioned
earlier, the thermal decomposition profile for corn stover falls in a much narrower
temperature range than that for coal, ~220-650°C. This, as mentioned earlier, is mainly due to
the high volatile matter and lower fixed carbon contents of corn stover as compared to that of
coal. This diiference is also attributed to the strength of the molecular structure of the fuels.
The immobile phase present in the coal structure comprises dense polycyclic aromatic
hydrocarbons linked together by aromatic rings with very high bond energy of about 1000
kJ/mol [Cai et al., 2008].
In contrast, the polymers of hemicellulose, cellulose, and lignin which constitute the
macromolecular structure of biomass and other woody materials are linked together by
relatively weak bonds with a bond energy of about 380–420 kJ/mol [Vuthaluru, 2004]. These
bonds are less resistant to heat at low temperatures. As a consequence, a much higher mass
loss rate results in biomass samples as compared with coal. As observed, the DTG profile of
corn stover results in a split peak in the temperature range of ∼220–350°C. As for the blends,
the DTG evolution profiles showed two distinct peaks in the temperature range of
approximately 130-800°C. The first peak occurs at a maximum peak temperature of
approximately 320-350°C representing the devolatilization of corn stover while the second
peak occurs at a maximum peak temperature of 400–800°C representing the devolatilization
of the sub-bituminous coal used for this study.
It could also be observed that the maximum weight loss rate (%/min) for the corn stover
devolatilization profile increased with increasing concentration of corn stover in the blends
and vice versa for the coal devolatilization profile, without an apparent change in the shape
and position of the peaks when compared to those of the pure samples. This may be attributed
80
to the fact that the release of volatiles containing oxygenated components during the
devolatilization of corn stover, generally does not affect the devolatilization of coal at higher
temperatures [Aboyade et al., 2013].
4.7 COMPUTER SIMULATION OF THE CO-GASIFICATION
PROCESS OF VARIOUS BLENDS OF CORN STOVER AND COAL
Gasification efficiency is an expression of the energy content of gaseous products to energy
content of biomass, coal or a mixture of them as solid fuel [Anukam et al., 2014]. The
computer simulation programme described in section 3.3.7 in chapter 3 was used to
undertake the simulation of the co-gasification process of all blends of corn stover/coal. The
parameters used for simulation have been presented in Table 3.1 also in chapter 3. The
simulation process established the blend of corn stover/coal that resulted in maximum
efficiency. Figure 4.5 shows the efficiency plot of the co-gasification process of all blends of
corn stover/coal obtained after computer simulation.
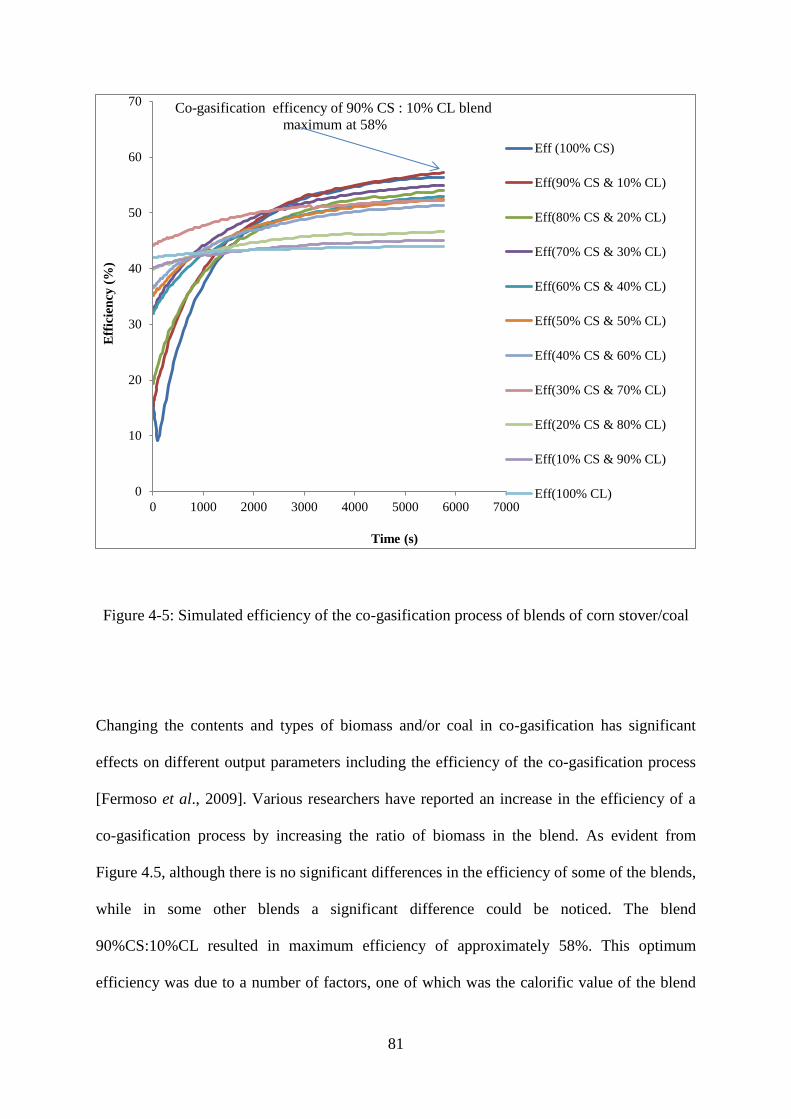
81
Figure 4-5: Simulated efficiency of the co-gasification process of blends of corn stover/coal
Changing the contents and types of biomass and/or coal in co-gasification has significant
effects on different output parameters including the efficiency of the co-gasification process
[Fermoso et al., 2009]. Various researchers have reported an increase in the efficiency of a
co-gasification process by increasing the ratio of biomass in the blend. As evident from
Figure 4.5, although there is no significant differences in the efficiency of some of the blends,
while in some other blends a significant difference could be noticed. The blend
90%CS:10%CL resulted in maximum efficiency of approximately 58%. This optimum
efficiency was due to a number of factors, one of which was the calorific value of the blend
0
10
20
30
40
50
60
70
0 1000 2000 3000 4000 5000 6000 7000
Eff
icie
ncy
(%
)
Time (s)
Eff (100% CS)
Eff(90% CS & 10% CL)
Eff(80% CS & 20% CL)
Eff(70% CS & 30% CL)
Eff(60% CS & 40% CL)
Eff(50% CS & 50% CL)
Eff(40% CS & 60% CL)
Eff(30% CS & 70% CL)
Eff(20% CS & 80% CL)
Eff(10% CS & 90% CL)
Eff(100% CL)
Co-gasification efficency of 90% CS : 10% CL blend
maximum at 58%
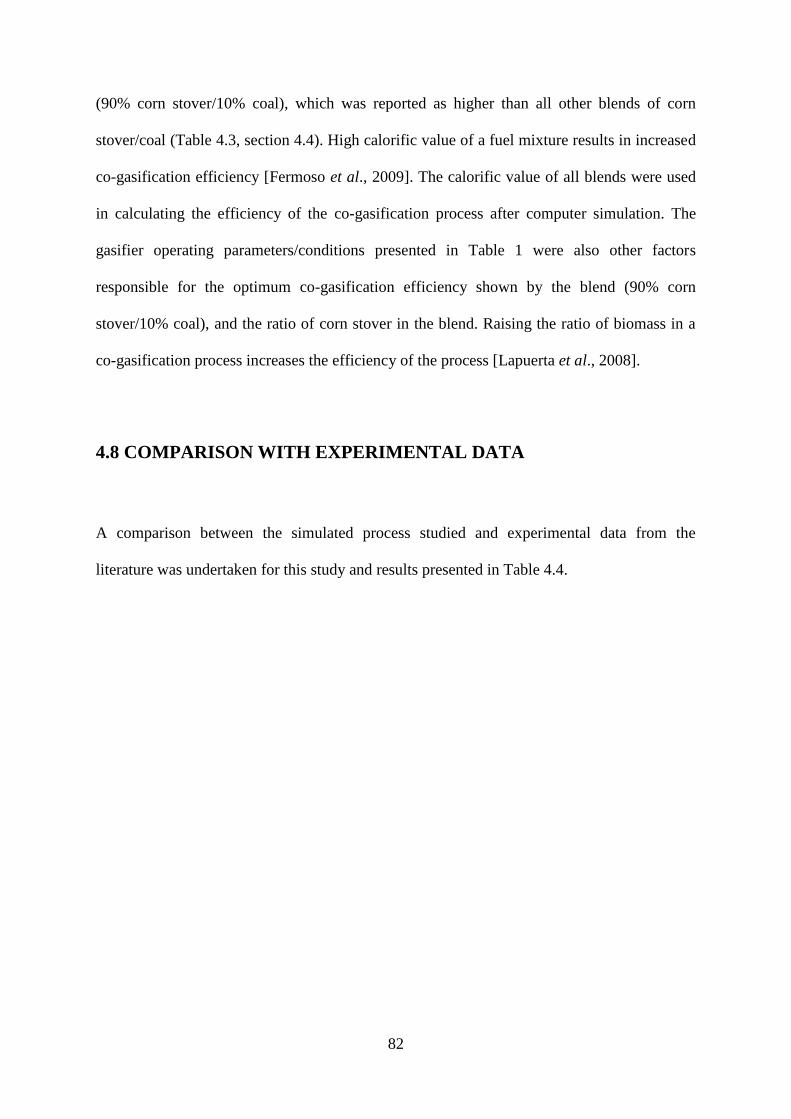
82
(90% corn stover/10% coal), which was reported as higher than all other blends of corn
stover/coal (Table 4.3, section 4.4). High calorific value of a fuel mixture results in increased
co-gasification efficiency [Fermoso et al., 2009]. The calorific value of all blends were used
in calculating the efficiency of the co-gasification process after computer simulation. The
gasifier operating parameters/conditions presented in Table 1 were also other factors
responsible for the optimum co-gasification efficiency shown by the blend (90% corn
stover/10% coal), and the ratio of corn stover in the blend. Raising the ratio of biomass in a
co-gasification process increases the efficiency of the process [Lapuerta et al., 2008].
4.8 COMPARISON WITH EXPERIMENTAL DATA
A comparison between the simulated process studied and experimental data from the
literature was undertaken for this study and results presented in Table 4.4.
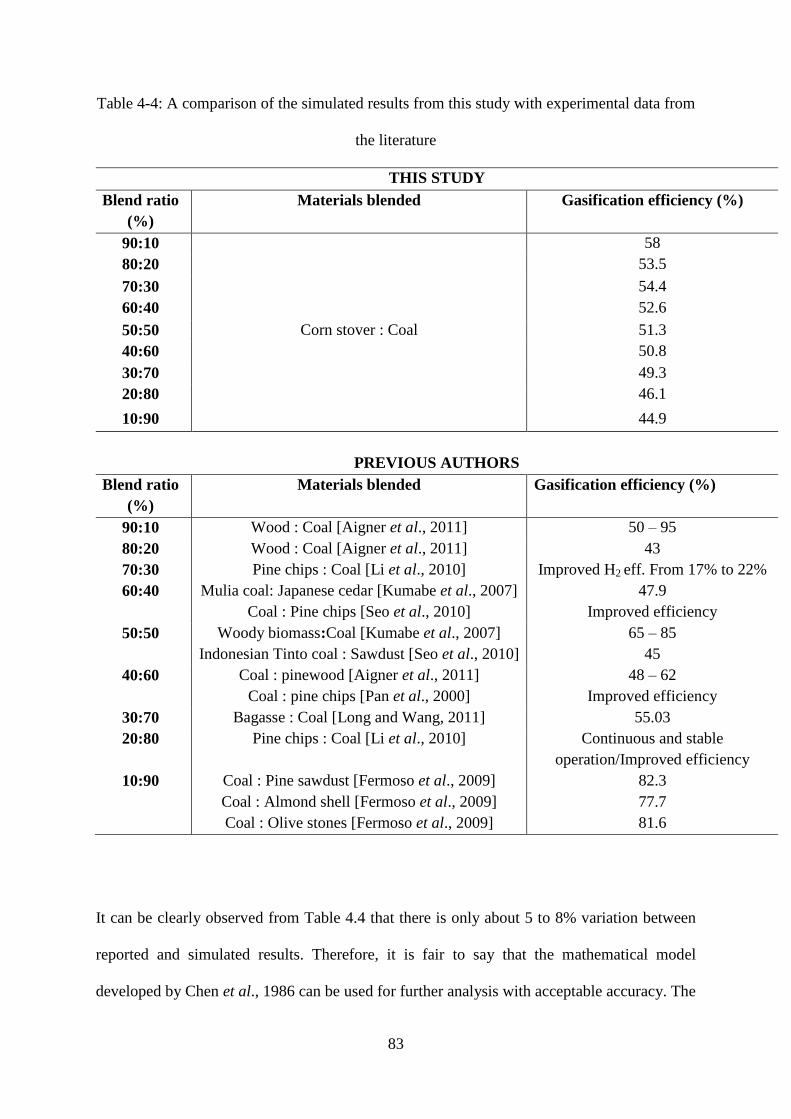
83
Table 4-4: A comparison of the simulated results from this study with experimental data from
the literature
THIS STUDY
Blend ratio
(%)
Materials blended Gasification efficiency (%)
90:10 58
80:20 53.5
70:30 54.4
60:40 52.6
50:50 Corn stover : Coal 51.3
40:60 50.8
30:70 49.3
20:80 46.1
10:90 44.9
PREVIOUS AUTHORS
Blend ratio
(%)
Materials blended Gasification efficiency (%)
90:10 Wood : Coal [Aigner et al., 2011] 50 – 95
80:20 Wood : Coal [Aigner et al., 2011] 43
70:30 Pine chips : Coal [Li et al., 2010] Improved H2 eff. From 17% to 22%
60:40 Mulia coal: Japanese cedar [Kumabe et al., 2007]
Coal : Pine chips [Seo et al., 2010]
47.9
Improved efficiency
50:50 Woody biomass:Coal [Kumabe et al., 2007]
Indonesian Tinto coal : Sawdust [Seo et al., 2010]
65 – 85
45
40:60 Coal : pinewood [Aigner et al., 2011]
Coal : pine chips [Pan et al., 2000]
48 – 62
Improved efficiency
30:70 Bagasse : Coal [Long and Wang, 2011] 55.03
20:80 Pine chips : Coal [Li et al., 2010] Continuous and stable
operation/Improved efficiency
10:90 Coal : Pine sawdust [Fermoso et al., 2009]
Coal : Almond shell [Fermoso et al., 2009]
Coal : Olive stones [Fermoso et al., 2009]
82.3
77.7
81.6
It can be clearly observed from Table 4.4 that there is only about 5 to 8% variation between
reported and simulated results. Therefore, it is fair to say that the mathematical model
developed by Chen et al., 1986 can be used for further analysis with acceptable accuracy. The

84
validated model was used to study the effect of process efficiency. The simulation results
concur with the experimental data found in the literature and are useful in predicting
experimental observations reasonably well based on process efficiency.

85
9 CHAPTER FIVE: SUMMARY, CONCLUSIONS AND
RECOMMENDATIONS
5.1 SUMMARY OF RESEARCH FINDINGS
This study investigated corn stover and coal for the purpose of co-gasification so as to
establish the best mixing ratio that would be suitable for co-gasification based on
composition and energy content as well as using computer simulation. The composition of all
samples used were determined in terms of proximate and ultimate analysis as well as energy
value. These analyses were undertaken so as to compare the physical and chemical properties
as well as the energy content of the corn stover used with that of coal and their blends.
The results of these analyses showed that the values obtained were within acceptable ranges
found in the literature. However, the results established the differences in composition
between corn stover and coal as well as the their blends. The result also showed that a typical
South African sub-bituminous coal has high amount of ash in comparison with the corn
stover. Similar results were found with other properties of the two feedstocks, while the
properties of the blended samples varied slightly.
The high ash content of the coal used was attributed to the influence of extraneous mineral
matter introduced during mining operations where the coal was obtained. The difference in
the pure and blended samples was also noticed from as the blends with high quantities of coal
exhibited high ash contents. Volatile matter content increased with increase quantities of corn
stover in the blends. The fixed carbon content of corn stover was found to be lower than that
86
of coal. This was due to the difference in property between coal and biomass. In contrast, the
fixed carbon content of the blends showed slight variation which was due to the ratio of
volatiles, moisture as well as ash contents of the pure coal.
It was also found that the pure coal sample used for this study had higher carbon content
(approximately 70%), in comparison with the pure corn stover with percentage composition
less than 50%. This establishes the fact that carbon is the primary constituent in coal. Oxygen
composition in corn stover was found to be higher in concentration than that for coal. This
difference was attributed to the carbohydrate nature of corn stover. The difference in
hydrogen composition between corn stover and coal was also noted and was attributed to
differences in chemical properties between both feedstocks. The carbon content of all blends
were quite lower than that of the pure coal which was due to blend ratio as the blends with
higher quantities of coal showed higher carbon content. A variation in oxygen and nitrogen
composition for all blends was also observed, which was also due to the ratio of biomass in
the blends.
The pure coal sample showed a much higher calorific value (22.8 MJ/kg) than the corn
stover. The difference in calorific value was attributed to the concentration of carbon and
oxygen in the samples. The composition of various blends of corn stover/coal was undertaken
in terms of proximate and ultimate analysis as well as energy value which established the
blend of corn stover/coal that was suitable for co-gasification and that resulted in optimum
process efficiency during co-gasification simulation. The thermal stability of the various
blends of corn stover/coal was established. It was found that the maximum temperature
reached for the devolatilization of all blends of corn stover/coal was approximately 900°C at
20°C/min heating rate. It was also found that at all mix ratios, the curves corresponding to the

87
blends maintained essentially the same shape and position and displayed three stages of
weight loss with the last stage of devolatilization occurring at a much higher temperature
(600-800°C) due to char oxidation, except for the 70% CS:30% CL blend which was
characterized by four weight loss stages due to much higher volatile matter content of corn
stover in the blend. The last stage of weight loss occurred at 715°C. However, an initial mass
loss occurred at 105°C temperature for all samples of various blends of corn stover/coal.
It was also noted that the maximum weight loss rate of the pure corn stover sample was much
lower than that of the pure coal. However, the thermal decomposition profile for corn stover
fell in a much narrower temperature range than that for coal, ~220-650°C. Above this
temperatures, varied peaks were observed for corn stover, coal and their blends which was
mainly due to the high volatile matter and lower fixed carbon contents of corn stover as
compared to that of coal. The thermal evolution profile of corn stover can be divided into
three stages apart from its dehydration which corresponded to the removal of cellulose,
hemicellulose and lignin components of corn stover. This was attributed to the fact that corn
stover contains much higher content of volatile matter than the coal.
The SEM images of the blends provided an understanding of the binding mechanisms of corn
stover and coal with morphological changes evident in the physical structures of both images
which was attributed mainly to blending. However, the images confirmed that corn stover
and coal, including their blends are carbonaceous materials suitable for co-gasification in a
downdraft gasifier properly designed to accommodate the properties of blends of corn stover
and coal.
The simulation results of the co-gasification process showed that the efficiency of the co-
gasification process increased with increasing ratio of biomass in the blend and the
88
90%CS:10%CL blend resulted in maximum efficiency of approximately 58%. A comparison
of the computer simulation results presented and experimental data from the literature
showed that the simulation results can serve as a useful tool in predicting experimental
observations reasonably well based on process efficiency.
5.2 SUMMARY OF CONTRIBUTIONS
A lot of information is available on the co-gasification of other biomass materials with coal
than it is for corn stover with coal. This is basically because trials with these feedstocks met
with challenges related to availability, hence the reduced interest its co-gasification with coal.
This research has, however, added information on the co-gasification of corn stover with coal
as well as the effect of blending corn stover and coal on the chemical composition of the
materials.
5.3 CONCLUSIONS
The properties and suitability of corn stover and coal have been investigated to establish the
best mixing ratio that results in enhanced conversion efficiency. However, all results showed
that the suitability of biomass and coal for co-gasification purposes depends on a number of
factors which includes the properties and composition of both feedstock which must be kept
within range for optimum efficiency, the ratio of blending and the operating conditions of the
gasifier. The results further showed that the type and composition of the samples as well as
the ratio of the blends affect the efficiency of the co-gasification process.
89
It was also noted from the results that the properties of corn stover and coal should be kept in
range for optimum co-gasification efficiency. The thermogravimetric analysis undertaken
also revealed the co-gasification temperature of various blends of corn stover/coal and further
established that the blends with higher ratio of coal degraded at a much wider temperature
range due to lower volatile matter content of coal, as compared to the blends with lower
ratios of corn stover. The study also revealed that co-gasification efficiency increased as the
ratio of corn stover in the blends increased due to the high reactivity of corn stover as a result
of high oxygen content. The variation of the co-gasification efficiency was insignificant, only
within 1-2% difference. However, for the blend 10% corn stover:90% coal (10% CS:90%
CL), it was noted that as the content of coal increased in the blend, CO production reduced
during simulation thereby leading to a reduction in the co-gasification efficiency. Based on
these results, there is evidence to suggest that gasifying corn stover with sub-bituminous coal
will raise the efficiency of the co-gasification process. However, the most favourable blend in
terms of efficiency is the 90% corn stover/10% coal (90%CS:10%CL) whose efficiency
reached a maximum of approximately 58% due to a number of factors one of which is the
ratio of corn stover in the blend and the calorific value of the blend as well as the operating
conditions/parameters of the gasifier. Furthermore, a comparison of the simulated data from
this study and experimental data from the literature showed similar results in terms of
efficiency, implying that a laboratory scale or a large scale downdraft gasification system for
the purpose of co-gasification of corn stover and coal can be designed using simulation
results.

90
5.4 RECOMMENDATION FOR FUTURE RESEARCH
Despite much research in this field, co-gasification of coal with corn stover has not yet been
fully explored. The tar production from this process needs further investigation as well as
variation of the operating conditions of the gasifier so as to examine their effect on the
efficiency of the co-gasification process. The pre-processing of the corn stover before
blending and co-gasification with coal is also recommended to lower its moisture content and
increase its bulk density for gravity feed in the gasifier.
91
REFERENCES
Aigner., I.; Pfeifer, C., Hofbauer, H., 2011. Co-gasification of coal and wood in a dual
fluidized bed gasifier. Fuel 90, 2404–2412.
Anon., 1997. European Commission, (1997) Communication from the commission: Energy
for the future; renewable energy source - White paper for a community strategy an
action plan. COM (97) 599, FINAL OF 16.11.97. Brussels. In Maniattis K. 2005
Progress.in biomass gasification, Brussels - Belgium: COM (97) 599, .
Anon., 2011. http://anto-hendarto.blogspot.com/2011/09/ash-content-of-coal.html. [Online]
Available at: http://www.anto-hendarto.blogspot.com
[Accessed 21 February 2014].
Anukam., A.; Mamphweli, S.; Meyer, E. and Okoh, O., 2014. Computer simulation of the
mass and energy balance during gasification of sugarcane bagasse.. Journal of Energy,
Volume 2014, pp. 1-9.
Barten, J. 2013. Evaluation and prediction of corn stover biomass and composition from
commercially available corn hybrids. PhD thesis, Iowa State University, Ames, Iowa.
Baxter, L., 2005. Biomass-coal co-combustion; opportunity for affordable renewable energy.
[Online]
[Accessed 2 September 2009].
Beall, F.C. and Eickner, H.W., 1970. Thermal degradation of wood component: a review of
literature, s.l.: s.n.
Beeneckers, A., 1999. Biomass gasification in moving beds, a review of European
technologies. Renewable energy, pp. 1180-1186.
Bezzon, G. and Cortez, L., 1999. Biomass in Brazil. Energy and Agriculture towards the
third millenium conference. Athens, s.n.
92
Biomass Energy Technologies (1987). Thermochemical conversion of biomass to energy.
Prepared for UNIDO, Vienna, Austria.
Bosch, F., 1998. Flue gas condition - SO3 injection rates for South African coal ashes, s.l.:
s.n.
Bossel, 1980. "Heizen mit Holz". s.l., s.n., p. 84(85):117.
Botnen, L.S.; David, W. Fisher, Anastasia, A.; Dobroskok, Tom, R.; Bratton, Keith, H.;
Greaves, T.; Robert, Mclendon; Greg, Steiner; James, A.; Sorense, Edward N. Steadman
and John, A. Harju, 2009. Field Test of CO2 Injection and storage in Lignite Coal seams
in North Dakota. Energy Procedia 1, pp. 2013-2019.
Bourgeois, J.; Bartholin, M.C. and Guyonnet, R., 1989. Thermal treatment of wood: analysis
of the obtained product - Wood modification: chemical thermal and other processes.
Wood Science and Technology, p. P104.
Bramer, E.A.and Brem, G., 2007. 15th European Biomass Conference and Exhibition, 7-11
May 2007. Berlin, Germany, s.n.
Brammer, J.G. and Bridgewater, A.V., 2002 (4). The influence of feedstock drying on the
performance and economics of a biomass gasifier engine CHP system.. Bioenergy, 22(4),
pp. 271-281 d.
Brar, J.S.; Sing, K., Wang, J. and Kumar, S., 2012. Co-gasification of coal and biomass - a
review. s.l.:s.n.
Bridgewater, A., 1995. The technical and economic feasibility of biomass gasification for
power generation. Fuel , Volume 74 (5), pp. 631-655.
Britannica Inc., 2014
British Geological Survey – Technical report WD/89/15. Hydrogeology Series. The
Basement Aquifer Research Project 1984-1989: Final report to the Overseas
Development Administration.
93
Chen, C. and Azeredo, J.L.T., 2005. Estimating the higher heating value of biomass and coal
for methanol synthesis from basic analysis data.. Biomass and bioenergy 28 (2005) (5),
pp. 499-507.
Cheng, C. and Azevedo, J.L.T., 2005. Estimating the higher heating value of biomass fuels
from dry analysis data. Biomass and Bioenergy, Volume 28 (5), pp. 499-507.
Chmielniak, Tomas and Sciazko, Marek, 2003. Co-gasification of biomass and coal for
methanol synthesis. Applied Energy, Volume 74, pp. 393-403.
Chopra, S. and jain, A., 2007. A review of Fixed Ded Gasification Systems for Biomass..
s.l.:s.n.
Ciolkosz, D., 2010. Characteristics of biomass as a heating fuel.. [Online]
Available at: http://www.energy.extension.psu.edu
[Accessed 22 June 2013].
Ciolkosz, D., 2010. www.energy.extension.psu.edu. [Online]
Available at: http://www.energy.extension.psu.edu
[Accessed 20 November 2012].
Clarke, S and Preto, F. (2011). Biomass Densification for Energy Production. Factsheet of
the Ontarion Minitry of Agriculture, Food and Rural Affairs.
de Olivier, J.L.;da Silva, J.N. and Pereira, E.G., 2013. Characterization and mapping of waste
from coffee and eucalyptus production in Brazil for thermochemical conversion of
energy via gasification. Renewable and Sustainable Energy Reviews, Volume 21, pp. 52
- 58.
Demibras, A., 2004. Combustion characteristics of different biomass fuels. Progress in
Energy and Combustion Science, 30(2), pp. 219 - 230.
Demirbas, A., 2004. Combustion characteristics of different biomass fuels.. s.l.:s.n.
94
Devi, L., 2005. catalytic removal of biomass tars; Olivine as prospective in bed catalyst for
fluidized-bed biomass gasifier, PhD Thesis. s.l., s.n.
DME and DANCED, 2001. Bulk Renewable Energy Undependent Power Producers in South
Africa, January 2001, Pretoria: s.n.
DME, Eskom and CSIR, 1999. s.l.:s.n.
DME, Eskom and CSIR, 2001. South African Renewable Energy Resource Database.
[Online]
Available at: http://www.csir.co.za/environmentek/sared/contact.html
[Accessed 5 March 2011].
DME, 1998. White paper on energy policy of Republic of South Africa, Pretoria: s.n.
DME, 2003. Integrated Energy Plan for the Republic of South Africa, Pretoria: s.n.
DTI, 2002. Waste/Biomass co-gasification with coal. s.l.:s.n.
Dhugga, K.S. 2007. Maize Biomass Yield and Composition for Biofuels. Crop Science 47(6):
2211-2227.
Durie, R. A., 1982. Coal properties and their importances in the production of liquid fuels.
Lorne, Victoria(North Sydney): R. W. Miller & Co. Pty Ltd.
DWAF, 2003. Comments on the Draft White Paper on Renewable Energy, April 2003, s.l.:
s.n.
Elaine, Virmond, Rennio, F. De Sena, Waldir, Albrecht, Christine, A. Althof, Regina, F.P.M.
Moreira, Humberto, J. Jose, 2012. Characterisation of agroindustrial solid residues as
biofuels and potential application in thermochemical processes. Waste Management, 13
May, Volume 32 (2012), pp. 1952-1961.
Eskom, 2007. Eskom annual report. s.l.:s.n.
European Committee for Standardization. Solid biofuels - Determination of the content of
volatile matter. Final draft FprEN 15148, (2009).
95
European Committee for Standardization. Solid biofuels - Determination of ash content.
Final draft FprEN 14775, (2009).
European Committee for Standardization. Solid biofuels - Determination of moisture content
- Oven dry method - Part 3: Moisture in general analysis sample. Final draft FprEN
14774-3, (2009).
Fenimore, C., 1971. Formation of nitric oxide in premixed hydrocarbon flames. In. Proc. of
thirteenth symposium (International) on combustion.. Pittsburg, s.n., pp. 373-380.
Fermoso, J.; Srias, B.; Plaza, M.G.; Rubiera, F Pis, J.J. et al, 2009. High pressure co-
gasification of coal with biomass and petroleum coke.. Fuel Process Technol, Volume
90(7-8), pp. 926-32.
Ganesh, A., 2006. Biomass Resources, Characterisation and Technologies, IIT Bombay, 21st
September. Bombay, s.n.
Gaqa, S. Thesis (M. Sc – Chemistry) (2013). University of Fort Hare, Alice, Eastern Cape,
South Africa
Gaur, S. and Reed, T., 1998. Proximate and ultimate analysis of several biomass. s.l.:s.n.
Gonzalo-Tirabe, C.; Santiago Jimenez and Javier Ballester, 2011. Combustion and flame xxx
(2011) xxx-xxx.Combust. Flame (2011), doi:10.1016/j.combustflame.2011.07.001..
s.l.:s.n.
Gustafsson, E., 2011 . Characterization of Particulate Matter from Atmospheric Fluidized
bed Biomaa Gasifiers - PhD thesis at Linnaeus University. s.l.:s.n.
Hall, D.O. and Overend, R.P.; 1987, n.d. Biomass regenerable energy. s.l.:John Wiley &
Sons.
Hall, D.O., Rosillo-Calle, Williams, R.H. and Woods, J.1991, 1991. Biomass for energy
supply prospects. In: Johansson T.B. et al editors. Renewable energy - sources for fuels
and electricity.. Washington DC, Island Press : 1993, pp. Pg 593-651.
96
Hill, C., 2006. Wood Modification: Chemical and other processes.. Banor: s.n.
Hoskinson, R. L., Karlen, D.L., Birrell, S.J., Radtke, C.W and Wilhelm, W.W., 2007.
Engineering, nutrient removal, and feedstock conversion evaluations of four corn stover
harvest scenarios. Biomass and Bioenergy 31(2‐3): 126‐136.
Hoss, J.J. and Groeneveld, M.J., 1987. Biomass gasification, Biomass: Renewable energy.
eds Hall D.O. and Overend R.P., s.l.: John Wiley & sons.
IEA, 2007. International Energy Agenny - AgencyWorld energy Outlook. [Online]
Available at: http://europa-eu.int/comm/energy/res/sectors/doc/bioenergy/km-tyrol-
tony.pdf
[Accessed 10 February 2010].
Jahah, T. H.; Lu, A.; Fuller, R. J. and Steward, D. F., 2003. Computer simulation of a
downdraft wood gasifier for tea drying. Biomass and Bioenergy, Volume 25 (4), pp. 459-
469.
Jeffrey, L., 2005. The Journal of the South African Institute of Mining and Metallurgy.
February.Issue SA ISSN 0038-223X3.00+0.00.
Jenkins, B.M. Kitani, O. and Hall, C.W., 1989. Physical properties of biomass. In: Biomass
Handbook. New York (NY): Gordon & Bearch, p. Chapter 5.2.
Jenkins, B.M.; Baxter, L.L.and Miles Jr., T.R.;, 1998. Combustion properties of biomass..
Fuel Processing Technology, Volume 54, pp. 17-46.
Khan, A. A.; de Jong, W.; Jansens, P.J. and Spliethoff, H., 2009. Biomass combustion in
fluidized bed boilers: potential problems and remedies.. Fuel Process Technology,
Volume 90, pp. 21-50.

97
Khawan, Ammar and Flanagan, Douglas R., 2006. Solid-state Kinetic Modela: Basics and
Mathematical Fundamentals. J. Phys. Chem. B., 110(35)(DOI: 10.1021/JP062746A), pp.
17315-17328.
Kim et al, 2001. Thermal decomposition of cellulose crystallites in wood.. Holzforrschung
55, pp. 521-524.
Kitani and Hall, 1989. s.l.: s.n.
Kumar, A.; Jones, D: and Milford, A., 2009. Thermochemical Biomass Gasification: A
Review of the Current Status of the Technology. Open Access Energies, Volume 2, pp.
556-581.
Kumar, A.; Wang, L.; Dzenis, D.D.; Hanna. M.A., 2008. Biomass and Energy. Biomass and
Energy, Volume 32, pp. 460-467.
Leckner, B. and Karlsson, M., 1993. Gaseous emission from circulating fluidized bed
combustion of wood. In.. Biomass and bioenergy, Volume 4, No. 5, pp. 379-389.
Lee, See Hoon; Kim, Sang Dome and Lee, Dong Hyun, 2002. Particle size reduction of
anthracite coals during devolatilization. Fuel, Volume 81, pp. 1633-1639.
Lynch, D.; Heninan, A.M.; Bowen, B.; Lynch, D.; McDonnell, K. Kwapinski, W. and Leahy,
J.J., 2013. Utilization of poultry litter a an energy feedstock. Biomass and Bioenergy,
Volume 49, pp. 197 - 204.
Malatji, P., 2009. Processing of wood and agricultural biomass gasification - Master"s
Thesis, University of Stellenbosch, South Africa. s.l.:s.n.
Mamphweli, N. S. and Meyer, E.L., 2005. University of Pretoria, Pretoria, 50th South
African Institute of Physics (SAIP) conference.
Mamphweli, N.S. and Meyer, E.L., 2009. Efficiency investigation of Eskom 180 Nm^2 /h
gasifier system.. International Journal for Energy and Environment., Volume 1(1), pp.
113-120.
98
Mamphweli, N.S. and Meyer, E.L., 2009. Implementation of the biomass gasification project
for community economic empowerment at Melane village. Renewable Energy, Volume
34 , pp. 2923-2927.
Mamphweli, N.S. and Meyer, E.L., 2009. Implementation of the biomass gasification project
for community economic empowerment at Melane village. Renewable Energy, Volume
34, pp. 2923-2927.
Mamphweli, 2009. Implementation of a 150 KVA biomass gasifier system for community
empowerment in South Africa - PhD Thesis. Alice (Eastern Cape): University of Fort
Hare.
Mangena, S.J. and Brent, A.C., 2006. Application of life cycle impact assessment framework
to evaluate and compare environment performances with economic values of supplied
coal products.. Journal of Cleaner Production, Volume 14, pp. 1071-1084.
Maniatias, K., 1999. Overview of EU THERME gasification projects. In Sipila K. and
Castello M., power production from biomass 111, gasification and pyrolysis R and D for
industry, VTT SYMPOSIUM 192, VTT Espoo.. s.l., s.n.
Maniatis, K., 1999. Overview of EU THERMIE gasification projects. In Sipila, K. & Castello,
M., Power production from biomass [1], gasification and pyrolysis R&D for industry,
VTT symposium 192, VTT Espoo. s.l., s.n.
Mansaray, G.K.and Ghaly, A.E., 1999. Biomass and energy. Biomass and energy, Volume
17, pp. 19-31.
Mckendry, P., 2002. Energy production from biomass (Part 3): Gasification technology.
Gasification Technology, Volume 83 (1), pp. 55 - 63.
Meuzelaar, H.L.C., Winding, W. and Metcalf, G. Steven, 1996. Numerical extraction of
chemical patten from pyrolysis mass spectra of US Lignite. s.l., s.n.

99
Meuzelaar, Henk, L.C., Winding, W. and Metcalf, G. Steven, 1996. Numerical extraction of
chemical patten from Pyrolysis mass spectra of U.S.. s.l.:s.n.
Miller, J.A. and Bowman, C.T., 1989. Mechanism and modelling of nitrogen chemistry in
combustion. In:. Prog. Energy Combust. Sci., Volume 15, pp. 287-338.
Morey, R.V., Hatfield, D.L., Sears, R., Haak, D., Tiffany, D.G., Kaliyan, N., 2009. Fuel
properties of biomass feed streams at ethanol plants. American Society of Agricultural
and Biological Engineers ISSN 0883-8542.
N94, C. 3. -. W., 2003. Final draft, European Committee for standardization, editor..
Brussels, Belgium: Solid biofuels - Fuel specifications and classes.
NETL, 2008. Newsletter Issue 10.. s.l.:s.n.
Nordin, A. (1994). Chemical elemental characteristics of biomass fuels. Biomass and
Bioenergy 6, 339-347.
Nussbaumer, T., 2002. Combustion and co-combustion of biomass, In: Proc. of the 12th
European Biomass Conference. s.l., s.n., pp. 31-37.
Obernberger, I.; Biedernmann, F.; Widman, W. and Riedl, R., 1997. Concentrations of
inorganic elements in biomass fuels and recovery in the different ash fractions. Biomass
Bioenergy, Volume 12, pp. 211-24.
Obernberger, I.; Brunner, T. and Barnthaler, G., 2006. Chemical properties of solid biofuels -
significance and impact.. Biomass and Bioenergy, Volume 30, pp. 973-982.
Obernnerger, I., 2003. Physical characteristics and chemical composition of solid biomass
fuels. In Script for the lecture Thermochemical biomass conversion, chapter 3.
Netherlands: Department of Mechanical Engineering, Section Process Technology (ed).
Palmer, C.A. and Lyons, P.C., 1996. Selected elements in major minerals from bituminous
coal as determined by INAA: Implication of removing environmentally sensitive
elements from coal.. International Journal of Coal Geology, Volume 32, pp. 151-166.
100
Parker, P., 2006. Shell coal gasification process updates. [Online]
Available at: http://www.shell.co./home/content/innovation/managing-
emissions/gasification/coal-gasification.html
[Accessed 20 Jan 2010].
Paul, W.C. and Buchele, W.F., 1980. Development of a concentric vortex agri-residue
furnace. Agri Energy, Volume 2, pp. 349-356.
Pedersen, L.S., Nielsien, H.P.,Hansen, L.A.;Dam-Johanse, K.; Kildsig, F.; Chriestensen, J.
and Jespersen., 1996. Full-scale co-firing of straw and coal. Fuel 75, pp. 1584-1590.
Pordesimo, L.O., Hames, B.R., Sokhansanj, S and Edens, W.C. 2005. Variation in corn
stover composition and energy content with crop maturity. Biomass and Bioenergy
28(4): 366–374.
Prins, M.J.; Ptasinski, K.J. and Janssen, F.G.J.J, 2007. From coal to biomass gasification:
Comparison of thermodynamic efficiency. Energy, Volume 32, pp. 1248-1259.
Quaack, Peter; Harrie and Stassen, Hubert., 1999. Energy from Biomass.. In: A Review of
Combustion Technology. WORLD BANK TECHNICAL REPORT NO.422. Energy series.
s.l.:s.n.
Rajvanshi, A., 1986. Biomass Gasification.. s.l.:Yogi Goswani and CRC Press,.
Rajvanshi, A., 1986. Biomass Gasification. Alternative. Alternative Energy in Agriculture..
s.l., Yogi Goswani and CRC Press, pgs 83-102.
Rene, M.; Philippe, S. and Joey, V., 2013. Corn Stover and Wheat Straw Combustion in a
176-kW Boile Adapted for Round Bales. Energies, 6(ISSN 1996-1073), p. 5760=5774.
Robinson, A.L., Junker, H. S. G., Sclippa, F. and Baxter, L.L.,, 1998. Interactions between
coal and biomass when co-firing.. s.l., s.n., pp. 1351-59.
Safriti, Anis Thesis; , 2005. Biomass gasification using bubbling fluidized - bed gasifier:
investigation of the effect of different catalyst on tar reduction. Eindoven: s.n.
101
Saha, Biswanath. and Ghoshal Aloke K., 2007. Hybrid genetic Algorithm and Model-free
Coupled Direct Search Methods for Pyrolysis Kinetics of. zsm-5 Catalyzed
Decomposition of waste Low-Density Polyethylene, pp. 5485-5492.
Scane, 1993. s.l.: s.n.
Sharma, A., 2008. Equilibrium Kinetic modeling of char reduction in a downdraft biomass
gasifier: A comparison. Solar Energy 82 (2008), pp. 918-928.
Siveria, S. and Foster, D., 2008. Encyclopedia ID p1155. [Online]
Available at: http://www.eia.doe.gov/kids/energy.cfm?page=coal-home-basis.
[Accessed 04 02 2011].
Spliethoff, H. W., Scheurer, W. and Hein, K.R.G., 2000. Effect of co-combustion of sewage
sludge and biomass on emissions and heavy metals behaviour. Process Sas Environ Prot
78, pp. 33-39.
Strehler, A., 1998. Necessity and chances of energy from biomass and hindrance to success.
10th European on Biomass for Energy and Industry. June 1998, Wurzburg, Germany.
Wurzburg, s.n.
Stretcher, A., 1984. Moglichkeiten der Trocknung von Holzhackschnitzeln, Sonderdruck der
Landtecknik Weihensteephan, 17 seiten. s.l.:s.n.
The Babcock & Wilcox Company, 2014. Coal by grade. Pp 36 – 5. ISBN 0 – 9634570 – 1 –
2. http://en.wikipedia.org/wiki/Sub-bituminous_coal. Last acceses 23 December 2013.
Thielemann, T.; Scmidt, sandro; Gerling, J. Peter, 2007. Lignite and hard coal; Energy
suppliers for world needs until the year 2100 - an outlook.. International journal of Coal
Geology, pp. 1-14.
Unger, P. & 1994., n.d. Managing Agricultural Residues. s.l.:CRC.

102
Valero, A. and Uson, S., 2006. Oxy-co-gasification of coal and biomass in an integrated
gasification combined cycle (IGCC) power plant.. Energy, Volume 31, pp. 10-11:1643-
55.
Valero, Antonio and Uson, Sergio, 2003. Oxy-co-gasification of coal and biomass in an
integrated gasification combined cycle (IGCC) power plant.. Energy, August, 31(10-11),
pp. 1643-1655.
van Loo, S. and Koppejan, J., 2002. Handbook of biomass combustion and co-firing. 32 -
ISBN 9036517737 - PP 171-213 ed. s.l.:IEA BIOENERGY TASK 32, .
Vassilev, Stanislav, V.; Baxter, David; Andersen, Lars, K. and Vassileva, Christina,G., 2010.
An overview of the chemical composition of biomass.. Fuel, Volume 89, pp. 913-933.
Vassilev, S. V., Baxter, D. & Andersen, L. K. a. V. C. G., 2010. An overview of the chemical
composition of biomass. Fuel, Volume 89, pp. 913-933.
Velez, J.F.; Chejne, F.; Emery, C.F. and Londono, E.J.C.A., 2008. Co-gasification of
Columbian coal and biomass in fluidized bed: An experimental study. s.l.:s.n.
Vutharulu, H., 2004. Bioresource Technology. Bioresource Technology, Volume 92(2), pp.
187-195.
Vyozovkin, S., 1996. A unified approach to kinetic processing of non-isothermal data.
International journal of chemical kinetics, Volume 28, pp. 95-101.
White, L.P. and Plaskett, L.G., 1981. Biomass as fuel, (1) 1-25 and 28-30. London, Academic
Press Inc, London ltd 28/28 Oval Road. London NW1 7DX, pp. (1) 1-25 and 28-30.
Zhang, Y., Ghaly, A., Bingxi, L. Physical properties of corn residues. American Journal of
Biochemistry and Biotechnology, 2012, 8(2), 44-53.
103
11 APPENDIX A: RESEARCH OUTPUTS ASSOCIATED
WITH THIS STUDY
The research outputs associated with this work are as follows:
A1: JOURNAL PUBLICATION
A1.1 Submitted paper
1. Anthony I. Anukam, Sampson N. Mamphweli, Polycarp S. Mabizela, and Edson L.
Meyer. The properties and suitability of various biomass and coal blends for co-
gasification in a downdraft gasifier system. Anthony (Under review with the
International Journal of Energy and Environment)
A2: CONFERENCE PROCEEDINGS
A2.1 South African Institute of Physics Conference
1. P.S. Mabizela, E.L. Meyer and N.S. Mamphweli. Thermal characterization of various
biomass materials for co-gasification with coal. Presented at the 57th
SAIP conference
at the University of Pretoria, 2012 and at the Centre for Renewable and Sustainable
Energy Studies at Stellenbosch University.
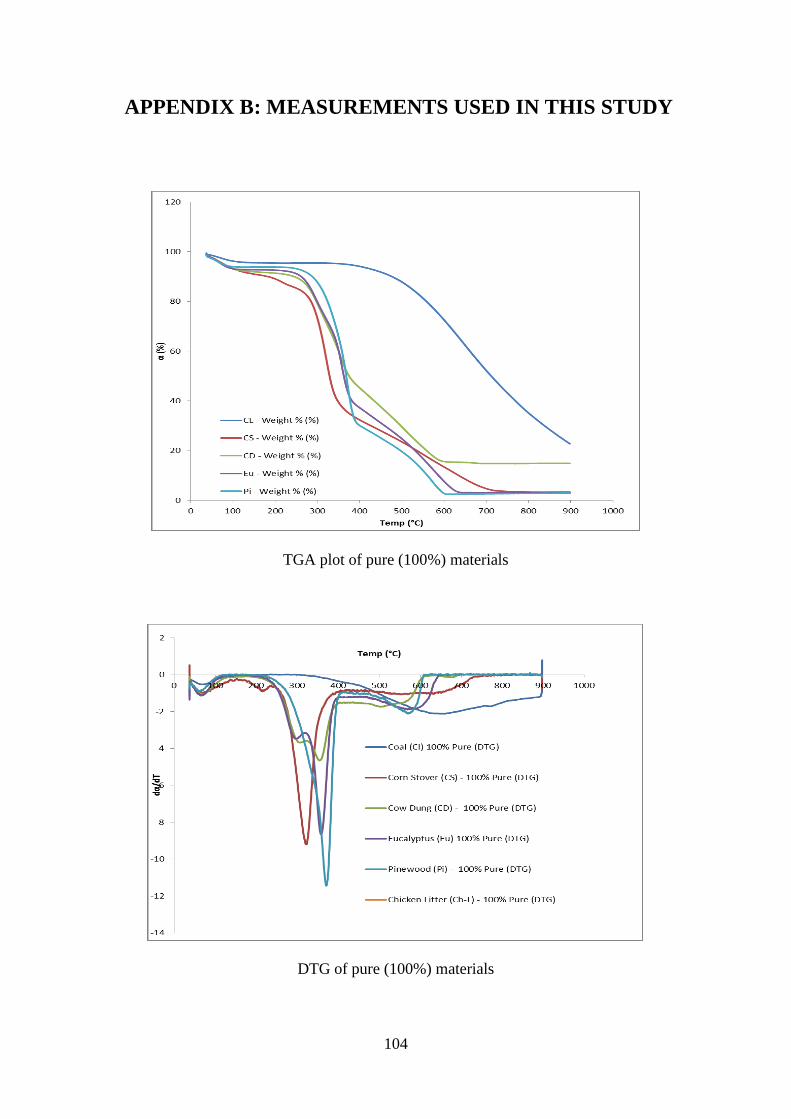
104
12 APPENDIX B: MEASUREMENTS USED IN THIS STUDY
TGA plot of pure (100%) materials
DTG of pure (100%) materials

105