Embed Size (px)
Citation preview
Characterization and Evaluation ofthe BEA WebLogic JRockit JVM on
the Itanium II platform
G U S T A V O Z A G O B A S I L I O
Master of Science ThesisStockholm, Sweden 2003
IMIT/LECS-2003-43

Inst för Mikroelektronik och Informationsteknik Kungl Tekniska Högskolan 100 44 STOCKHOLM
Dept of Microelectronics andInformation Technology
Royal Institute of TechnologySE-100 44 Stockholm, SWEDEN
Characterization and Evaluation of the BEA WebLogic JRockit JVM on the Itanium II
platform
Master of Science Thesis
GUSTAVO ZAGO BASILIO
IMIT/LECS-2003-43
Master’s Thesis in Internetworking (20 credits) at the Department of Microelectronics and Information Technology,
Royal Institute of Technology, December 2003
Supervisor is Isak Isacsson at R2Meton AB Examiner is Vladmir Vlassov at Dept of Microelectronics and Information Technology

i
Abstract
As Internet evolves toward a mature communication and data exchange medium, more and more services migrate to its domain, giving users wider range of possibilities, but also demanding higher performance from the servers, as these new services tend to be more advanced and more complex than the ones previously available.
Over the years Java has become the language of choice for implementing server-side Internet applications. However, Java was not initially designed for the specific demands of server-side applications and its use as a server-side technology has put completely new requirements on the JVMs.
Traditional JVMs were designed and optimized for desktop environments and were built to support the single-user perspective. As time passed, they were modified to work better with server-side applications. BEA WebLogic JRockit takes a new approach by being the first commercial JVM built from the ground up to specifically meet the requirements of server-side Java applications. For this reason, BEA WebLogic JRockit is a very interesting subject of study, as it could imply in better performance for server-side applications with no extra costs.
This master thesis project is focused on BEA WebLogic JRockit 8.1 and its behavior and performance as a server-side JVM. The project thoroughly investigates JRockit and compares it with other JVM’s available for the Itanium II platform. The internals of JVMs in general and JRockit in particular are deeply studied, and issues like JRockit’s performance, scalability, reliability and tuning options are tested, compared to other JVMs and analyzed.
ii
Acknowledgements
This master thesis project was without a doubt one of the best professional and academic experiences I have ever had. For the first time since the start of my professional career I had the opportunity to join academic research with company business. This new experience of having research and business integrated as well as the technical knowledge I acquired during the development of this master thesis made this project one of the most enriching professional experiences I have ever had.
Most of all I would like to thank Ulf Börjesson, manager at R2M, for all the support he gave me throughout the project. From books to hardware equipment he was always ready to help when something was needed. And most important of all, he helped me to keep motivation even when things went wrong and my moral was low.
I also would like to thank Isak Isacsson, my supervisor at R2M, for the help with technical issues related to the project and Vladmir Vlassov, my examiner at KTH, for the help with bureaucracy and academic issues as well as for guiding me when writing the report.
At last I would like to thank some of my friends who spent part of their time discussing issues related to my thesis and/or helped me to keep the motivation throughout the project. Juan Mata Pavia, who helped me a lot to get started and keep motivation in the early stages of the project, and also spent a lot of time discussing with me about JRockit and JVMs. Konstantinos Avgeropoulos and Nrip Nihalani, who made me see things under a new perspective due to their critical view on JVMs and Java. And finally, Dmitri Shiplov, who gave me important hints on practical things as Oracle and EJBs.
iii
Table of Contents
1 INTRODUCTION............................................................................................................................... 1 2 THE PROJECT .................................................................................................................................. 3
2.1 PROJECT PARTICIPANTS ............................................................................................................... 3
2.2 BACKGROUND.............................................................................................................................. 4
2.3 MOTIVATION................................................................................................................................ 6
2.4 GOALS.......................................................................................................................................... 8
2.5 LIMITATIONS................................................................................................................................ 8
3 INSIDE THE JVM.............................................................................................................................. 9 3.1 THE JVM IN THE JAVA ARCHITECTURE........................................................................................ 9
3.2 SERVER JVMS.............................................................................................................................10
3.3 JVM ARCHITECTURE ..................................................................................................................10
3.3.1 Class Loader..........................................................................................................................11
3.3.2 Execution Engine...................................................................................................................12
3.3.3 Garbage Collection ...............................................................................................................13
3.3.4 Thread Management..............................................................................................................15
4 INSIDE BEA WEBLOGIC JROCKIT............................................................................................17 4.1 INITIAL CONSIDERATIONS............................................................................................................17
4.2 THE DESIGN OF BEA WEBLOGIC JROCKIT.................................................................................17
4.2.1 Code Generation Package.....................................................................................................18
4.2.2 Memory Management Package .............................................................................................20
4.2.3 Thread Management Package ...............................................................................................21
4.2.4 Native Package ......................................................................................................................23
5 PROBLEM DEFINITION AND ANALYSIS..................................................................................24 5.1 SCOPE OF THE PROJECT ...............................................................................................................24
5.2 PERFORMANCE, SCALABILITY AND RELIABILITY.........................................................................24
5.3 COMPARING JVMS......................................................................................................................25
5.4 EVALUATION PROCESS ................................................................................................................25
iv
6 METHOD ...........................................................................................................................................27 6.1 ECPERF .......................................................................................................................................27
6.1.1 Introduction to ECperf...........................................................................................................27
6.1.2 ECperf Domains ....................................................................................................................27
6.1.3 ECperf application design .....................................................................................................28
6.2 SOFTWARE AND HARDWARE PLATFORMS ....................................................................................29
6.3 TESTS ..........................................................................................................................................33
6.3.1 Performance and scalability tests..........................................................................................33
6.3.2 Reliability tests ......................................................................................................................33
6.3.3 JVM tuning tests ....................................................................................................................34
7 RESULTS AND ANALYSIS.............................................................................................................38 7.1 SETUP 1.......................................................................................................................................38
7.1.1 Performance ..........................................................................................................................38
7.1.1.1 Throughput................................................................................................................................. 39
7.1.1.2 Response Time........................................................................................................................... 42
7.1.2 Scalability ..............................................................................................................................45
7.1.3 Reliability ..............................................................................................................................47
7.1.4 Tuning....................................................................................................................................47
7.2 SETUP 2.......................................................................................................................................50
7.2.1 Performance ..........................................................................................................................50
7.2.1.1 Throughput................................................................................................................................. 52
7.2.1.2 Response Time........................................................................................................................... 54
7.2.2 Scalability ..............................................................................................................................57
7.2.3 Reliability ..............................................................................................................................58
7.2.4 Tuning....................................................................................................................................58
8 CONCLUSIONS AND RECOMMENDATIONS ...........................................................................63 9 FURTHER WORK............................................................................................................................65 10 REFERENCES...................................................................................................................................66 11 APPENDICES....................................................................................................................................69
v
11.1 APPENDIX I – JROCKIT VS SUN’S JVM RAMPUP TIME................................................................69
11.1.1 Sun’s JVM.........................................................................................................................69
11.1.1.1 JDK 1.4.1 ................................................................................................................................... 69
11.1.1.2 JDK 1.4.2 ................................................................................................................................... 71
11.1.2 JRockit ..............................................................................................................................73
11.2 APPENDIX II - INVESTIGATING THE LOAD BALANCE ALGORITHM ON THE WEBLOGIC SERVER CLUSTER.....................................................................................................................................................76
vi
Table of Figures
Figure 1: Time spent by the JVM on different tasks for different application types.......... 7
Figure 2: The JVM in the Java Architecture....................................................................... 9
Figure 3: Inside the JVM .................................................................................................. 11
Figure 4: JRockit code optimization paths [21]................................................................ 19
Figure 5: Native threads and Thin threads........................................................................ 22
Figure 6: application server and DBMS on the same machine (setup 1).......................... 31
Figure 7: application server and DBMS on separate machines (setup 2) ......................... 32
Figure 8: Throughput of the ECperf application on the IA64x1 machine (setup 1) according to the injection rate and JVM used........................................................... 40
Figure 9: CPU utilization on the IA64x1 machine (setup 1) during the steady execution of the ECperf application (after the RampUp time) according to the injection rate and JVM used. ................................................................................................................. 41
Figure 10: Time taken for a WorkOrder to complete in the Manufacturing Domain (IA64x1 – setup 1), according to the injection rate and JVM used. ......................... 42
Figure 11: Time taken for a NewOrder Transaction to complete in the Customer Domain (IA64x1 - setup 1), according to the injection rate and JVM used. .......................... 43
Figure 12: Time taken for a ChangeOrder Transaction to complete in the Customer Domain (IA64x1 - setup 1), according to the injection rate and JVM used. ............ 43
Figure 13: Time taken for an OrderStatus Transaction to complete in the Customer Domain (IA64x1 - setup 1), according to the injection rate and JVM used. ............ 44
Figure 14: Time taken for a CustomerStatus Transaction to complete in the Customer Domain (IA64x1 - setup 1), according to the injection rate and JVM used. ............ 44
Figure 15: JVMs throughput on the IA64x4 machine of setup 2 ..................................... 53
Figure 16: CPU utilization on the IA64x4 machine (setup 2) according to the injection rate, JVM used and application server configuration (non-clustered/clustered). ..... 53
Figure 17: Time taken for a WorkOrder to complete in the Manufacturing Domain (IA64x4 – setup 2) .................................................................................................... 54
Figure 18: Time taken to complete a NewOrder Transaction in the Customer Domain (IA64x4 - setup 2)..................................................................................................... 55
vii
Figure 19: Time taken to complete a ChangeOrder Transaction in the Customer Domain (IA64x4 - setup 2)..................................................................................................... 55
Figure 20: Time taken to complete an OrderStatus Transaction in the Customer Domain (IA64x4 - setup 2)..................................................................................................... 56
Figure 21: Time taken to complete a CustomerStatus Transaction in the Customer Domain (IA64x4 - setup 2) ....................................................................................... 56
Figure 22: Relation Throughput x Time in 1 minute steps for JDK 1.4.1........................ 69
Figure 23: Relation Throughput x Time in 3 minutes steps for JDK 1.4.1 ...................... 70
Figure 24: CPU utilization (JDK 1.4.1) ............................................................................ 70
Figure 25: Relation Throughput x Time in 1 minute steps for JDK 1.4.2........................ 71
Figure 26: Relation Throughput x Time in 3 minutes steps for JDK 1.4.2 ...................... 72
Figure 27: CPU utilization (JDK 1.4.2) ............................................................................ 72
Figure 28: Relation Throughput x Time in 1 minute steps (JRockit) ............................... 73
Figure 29: Relation Throughput x Time in 3 minutes steps (JRockit) ............................. 74
Figure 30: CPU utilization (JRockit) ................................................................................ 74
Figure 31: Throughput x load-balance algorithm measured in the WebLogic cluster in the IA64x4 machine of setup 2. ...................................................................................... 77
viii
Table of Tables
Table 1: List of the software used to perform the tests, their versions and descriptions. . 30
Table 2: List of the JVMs tested, their versions and descriptions. ................................... 31
Table 3: JRockit non-standard startup options.................................................................. 36
Table 4: command line for starting the JVM in each of the application server configurations used in setup 1................................................................................... 39
Table 5: Highest injection rate used with the JVMs without degrading the performance and service quality and the throughput measured in each case (setup 1). ................ 47
Table 6: Values used in the ECperf driver to run the tests for investigating tuning techniques for JRockit on setup 1 ............................................................................. 48
Table 7: tuning JRockit with the singlecon garbage collector.......................................... 48
Table 8: tuning JRockit with the parallel garbage collector ............................................. 49
Table 9: command line for starting the JVM in each of the application server configurations used in setup 2................................................................................... 51
Table 10: Highest injection rate used with the JVMs without degrading the performance and service quality and the throughput measured in each case (setup 2). ................ 58
Table 11: Values used in the ECperf driver to run the tests for investigating tuning techniques for JRockit on setup 2 ............................................................................. 59
Table 12: On the first test no parameters were given, that is, JRockit tries to optimize the execution automatically. ........................................................................................... 60
Table 13: Startup options and results for the singlecon garbage collector. The startup options used were the ones which achieved the best performance on setup 1 (75% of the available RAM for the heap and 0.5% for the thread stack)............................... 60
Table 14: Startup options and results for the parallel garbage collector. The startup options used were the ones which achieved the best performance on setup 1 (small min heap, 75% RAM max heap and default thread stack size 128kb). .................... 60
Table 15: Startup options and results for the gencopy garbage collector. Several sizes for the heap, thread stack and nursery were tested on the search for the best performance. ............................................................................................................. 61
ix
Table 16: Startup options and results for the gencon garbage collector. Several sizes for the heap, thread stack and nursery were tested on the search for the best performance. ............................................................................................................. 61
Table 17: Values used in the ECperf driver to run the tests for investigating the best load-balance algorithm for the WebLogic server cluster on the IA64x4 machine of setup 2................................................................................................................................. 76
Characterization and Evaluation of the BEA WebLogic JRockit JVM on the Itanium II platform
Gustavo Zago Basilio – KTH / R2Meton AB – Stockholm, Summer/Autumn 2003 1
1 Introduction This report is the main document produced as the result of the master thesis project developed by me at R2Meton AB as a mandatory step toward a master degree at the Royal Institute of Technology (KTH). Its focus is on BEA WebLogic JRockit JVM, a server side JVM developed especially for meeting the requirements of Java enterprise applications, and the Itanium II platform, the latest server side processor from the Intel and HP cooperation. Performance, scalability and reliability of this JVM on the Itanium II platform are deeply studied on this document, as well as its comparison with Sun’s JVM running on the same platform. Moreover, a thorough study of JRockit tuning is performed, analyzing the most representative JVM startup options available and how they affect the performance of the application being executed.
This thesis is roughly divided in 2 parts: theoretical study of JVMs and JRockit, covered in chapters 1 to 4, and practical evaluation of JRockit and comparison to Sun’s JVM on the Itanium II platform, covered in chapters 5 to 7. Chapter 8 presents the conclusion of the work developed and possible suggestions for improving JRockit and JVMs in general and chapter 9 presents suggestions of further work that can be done within the field of study of this master thesis project. To finalize, chapter 10 presents the references used while developing this projects and chapter 11 contains the appendices, everything related to the project but that does not fit the main body of the report. A brief description of each of the chapters follows:
Chapter 1, Introduction, introduces the project and presents the organization of the report.
Chapter 2, The Project, presents the project, project participants, background information, motivation for developing the project, goals and limitations.
Chapter 3, Inside the JVM, presents the JVM under a technical point of view. A deep explanation of the JVM internals is presented here.
Chapter 4, Inside BEA WebLogic JRockit, presents the main focus of this project, the JRockit JVM, providing details about its ins and outs and trying to investigate where and how a better performance could be achieved when using it.
Chapter 5, Problem definition and analysis, presents the problem to be solved, that is, how to evaluate JRockit JVM.
Chapter 6, Method, presents the method used to evaluate JRockit, detailing software programs, platform and tools used in this process.
Chapter 7, Results and Analysis, presents the results of the tests and a thorough analysis of them.
Chapter 8, Conclusions and recommendations, presents the conclusions of this project.
Characterization and Evaluation of the BEA WebLogic JRockit JVM on the Itanium II platform
Gustavo Zago Basilio – KTH / R2Meton AB – Stockholm, Summer/Autumn 2003 2
Chapter 9, Further work, presents suggestions of further work that could be developed in the field of study of this master thesis project.
Chapter 10, References, presents a list of references to documents used during the development of this project.
Chapter 11, Appendices, presents everything related to the project but that does not fit the body of the report
Characterization and Evaluation of the BEA WebLogic JRockit JVM on the Itanium II platform
Gustavo Zago Basilio – KTH / R2Meton AB – Stockholm, Summer/Autumn 2003 3
2 The Project This chapter presents the master thesis project, providing information about the parties involved and the work developed. It starts by describing the project participants, detailing the role and the responsibilities of each of them. Then it presents some background information regarding the project and the motivations behind such research. It finalizes by describing the goals to be achieved and the limitations imposed to the project.
2.1 Project Participants This master thesis project was only made possible due to the support provided by and the interaction between R2Meton AB and the Royal Institute of Technology.
• R2Meton AB is the company which proposed the project and provided all the infrastructure and technical support that made it feasible;
• Royal Institute of Technology, KTH, is the university responsible for the master program in Internetworking and for the academic supervision of this master thesis project.
R2Meton AB, also known as R2M is a Swedish IT company located in Kista, Sweden’s “silicon valley”. R2M focus is on business optimization, providing customers with solutions to improve their business activities and strengthen their position in the market.
Business optimization is achieved by R2M through several different channels, the most important ones being project management, modeling (R2M is an active contributing member of the DSDM Consortium, a growing international organization for systems development with a business utility and user focus), tools (by the use of tools that support iterative and incremental development methods) and training (R2M provides training courses, teachers and course material in all areas of competence).
R2M main areas of expertise are:
Process mapping
• By process mapping one can create literacy of core business activities, understanding better ones activity and creating conditions to improve business performance. Process mapping is essential for an effective use of IT resources.
Enterprise Application Integration (EAI)
• EAI combines distinct applications, generally hosted in heterogeneous environments, in a set of cooperating applications. It improves business activities by allowing companies to integrate their systems.
J2EE
Characterization and Evaluation of the BEA WebLogic JRockit JVM on the Itanium II platform
Gustavo Zago Basilio – KTH / R2Meton AB – Stockholm, Summer/Autumn 2003 4
• J2EE has been adopted worldwide as a reliable platform for application servers in the last years. It provides an ideal environment to integrate different domains, architectures, and technologies in order to create scalable and secure enterprise applications.
This master thesis project relates to R2M business by being focused on the J2EE technology framework. The deep study of JVM technologies and the evaluation of BEA WebLogic JRockit on the Itanium II platform will give R2M a better understanding on how application performance is related to the JVM and the underlying operating system and hardware platform. It will also provide them means to improve application performance by JVM tuning and a clear idea on how is the behavior of BEA WebLogic JRockit in comparison to other JVMs available for the Itanium II platform. The thesis supervisor at R2M is Isak Isacsson.
Royal Institute of Technology, also know as KTH (Kungliga Tekniska Högskolan), is the largest university of technology in Sweden. It is responsible for one-third of Sweden’s capacity for engineering studies and technical research at post-secondary level. KTH is the university responsible for the master program in Internetworking and for the academic supervision and examination of this thesis. The thesis examiner at KTH is Vladimir Vlassov, associate professor in computer systems at the Department of Microelectronics and Information Technology (IMIT).
2.2 Background When Java technology is mentioned concepts as platform-independence, object-oriented programming, security and network-mobility are remembered. Many of these concepts are made possible only because of a very important player in the Java architecture: the Java Virtual Machine (JVM). The JVM is the component that enables platform-independence, is responsible for great part of the security and provides a neat and easy way to integrate heterogeneous systems in a networked fashion. Before getting deeper into the ins and outs of JVMs let’s take a look at the concept of Virtual Machines.
A Virtual Machine (VM), as the name says, is an abstract computer capable of executing a specific instruction set. Like a real computer, the VM has its own instruction set and memory where code and data are stored, and sometimes a set of registers. It is exactly like any other computer, except for the fact that it does not have to be necessarily implemented in hardware. It can be a software only, a combination of software and hardware or a hardware only VM. No matter the way chosen to implement it, its functioning is quite the same: it will read a program written on its instruction set and execute it. From the point of view of the program being executed the VM is a real computer, and it makes no difference if the memory and instruction set are really part of a hardware system or only a software layer on the top of another system.
VMs are sometimes defined as being stack-oriented or register-oriented. Register-oriented VMs have a set of global locations (registers) that is used for evaluating expressions. Expressions are evaluated by copying values to registers and performing operations on them. Stack-oriented VMs on the other hand, do not have a set of registers, and all expressions are evaluated on a single stack. In these VMs operands are pushed
Characterization and Evaluation of the BEA WebLogic JRockit JVM on the Itanium II platform
Gustavo Zago Basilio – KTH / R2Meton AB – Stockholm, Summer/Autumn 2003 5
onto the top of the stack and operations are always performed on the values on the top of the stack.
The Java Virtual Machine (JVM) is a stack-oriented virtual machine whose instruction set is specifically designed for the implementation of the Java language. It executes Java binary code, called bytecode. After a Java program is written, it is compiled by the Java compiler into Java bytecode (instead of machine and operating system specific code) and this bytecode is run in the JVM. Since the bytecode is the input for the Java Virtual Machine, a compiled Java program can be run wherever a JVM is present, guaranteeing the platform independence of the Java language.
Two other important Java concepts that depend on the JVM are network mobility and security. The JVM guarantees network mobility by providing means of transferring bytecode through a network. That implies that a JVM in location A could execute bytecode stored in location B, as far as there is a network connection between them. Security, on its turn, is enforced by the JVM by means of restricted running environments for the bytecodes. Bytecodes running in a restricted environment do not have access to anything outside their environment.
The JVM specification is rather loose as far as its implementation is concerned. It specifies how the JVM should behave and defines certain features all JVMs must have, but it leaves many implementation details and choices to the JVM designers. This implies that JVMs can assume very different forms, and implementations can greatly vary. As any other VM, the JVM can be implemented in any manner ranging from software only to hardware only. And within each of these categories they can be still very different. For instance, software only JVMs can be implemented in completely different ways and have different memory and CPU requirements. The most common type of JVM is the one completely implemented in software, on the top of a computer and operating system platform. It is also the type this document will focus on.
JVMs, once called Java interpreters can nowadays execute bytecode in a myriad of ways. The code can be simply interpreted, instruction by instruction, one at a time. This is the simplest type of JVM but also the one with the poorest performance. Another execution method is just-in-time compiling (also known as JIT-compiling). In this scheme, the bytecodes of a method are compiled to native machine code the first time the method is invoked. Later references to this method will execute the native machine code instead of the bytecode, achieving a better performance. A third type of execution method, which makes use of JIT-compiling, is called adaptive optimization. In this scheme the JVM starts by interpreting all the code (or uses a fast JIT-compiler to first compile the methods without many optimizations), but keeps monitoring the behavior of the application, looking for the most heavily used areas of the code. After some time the JVM compiles (or re-compiles) these most used code pieces to native code, performing heavy optimization on them. As only 10% to 20% of the code go through the optimized JIT-compiling process, the JVM has more time to perform code optimization than when using the pure JIT-compiling approach, achieving sometimes much better results.
Characterization and Evaluation of the BEA WebLogic JRockit JVM on the Itanium II platform
Gustavo Zago Basilio – KTH / R2Meton AB – Stockholm, Summer/Autumn 2003 6
Another way of classifying JVMs is according to the target application type of the JVM. Server-side and client-side applications have very different behavior and requirements, and JVMs can be optimized to deal with each of these types. Client-side JVMs (also called client JVMs) are optimized for client applications, having a quick startup and a higher priority to low resources usage than high execution performance. Server-side JVMs (also called server JVMs) are designed to optimize the execution of server-side applications. The economical usage of resources in this case has a lower priority than application performance, and long running times and high reliability are preferred over a quick startup.
2.3 Motivation As Internet evolves toward a mature communication and data exchange medium, more and more services migrate to its domain, giving users wider range of possibilities, but also demanding higher performance from the servers, as these new types of services tend to be more advanced and more complex than the ones previously available.
Over the years Java has become the language of choice for implementing these server-side Internet applications. J2EE (Java 2 Enterprise Edition) technology provides an optimized framework for developing and deploying enterprise applications, giving developers the tools and run-time capabilities needed to build applications meeting strict security, stability and maintainability requirements.
However, Java was not initially designed for the specific demands of server-side applications and its use as a server-side technology has put completely new requirements on the JVMs. Traditional JVMs were designed and optimized for desktop environments and were built to support the single-user perspective. As time passed, they were modified to work better with server-side applications, giving rise to the concept of server and client JVMs.
Server JVMs are the ones studied in this thesis. They are designed to meet specific requirements of server-side applications. These applications have similar behavior, and their main characteristics are:
• Generally deployed in distributed environments
• High amounts of network and I/O communication
• A great number of threads where each of them do a small amount of work before it has to wait for a resource
• Long running times
• Similar behavior over long periods of time
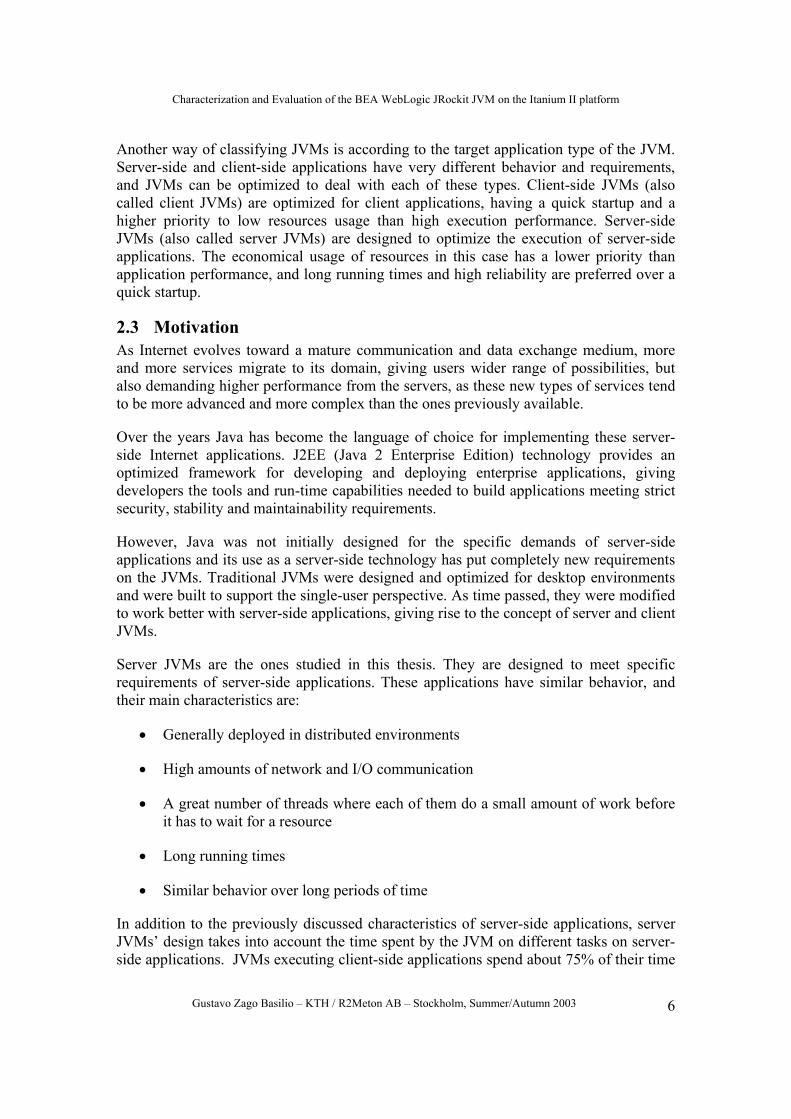
In addition to the previously discussed characteristics of server-side applications, server JVMs’ design takes into account the time spent by the JVM on different tasks on server-side applications. JVMs executing client-side applications spend about 75% of their time
Characterization and Evaluation of the BEA WebLogic JRockit JVM on the Itanium II platform
Gustavo Zago Basilio – KTH / R2Meton AB – Stockholm, Summer/Autumn 2003 7
translating and executing bytecode, 20% in garbage collection and the rest with threads and I/O related activities. JVMs executing server-side applications, on the other hand, spend about 25% of the time translating and executing bytecode, 15% garbage collecting and 60% on threads and I/O related activities[15]. It is clear then that different areas of the JVM must be optimized for achieving best performance for client-side and server-side applications.
Figure 1: Time spent by the JVM on different tasks for different application types
Server JVMs are optimized for the best performance of server-side applications. Important things for client JVMs as quick startup and small memory utilization are not a big issue for server JVMs. Servers tend to have huge amounts of memory available and, as applications run for a long time, better performance over time is preferred over a quick startup. In addition, the long running time of server side applications creates a good field for adaptive optimization. The performance of the application is likely increase considerably in the long run if some minutes are spent at the beginning of the execution to analyze where the bottlenecks are and how the application behaves.
BEA WebLogic JRockit, the focus of this thesis, is a JVM developed from the scratch specifically to meet the requirements of server-side applications and to address the unique enterprise-class performance demands of today's web applications. It is also the only commercial JVM available today that is optimized for the Intel Itanium II architecture. The JVM version to be studied in this thesis is 8.1. The goal of the thesis is to elaborate a deep study on JRockit 8.1, and compare it with other server JVMs available for the Itanium II platform.
As a JVM developed from ground up to meet the requirements of server-side applications, BEA WebLogic JRockit is an interesting topic for study, as it could possibly bring better performance for enterprise applications. In addition to that, being the first JVM uniquely optimized for the Intel Itanium II platform makes the study of JRockit economically interesting, as it could imply on applications being run on lower-cost hardware with increased reliability and performance. These characteristics make JRockit a very convenient piece on enterprise solutions, and a hot topic for study, research and analysis.
Characterization and Evaluation of the BEA WebLogic JRockit JVM on the Itanium II platform
Gustavo Zago Basilio – KTH / R2Meton AB – Stockholm, Summer/Autumn 2003 8
2.4 Goals The primary goal of this thesis is to characterize and evaluate the BEA Weblogic JRockit JVM on the Itanium II platform and compare it with other server JVMs currently available for this platform. The evaluation will be done on the fields of performance, reliability and scalability and the comparison with other JVMs will provide means to rank JRockit and to assess its possible benefits.
Among secondary goals of the thesis one can mention the deep study of JRockit JVM and the identification of its key characteristics, the evaluation of the maturity of the Itanium II platform and the study of tuning techniques and parameters for JRockit.
2.5 Limitations The limited amount of resources and time implies some restrictions on the work to be developed on this master thesis project. Some of the limitations are stated below.
BEA Weblogic JRockit will be evaluated only for enterprise class applications, that is, applications that are commonly used in the enterprise world and have some common characteristics as mentioned on section 2.3.
As application servers have become the most usual environment for enterprise applications, the evaluation of JRockit will be done through the use of one. In our case, BEA WebLogic will be used as the application server supporting the enterprise applications.
The application/benchmark used to evaluate JRockit must simulate a complete enterprise application and must be free of charge. Preferably a standardized benchmark should be used.
Security and implementation details of JRockit will not be evaluated on this thesis.
Characterization and Evaluation of the BEA WebLogic JRockit JVM on the Itanium II platform
Gustavo Zago Basilio – KTH / R2Meton AB – Stockholm, Summer/Autumn 2003 9
3 Inside the JVM This chapter gives a deeper view about JVMs in general. It starts by locating the JVM in the Java architecture, explaining why it is used and how it works. Then it presents the server JVM and discusses what are the main characteristics of them. Afterwards, it breaks into the JVM internals and presents its architecture, providing detailed information about the class loader, execution engine, garbage collection and thread synchronization systems.
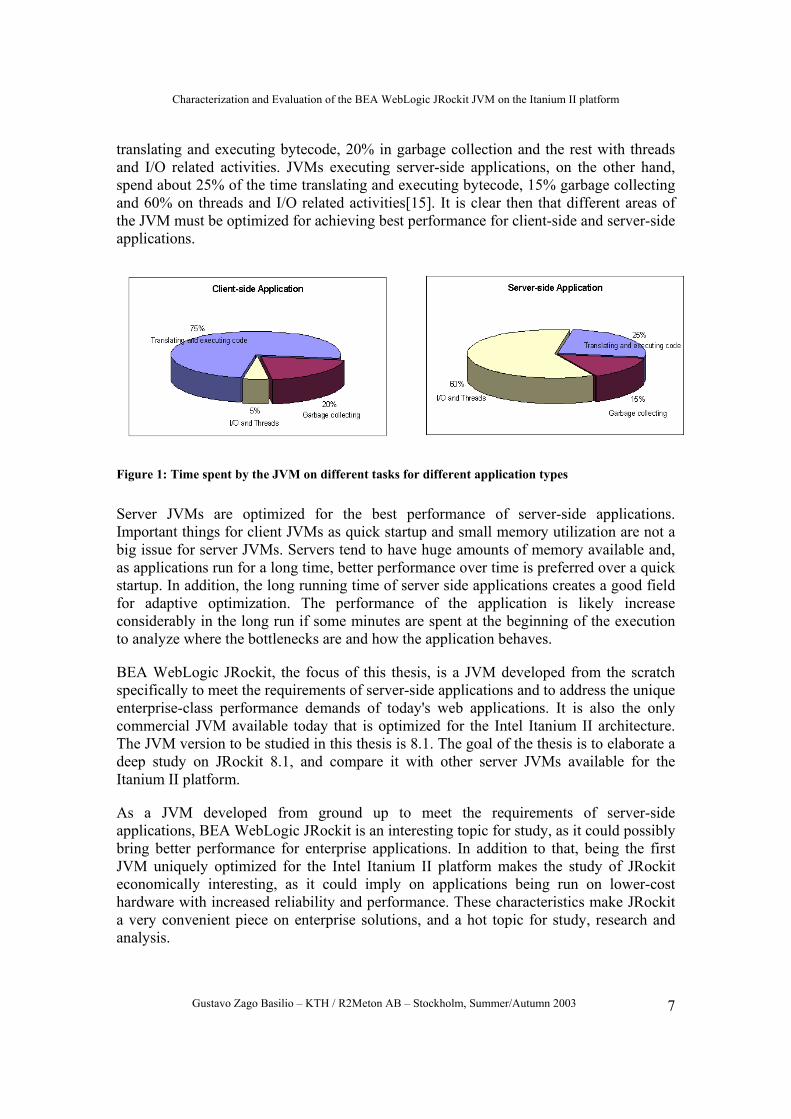
3.1 The JVM in the Java architecture The JVM is the heart of the Java architecture and is the piece responsible for the platform independence, security and network mobility defined by the Java platform. The JVM is also the piece that transforms all the concepts and abstractions of the Java architecture into reality. The applications written in the Java language will run on the JVM, and the concepts defined by the Java platform will be supported by the JVM. The JVM is shown in Figure 2 in the context of the Java architecture.
JVM
Class A Class B Class Z
Java API
Hardware + Operating System
. . .
Figure 2: The JVM in the Java Architecture
The JVM and the Java API form the Java Runtime Environment, and are responsible for running the class files. The class files are bytecode files, that is, they are files in the Java binary format and are the result of compiling Java source files. Java programs are written in the Java language, compiled to class files and then run in the Java Runtime Environment. Because the programs written in the Java language run on the Java Runtime Environment rather than on the underlying hardware and operating system, they can be run anywhere where a JVM and Java API can be found.
As JVMs interface directly with the underlying system they are hardware and operating system dependent (as is the Java API). For each different combination of hardware and
Characterization and Evaluation of the BEA WebLogic JRockit JVM on the Itanium II platform
Gustavo Zago Basilio – KTH / R2Meton AB – Stockholm, Summer/Autumn 2003 10
operating system a distinct JVM (and API) must be developed. This characteristic makes JVMs very different from each other. A JVM developed for a mobile phone will not have the same resources available as a JVM developed for a J2EE server for instance. In addition to this, JVMs can be targeted for a certain type of application (as mentioned in section 2.2), and can be optimized for server-side or client-side applications. The focus of this master thesis project is on server-side JVMs and some attention will be paid now to their inner workings.
3.2 Server JVMs Server JVMs optimize the execution of server-side applications. They do this by optimizing the operations that are most commonly executed by server-side applications. Just reminding what was mentioned in section 2.3, JVMs executing server-side applications spend about 25% of the time translating and executing bytecode, 15% garbage collecting and 60% on threads and I/O related activities. From this picture it is clear that the sheer improvement of the bytecode execution is not enough for substantially improving the overall performance of the server-side applications.
The optimization of the code in server JVMs is done by JIT-compiling the class files into native machine instructions. This improves the performance of the code execution as Java methods will not be interpreted by the JVM anymore, but executed directly by the underlying system. Pure JIT-compiling or adaptive optimization can be used in this process. In addition, the JIT-compiled methods are generally cached in the memory for subsequent reuse throughout the lifetime of the JVM instance.
Although garbage collection does not represent a substantial amount of time spent by JVMs executing server-side applications it is of utmost importance because it affects the behavior of the applications being executed. Server-side applications generally have very strict response-time requirements thus they cannot be halted for some time while the JVM is garbage collecting. For this reason, server JVMs make use of garbage collection schemas that minimize the time spent garbage collecting and do not hamper the application performance.
The most important field of improvement for server JVMs is without a doubt thread and I/O handling as JVMs executing server-side applications spend on the average 60% of their time on these activities. Increased performance is achieved within these areas by means of schemas for diminishing lock contention and the need for synchronization.
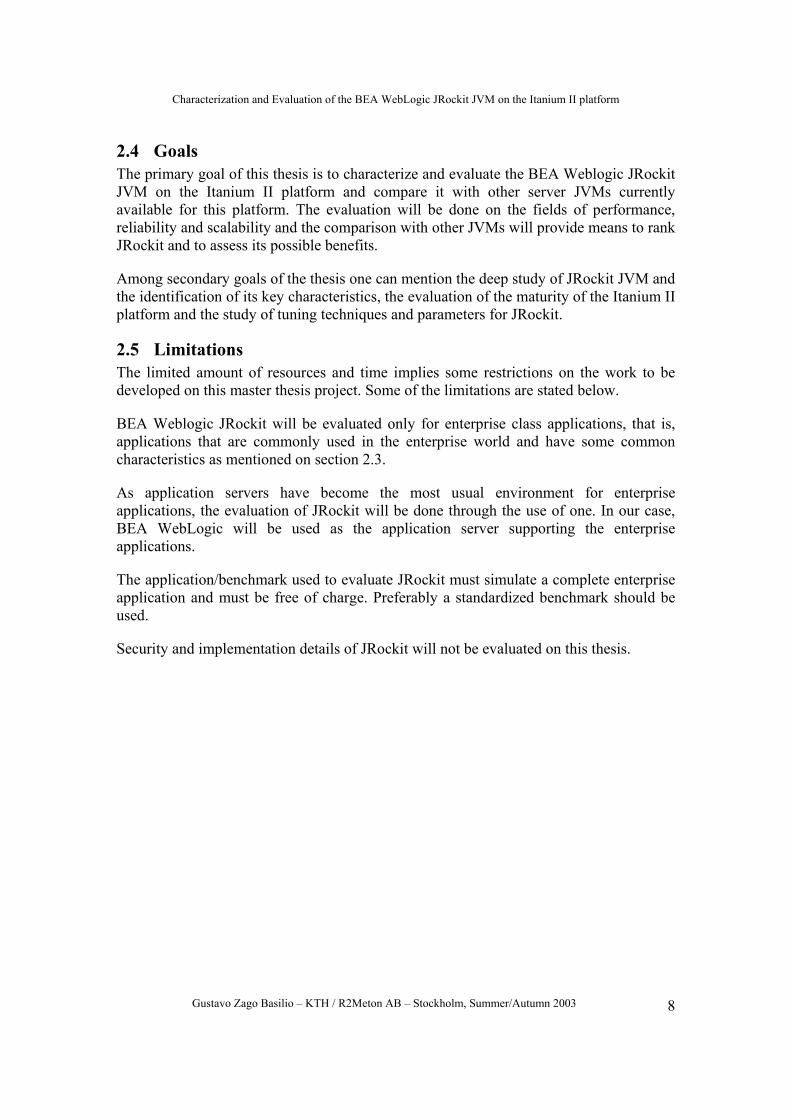
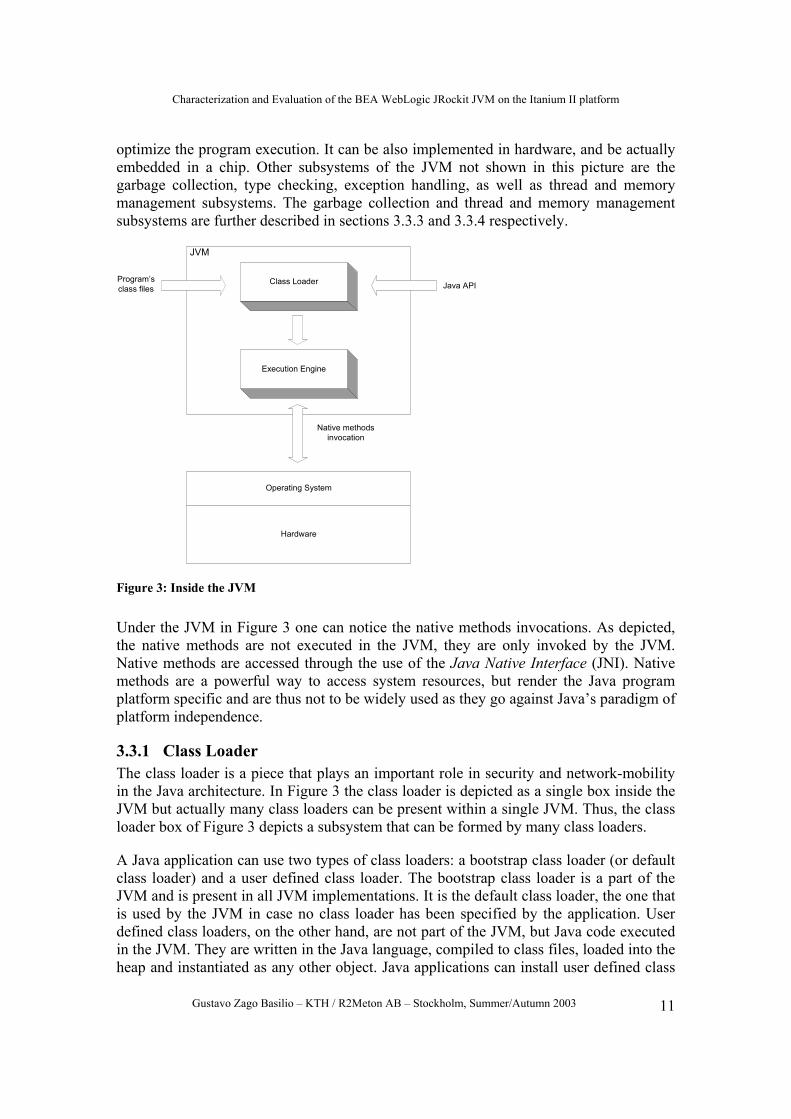
3.3 JVM Architecture The JVM, shown up to this point as one block, is actually composed by 2 sub systems: the class loader and the execution engine. Figure 3 shows the JVM as a piece composed of these 2 parts and the relation between them. The class loader’s main responsibility is to load classes from both the program and the Java API. Only the classes that are actually needed by the running program are loaded by the class loader into the JVM. After the classes are loaded the bytecodes are executed in the execution engine. The execution engine is the part of the JVM that vary greatly among different JVM implementations. It can interpret the bytecodes, JIT-compile it or make use of adaptive optimization to
Characterization and Evaluation of the BEA WebLogic JRockit JVM on the Itanium II platform
Gustavo Zago Basilio – KTH / R2Meton AB – Stockholm, Summer/Autumn 2003 11
optimize the program execution. It can be also implemented in hardware, and be actually embedded in a chip. Other subsystems of the JVM not shown in this picture are the garbage collection, type checking, exception handling, as well as thread and memory management subsystems. The garbage collection and thread and memory management subsystems are further described in sections 3.3.3 and 3.3.4 respectively.
Class Loader
Execution Engine
Operating System
Hardware
JVM
Java APIProgram’sclass files
Native methodsinvocation
Figure 3: Inside the JVM
Under the JVM in Figure 3 one can notice the native methods invocations. As depicted, the native methods are not executed in the JVM, they are only invoked by the JVM. Native methods are accessed through the use of the Java Native Interface (JNI). Native methods are a powerful way to access system resources, but render the Java program platform specific and are thus not to be widely used as they go against Java’s paradigm of platform independence.
3.3.1 Class Loader The class loader is a piece that plays an important role in security and network-mobility in the Java architecture. In Figure 3 the class loader is depicted as a single box inside the JVM but actually many class loaders can be present within a single JVM. Thus, the class loader box of Figure 3 depicts a subsystem that can be formed by many class loaders.
A Java application can use two types of class loaders: a bootstrap class loader (or default class loader) and a user defined class loader. The bootstrap class loader is a part of the JVM and is present in all JVM implementations. It is the default class loader, the one that is used by the JVM in case no class loader has been specified by the application. User defined class loaders, on the other hand, are not part of the JVM, but Java code executed in the JVM. They are written in the Java language, compiled to class files, loaded into the heap and instantiated as any other object. Java applications can install user defined class
Characterization and Evaluation of the BEA WebLogic JRockit JVM on the Itanium II platform
Gustavo Zago Basilio – KTH / R2Meton AB – Stockholm, Summer/Autumn 2003 12
loaders at run-time, providing means to load classes in customized ways, as downloading from the network or reading from a database.
For each class it loads the JVM keeps track of which class loader loaded it. When a loaded class refers to another class the JVM requests the referenced class from the same class loader that loaded the referencing class. Because of this characteristic of the JVM classes can by default only see other classes that were loaded by the same class loader. This allows the creation of different name-spaces within the same Java application. Each class loader in a running Java application has its own name-space, which is formed by the name of all the classes it loaded. Classes loaded by different class loaders are in different name-spaces and cannot gain access to each other unless the application explicitly allows that. This gives developers the possibility of separating classes in different name-spaces the way they want. One can, for instance, segregate network downloaded classes from different sources in different name-spaces and avoid malicious code to interfere with friendly code. For this reason the class loader plays an important role in security, giving developers the possibility to tightly control the scope of classes. And by allowing the developers to define class loaders that could download classes from a network it is also an important piece in enforcing the network-mobility paradigm.
3.3.2 Execution Engine The execution engine is the part of the JVM responsible for the actual execution of the Java code. It is responsible for reading the bytecodes and translating them into platform specific binary code.
In the Java virtual machine specification, the behavior of the execution engine is defined in terms of an instruction set. For each instruction, the specification provides a detailed description of what the execution engine should do when it encounters the instruction as it executes bytecodes, but says very little about how to do that. As already mentioned, the execution of bytecodes can be done in a myriad of different ways, including pure interpretation, JIT-compiling, by the use of adaptive optimization or even in hardware. Each of these methods has its own advantages and drawbacks, and influence the execution of the Java program.
Pure interpretation of the bytecodes was the method used when the first JVM came into the scene. It is the simplest way to execute bytecodes and also provides an easy way to ensure portability and platform independence. It works by translating every bytecode to the machine native code, and then executing the native machine code. This translation is generally done bytecode by bytecode, thus resulting in a poor performance.
JIT-compiling the application code proved to be a good solution for the performance limitations of Java interpreters. The Java code is compiled into native code the first time the JVM encounters it and saved in the RAM for future use. All subsequent calls to the same method will execute the cached native code instead of the bytecodes. The main drawbacks of this approach is that the application execution is hampered while the Java code has not been completely translated into native code and it consumes a lot of memory as the native methods are stored in the RAM.
Characterization and Evaluation of the BEA WebLogic JRockit JVM on the Itanium II platform
Gustavo Zago Basilio – KTH / R2Meton AB – Stockholm, Summer/Autumn 2003 13
As a way to optimize the execution performance (and in some cases the memory utilization), adaptive optimization was developed. Adaptive optimization works by probing the application behavior for some time, identifying the most used methods and possible bottlenecks and then heavily optimizing and JIT-compiling them. This approach reduces the amount of time spent on optimizations as only the most used pieces of code will be heavily optimized, and can also reduce the amount of memory used if the translation to native code is performed only on these methods (in the case the less used methods are kept as bytecodes).
Each thread of a running Java application is a distinct instance of the virtual machine's execution engine. From the beginning of its lifetime to the end, a thread is either executing bytecodes or native methods. A JVM implementation may use other threads invisible to the running application, such as a thread that performs garbage collection. Such threads do not have to be "instances" of the execution engine. All threads that belong to the running application, however, are execution engines in action.
Execution engines implemented in hardware are out of the scope of this thesis and will not be covered in any way on this document.
3.3.3 Garbage Collection One of the most remarkable features of Java is the garbage collection. Although Java is not the only language that makes use of garbage collection it is without a doubt the most popular one. Garbage collection is also called automatic dynamic memory management, as its main task is to automatically manage the use of memory by Java applications. Garbage collection helps ensure program integrity by intentionally not allowing the Java application developer to free memory that was not previously allocated.
The Java virtual machine specification does not define any type of garbage collection technique to be used. As a matter of fact, it does not even require JVM implementations to make use of any kind of garbage collection. But as far as I know there is no commercially available JVM without a garbage collector.
The JVM makes use of 3 main types of memory:
• Global or static: this memory is allocated at class load time, and has no change in size after that.
• Stack allocated: allocated when a declaration is encountered within the scope of a method, routine or function. It is released when the execution leaves the method, routine or function.
• Heap: this is the area that holds all the objects that are dynamically allocated during execution.
Garbage collection is performed only in the heap.
Characterization and Evaluation of the BEA WebLogic JRockit JVM on the Itanium II platform
Gustavo Zago Basilio – KTH / R2Meton AB – Stockholm, Summer/Autumn 2003 14
In Java, while a program is running space is allocated in the heap by the use of the new operator. The application never explicitly free the memory allocated, instead Java does automatic garbage collection. All the objects are garbage collected, when the application developer makes a null reference to the object. For this reason, it is a good policy to always assign null to a variable after you have finished using it.
Any garbage collection algorithm must do two basic things. First, it must detect garbage objects. Second, it must reclaim the heap space used by the garbage objects and make the space available again to the program. The two main algorithm families for garbage collection are reference counting algorithms and tracing algorithms.
Reference counting algorithms work by counting how many references (that is, pointers) there are to a particular memory block from other blocks. In a simple reference counting system, a reference count is kept for each object. This count is incremented for each new reference, and is decremented if a reference is overwritten, or if the referring object is recycled. If a reference count falls to zero, then the object is no longer required and can be recycled.
Reference counting algorithms are, however, difficult to implement efficiently due to the cost of updating the reference counts and their inability of detecting loops (two or more objects that refer to one another). Because of the disadvantages of this technique it is currently not widely used. It is more likely that JVMs will use some kind of tracing algorithm instead.
Tracing algorithms follow pointers to determine which blocks of memory are reachable from program variables (known as the root set). It starts by examining the variables of the running Java program and the objects referenced by these variables. Then the objects referenced by these objects. And so forth, until it reaches all the objects accessible through the variables of the Java program.
The most basic tracing algorithm is called "mark and sweep." Its name refers to the two phases of the garbage collection process (this algorithms is also known as 2-phase collector). In the mark phase, the garbage collector traverses the tree of references and marks each object it encounters. In the sweep phase, unmarked objects are freed, and the resulting memory is made available to the executing program. In the Java virtual machine, the sweep phase must include finalization of objects.
In addition to freeing space by removing unreferenced objects, a garbage collector should also avoid heap fragmentation. Heap fragmentation is the natural consequence of normal program execution and spaces being freed time after time. After many memory blocks have been allocated and recycled, there are two problems that typically occur. First, the memory being used by the heap is widely scattered, causing low performance due to the poor locality of reference. Second, it is difficult to allocate large blocks because free memory is divided into small pieces, separated by blocks in use (known as external fragmentation). For solving these problems the JVM generally performs heap compaction, that is, it rearranges valid objects in the heap so that they are located next to
Characterization and Evaluation of the BEA WebLogic JRockit JVM on the Itanium II platform
Gustavo Zago Basilio – KTH / R2Meton AB – Stockholm, Summer/Autumn 2003 15
each other. This increases locality of reference and makes large chunks of free memory available for future object allocation.
3.3.4 Thread Management The term thread management, as it is used in this document, refers to the synchronization of multiple threads or multithreading. The Java language provides multithreading support at the language level, giving developers an easy and powerful framework to control the application’s threads. The main piece of this framework is the monitor, the mechanism used by Java to ensure thread synchronization.
Java monitors support two types of thread synchronization: mutual exclusion and cooperation. Mutual exclusion is supported in the JVM by object locks, and allows threads to work independently whereas still sharing data. Cooperation is supported by the wait and notify methods of class Object (the parent class of all classes) and allows threads to work together towards a common goal.
Mutual exclusion, the first type of thread synchronization mentioned above, refers to the mutually exclusive execution of monitor regions by multiple threads. At any particular time only one thread can execute a mutually exclusive region of a monitor. This type of thread synchronization is important when threads share data or some other resource. If two or more threads do not share any data or other resource they cannot interfere with each other and no mutual exclusion is needed.
The second type of thread synchronization mentioned, cooperation, works by allowing threads to communicate to each other by the use of the wait and notify methods in order to accomplish a common task. In this kind of monitor, a thread that currently owns the monitor can suspend itself inside the monitor by executing a wait command. When a thread executes a wait, it releases the monitor and enters a wait set. The thread will stay suspended in the wait set until some time after another thread executes a notify command inside the monitor. When a thread executes a notify, it continues to own the monitor until it releases the monitor of its own accord, either by executing a wait or by completing the monitor region. After the notifying thread has released the monitor, the waiting thread will be resurrected and will reacquire the monitor.
How a JVM handles synchronization plays an extremely important role in performance. The best way to handle a lock is to avoid locks all together, and it is good for the application developer to avoid unnecessary synchronized methods and blocks of code. In the event that such unnecessary synchronized code does exist, JVMs can possess techniques to detect them and eliminate the locks.
JVMs handle contended (many threads try to enter the same synchronized block at once) and uncontended (only one thread tries to enter the synchronized block at once) locks differently, optimizing such that the uncontended lock operations go faster. The choices the JVM makes as to how it handles uncontended and contended locks can all impact performance.
Characterization and Evaluation of the BEA WebLogic JRockit JVM on the Itanium II platform
Gustavo Zago Basilio – KTH / R2Meton AB – Stockholm, Summer/Autumn 2003 16
Characterization and Evaluation of the BEA WebLogic JRockit JVM on the Itanium II platform
Gustavo Zago Basilio – KTH / R2Meton AB – Stockholm, Summer/Autumn 2003 17
4 Inside BEA WebLogic JRockit This chapter presents BEA WebLogic JRockit under a technical point of view. It starts by giving an overview of the design of JRockit and then it thoroughly describes each of the packages that form the JVM, providing detailed information about the ins and outs of each of them.
4.1 Initial considerations As shown in Figure 1 (Time spent by the JVM on different tasks for different application types, page 7), the amount of time spent on different tasks differs radically when comparing client-side and server-side Java applications. For this reason, client and server JVMs have a very different approach to optimize application execution. BEA WebLogic JRockit, as a JVM built from the scratch specifically to meet the requirements of server-side Java applications, makes use of some server-side optimization techniques, which will be studied in this chapter.
At this point it is worth mentioning that although the content of this chapter is intended to be as technical as possible and give a sound idea about the ins and outs of JRockit JVM, it does not go deep into algorithms used by the designers of JRockit to achieve better performance or JVM implementation details. The first reason for this is that this project is focused on the performance, scalability and reliability of JRockit at application level, not on JVM implementation details. The second reason is that since JRockit is a commercial JVM, neither its source code nor documentation about its internals is publicly available. This makes it difficult to obtain good technical documentation about the way it works. Said that, the content of this chapter can be described as an explanation of the techniques used by the JRockit JVM to try to achieve better performance and how they actually affect the running of server-side Java applications.
4.2 The Design of BEA WebLogic JRockit BEA Weblogic JRockit is made of four different parts or packages, each of them being responsible for a specific task. The Code Generation package is responsible for generating the code for the methods encountered during startup and for the performance analysis and optimization of frequently used methods. The Memory Management package is responsible for memory/object allocation and for garbage collection. The Thread Management package is responsible for handling threads, thread synchronization, etc. The Native package provides support for native methods (e.g. java.lang, java.io and java.net, JVM-support methods, JNI, and exception handling).
According to the BEA white paper on JRockit [15], the JVM design had three main goals in mind:
• Have each of the 4 different areas described above optimized and cooperating closely between themselves;
Characterization and Evaluation of the BEA WebLogic JRockit JVM on the Itanium II platform
Gustavo Zago Basilio – KTH / R2Meton AB – Stockholm, Summer/Autumn 2003 18
• Keep the system as platform independent as possible so that porting it to other platforms is easy and most of the optimizations will be readily available;
• Provide a framework through which the Java application developer can easily profile and tune the JVM to increase performance.
4.2.1 Code Generation Package The Code Generation package is the part of JRockit responsible for compiling the code at startup as well as for the adaptive optimization. When JRockit starts-up it JIT-compiles all the methods it encounters. As the application runs there is a bottleneck detector which actively looks for bottlenecks in frequently executed methods. If a method is reducing the application performance it is sent to the Optimization Manager to be aggressively optimized and compiled. The optimized one replaces then the old method without interrupting the running program.
As opposed to other JVMs (as Sun’s JVM for example, which starts-up interpreting Java code), JRockit uses a fast JIT-compiler for compiling all methods it encounters at startup. Later, as the application is executed, the bottleneck detector heavily optimizes and compiles the methods that are most frequently executed. This approach implies on a slower startup but it ensures that desirable application performance will be achieved even on the early stages of the application run.
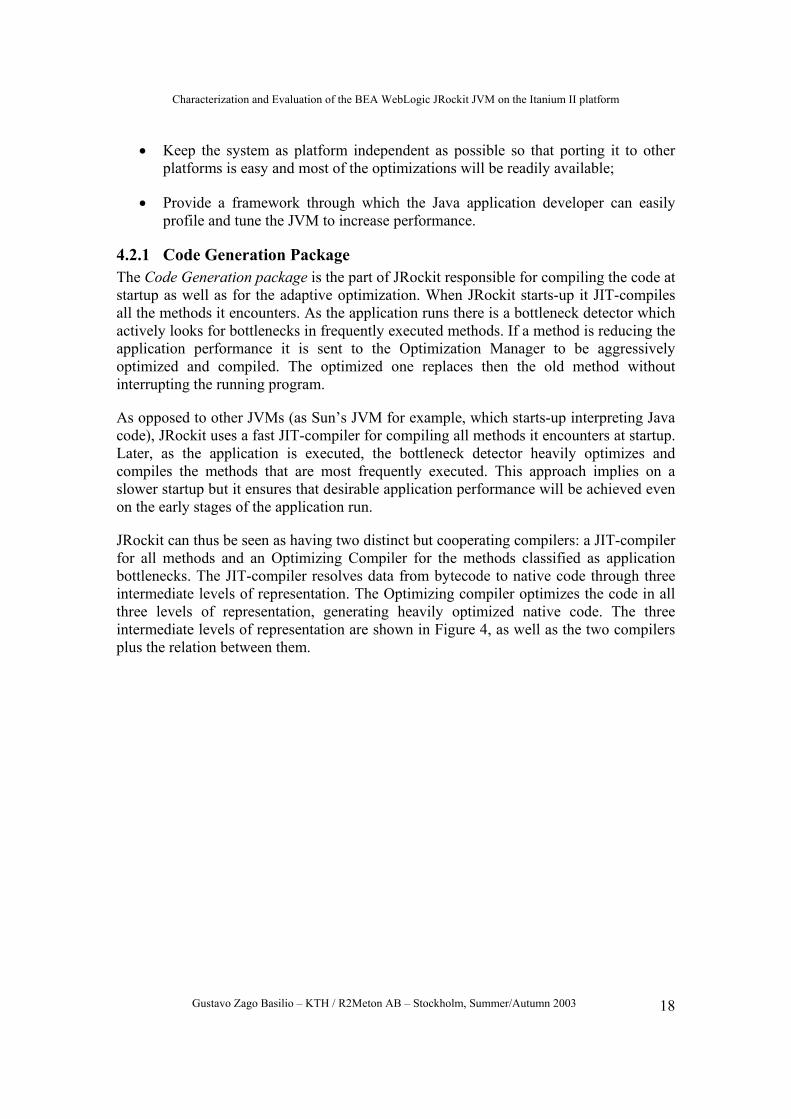
JRockit can thus be seen as having two distinct but cooperating compilers: a JIT-compiler for all methods and an Optimizing Compiler for the methods classified as application bottlenecks. The JIT-compiler resolves data from bytecode to native code through three intermediate levels of representation. The Optimizing compiler optimizes the code in all three levels of representation, generating heavily optimized native code. The three intermediate levels of representation are shown in Figure 4, as well as the two compilers plus the relation between them.
Characterization and Evaluation of the BEA WebLogic JRockit JVM on the Itanium II platform
Gustavo Zago Basilio – KTH / R2Meton AB – Stockholm, Summer/Autumn 2003 19
Figure 4: JRockit code optimization paths [21]
The bytecode is first transformed to a high-level intermediate representation (HIR) in a phase called BC2HIR. At this first level, the IR reflects the bytecode in a more practical way, where each IR instruction belongs in a basic block. The instructions can be of arbitrary complexity, what is not true for the instruction set of the target platform. The second phase, called HIR2MIR transforms the HIR into a more natural form of representation called MIR (middle-level intermediate representation). The MIR is still platform independent, but the complex instructions are broken into single operator intructions. It is at the MIR that most of the optimizations are done. Next phase, called MIR2LIR, transforms the MIR into a platform dependent representation called LIR (low-level intermediate representation). From LIR it is easy to produce native code by mapping the instructions in the LIR to instructions in the target platform.
All the methods executed by JRockit will traverse the left side of the Figure 4, and most of them will only traverse this path. Only methods classified as application bottlenecks will be sent to the optimizing compiler and thus traverse the right side of Figure 4.
Method inlining is the single most important optimization tool available. Inlining means that the code of a called method is inserted directly into the call site. As opposed to procedural languages as C, method inlining can be very tricky in object-oriented languages as Java. Polymorphism, interface calls and remote calls are difficult to treat because the actual method being called is only known at runtime. For this reason, method inlining must be performed carefully by the Java code optimizer, otherwise it could have
Characterization and Evaluation of the BEA WebLogic JRockit JVM on the Itanium II platform
Gustavo Zago Basilio – KTH / R2Meton AB – Stockholm, Summer/Autumn 2003 20
an effect opposite to the intended and cause a drop-off in performance. To avoid this JRockit makes use of heuristics tuned for avoiding performance loss.
JRockit, as a JVM optimized for the Itanium II platform, includes some techniques for code generation on this platform. Among them, it includes a register allocator that takes full advantage of the Itanium II processor’s large register stack (128 general purpose plus 128 floating point registers).
But how does JRockit knows which methods are hampering the application performance and should be optimized? The technique used by JRockit to identify methods that merit optimization is a low-cost, sampling-based one. A “sampler thread” wakes up at periodic intervals and checks the status of several application threads. It identifies what each thread is executing and notes some of the execution history. This information is tracked for all methods and when it is noticed that a method is experiencing heavy use it is marked for optimization. Usually many such optimization opportunities occur at the application early stages of run, with the rate slowing down as the execution continues.
4.2.2 Memory Management Package The Memory Management package is the package responsible for memory allocation and garbage collection.
Memory allocation is done by the use of “thread local arrays”, that is, each thread is assigned a small heap where it allocates objects. Thread local arrays work by allocating space for about a thousand objects on behalf of each thread. This technique provides spatial and temporal locality of the data, as well as it reduces the synchronization between threads.
Different applications have different needs, thus JRockit provides 4 garbage collection schemas to be chosen by the developer to best suit the application needs.
• Generational Copy, which divides the memory into two areas called "generations." New objects are put in the area reserved for them, called nursery, and are promoted from there only after surviving for a certain amount of time. By doing this one avoids the task of garbage collecting the whole object space when it gets full.
• Single-Spaced Concurrent is a concurrent garbage collection schema, that is, the garbage collection is performed at the same time the Java application runs. This schema uses a single object space, in opposition to a generational garbage collection that uses 2 distinct object spaces. It is designed to support garbage collection without disruption and to improve multiprocessor garbage collection performance.
• Generational Concurrent is the second type of concurrent collector BEA WebLogic JRockit employs. Although very similar to a single-spaced concurrent collector, a generational concurrent garbage collector makes use of the generational schema, that is, it will divide the object space in two and put new
Characterization and Evaluation of the BEA WebLogic JRockit JVM on the Itanium II platform
Gustavo Zago Basilio – KTH / R2Meton AB – Stockholm, Summer/Autumn 2003 21
objects in a "nursery," reducing the need to do collection of the entire heap so often.
• Parallel garbage collection, which stops all Java threads and uses all CPUs to perform a complete garbage collection of the entire heap.
All these 4 garbage collectors have been designed to work smoothly with large heaps and to take advantage of the sparseness of the heap, that is, most of the heap is garbage because most of the objects are short lived.
With the large heaps available for the 64-bit Itanium II systems, fragmentation can be become a serious performance issue. Compacting the heap during garbage collection alleviates the problem, but it hampers the performance, as compacting large heaps is an expensive task. Avoiding compacting the heap is not a good idea either, as large portions of the heap would become unusable as the application runs, and this would lead to even more frequent garbage collections and inefficient heap utilization. JRockit solves this dilemma by using a sliding compaction window. In other words, during each garbage collection a small part of the heap is compacted, a different part being compacted each collection. With a properly set size of the window the heap performs almost as well as with full compaction with the cost of compaction being almost as low as with no compaction at all.
Each of these garbage collectors have different ways to clean up the heap and thus different behaviors. For some applications, the only important parameter is the throughput of the application, while for others the response time is what has to be taken into account. The four garbage collectors provided by JRockit are intended to cover all the possible cases and if some time is spent tuning the JVM the desired performance and behavior of the application will most certainly be achieved.
4.2.3 Thread Management Package The Thread Management package is responsible for thread handling, such as thread synchronization, semaphores, and the creation of new threads.
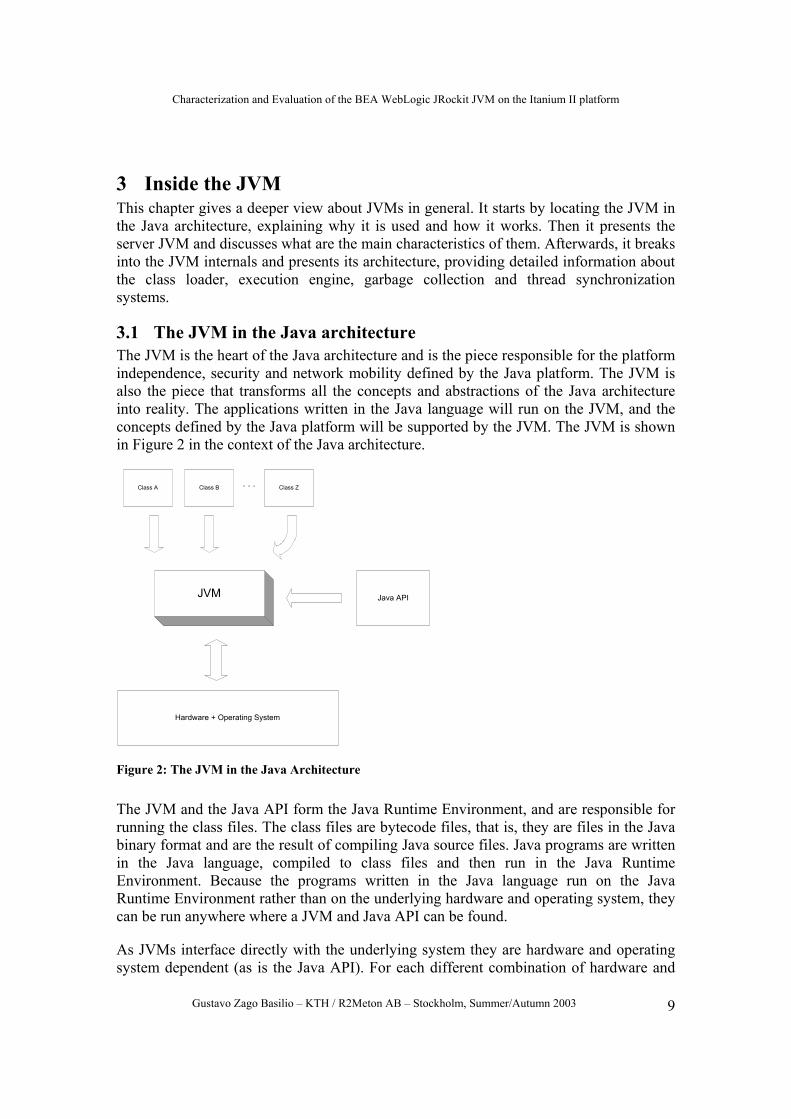
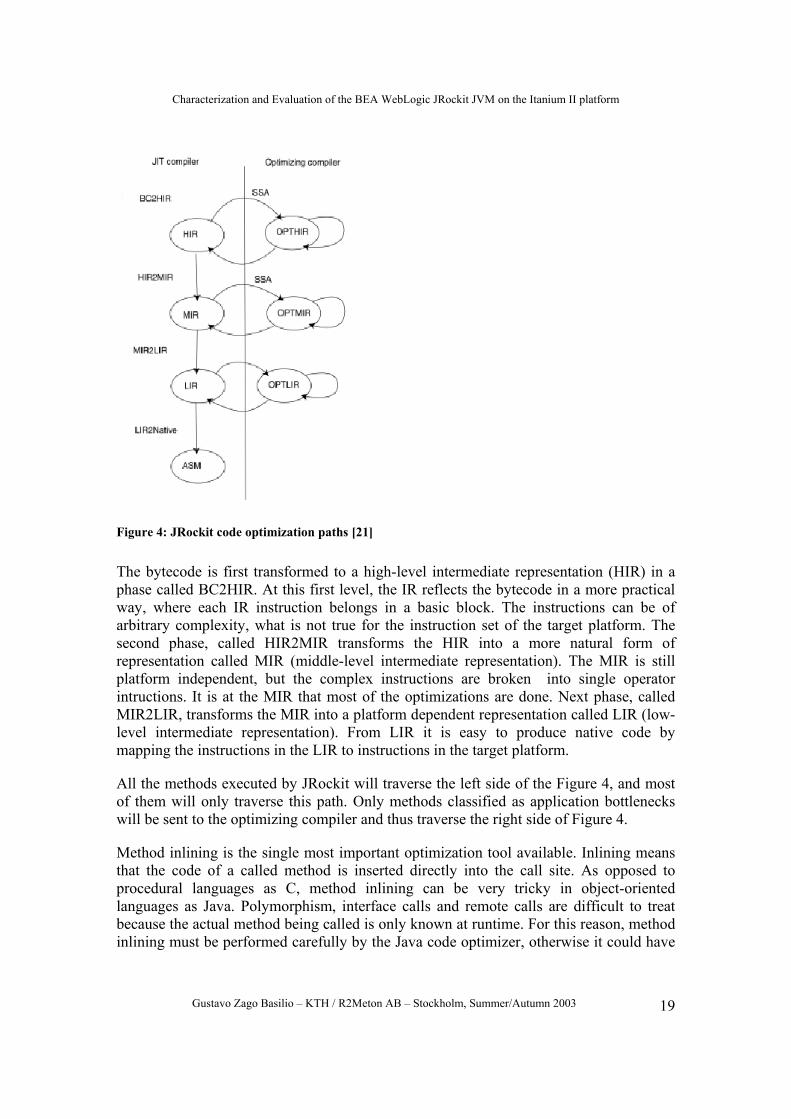
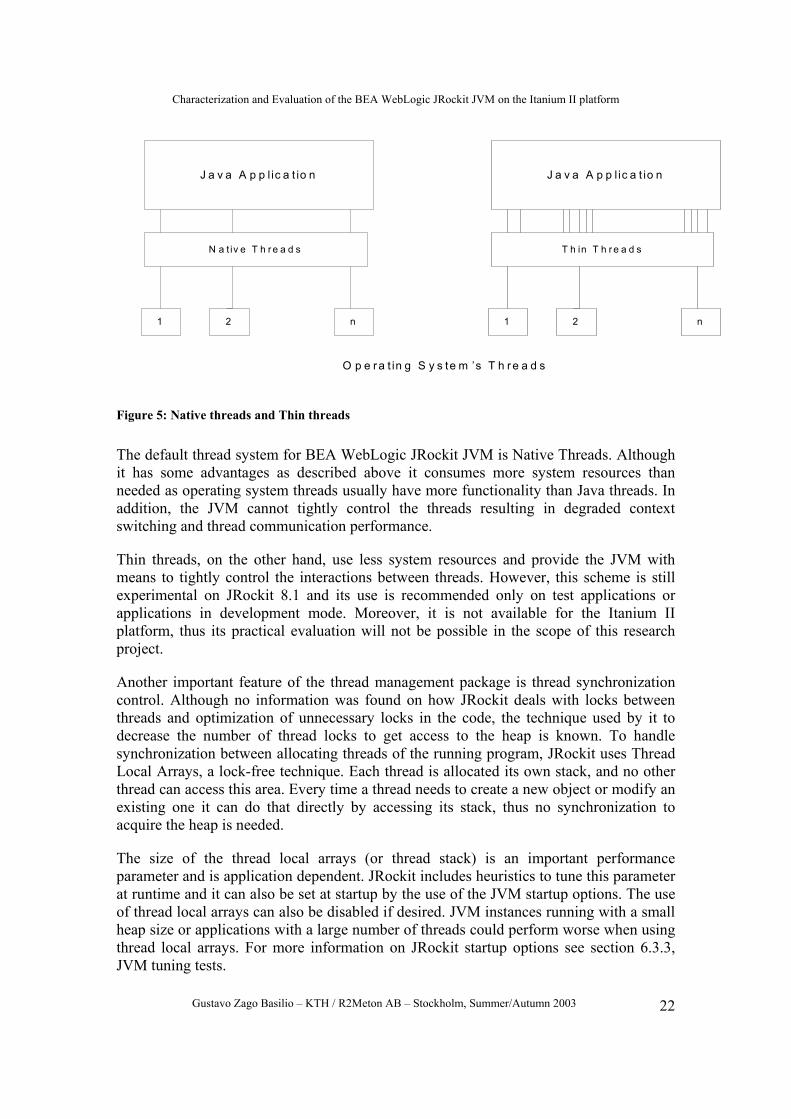
To decrease the amount of system resources used and improve performance by providing better thread switching and synchronization BEA Weblogic JRockit came up with the concept of thin threads, where the JVM maps multiple Java threads to a single operating system thread. The 2 schemas provided by JRockit for thread handling are:
• Native Threads which maps Java threads directly to the operating system threads, directly taking advantage of the operating system's thread scheduling and load balancing policies.
• Thin threads, where multiple Java threads are run on a single operating system thread. This allows WebLogic JRockit to optimize thread scheduling, thread switching, and thread synchronization, while using less system resources.
Figure 5 shows a graphical representation of the concepts of Native and Thin threads.
Characterization and Evaluation of the BEA WebLogic JRockit JVM on the Itanium II platform
Gustavo Zago Basilio – KTH / R2Meton AB – Stockholm, Summer/Autumn 2003 22
J a v a A p p l ic a t io n
1 2 n
N a t iv e T h r e a d s
J a v a A p p l ic a t io n
1 2 n
T h in T h r e a d s
O p e r a t in g S y s te m ’s T h r e a d s
Figure 5: Native threads and Thin threads
The default thread system for BEA WebLogic JRockit JVM is Native Threads. Although it has some advantages as described above it consumes more system resources than needed as operating system threads usually have more functionality than Java threads. In addition, the JVM cannot tightly control the threads resulting in degraded context switching and thread communication performance.
Thin threads, on the other hand, use less system resources and provide the JVM with means to tightly control the interactions between threads. However, this scheme is still experimental on JRockit 8.1 and its use is recommended only on test applications or applications in development mode. Moreover, it is not available for the Itanium II platform, thus its practical evaluation will not be possible in the scope of this research project.
Another important feature of the thread management package is thread synchronization control. Although no information was found on how JRockit deals with locks between threads and optimization of unnecessary locks in the code, the technique used by it to decrease the number of thread locks to get access to the heap is known. To handle synchronization between allocating threads of the running program, JRockit uses Thread Local Arrays, a lock-free technique. Each thread is allocated its own stack, and no other thread can access this area. Every time a thread needs to create a new object or modify an existing one it can do that directly by accessing its stack, thus no synchronization to acquire the heap is needed.
The size of the thread local arrays (or thread stack) is an important performance parameter and is application dependent. JRockit includes heuristics to tune this parameter at runtime and it can also be set at startup by the use of the JVM startup options. The use of thread local arrays can also be disabled if desired. JVM instances running with a small heap size or applications with a large number of threads could perform worse when using thread local arrays. For more information on JRockit startup options see section 6.3.3, JVM tuning tests.
Characterization and Evaluation of the BEA WebLogic JRockit JVM on the Itanium II platform
Gustavo Zago Basilio – KTH / R2Meton AB – Stockholm, Summer/Autumn 2003 23
4.2.4 Native Package The native package is the part of BEA WebLogic JRockit responsible for providing support for native methods (e.g. java.lang, java.io and java.net, JVM-support methods, JNI, and exception handling). I could not find any source of information about its internals, techniques used, implementation details, etc, except for some statements by BEA and Intel that I/O in JRockit is optimized for the Itanium II platform.
Characterization and Evaluation of the BEA WebLogic JRockit JVM on the Itanium II platform
Gustavo Zago Basilio – KTH / R2Meton AB – Stockholm, Summer/Autumn 2003 24
5 Problem definition and analysis This chapter defines the problem that had to be solved and the way chosen to solve it. It starts by describing the scope of the project and precisely defining what is to be solved. Then it defines a set of measurements that will be taken in order to achieve the goals. Later it gives some basic ideas about how to compare JVMs and, to finalize, it briefly describes the method that will be used.
5.1 Scope of the project As mentioned in section 2.4, Goals, and section 2.5, Limitations, the main goal of this project is to evaluate the BEA WebLogic JRockit JVM for the Itanium II platform in a way that reveals its possible benefits or drawbacks for Java enterprise applications.
For achieving this goal 3 main characteristics of the JVM will be investigated, performance, scalability and reliability, all in the context of Java enterprise applications. Java enterprise applications are developed under the J2EE architecture and run inside J2EE servers that provide transaction and state management, multithreading, resource pooling, and other complex low-level details. For this reason, the evaluation of the BEA WebLogic JRockit JVM will not be done directly, but through a J2EE server, also known as application server. As the JVM is the engine of application servers, its performance, scalability and reliability heavily affects the way the application is executed by the application server.
In addition to the investigation of performance, scalability and reliability of JRockit, a study on tuning options and how they affect the performance of the JRockit JVM will be carried out.
5.2 Performance, scalability and reliability Having defined what to measure, it is important to strictly define the exact meaning of each of the measurement parameters (performance, scalability and reliability) and why they are representative of the JVM overall behavior.
Performance in this master thesis project is measured in terms of application throughput and response time given a certain user load. Throughput is the number of transactions or operations executed in a certain period of time. Response time is the time taken to execute each of these transactions and give a reply back to the user. User load is the number of user requests in a certain period of time. As an example, let’s say there are 100 requests per minute and the application executes 300 operations in the same amount of time, each of these operations taking 300ms to complete and return a result to the user. In this case the throughput would be 300 operations per minute and the response time would be 300ms, and they would be the measure of performance used to compare JVMs.
Scalability, as it will be used throughout this document, is the ability to cope with an increasing number of user requests without degrading the performance and the service quality. In other words, I am interested on how many users the system could handle
Characterization and Evaluation of the BEA WebLogic JRockit JVM on the Itanium II platform
Gustavo Zago Basilio – KTH / R2Meton AB – Stockholm, Summer/Autumn 2003 25
keeping the same rate of transactions per user in a period of time and providing the same service quality an individual user would experience. It is worth to emphasize that due to resource constraints this master thesis project is not going to investigate the JVM scalability as it is commonly defined by JVM designers, that is, “an increase in hardware resources will result in a corresponding linear increase in supported user load while maintaining the same response time”.
JVM reliability, as is defined now, is the ability to execute a Java enterprise application under a fairly constant load over a longer period of time without presenting any problems as memory leaking, data corruption, or system crash. In other words, the JVM has to be able to execute an application over a longer period of time without disruption and with valid output during all the time.
JVM performance, scalability and reliability are key points of the JVM behavior because they can be easily translated to business and financial figures. The performance as it was defined on this document can be easily translated to the number of business transactions a JVM can execute in a period of time (throughput) and the service quality experienced by a user of the system (response time). Scalability will show how many of these business transactions can be executed at the peak without degrading the service quality. And reliability will directly impact on the number of business opportunities missed, as a system that is down or generates unpredictable results cannot generate any valid business transaction.
5.3 Comparing JVMs The task of comparing JVMs is not as easy as it might seem at first glance. The performance achieved by a JVM depends, among other things, on the hardware, operating system and JVM tuning parameters used. Without taking into account the first two factors of this equation, namely the hardware and operating system, the comparison of JVMs performance is meaningless. A bad implemented and not efficient JVM running on a 32 processor machine will much likely be faster than a very efficient JVM running on a single processor machine. For this reason, standardized benchmarks were created, providing means to effectively compare different JVMs running on different environments. The most widely used and accepted benchmarks for server side Java are SPECjbb2000 (evaluates the performance of server side java by emulating a 3-tier system), SPECjAppServer2001 (measures the performance of J2EE Application Servers), ECperf (measures the performance of J2EE Application Servers) and VolanoMark (measures the performance of server JVMs when running applications with long lasting network connections and a high number of threads).
5.4 Evaluation process Instead of evaluating the performance of the JVM when executing different types of tasks and operations the method used will focus on the performance of the JVM when running an enterprise application inside an application server. For achieving this goal ECperf will be used to simulate a real world enterprise application. ECperf is an Enterprise JavaBeans(EJB) benchmark meant to measure the scalability and performance of J2EE servers and containers. GUI and presentation are not the focus of the ECPerf workload,
Characterization and Evaluation of the BEA WebLogic JRockit JVM on the Itanium II platform
Gustavo Zago Basilio – KTH / R2Meton AB – Stockholm, Summer/Autumn 2003 26
nor are aspects of everyday DBMS scalability (e.g., database I/O, concurrency, memory management, etc.). ECperf stresses the ability of EJB containers to handle the complexities of memory management, connection pooling, passivation/activation, caching, etc. ECperf provides a good way to evaluate the JVM, as the performance, scalability and reliability of the application server heavily depends on the JVM.
For running the ECperf benchmark a DBMS is needed, as well as a J2EE application server. The DBMS is needed to provide data storage and retrieval capabilities. The application server is needed to provide the environment for the ECperf application to run (J2EE framework).
All the tests are performed using ECperf, as it simulates a real life enterprise application in many of its details and particularities. For the performance and scalability test the ECperf application is run with different injection rates (see section 6.1, ECperf, for information on the benchmark test), and the results obtained using different JVMs are then compared. For the reliability test the ECperf benchmark is run for a longer period of time, 1 to 5 hours, and the application and JVM behavior is monitored for errors, invalid responses or crashes. For the study of tuning options and how they affect the performance of the JRockit JVM, the ECperf application is run several times under the same conditions having different JVM startup options used at each time. The results are then compared to verify which startup options combination provided the best performance.
Characterization and Evaluation of the BEA WebLogic JRockit JVM on the Itanium II platform
Gustavo Zago Basilio – KTH / R2Meton AB – Stockholm, Summer/Autumn 2003 27
6 Method This chapter describes the software and hardware platforms used for the tests to evaluate JRockit and it provides detailed information about the method used to carry out the tests.
It starts by describing ECperf, the benchmark application used to evaluate JRockit and compare it with Sun’s JVM. Then it lists all the software used to perform the tests, the JVMs used, ECperf version, application server used, etc. Subsequently it describes the hardware used and how it was arranged on the tests. Finally it describes the tests themselves, giving detailed information about the method used.
6.1 ECperf
6.1.1 Introduction to ECperf The ECperf benchmark is based on a distributed application that claims to simulate a real world e-business application in all its aspects and requirements. The “storyline” of the business problem modeled is made of manufacturing, supply chain management, and order/inventory. As stated by the ECperf developers in the ECperf specification [9], this is a meaty, industrial strength distributed problem. It is heavyweight, mission-critical, worldwide, 7x24, and necessitates use of a powerful, scalable infrastructure. And most importantly, it makes use of interesting middleware services as transactional components, distributed transactions, caching, object persistence and resource pooling, and it can also make use of clustering, load-balancing and fault-tolerance.
6.1.2 ECperf Domains ECperf models business by using 4 domains:
1. Customer Domain;
2. Manufacturing Domain;
3. Supplier Domain;
4. Corporate Domain.
The Customer Domain handles customer orders and interactions. This domain hosts an order entry application which is responsible for, among other things, adding new orders, changing an existing order and retrieving the status of a particular order or all the orders from a particular costumer. Orders can be placed by individual customers or by distributors. Orders placed by distributors are called large orders.
Orders can be placed by existing customers or by new customers. In either case, a credit verification is done on the customer by sending a request to the corporate domain. Discounts are applied to orders depending on the type of customer. First time customers, existing customers and distributors have a differentiated treatment regarding discounts.
Characterization and Evaluation of the BEA WebLogic JRockit JVM on the Itanium II platform
Gustavo Zago Basilio – KTH / R2Meton AB – Stockholm, Summer/Autumn 2003 28
Existing orders can be changed and their status can be accessed by customers or salespeople.
The Manufacturing Domain performs "Just In Time" manufacturing operations. It models production lines in a manufacturing plant. Products manufactured by the production lines are called widgets. They are made of components or parts. The Bill of Material (BOM) for a widget indicates the parts needed to produce it. There are 2 types of production lines: planned lines and large order lines. Planned lines produce widgets according to a pre-defined schedule. Large order lines produce widgets as a response to large orders from customers. Production for both lines starts when a work order enters the system. Each work order describes what types of widget and the quantity to produce. Work orders for the planned lines are generated as the result of demand forecasting while for the large order lines they are the result of customer orders.
When a work order is created the Bill of Materials (BOM) for the widgets to be produced is created and the parts are taken from the inventory. As work progress the work order is updated until it is completed. When the work order is completed it is marked as completed and the inventory is updated. When there is a lack of parts in the inventory the Manufacturing Domain must contact the Supplier Domain which will, on its turn, send purchase orders (PO) to the appropriate suppliers.
The Supplier Domain handles interactions with external suppliers. It orders parts from suppliers based on which parts are needed, when they are needed, and the price of the parts in different suppliers. It orders parts by sending purchase orders (PO) to the suppliers. These purchase orders contain the quantity of various parts being purchased, the site where they must be delivered and the date by when they should be delivered. When parts are received from the suppliers, the supplier domain send a message to the manufacturing domain to update the inventory.
The Corporate Domain is the master keeper of customer, product, and supplier information. It manages the global list of customers, parts and suppliers. All the information about customer credits and order discount rules is kept in the corporate domain. Whenever a credit check or a discount calculation must be performed it is requested to the corporate domain.
6.1.3 ECperf application design The ECperf benchmark is made of 3 applications: the ECperf application itself, which contains all 4 domains; the Supplier Emulator application, which simulates external suppliers; and the Driver, which generates the workload for the benchmark.
All the tasks and processes executed in the 4 ECperf domains are implemented using Enterprise Java Bean components (EJB 1.1 specification) and are assembled into a single application (the ECperf application) which is deployed into the System Under Test (SUT). The performance of this application on the SUT is what will be measure by the ECperf benchmark.
Characterization and Evaluation of the BEA WebLogic JRockit JVM on the Itanium II platform
Gustavo Zago Basilio – KTH / R2Meton AB – Stockholm, Summer/Autumn 2003 29
Suppliers are implemented in a separate application that must run in a system other than the SUT. This application is known as the Supplier Emulator. It provides the supplier domain ways to emulate the process of sending and receiving purchase orders to/from suppliers. It accepts a purchase order from the BuyerSes session bean in the supplier domain, processes the purchase order, and then delivers the items requested to the ReceiverSes session bean after sleeping for an amount of time based on the lead-time of the component. The Supplier Emulator makes no use of Enterprise Java Beans, thus it can be run in any Java-enabled web server outside the SUT.
The last piece of the ECperf benchmark is the driver, responsible for generating the workload. It is not part of the SUT either, and it must be run using an arbitrary number of JVMs to ensure it has no scalability limitations.
A relational DBMS is used to provide data persistence and all the access operations use entity beans which are mapped to tables in the ECperf database. Both container (CMP) and bean managed (BMP) persistence is supported.
The throughput of the ECperf benchmark is driven by the activity of the OrderEntry and Manufacturing applications. The throughput of both applications is directly related to the chosen Injection Rate. To increase the throughput, the Injection Rate needs to be increased. The Injection Rate is the rate at which business transaction requests from the OrderEntry Application in the Customer Domain are injected into the system under test (SUT). In other words, it determines the number of order entry requests generated and the number of work orders scheduled per second.
The performance metric provided by ECperf is BBops/min (Benchmark Business OPerationS per minute). It is composed of the total number of business transactions completed in the customer domain plus the total number of work orders completed in the manufacturing domain, normalized per minute.
6.2 Software and hardware platforms Deploying and running ECperf is not a straightforward task, and some requirements for both hardware and software components have to be followed in order to obtain valid and meaningful results. The minimum hardware system needed is composed by at least 2 machines, as the Supplier Emulator and Driver are not supposed to run on the SUT. As for software requirements, the system must bear, in addition to the ECperf benchmark itself, a relational DBMS to hold the benchmark tables and a J2EE server to run the benchmark application. As some of the tests require monitoring CPU and memory utilization, some kind of monitoring tool must be used too. Table 1 is a list of the software used to perform the tests.
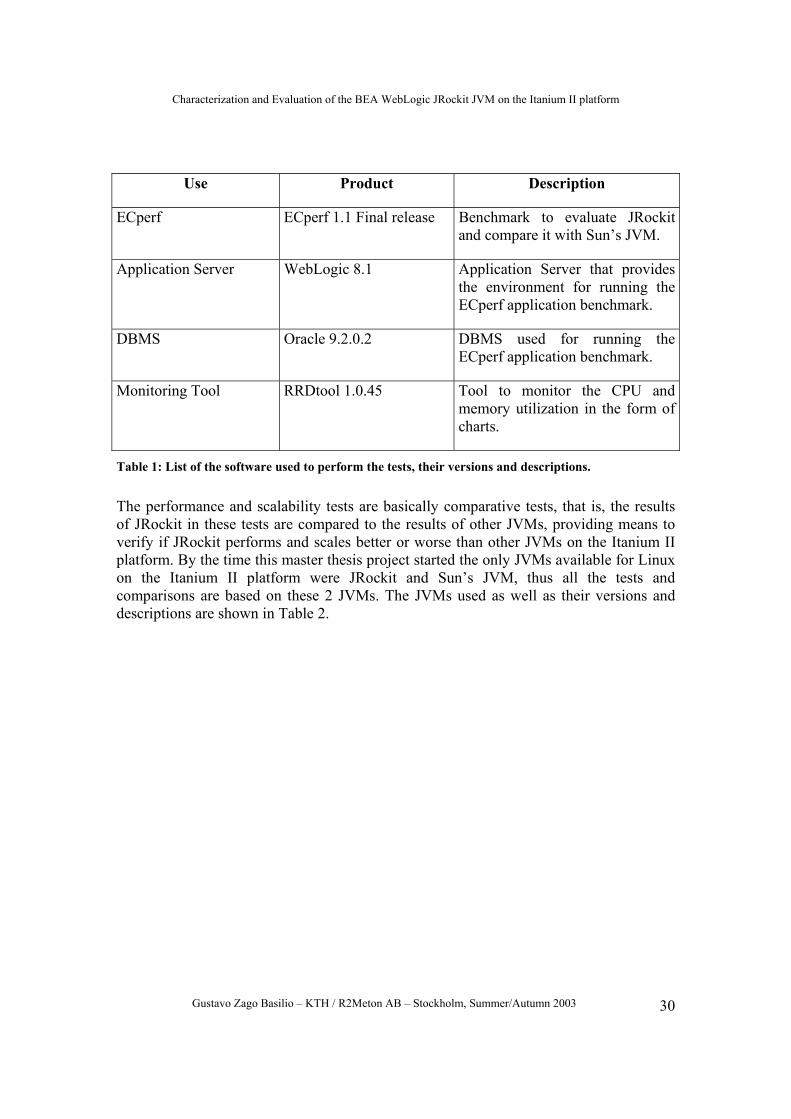
Characterization and Evaluation of the BEA WebLogic JRockit JVM on the Itanium II platform
Gustavo Zago Basilio – KTH / R2Meton AB – Stockholm, Summer/Autumn 2003 30
Use Product Description
ECperf ECperf 1.1 Final release Benchmark to evaluate JRockit and compare it with Sun’s JVM.
Application Server WebLogic 8.1 Application Server that provides the environment for running the ECperf application benchmark.
DBMS Oracle 9.2.0.2 DBMS used for running the ECperf application benchmark.
Monitoring Tool RRDtool 1.0.45 Tool to monitor the CPU and memory utilization in the form of charts.
Table 1: List of the software used to perform the tests, their versions and descriptions.
The performance and scalability tests are basically comparative tests, that is, the results of JRockit in these tests are compared to the results of other JVMs, providing means to verify if JRockit performs and scales better or worse than other JVMs on the Itanium II platform. By the time this master thesis project started the only JVMs available for Linux on the Itanium II platform were JRockit and Sun’s JVM, thus all the tests and comparisons are based on these 2 JVMs. The JVMs used as well as their versions and descriptions are shown in Table 2.
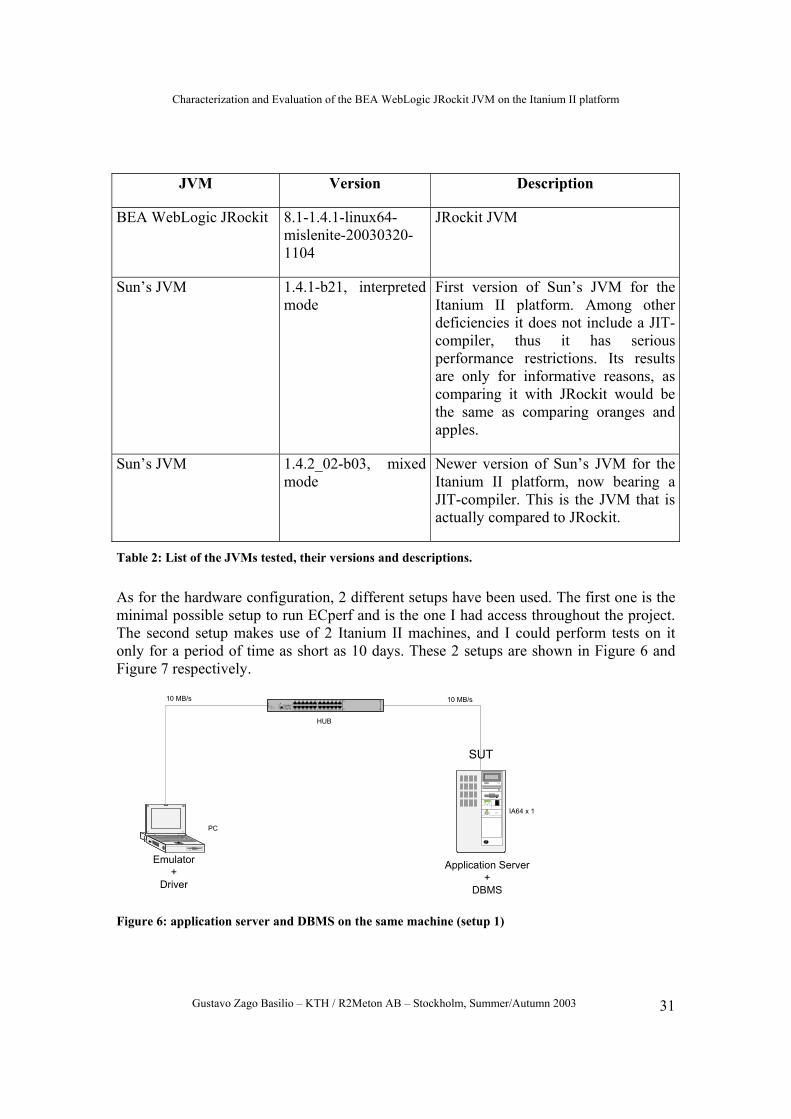
Characterization and Evaluation of the BEA WebLogic JRockit JVM on the Itanium II platform
Gustavo Zago Basilio – KTH / R2Meton AB – Stockholm, Summer/Autumn 2003 31
JVM Version Description
BEA WebLogic JRockit 8.1-1.4.1-linux64-mislenite-20030320-1104
JRockit JVM
Sun’s JVM 1.4.1-b21, interpreted mode
First version of Sun’s JVM for the Itanium II platform. Among other deficiencies it does not include a JIT-compiler, thus it has serious performance restrictions. Its results are only for informative reasons, as comparing it with JRockit would be the same as comparing oranges and apples.
Sun’s JVM 1.4.2_02-b03, mixed mode
Newer version of Sun’s JVM for the Itanium II platform, now bearing a JIT-compiler. This is the JVM that is actually compared to JRockit.
Table 2: List of the JVMs tested, their versions and descriptions.
As for the hardware configuration, 2 different setups have been used. The first one is the minimal possible setup to run ECperf and is the one I had access throughout the project. The second setup makes use of 2 Itanium II machines, and I could perform tests on it only for a period of time as short as 10 days. These 2 setups are shown in Figure 6 and Figure 7 respectively.
PC
IA64 x 1
1 2 3 4 5 6
7 8 9101112
AB
12x
6x
8x
2x
9x
3x
10x
4x
11x
5x
7x
1x
Ethe
rnet
A
12x
6x
8x
2x
9x
3x
10x
4x
11x
5x
7x
1x
C
HUB
Emulator+
Driver
Application Server+
DBMS
10 MB/s 10 MB/s
SUT
Figure 6: application server and DBMS on the same machine (setup 1)
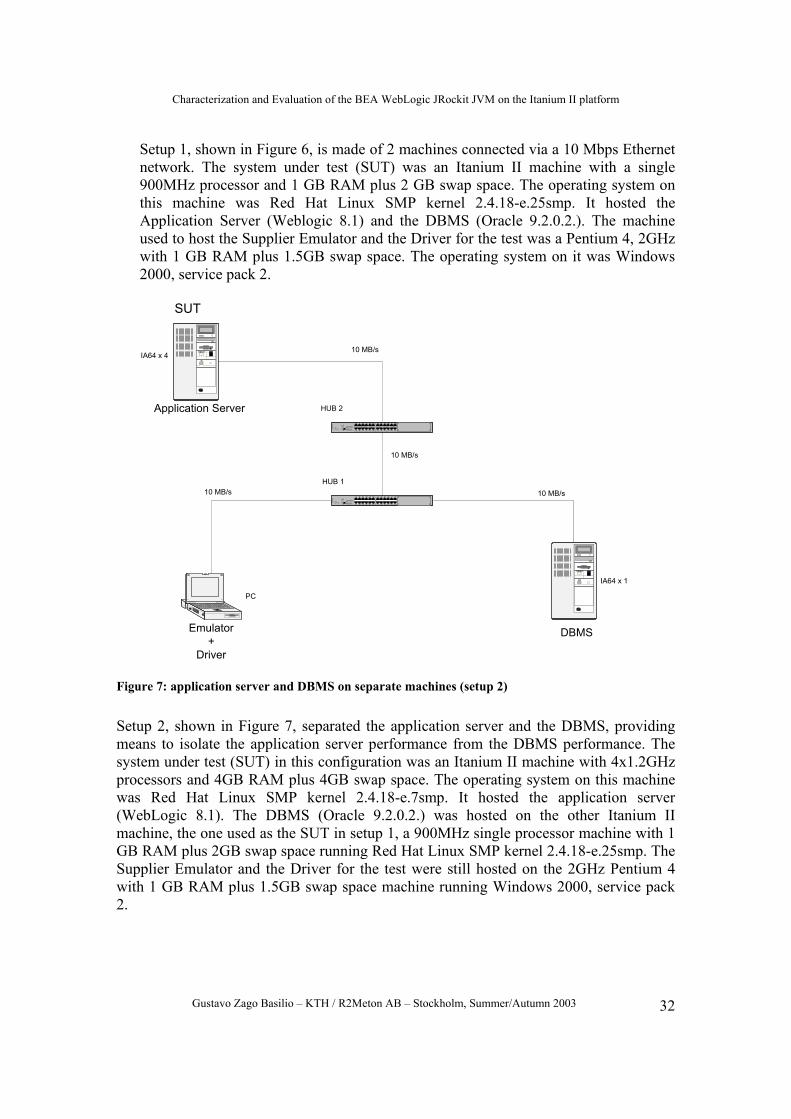
Characterization and Evaluation of the BEA WebLogic JRockit JVM on the Itanium II platform
Gustavo Zago Basilio – KTH / R2Meton AB – Stockholm, Summer/Autumn 2003 32
Setup 1, shown in Figure 6, is made of 2 machines connected via a 10 Mbps Ethernet network. The system under test (SUT) was an Itanium II machine with a single 900MHz processor and 1 GB RAM plus 2 GB swap space. The operating system on this machine was Red Hat Linux SMP kernel 2.4.18-e.25smp. It hosted the Application Server (Weblogic 8.1) and the DBMS (Oracle 9.2.0.2.). The machine used to host the Supplier Emulator and the Driver for the test was a Pentium 4, 2GHz with 1 GB RAM plus 1.5GB swap space. The operating system on it was Windows 2000, service pack 2.
IA64 x 1
PC
1 2 3 4 5 6
7 8 9101112
AB
12x
6x
8x
2x
9x
3x
10x
4x
11x
5x
7x
1x
Ethe
rnet
A
12x
6x
8x
2x
9x
3x
10x
4x
11x
5x
7x
1x
C
1 2 3 4 5 6
7 8 9101112
AB
12x
6x
8x
2x
9x
3x
10x
4x
11x
5x
7x
1x
Ethe
rnet
A
12x
6x
8x
2x
9x
3x
10x
4x
11x
5x
7x
1x
C
IA64 x 4
HUB 2
HUB 110 MB/s 10 MB/s
10 MB/s
10 MB/s
Application Server
Emulator+
Driver
DBMS
SUT
Figure 7: application server and DBMS on separate machines (setup 2)
Setup 2, shown in Figure 7, separated the application server and the DBMS, providing means to isolate the application server performance from the DBMS performance. The system under test (SUT) in this configuration was an Itanium II machine with 4x1.2GHz processors and 4GB RAM plus 4GB swap space. The operating system on this machine was Red Hat Linux SMP kernel 2.4.18-e.7smp. It hosted the application server (WebLogic 8.1). The DBMS (Oracle 9.2.0.2.) was hosted on the other Itanium II machine, the one used as the SUT in setup 1, a 900MHz single processor machine with 1 GB RAM plus 2GB swap space running Red Hat Linux SMP kernel 2.4.18-e.25smp. The Supplier Emulator and the Driver for the test were still hosted on the 2GHz Pentium 4 with 1 GB RAM plus 1.5GB swap space machine running Windows 2000, service pack 2.
Characterization and Evaluation of the BEA WebLogic JRockit JVM on the Itanium II platform
Gustavo Zago Basilio – KTH / R2Meton AB – Stockholm, Summer/Autumn 2003 33
6.3 Tests The goal of the tests is to provide enough data to produce a good, reliable and meaningful comparison between JRockit and Sun’s JVMs on the Itanium II platform as well as investigating JRockit’s reliability and how tuning affects the performance of Java applications run by this JVM.
The tests performed can be divided in 3 groups:
1. Performance and scalability tests;
2. Reliability tests;
3. JVM tuning tests.
6.3.1 Performance and scalability tests The simple measurement of performance and scalability indicators for JRockit on the Itanium II platform would not provide meaningful information about how good or bad it is when confronted to other JVMs. For this reason, the performance and scalability of JRockit on the Itanium II platform were evaluated by comparing it to the performance and scalability of Sun’s JVM on the same platform. Tests were performed for both JVMs and the results were compared.
For evaluating the performance and scalability of the BEA Weblogic JRockit JVM and comparing it to Sun’s JVM, ECperf was repeatedly run with different injection rates. For each JVM the ECperf benchmark was run with increasing injection rates for simulating increasing user load. This approach allowed me to analyze how both JVMs perform under different load conditions and also to investigate how well they scale for a different number of users (see sections 7.1.2 and 7.2.2 for details on the JVM scalability test results).
One important thing to observe when having performance tests on different JVMs is the amount of resources allocated to the JVM and any optimization technique used. If one runs 2 different JVMs with different heap sizes then, the results of the tests will most likely be misleading as a JVM with a bigger heap will probably have some advantage over a JVM with a smaller one. The same logic is valid for optimization parameters. Tests where one JVM optimizes code in a certain way while the other does not could be misleading. For this reason, in all the tests taken for comparing the performance of JRockit and Sun’s JVM the same heap size and no optimization startup options were used.
6.3.2 Reliability tests The task of measuring reliability or quantifying it somehow is not an easy one. What is it meant when the term “reliability of the JVM” is used? How could it be measured?
The way chosen to measure this property of the JVM was to run the ECperf benchmark with different injection rates (to simulate different loads) over a longer period of time and monitor the system for application or JVM errors, JVM crashes or system crashes.
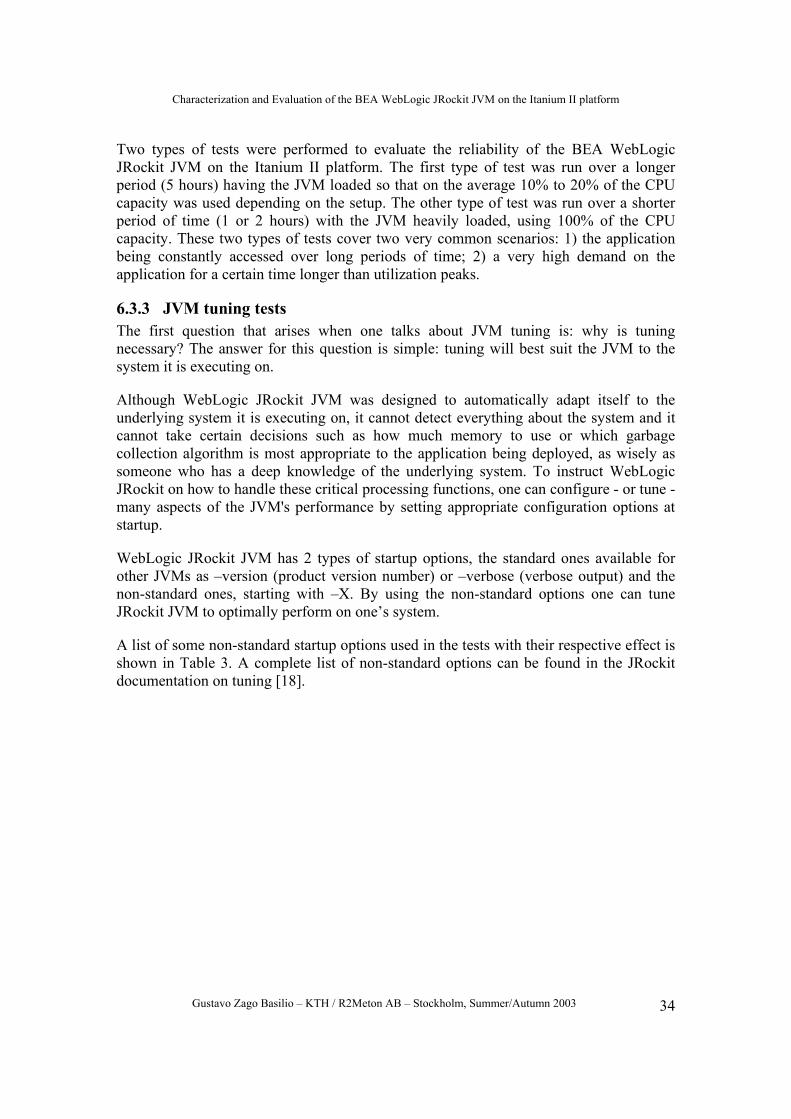
Characterization and Evaluation of the BEA WebLogic JRockit JVM on the Itanium II platform
Gustavo Zago Basilio – KTH / R2Meton AB – Stockholm, Summer/Autumn 2003 34
Two types of tests were performed to evaluate the reliability of the BEA WebLogic JRockit JVM on the Itanium II platform. The first type of test was run over a longer period (5 hours) having the JVM loaded so that on the average 10% to 20% of the CPU capacity was used depending on the setup. The other type of test was run over a shorter period of time (1 or 2 hours) with the JVM heavily loaded, using 100% of the CPU capacity. These two types of tests cover two very common scenarios: 1) the application being constantly accessed over long periods of time; 2) a very high demand on the application for a certain time longer than utilization peaks.
6.3.3 JVM tuning tests The first question that arises when one talks about JVM tuning is: why is tuning necessary? The answer for this question is simple: tuning will best suit the JVM to the system it is executing on.
Although WebLogic JRockit JVM was designed to automatically adapt itself to the underlying system it is executing on, it cannot detect everything about the system and it cannot take certain decisions such as how much memory to use or which garbage collection algorithm is most appropriate to the application being deployed, as wisely as someone who has a deep knowledge of the underlying system. To instruct WebLogic JRockit on how to handle these critical processing functions, one can configure - or tune - many aspects of the JVM's performance by setting appropriate configuration options at startup.
WebLogic JRockit JVM has 2 types of startup options, the standard ones available for other JVMs as –version (product version number) or –verbose (verbose output) and the non-standard ones, starting with –X. By using the non-standard options one can tune JRockit JVM to optimally perform on one’s system.
A list of some non-standard startup options used in the tests with their respective effect is shown in Table 3. A complete list of non-standard options can be found in the JRockit documentation on tuning [18].
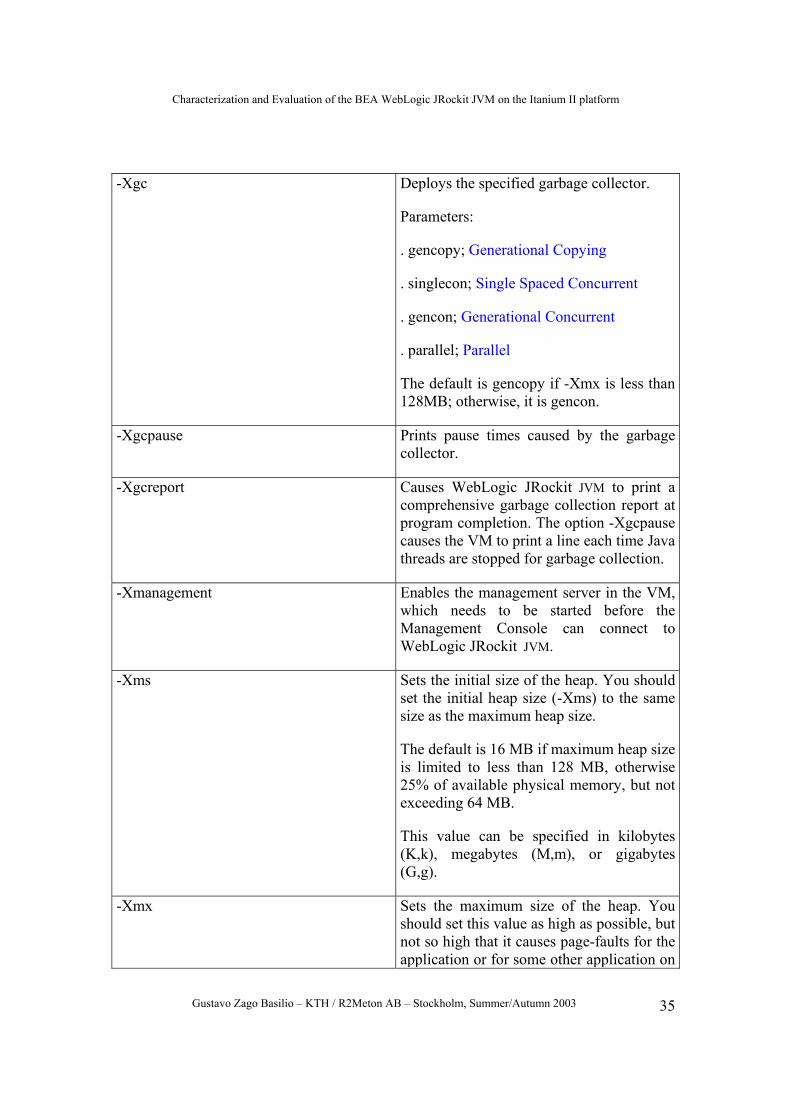
Characterization and Evaluation of the BEA WebLogic JRockit JVM on the Itanium II platform
Gustavo Zago Basilio – KTH / R2Meton AB – Stockholm, Summer/Autumn 2003 35
-Xgc Deploys the specified garbage collector.
Parameters:
. gencopy; Generational Copying
. singlecon; Single Spaced Concurrent
. gencon; Generational Concurrent
. parallel; Parallel
The default is gencopy if -Xmx is less than 128MB; otherwise, it is gencon.
-Xgcpause Prints pause times caused by the garbage collector.
-Xgcreport Causes WebLogic JRockit JVM to print a comprehensive garbage collection report at program completion. The option -Xgcpause causes the VM to print a line each time Java threads are stopped for garbage collection.
-Xmanagement Enables the management server in the VM, which needs to be started before the Management Console can connect to WebLogic JRockit JVM.
-Xms
Sets the initial size of the heap. You should set the initial heap size (-Xms) to the same size as the maximum heap size.
The default is 16 MB if maximum heap size is limited to less than 128 MB, otherwise 25% of available physical memory, but not exceeding 64 MB.
This value can be specified in kilobytes (K,k), megabytes (M,m), or gigabytes (G,g).
-Xmx
Sets the maximum size of the heap. You should set this value as high as possible, but not so high that it causes page-faults for the application or for some other application on
Characterization and Evaluation of the BEA WebLogic JRockit JVM on the Itanium II platform
Gustavo Zago Basilio – KTH / R2Meton AB – Stockholm, Summer/Autumn 2003 36
the same computer.
The default is the lesser of 75% of physical memory and 400 MB when running gencopy; when running another garbage collector, the default is the lesser of 75% of physical memory and 1536 MB.
This value can be specified in kilobytes (K,k), megabytes (M,m), or gigabytes (G,g).
-Xns Sets the size of the young generation (nursery) in generational concurrent and generational copying garbage collectors (these are the only collectors that use nurseries). If you are creating a lot of temporary objects you should have a large nursery.
The default is default is 10 MB per CPU with a gencon garbage collector and 320 KB per CPU with gencopy.
This value can be specified in kilobytes (K,k), megabytes (M,m), or gigabytes (G,g)..
-Xss
Sets the thread stack size; can be specified in kilobytes (K,k), megabytes (M,m), or gigabytes (G,g).
Table 3: JRockit non-standard startup options
The main goal on this part of the project was to obtain the best performance of the ECperf application by setting the appropriate startup options. As applications can differ considerably, the startup options that achieved the best performance in this case can be not the optimal ones for some other application. However, the basic ideas of tuning as well as most of the conclusions drawn from the tests can be widely applied to other enterprise applications.
The initial idea was to test all the 4 different garbage collectors with different heap and thread stack sizes as well different thread systems (native and thin threads) on both setups and analyze the results to see which combination of startup options would result in the best performance.
Characterization and Evaluation of the BEA WebLogic JRockit JVM on the Itanium II platform
Gustavo Zago Basilio – KTH / R2Meton AB – Stockholm, Summer/Autumn 2003 37
However, thin threads are not available for Itanium II machines and I had problems when trying to run the generational garbage collectors on setup 1. As a result, the tunning tests for setup 1 and setup 2 are slightly different. The tunning tests on setup 1 were performed only for the single spaced concurrent (singlecon) and single spaced parallel (parallel) garbage collectors while on setup 2 they were performed for all garbage collectors, although focused on the generational copying (gencopy) and generational concurrent (gencon).
Characterization and Evaluation of the BEA WebLogic JRockit JVM on the Itanium II platform
Gustavo Zago Basilio – KTH / R2Meton AB – Stockholm, Summer/Autumn 2003 38
7 Results and Analysis In this chapter the tests carried out to evaluate JRockit and compare it to Sun’s JVM are presented and analyzed. The results are organized according to the hardware used to perform the tests (setup 1 and setup 2) and the type of tests performed. Performance and scalability tests were carried out for all JVMs and the results were then analyzed and compared. For the characterization of JRockit, reliability tests and tuning studies were performed and the results were then analyzed.
7.1 Setup 1 Setup 1 had the BEA WebLogic application server and Oracle DBMS running on the same machine, as shown in Figure 6 (page 31). This setup was extensively tested, as I had access to this configuration throughout the master thesis project.
7.1.1 Performance Performance and scalability tests were performed according to the method exemplified in Section 6.3.1. The tests were run in a way to simulate different user loads and for each different load the throughput and response times were monitored.
The tests were performed for both BEA WebLogic JRockit and Sun’s JVM to provide means of comparing between these two JVMs on the Itanium II platform. The versions tested were BEA WebLogic JRockit 8.1, Sun JDK 1.4.1 and Sun JDK 1.4.2 (see Table 2, page 31, for details). Initially the tests were run for only Sun JVM version 1.4.1, but afterwards I discovered that this version does not include a JIT-compiler, so a new set of measurements was taken for Sun JDK 1.4.2 which includes the HotSpot JIT-compiler.
The RampUp time (time when the JVM executes the ECperf application but no measurements are taken) used during the tests for each JVM and version differs according to the time taken to achieve a stable application throughput. A brief study on the minimum RampUp time for each JVM was done and is presented in section 11, “
Appendix I – JRockit vs Sun’s JVM RampUp time”. For BEA WebLogic JRockit and Sun JDK 1.4.2 the RampUp time used was 8 minutes, for Sun JDK 1.4.1 it was 35 minutes.
As the tests should be performed under similar conditions for all JVMs, the minimum and maximum heap size were set at startup and no tuning options were used for any of the JVMs. The command line to start each of the JVMs is shown in Table 4.
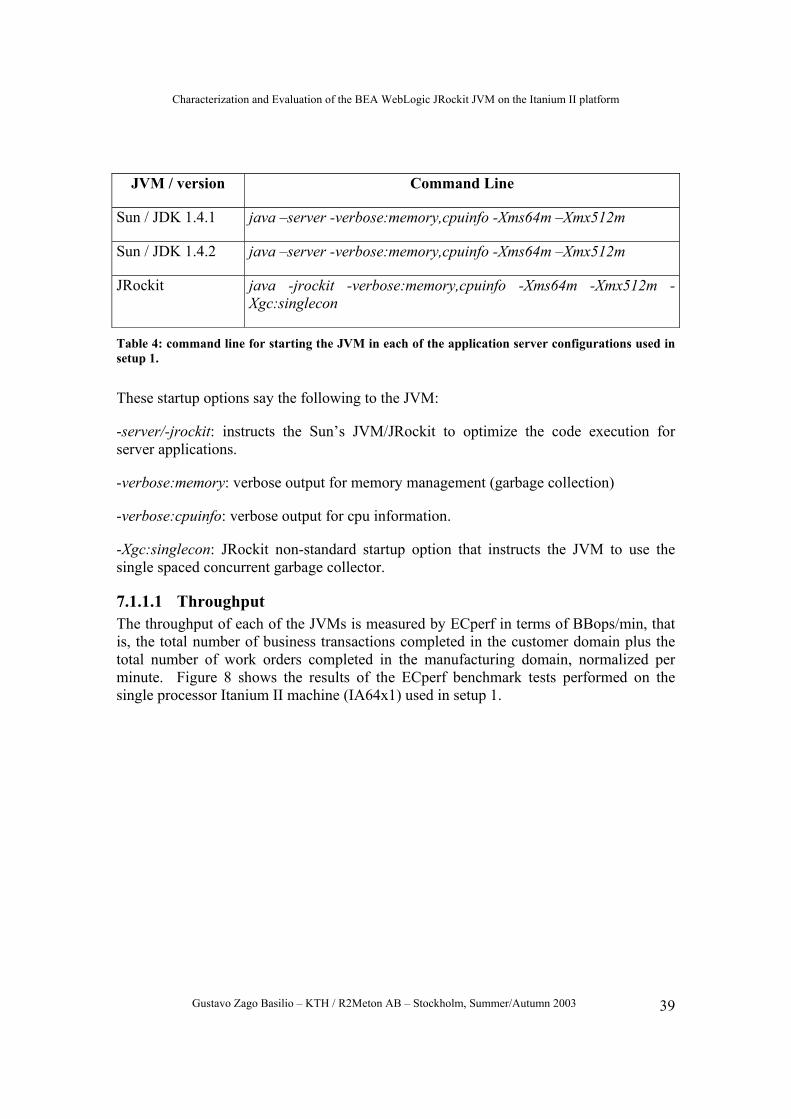
Characterization and Evaluation of the BEA WebLogic JRockit JVM on the Itanium II platform
Gustavo Zago Basilio – KTH / R2Meton AB – Stockholm, Summer/Autumn 2003 39
JVM / version Command Line
Sun / JDK 1.4.1 java –server -verbose:memory,cpuinfo -Xms64m –Xmx512m
Sun / JDK 1.4.2 java –server -verbose:memory,cpuinfo -Xms64m –Xmx512m
JRockit java -jrockit -verbose:memory,cpuinfo -Xms64m -Xmx512m -Xgc:singlecon
Table 4: command line for starting the JVM in each of the application server configurations used in setup 1.
These startup options say the following to the JVM:
-server/-jrockit: instructs the Sun’s JVM/JRockit to optimize the code execution for server applications.
-verbose:memory: verbose output for memory management (garbage collection)
-verbose:cpuinfo: verbose output for cpu information.
-Xgc:singlecon: JRockit non-standard startup option that instructs the JVM to use the single spaced concurrent garbage collector.
7.1.1.1 Throughput The throughput of each of the JVMs is measured by ECperf in terms of BBops/min, that is, the total number of business transactions completed in the customer domain plus the total number of work orders completed in the manufacturing domain, normalized per minute. Figure 8 shows the results of the ECperf benchmark tests performed on the single processor Itanium II machine (IA64x1) used in setup 1.
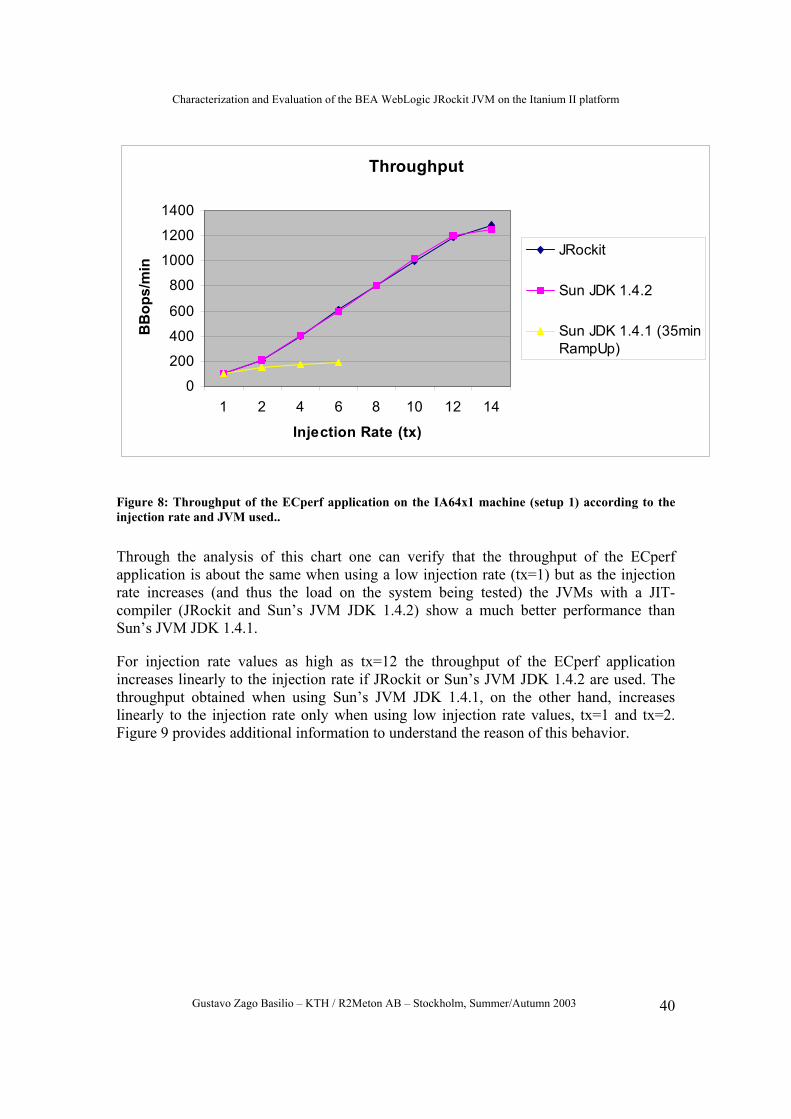
Characterization and Evaluation of the BEA WebLogic JRockit JVM on the Itanium II platform
Gustavo Zago Basilio – KTH / R2Meton AB – Stockholm, Summer/Autumn 2003 40
Throughput
0
200
400
600
800
1000
1200
1400
1 2 4 6 8 10 12 14
Injection Rate (tx)
BB
ops/
min
JRockit
Sun JDK 1.4.2
Sun JDK 1.4.1 (35minRampUp)
Figure 8: Throughput of the ECperf application on the IA64x1 machine (setup 1) according to the injection rate and JVM used..
Through the analysis of this chart one can verify that the throughput of the ECperf application is about the same when using a low injection rate (tx=1) but as the injection rate increases (and thus the load on the system being tested) the JVMs with a JIT-compiler (JRockit and Sun’s JVM JDK 1.4.2) show a much better performance than Sun’s JVM JDK 1.4.1.
For injection rate values as high as tx=12 the throughput of the ECperf application increases linearly to the injection rate if JRockit or Sun’s JVM JDK 1.4.2 are used. The throughput obtained when using Sun’s JVM JDK 1.4.1, on the other hand, increases linearly to the injection rate only when using low injection rate values, tx=1 and tx=2. Figure 9 provides additional information to understand the reason of this behavior.
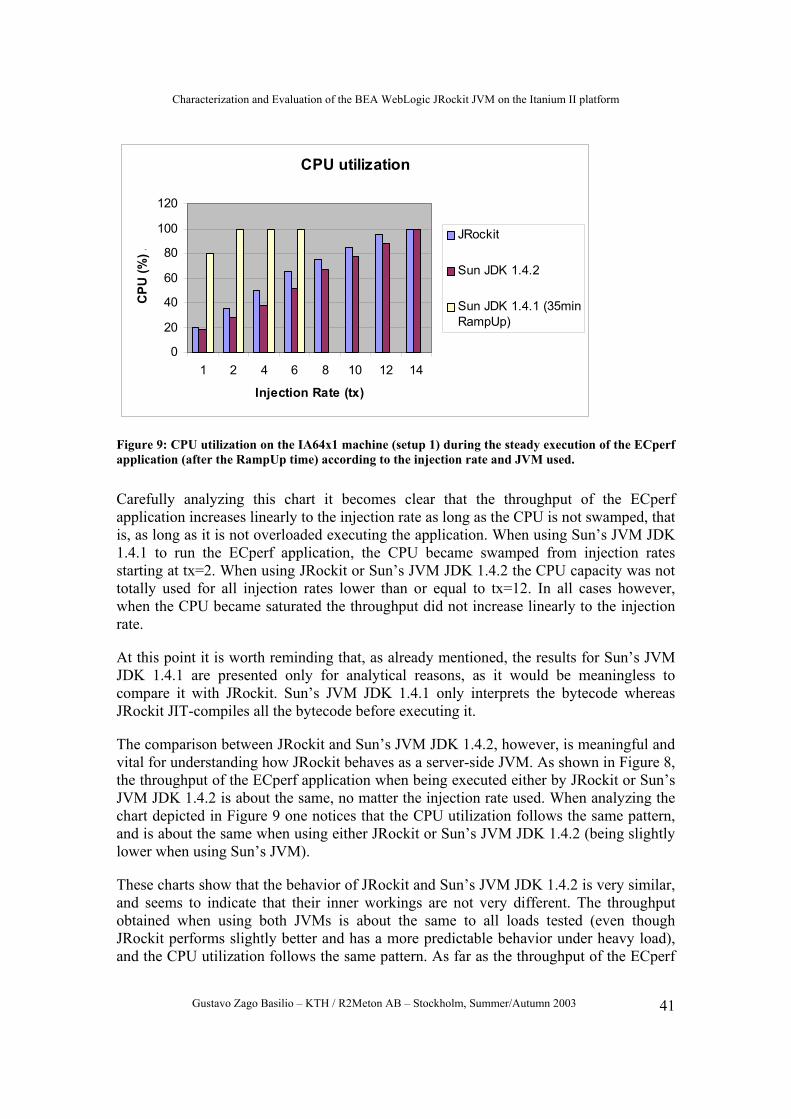
Characterization and Evaluation of the BEA WebLogic JRockit JVM on the Itanium II platform
Gustavo Zago Basilio – KTH / R2Meton AB – Stockholm, Summer/Autumn 2003 41
CPU utilization
0
20
40
60
80
100
120
1 2 4 6 8 10 12 14
Injection Rate (tx)
CPU
(%) .
JRockit
Sun JDK 1.4.2
Sun JDK 1.4.1 (35minRampUp)
Figure 9: CPU utilization on the IA64x1 machine (setup 1) during the steady execution of the ECperf application (after the RampUp time) according to the injection rate and JVM used.
Carefully analyzing this chart it becomes clear that the throughput of the ECperf application increases linearly to the injection rate as long as the CPU is not swamped, that is, as long as it is not overloaded executing the application. When using Sun’s JVM JDK 1.4.1 to run the ECperf application, the CPU became swamped from injection rates starting at tx=2. When using JRockit or Sun’s JVM JDK 1.4.2 the CPU capacity was not totally used for all injection rates lower than or equal to tx=12. In all cases however, when the CPU became saturated the throughput did not increase linearly to the injection rate.
At this point it is worth reminding that, as already mentioned, the results for Sun’s JVM JDK 1.4.1 are presented only for analytical reasons, as it would be meaningless to compare it with JRockit. Sun’s JVM JDK 1.4.1 only interprets the bytecode whereas JRockit JIT-compiles all the bytecode before executing it.
The comparison between JRockit and Sun’s JVM JDK 1.4.2, however, is meaningful and vital for understanding how JRockit behaves as a server-side JVM. As shown in Figure 8, the throughput of the ECperf application when being executed either by JRockit or Sun’s JVM JDK 1.4.2 is about the same, no matter the injection rate used. When analyzing the chart depicted in Figure 9 one notices that the CPU utilization follows the same pattern, and is about the same when using either JRockit or Sun’s JVM JDK 1.4.2 (being slightly lower when using Sun’s JVM).
These charts show that the behavior of JRockit and Sun’s JVM JDK 1.4.2 is very similar, and seems to indicate that their inner workings are not very different. The throughput obtained when using both JVMs is about the same to all loads tested (even though JRockit performs slightly better and has a more predictable behavior under heavy load), and the CPU utilization follows the same pattern. As far as the throughput of the ECperf
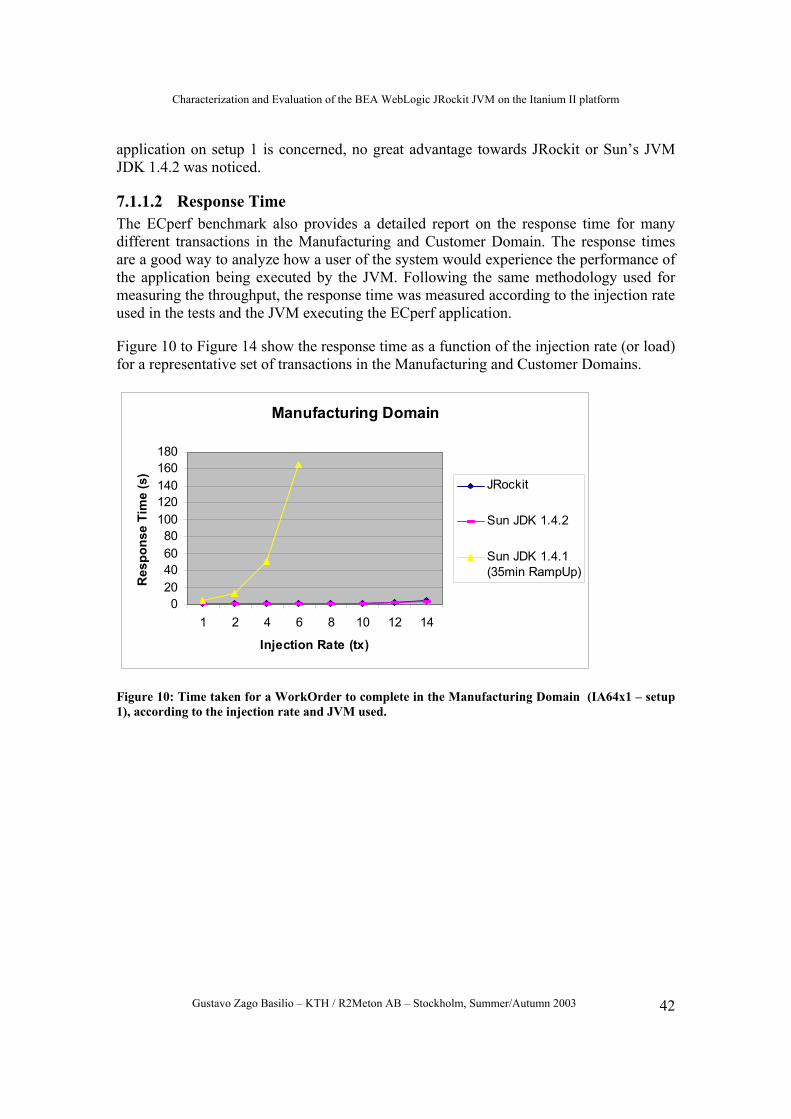
Characterization and Evaluation of the BEA WebLogic JRockit JVM on the Itanium II platform
Gustavo Zago Basilio – KTH / R2Meton AB – Stockholm, Summer/Autumn 2003 42
application on setup 1 is concerned, no great advantage towards JRockit or Sun’s JVM JDK 1.4.2 was noticed.
7.1.1.2 Response Time The ECperf benchmark also provides a detailed report on the response time for many different transactions in the Manufacturing and Customer Domain. The response times are a good way to analyze how a user of the system would experience the performance of the application being executed by the JVM. Following the same methodology used for measuring the throughput, the response time was measured according to the injection rate used in the tests and the JVM executing the ECperf application.
Figure 10 to Figure 14 show the response time as a function of the injection rate (or load) for a representative set of transactions in the Manufacturing and Customer Domains.
Manufacturing Domain
020406080
100120140160180
1 2 4 6 8 10 12 14
Injection Rate (tx)
Res
pons
e Ti
me
(s)
JRockit
Sun JDK 1.4.2
Sun JDK 1.4.1(35min RampUp)
Figure 10: Time taken for a WorkOrder to complete in the Manufacturing Domain (IA64x1 – setup 1), according to the injection rate and JVM used.
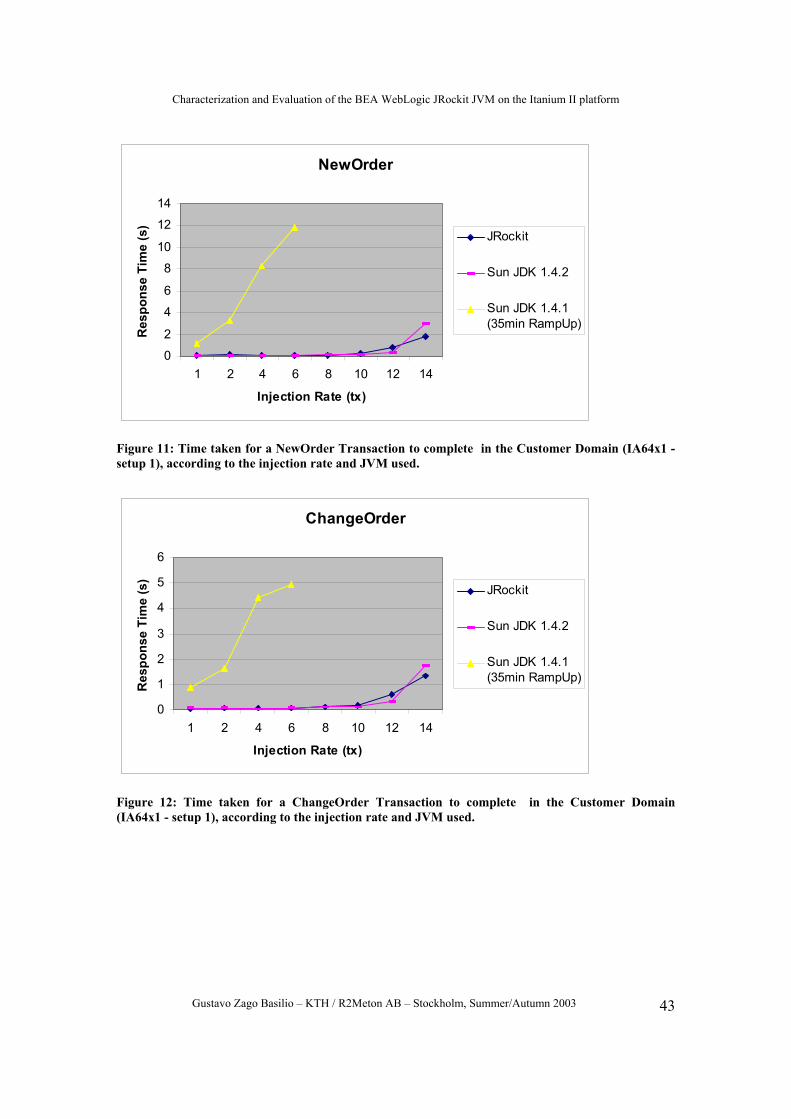
Characterization and Evaluation of the BEA WebLogic JRockit JVM on the Itanium II platform
Gustavo Zago Basilio – KTH / R2Meton AB – Stockholm, Summer/Autumn 2003 43
NewOrder
02
46
810
1214
1 2 4 6 8 10 12 14
Injection Rate (tx)
Res
pons
e Ti
me
(s)
JRockit
Sun JDK 1.4.2
Sun JDK 1.4.1(35min RampUp)
Figure 11: Time taken for a NewOrder Transaction to complete in the Customer Domain (IA64x1 - setup 1), according to the injection rate and JVM used.
ChangeOrder
0
1
2
3
4
5
6
1 2 4 6 8 10 12 14
Injection Rate (tx)
Res
pons
e Ti
me
(s)
JRockit
Sun JDK 1.4.2
Sun JDK 1.4.1(35min RampUp)
Figure 12: Time taken for a ChangeOrder Transaction to complete in the Customer Domain (IA64x1 - setup 1), according to the injection rate and JVM used.
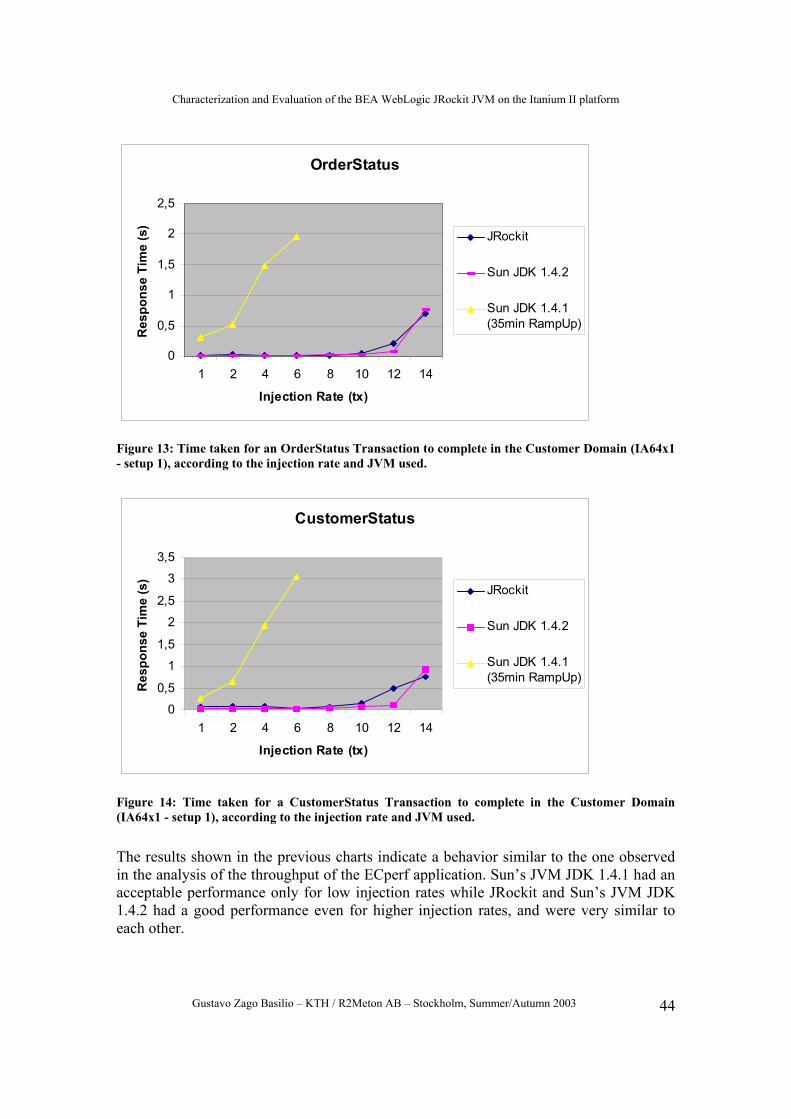
Characterization and Evaluation of the BEA WebLogic JRockit JVM on the Itanium II platform
Gustavo Zago Basilio – KTH / R2Meton AB – Stockholm, Summer/Autumn 2003 44
OrderStatus
0
0,5
1
1,5
2
2,5
1 2 4 6 8 10 12 14
Injection Rate (tx)
Res
pons
e Ti
me
(s)
JRockit
Sun JDK 1.4.2
Sun JDK 1.4.1(35min RampUp)
Figure 13: Time taken for an OrderStatus Transaction to complete in the Customer Domain (IA64x1 - setup 1), according to the injection rate and JVM used.
CustomerStatus
00,5
11,5
22,5
33,5
1 2 4 6 8 10 12 14
Injection Rate (tx)
Res
pons
e Ti
me
(s)
JRockit
Sun JDK 1.4.2
Sun JDK 1.4.1(35min RampUp)
Figure 14: Time taken for a CustomerStatus Transaction to complete in the Customer Domain (IA64x1 - setup 1), according to the injection rate and JVM used.
The results shown in the previous charts indicate a behavior similar to the one observed in the analysis of the throughput of the ECperf application. Sun’s JVM JDK 1.4.1 had an acceptable performance only for low injection rates while JRockit and Sun’s JVM JDK 1.4.2 had a good performance even for higher injection rates, and were very similar to each other.
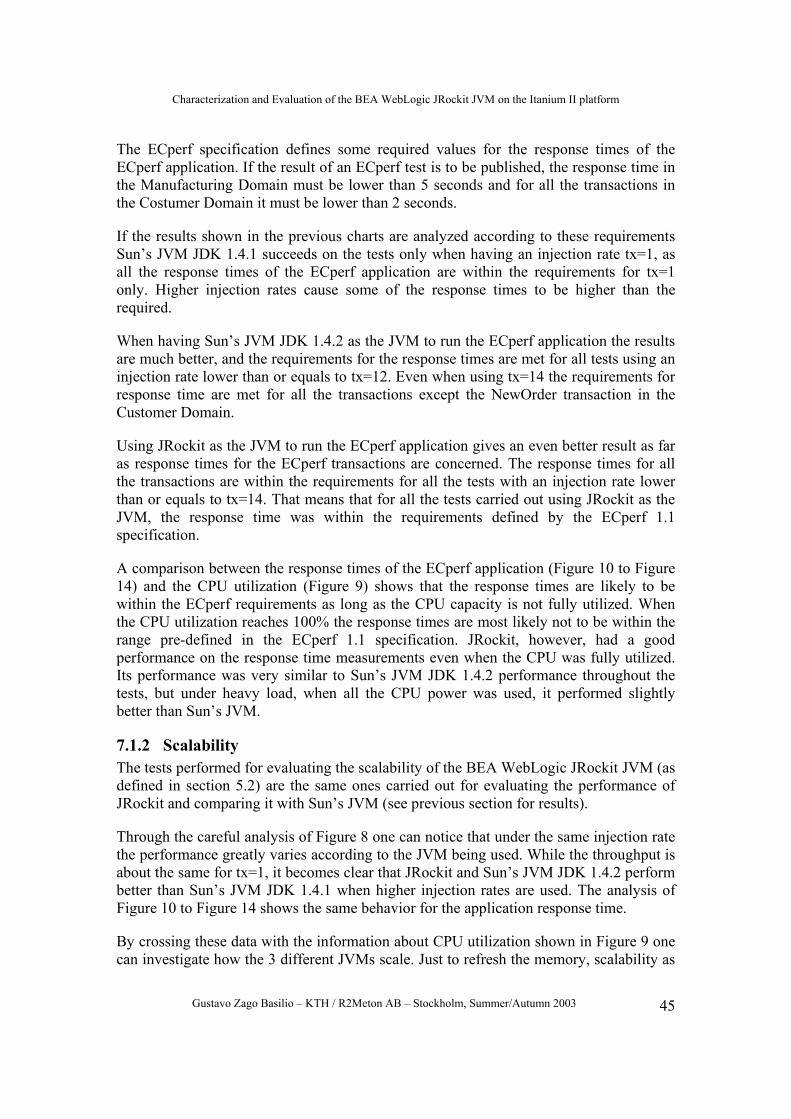
Characterization and Evaluation of the BEA WebLogic JRockit JVM on the Itanium II platform
Gustavo Zago Basilio – KTH / R2Meton AB – Stockholm, Summer/Autumn 2003 45
The ECperf specification defines some required values for the response times of the ECperf application. If the result of an ECperf test is to be published, the response time in the Manufacturing Domain must be lower than 5 seconds and for all the transactions in the Costumer Domain it must be lower than 2 seconds.
If the results shown in the previous charts are analyzed according to these requirements Sun’s JVM JDK 1.4.1 succeeds on the tests only when having an injection rate tx=1, as all the response times of the ECperf application are within the requirements for tx=1 only. Higher injection rates cause some of the response times to be higher than the required.
When having Sun’s JVM JDK 1.4.2 as the JVM to run the ECperf application the results are much better, and the requirements for the response times are met for all tests using an injection rate lower than or equals to tx=12. Even when using tx=14 the requirements for response time are met for all the transactions except the NewOrder transaction in the Customer Domain.
Using JRockit as the JVM to run the ECperf application gives an even better result as far as response times for the ECperf transactions are concerned. The response times for all the transactions are within the requirements for all the tests with an injection rate lower than or equals to tx=14. That means that for all the tests carried out using JRockit as the JVM, the response time was within the requirements defined by the ECperf 1.1 specification.
A comparison between the response times of the ECperf application (Figure 10 to Figure 14) and the CPU utilization (Figure 9) shows that the response times are likely to be within the ECperf requirements as long as the CPU capacity is not fully utilized. When the CPU utilization reaches 100% the response times are most likely not to be within the range pre-defined in the ECperf 1.1 specification. JRockit, however, had a good performance on the response time measurements even when the CPU was fully utilized. Its performance was very similar to Sun’s JVM JDK 1.4.2 performance throughout the tests, but under heavy load, when all the CPU power was used, it performed slightly better than Sun’s JVM.
7.1.2 Scalability The tests performed for evaluating the scalability of the BEA WebLogic JRockit JVM (as defined in section 5.2) are the same ones carried out for evaluating the performance of JRockit and comparing it with Sun’s JVM (see previous section for results).
Through the careful analysis of Figure 8 one can notice that under the same injection rate the performance greatly varies according to the JVM being used. While the throughput is about the same for tx=1, it becomes clear that JRockit and Sun’s JVM JDK 1.4.2 perform better than Sun’s JVM JDK 1.4.1 when higher injection rates are used. The analysis of Figure 10 to Figure 14 shows the same behavior for the application response time.
By crossing these data with the information about CPU utilization shown in Figure 9 one can investigate how the 3 different JVMs scale. Just to refresh the memory, scalability as
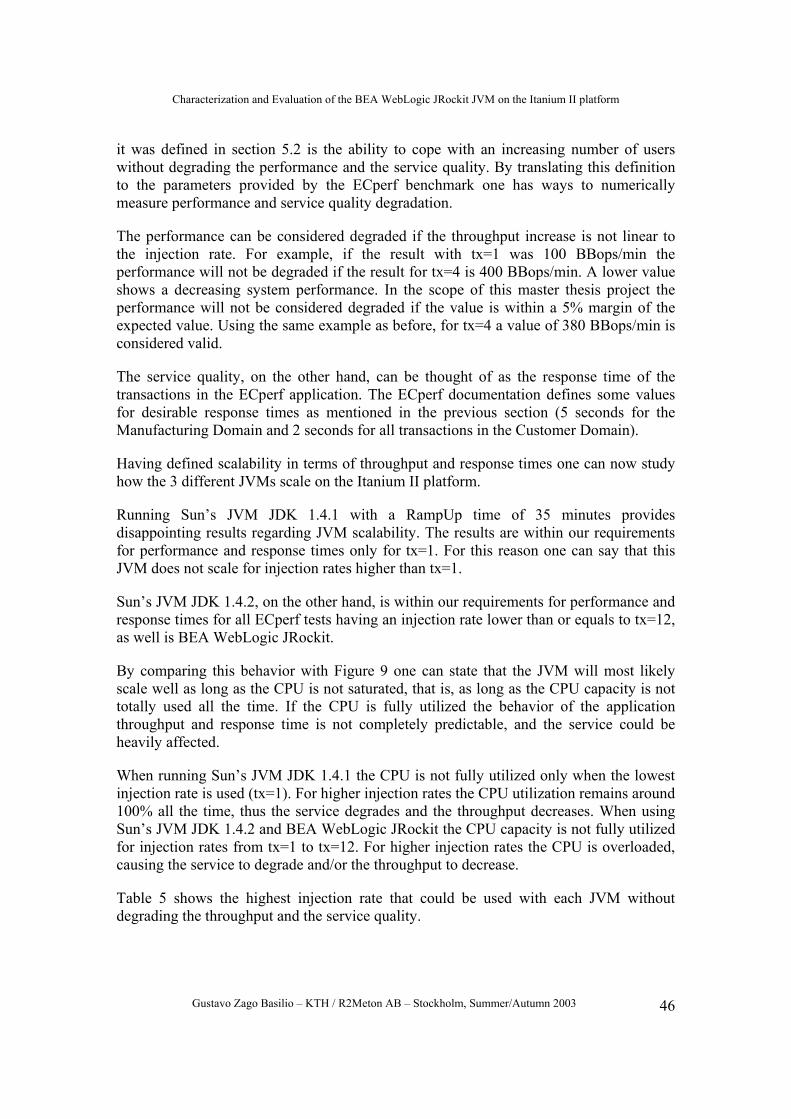
Characterization and Evaluation of the BEA WebLogic JRockit JVM on the Itanium II platform
Gustavo Zago Basilio – KTH / R2Meton AB – Stockholm, Summer/Autumn 2003 46
it was defined in section 5.2 is the ability to cope with an increasing number of users without degrading the performance and the service quality. By translating this definition to the parameters provided by the ECperf benchmark one has ways to numerically measure performance and service quality degradation.
The performance can be considered degraded if the throughput increase is not linear to the injection rate. For example, if the result with tx=1 was 100 BBops/min the performance will not be degraded if the result for tx=4 is 400 BBops/min. A lower value shows a decreasing system performance. In the scope of this master thesis project the performance will not be considered degraded if the value is within a 5% margin of the expected value. Using the same example as before, for tx=4 a value of 380 BBops/min is considered valid.
The service quality, on the other hand, can be thought of as the response time of the transactions in the ECperf application. The ECperf documentation defines some values for desirable response times as mentioned in the previous section (5 seconds for the Manufacturing Domain and 2 seconds for all transactions in the Customer Domain).
Having defined scalability in terms of throughput and response times one can now study how the 3 different JVMs scale on the Itanium II platform.
Running Sun’s JVM JDK 1.4.1 with a RampUp time of 35 minutes provides disappointing results regarding JVM scalability. The results are within our requirements for performance and response times only for tx=1. For this reason one can say that this JVM does not scale for injection rates higher than tx=1.
Sun’s JVM JDK 1.4.2, on the other hand, is within our requirements for performance and response times for all ECperf tests having an injection rate lower than or equals to tx=12, as well is BEA WebLogic JRockit.
By comparing this behavior with Figure 9 one can state that the JVM will most likely scale well as long as the CPU is not saturated, that is, as long as the CPU capacity is not totally used all the time. If the CPU is fully utilized the behavior of the application throughput and response time is not completely predictable, and the service could be heavily affected.
When running Sun’s JVM JDK 1.4.1 the CPU is not fully utilized only when the lowest injection rate is used (tx=1). For higher injection rates the CPU utilization remains around 100% all the time, thus the service degrades and the throughput decreases. When using Sun’s JVM JDK 1.4.2 and BEA WebLogic JRockit the CPU capacity is not fully utilized for injection rates from tx=1 to tx=12. For higher injection rates the CPU is overloaded, causing the service to degrade and/or the throughput to decrease.
Table 5 shows the highest injection rate that could be used with each JVM without degrading the throughput and the service quality.
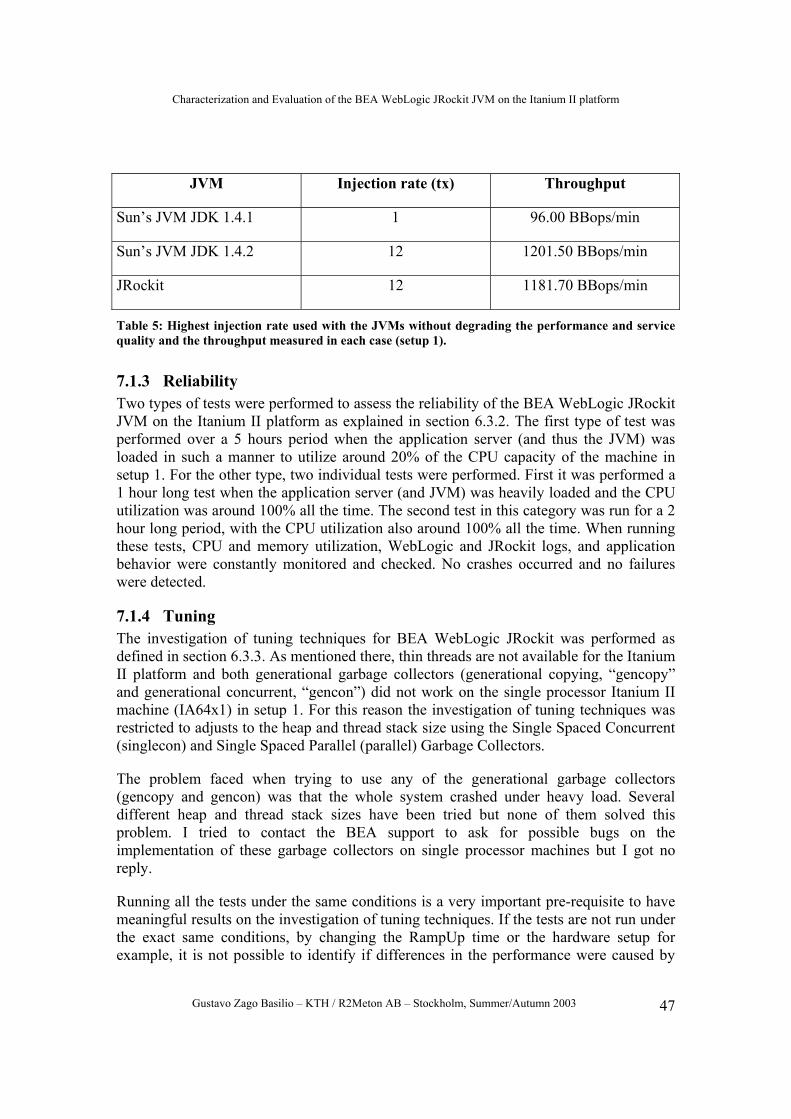
Characterization and Evaluation of the BEA WebLogic JRockit JVM on the Itanium II platform
Gustavo Zago Basilio – KTH / R2Meton AB – Stockholm, Summer/Autumn 2003 47
JVM Injection rate (tx) Throughput
Sun’s JVM JDK 1.4.1 1 96.00 BBops/min
Sun’s JVM JDK 1.4.2 12 1201.50 BBops/min
JRockit 12 1181.70 BBops/min
Table 5: Highest injection rate used with the JVMs without degrading the performance and service quality and the throughput measured in each case (setup 1).
7.1.3 Reliability Two types of tests were performed to assess the reliability of the BEA WebLogic JRockit JVM on the Itanium II platform as explained in section 6.3.2. The first type of test was performed over a 5 hours period when the application server (and thus the JVM) was loaded in such a manner to utilize around 20% of the CPU capacity of the machine in setup 1. For the other type, two individual tests were performed. First it was performed a 1 hour long test when the application server (and JVM) was heavily loaded and the CPU utilization was around 100% all the time. The second test in this category was run for a 2 hour long period, with the CPU utilization also around 100% all the time. When running these tests, CPU and memory utilization, WebLogic and JRockit logs, and application behavior were constantly monitored and checked. No crashes occurred and no failures were detected.
7.1.4 Tuning The investigation of tuning techniques for BEA WebLogic JRockit was performed as defined in section 6.3.3. As mentioned there, thin threads are not available for the Itanium II platform and both generational garbage collectors (generational copying, “gencopy” and generational concurrent, “gencon”) did not work on the single processor Itanium II machine (IA64x1) in setup 1. For this reason the investigation of tuning techniques was restricted to adjusts to the heap and thread stack size using the Single Spaced Concurrent (singlecon) and Single Spaced Parallel (parallel) Garbage Collectors.
The problem faced when trying to use any of the generational garbage collectors (gencopy and gencon) was that the whole system crashed under heavy load. Several different heap and thread stack sizes have been tried but none of them solved this problem. I tried to contact the BEA support to ask for possible bugs on the implementation of these garbage collectors on single processor machines but I got no reply.
Running all the tests under the same conditions is a very important pre-requisite to have meaningful results on the investigation of tuning techniques. If the tests are not run under the exact same conditions, by changing the RampUp time or the hardware setup for example, it is not possible to identify if differences in the performance were caused by
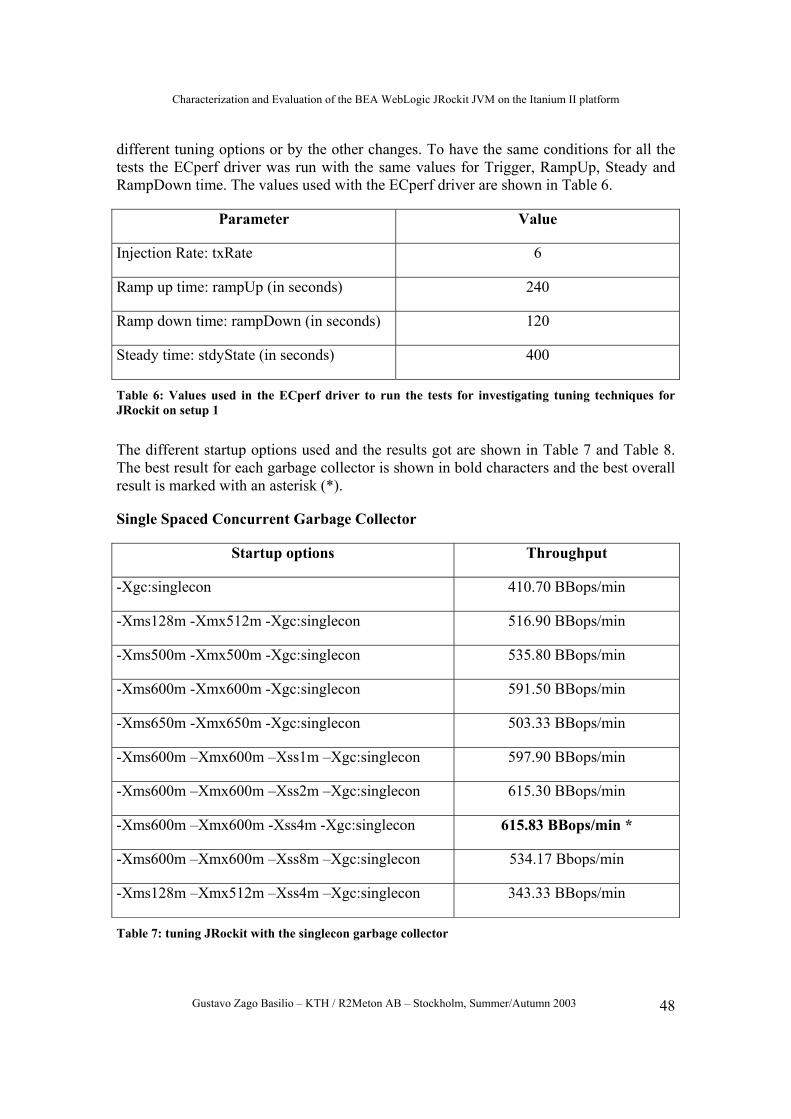
Characterization and Evaluation of the BEA WebLogic JRockit JVM on the Itanium II platform
Gustavo Zago Basilio – KTH / R2Meton AB – Stockholm, Summer/Autumn 2003 48
different tuning options or by the other changes. To have the same conditions for all the tests the ECperf driver was run with the same values for Trigger, RampUp, Steady and RampDown time. The values used with the ECperf driver are shown in Table 6.
Parameter Value
Injection Rate: txRate 6
Ramp up time: rampUp (in seconds) 240
Ramp down time: rampDown (in seconds) 120
Steady time: stdyState (in seconds) 400
Table 6: Values used in the ECperf driver to run the tests for investigating tuning techniques for JRockit on setup 1
The different startup options used and the results got are shown in Table 7 and Table 8. The best result for each garbage collector is shown in bold characters and the best overall result is marked with an asterisk (*).
Single Spaced Concurrent Garbage Collector
Startup options Throughput
-Xgc:singlecon 410.70 BBops/min
-Xms128m -Xmx512m -Xgc:singlecon 516.90 BBops/min
-Xms500m -Xmx500m -Xgc:singlecon 535.80 BBops/min
-Xms600m -Xmx600m -Xgc:singlecon 591.50 BBops/min
-Xms650m -Xmx650m -Xgc:singlecon 503.33 BBops/min
-Xms600m –Xmx600m –Xss1m –Xgc:singlecon 597.90 BBops/min
-Xms600m –Xmx600m –Xss2m –Xgc:singlecon 615.30 BBops/min
-Xms600m –Xmx600m -Xss4m -Xgc:singlecon 615.83 BBops/min *
-Xms600m –Xmx600m –Xss8m –Xgc:singlecon 534.17 Bbops/min
-Xms128m –Xmx512m –Xss4m –Xgc:singlecon 343.33 BBops/min
Table 7: tuning JRockit with the singlecon garbage collector
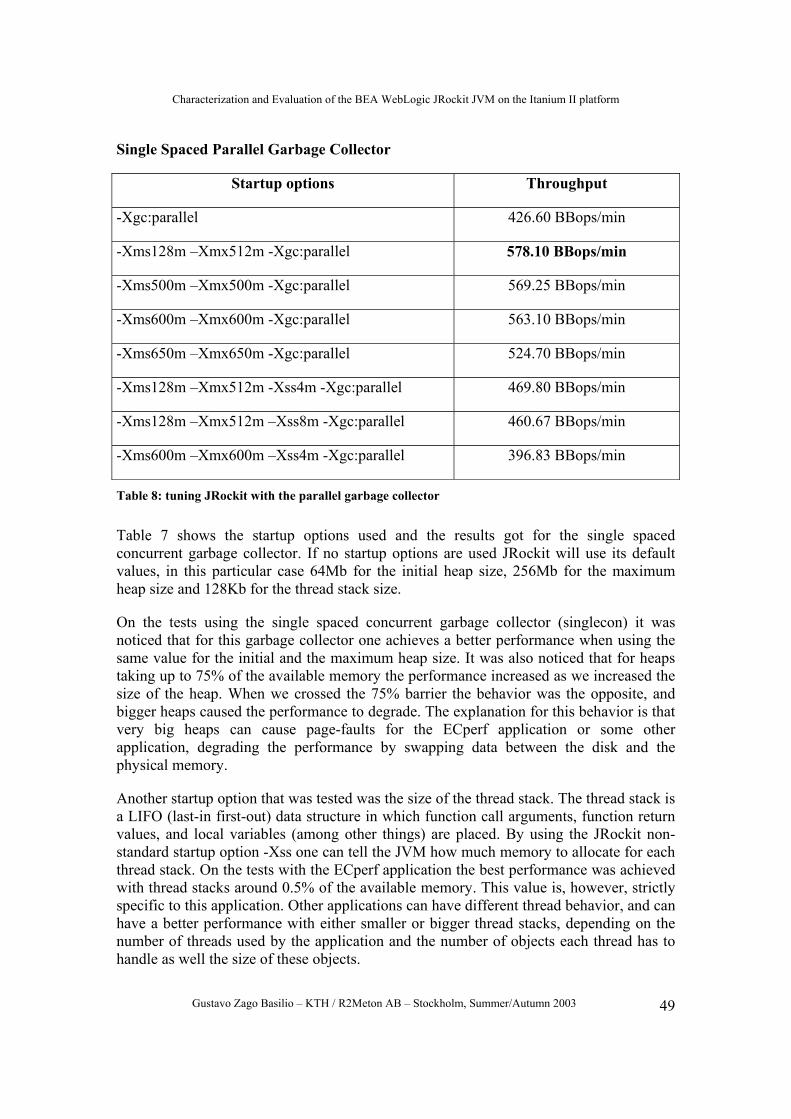
Characterization and Evaluation of the BEA WebLogic JRockit JVM on the Itanium II platform
Gustavo Zago Basilio – KTH / R2Meton AB – Stockholm, Summer/Autumn 2003 49
Single Spaced Parallel Garbage Collector
Startup options Throughput
-Xgc:parallel 426.60 BBops/min
-Xms128m –Xmx512m -Xgc:parallel 578.10 BBops/min
-Xms500m –Xmx500m -Xgc:parallel 569.25 BBops/min
-Xms600m –Xmx600m -Xgc:parallel 563.10 BBops/min
-Xms650m –Xmx650m -Xgc:parallel 524.70 BBops/min
-Xms128m –Xmx512m -Xss4m -Xgc:parallel 469.80 BBops/min
-Xms128m –Xmx512m –Xss8m -Xgc:parallel 460.67 BBops/min
-Xms600m –Xmx600m –Xss4m -Xgc:parallel 396.83 BBops/min
Table 8: tuning JRockit with the parallel garbage collector
Table 7 shows the startup options used and the results got for the single spaced concurrent garbage collector. If no startup options are used JRockit will use its default values, in this particular case 64Mb for the initial heap size, 256Mb for the maximum heap size and 128Kb for the thread stack size.
On the tests using the single spaced concurrent garbage collector (singlecon) it was noticed that for this garbage collector one achieves a better performance when using the same value for the initial and the maximum heap size. It was also noticed that for heaps taking up to 75% of the available memory the performance increased as we increased the size of the heap. When we crossed the 75% barrier the behavior was the opposite, and bigger heaps caused the performance to degrade. The explanation for this behavior is that very big heaps can cause page-faults for the ECperf application or some other application, degrading the performance by swapping data between the disk and the physical memory.
Another startup option that was tested was the size of the thread stack. The thread stack is a LIFO (last-in first-out) data structure in which function call arguments, function return values, and local variables (among other things) are placed. By using the JRockit non-standard startup option -Xss one can tell the JVM how much memory to allocate for each thread stack. On the tests with the ECperf application the best performance was achieved with thread stacks around 0.5% of the available memory. This value is, however, strictly specific to this application. Other applications can have different thread behavior, and can have a better performance with either smaller or bigger thread stacks, depending on the number of threads used by the application and the number of objects each thread has to handle as well the size of these objects.
Characterization and Evaluation of the BEA WebLogic JRockit JVM on the Itanium II platform
Gustavo Zago Basilio – KTH / R2Meton AB – Stockholm, Summer/Autumn 2003 50
On the tests performed using the single spaced parallel garbage collector (Table 8) the results were slightly different. Whereas we achieved the best performance for the singlecon garbage collector when having the same value for the initial and maximum heap size, the parallel garbage collector had a different behavior and the best performance was achieved with a small (-Xms128m, 16% of available memory) initial and a high (-Xmx512m, 64% of available memory) maximum heap size. In addition, no performance increase was noticed for bigger thread stack sizes, and the default size of 128Kb (0.016% of available memory) proved to be the one that achieved the best performance. However, all the results for the parallel garbage collector were worse than the best one for the singlecon garbage collector.
The tests performed for investigating tuning techniques for JRockit show how important it is to tune the JVM for the underlying system it is executing on. Great performance increase can be achieved just by instructing the JVM how much memory to allocated for the heap or for each thread. In the particular case studied here a throughput improvement of about 50% was achieved for the singlecon garbage collector when the best result is compared to the result of running this very same garbage collector with no other startup options, thus leaving to JRockit the responsibility of adapting itself automatically to the underlying system. When using the parallel garbage collector the throughput increase was almost 36%.
7.2 Setup 2 Setup 2 had the application server (BEA WebLogic) and the DBMS (Oracle) hosted in different machines, as shown in Figure 7. The behavior of JRockit and Sun’s JVM on this configuration was not investigated as extensively as on setup 1 because the time window allocated for me to use the IA64x4 machine was short. However, the same tests performed for setup 1 were carried out for setup 2, as well as some other representative tests, as the application performance when having an application server cluster, testing the generational garbage collectors and testing the performance of the application for different load balance algorithms when having an application server cluster (see the Appendix II, section 11.2 for details).
7.2.1 Performance The approach to measure performance and scalability on setup 2 was the same used for setup 1 and defined in section 6.3.1. However, due to the higher processing capacity of this setup, higher injection rates were used to characterize the behavior of JRockit and Sun’s JVM,
Moreover, two different application server configurations were tested on setup 2. The first one is the same used for all the tests on setup 1: a single server configuration, that is, there is only one instance of the application server running on the machine and being responsible for handling all the requests. The second configuration tested was an application server cluster. Clusters provide higher availability and reliability, as well as load balancing capabilities. The WebLogic cluster configured in the IA64x4 machine for the tests was made of 2 managed servers where the ECperf application was deployed and
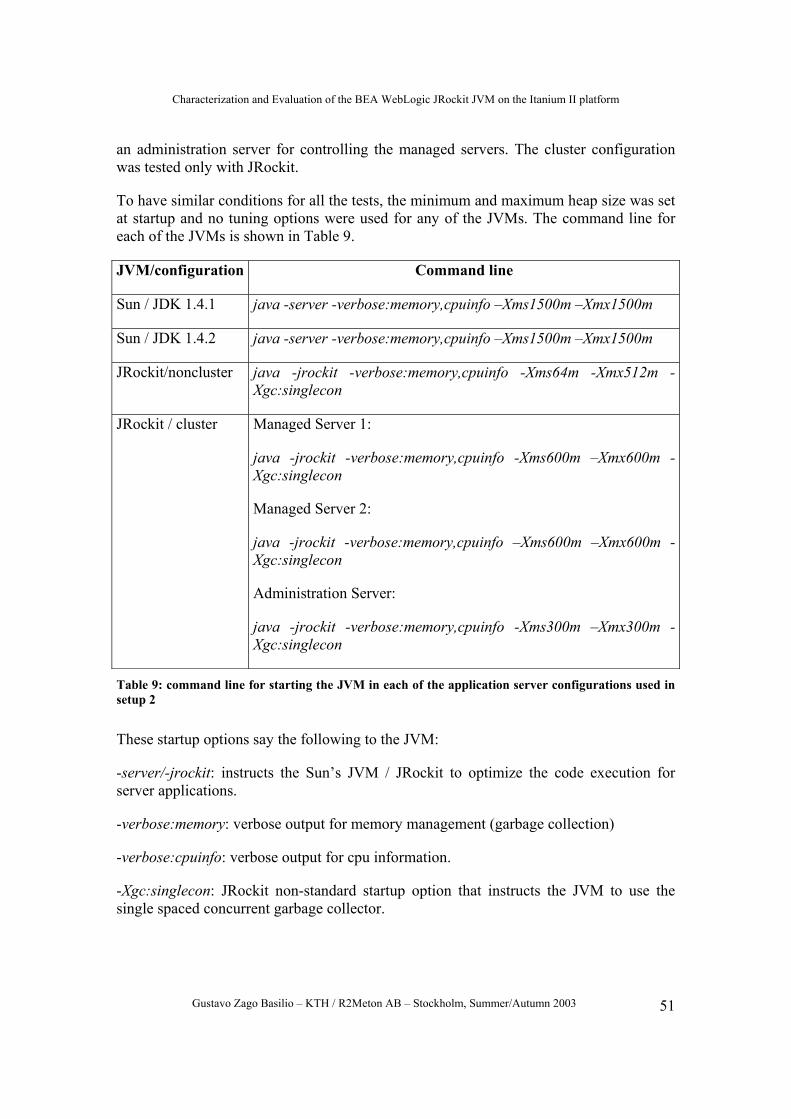
Characterization and Evaluation of the BEA WebLogic JRockit JVM on the Itanium II platform
Gustavo Zago Basilio – KTH / R2Meton AB – Stockholm, Summer/Autumn 2003 51
an administration server for controlling the managed servers. The cluster configuration was tested only with JRockit.
To have similar conditions for all the tests, the minimum and maximum heap size was set at startup and no tuning options were used for any of the JVMs. The command line for each of the JVMs is shown in Table 9.
JVM/configuration Command line
Sun / JDK 1.4.1 java -server -verbose:memory,cpuinfo –Xms1500m –Xmx1500m
Sun / JDK 1.4.2 java -server -verbose:memory,cpuinfo –Xms1500m –Xmx1500m
JRockit/noncluster java -jrockit -verbose:memory,cpuinfo -Xms64m -Xmx512m -Xgc:singlecon
JRockit / cluster Managed Server 1:
java -jrockit -verbose:memory,cpuinfo -Xms600m –Xmx600m -Xgc:singlecon
Managed Server 2:
java -jrockit -verbose:memory,cpuinfo –Xms600m –Xmx600m -Xgc:singlecon
Administration Server:
java -jrockit -verbose:memory,cpuinfo -Xms300m –Xmx300m -Xgc:singlecon
Table 9: command line for starting the JVM in each of the application server configurations used in setup 2
These startup options say the following to the JVM:
-server/-jrockit: instructs the Sun’s JVM / JRockit to optimize the code execution for server applications.
-verbose:memory: verbose output for memory management (garbage collection)
-verbose:cpuinfo: verbose output for cpu information.
-Xgc:singlecon: JRockit non-standard startup option that instructs the JVM to use the single spaced concurrent garbage collector.
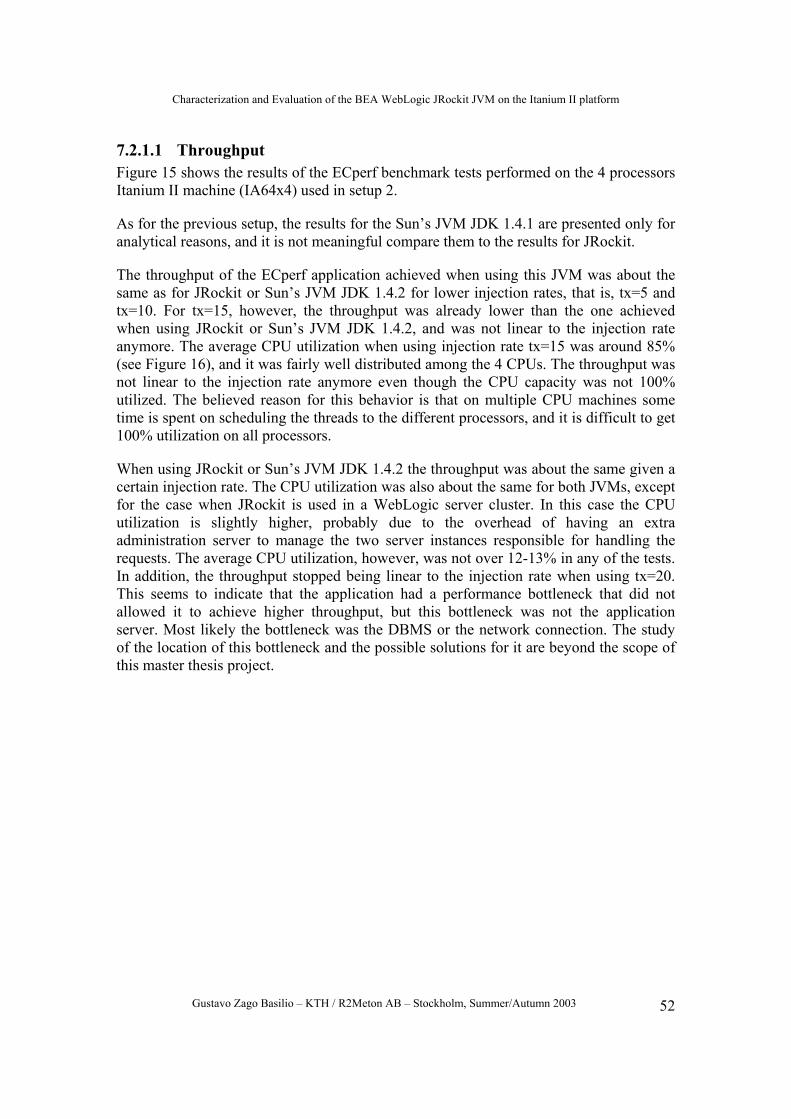
Characterization and Evaluation of the BEA WebLogic JRockit JVM on the Itanium II platform
Gustavo Zago Basilio – KTH / R2Meton AB – Stockholm, Summer/Autumn 2003 52
7.2.1.1 Throughput Figure 15 shows the results of the ECperf benchmark tests performed on the 4 processors Itanium II machine (IA64x4) used in setup 2.
As for the previous setup, the results for the Sun’s JVM JDK 1.4.1 are presented only for analytical reasons, and it is not meaningful compare them to the results for JRockit.
The throughput of the ECperf application achieved when using this JVM was about the same as for JRockit or Sun’s JVM JDK 1.4.2 for lower injection rates, that is, tx=5 and tx=10. For tx=15, however, the throughput was already lower than the one achieved when using JRockit or Sun’s JVM JDK 1.4.2, and was not linear to the injection rate anymore. The average CPU utilization when using injection rate tx=15 was around 85% (see Figure 16), and it was fairly well distributed among the 4 CPUs. The throughput was not linear to the injection rate anymore even though the CPU capacity was not 100% utilized. The believed reason for this behavior is that on multiple CPU machines some time is spent on scheduling the threads to the different processors, and it is difficult to get 100% utilization on all processors.
When using JRockit or Sun’s JVM JDK 1.4.2 the throughput was about the same given a certain injection rate. The CPU utilization was also about the same for both JVMs, except for the case when JRockit is used in a WebLogic server cluster. In this case the CPU utilization is slightly higher, probably due to the overhead of having an extra administration server to manage the two server instances responsible for handling the requests. The average CPU utilization, however, was not over 12-13% in any of the tests. In addition, the throughput stopped being linear to the injection rate when using tx=20. This seems to indicate that the application had a performance bottleneck that did not allowed it to achieve higher throughput, but this bottleneck was not the application server. Most likely the bottleneck was the DBMS or the network connection. The study of the location of this bottleneck and the possible solutions for it are beyond the scope of this master thesis project.
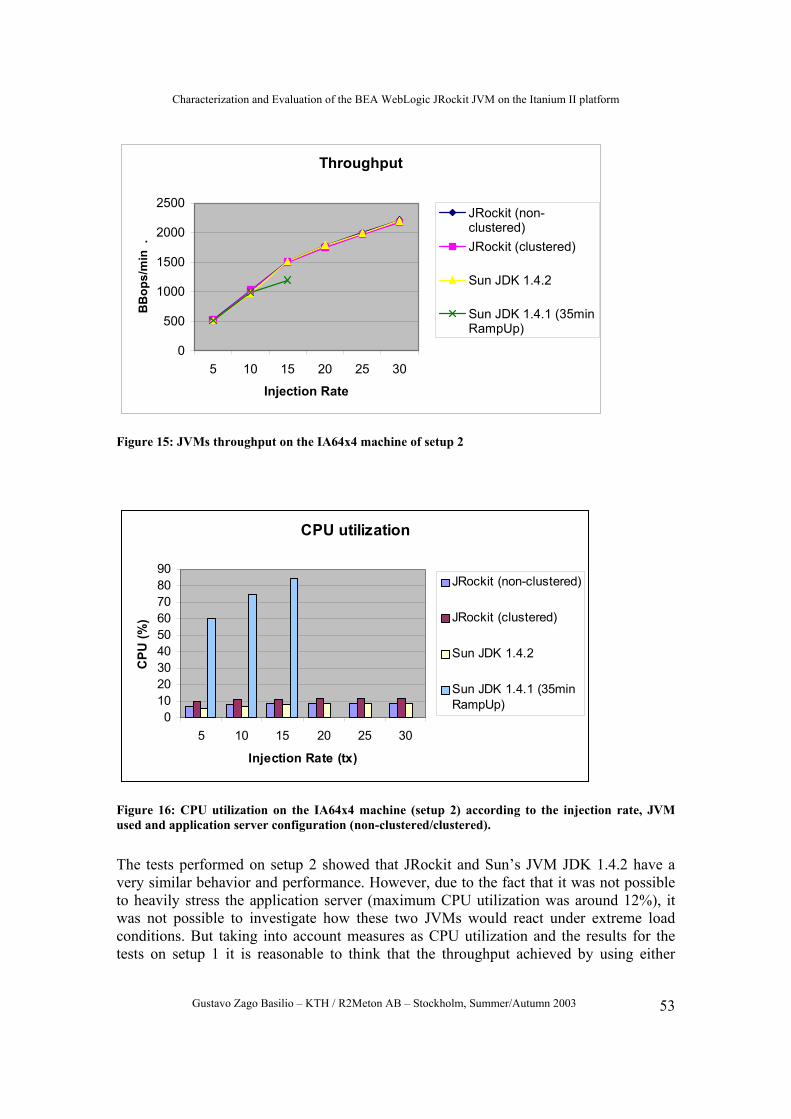
Characterization and Evaluation of the BEA WebLogic JRockit JVM on the Itanium II platform
Gustavo Zago Basilio – KTH / R2Meton AB – Stockholm, Summer/Autumn 2003 53
Throughput
0
500
1000
1500
2000
2500
5 10 15 20 25 30
Injection Rate
BB
ops/
min
.
JRockit (non-clustered)JRockit (clustered)
Sun JDK 1.4.2
Sun JDK 1.4.1 (35minRampUp)
Figure 15: JVMs throughput on the IA64x4 machine of setup 2
CPU utilization
0102030405060708090
5 10 15 20 25 30
Injection Rate (tx)
CPU
(%) .
JRockit (non-clustered)
JRockit (clustered)
Sun JDK 1.4.2
Sun JDK 1.4.1 (35minRampUp)
Figure 16: CPU utilization on the IA64x4 machine (setup 2) according to the injection rate, JVM used and application server configuration (non-clustered/clustered).
The tests performed on setup 2 showed that JRockit and Sun’s JVM JDK 1.4.2 have a very similar behavior and performance. However, due to the fact that it was not possible to heavily stress the application server (maximum CPU utilization was around 12%), it was not possible to investigate how these two JVMs would react under extreme load conditions. But taking into account measures as CPU utilization and the results for the tests on setup 1 it is reasonable to think that the throughput achieved by using either
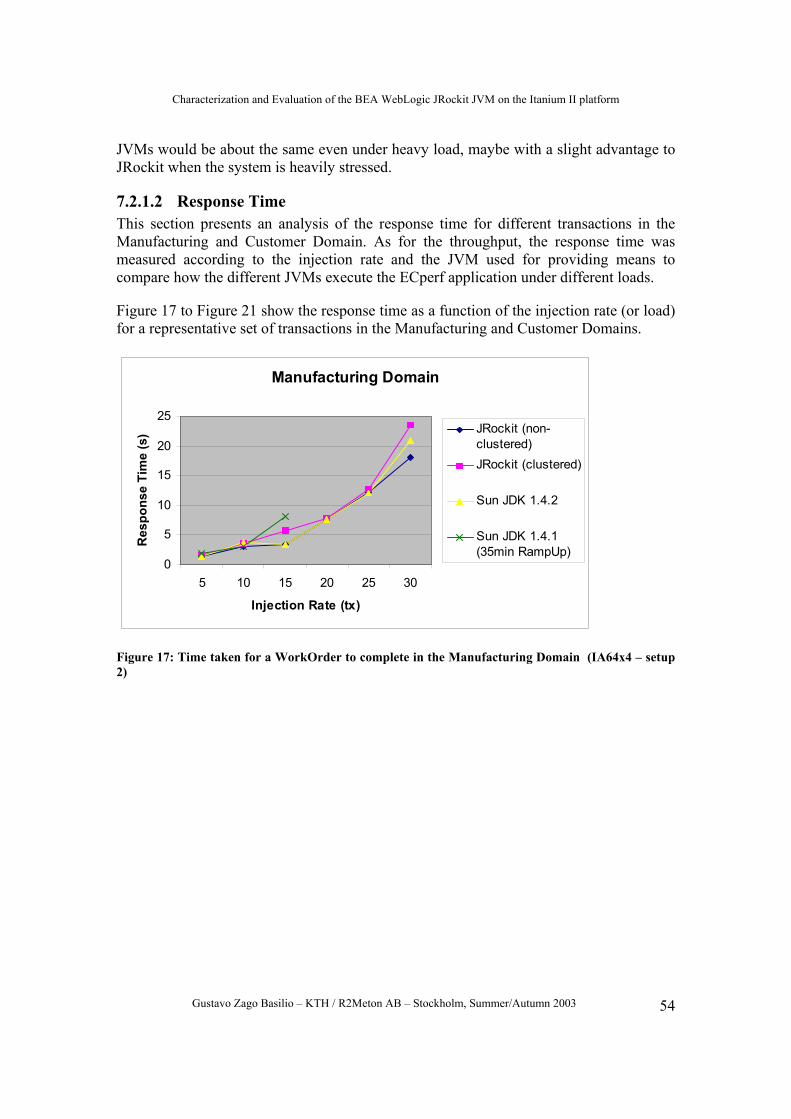
Characterization and Evaluation of the BEA WebLogic JRockit JVM on the Itanium II platform
Gustavo Zago Basilio – KTH / R2Meton AB – Stockholm, Summer/Autumn 2003 54
JVMs would be about the same even under heavy load, maybe with a slight advantage to JRockit when the system is heavily stressed.
7.2.1.2 Response Time This section presents an analysis of the response time for different transactions in the Manufacturing and Customer Domain. As for the throughput, the response time was measured according to the injection rate and the JVM used for providing means to compare how the different JVMs execute the ECperf application under different loads.
Figure 17 to Figure 21 show the response time as a function of the injection rate (or load) for a representative set of transactions in the Manufacturing and Customer Domains.
Manufacturing Domain
0
5
10
15
20
25
5 10 15 20 25 30
Injection Rate (tx)
Res
pons
e Ti
me
(s) JRockit (non-
clustered)JRockit (clustered)
Sun JDK 1.4.2
Sun JDK 1.4.1(35min RampUp)
Figure 17: Time taken for a WorkOrder to complete in the Manufacturing Domain (IA64x4 – setup 2)
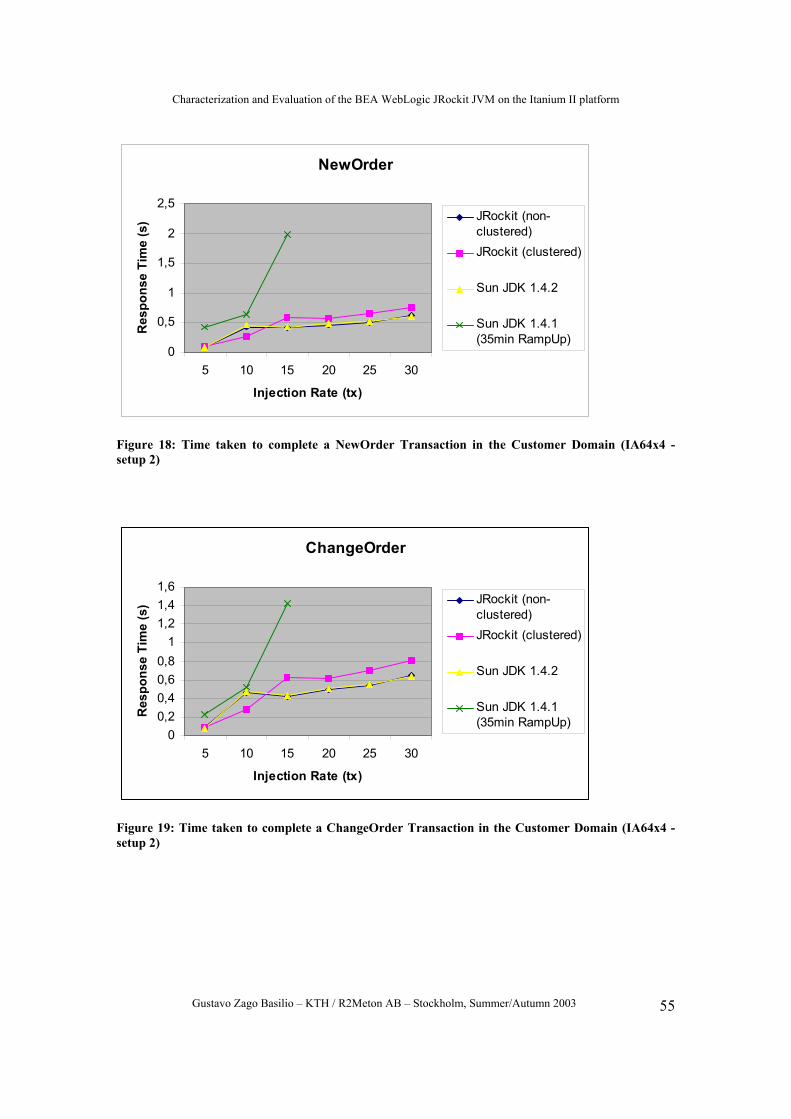
Characterization and Evaluation of the BEA WebLogic JRockit JVM on the Itanium II platform
Gustavo Zago Basilio – KTH / R2Meton AB – Stockholm, Summer/Autumn 2003 55
NewOrder
0
0,5
1
1,5
2
2,5
5 10 15 20 25 30
Injection Rate (tx)
Res
pons
e Ti
me
(s) JRockit (non-
clustered)JRockit (clustered)
Sun JDK 1.4.2
Sun JDK 1.4.1(35min RampUp)
Figure 18: Time taken to complete a NewOrder Transaction in the Customer Domain (IA64x4 - setup 2)
ChangeOrder
00,20,40,60,8
11,21,41,6
5 10 15 20 25 30
Injection Rate (tx)
Res
pons
e Ti
me
(s) JRockit (non-
clustered)JRockit (clustered)
Sun JDK 1.4.2
Sun JDK 1.4.1(35min RampUp)
Figure 19: Time taken to complete a ChangeOrder Transaction in the Customer Domain (IA64x4 - setup 2)
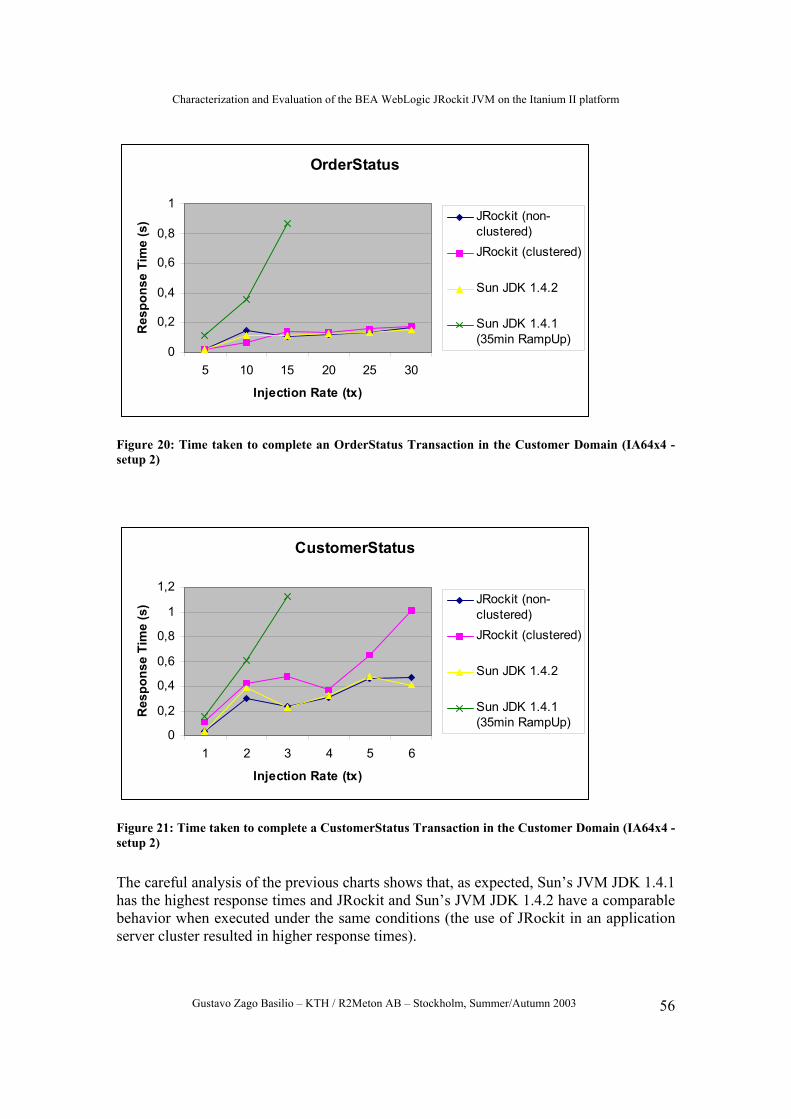
Characterization and Evaluation of the BEA WebLogic JRockit JVM on the Itanium II platform
Gustavo Zago Basilio – KTH / R2Meton AB – Stockholm, Summer/Autumn 2003 56
OrderStatus
0
0,2
0,4
0,6
0,8
1
5 10 15 20 25 30
Injection Rate (tx)
Res
pons
e Ti
me
(s) JRockit (non-
clustered)JRockit (clustered)
Sun JDK 1.4.2
Sun JDK 1.4.1(35min RampUp)
Figure 20: Time taken to complete an OrderStatus Transaction in the Customer Domain (IA64x4 - setup 2)
CustomerStatus
0
0,2
0,4
0,6
0,8
1
1,2
1 2 3 4 5 6
Injection Rate (tx)
Res
pons
e Ti
me
(s) JRockit (non-
clustered)JRockit (clustered)
Sun JDK 1.4.2
Sun JDK 1.4.1(35min RampUp)
Figure 21: Time taken to complete a CustomerStatus Transaction in the Customer Domain (IA64x4 - setup 2)
The careful analysis of the previous charts shows that, as expected, Sun’s JVM JDK 1.4.1 has the highest response times and JRockit and Sun’s JVM JDK 1.4.2 have a comparable behavior when executed under the same conditions (the use of JRockit in an application server cluster resulted in higher response times).
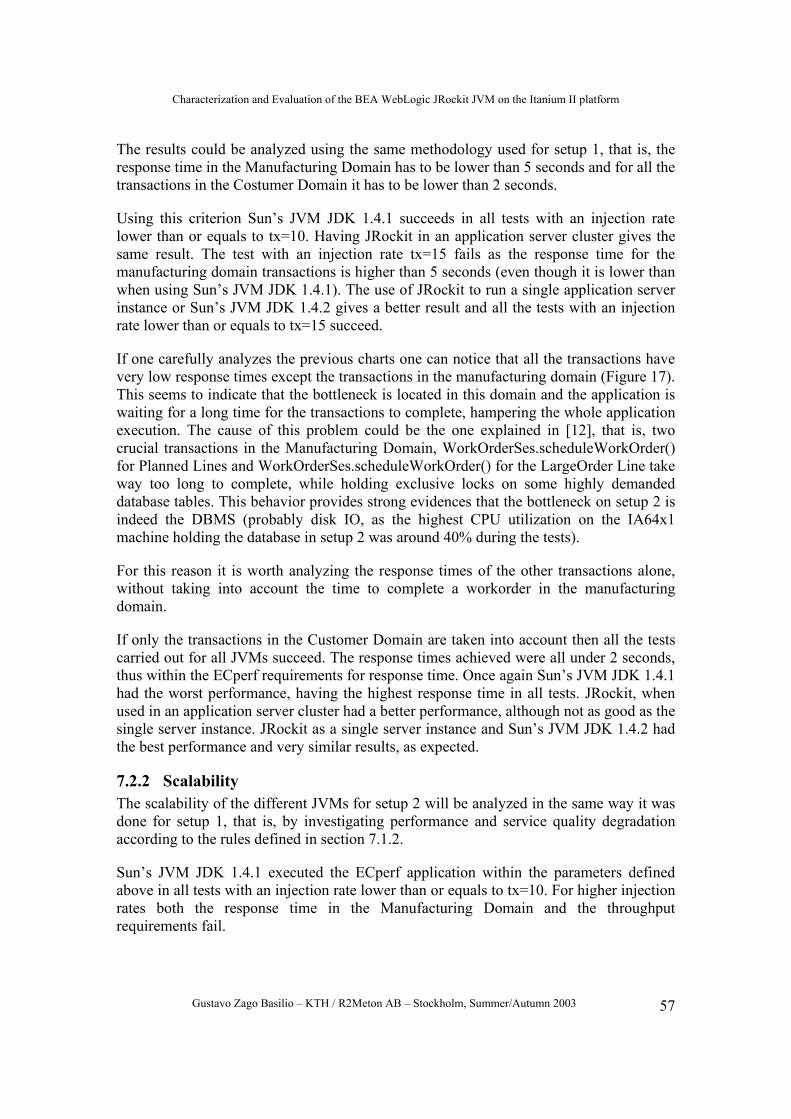
Characterization and Evaluation of the BEA WebLogic JRockit JVM on the Itanium II platform
Gustavo Zago Basilio – KTH / R2Meton AB – Stockholm, Summer/Autumn 2003 57
The results could be analyzed using the same methodology used for setup 1, that is, the response time in the Manufacturing Domain has to be lower than 5 seconds and for all the transactions in the Costumer Domain it has to be lower than 2 seconds.
Using this criterion Sun’s JVM JDK 1.4.1 succeeds in all tests with an injection rate lower than or equals to tx=10. Having JRockit in an application server cluster gives the same result. The test with an injection rate tx=15 fails as the response time for the manufacturing domain transactions is higher than 5 seconds (even though it is lower than when using Sun’s JVM JDK 1.4.1). The use of JRockit to run a single application server instance or Sun’s JVM JDK 1.4.2 gives a better result and all the tests with an injection rate lower than or equals to tx=15 succeed.
If one carefully analyzes the previous charts one can notice that all the transactions have very low response times except the transactions in the manufacturing domain (Figure 17). This seems to indicate that the bottleneck is located in this domain and the application is waiting for a long time for the transactions to complete, hampering the whole application execution. The cause of this problem could be the one explained in [12], that is, two crucial transactions in the Manufacturing Domain, WorkOrderSes.scheduleWorkOrder() for Planned Lines and WorkOrderSes.scheduleWorkOrder() for the LargeOrder Line take way too long to complete, while holding exclusive locks on some highly demanded database tables. This behavior provides strong evidences that the bottleneck on setup 2 is indeed the DBMS (probably disk IO, as the highest CPU utilization on the IA64x1 machine holding the database in setup 2 was around 40% during the tests).
For this reason it is worth analyzing the response times of the other transactions alone, without taking into account the time to complete a workorder in the manufacturing domain.
If only the transactions in the Customer Domain are taken into account then all the tests carried out for all JVMs succeed. The response times achieved were all under 2 seconds, thus within the ECperf requirements for response time. Once again Sun’s JVM JDK 1.4.1 had the worst performance, having the highest response time in all tests. JRockit, when used in an application server cluster had a better performance, although not as good as the single server instance. JRockit as a single server instance and Sun’s JVM JDK 1.4.2 had the best performance and very similar results, as expected.
7.2.2 Scalability The scalability of the different JVMs for setup 2 will be analyzed in the same way it was done for setup 1, that is, by investigating performance and service quality degradation according to the rules defined in section 7.1.2.
Sun’s JVM JDK 1.4.1 executed the ECperf application within the parameters defined above in all tests with an injection rate lower than or equals to tx=10. For higher injection rates both the response time in the Manufacturing Domain and the throughput requirements fail.
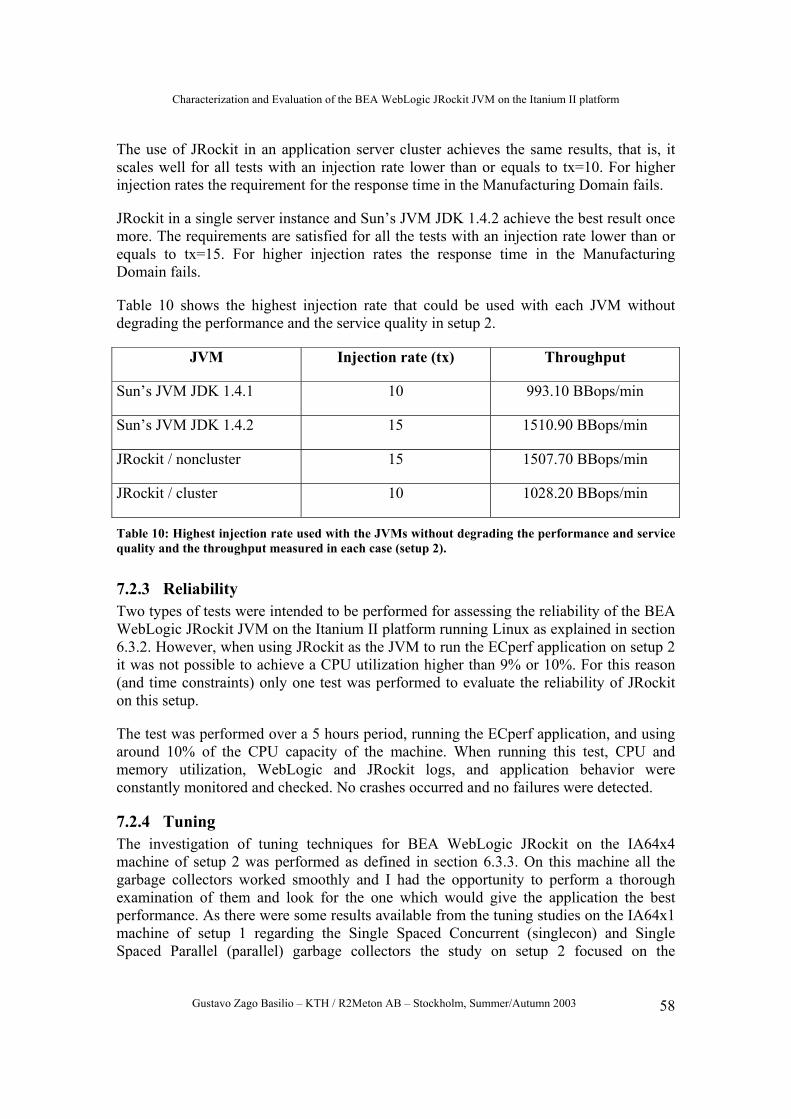
Characterization and Evaluation of the BEA WebLogic JRockit JVM on the Itanium II platform
Gustavo Zago Basilio – KTH / R2Meton AB – Stockholm, Summer/Autumn 2003 58
The use of JRockit in an application server cluster achieves the same results, that is, it scales well for all tests with an injection rate lower than or equals to tx=10. For higher injection rates the requirement for the response time in the Manufacturing Domain fails.
JRockit in a single server instance and Sun’s JVM JDK 1.4.2 achieve the best result once more. The requirements are satisfied for all the tests with an injection rate lower than or equals to tx=15. For higher injection rates the response time in the Manufacturing Domain fails.
Table 10 shows the highest injection rate that could be used with each JVM without degrading the performance and the service quality in setup 2.
JVM Injection rate (tx) Throughput
Sun’s JVM JDK 1.4.1 10 993.10 BBops/min
Sun’s JVM JDK 1.4.2 15 1510.90 BBops/min
JRockit / noncluster 15 1507.70 BBops/min
JRockit / cluster 10 1028.20 BBops/min
Table 10: Highest injection rate used with the JVMs without degrading the performance and service quality and the throughput measured in each case (setup 2).
7.2.3 Reliability Two types of tests were intended to be performed for assessing the reliability of the BEA WebLogic JRockit JVM on the Itanium II platform running Linux as explained in section 6.3.2. However, when using JRockit as the JVM to run the ECperf application on setup 2 it was not possible to achieve a CPU utilization higher than 9% or 10%. For this reason (and time constraints) only one test was performed to evaluate the reliability of JRockit on this setup.
The test was performed over a 5 hours period, running the ECperf application, and using around 10% of the CPU capacity of the machine. When running this test, CPU and memory utilization, WebLogic and JRockit logs, and application behavior were constantly monitored and checked. No crashes occurred and no failures were detected.
7.2.4 Tuning The investigation of tuning techniques for BEA WebLogic JRockit on the IA64x4 machine of setup 2 was performed as defined in section 6.3.3. On this machine all the garbage collectors worked smoothly and I had the opportunity to perform a thorough examination of them and look for the one which would give the application the best performance. As there were some results available from the tuning studies on the IA64x1 machine of setup 1 regarding the Single Spaced Concurrent (singlecon) and Single Spaced Parallel (parallel) garbage collectors the study on setup 2 focused on the
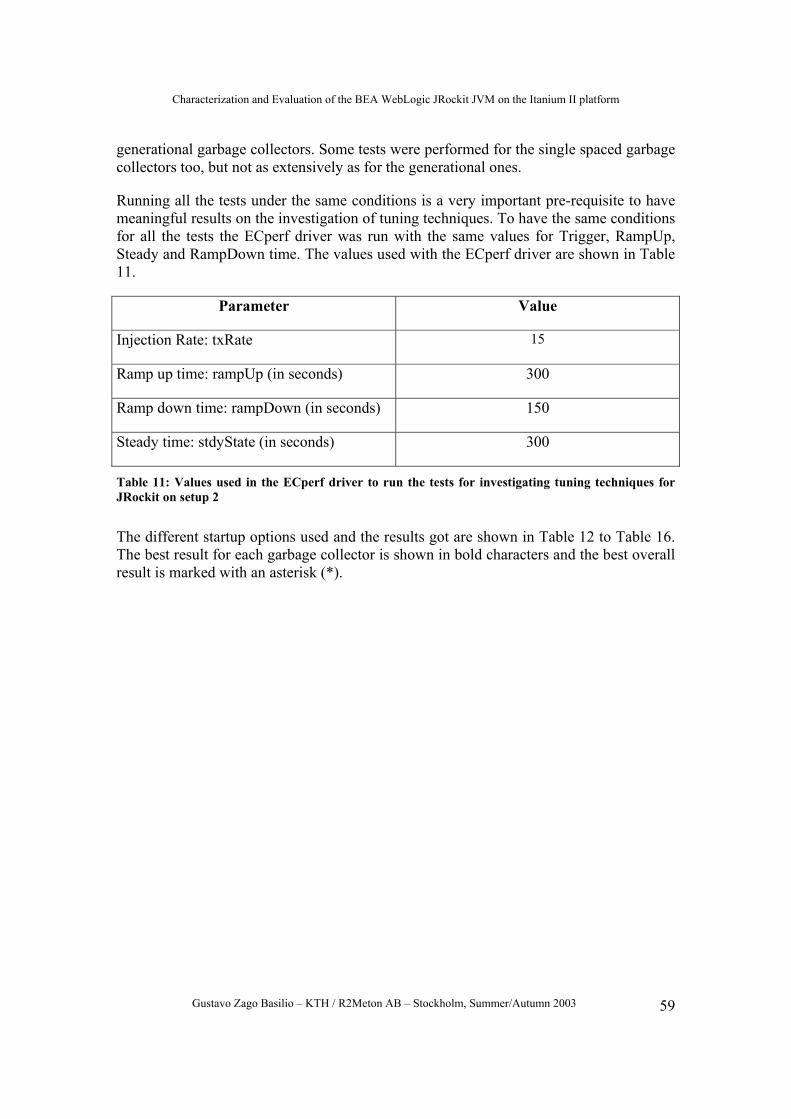
Characterization and Evaluation of the BEA WebLogic JRockit JVM on the Itanium II platform
Gustavo Zago Basilio – KTH / R2Meton AB – Stockholm, Summer/Autumn 2003 59
generational garbage collectors. Some tests were performed for the single spaced garbage collectors too, but not as extensively as for the generational ones.
Running all the tests under the same conditions is a very important pre-requisite to have meaningful results on the investigation of tuning techniques. To have the same conditions for all the tests the ECperf driver was run with the same values for Trigger, RampUp, Steady and RampDown time. The values used with the ECperf driver are shown in Table 11.
Parameter Value
Injection Rate: txRate 15
Ramp up time: rampUp (in seconds) 300
Ramp down time: rampDown (in seconds) 150
Steady time: stdyState (in seconds) 300
Table 11: Values used in the ECperf driver to run the tests for investigating tuning techniques for JRockit on setup 2
The different startup options used and the results got are shown in Table 12 to Table 16. The best result for each garbage collector is shown in bold characters and the best overall result is marked with an asterisk (*).
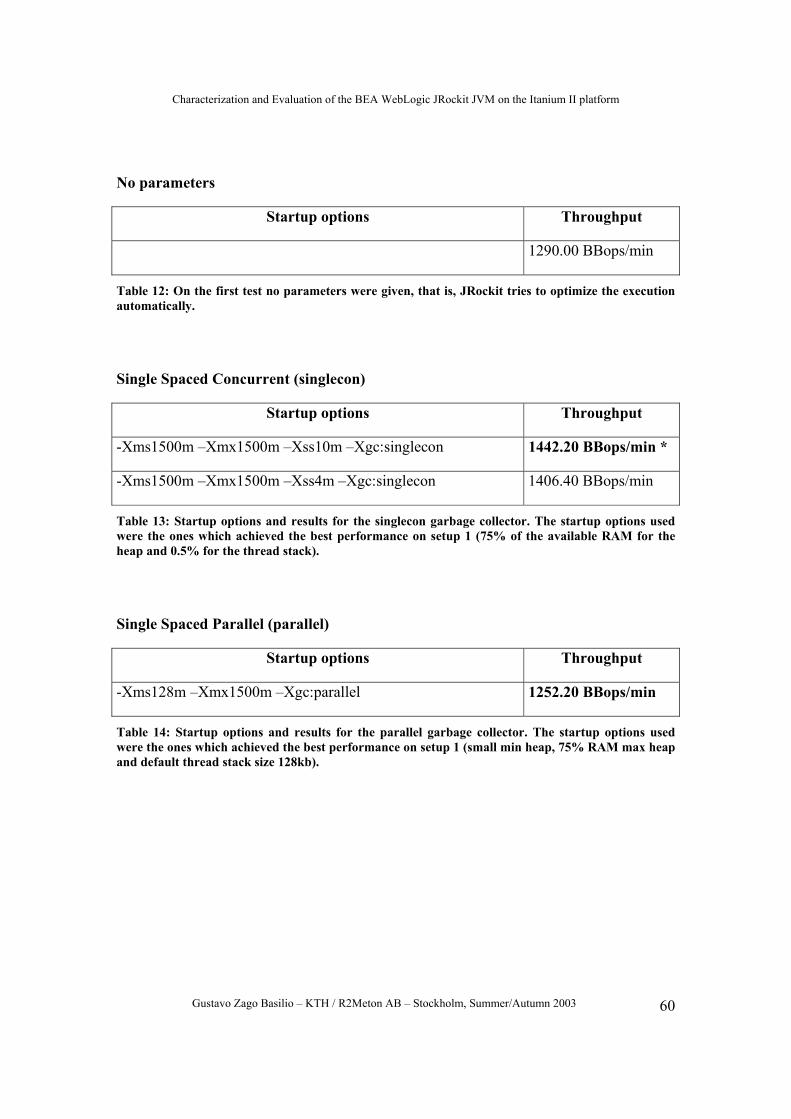
Characterization and Evaluation of the BEA WebLogic JRockit JVM on the Itanium II platform
Gustavo Zago Basilio – KTH / R2Meton AB – Stockholm, Summer/Autumn 2003 60
No parameters
Startup options Throughput
1290.00 BBops/min
Table 12: On the first test no parameters were given, that is, JRockit tries to optimize the execution automatically.
Single Spaced Concurrent (singlecon)
Startup options Throughput
-Xms1500m –Xmx1500m –Xss10m –Xgc:singlecon 1442.20 BBops/min *
-Xms1500m –Xmx1500m –Xss4m –Xgc:singlecon 1406.40 BBops/min
Table 13: Startup options and results for the singlecon garbage collector. The startup options used were the ones which achieved the best performance on setup 1 (75% of the available RAM for the heap and 0.5% for the thread stack).
Single Spaced Parallel (parallel)
Startup options Throughput
-Xms128m –Xmx1500m –Xgc:parallel 1252.20 BBops/min
Table 14: Startup options and results for the parallel garbage collector. The startup options used were the ones which achieved the best performance on setup 1 (small min heap, 75% RAM max heap and default thread stack size 128kb).
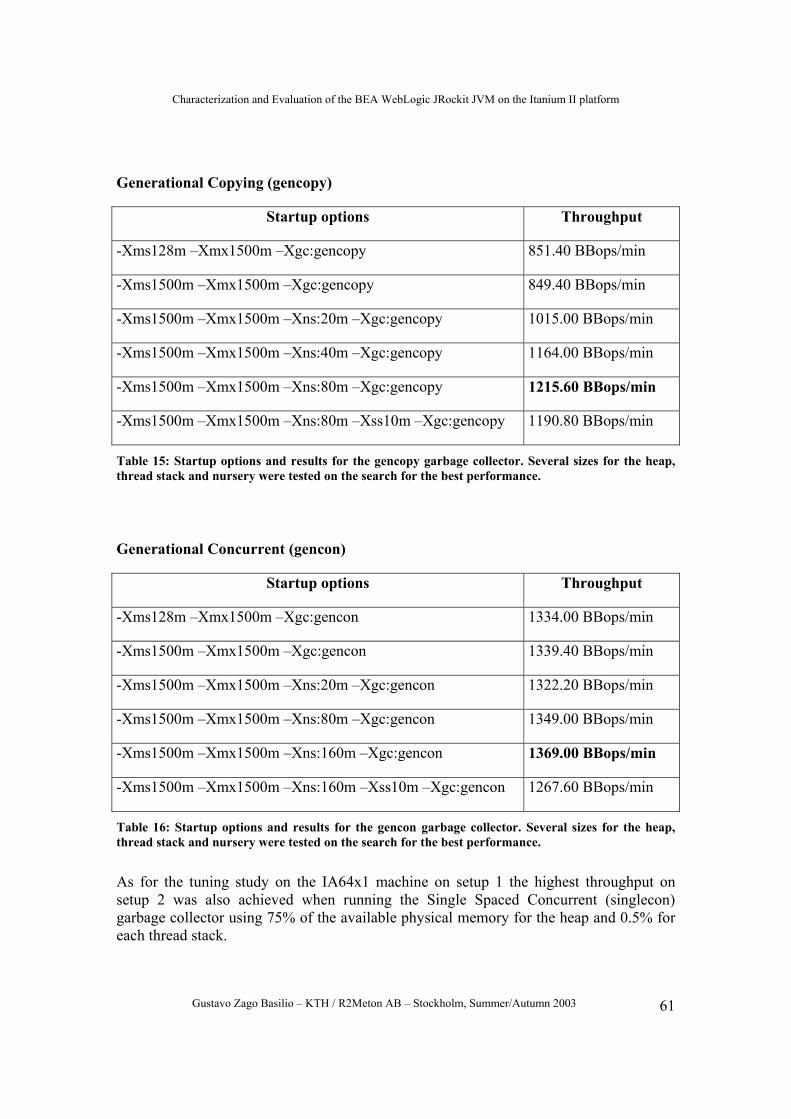
Characterization and Evaluation of the BEA WebLogic JRockit JVM on the Itanium II platform
Gustavo Zago Basilio – KTH / R2Meton AB – Stockholm, Summer/Autumn 2003 61
Generational Copying (gencopy)
Startup options Throughput
-Xms128m –Xmx1500m –Xgc:gencopy 851.40 BBops/min
-Xms1500m –Xmx1500m –Xgc:gencopy 849.40 BBops/min
-Xms1500m –Xmx1500m –Xns:20m –Xgc:gencopy 1015.00 BBops/min
-Xms1500m –Xmx1500m –Xns:40m –Xgc:gencopy 1164.00 BBops/min
-Xms1500m –Xmx1500m –Xns:80m –Xgc:gencopy 1215.60 BBops/min
-Xms1500m –Xmx1500m –Xns:80m –Xss10m –Xgc:gencopy 1190.80 BBops/min
Table 15: Startup options and results for the gencopy garbage collector. Several sizes for the heap, thread stack and nursery were tested on the search for the best performance.
Generational Concurrent (gencon)
Startup options Throughput
-Xms128m –Xmx1500m –Xgc:gencon 1334.00 BBops/min
-Xms1500m –Xmx1500m –Xgc:gencon 1339.40 BBops/min
-Xms1500m –Xmx1500m –Xns:20m –Xgc:gencon 1322.20 BBops/min
-Xms1500m –Xmx1500m –Xns:80m –Xgc:gencon 1349.00 BBops/min
-Xms1500m –Xmx1500m –Xns:160m –Xgc:gencon 1369.00 BBops/min
-Xms1500m –Xmx1500m –Xns:160m –Xss10m –Xgc:gencon 1267.60 BBops/min
Table 16: Startup options and results for the gencon garbage collector. Several sizes for the heap, thread stack and nursery were tested on the search for the best performance.
As for the tuning study on the IA64x1 machine on setup 1 the highest throughput on setup 2 was also achieved when running the Single Spaced Concurrent (singlecon) garbage collector using 75% of the available physical memory for the heap and 0.5% for each thread stack.
Characterization and Evaluation of the BEA WebLogic JRockit JVM on the Itanium II platform
Gustavo Zago Basilio – KTH / R2Meton AB – Stockholm, Summer/Autumn 2003 62
On setup 2 I could finally test the generational garbage collectors and analyze them on the grounds of application throughput. As the size of the heap and the thread stacks were thoroughly studied on setup 1 I decided to use the same values that achieved the best performance for the singlecon and parallel garbage collectors running on setup 1 and focus on the search of the ideal size of the nursery for the ECperf application. The size of the nursery is a vital parameter for generational garbage collectors as new objects are always put on the nursery before being promoted.
If the nursery size (-Xns) is not set the default size depends on the number of CPUs. For the Generational Copying (gencopy) garbage collector the default nursery size is 320 KB times the number of CPUs and for the Generational Concurrent (gencon) garbage collector the default nursery size is 10 MB times the number of CPUs.
By the analysis of the results shown in Table 15 one can notice how important the size of the nursery is for the application performance. Using the default size for the gencopy garbage collector (320KB x 4CPUs = 1.28MB) the performance achieved was the worst within all the tests performed. This is due to the extremely high number of garbage collections performed during the execution of the ECperf application. In a 20 minutes test more than 7000 garbage collections occurred. As the size of the nursery was increased the performance also increased due to less frequent garbage collections.
The behavior of the gencon garbage collector is similar to the one observed for the gencopy garbage collector, although less extreme due to the bigger default size of the nursery (10MB x 4CPUs = 40MB). The worst performance when using this garbage collector was achieved with the smallest nursery size (20MB). As the nursery size increased also did the performance. The best performance was achieved (as for the gencopy garbage collector) with the biggest nursery size.
The study of tuning techniques for JRockit on setup 2 reinforces how important it is to tune the JVM for the system it is running on. The throughput increase from the run without any parameters (thus letting JRockit try to optimize the application execution) to the best run is around 12%. It can look like a small difference, but when one takes into account the total cost of enterprise systems 12% can represent a lot of money. In addition, it is worth mentioning again that the bottleneck on setup 2 was not CPU power, but probably the database. Thus, it is believed that if the database bottleneck is solved the performance difference between the run without any startup option and the best run could be close to 50%, as in setup 1.
Characterization and Evaluation of the BEA WebLogic JRockit JVM on the Itanium II platform
Gustavo Zago Basilio – KTH / R2Meton AB – Stockholm, Summer/Autumn 2003 63
8 Conclusions and recommendations This chapter presents the conclusions of the work developed as well as recommendations based on these conclusions. The conclusions are drawn from the analysis of the data got in the tests with BEA WebLogic JRockit JVM and Sun’s JVM on the Itanium II platform as well as from theoretical studies of these JVMs.
As already mentioned, BEA WebLogic JRockit is a JVM developed from the ground up to meet the requirements of server-side Java applications. It is especially optimized for the Itanium II platform and, according to BEA, “it is the fastest server JVM available for this platform”.
The results of the tests seem to corroborate this assertion, although the difference in performance to Sun’s JVM JDK 1.4.2 is small. In the case where the system is under ordinary load (the CPU power is not fully utilized) both JVM’s have a very similar behavior, and there is no great advantage on using either JRockit or Sun’s JVM JDK 1.4.2. Under heavy load however, JRockit performs slightly better than Sun’s JVM JDK 1.4.2, considering both the throughput and the response time metrics of the ECperf benchmark. JRockit also has a more predictable behavior than Sun’s JVM JDK 1.4.2 under such conditions.
Sun’s JVM JDK 1.4.1, on the other hand, performs extremely poorly under any condition. In all tests carried out, this JVM got the worst results and its performance and scalability are not even comparable to JRockit or Sun’s JVM JDK 1.4.2. The reason for this is that this JVM does not JIT-compiles the Java bytecode, thus it spends a lot of the CPU capacity to interpret the bytecodes one at a time.
As far as JRockit reliability is concerned, this JVM did not show any flaw or weak point. Even though no comparative tests were performed to evaluate JRockit’s reliability when opposed to Sun’s JVM’s, the tests carried out showed that JRockit is quite stable and reliable. For this reason it is reasonable to think that JRockit can be safely used in production environments.
The last set of tests performed, the tuning tests, indicate that JRockit’s performance could be substantially increased by simply choosing the right JVM startup options. In some cases the performance improvement was around 50% in comparison to the run without any startup option. Although it is meaningless to compare the best result achieved by JRockit in the tuning tests with the result of Sun’s JVM during the performance and scalability tests, it is reasonable to think that the performance difference between JRockit and Sun’s JVM JDK 1.4.2 could be even larger when both JVMs are pushed to the limit. This is an interesting subject to investigation and could be the topic of future studies in this area.
For all the reasons stated above it is suggested that JRockit be the JVM chosen to run enterprise applications on the Itanium II platform. Even though the performance measured for JRockit was not much higher than the one measured for Sun’s JVM JDK
Characterization and Evaluation of the BEA WebLogic JRockit JVM on the Itanium II platform
Gustavo Zago Basilio – KTH / R2Meton AB – Stockholm, Summer/Autumn 2003 64
1.4.2, the difference justifies this choice. Enterprise systems can be quite expensive, and even a difference as small as 2% or 3% means a lot of money.
Moreover, when using WebLogic 8.1 as the application server on Itanium II servers running Linux (the environment used on this master thesis project) JRockit becomes the only choice as BEA WebLogic Server 8.1 officially supports only this JVM (WebLogic JRockit 8.1 SP1).
Characterization and Evaluation of the BEA WebLogic JRockit JVM on the Itanium II platform
Gustavo Zago Basilio – KTH / R2Meton AB – Stockholm, Summer/Autumn 2003 65
9 Further work • Study of the economical issues of JRockit on the Itanium II platform.
• A comparison of the memory utilization of JRockit and Sun’s JVM running on the Itanium II platform.
• Comparative study of the effects of JVM tuning on the performance for JRockit and Sun’s JVMs.
• Investigation of the maturity of the Itanium II platform for business applications.
• More detailed reliability tests could be performed with JRockit.
• This project was focused on the characterization and evaluation of JRockit on the Itanium II platform under the optics of Java enterprise applications. If a complete picture of JRockit on the Itanium II platform is wanted the JVM should be tested with other types of applications and also with the use of micro-benchmarks (benchmarks that test specific areas of the JVM as thread management, floating point calculation, etc).
• The application server used on this master thesis project was BEA WebLogic. It would be interesting to have the same kind of tests performed using other application servers and compare the results analyzing both JVM and application server behavior.
• BEA WebLogic JRockit is optimized for the Itanium II platform while Sun’s JVM is probably optimized for Sun servers. A comparison JRockit on Itanium II servers vs Sun’s JVM on Sun servers would be very interesting.
Characterization and Evaluation of the BEA WebLogic JRockit JVM on the Itanium II platform
Gustavo Zago Basilio – KTH / R2Meton AB – Stockholm, Summer/Autumn 2003 66
10 References
[1] Tim Lindholm and Frank Yellin. “The JavaTM Virtual Machine Specification”. <http://java.sun.com/docs/books/vmspec/2nd-edition/html/VMSpecTOC.doc.html> [2] Bill Venners. “Inside the Java Virtual Machine”. McGraw-Hill, 1998. [3] Ravenbrook Limited. “The Memory Management Reference”. 2001. <http://www.memorymanagement.org/articles/> [4] Richard Jones. “The Garbage Collection page”. November 6, 2003. <http://www.cs.kent.ac.uk/people/staff/rej/gc.html> [5] Josefin Hallberg. “Optimizing Memory Performance with a JVM: Prefetching in a Mark-and-Sweep Garbage Collector”. Master of Science Thesis, Royal Institute of Technology, Stockholm, Sweden, October 2003. [6] K. Shiv , R. Iyer , C. Newburn , J. Dahlstedt , M. Lagergren and O. Lindholm. “Impact of JIT/JVM Optimizations on Java Application Performance”. [7] Ed Ort. ”A Test of Java Virtual Machine Performance”. February 2001. <http://developer.java.sun.com/developer/technicalArticles/Programming/JVMPerf/> [8] TheServerSide.com J2EE community. The ECperf homepage. <http://www.theserverside.com/ecperf> [9] Sun Microsystems Inc. “ECperfTM Specification - Version 1.1, Final Release”. April 16, 2002. [10] Kingsum Chow, Ricardo Morin, Kumar Shiv. “Enterprise Java Performance: Best Practices”. 2003. <http://www.intel.com/technology/itj/2003/volume07issue01/art03_java/vol7iss1_art03.pdf> [11] Samuel Kounev and Alejandro Buchmann. ”Performance Issues in E-Business Systems”. 2002. <http://citeseer.nj.nec.com/cache/papers/cs/26473/http:zSzzSzwww.ssgrr.itzSzenzSzssgrr2002wzSzpaperszSz1.pdf/kounev02performance.pdf> [12] Samuel Kounev. “Eliminating ECperf persistence bottlenecks when using RDBMS with pessimistic concurrency control”. Technical Report, Technical University of Darmstadt, Germany, September 2001.
Characterization and Evaluation of the BEA WebLogic JRockit JVM on the Itanium II platform
Gustavo Zago Basilio – KTH / R2Meton AB – Stockholm, Summer/Autumn 2003 67
<http://www.dvs1.informatik.tu-darmstadt.de/staff/skounev/pub/ecperf1.0-opt-proposal.pdf > [13] BEA Systems, Inc. WebLogic Server documentation. Technical report. <http://edocs.bea.com/platform/docs81/index.html> [14] BEA Systems, Inc. BEA WebLogic Platform – Supported Configurations. Technical report. <http://e-docs.bea.com/platform/docs81/pdf/support.pdf> [15] BEA Systems, Inc. BEA White Paper. “BEA WebLogic® JRockit - The Server JVM”. August 27, 2002. <http://kr.bea.com/news_events/white_papers/BEA_JRockit_wp.pdf> [16] BEA Systems, Inc. “WebLogic® JRockit Java Virtual Machine Data Sheet”. 2001. [17] Arvind Jain. “BEA WebLogic JRockit - Update & Roadmap”. March 4, 2003. <http://www.bea.com/content/files/eworld/presentations/Tues_03_04_03/Application_Servers/1147_JRockit_New_Capabilities.pdf> [18] BEA Systems, Inc. “BEA WebLogic JRockit™ SDK -Tuning WebLogic JRockit 8.1 JVM”. March 2003. < http://e-docs.bea.com/wljrockit/docs81/pdf/tuning.pdf > [19] BEA Systems, Inc. “BEA WEBLOGIC JROCKIT™ - High Performance on Intel Platforms”. April 2003. < http://www.intel.com/ebusiness/pdf/affiliates/bea/bea032501.pdf > [20] Kumar Shiv, Marcus Lagergren and Edwin Spear. “Java in a 64-bit World: Why BEA WebLogic JRockit and the Intel® Itanium® Processor Family Make Java the Choice for Developing Server-side Enterprise Applications”. <http://dev2dev.bea.com/products/wljrockit81/articles/jrockit_intel.jsp> [21] Kumar Shiv, Marcus Lagergren and Edwin Spear. “Java Opportunities and Challenges in a 64-bit World: Solutions with the Intel Itanium Processor Family and BEA WebLogic JRockit”. September 29, 2003 <http://www.devx.com/Intel/Article/17457> [22] Intel Corporation, “The Advantages of Intel® Itanium Architecture for Java and Other Component-based Environments”, 2001. <http://developer.intel.com/design/itanium/downloads/java_itanium.pdf> [23] R. Lindsay Todd. “Linux Systems Administration - An introduction to administering Red Hat Linux”. Rensselaer Polytechnic Institute, USA. < http://www.rpi.edu/~toddr/Classes/Linux-SysAdmin-2003S/sysadmin-6.pdf >
Characterization and Evaluation of the BEA WebLogic JRockit JVM on the Itanium II platform
Gustavo Zago Basilio – KTH / R2Meton AB – Stockholm, Summer/Autumn 2003 68
[24] BEA Systems, Inc. “Supported Configurations for WebLogic Server 8.1 - Red Hat Enterprise Linux AS 2.1 and ES 2.1 for IA-64”. <http://edocs.bea.com/wls/certifications/certs_810/redhat_linux_as_ipf.html#58604> [25] Bryan Duerk, Tom Kast. “Improving Performance and Cutting Costs with BEA and Intel”. March 4, 2003. <http://www.bea.com/content/files/eworld/presentations/Tues_03_04_03/Deployment_Management_Administration/1230_BEA_and_Intel.pdf>
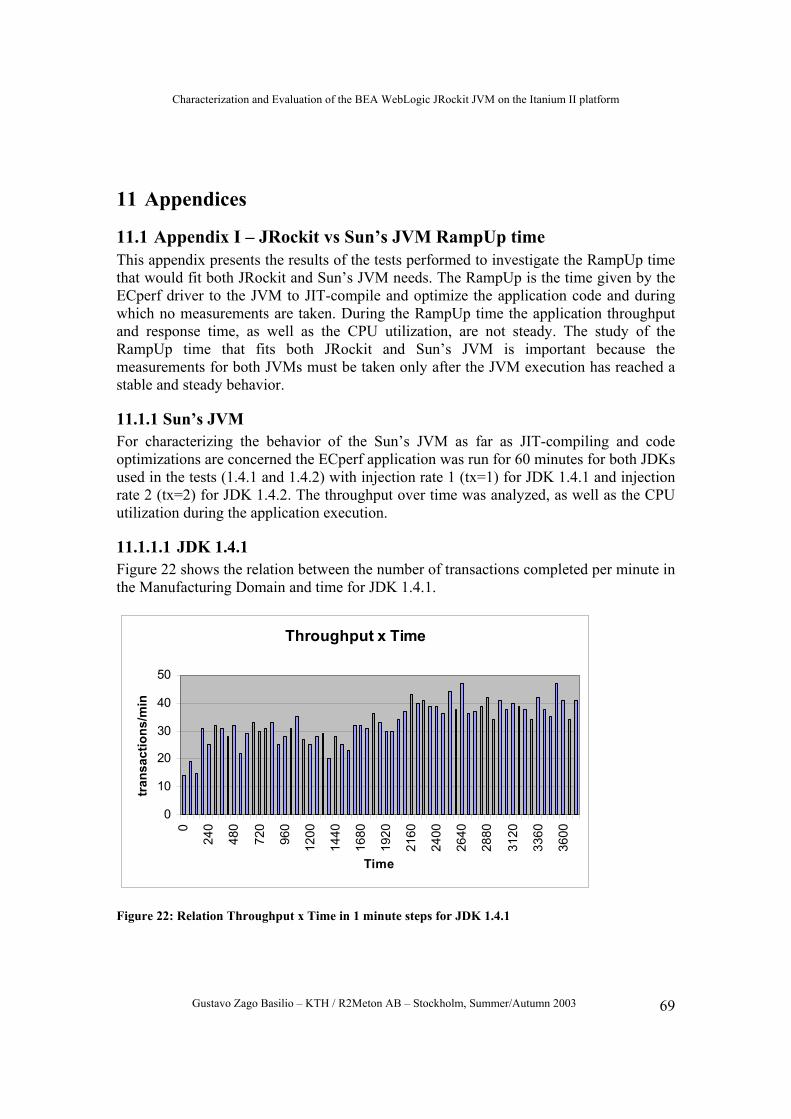
Characterization and Evaluation of the BEA WebLogic JRockit JVM on the Itanium II platform
Gustavo Zago Basilio – KTH / R2Meton AB – Stockholm, Summer/Autumn 2003 69
11 Appendices
11.1 Appendix I – JRockit vs Sun’s JVM RampUp time This appendix presents the results of the tests performed to investigate the RampUp time that would fit both JRockit and Sun’s JVM needs. The RampUp is the time given by the ECperf driver to the JVM to JIT-compile and optimize the application code and during which no measurements are taken. During the RampUp time the application throughput and response time, as well as the CPU utilization, are not steady. The study of the RampUp time that fits both JRockit and Sun’s JVM is important because the measurements for both JVMs must be taken only after the JVM execution has reached a stable and steady behavior.
11.1.1 Sun’s JVM For characterizing the behavior of the Sun’s JVM as far as JIT-compiling and code optimizations are concerned the ECperf application was run for 60 minutes for both JDKs used in the tests (1.4.1 and 1.4.2) with injection rate 1 (tx=1) for JDK 1.4.1 and injection rate 2 (tx=2) for JDK 1.4.2. The throughput over time was analyzed, as well as the CPU utilization during the application execution.
11.1.1.1 JDK 1.4.1 Figure 22 shows the relation between the number of transactions completed per minute in the Manufacturing Domain and time for JDK 1.4.1.
Throughput x Time
0
10
20
30
40
50
0
240
480
720
960
1200
1440
1680
1920
2160
2400
2640
2880
3120
3360
3600
Time
tran
sact
ions
/min
Figure 22: Relation Throughput x Time in 1 minute steps for JDK 1.4.1
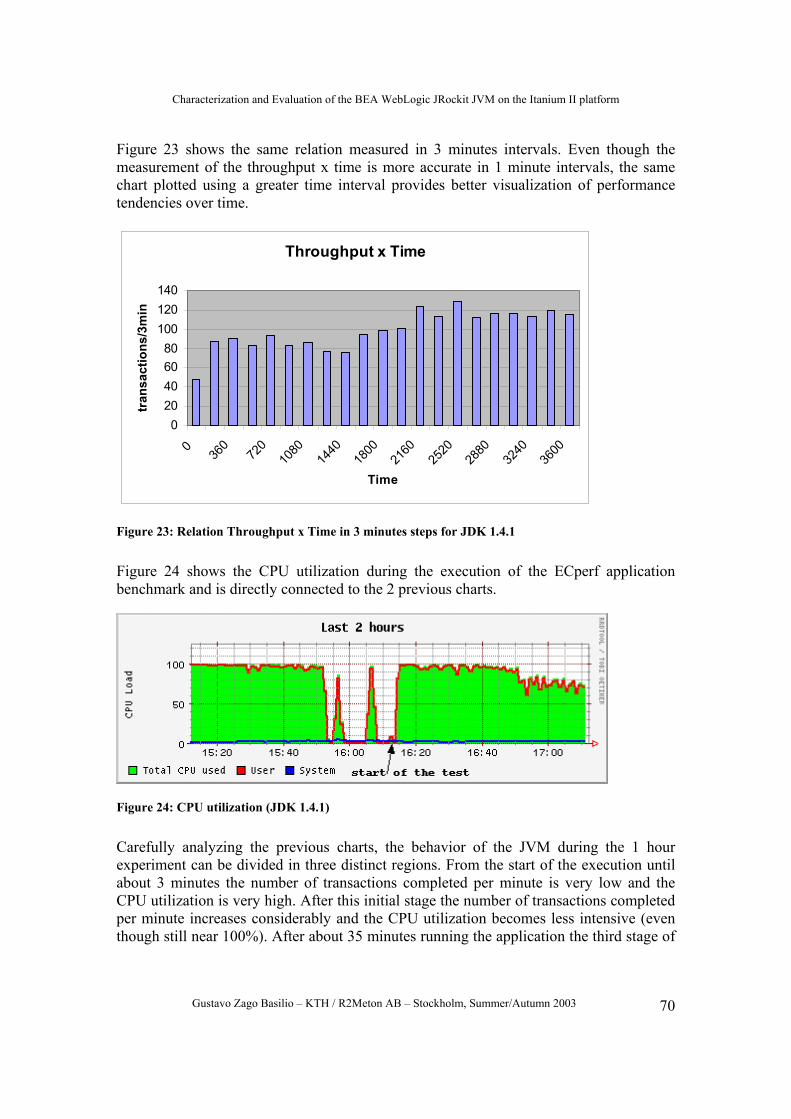
Characterization and Evaluation of the BEA WebLogic JRockit JVM on the Itanium II platform
Gustavo Zago Basilio – KTH / R2Meton AB – Stockholm, Summer/Autumn 2003 70
Figure 23 shows the same relation measured in 3 minutes intervals. Even though the measurement of the throughput x time is more accurate in 1 minute intervals, the same chart plotted using a greater time interval provides better visualization of performance tendencies over time.
Throughput x Time
020406080
100120140
036
072
010
8014
4018
0021
6025
2028
8032
4036
00
Time
tran
sact
ions
/3m
in
Figure 23: Relation Throughput x Time in 3 minutes steps for JDK 1.4.1
Figure 24 shows the CPU utilization during the execution of the ECperf application benchmark and is directly connected to the 2 previous charts.
Figure 24: CPU utilization (JDK 1.4.1)
Carefully analyzing the previous charts, the behavior of the JVM during the 1 hour experiment can be divided in three distinct regions. From the start of the execution until about 3 minutes the number of transactions completed per minute is very low and the CPU utilization is very high. After this initial stage the number of transactions completed per minute increases considerably and the CPU utilization becomes less intensive (even though still near 100%). After about 35 minutes running the application the third stage of
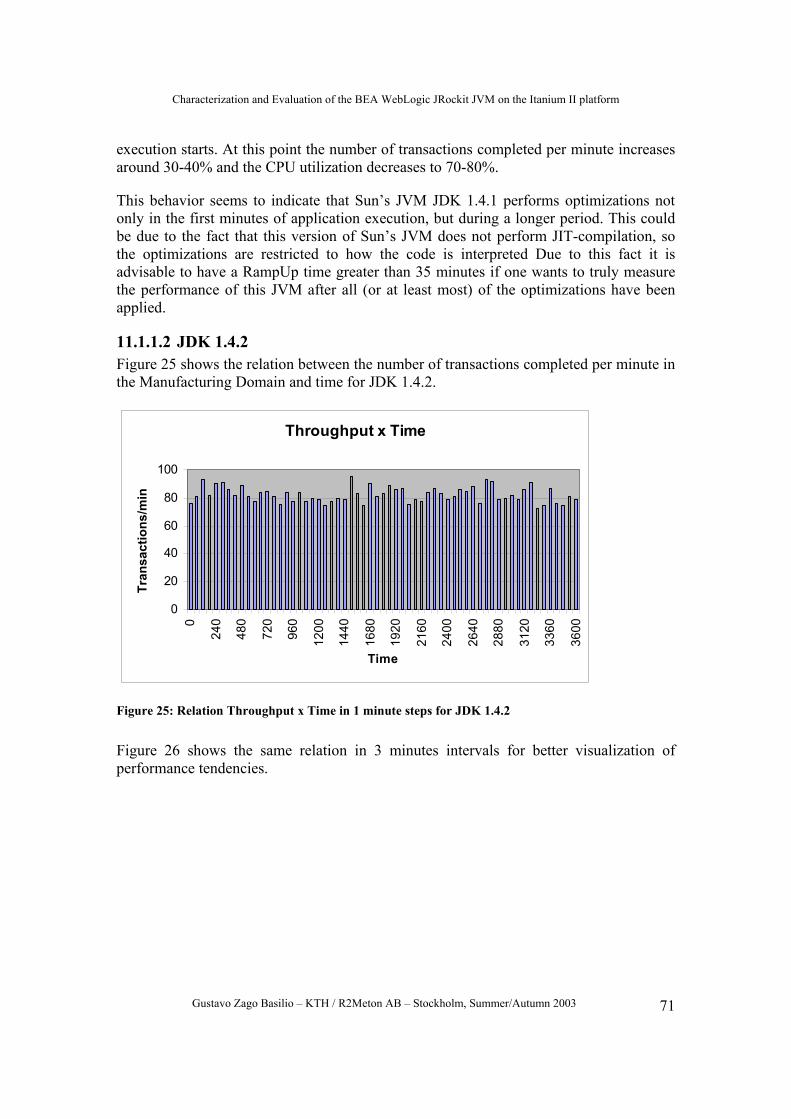
Characterization and Evaluation of the BEA WebLogic JRockit JVM on the Itanium II platform
Gustavo Zago Basilio – KTH / R2Meton AB – Stockholm, Summer/Autumn 2003 71
execution starts. At this point the number of transactions completed per minute increases around 30-40% and the CPU utilization decreases to 70-80%.
This behavior seems to indicate that Sun’s JVM JDK 1.4.1 performs optimizations not only in the first minutes of application execution, but during a longer period. This could be due to the fact that this version of Sun’s JVM does not perform JIT-compilation, so the optimizations are restricted to how the code is interpreted Due to this fact it is advisable to have a RampUp time greater than 35 minutes if one wants to truly measure the performance of this JVM after all (or at least most) of the optimizations have been applied.
11.1.1.2 JDK 1.4.2 Figure 25 shows the relation between the number of transactions completed per minute in the Manufacturing Domain and time for JDK 1.4.2.
Throughput x Time
0
20
40
60
80
100
0
240
480
720
960
1200
1440
1680
1920
2160
2400
2640
2880
3120
3360
3600
Time
Tran
sact
ions
/min
Figure 25: Relation Throughput x Time in 1 minute steps for JDK 1.4.2
Figure 26 shows the same relation in 3 minutes intervals for better visualization of performance tendencies.
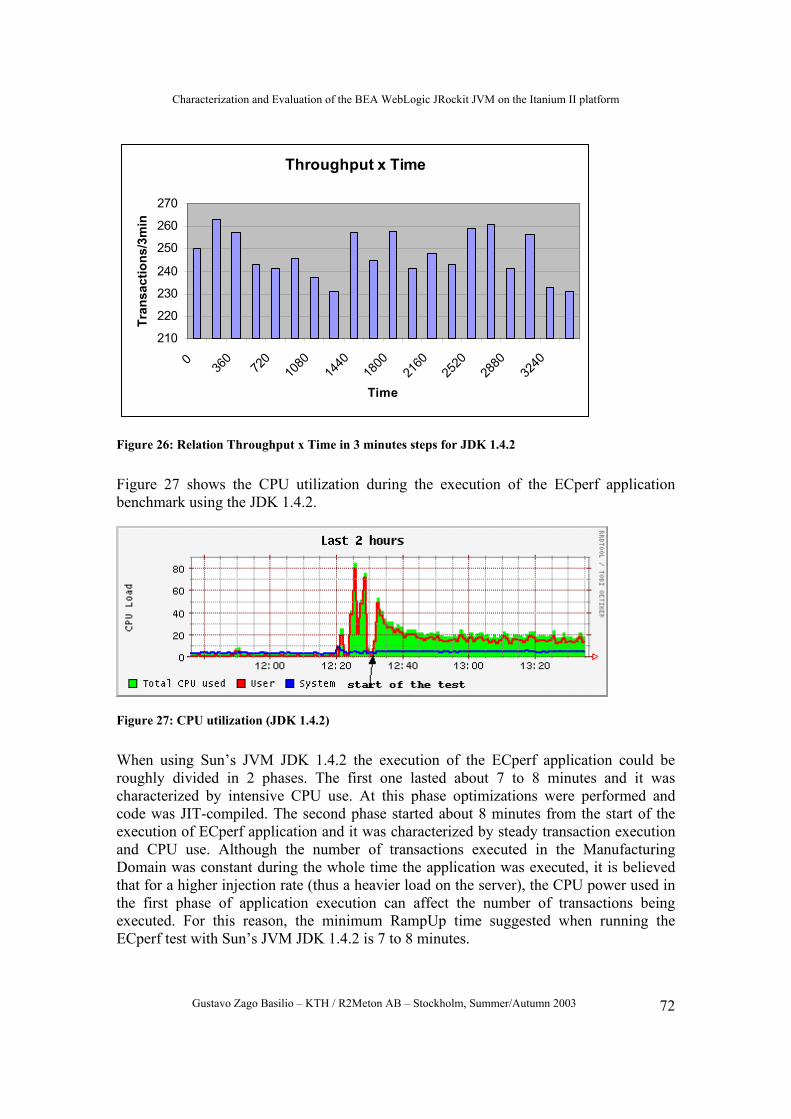
Characterization and Evaluation of the BEA WebLogic JRockit JVM on the Itanium II platform
Gustavo Zago Basilio – KTH / R2Meton AB – Stockholm, Summer/Autumn 2003 72
Throughput x Time
210
220
230
240
250
260
270
036
072
010
8014
4018
0021
6025
2028
8032
40
Time
Tran
sact
ions
/3m
in
Figure 26: Relation Throughput x Time in 3 minutes steps for JDK 1.4.2
Figure 27 shows the CPU utilization during the execution of the ECperf application benchmark using the JDK 1.4.2.
Figure 27: CPU utilization (JDK 1.4.2)
When using Sun’s JVM JDK 1.4.2 the execution of the ECperf application could be roughly divided in 2 phases. The first one lasted about 7 to 8 minutes and it was characterized by intensive CPU use. At this phase optimizations were performed and code was JIT-compiled. The second phase started about 8 minutes from the start of the execution of ECperf application and it was characterized by steady transaction execution and CPU use. Although the number of transactions executed in the Manufacturing Domain was constant during the whole time the application was executed, it is believed that for a higher injection rate (thus a heavier load on the server), the CPU power used in the first phase of application execution can affect the number of transactions being executed. For this reason, the minimum RampUp time suggested when running the ECperf test with Sun’s JVM JDK 1.4.2 is 7 to 8 minutes.
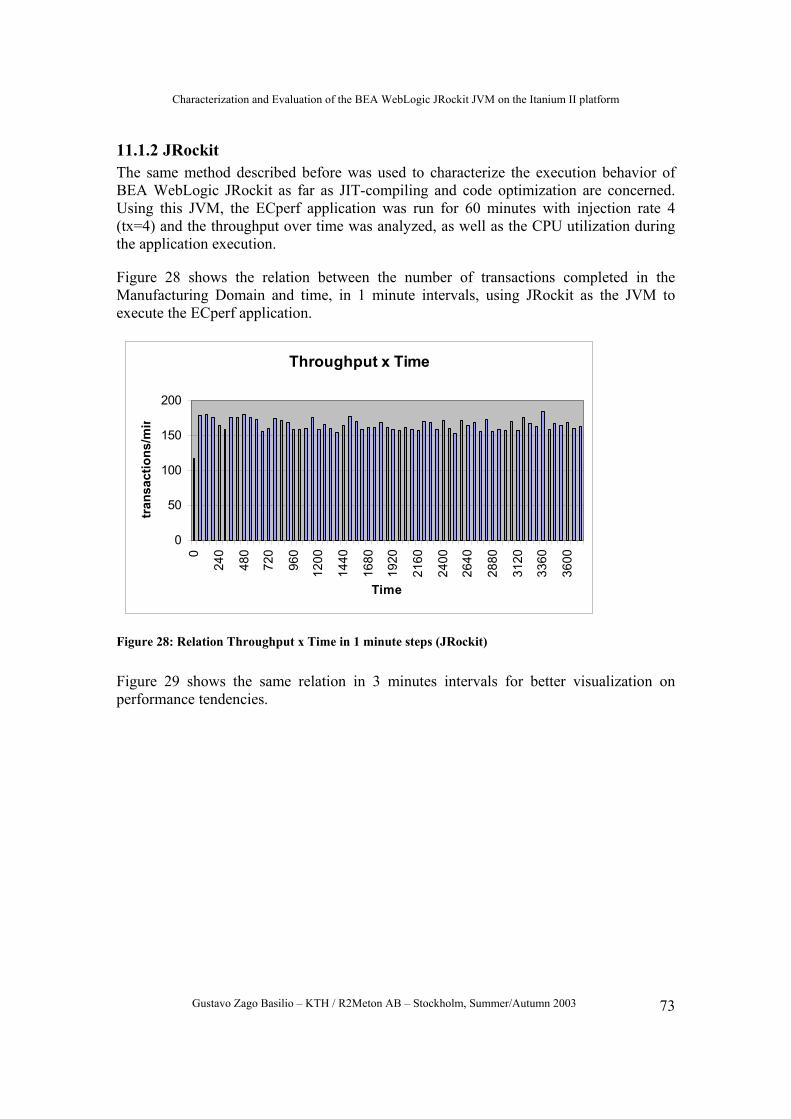
Characterization and Evaluation of the BEA WebLogic JRockit JVM on the Itanium II platform
Gustavo Zago Basilio – KTH / R2Meton AB – Stockholm, Summer/Autumn 2003 73
11.1.2 JRockit The same method described before was used to characterize the execution behavior of BEA WebLogic JRockit as far as JIT-compiling and code optimization are concerned. Using this JVM, the ECperf application was run for 60 minutes with injection rate 4 (tx=4) and the throughput over time was analyzed, as well as the CPU utilization during the application execution.
Figure 28 shows the relation between the number of transactions completed in the Manufacturing Domain and time, in 1 minute intervals, using JRockit as the JVM to execute the ECperf application.
Throughput x Time
0
50
100
150
200
0
240
480
720
960
1200
1440
1680
1920
2160
2400
2640
2880
3120
3360
3600
Time
tran
sact
ions
/min
Figure 28: Relation Throughput x Time in 1 minute steps (JRockit)
Figure 29 shows the same relation in 3 minutes intervals for better visualization on performance tendencies.
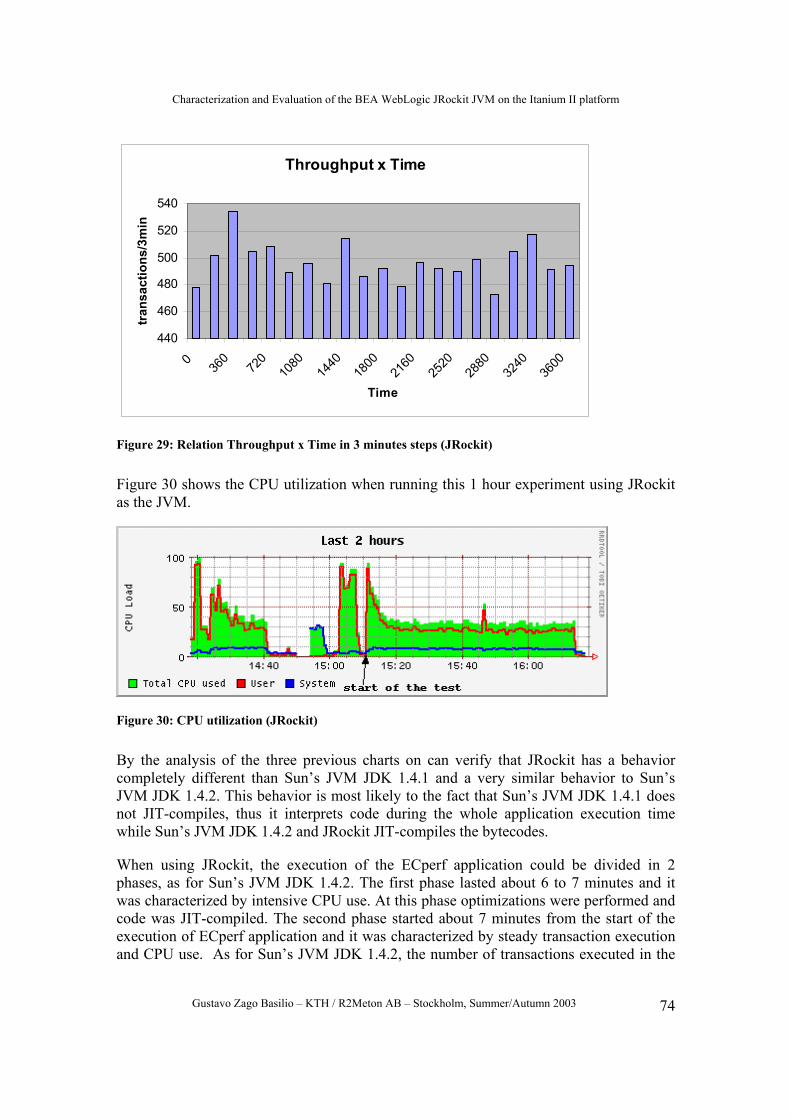
Characterization and Evaluation of the BEA WebLogic JRockit JVM on the Itanium II platform
Gustavo Zago Basilio – KTH / R2Meton AB – Stockholm, Summer/Autumn 2003 74
Throughput x Time
440
460
480
500
520
540
036
072
010
8014
4018
0021
6025
2028
8032
4036
00
Time
tran
sact
ions
/3m
in
Figure 29: Relation Throughput x Time in 3 minutes steps (JRockit)
Figure 30 shows the CPU utilization when running this 1 hour experiment using JRockit as the JVM.
Figure 30: CPU utilization (JRockit)
By the analysis of the three previous charts on can verify that JRockit has a behavior completely different than Sun’s JVM JDK 1.4.1 and a very similar behavior to Sun’s JVM JDK 1.4.2. This behavior is most likely to the fact that Sun’s JVM JDK 1.4.1 does not JIT-compiles, thus it interprets code during the whole application execution time while Sun’s JVM JDK 1.4.2 and JRockit JIT-compiles the bytecodes.
When using JRockit, the execution of the ECperf application could be divided in 2 phases, as for Sun’s JVM JDK 1.4.2. The first phase lasted about 6 to 7 minutes and it was characterized by intensive CPU use. At this phase optimizations were performed and code was JIT-compiled. The second phase started about 7 minutes from the start of the execution of ECperf application and it was characterized by steady transaction execution and CPU use. As for Sun’s JVM JDK 1.4.2, the number of transactions executed in the
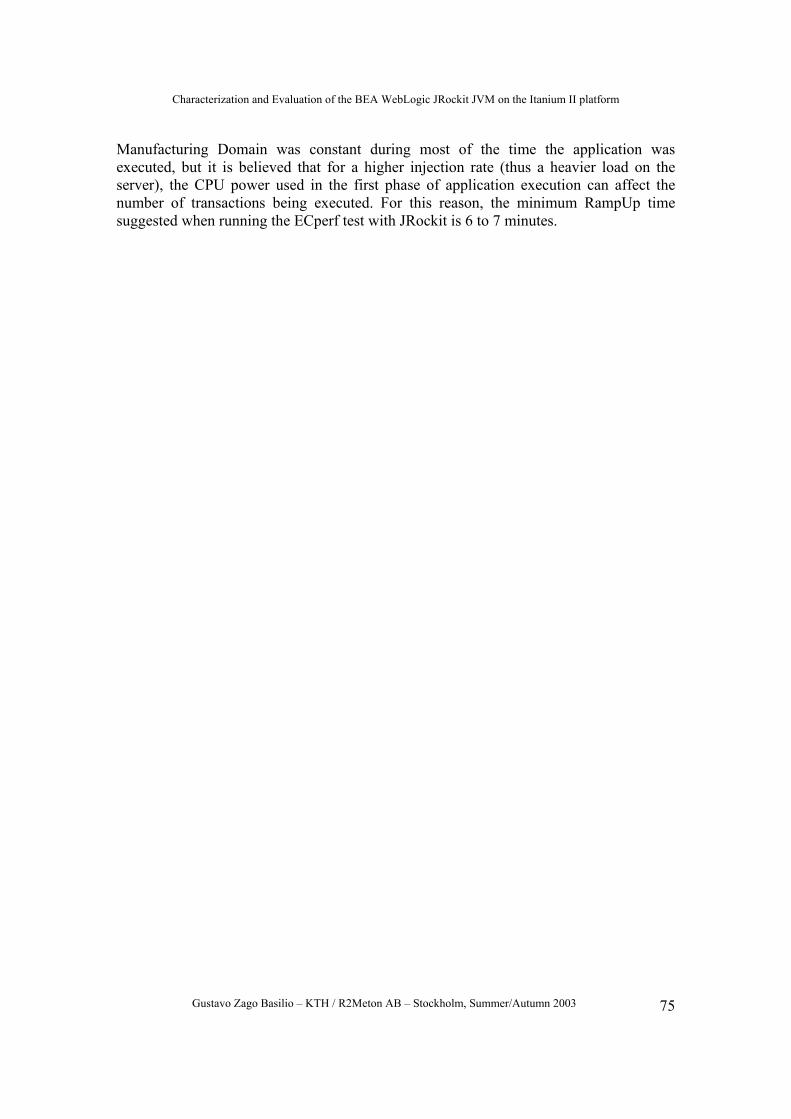
Characterization and Evaluation of the BEA WebLogic JRockit JVM on the Itanium II platform
Gustavo Zago Basilio – KTH / R2Meton AB – Stockholm, Summer/Autumn 2003 75
Manufacturing Domain was constant during most of the time the application was executed, but it is believed that for a higher injection rate (thus a heavier load on the server), the CPU power used in the first phase of application execution can affect the number of transactions being executed. For this reason, the minimum RampUp time suggested when running the ECperf test with JRockit is 6 to 7 minutes.
Characterization and Evaluation of the BEA WebLogic JRockit JVM on the Itanium II platform
Gustavo Zago Basilio – KTH / R2Meton AB – Stockholm, Summer/Autumn 2003 76
11.2 Appendix II - Investigating the load balance algorithm on the WebLogic server cluster
One of the parameters that can be configured by the server administrator in a WebLogic server cluster is which load-balance algorithm to use to distribute the load between the servers belonging to the cluster. BEA WebLogic application server provides six different choices for the administrator (in addition to allowing third party load-balancers to be used). This section presents a brief study on the different load-balance algorithms shipped with WebLogic 8.1 and how they affect the performance of the ECperf application. The goal of this study is to provide enough information so that I can choose the load-balance algorithm that achieves the best performance when running the tests with the WebLogi server cluster.
To compare the six different load-balance algorithms the ECperf benchmark was run six times under identical conditions, with six different load-balance algorithms being used in the application server cluster. The values used with the ECperf driver are shown in Table 17.
Parameter Value
Injection Rate: txRate 6
Ramp up time: rampUp (in seconds) 240
Ramp down time: rampDown (in seconds) 120
Steady time: stdyState (in seconds) 400
Table 17: Values used in the ECperf driver to run the tests for investigating the best load-balance algorithm for the WebLogic server cluster on the IA64x4 machine of setup 2.
To keep the study as brief as possible only the throughput of the ECperf application was taken into account. The throughput of each of the runs is shown in Figure 31 for easy comparison.
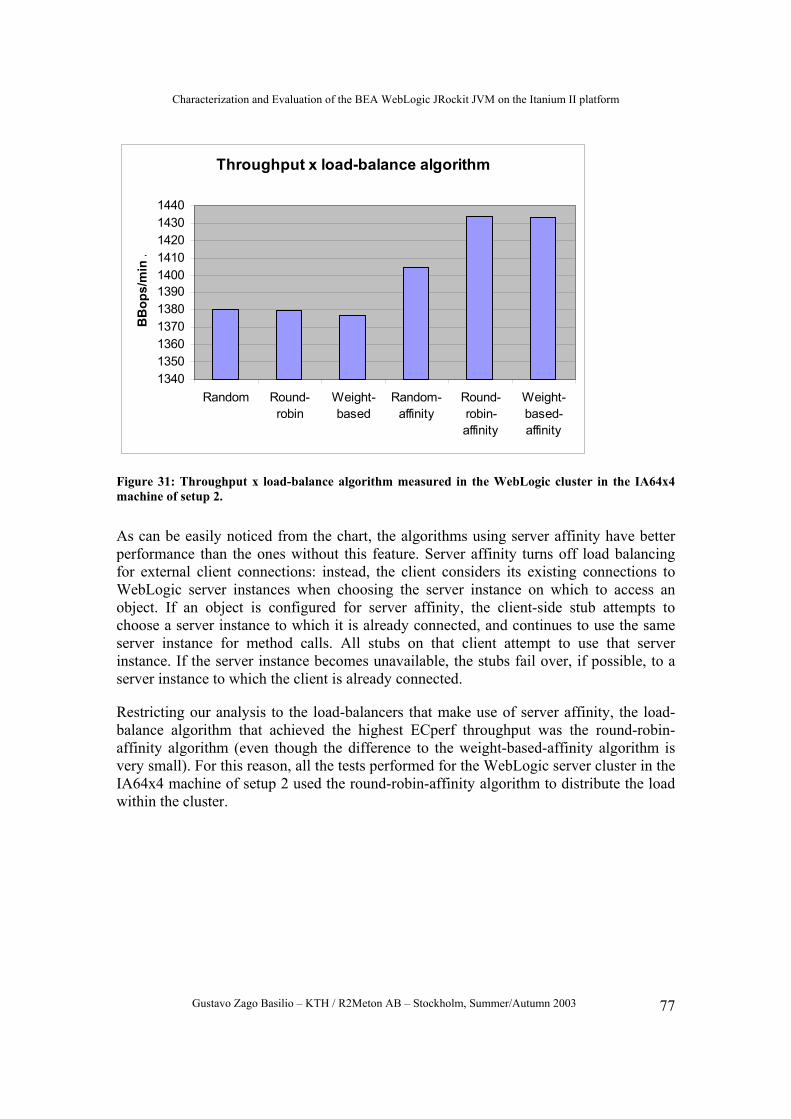
Characterization and Evaluation of the BEA WebLogic JRockit JVM on the Itanium II platform
Gustavo Zago Basilio – KTH / R2Meton AB – Stockholm, Summer/Autumn 2003 77
Throughput x load-balance algorithm
13401350136013701380139014001410142014301440
Random Round-robin
Weight-based
Random-affinity
Round-robin-affinity
Weight-based-affinity
BB
ops/
min
.
Figure 31: Throughput x load-balance algorithm measured in the WebLogic cluster in the IA64x4 machine of setup 2.
As can be easily noticed from the chart, the algorithms using server affinity have better performance than the ones without this feature. Server affinity turns off load balancing for external client connections: instead, the client considers its existing connections to WebLogic server instances when choosing the server instance on which to access an object. If an object is configured for server affinity, the client-side stub attempts to choose a server instance to which it is already connected, and continues to use the same server instance for method calls. All stubs on that client attempt to use that server instance. If the server instance becomes unavailable, the stubs fail over, if possible, to a server instance to which the client is already connected.
Restricting our analysis to the load-balancers that make use of server affinity, the load-balance algorithm that achieved the highest ECperf throughput was the round-robin-affinity algorithm (even though the difference to the weight-based-affinity algorithm is very small). For this reason, all the tests performed for the WebLogic server cluster in the IA64x4 machine of setup 2 used the round-robin-affinity algorithm to distribute the load within the cluster.