Embed Size (px)
Citation preview
15th International LS-DYNA® Users Conference Connections
June 10-12, 2018 1
Characterization and Modeling of Spot-Weld Joints with
*MAT_100_DA Parameter Optimization using LS-OPT®, and 3 Sheet Spot-weld Modeling Method Development in LS-DYNA®
Qaiser Khan1, Hassan Ghassemi-Armaki1, Amandeep Singh Gill2, Scott Zilincik2, Abhishek Gawade3
1ArcelorMittal Global R&D, East Chicago, IN, USA 2FCA Chrysler Technical Center, Auburn Hills, Michigan, USA
3Purdue University, Indianapolis, Formerly Intern at ArcelorMittal
Abstract Spot-weld strength is of crucial importance to the overall vehicle structural integrity and crash safety. With the innovation of Advanced High Strength Steels (AHSS), prediction of spot-weld fracture is of paramount importance in current and future vehicle designs. Spot-weld testing on AHSS intensive coupons was carried out in five different loading conditions, such as Tension-Shear, Coach-Peel, Cross-Tension and KSII configurations (30, 60 and 90 degrees). In spot-weld simulation, a combination of an eight element hexahedral assembly and *MAT_100_DA was used for defining the spot-weld failure criteria. *MAT_100_DA is a 3D stress-based failure surface model which requires the user to define failure stress and exponents for axial, shear and bending stress in order to fail a spot-weld nugget. These parameters are generated from the coupon testing performed in different loading conditions and has to be done for each individual spot-weld stackup in the vehicle. In the present study, LS-OPT optimization software has been used to generate these material card parameters by optimizing the parameters for different loading conditions. Failure force in simulation using optimized material parameters is compared with test failure force for individual coupons to check the robustness of optimization process. As a measure of capturing the effect of variation in assembly process, the effect of spot-weld diameter on failure parameters (stress and exponents) was studied. The failure parameters developed for a certain spot-weld diameter was used to predict the performance of a spot-weld with a different diameter. There are many three sheet stackups in a body structure. For calibration and testing of three sheets stackups, industry prefers to perform tests using only two sheets stackups because of simplicity. Failure surface for two sheet versus three sheet coupon CAE model was investigated. The simulation results of the three sheet CAE model shows reasonable conformance with test results performed for the three sheet stackup.
1.0 Introduction
Resistance spot welding (RSW) is the most common joining method in the automotive industry,
particularly for BIW applications. The main advantages of RSW include high speed, low cost, and the ability to weld a wide range of joint configurations with the same weld gun, lack of weld consumables, and ease of high volume automation. A typical vehicle contains approximately 2000-5000 spot-welds [1]. The joining strength is important to the overall structural integrity and vehicle crash safety.
Today’s automotive industry is mindful of reducing CO2 emissions and increasing fuel efficiency. To achieve these objectives, automakers are continuously working to reduce overall vehicle weight. Extensive use of Advanced High Strength Steels (AHSS) in the BIW is one of the ways to achieve this goal. With the most recent innovations in AHSS, automotive industry has been able to use a combination of low gage and high strength steels to design light weight body structures. However, joining of these high strength steels becomes challenging with lower gages, considering spot-weld strength is directly proportional to the thickness of underlying sheet metal. Hence, spot-weld failure prediction during virtual design stage of vehicle development is of vital importance. The paper, “Characterization and Modeling of Spot-Weld Joints in Press Hardening
15th International LS-DYNA® Users Conference Connections
June 10-12, 2018 2
Steels Associated with Softening in Heat Affected Zone” published in 11th European LS-DYNA Conference 2017, by the current authors, established a core CAE modeling technique for resistance spot-weld. The current paper addresses three separate, yet important connected challenges authors faced while studying spot-weld failure modeling. These are broadly categorized as follows:
1. Parameter optimization for *MAT_100_DA using LS-OPT. 2. Study the CAE simulation effect of weld diameter on spot-weld failure. 3. Investigate modeling methods for three steel sheet (3T) stackups.
2.0 Experimental Procedure and Material
A total of 6 stackups were tested and used for CAE correlation. Materials were welded with Medium Frequency Direct Current (MFDC) to achieve the targeted spot-weld size. The spot-weld testing on AHSS coupons was performed with different loading conditions, such as Tension-Shear, Coach-Peel, Cross-Tension and KSII configurations (30, 60 and 90 degrees) [2]. The shear test was used to capture effect of the shear forces on the spot-weld, similarly coach peel test was used to capture the effect of bending moment. KSII geometries were tested at three angles - 30, 60 and 90 degrees, called KSII-30, KSII-60 and KSII-90 hereafter, respectively. The KSII sample is designed to test the spot-weld axial strength when a load is applied in a 90° direction (normal to the spot-weld interface). KSII samples tested in 30° and 60° directions (pulling force applied at 30° and 60° to spot-weld interface, respectively) were used to evaluate spot-weld strength for a combination of axial and shear load. Force-displacement data was acquired from the tensile machine.
After mechanical tests were completed, minimum, maximum and average button sizes were measured. Failure modes were recorded, as Interfacial Failure (IF), Partial Interfacial Failure (PIF) or Plug Failure (PF). Table 1, shows the studied stackups. All of them, except stackup # 6, are three-layer stackups. Stackups have been called by numbers in first column and referenced hereafter using this number. Table 2, shows the weld strengths for all loading modes - tension shear, coach peel, KSII-30, 60 and 90. More detailed information about materials properties for HAZ in CAE modeling can be found in the previous paper published by the present authors [2].
Table 1. Studied Stackups, with description of materials, stackup configuration and aimed weld diameter
Stackup #
Spot-weld diameter
(mm)
A; Material (Thickness, mm)
B; Material (Thickness, mm)
C; Material (Thickness, mm)
1: A/B/C 6 Usibor® 1500 (2.5) CR02 GI (0.7) HSLA340 GI (1.5) 2: A/B/C 4.5 Usibor® 1500 (1.2) Usibor® 1500 (1.2) CR02 GI (0.7) 3: A/B/C 4.5 HSLA340 GI (1.2) Usibor® 1500 (1.2) CR02 GI (0.7) 4: A/B/C 4.5 TRIP690 GI (1.2) Usibor® 1500 (1.2) CR02 GI (0.7) 5: A/B/C 6 Usibor® 1500 (1.5) HSLA340 GI (1.2) TRIP690 GI (1.2) 6: A/B/C 6 HSLA340 GI (1.2) TRIP780 GI (1.54) NA
15th International LS-DYNA® Users Conference Connections
June 10-12, 2018 3
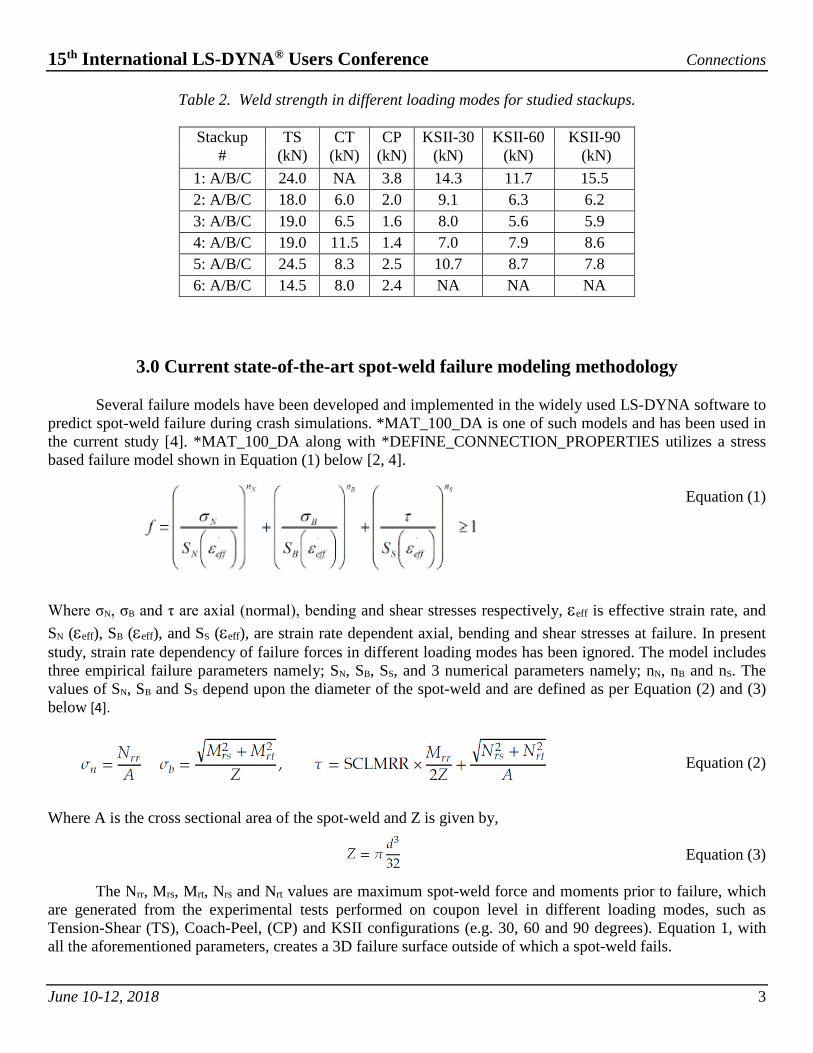
Table 2. Weld strength in different loading modes for studied stackups.
Stackup
# TS
(kN) CT
(kN) CP
(kN) KSII-30
(kN) KSII-60
(kN) KSII-90
(kN) 1: A/B/C 24.0 NA 3.8 14.3 11.7 15.5 2: A/B/C 18.0 6.0 2.0 9.1 6.3 6.2 3: A/B/C 19.0 6.5 1.6 8.0 5.6 5.9 4: A/B/C 19.0 11.5 1.4 7.0 7.9 8.6 5: A/B/C 24.5 8.3 2.5 10.7 8.7 7.8 6: A/B/C 14.5 8.0 2.4 NA NA NA
3.0 Current state-of-the-art spot-weld failure modeling methodology
Several failure models have been developed and implemented in the widely used LS-DYNA software to
predict spot-weld failure during crash simulations. *MAT_100_DA is one of such models and has been used in the current study [4]. *MAT_100_DA along with *DEFINE_CONNECTION_PROPERTIES utilizes a stress based failure model shown in Equation (1) below [2, 4].
Equation (1) Where σN, σB and τ are axial (normal), bending and shear stresses respectively, εeff is effective strain rate, and SN (εeff), SB (εeff), and SS (εeff), are strain rate dependent axial, bending and shear stresses at failure. In present study, strain rate dependency of failure forces in different loading modes has been ignored. The model includes three empirical failure parameters namely; SN, SB, SS, and 3 numerical parameters namely; nN, nB and nS. The values of SN, SB and SS depend upon the diameter of the spot-weld and are defined as per Equation (2) and (3) below [4].
Equation (2) Where A is the cross sectional area of the spot-weld and Z is given by,
Equation (3)
The Nrr, Mrs, Mrt, Nrs and Nrt values are maximum spot-weld force and moments prior to failure, which are generated from the experimental tests performed on coupon level in different loading modes, such as Tension-Shear (TS), Coach-Peel, (CP) and KSII configurations (e.g. 30, 60 and 90 degrees). Equation 1, with all the aforementioned parameters, creates a 3D failure surface outside of which a spot-weld fails.
15th International LS-DYNA® Users Conference Connections
June 10-12, 2018 4
3.1 Parameter optimization for *MAT_100_DA using LS-OPT
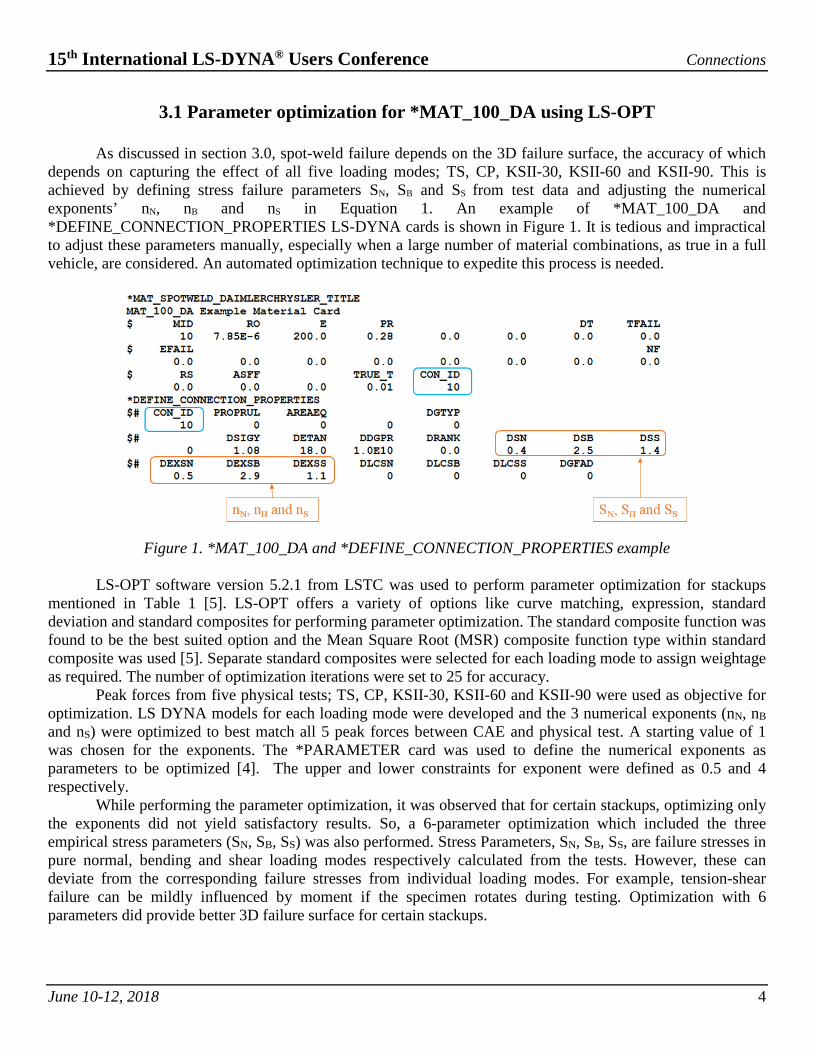
As discussed in section 3.0, spot-weld failure depends on the 3D failure surface, the accuracy of which depends on capturing the effect of all five loading modes; TS, CP, KSII-30, KSII-60 and KSII-90. This is achieved by defining stress failure parameters SN, SB and SS from test data and adjusting the numerical exponents’ nN, nB and nS in Equation 1. An example of *MAT_100_DA and *DEFINE_CONNECTION_PROPERTIES LS-DYNA cards is shown in Figure 1. It is tedious and impractical to adjust these parameters manually, especially when a large number of material combinations, as true in a full vehicle, are considered. An automated optimization technique to expedite this process is needed.
Figure 1. *MAT_100_DA and *DEFINE_CONNECTION_PROPERTIES example
LS-OPT software version 5.2.1 from LSTC was used to perform parameter optimization for stackups mentioned in Table 1 [5]. LS-OPT offers a variety of options like curve matching, expression, standard deviation and standard composites for performing parameter optimization. The standard composite function was found to be the best suited option and the Mean Square Root (MSR) composite function type within standard composite was used [5]. Separate standard composites were selected for each loading mode to assign weightage as required. The number of optimization iterations were set to 25 for accuracy.
Peak forces from five physical tests; TS, CP, KSII-30, KSII-60 and KSII-90 were used as objective for optimization. LS DYNA models for each loading mode were developed and the 3 numerical exponents (nN, nB and nS) were optimized to best match all 5 peak forces between CAE and physical test. A starting value of 1 was chosen for the exponents. The *PARAMETER card was used to define the numerical exponents as parameters to be optimized [4]. The upper and lower constraints for exponent were defined as 0.5 and 4 respectively.
While performing the parameter optimization, it was observed that for certain stackups, optimizing only the exponents did not yield satisfactory results. So, a 6-parameter optimization which included the three empirical stress parameters (SN, SB, SS) was also performed. Stress Parameters, SN, SB, SS, are failure stresses in pure normal, bending and shear loading modes respectively calculated from the tests. However, these can deviate from the corresponding failure stresses from individual loading modes. For example, tension-shear failure can be mildly influenced by moment if the specimen rotates during testing. Optimization with 6 parameters did provide better 3D failure surface for certain stackups.
15th International LS-DYNA® Users Conference Connections
June 10-12, 2018 5
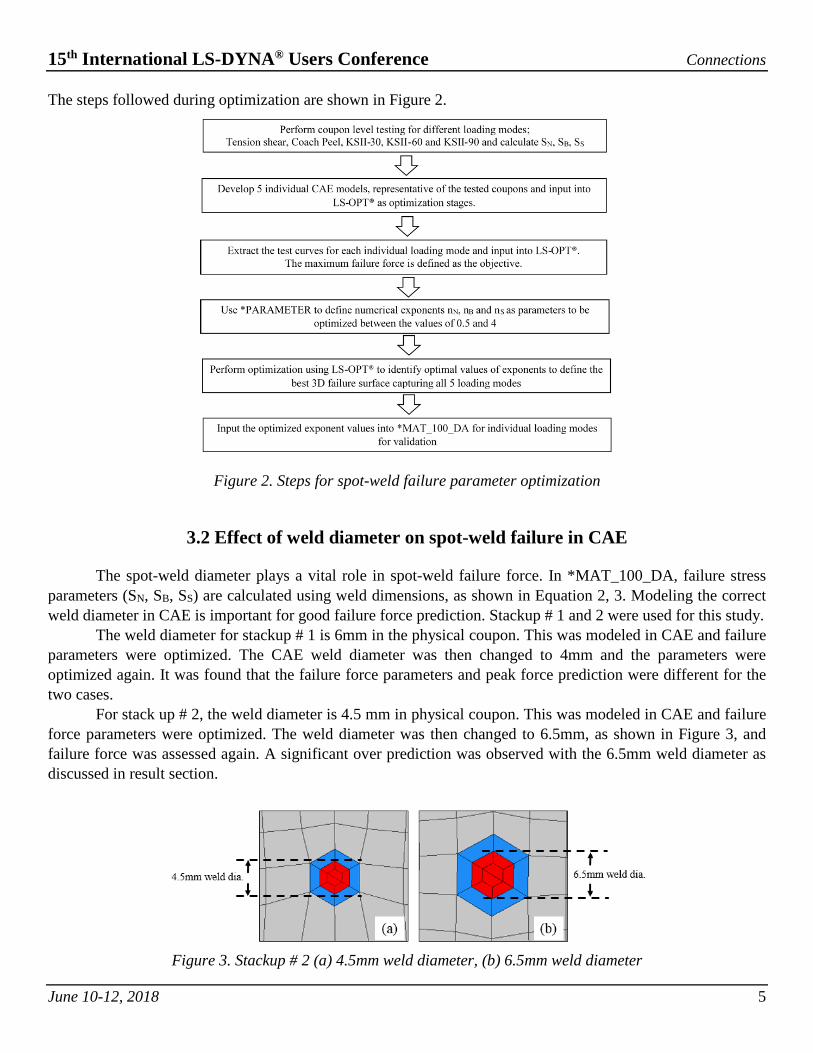
The steps followed during optimization are shown in Figure 2.
Figure 2. Steps for spot-weld failure parameter optimization
3.2 Effect of weld diameter on spot-weld failure in CAE
The spot-weld diameter plays a vital role in spot-weld failure force. In *MAT_100_DA, failure stress parameters (SN, SB, SS) are calculated using weld dimensions, as shown in Equation 2, 3. Modeling the correct weld diameter in CAE is important for good failure force prediction. Stackup # 1 and 2 were used for this study.
The weld diameter for stackup # 1 is 6mm in the physical coupon. This was modeled in CAE and failure parameters were optimized. The CAE weld diameter was then changed to 4mm and the parameters were optimized again. It was found that the failure force parameters and peak force prediction were different for the two cases.
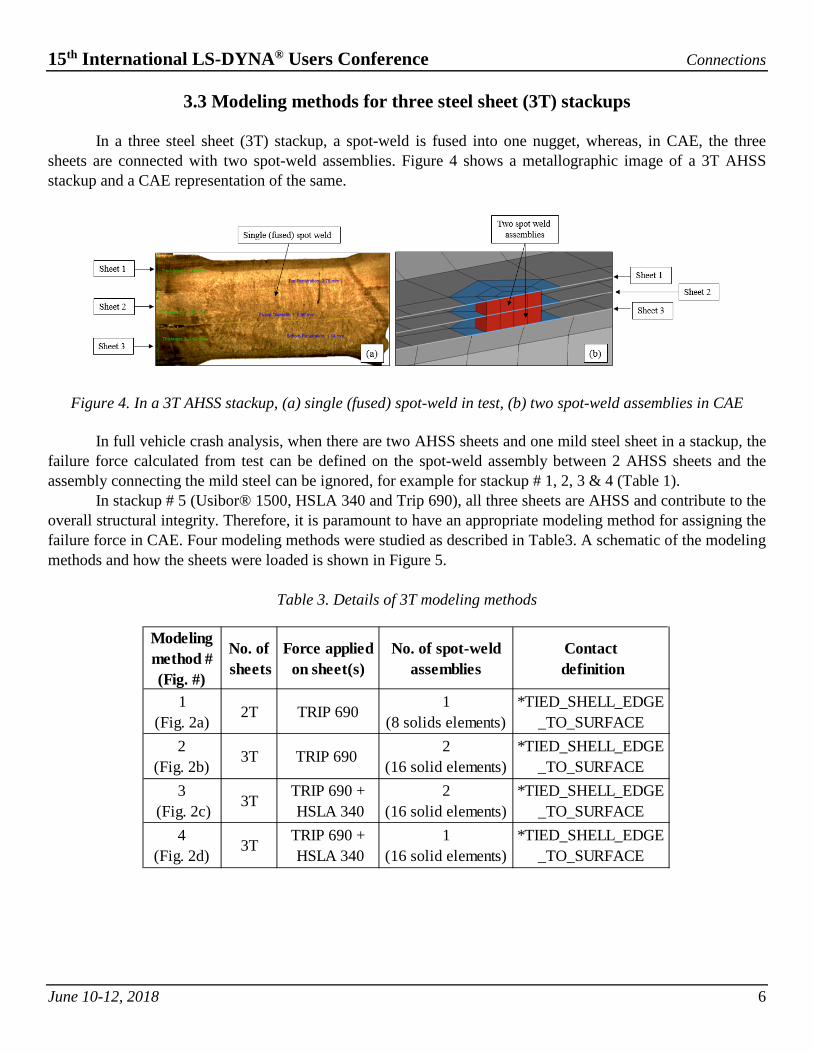
For stack up # 2, the weld diameter is 4.5 mm in physical coupon. This was modeled in CAE and failure force parameters were optimized. The weld diameter was then changed to 6.5mm, as shown in Figure 3, and failure force was assessed again. A significant over prediction was observed with the 6.5mm weld diameter as discussed in result section.
Figure 3. Stackup # 2 (a) 4.5mm weld diameter, (b) 6.5mm weld diameter
15th International LS-DYNA® Users Conference Connections
June 10-12, 2018 6
3.3 Modeling methods for three steel sheet (3T) stackups
In a three steel sheet (3T) stackup, a spot-weld is fused into one nugget, whereas, in CAE, the three
sheets are connected with two spot-weld assemblies. Figure 4 shows a metallographic image of a 3T AHSS stackup and a CAE representation of the same.
Figure 4. In a 3T AHSS stackup, (a) single (fused) spot-weld in test, (b) two spot-weld assemblies in CAE
In full vehicle crash analysis, when there are two AHSS sheets and one mild steel sheet in a stackup, the failure force calculated from test can be defined on the spot-weld assembly between 2 AHSS sheets and the assembly connecting the mild steel can be ignored, for example for stackup # 1, 2, 3 & 4 (Table 1).
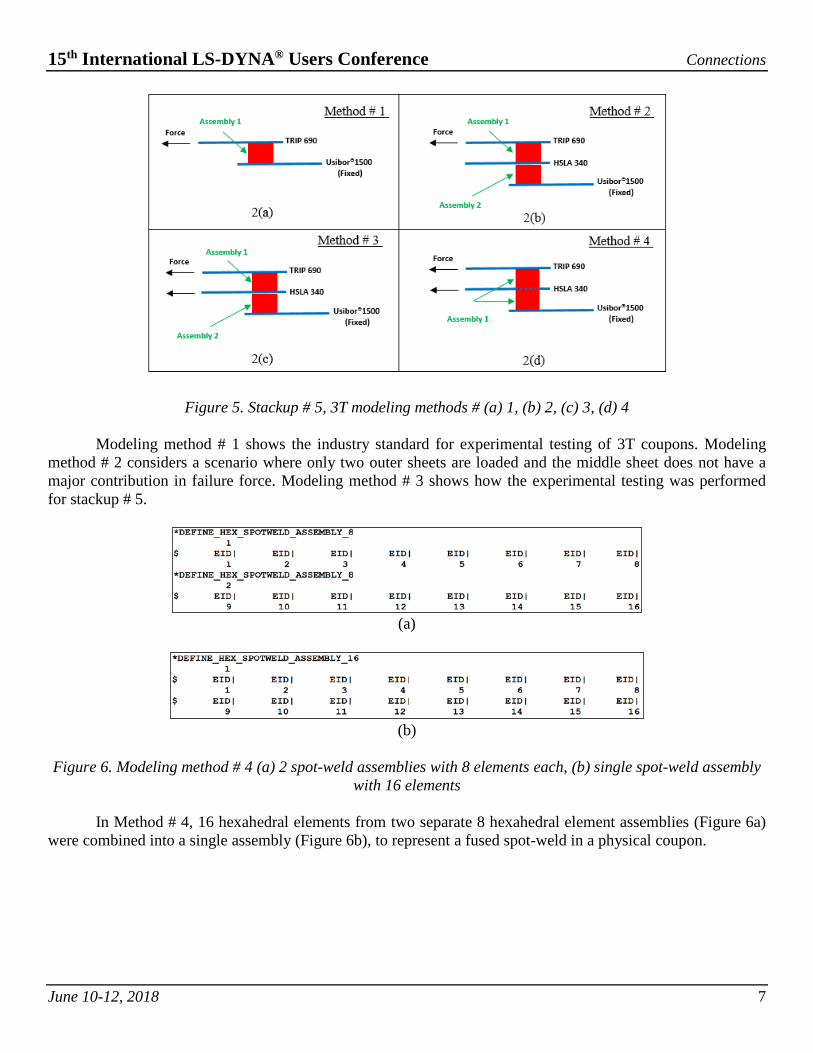
In stackup # 5 (Usibor® 1500, HSLA 340 and Trip 690), all three sheets are AHSS and contribute to the overall structural integrity. Therefore, it is paramount to have an appropriate modeling method for assigning the failure force in CAE. Four modeling methods were studied as described in Table3. A schematic of the modeling methods and how the sheets were loaded is shown in Figure 5.
Table 3. Details of 3T modeling methods
Modeling method # (Fig. #)
No. of sheets
Force applied on sheet(s)
No. of spot-weld assemblies
Contact definition
1 (Fig. 2a) 2T TRIP 690 1
(8 solids elements) *TIED_SHELL_EDGE
_TO_SURFACE2
(Fig. 2b) 3T TRIP 690 2 (16 solid elements)
*TIED_SHELL_EDGE_TO_SURFACE
3 (Fig. 2c) 3T TRIP 690 +
HSLA 340 2
(16 solid elements)*TIED_SHELL_EDGE
_TO_SURFACE4
(Fig. 2d) 3T TRIP 690 + HSLA 340
1 (16 solid elements)
*TIED_SHELL_EDGE_TO_SURFACE
15th International LS-DYNA® Users Conference Connections
June 10-12, 2018 7
Figure 5. Stackup # 5, 3T modeling methods # (a) 1, (b) 2, (c) 3, (d) 4
Modeling method # 1 shows the industry standard for experimental testing of 3T coupons. Modeling method # 2 considers a scenario where only two outer sheets are loaded and the middle sheet does not have a major contribution in failure force. Modeling method # 3 shows how the experimental testing was performed for stackup # 5.
(a)
(b) Figure 6. Modeling method # 4 (a) 2 spot-weld assemblies with 8 elements each, (b) single spot-weld assembly
with 16 elements
In Method # 4, 16 hexahedral elements from two separate 8 hexahedral element assemblies (Figure 6a) were combined into a single assembly (Figure 6b), to represent a fused spot-weld in a physical coupon.
15th International LS-DYNA® Users Conference Connections
June 10-12, 2018 8
4.0 Results and Discussion
A total of 6 stackups were tested and analysed to investigate three objectives as explains in section 3.
For each objective, CAE results were compared with the test.
4.1 Parameter optimization for *MAT_100_DA using LS-OPT
Table 4. Spot-weld failure force parameters for studied stackups.
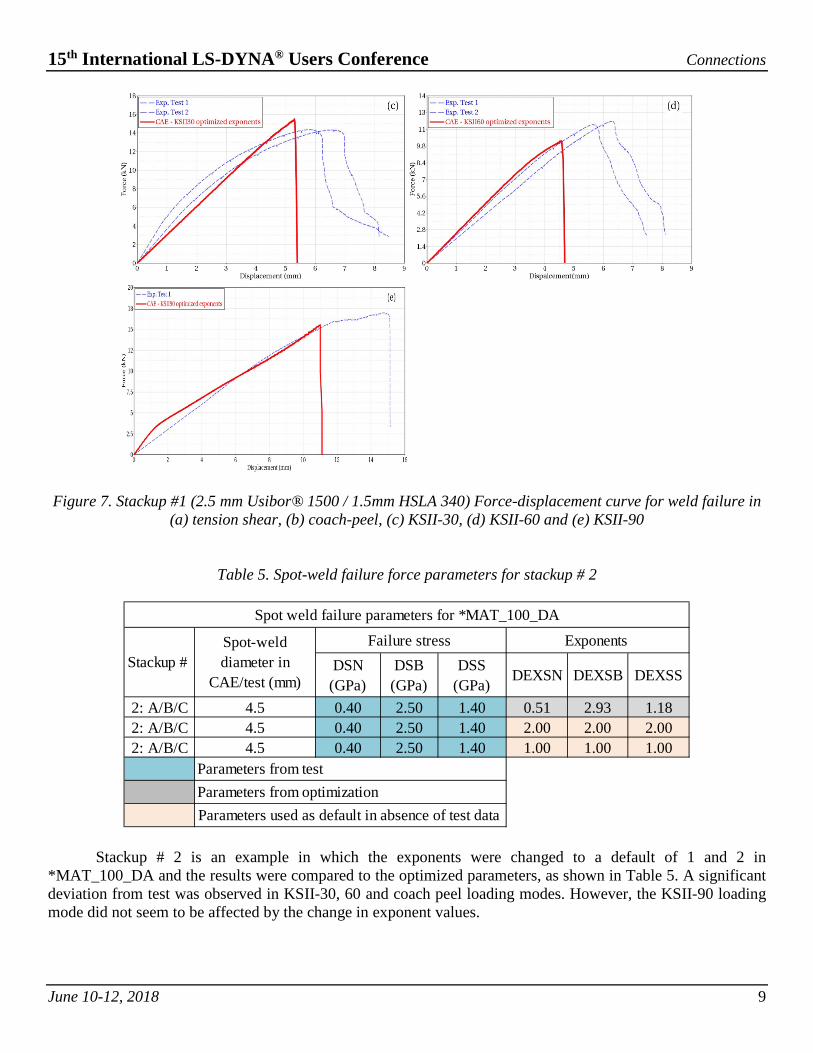
Table 4 shows input failure force parameters for *MAT_100_DA for all the tested stackups derived from optimization. For stackup # 1, the CAE to test correlation results are shown for the five coupon loading modes in Figure 7. The minimum and maximum are plotted from experimental curves to show the range of experimental test data.
DSN (GPa)
DSB(GPa)
DSS(GPa) DEXSN DEXSB DEXSS
1: A/B/C 0.66 1.00 2.40 1.90 3.05 3.992: A/B/C 0.40 2.50 1.40 0.51 2.93 1.183: A/B/C 0.33 0.81 1.00 3.87 0.63 2.134: A/B/C 0.65 1.80 1.20 3.48 3.27 2.185: A/B/C 0.28 1.51 1.51 0.94 3.89 2.456: A/B/C 0.34 1.30 0.88 0.51 1.62 3.24
Parameters from optimization Parameters from test
Spot-weld failure parameters for *MAT_100_DA
Stackup #
Failure stress Exponents
15th International LS-DYNA® Users Conference Connections
June 10-12, 2018 9
Figure 7. Stackup #1 (2.5 mm Usibor® 1500 / 1.5mm HSLA 340) Force-displacement curve for weld failure in
(a) tension shear, (b) coach-peel, (c) KSII-30, (d) KSII-60 and (e) KSII-90
Table 5. Spot-weld failure force parameters for stackup # 2
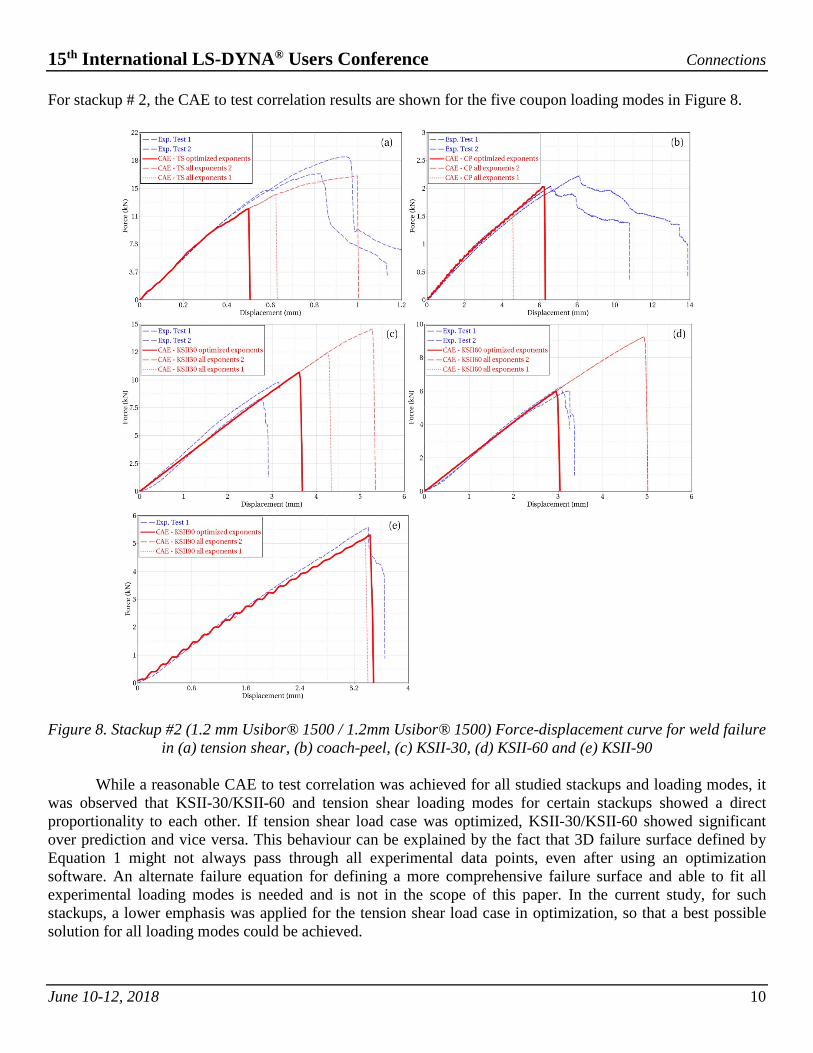
Stackup # 2 is an example in which the exponents were changed to a default of 1 and 2 in *MAT_100_DA and the results were compared to the optimized parameters, as shown in Table 5. A significant deviation from test was observed in KSII-30, 60 and coach peel loading modes. However, the KSII-90 loading mode did not seem to be affected by the change in exponent values.
DSN (GPa)
DSB (GPa)
DSS (GPa) DEXSN DEXSB DEXSS
2: A/B/C 4.5 0.40 2.50 1.40 0.51 2.93 1.182: A/B/C 4.5 0.40 2.50 1.40 2.00 2.00 2.002: A/B/C 4.5 0.40 2.50 1.40 1.00 1.00 1.00
Parameters from test Parameters from optimizationParameters used as default in absence of test data
Spot weld failure parameters for *MAT_100_DA
Stackup # Spot-weld diameter in
CAE/test (mm)
Failure stress Exponents
15th International LS-DYNA® Users Conference Connections
June 10-12, 2018 10
For stackup # 2, the CAE to test correlation results are shown for the five coupon loading modes in Figure 8.
Figure 8. Stackup #2 (1.2 mm Usibor® 1500 / 1.2mm Usibor® 1500) Force-displacement curve for weld failure
in (a) tension shear, (b) coach-peel, (c) KSII-30, (d) KSII-60 and (e) KSII-90
While a reasonable CAE to test correlation was achieved for all studied stackups and loading modes, it was observed that KSII-30/KSII-60 and tension shear loading modes for certain stackups showed a direct proportionality to each other. If tension shear load case was optimized, KSII-30/KSII-60 showed significant over prediction and vice versa. This behaviour can be explained by the fact that 3D failure surface defined by Equation 1 might not always pass through all experimental data points, even after using an optimization software. An alternate failure equation for defining a more comprehensive failure surface and able to fit all experimental loading modes is needed and is not in the scope of this paper. In the current study, for such stackups, a lower emphasis was applied for the tension shear load case in optimization, so that a best possible solution for all loading modes could be achieved.
15th International LS-DYNA® Users Conference Connections
June 10-12, 2018 11
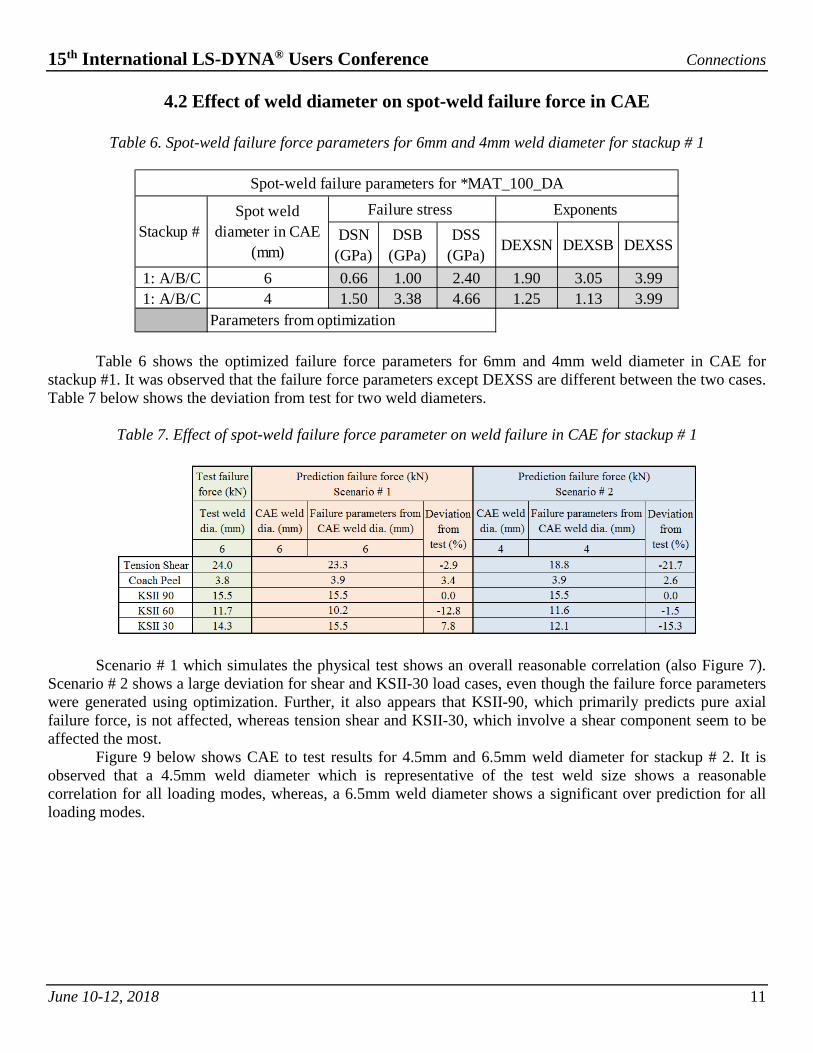
4.2 Effect of weld diameter on spot-weld failure force in CAE
Table 6. Spot-weld failure force parameters for 6mm and 4mm weld diameter for stackup # 1
Table 6 shows the optimized failure force parameters for 6mm and 4mm weld diameter in CAE for stackup #1. It was observed that the failure force parameters except DEXSS are different between the two cases. Table 7 below shows the deviation from test for two weld diameters.
Table 7. Effect of spot-weld failure force parameter on weld failure in CAE for stackup # 1
Scenario # 1 which simulates the physical test shows an overall reasonable correlation (also Figure 7). Scenario # 2 shows a large deviation for shear and KSII-30 load cases, even though the failure force parameters were generated using optimization. Further, it also appears that KSII-90, which primarily predicts pure axial failure force, is not affected, whereas tension shear and KSII-30, which involve a shear component seem to be affected the most.
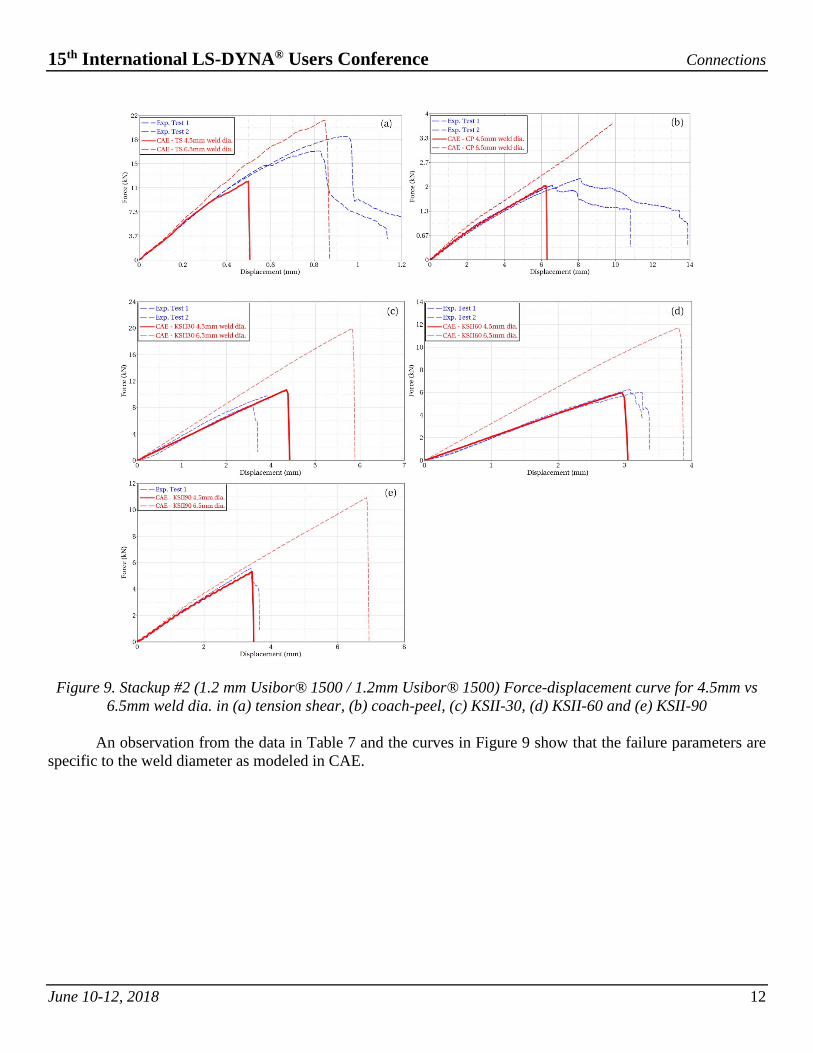
Figure 9 below shows CAE to test results for 4.5mm and 6.5mm weld diameter for stackup # 2. It is observed that a 4.5mm weld diameter which is representative of the test weld size shows a reasonable correlation for all loading modes, whereas, a 6.5mm weld diameter shows a significant over prediction for all loading modes.
DSN (GPa)
DSB (GPa)
DSS (GPa) DEXSN DEXSB DEXSS
1: A/B/C 6 0.66 1.00 2.40 1.90 3.05 3.991: A/B/C 4 1.50 3.38 4.66 1.25 1.13 3.99
Spot-weld failure parameters for *MAT_100_DA
Parameters from optimization
Stackup # Spot weld
diameter in CAE (mm)
Failure stress Exponents
15th International LS-DYNA® Users Conference Connections
June 10-12, 2018 12
Figure 9. Stackup #2 (1.2 mm Usibor® 1500 / 1.2mm Usibor® 1500) Force-displacement curve for 4.5mm vs 6.5mm weld dia. in (a) tension shear, (b) coach-peel, (c) KSII-30, (d) KSII-60 and (e) KSII-90
An observation from the data in Table 7 and the curves in Figure 9 show that the failure parameters are
specific to the weld diameter as modeled in CAE.
15th International LS-DYNA® Users Conference Connections
June 10-12, 2018 13
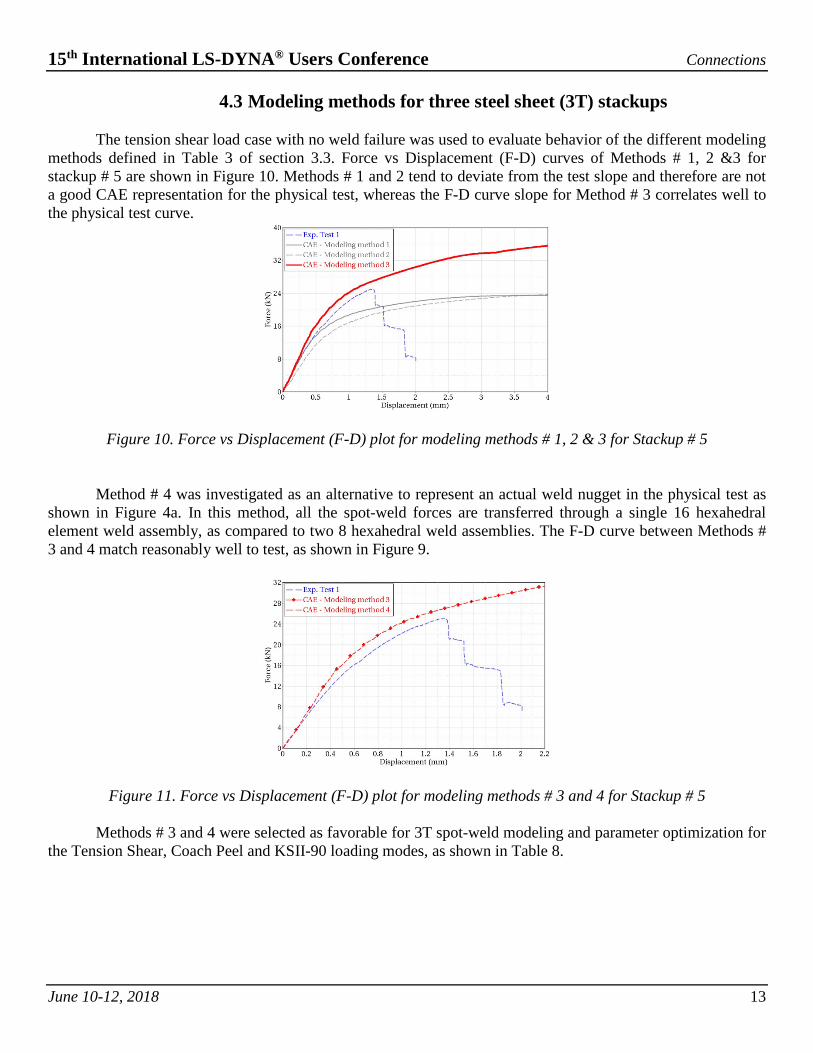
4.3 Modeling methods for three steel sheet (3T) stackups
The tension shear load case with no weld failure was used to evaluate behavior of the different modeling
methods defined in Table 3 of section 3.3. Force vs Displacement (F-D) curves of Methods # 1, 2 &3 for stackup # 5 are shown in Figure 10. Methods # 1 and 2 tend to deviate from the test slope and therefore are not a good CAE representation for the physical test, whereas the F-D curve slope for Method # 3 correlates well to the physical test curve.
Figure 10. Force vs Displacement (F-D) plot for modeling methods # 1, 2 & 3 for Stackup # 5
Method # 4 was investigated as an alternative to represent an actual weld nugget in the physical test as
shown in Figure 4a. In this method, all the spot-weld forces are transferred through a single 16 hexahedral element weld assembly, as compared to two 8 hexahedral weld assemblies. The F-D curve between Methods # 3 and 4 match reasonably well to test, as shown in Figure 9.
Figure 11. Force vs Displacement (F-D) plot for modeling methods # 3 and 4 for Stackup # 5
Methods # 3 and 4 were selected as favorable for 3T spot-weld modeling and parameter optimization for the Tension Shear, Coach Peel and KSII-90 loading modes, as shown in Table 8.

15th International LS-DYNA® Users Conference Connections
June 10-12, 2018 14
Table 8. Spot-weld failure force parameters for modeling methods # 3 and 4 for Stackup # 5
A reasonable CAE to physical test correlation for Methods # 3 and 4 was achieved as shown in Table 9.
Table 9. CAE to test failure force comparison of modeling methods # case 3 and 4 for Stackup # 5
In Method # 3, the spot-weld assembly # 2 (8 hexahedral element) reached failure and deleted, separating Usibor®1500 and HSLA 340 as shown in Figure 12a. In Method # 4 spot-weld assembly # 1 (16 hexahedral assembly) reached failure and deleted, separating all three sheets as shown in Figure 12b. Even though both modeling Methods # 3 and 4 achieve similar results, based on author’s experience, Method # 3 represents a more realistic approach for modeling 3T spot-weld stackups in full vehicle crash analysis.
Figure 12. Spot-weld assembly deletion in stackup # 5 for (a) Modeling method # 3, (b) Modeling method # 4
DSN (GPa)
DSB (GPa)
DSS (GPa) DEXSN DEXSB DEXSS
5: A/B/C 3 0.28 1.51 1.51 0.94 3.89 2.455: A/B/C 4 0.28 1.51 1.51 0.50 1.16 1.91
Parameters from test Parameters from optimization
Spot-weld failure parameters for *MAT_100_DA
Stackup # Modeling method #
Failure stress Exponents
Tension Shear (kN)
Coach Peel (kN)
KSII-90 (kN)
24.5 2.5 7.83 24.5 2.5 6.54 24.5 2.5 8.3
CAE Modeling method #
Test
15th International LS-DYNA® Users Conference Connections
June 10-12, 2018 15
5.0 Conclusion
This paper proposed a simulation method to generate the spot-weld failure material card parameter for
all physical tests (i.e tension shear, coach-peel, KSII-30, KSII-60, and KSII-90). The spot-weld failure material card parameters can be implemented for all loading modes that a spot-weld undergoes during full vehicle crash analysis. The CAE definition of spot-weld diameter plays a vital role in defining failure parameters. The failure parameters are directly proportional to weld nugget diameter. Hence it was proposed that weld nugget diameter specific failure parameter should to be used to capture realistic spot-weld failure behavior. The three sheet stackup CAE modeling methodology, described in the paper, is recommended when there are three high strength sheets welded together to capture spot-weld failure more accurately.
6.0 Future work
The current authors investigated weld damage option in *MAT_100_DA (Type 4) for damage prediction of the studied stackups [4]. Area under the test curve for each stackup and each loading mode was used to develop a fading energy for damage input in *MAT_100_DA. However, it did not work in all loading modes and the authors are investigating a loading path dependent damage as future work. An example of weld damage is show in Figure 13.
Figure 13. Spot-weld damage
For 3T stackup modeling, individual testing for assembly # 1 and 2 is part of future work as shown in Figure 14.
Figure 14. Future 3T stackup testing
15th International LS-DYNA® Users Conference Connections
June 10-12, 2018 16
References
1 M. Pouranvari, H. R. Asgari, S. M. Mosavizadch, P. H. Marashi & M. Goodarzi in “Effect of weld nugget size on overload failure
mode of resistance spot-welds”, Science and Technology of Welding and Joining, Volume 12, issue 3, 2007. 2 Hassan Ghassemi-Armaki, Qaiser Khan, Amandeep Singh Gill, Scott Zilincik in “Characterization and Modeling of Spot-Weld
Joints in Press Hardening Steels Associated with Softening in Heat Affected Zone”, LS-DYNA Conference 2017, Austria. 3 Y. P. Yang, Sheet Metal Welding Conference XV, 2012. 4 LS-DYNA. Keyword User’s Manual. Version 971, Livermore Software Technology Corporation, Livermore, 2007. 5 LS-OPT. Keyword User’s Manual. Version 5.2, Livermore Software Technology Corporation, Livermore, 2015.