Embed Size (px)
Citation preview

1
Characterization and Seismic Assessment of a Mixed
Masonry-Reinforced Concrete Building
João Pedro Silva
Instituto Superior Técnico, Universidade de Lisboa
October 2016
Abstract
‘Placa’ buildings represent a mixed typology constructive transition between the masonry and the
reinforced concrete (RC) buildings of Lisbon’s city, result of the urban expansion on the decade between
30 and 60 of the twentieth century. Due to the fact that they were constructed before the actual seismic
design regulations, it is important to analyze and assess seismically these types of buildings.
From a representative building of this typology, a three-dimensional model in BIM (Building
Information Modelling) representation about the building under consideration and other in 3D GIS (3D
Geographic Information Systems) representation about its geographic context was performed, in order
to improve not only the perception of its geometric characteristics and surrounding area, but also to
provide relevant building’s data storage and accessibility.
Afterwards, it was intended to evaluate the building’s seismic performance through non-linear static
analyses from a structural modeling of it, taking into account the effect of the adjacent buildings and
using the program 3MURI/TREMURI.
Concerning the seismic analysis performed, it can be concluded that the required safety verification for
the pseudo-triangular load pattern was achieved. However, structural safety was not verified for the
longitudinal direction of the building in case of the uniform lateral load distribution. Moreover, visible
significant damages in most reinforced concrete elements for all the cases analysed was presented,
revealing an inappropriate design of these elements for seismic actions and leading to the need of
implementing structural strengthening techniques.
Keywords ‘Placa’ building, ‘Bairro de Alvalade’, Building Information Modelling (BIM), 3D Geographic
Information Systems (3D GIS), Seismic Performance Assessment, Non-Linear Static Analysis
1 Introduction
Lisbon building stock is represented by a large
number of old buildings that shows seismic
vulnerability issues and in need of structural
intervention (Monteiro & Bento, 2012b). Taking
into account the seismic potential associated to
this city and ensuring the structural safety and
also the preservation of this building heritage, it is
important to assess their seismic behavior and, if
needed, to adopt strengthening solutions.
In agreement with Monteiro & Bento (2012a),
‘Placa’ buildings represent a significant stock of

2
Lisbon’s city and they are characterized as the
first masonry buildings where the reinforced
concrete structural elements were introduced,
which, in most of the cases, do not fulfill the
necessary specific design features to resist
seismic actions, as the actual earthquake-
resistance’s regulations recommend.
Thus, in this work is intended to structural
characterize and assess the seismic-base
performance of a representative building of
‘Placa’ typology. In order to support this seismic
vulnerability study, it was developed two three-
dimensional models, one in BIM (Building
Information Modeling) representation and other
in 3D GIS (3D geographic information systems)
representation that aim the improvement not only
in terms of visualization of geometric
characteristics and geographical context of the
building, but also providing a database,
management and reading tools of its structural
properties.
Using 3MURI/TREMURI (S.T.A. Data, 2005)
(Lagomarsino et al., 2013) program, static non-
linear analysis was performed to evaluate
the seismic performance of the building under
consideration, from the structural modelling and
after calibration of it, for the specific building and
taking into account the effect of the two adjacent
buildings.
2 Characterization and territorial
context of ‘Placa’ buildings
Lisbon building stock includes different
constructive typologies, derived of structural
proprieties changes throughout the history
of this city. ‘Placa’ buildings represent the end of
the period of “Gaioleiro” buildings, and resulted of
the urban expansion of the city between the
decades of 30 and 60 of the twentieth century
(Milošević et al., 2014). This type of construction
is characterized by the removal of wood structural
elements and adoption of reinforced concrete
elements and is predominantly in two areas of
Lisbon, namely ‘Bairro de Alvalade’ and ‘Bairro
dos Actores’.
2.1 Characterization of ‘Placa’
buildings
‘Placa’ constructive typology shows relevant
geometric and structural changes from ‘Gaioleiro’
buildings. In terms of exterior walls, they maintain
to be made of rubble stone or brick masonry, but
it a replacement of air lime mortar to hydraulic or
cement mortar. The thicknesses are between 0.4
m and 0.7 m and, in some cases, with a decrease
along the height (Milošević et al., 2014).
Regarding the interior walls, there was a
substitution of wood as principal material and use
of concrete blocks or brick masonry, with
thicknesses between 0.15 m and 0.25 m which
may also decrease along the height of the
building (Monteiro & Bento, 2012a).
Foundations are composed of very stiff stone
masonry and with a hydraulic mortar, working as
a continuous wall with a thickness superior to the
walls they support. Some buildings may also
have reinforced concrete foundations (Monteiro
& Bento, 2012a).
As mentioned before, there was an introduction
of reinforced concrete structural elements,
namely concrete slabs with a thickness between
0.07 m and 0.12 m, initially applied in back
balconies and wet areas (kitchens, bathrooms
and balconies) and, later, extended to the whole
floor. Afterwards, it was also implemented in
‘Placa’ building structure, as reinforced concrete
columns and beams (Monteiro & Bento, 2012a).
3
Regarding the geometry in the plan, these
buildings have two main configurations: (i)
rectangular and (ii) ‘Rabo de Bacalhau’,
presenting a rectangular format with a salient
shape in the back of the building
(Milošević et al., 2014).
2.2 ‘Bairro de Alvalade’
‘Bairro de Alvalade’ represents the area where
the study building is located. This neighborhood
was built to solve the problem of shortage in
housing supply registered during the second
quarter of the twentieth century, providing, in this
period, 45 000 inhabitants spread over 12 000
homes (Costa, 2010).
The area was divided in eight cells defined by the
main existing road structure, as seen on
Figure 1.
Figure 1 – ‘Bairro de Alvalade’ cells’ division layout (Costa, 2010)
All cells had a habitational purpose, with
affordable rented housing and cell 3 had also a
commercial use, being constructed with buildings
with double function (commercial ground floors
and residential upper floors). The most
representative building’s configuration in plane
for cell 3 is “Rabo de Bacalhau” (Costa, 2010)
and a specific building from this cell was chosen
in order to study its seismic behavior.
2.3 Building’s study
The building under study is the most
representative of the “Placa” buildings, type
‘Rabo de Bacalhau’, in terms of structural
proprieties and geometry. The selected building
is presented in Figure 2 and is located in a block
with buildings of the same type. Due to the fact
that adjacent structures have influence on a
building’s seismic behavior, the analyses were
performed taking into account the presence of the
two buildings adjacent to the study building.
Figure 2 - Study building's front facade
The structural and geometric data about the
building was obtained through consultation of
documents found in the Municipal Archives of
Lisbon of the building under consideration.
Additional information can be found in
Silva (2016).
This building has four floors, where the ground
floor has a commercial purpose and the three
upper floors are for habitational use, without any
major geometric and structural modifications.
The wall foundations are continuous and made of
stiff stone masonry with cement mortar and the

4
column foundations are constituted of reinforced
concrete.
The main and back facade walls are
characterized with a reinforced concrete frame
with the empty spaces filled with brick masonry
with 0,40 m of thickness. The side wall is
described as reinforced concrete wall with 0,20 m
and the interior walls with two possible structural
solutions, namely hollow brick and solid brick
masonry, with thicknesses between 0,15 m and
0,25 m.
The stairs and pavement structure are made of
reinforced concrete with 0,10 m of thickness.
A pine wood’s structure with tiles of Marseille type
characterize the roof of the building.
Regarding the existing reinforced concrete
beams and columns, they are placed in the main
and back facades, along the height of the
building, and in the interior of the ground floor.
3 Geometric characterization
In this work, it was adopted two information
representation approaches, namely a 3D
modelling of all the features of the study building
in one single information model through a BIM
representation and also a 3D modelling of the
surrounding e geographic context of the building
under consideration, using a 3D GIS
representation.
3.1 Study Building geometric
characterization
In order to contribute to a better understanding of
the geometric characteristics of the study building
and provide a data base of all the relevant
information of it, a BIM representation of this
structure was developed.
For the execution of the BIM model it was used
the Archicad (Graphisoft, 2015) software and it
was based on the documents collected in the
Lisbon Municipal Archive such as floor plans,
elevations, specific drawings, etc. For the model
conception was followed the procedure
described in Silva (2016)
The Figure 3 presents two views of the BIM
model produced for this study.
Figure 3 - BIM model (a) front facade view and (b) back facade view
Regarding the management and visualization of
the relevant data of the buildings, was attached a
set of links to specific existing objects in the
model, that directs to an online storage and
sharing service, as mentioned with more detail in
Silva (2016).
3.2 Geometric characterization of the
surrounding area
It was intended to study the surrounding area of
the building under consideration, thus a 3D GIS
model through CityEngine (ESRI, 2013) software
was made. The main feature of this program is to
automatically generate numerous buildings, in an
urban area, as 3D elements and with different
possible levels of detail.
(a) (b)
5
For the conception of this 3D urban
representation, data collected from Lisbon
Municipal Council, namely geographic data and a
digital elevation model of Lisbon’s city, and,
afterwards, the application of a set of shape
grammar rules to the geographic data was used.
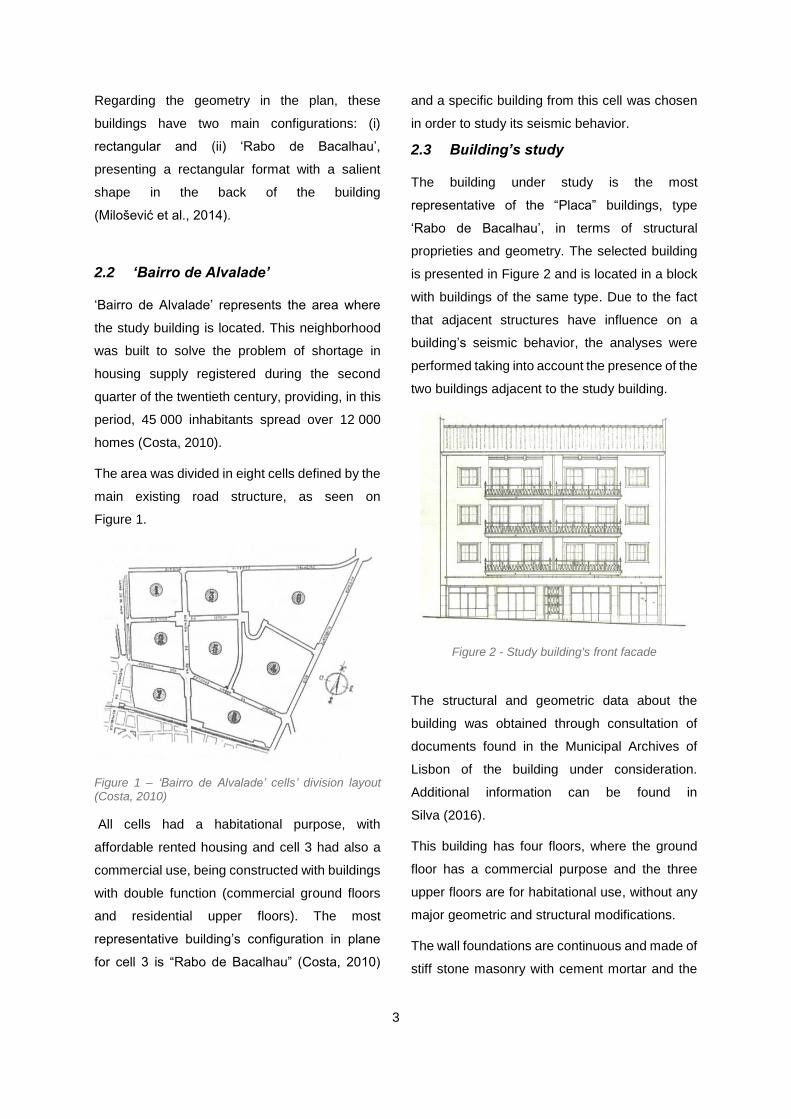
The Figure 4 presents the 3D GIS representation
of the urban area ‘Bairro de Alvalade’, cell 3,
where the building is placed. It is possible to
observe that it was assigned higher levels of
detail to the block where the building belongs, to
enhance the buildings with the same geometric
and structural proprieties.
Figure 4 - 3D GIS model of study area
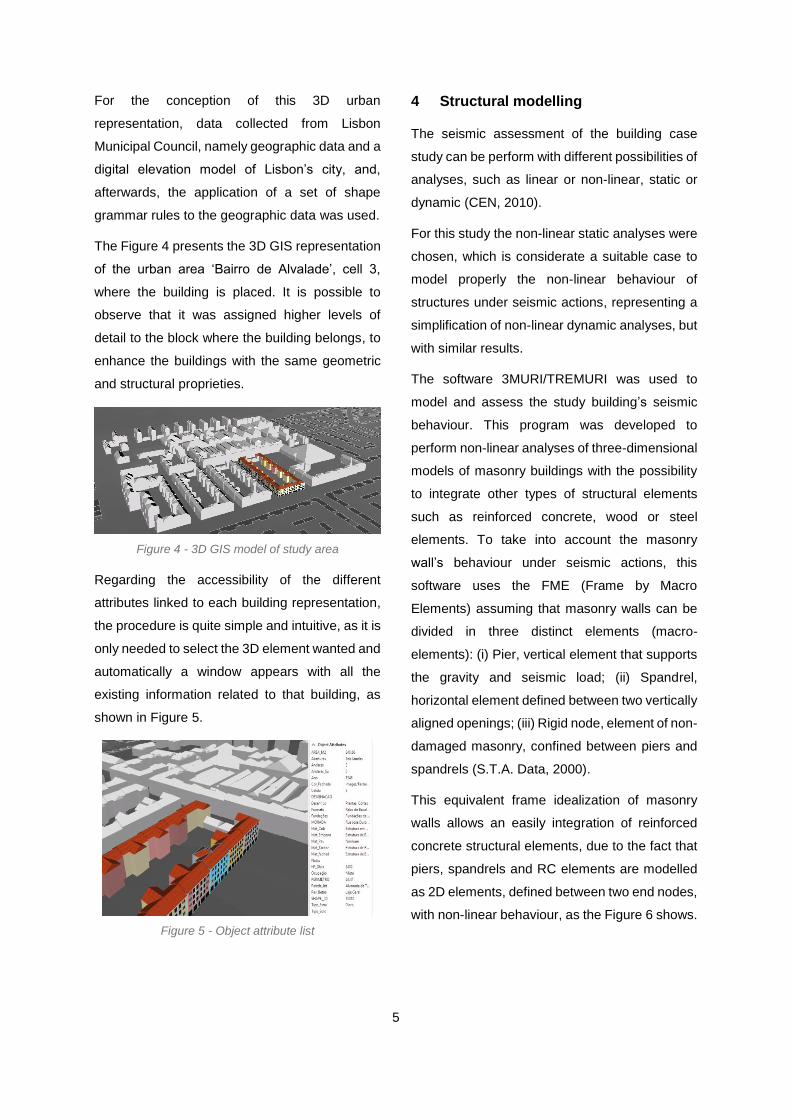
Regarding the accessibility of the different
attributes linked to each building representation,
the procedure is quite simple and intuitive, as it is
only needed to select the 3D element wanted and
automatically a window appears with all the
existing information related to that building, as
shown in Figure 5.
Figure 5 - Object attribute list
4 Structural modelling
The seismic assessment of the building case
study can be perform with different possibilities of
analyses, such as linear or non-linear, static or
dynamic (CEN, 2010).
For this study the non-linear static analyses were
chosen, which is considerate a suitable case to
model properly the non-linear behaviour of
structures under seismic actions, representing a
simplification of non-linear dynamic analyses, but
with similar results.
The software 3MURI/TREMURI was used to
model and assess the study building’s seismic
behaviour. This program was developed to
perform non-linear analyses of three-dimensional
models of masonry buildings with the possibility
to integrate other types of structural elements
such as reinforced concrete, wood or steel
elements. To take into account the masonry
wall’s behaviour under seismic actions, this
software uses the FME (Frame by Macro
Elements) assuming that masonry walls can be
divided in three distinct elements (macro-
elements): (i) Pier, vertical element that supports
the gravity and seismic load; (ii) Spandrel,
horizontal element defined between two vertically
aligned openings; (iii) Rigid node, element of non-
damaged masonry, confined between piers and
spandrels (S.T.A. Data, 2000).
This equivalent frame idealization of masonry
walls allows an easily integration of reinforced
concrete structural elements, due to the fact that
piers, spandrels and RC elements are modelled
as 2D elements, defined between two end nodes,
with non-linear behaviour, as the Figure 6 shows.

6
Figure 6 - Equivalent Frame Idealization of a mixed reinforced concrete-masonry structure (Cattari &
Lagomarsino, 2013)
About RC elements, the non-linear behaviour is
regarded as elasto-perfectly plastic with limited
resistance and plasticity concentrated at the end-
element (Lagomarsino et., 2008). Shear and
compressive/tensile failures are considered as
brittle failures while combined axial-bending
moment, modelled by plastic hinges at the end of
element, are assumed as ductile failure
(Lagomarsino et al., 2013). Once the collapse is
reached, for both failures, the element influence
to the global strength is only associated to its
capacity of carrying vertical loads, as well as in
the case of masonry elements (Lagomarsino et
al., 2008).
4.1 Numerical modelling and
calibration
It was intended that the computational model
represented all the relevant features of the study
building and the two adjacent buildings, as close
to reality as possible. Therefore, all material and
geometric proprieties of the structural elements
were set and the relevant vertical loads applied
to the structure defined.
Due to the inclination of the ground, the buildings
are not at the same level. However, 3MURI is not
designed to correctly represent the macro-
elements mesh this way; thus it was assumed the
three buildings have the same level of foundation,
representing a possible case in which this may
happen (Figure 7).
Figure 7 - 3MURI/TREMURI model
About the mechanical properties adopted for
each existing material, the values were based on
the results related to experimental tests from
buildings of the same typology, taking into
account the suggestion from Italian code for the
similar typology (NTC, 2008). However, in the
process of calibration of the numerical model,
using some dynamic in situ vibration tests of the
building under consideration as reference, it was
evident that the side walls may not be of
reinforced concrete, due to the high frequencies
of the building shown in the direction of these
walls. Since it was not possible to do in situ
analyses for the building’s characterisation,
existing literature on such buildings was checked
and it is possible that those walls could be made
of concrete blocks instead. For this case, the
modal frequencies were closer to the in situ tests
results, so it was assumed this material for the
side walls in this study.
Table 1 and 2 resumes all the material’s
proprieties adopted for this numerical model.

7
Table 1 - Masonry material proprieties
Masonry
Stone Hollow Brick
Solid Brick
Concrete Blocks
fm
(MPa) 2.33 1.66 7.19 5.81
𝜏
(MPa) 0.077 0.277 0.277 0.24
E (GPa)
0.82 2.95 5.73 2.15
G (GPa) 0.27 0.98 1.91 0.89
w (kN/m3) 21 15 18 14
Table 2 - Reinforced concrete material proprieties
Concrete C16/20
Steel S235
fm
(MPa) 32.40 171.10
𝜏
(MPa) - -
E (GPa)
29 210
G (GPa)
12.08 80.77
w (kN/m3)
25 79
𝜐 0.2 -
5 Seismic assessment
The seismic performance-based assessment
comprehends the determination of the
performance point of the building, computed from
the intersection between the capacity curve of the
structure and the seismic demand (in terms of
response spectrum).
As it is described in Standard NP EN 1998-3
(CEN, n.d.), for existing masonry buildings, Limit
State of Significant Damage should be
considered.
5.1 Non-linear static analysis
The non-linear static or pushover analysis,
characterizes the buildings’ seismic resist
through force-displacement curves (capacity
curves). These curves are defined applying
incremental static lateral forces to the structure,
measuring the displacements of a relevant point
of it and the corresponding base shear forces
(S.T.A. Data, 2000)
In this study, these analyses were performed in
TREMURI, for each main direction of the building
(𝑋 and 𝑌 in both directions) considering two load
patterns: (i) uniform, proportional to the mass;
and (ii) pseudo-triangular, proportional to the
product between the mass and height
(CEN, 2010). In Figures 8 and 9, the capacity
curves for 𝑋 and 𝑌, longitudinal and transversal
direction of the building are presented,
respectively.
Figure 8 - Capacity curves for 𝑋 direction
Figure 9 - Capacity curves for 𝑌 direction
0
1000
2000
3000
4000
5000
6000
7000
8000
9000
0 0,005 0,01 0,015 0,02 0,025 0,03
Bas
e Sh
ear
Forc
e (k
N)
Displacement (m)
Uniform X +Triangular X +Uniform X -Triangular X -
0
2000
4000
6000
8000
10000
12000
0 0,005 0,01 0,015 0,02 0,025
Bas
e Sh
ear
Forc
e (k
N)
Displacement (m)
Uniform Y +
Triangular Y +
Uniform Y -
Triangular Y -
8
The ultimate displacement was reached for 20%
decay of the maximum base shear force for all
cases (red cross representation), in accordance
with NP EN 1998-1 (CEN, 2010). From Figures 8
and 9, it is possible to observe that, for all cases,
the uniform load has a higher value of the base
shear force, which means that the pseudo-
triangular load is the most demanding load
pattern. However, in 𝑋 direction, the uniform
distribution leads to a less ductile behaviour, so
was assessed the seismic performance for this
case as well.
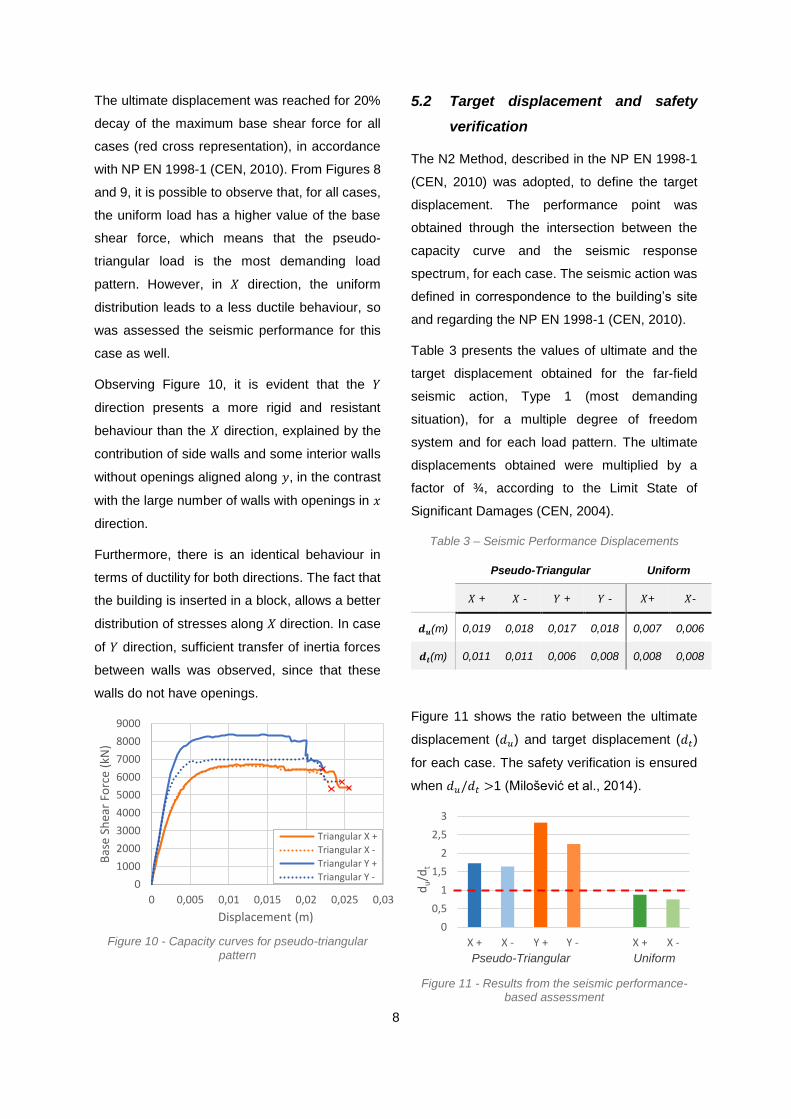
Observing Figure 10, it is evident that the 𝑌
direction presents a more rigid and resistant
behaviour than the 𝑋 direction, explained by the
contribution of side walls and some interior walls
without openings aligned along 𝑦, in the contrast
with the large number of walls with openings in 𝑥
direction.
Furthermore, there is an identical behaviour in
terms of ductility for both directions. The fact that
the building is inserted in a block, allows a better
distribution of stresses along 𝑋 direction. In case
of 𝑌 direction, sufficient transfer of inertia forces
between walls was observed, since that these
walls do not have openings.
Figure 10 - Capacity curves for pseudo-triangular pattern
5.2 Target displacement and safety
verification
The N2 Method, described in the NP EN 1998-1
(CEN, 2010) was adopted, to define the target
displacement. The performance point was
obtained through the intersection between the
capacity curve and the seismic response
spectrum, for each case. The seismic action was
defined in correspondence to the building’s site
and regarding the NP EN 1998-1 (CEN, 2010).
Table 3 presents the values of ultimate and the
target displacement obtained for the far-field
seismic action, Type 1 (most demanding
situation), for a multiple degree of freedom
system and for each load pattern. The ultimate
displacements obtained were multiplied by a
factor of ¾, according to the Limit State of
Significant Damages (CEN, 2004).
Table 3 – Seismic Performance Displacements
Pseudo-Triangular Uniform
𝑋 + 𝑋 - 𝑌 + 𝑌 - 𝑋+ 𝑋-
𝒅𝒖(m) 0,019 0,018 0,017 0,018 0,007 0,006
𝒅𝒕(m) 0,011 0,011 0,006 0,008 0,008 0,008
Figure 11 shows the ratio between the ultimate
displacement (𝑑𝑢) and target displacement (𝑑𝑡)
for each case. The safety verification is ensured
when 𝑑𝑢/𝑑𝑡 >1 (Milošević et al., 2014).
Figure 11 - Results from the seismic performance-based assessment
0
1000
2000
3000
4000
5000
6000
7000
8000
9000
0 0,005 0,01 0,015 0,02 0,025 0,03
Bas
e Sh
ear
Forc
e (k
N)
Displacement (m)
Triangular X +
Triangular X -
Triangular Y +
Triangular Y -
0
0,5
1
1,5
2
2,5
3
X + X - Y + Y - X + X -
du/d
t
Pseudo-Triangular Uniform

9
It is possible to conclude that the pseudo-
triangular distribution verifies the safety for all
directions, whereas for the uniform load pattern
this safety criterion is not satisfied.
Although the uniform distribution, in 𝑋 direction,
presents higher base shear forces in relation with
pseudo-triangular distribution (Figure 8), this load
pattern is the most demanding case for this
direction.
In Figure 12 the damage pattern for the ultimate
displacement of the uniform distribution for 𝑋
direction is presented.
Figure 12 - Damage pattern of the ultimate displacement for Uniform Distribution in x direction for
(a) front facade (b) back facade and (c) an exterior wall align along x direction
Observing Figure 12, it is evident the presence of
relevant damages in the structure, specifically
shear collapse in some masonry elements and
flexural damages on all columns on ground level.
This displacement does not constitute a situation
which causes a structural collapse, but it should
be to highlighted the presence of shear collapse
(orange outline) and flexural collapse (red
outline) in the reinforced concrete beams in the
front façade (Figure 12 (a)).
Further analyses have been made, presented on
Silva (2016).
6 Conclusions
‘Placa’ building represents a mixed constructive
typology with masonry and reinforced concrete
structural elements. Due to its widespread
availability and lack of seismic vulnerability
studies about this type of buildings, in this work a
characterization and a seismic performance-
based assessment through non-linear static
analyses of a representative ‘Placa’ building set
within a band of its block was presented.
Regarding the geometric and surrounding area
characterization, it was performed two three-
dimensional models in BIM representation and
3D GIS representation, which improved the
detailed understanding of the geometry
characteristics of the study element and allowed
an integrated management of the building’s
information and its territorial context, through the
possibility to access, manipulate and visualize
the collected data.
The non-linear static analyses were performed
using 3MURI/TREMURI software and the
capacity curves were defined for both main
directions and for uniform and pseudo-triangular
load pattern.
About the results of the seismic assessment, the
safety verification was satisfied for the pseudo-
triangular load pattern, but not for the case of
uniform load distribution in 𝑥 direction for the far
field seismic action.
Observing the damage distribution for the
ultimate displacement of the uniform load pattern
(a)
(b) (c)

10
in 𝑋 direction, it was noticeable the existence of
significant damages and even collapse of
masonry elements and reinforcement concrete
beams. This fact led to the conclusion that there
is an inappropriate design of RC elements to
resist seismic actions and, therefore, a need to
adopt solutions of strengthening and retrofitting
of these elements.
As mentioned before, the structural model
developed does not represent the real existing
situation, because of the building’s foundation
level alignment assumed, which do not consider
the relevant action of the concrete slabs over the
side walls that separate two buildings. Also it
would be beneficial for the improvement of this
study, the execution of in situ material
characterization.
References
CEN (n.d.) NP EN 1998-3: Eurocódigo 8 -
Projecto de Estruturas para resistência aos
sismos. Parte 3: Avaliação e reabilitação de
edifícios, Instituto Português da Qualidade,
European Committee for Standardization.
CEN (2004) EN 1998-3: Eurocode 8 - Design of
structures for earthquake resistance. Part 3:
Assessment and retrofitting of buildings,
European Committee for Standardization.
CEN (2010). NP EN 1998-1: Eurocódigo 8 -
Projecto de Estruturas para resistência aos
sismos. Parte 1: Regras gerais, acções sísmicas
e regras para edifícios, Instituto Português da
Qualidade, European Committee for
Standardization.
Cattari, S., Lagomarsino, S. (2013) - Seismic
assessment of mixed masonry-reinforced
concrete buildings by non-linear static analysis,
Earthquake and Structures, 4 (3): pp 241-264.
Costa, J. (2010) - Bairro de Alvalade: Um
Paradigma no Urbanismo Português, Livros
Horizonte, Lisbon.
ESRI (2013) CityEngine Program, version
2013.1.
Graphisoft (2015) ArchiCAD Program, version 19
Lagomarsino, S., Galasco, A., Penna, A., e
Cattari, S. (2008) - TREMURI User Guide,
University of Genova, Italy.
Lagomarsino, S., Penna, A., Galasco, A., e
Cattari, S. (2013) TREMURI program: An
equivalent frame model for the nonlinear seismic
analysis of masonry buildings, Engineering
Structures, 56, pp 1787–1799, DOI
10.1016/j.engstruct.2013.08.002.
Milošević J., Bento R., Cattari S. (2014) - Seismic
assessment of a “Placa” building in Lisbon,
Proceedings of the 2nd European Conference on
Earthquake Engineering and Seismology,
Istanbul, Turkey.
Monteiro M., Bento R. (2012a) - Characterization
of ‘Placa’ Buildings, Relatório ICIST DTC nº
02/2012, Lisbon, Portugal.
Monteiro, M., Bento, R. (2012b) - Seismic
Assessment of a ‘Placa’ Building, Relatório ICIST
DTC nº 20/2012, Lisbon, Portugal.
NTC (2008) Norme Tecniche per le Costruzioni,
Silva, J. (2016) - Caracterização e Avaliação
Sísmica de um Edifício Misto Alvenaria-Betao,
Instituto Superior Técnico, Universidade de
Lisboa.
S.T.A. Data (2000) - 3Muri – General Description.
S.T.A. Data (2005) - 3Muri program: Seismic
analyser of 3D masonry buildings, S.T.A. Data
s.r.l., version 5.5.110.