Embed Size (px)
Citation preview
CHARACTERIZATION AND TREATMENT OF BRINE WASTEWATERS
FROM THE CUCUMBER PICKLE INDUSTRY
Linda W. L i t t l e James C . Lamb I11 Louise F. Horney
U N C Wastewater Research Center Department of Environmental Sciences and Engineering
School of Pub1 i c Health University of North Carolina a t Chapel Hill
The work upon which t h i s publication i s based was supported i n pa r t by funds provided by the Office of Water Research and Technology, U . S. Department of the In t e r i o r , through the Water Resources Research I n s t i t u t e of The University o f North Carolina as authorized under the Water Resources Research Act of 1964, as amended, and i n pa r t by funds provided by Pickle Packers International , Inc. , St . Charles, I l l i n o i s .
Project No. A-079-NC Agreement No. 14-31 -0001 -4033, FY 1974
May, 1976
ESE Publication No. 399

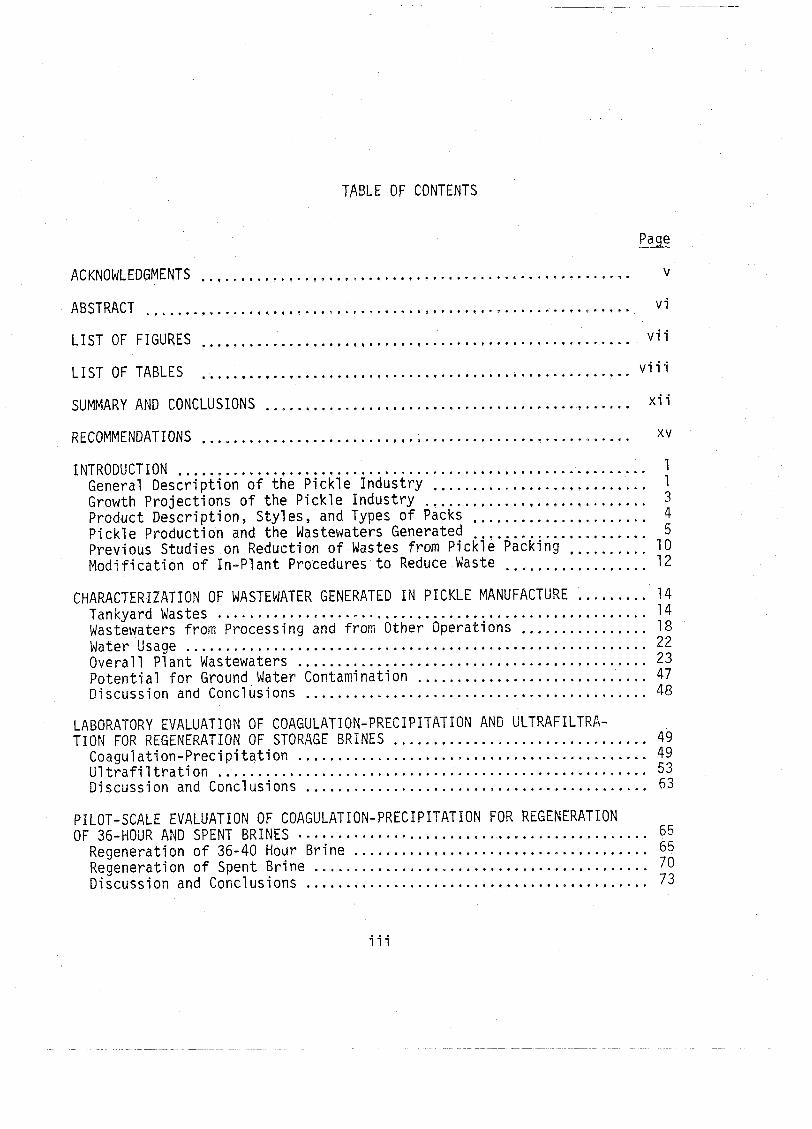
TABLE OF CONTENTS
................................. ................... ACKNOWLEDGMENTS ,. v
ABSTRACT .......................... ,.. ................................ v i
LIST OF TABLES ...................................................... v i i i
SUMMARY AND CONCLUSIONS ................................ ... .......... x i i
RECOMMENDATIONS ...................................................... x v
INTRODUCTION ............................ .. ............................. 1 General Desc r i p t i on o f t h e P i c k l e I n d u s t r y ........................... 1 Growth P ro jec t i ons o f t he P i c k l e I n d u s t r y ............................ 3 Product Descr ip t ion . S ty les . and Types o f Packs ...................... 4 P i c k l e Product ion and the Wastewaters Generated ...................... 5 Previous Studies on Reduction o f Wastes from P i c k l e Packing .......... 10 M o d i f i c a t i o n of In -P l an t Procedures t o Reduce Waste .................. 12
......... CHARACTERIZATION OF WASTEWATER GENERATED IN PICKLE MANUFACTURE 14 Tankyard Wastes ...................................................... 14 Wastewaters from Processing and from Other Operat ions ................ 18 Water Usage .......................................................... 22 Overa l l P lan t Wastewaters ........................................*... 23 P o t e n t i a l f o r Ground Water Contamination ............................. 47 Discussion and Conclusions ........................................... 48
LABORATORY EVALUATION OF COAGULATION-PRECIPITATION AND ULTRAFILTRA- TION FOR REGENERATION OF STORAGE B R I N E S ................................ 49
Coagu la t i on -P rec ip i t a t i on ............................................ 49 U l t r a f i l t r a t i o n ...................................................... 53 Discussion and Conclusions ........................................... 63
PILOT-SCALE EVALUATION OF COAGULATION-PRECIPITATION FOR REGENERATION OF 36-HOUR AND SPENT BRINES ............................................ 65
Regeneration of 36-40 Hour Br ine ..................................... 65 Regeneration o f Spent B r i ne .......................................... 70 Discussion and Conclusions ......................................... 73 ..
iii
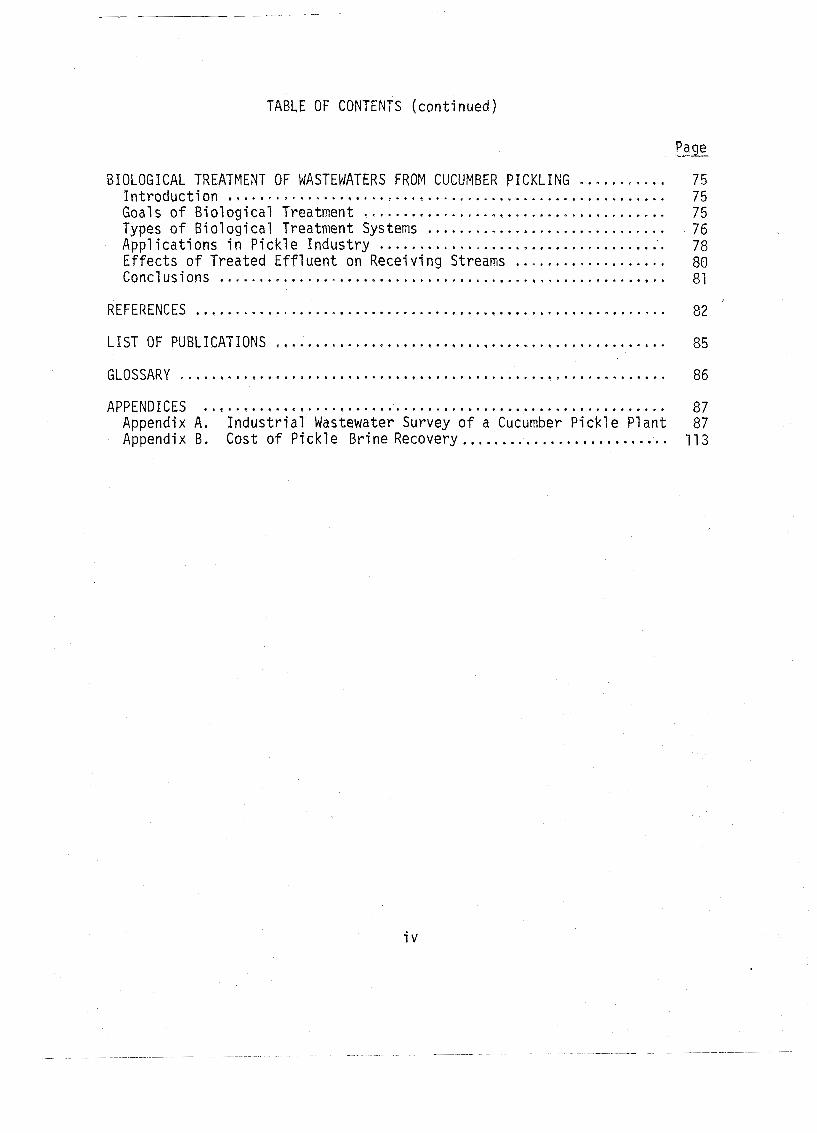
TABLE OF CONTENTS (cont inued)
........... BIOLOGICAL TREATMENT OF WASTEWATERS FROM CUCUMBER PICKLING 75 .............................. . I n t r o d u c t i o n ..*.................,... 75
...................................... Goals o f B i o l o g i c a l Treatment 75 .............................. Types o f B i o l o g i c a l Treatment Systems 76
App l i ca t i ons i n P i c k l e I n d u s t r y .................................... 78 E f f e c t s o f Treated Ef f luen t on Receiv ing Streams ................... 80 Conclusions ....................................................... 81
I ........................................................... REFERENCES 82
LIST OF PUBLICATIONS ................................................. 85
GLOSSARY ......................................................... 86
.......................................................... APPENDICES 87 Appendix A . I n d u s t r i a l Wastewater Survey o f a Cucumber P i c k l e P lan t 87 . Appendix B Cost of P i c k l e Br ine Recovery .......................... 113
This project was conducted by faculty and students of the Department of Environmental Sciences and Engineering, School of Pub1 1 c Heal t h y University of North Carolina a t Chapel Hill .
The project was supported by the Water Resources Research Ins t i tu te of The University of North Carolina and by Pickle Packers International, Inc., Saint Charles, I l l ino is . A major factor making th i s report possible was the excellent cooperation by members of PPI, especially the PPI Ecology Committee chaired by Mr. Herman B l u m of Vlasic Foods, Inc. Special recognition i s due to the management and s t a f f of the three North Carolina pickle packers -- Mount 01 ive Pickle Company, Mount 01 ive; Perfect Packed Products, Henderson; and Cates Pickle Company, Faison.
The in teres t and assistance of Mr. Thomas A . Bell of the USDA-ARS Food Fermentation Laboratory, Raleigh, N . C . were invaluable before and throughout the study.
Ms. Horney was supported by an Alumni Fellowship and by a Young Carolinian Environmental Fellowship from Fi rs t Union National Bank.
The analytical assistance of the U N C Wastewater Research Center and the UNC Limnology Laboratory, especially the i r patience and perseverance in analyz- ing concentrated brine samples, i s gratefully acknowledged.
Finally, thanks are due Mrs. Delores Plummer for her patient typing and retyping of the draf t s and final manuscript.

ABSTRACT
Pickling i s one of the o ldes t means of food preservation. Currently,
the U. S . cucumber pickle industry i s a $500 m i l l ion/year industry involving
39 s t a t e s . Wastes from pickling operations are characterized by high chloride
content , high oxygen demand, low pH, and high t o t a l and suspended so l ids .
Waste treatment technology for removing suspended sol ids , reducing oxygen de-
mand, and neutral iz ing pH i s ava<labZe, but no economical method for removing
s a l t i s available. The pickling industry i s faced wi th the task of dras t i ca l l y
reducing s a l t content o f i t s e f f l uen t s .
Industrial water and wastes surveys uere conducted a t two pickle companies.
Water usage and waste character is t ics were determined on major un i t operations,
including tankyard brining, desal t ing and processing, s l i c i ng and cu t t ing opera-
t ions , and pasteurization. Laboratory and p i l o t scale s tud ies were performed
t o evaluate potential for reeyezing concentrated tankyard brines. Both a high
pH coagulation-precipitation procedure and an u l t r a f i l t r a t i o n procedure were
inves t igated. A "desk-top" evaluation o f various brine treatment ppocesses
compared t h e i r cos t -e f fec t iveness .
The study indicated t ha t in-plant water and s a l t usage could be substan-
t i a l l y reduced by c loser management and be t t e r housekeeping; t ha t tankyard
brines could be treated and reused a t l ea s t once wi th no sac r i f i c e of product
qual i ty; and tha t e x i s t i ng wastewater treatment f a c i l i t i e s (aerated lagoons)
could be upgraded t o improve BOD and so l ids removal. AdditionaZZy, the r e s u l t s
o f the study provide a detailed characterization of the types and concentration
of components of waste streams from u n i t operations i n cucumber pickle produc-
t ion .

LIST OF FIGURES
Page
1 . Flow Chart of Typical Unit Processes in the Production of Fresh-Pack and Processed Cucumber Pickles .................... 6
2, Diagram of Layout of Plant A . . . . . . . . . . . . . . . . . . . . . . . . . . . . . . . . . . . 42
3 . Retention of Ul t ra f i l te rs . . . . . . . . . . . . . . . . . . . . . . . . . . . . . . . . . . . . . . . 53
4. Effect- of Seri-a1 Ul t r a f i l t ra t ion on Pectinase Activity i n 36-Mr Brine . . . . . . . . . . . . . . . . . . . . . . . . . . . . . . . . . . . . . . . . . . . . . . . . 60
5. Effect of Ultraf i l t ra t ion on Pectinase Activity in Spent Brine . . . . . . . . . . . . . . . . . . . . . . . . .. . . . . . . . . . . . . . . . . . . . . . . . . . 61
6. Flux During Serial Ultraf i l t ra t ion ............................. 62
Appendix A
1 . Sketch of Sewer System a t Plant . . . . . . , . . . . . . . . . . . . . , . , , . , . . . . . . 94
2. Daily pH Monitoring of Lagoon Simulation Units . , . . . . . . , , . , . , . . . 103
3 . Titration Curves for Untreated Wastewater ...................... 108
4. Effects of Low pH and High Sal t Shock Loading Upon Respiration,, 111
Appendix B
1 . Schematic of Stream Flows i n Pickle Processing .............,,.. 118

LIST OF TABLES
Page
..................... 1 . Production of Cucumbers for Pickles in 1972 2
2 . Economic Aspects of Cucumber Production and Pickling Process- ing in North Carolina ........................................... 3
3 . Pickle Consumption in the United States ......................... 3 4 . Salt (.NaCl) Solution Conversion Chart ................... .. ...... 7
........... 5 . Characteristics of Wastewaters from Pickle Manufacture 15
6 . Characteristics of Wastewater from Unit Processes in Pickle Manufacture ..................................................... 15
........................................... 7 . Analytical Procedures 16
.............. 8 . Characterization of Tankyard Brines from Cucumbers 17
9 . Tankyard Brine Compared to Typical Domestic Sewage .............. 18 10 . Characteristics of 36-Hour Drain. Plant A. 1974 ................ 19 11 . Characterization of Tankyard Brines from Mi scel 1 aneous
Vegetables. Plant A. 1974 ....................................... 19 12 . Characterization of Wastewater Flows from Processing Various
Pickle Products ................................................ 20 13 . Characterization of Wastewater from Chip Machine. Plant A .
1974 ............................................................ 21 ... 14 . Wastewater Characteristics. Salad Cubes Machine. Plant A. 1974 21
15 . Characterization of Wastewater from Pricking Machine. Plant A ... 22 16 . Tankyard Water Usage. Plant A. March.August. 1974 ............... 24 17 . Water Usage. Whole Pickle Machine. Plant A. June.Ju1y. 1974 ..... 29 18 . Water Usage. Strip Machine. Plant A. July. 1974 ................. 30
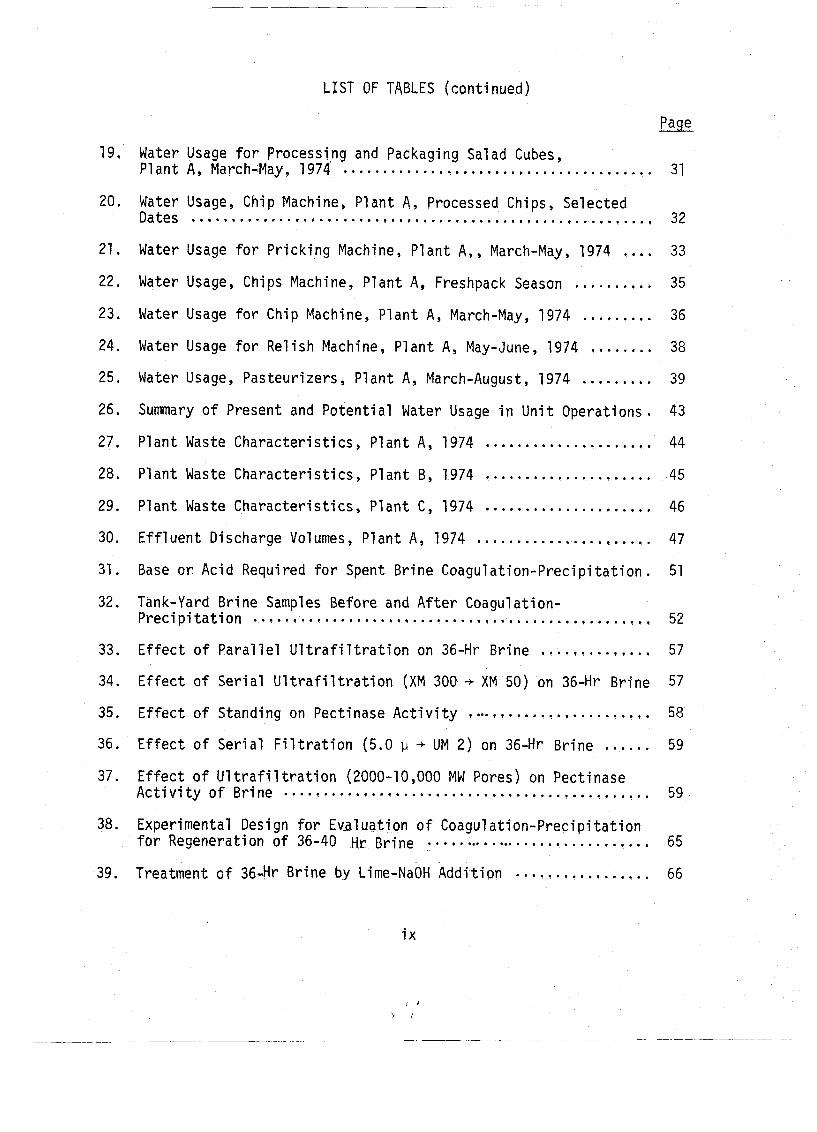
LIST OF TABLES (cont inued)
Water Usage fo r Processing and Packaging Salad Cubes, P lan t A , March-May, 1974 . . . . . . . . . . . . . . . . . . . . . . . . . . . . . . . . . . . . . . . 31
Water Usage, Chip Machine, P lan t A, Processed Chips, Selected Dates . . . . . . . . . . . . . . . I . . . . . . . . . . . , . , . . . . . . . . . . . . , . . . . . . . . , . . . . . . 32
Water Usage f o r P r i c k i n g Machine, P lan t A,, March-May, 1974 . . . . 33
Water Usage, Chips Machine, P lan t A, Freshpack Season ...-...,.. 35
Water Usage f o r Chip Machine, P lan t A, March-May, 1974 ......... 36
Water Usage f o r Re l i sh Machine, P lan t A, May-June, 1974 ........ 38
Water Usage, Pasteur izers, P lan t A , March-August, 1974 ......... 39
Summary o f Present and Potent i a1 Water Usage i n U n i t Operations . 43
P lan t Waste Charac te r i s t i cs , P lan t A, 1974 ..................... 44
P lan t Waste Charac te r i s t i cs , P lan t B, 1974 . . . . . . . . . . . . . . . , . . . . , 45
P lan t Waste Charac te r i s t i cs , P l a n t C, 1974 ..................... 46
Ef f luent Discharge Volumes, P lan t A, 1974 ...................... 47
Base o r Acid Required f o r Spent Br ine Coagulat ion-Precip i t a t i o n . 51
Tank-Yard B r ine Samples Before and A f t e r Coagul a t i o n - P r e c i p i t a t i o n . . . . . , , . .~ . . . . . . . .q . . . . . . . . . . I ( . . . . . . . . . . , , . . . . . . , 52
E f fec t of P a r a l l e l U l t r a f i l t r a t i o n on 36-Hr Br ine . . . . , . . . . . . . . . 57
Ef fect o f S e r i a l U l t r a f i l t r a t i o n (XM 300 -+ XM 50) on 36-Hr B r ine 57
E f f e c t o f Standing on Pect inase A c t i v i t y . . . . . . . . . . , . . . . .. . .,. 58
Ef fect of S e r i a l F i l t r a t i o n (5.0 p + UM 2) on 36-Hr Br ine . . . . . . 59
Effect o f U l t r a f i l t r a t i o n (2000-10,000 MW Pores) on Pect inase A c t i v i t y of Br ine ............................................ 59
Experimental Design f o r Ev-al-uation o f Coagul a t i on -P rec ip i t a t i o n fo r Regeneration of 36-40 Hr Br ine . . . . . . . . , . . . . . . . . . . . . . . . . . 65
Treatment of 36-Hr Br ine b.y Lime-NaOH Add i t i on . . . . . . . . . . . . . , . . . 66
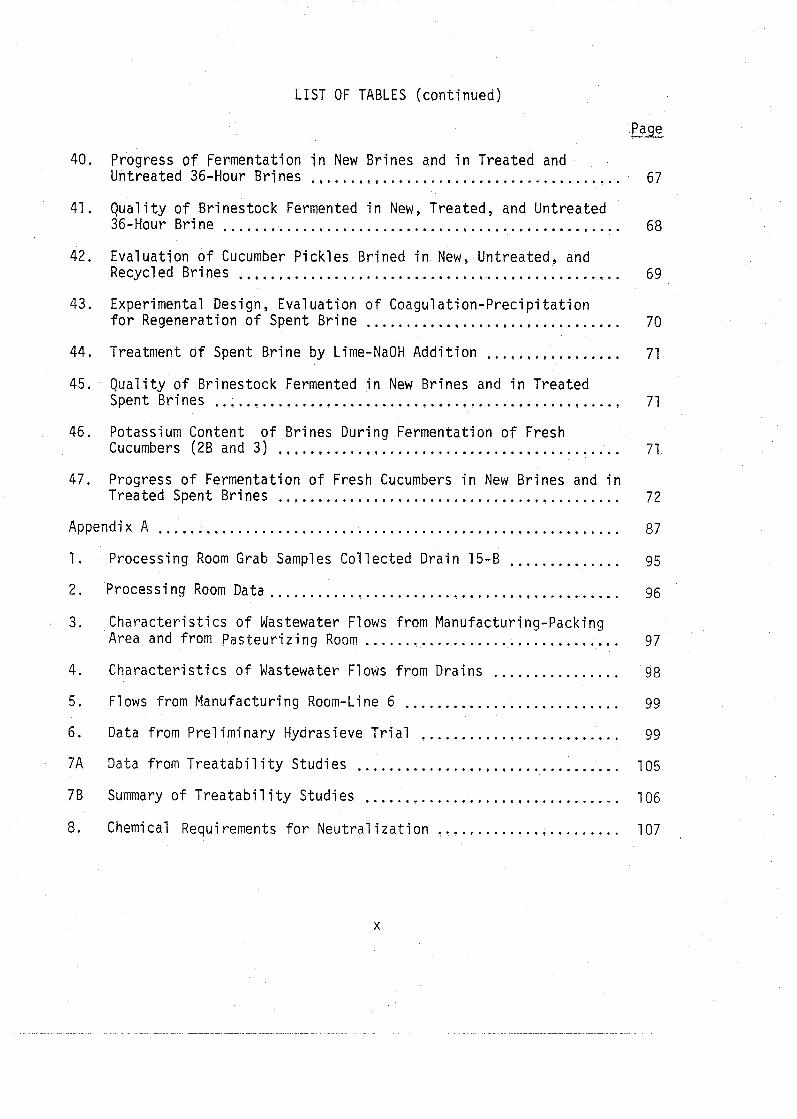
LIST OF TABLES (continued)
40 . Progress of Fermentation in New Brines and in Treated and Untreated 36-Hour Brines ....................................... 67
41 . Qua1 i ty of Brinestock Fermented in New. Treated. and Untreated 36-Hour Brine .................................................. 68
42 . Evaluation of Cucumber Pickles Brined in New. Untreated. and Recycled Brines ................................. ,, ............ 69
43 . Experimental Design. Eva1 uation of Coagulation-Precipi tation for Regeneration of Spent Brine ................................ 70
................. . 44 Treatment of Spent Brine by Lime-NaOH Addition
45 . Quali ty of Brinestock Fermented in New Brines and in Treated Spent Brines ...................................................
46 . Potassium Content of Brines During Fermentation of Fresh Cucumbers (26 and 3) ...........................................
47 . Progress of Fermentation of Fresh Cucumbers in New Brines and in ........................................... Treated Spent Brines
Appendix A ......................................................... .............. 1 . Processing Room Grab Samples Collected Drain 15-6
2 . Processing Room Data ............................................ 3 . Characteristics of Wastewater Flows from Manufacturing-Packing
Area and from Pasteurizing Room ................................ ................ 4 . Characteristics of Wastewater Flows from Drains
5 . Flows from Manufacturing Room-Line 6 ........................... ......................... 6 . Data from Preliminary Hydrasieve Trial
7A Data from Treatabil i t y Studies ................................. 105
76 Summary of Treatabil i t y Studies ................................ 106
8 . Chemical Requirements for Neutral ization ....................... 107
LIST OF TABLES (continued)
Appendix B
1 . Capital Cost Estimation .................................... 121
2 . Annual Operating Costs .................................... 122
3 . Cost Estimates for Concentrating Pickle Brines ............. 124
....... 4. Cost Estimates for Organic Removal from Pickle Brine 125
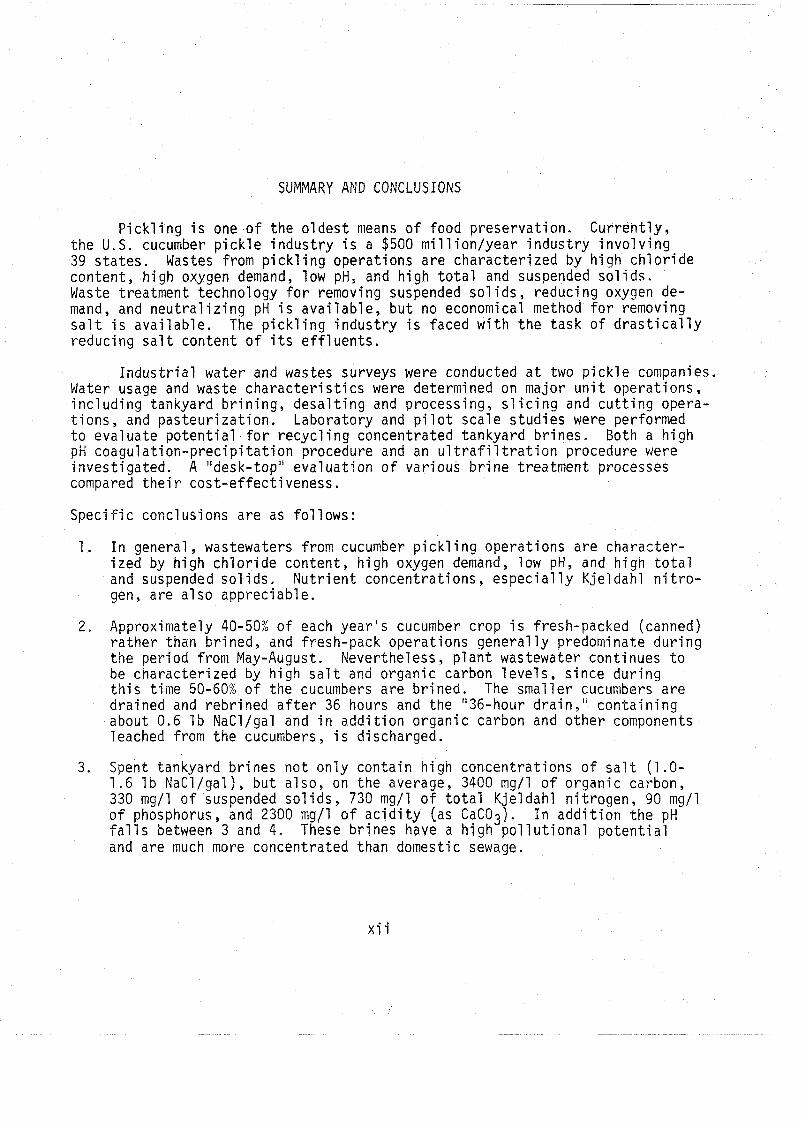
SUMMARY AND CONCLUSIONS
P i c k l i n g i s one of t h e o l d e s t means of food p rese rva t i on . C u r r e n t l y , t h e U. S. cucumber p i c k l e i n d u s t r y i s a $500 mi 11 i on / yea r i n d u s t r y i n v o l v i n g 39 s t a t e s . Wastes from p i c k l i n g opera t ions a r e cha rac te r i zed by h i g h c h l o r i d e con ten t , h i g h oxygen demand, low pH, and h i g h t o t a l and suspended s o l i d s . Waste t rea tment technology f o r removing suspended s o l i d s , reduc ing oxygen de- mand, and n e u t r a l i z i n g pH i s a v a i l a b l e , b u t no economical method f o r removing s a l t i s a v a i l a b l e . The p i c k l i n g i n d u s t r y i s faced w i t h t h e t a s k o f d r a s t i c a l l y reduc ing s a l t con ten t o f i t s e f f l u e n t s .
I n d u s t r i a l wa te r and wastes surveys were conducted a t two p i c k l e companies. Water usage and waste c h a r a c t e r i s t i c s were determined on ma jo r u n i t opera t ions , i n c l u d i n g tankyard b r i n i n g , d e s a l t i n g and process ing, s l i c i n g and c u t t i n g opera- t i o n s , and p a s t e u r i z a t i o n . Labora to ry and p i l o t sca le s t u d i e s were performed t o eva lua te p o t e n t i a l f o r r e c y c l i n g concent ra ted tankyard b r i n e s . Both a h i g h pH c o a g u l a t i o n - p r e c i p i t a t i o n procedure and an u l t r a f i l t r a t i o n procedure were i n v e s t i g a t e d . A "desk-top" e v a l u a t i o n o f va r ious b r i n e t rea tment processes compared t h e i r cos t -e f f ec t i veness ,
Speci f i c conc l u s i ons a re as f o l 1 ows :
I n genera l , wastewaters f rom cucumber p i c k l i n g ope ra t i ons a r e cha rac te r - i z e d by h i g h c h l o r i d e con ten t , h i g h oxygen demand, l o w pH, and h i g h t o t a l and suspended s o l i d s . N u t r i e n t concen t ra t ions , e s p e c i a l l y K je l dah l n i t r o - gen, a re a l s o apprec iab le .
Approximately 40-50% o f each y e a r ' s cucumber c rop i s fresh-packed (canned) r a t h e r than b r i ned , and f resh-pack ope ra t i ons g e n e r a l l y predominate d u r i n g t h e pe r i od f rom May-August. Never the less, p l a n t wastewater con t inues t o be cha rac te r i zed by h i g h s a l t and o rgan i c carbon l e v e l s , s i nce d u r i n g t h i s t ime 50-60% o f the cucumbers a r e b r i ned . The sma l l e r cucumbers a r e d ra ined and r e b r i n e d a f t e r 36 hours and t he "36-hour d ra in , " c o n t a i n i n g about 0.6 1b NaCl/gal and i n a d d i t i o n o rgan i c carbon and o t h e r components leached f rom t h e cucumbers, i s d ischarged.
Spent tankyard b r i n e s n o t o n l y c o n t a i n h i g h concen t ra t i ons o f s a l t (1 . O - 1 - 6 1 b NaCl/gal ) , b u t a1 so, on t h e average, 3400 mg/l o f o rgan i c carbon, 330 mg/l of suspended s o l i d s , 730 mg/l o f t o t a l K j e l d a h l n i t r o g e n , 90 mg/l o f phosphorus, and 2300 mg/l o f a c i d i t y (as CaCB3), I n a d d i t i o n t h e pH f a l l s between 3 and 4. These b r i n e s have a h i g h p o l l u t i o n a l p o t e n t i a l - . and a re much more concent ra ted than domest ic sewage.
A major factor t o consider in reuse of 36-hr and spent brines i s the i r softening enzyme [pectinase) content. pectinase ac t iv i ty can be el imina- ted in these brines by coagulation-precipitation a t high pH or by ul t ra- f i l t r a t i o n .
Regeneration by high pH treatment involves raising pH of the brines to 11 with lime and sodium hydroxide, followed by se t t l i ng and neutralization with hydrochloric or acet ic acid, Treatment of brines by th i s method not only eliminates pectinase ac t iv i ty b u t also removes phosphate and dras t ica l ly reduces bacterial populations. However, i t does not remove the majority of the organic component as measured by TOG or COD analysis.
Brinestock brined in high pH treated brine (one reuse cycle) compares favorably w i t h that brined in new brine.
Pickles packed as sweet or d i l l a f t e r brining in high pH treated brine are not significantly different in quality from those brined in new brines.
Ul t ra f i l t ra t ion of brines i s another potential method of regeneration. In the laboratory, pectinase ac t iv i ty can be removed from 36-hr or spent tankyard brines by u l t r a f i l t r a t ion through f l a t membranes with average molecular weight passthrough of 10,000 or less . Such treatment does not s ignif icant ly reduce organics as measured by TOC or COD. Since the hollow- f iber membrane configuration i s generally more e f f i c i en t , i t i s possible that larger pore sizes could be used, with correspondingly greater flux r a t e , in a fu l l -scale application.
In the studies herein described, brine was reused only once. There i s some question as to buildup of metals, organic compounds, or other materials during repeated reuse. In the long run, costs of t reat ing brine will be dependent on whether elimination of pectinase ac t iv i ty alone will suf f ice , or whether removal of a l l organic compounds i s necessary. Ul t ra f i l t ra t ion and high pH treatment appear t o suffice for the former case; in the l a t t e r case, other methods would be required.
I t i s estimated that a t leas t 30% of the s a l t used i s wasted because of s a l t spi l lage, tank leakage, and tank overflow.
Water requirements per unit of cucumbers handled vary widely within each unit process. Part of the variation can be attributed to leakage, over- flow, or fa i lure to close valves during times when the uni t i s not i n operation,
Desalting (processing) wastewaters are typical ly low pH and re1 at ively high in chloride concentration. In the f i r s t desalting water chloride levels are about 40 gm C1 11. Organic carbon levels are h i g h and i n gener- al the more finely divided the product, the higher the TOG, as we1 1 as the Kjeldahl nitrogen and phosphorus levels , Apparently, the greater the sur- face area exposed to the processing water, the greater the loss of soluble components and fragments of cucumber t issue.
x i i i
1 3 , Pickle plant wastes, with the exception of the s a l t , respond to biological treatment provided suff ic ient detention time and suf f ic ien t oxygen are available. Neutralization of pH by addition of a1 kali appears to be unnecessary i f suff ic ient aeration i s provided to allow the aerobic degra- dation of the organic acids (.such as l ac t i c and acet ic acids) i n the wastewaters.
14. Observations on water use, s a l t handling, cucumber handling, and tank management were conveyed to management personnel a t Plants A and B. A t the request of management a t Plant A two additional presentations were subsequently made to tankyard and l ine foremen and supervisors to acquaint them with the relationship of conservation of water, s a l t , cucumbers, and other materials to reduction of volume and strength of wastewater and to overall increase i n net profi ts .
15. The work described herein has led to funding of a demonstration project by the Environmental Protection Agency. The project will be conducted a t a North Carolina pickle plant by sc ien t i s t s from North Carolina A & T State University (Greensboro) and the University of North Carolina a t Chapel Hill .

ERRATA: Item 5, page xv, should read as follows:
5. Treatment and reuse of spent brines should be
Assume a p lan t using 6700 T of s a l t per year
3300 T saved by b e t t e r housekeeping); assume
i n the spent brines can be recovered by coagu
tes ted on a l a rge r s ca l e .
(10,000 a t present , minus
90 % cf the 6000 T remaining
la t ion-precipi t a t i on o r u l t r a -
f i l t r a t i o n . Reuse of t h i s 5400 T would el iminate t h a t load on the receiving
stream and i n addi t ion o f fe r a potent ia l savings in s a l t co s t s , depending on
the cos t of treatment. Costs of treatment can only be derived by fu r t he r
study on a l a rger s ca l e .

RECOMMENDATIONS
Due to the highly pollutional nature of tankyard brines the present wide- spread practices of discharging these brines untreated onto the tankyard or into a surface water should be discontinued. Instead, they should be reused or , i f wasted, drained direct ly into a treatment f a c i l i t y rather than onto the ground where buildup i s unsightly and causes odors, where they create a potential groundwater hazard, and where they are subject t o being washed by rain as llslugs" into the treatment system or receiving stream.
2 . The use of fiberglass or other non-leaking tanks should be encouraged. If wooden tanks are used, leaks should be repaired promptly.
3. S t r i c t supervision of dry s a l t and brine handling should be inst i tuted t o avoid s a l t loss. If 33% of the s a l t i s presently wasted a t a typical plant using 70,000 tons/year, elimination of t h i s wastage would resu l t in a savings of $72,600 (@ $22/T).
4. Water meters should be instal led on l ines serving each major unit process. Readings should be made a t leas t dai ly , and unusually large volume re- quirements per unit of product should be investigated. Leaks, overflows, breaks in the water1 ine, and other mishaps should be corrected promptly. Water use studies indicate tha t 40-90% of the water currently used i s unnecessary. Assuming a plant discharging 200,000 gallons per day (73 million gallons per year) under present conditions cut water usage by 50% (a conservative value), the daily discharge would be cut to 100,000 gpd , effectively doubling the detention time in the wastewater treatment system and the annual water usage would be cut to 36.5 million gallons. In water costs alone, assuming a cost of $1/1000 gallons, a savings of $36,500 could be achieved.
---
5. Treatment and reuse of spent brines should be tested on a larger scale . Assume a plant using 6700 T of s a l t per year (10,000 a t present, minus 3 . 3 T saved by be t te r housekeeping); assume 90 % of the 6 T remaining in the spent brines can be recovered by coagulation-precipitation or u l t ra - f i l t r a t i o n . Reuse of th i s 5.4 T would eliminate that load on the receiving stream and in addition offer a potential savings in s a l t costs , depending on the cost of treatment. Costs of treatment can only be de- rived by further study on a larger scale.
6. Present treatment systems should be operated t o conform to design capacity. Equipment for suspended sol ids removal i s essent ia l , and once in place should be closely monitored and maintained. Hydraulic loading should be reduced by water conservation. Most important, dissolved oxygen concen-
t ra t ions of a t leas t 1 mg/l should be maintained in the aeration basins. Adequate oxygen i s essential for BOD removal. In addition, i f suff ic ient oxygen i s available, neutralization of the influent by chemical addition i s usually unnecessary, thus eliminating the costs, as well as the hazards, of strong a lka l i s such as sodium hydroxide or anhydrous ammonia. I t i s estimated that the cost of neutralizing 200,000 gallons per day of typical pick1 in wastewater with NaOH (@ $100 per ton as 50% strength) would exceed ! 55,000 per year.
7. The potential for reuse of pasteurizer water in cleanup or other areas should be investigated. Alternatively, to reduce loading on the waste treatment system the possibi l i ty of discharging the relat ively clean pasteurizer water t o the municipal system should be investigated (as i s a l - ready the practice a t some plants) .
8. Since regeneration and reuse of brines i s generally more feasible the more concentrated the brine, measures to reduce the volume of desalting water should be investigated. One approach t o t h i s problem i s the counter- current rinsing suggested by previous investigators.
9. Another al ternat ive which would reduce the volume of desalting water, as we1 1 as overall s a l t use, i s the adoption of lower salometer s a l t s tor- age for brinestock.
10. Efforts should be made to avoid dropping cucumbers, brinestock, or parts thereof onto the tankyard, onto the f loors , or into the wastewater drains. Once dropped, a valuable raw commodity becomes a waste, causing a 2-fold loss -- (1) of i n i t i a l cost and ( 2 ) of cost t o t r e a t i t as a waste.
11. The f i r s t and cheapest approach to wastewater control should be elimina- tion of wastage of water, cucumbers, s a l t , and any other materials. Such improved "housekeeping" can be accompl i shed by continuing education of a1 1 plant personnel. Without improved housekeeping i t i s doubtful that any other more sophisticated approaches -- brine treatment and reuse, countercurrent rinsing, advanced waste treatment processes, e t cetera -- can succeed i n reducing the volume and loading o f wastewaterssufficiently to meet proposed effluent guidelines.
xvi
INTRODUCTION
In 1972 representatives of the Mount Olive Pickle Company and the U . S. Food Fermentation Laboratory requested assistance of the Department of Environ- mental Sciences and Engineering in handling wastewater problems related to production of pickles, with the understanding that any useful information obtained would be made available to a l l interested pickle companies. With small grants from the University Research Counci 1 (University of North Carol - ina a t Chapel Hil l , URC Council Grant V C 334) and from Pickle Packers Inter- national, Inc. (PPI) work was begun on characterization and treatment of brine wastes from the cucumber pickle industry. The scope of t h i s work was greatly expanded in 1973 with a $12,000 research grant from the U N C Water Resources Research Inst i tute and $10,000 from PPI.
The scope of work undertaken included
I . Industrial water and waste surveys a t two North Carolina pickle plants, including water usage and characterization of wastewaters
11. Economic evaluation of various treatment processes for brine waste- waters
111. Laboratory and p i lo t evaluation of recycling of tankyard brines, by high pH coagulation-precipi ta t ion and by u l t r a f i l t ra t ion .
This report represents the information obtained during t h i s study and includes recommendations for decreasing water usage; reducing waste loads of s a l t , BOD, and solids; and upgrading existing wastewater treatment f a c i l i t i e s .
General Description of the Pickle Industry
The cultivation of cucumbers as a food crop and the preservation of foods by pickling are practices so old that t he i r origins are unknown. The cucumber, Cucwnis sativus, a native of Southern Asia, has been i n cult ivation for more than 4000 years, being grown in Egypt in Old Testament times (King, 1941 ; Bush-Brown and Bush-Brown, 1958).
Pickling i s one of the oldest methods of preserving food, used long be- fore heat s t e r i l i za t ion and freezing were available. The work p ick le i s derived from the Dutch p e k e l , "brine or pickle," and from the equivalent Ger- man $ke l , Conventional pickling involves storage of food in s a l t brine, accompanied by natural fermentation mediated by indigenous micro-organisms
and leading t o the production of ac id ic endproducts. The s a l t serves t o govern the extent and type of microbial growth, and the combination s f high salt-low pH serves t o preserve the food. Many vegetables can be preserved in brine, sauerkraut and cucumber pickles being the best-known examples. Others include okra, tomatoes, c a r ro t s , corn, and green beans.
Compared t o canning o r f reezing, pickling i s an energy-conserving method of food preservation, and during World War 11 fuel shortages the re was a revival of brining both i n the home and commercially (E tche l l s , Jones, and Bell , 1952).
In the l a s t decade the term pickle has a l so been applied t o cucumber products which have not been brined o r fermented b u t have been packed d i r e c t l y in vinegar (fresh-pack process) .
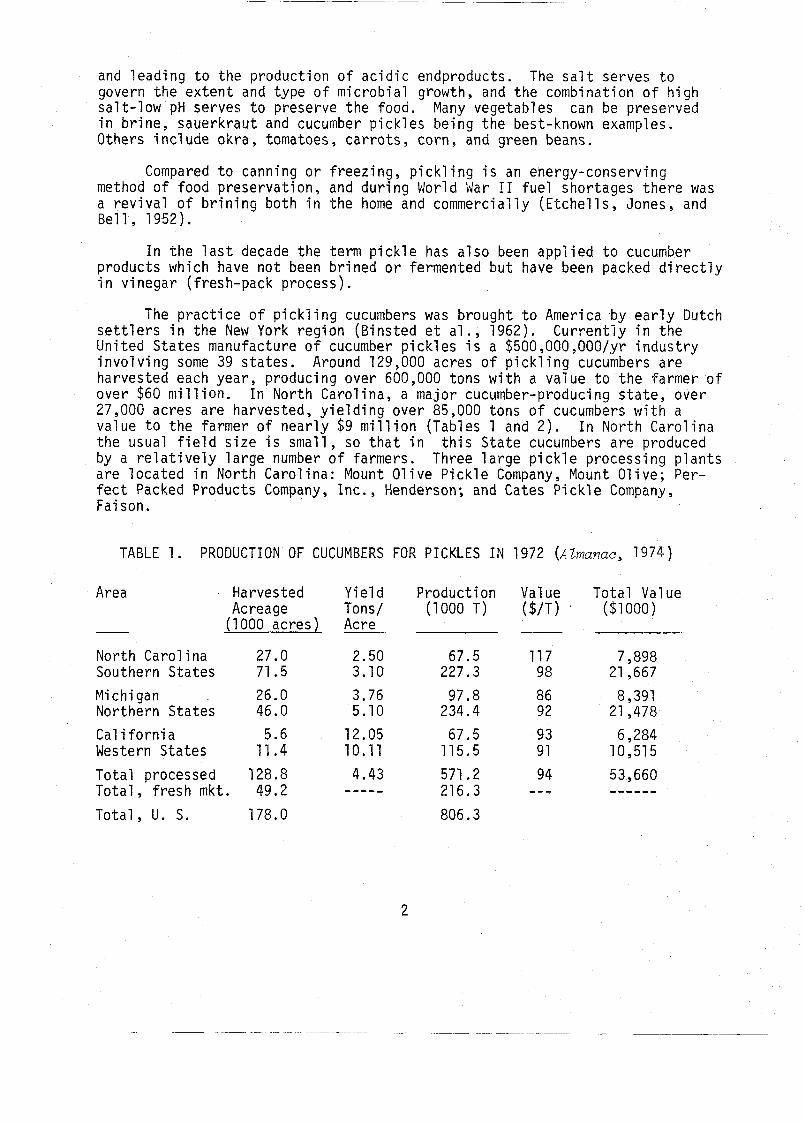
The pract ice of pickling cucumbers was brought t o America by ea r l y Dutch s e t t l e r s in the New York region (Binsted e t a1 : , 1962). Currently in the United S ta tes manufacture of cucumber pickles 1s a $500,000,000/yr industry involving some 39 s t a t e s . Around 129,000 acres of pickling cucumbers a r e harvested each year , producing over 600,000 tons with a value t o the farmer of over $60 mill ion. In North Carolina, a major cucumber-producing s t a t e , over 27,000 acres a r e harvested, y ie lding over 85,000 tons of cucumbers with a value t o the farmer of nearly $9 mil l ion (Tables 1 and 2 ) . In North Carolina the usual f i e1 d s i z e i s small , so t h a t in t h i s S ta te cucumbers a r e produced by a r e l a t i ve ly large number of farmers. Three large pickle processing plants a r e located in North Carolina: Mount Olive Pickle Company, Mount Olive; Per- f e c t Packed Products Company, Inc . , Henderson; and Cates Pickle Company, Fai son.
TABLE 1 . PRODUCTION OF CUCUMBERS FOR PICKLES IN 1972 (~Zmanac, 1974 )
Area Harvested Yield Production Value Total Value Acreage Tons/ (1000 T ) ($/T) . ($1000)
(1000 ac res ) Acre
North Carolina 27.0 2.50 67.5 11 7 7,898 Southern S ta tes 71.5 3.10 227.3 9 8 21,667
Michigan 26.0 3.76 97.8 8 6 8,391 Northern S ta tes 46.0 5.10 234.4 9 2 21,478
Cal i fo rn ia 5.6 12.05 67.5 93 6,284 Western Sta tes 11.4 10.11 115.5 9 1 10,515
Total processed 128.8 4.43 571.2 94 53,660 Tota l , f resh m k t . 49.2 ----- 216.3 - - - ------ Total , U . S. 178.0 806.3
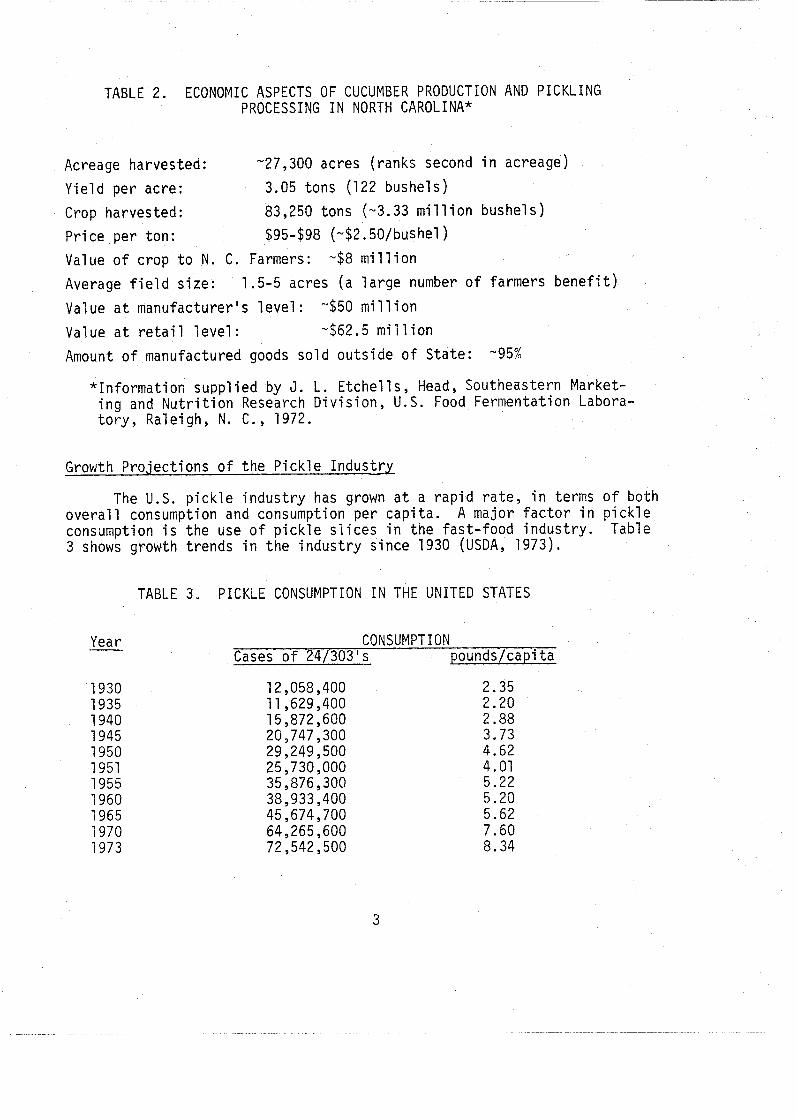
TABLE 2. ECONOMIC ASPECTS OF CUCUMBER PRODUCTION AND PICKLING PROCESSING I N NORTH CAROL1 NA*
Acreage harvested: -27,300 acres ( ranks second i n acreage)
Y i e l d p e r acre: 3.05 tons (122 bushe ls )
Crop harvested : 83,250 tons (-3.33 m i l 1 i o n bushe ls )
P r i c e pe r ton: $95-$98 (-$2,50/bushel)
Value o f c rop t o N. C. Farmers: "$8 mi 11 i o n
Average f i e l d s i ze : 1.5-5 acres (a l a r g e number o f farmers b e n e f i t )
Value a t manufac tu re r ' s l e v e l : "$50 mi 11 i o n
Value a t r e t a i l l e v e l : -$62.5 m i l l i o n
Amount o f manufactured goods s o l d o u t s i d e o f S ta te : -95%
* In fo rma t i on suppl i e d by J. L. E tche l 1 s, Head, Southeastern Market- i n g and N u t r i t i o n Research D i v i s i o n , U.S. Food Fermentat ion Labora- t o r y , Rale igh, N. C., 1972.
Growth P r o j e c t i o n s o f t h e P i c k l e I n d u s t r y
The U.S. p i c k l e i n d u s t r y has grown a t a r a p i d r a t e , i n terms o f bo th o v e r a l l consumption and consumption pe r c a p i t a . A ma jo r f a c t o r i n p i c k l e consumption i s t h e use o f p i c k l e s l i c e s i n t h e f a s t - f o o d i n d u s t r y . Table 3 shows growth t r ends i n t h e i n d u s t r y s i nce 1930 (USDA, 1973).
TABLE 3. PICKLE CONSUMPTION I N THE UNITED STATES
Year
1930 1935 1940 1945 1950 1951 1955 1960 1965 1970 1973
CONSUMPTION Cases o f 241303's p m
Partly because of the growth of the pickle industry currently many plants may find themselves w i t h inadequate and overloaded waste treatment systems a t a time when funds for capital improvements are hard to obtain.
Product Description, Styles, and Types of Packs
United States Standards for Grades of Pickles define pickles as follows:
"Pickles means the product prepared ent i rely or predominantly from cucumbers (~ucumis sativus L ) . Clean , sound ingredients are used which may or may not have been previously subjected to fermentation and curing in a s a l t brine (solution of sodium chloride NaCS). The prepared pickles are packed in vinegar solution, t o which may be added s a l t and other vege- t a b l e ( ~ ) , nutr i t ive sweetener(s) , seasoning(s), f lavoring(s) , sp ice(s ) , and other ingredients permissible under the Federal Food, Drug, and Cosmetic Act. The product i s packed in su i t - able containers and heat t reated, or otherwise processed to assure preservation." (~Zmanac, 1974).
The term s ty le refers to the shape of the product and includes the fo l - lowing categories: whole, crosscut, s l i c e lengthwise, cut , and re1 ish (f inely cu t ) .
There are two major types of pack -- cured and fresh-pack.
Cured type pickles are naturally fermented in NaCl brine to which may be added flavorings such as d i l l . During curing the internal s a l t concentration may reach levels too high for pa la tab i l i ty , i n which case the pickle then i s par t ia l ly desalted before packing i n vinegar solution. Types of cured pickles i ncl ude
(1 ) Natural or genuine d i l l s - cured in s a l t brine with d i l l herb ( 2 ) Processed d i l l s - cured pickles packed in vinegar solution
with d i l l flavoring (3 ) Sour pickles - cured, packed i n vinegar ( 4 ) Sweet pickles and mild sweet pickles - cured, packed in
vinegar with nut r i t ive sweetening ingredient (5) Sour mixed - cured, packed i n vinegar, packed with onions
and cauliflower and other ingredients ( 6 ) Sweet mixed and mild sweet mixed - as in 5, b u t with
nut r i t ive sweeteners added ( 7 ) Sour mustard pickles or sour chow-chow - as in 5, except
packed in mustard sauce rather than in vinegar (8) Sour pickle re1 ish - cured, f inely cut or chopped cucumbers,
packed in vinegar solution, may contain other f inely cut vegetables
(9 ) Sweet pickle re1 ish - as in 8 , b u t with nut r i t ive sweetener added.
Fresh-pack type pickles are prepared from uncured unfermented cucumbers and packed in vinegar solutions of various types, They are processed by heat for preservation. The types include
(1) fresh-pack d i l l - packed in vinegar solution w i t h d i l l flavoring ( 2 ) fresh-pack sweet d i l l - as in 1 , b u t with nut r i t ive sweetener (3) fresh-pack sweetened d i l l re l ish - f inely cut or chopped,
packed in vinegar, d i l l and nut r i t ive sweetener added, may contain other finely cut or chopped vegetables
(4 ) fresh-pack sweet and fresh-pack mild sweet - packed i n vinegar w i t h nutr i t ive sweetener
( 5 ) fresh-pack sweet rel ish and fresh-pack mild sweet re l i sh - as in 3, b u t without d i l l flavoring
(6) fresh-pack d ie t e t i c - may be prepared with or without addition of sweetener, s a l t , and other ingredients to meet requirements for special dietary uses.
Currently, of the annual crop about 40% i s made d i rec t ly into fresh-pack or pasteurized pickle products using the canning operation largely developed a t the U.S. Food Fermentation Laboratory (Etchel 1s and Moore, 1971 ) .
Pickle Production and the Wastewaters Generated
Sources of wastewaters from pickle manufacture are readily apparent as one follows the progress of cucumbers from f i e ld t o finished product (Figure 1 ) . The three major divisions in production of brined-type pickles are (1 ) brining, ( 2 ) "processing" or freshening," and (3) finishing,
I t must be noted that in the pickle industry brine strengths are expressed in terms of degrees salometer, measured with a hydrometer calibrated in per- cent saturation with respect t o sodium chloride. A saturated solution of s a l t would read 100' salometer (see Table 4 ) .
Green cucumbers trucked in from f i e ld weighing s tat ions may be f i r s t graded (sorted according to s i ze ) or p u t d i rect ly into brining tanks ( f i e ld run). As a rule , the cucumbers are not washed f i r s t .
In most plants green cucumbers are brined outdoors in large wooden tanks ranging in s ize from 1000-20,000 gallons and accommodating from 100-2000 bushels of cucumbers. These tanks are actually huge barrels constructed with staves and hoops; consequently, they must be kept wet to reduce the i r tendency t o shrink and leak. During the winter months the tanks are f i l l e d with water containing lime (or in some instances, microbicides) to keep the wood wet and to "sweeten" the tanks. As tanks are needed in the spring and summer, the limewater (-10 1b hydrated 1 ime per 1000 gal ) i s drained out onto the tankyard and the tanks are washed with freshwater. Care of empty tanks i s reviewed by Veldhuis e t a1 (1941 ) .
Before cucumbers are added to the t a n k , a cushion (6"-8" deep) of 25' brine i s placed in the bottom of the tank t o prevent bruising the cucumbers as they are dumped in. After f i l l i n g to within about a foot of the top of
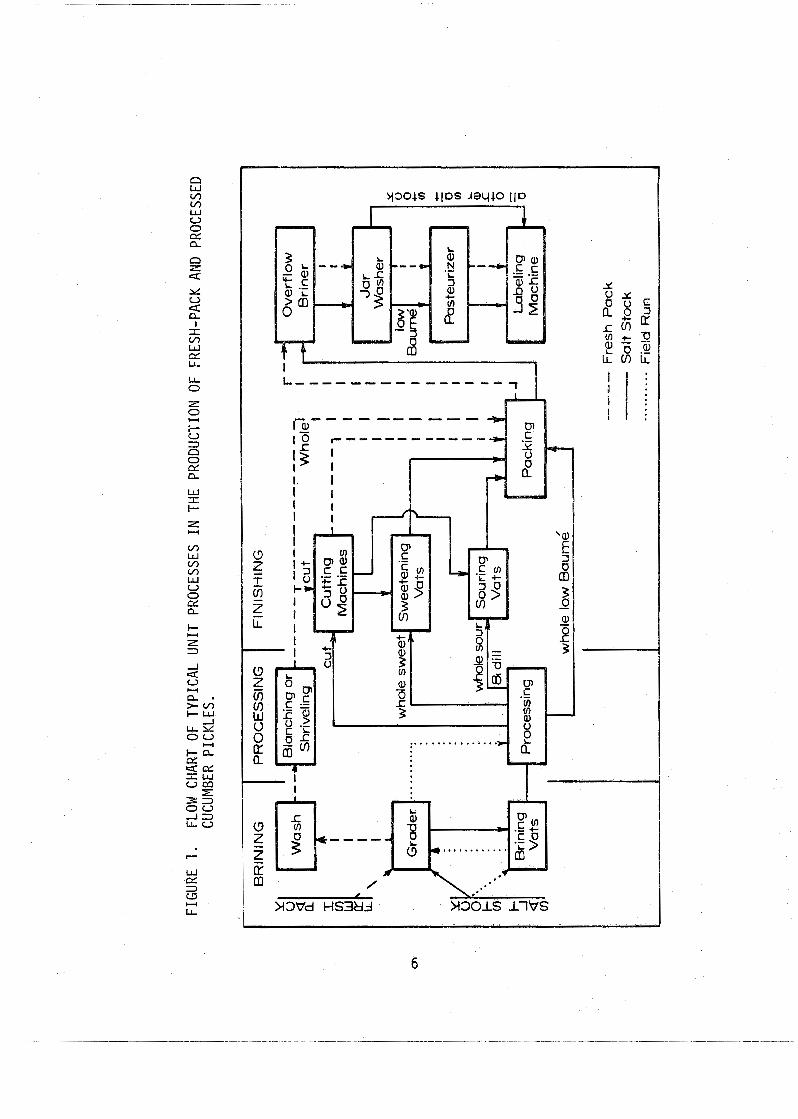
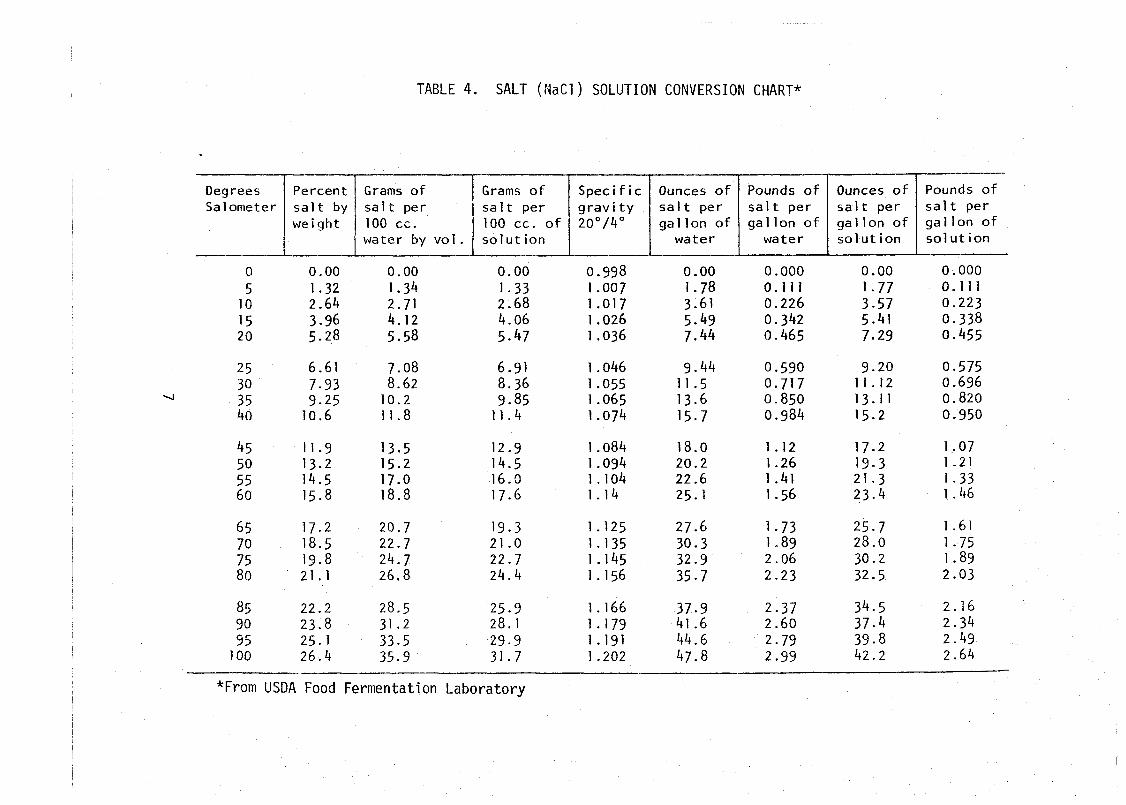
TABLE 4. SALT (NaC1) SOLUTION CONVERSION CHART*
( Ounces of ] Pounds of salt per salt per gallon of gallon o f solution solution
85 22.2 28.5 25.9 1.166 37.9 2.37 34.5 2.16 90 23.8 31.2 28.1 1.179 41.6 2.60 37.4 2.34 9 5 25.1 33.5 29.9 1.191 44.6 2.79 39.8 2.49 100 26.4 35.9 31.7 1.202 47.8 2.99 42.2 2.64
*From USDA Food Fermentation Laboratory
t h e tank, t h e tanks a re "headed down" w i t h a cover o f wooden boards, l o o s e l y cons t ruc ted t o a l l o w f ree movement o f l i q u i d w h i l e keeping t h e cucumbers submerged. The cover i s fastened i n p l ace w i t h heavy beams. S a l t b r i n e i s added t o about 4-6" above t h e head. I n i t i a l l y t h e cucumbers absorb b r i n e and wa te r d i f f u s e s o u t o f t he cucumbers, so d r y s a l t i s added p e r i o d i c a l l y t o ma in ta i n a b r i n e s t r e n g t h o f 20"-30". Any leakage f rom t h e tanks w i l l a l s o n e c e s s i t a t e a d d i t i o n o f b r i n e . Rain may d i l u t e t h e b r i n e and r e q u i r e a d d i t i o n o f more s a l t .
I n t h e case o f smal l cucumbers up t o 1 1/4" (d iameter ) an a d d i t i o n a l s t ep may be necessary. Small cucumbers o f t en have f l owe rs s t i l l a t t ached t o t he stems. Fungi assoc ia ted w i t h f l o w e r s have been shown t o produce p e c t - inases, enzymes which des t roy t h e p e c t i n i n t h e cucumber c e l l w a l l s , thus caus ing s o f t e n i n g o f t h e b r i n e s t o c k (Be1 1, E tche l I s , and Cos t i low, 1958). Yo combat t h i s problem, i t i s common p r a c t i c e , e s p e c i a l l y i n t h e South, t o d r a i n o f f t he i n i t i a l 25" b r i n e a f t e r 36 hours, r e p l a c i n g i t w i t h f r e s h b r i n e . The 36-hour d r a i n i s d ischarged as a waste. Thus, a d d i t i o n a l s a l t i s r e q u i r e d f o r smal l cucumbers and an a d d i t i o n a l waste stream i s generated, For example, f o r a 500 bushel tank , 1500 1b o f s a l t i s r e q u i r e d f o r t h e 25' b r i n e , so smal l s tock r e q u i r e s an e x t r a 3/4 t o n o f s a l t , much o f which i s wasted on to t h e tank- y a r d over a r e l a t i v e l y s h o r t p e r i o d o f t ime ( E t c h e l l s and Wontz, 1972).
Dur ing t h e f i r s t 4-6 weeks o f b r i n i n g a t 20-30" sa lometer , a n a t u r a l fe rmenta t ion takes p lace . T h i s f e rmen ta t i on i s medi a t e by s a l t - t o 1 e r a n t microorganisms adher ing t o t h e cucumbers. U t i l i z i n g o rgan ics and n u t r i e n t s d i f f u s i n g f rom t h e cucumbers, these organisms produce l a c t i c a c i d and t h e pH i s depressed t o -3.5. A f t e r s u f f i c i e n t a c i d i t y (-0.6%) i s reached, t h e b r i n e s t r e n g t h i s inc reased by a d d i t i o n o f d r y s a l t t o a f i n a l s t r e n g t h o f 45- 70' salometer. The combinat ion of low pH and h i g h s a l t serves t o suppress t h e a c t i v i t y o f many ( b u t n o t a1 1 ) undes i rab le organisms and t o t hus p reserve t h e cucumbers.
When t h e b r i n e d cucumbers a re needed f o r product , t h e y a r e removed f r om t h e vats , processed o r freshened, and packed (see be low). The used o r "spent" b r i n e i s commonly discharged to t h e ground as waste.
To c o n t r o l su r f ace growths o f yeas t , tanks a r e commonly l e f t open t o s u n l i g h t . Desp i te t h e low pH and h i g h s a l t c o n d i t i o n s c e r t a i n scum yeas ts can t h r i v e i n t h e fermented b r i n e . Scum yeasts , a l though n o t i n c r i m i n a t e d i n s a l t - s t o c k so f t en ing (Be1 1 and E tche l 1 s, 1956), damage t h e appearance and over- a l l q u a l i t y o f t h e s tock . Species o f yeas t i n v o l v e d a r e Debaryomyces ( t h e most widespread) , Zygosaccharomyces, Endomycopsis, and Candida (E t che l 1 s and Be1 7 , 1950). Scum growth i s espec ia l l y a p t t o occur when s k i e s a r e ove rcas t and when t h e weather i s warm. Veldhuis e t a1 (1941 ) recommend d a i l y a g i t a t i o n o f t h e l i q u i d su r f ace t o r e t a r d growth o f yeas ts ; t hey s t a t e t h a t i f scum i s a l lowed t o develop t o t h e p o i n t a t which i t i s v i s i b l e i r r e p a r a b l e damage can occur. S ince few p l a n t s p r a c t i c e a g i t a t i o n , when scum accumulates i t i s r e - moved by skimming o r by ove r f l ow ing . I n e i t h e r case, b r i n e i s l o s t t o t h e ground.
S ince t h e tanks a r e open they r e c e i v e n o t o n l y s u n l i g h t , b u t a l s o r a i n - water . Consequently, b r i n e i s l o s t by o v e r f l o w t o t h e ground, t h e remain ing
brine i s diluted, and more s a l t i s required. In addition loss of acidi ty may necessitate addition of acetic acid.
A f inal source of wastewater i s the leakage of brine from improperly maintained tanks. To indicate the contribution of leakage to waste generation, the following calculation i s i 1 lustrat ive:
Assume a tank 12' in diameter with 65" brine. Leakdown of 1" of brine will resul t in a volume loss of 68 gallons contain- ing 109 1b of s a l t . Leakdown of 1 ' of brine will resu l t in a volume loss of 816 gallons containing 1306 1 b of s a l t .
Loss of brine will necessitate i t s replacement and, thus, will require additional consumption of s a l t and water. In addition, loss of the acid end- products of fermentation will necessitate addition of acet ic acid. Finally, the spi l led brine will contribute oxygen-demanding materials to the wastewater draining from the tankyard.
Returning to the cucumbers, the brined cucumbers a t t h i s point are in- edible because of the i r high s a l t content ( - 16%). In order to reduce the s a l t the cucumbers are soaked in 1-2 equivalent volumes of fresh water. Final desired s a l t content for d i l l s i s - 4.7%; for sweets, - 2.5%. During the second washing process the water generally contains alum, for texture improve- ment, and may also contain turmeric or Food Yellow No. 5 for coloring. Dur- ing processing a i r i s usually pumped into the solution to promote mixing and rapid diffusion of s a l t . The processing waters are discharged as wastewater.
Before and a f t e r processing, cucumbers may be regraded; pricked to pro- mote inward diffusion of flavoring agents; or sl iced into spears, cubes, s l i ces , re1 ish, and so on. Cutting and pricking operations generally involve fluming of the cucumbers through the system and may also involve j e t washing a t the point of cutting or pricking. Flume waters may be reused until too
, di r ty ; washwaters go direct ly to waste.
Depending on the product, the pickles may be soaked in various combina- tions of vinegar, sugar, and spices. The flavoring liquors are expensive and thus e f for t s are usually made to avoid spillage. Some losses occur during transfers and d u r i n g dumping of leftover liquors when a particular product run i s finished.
The pickles may be packed by hand or machine into ja rs or buckets. After packing the final cover brine i s added, generally dispensed by an overflow briner into the containers as they pass by on a conveyer be l t . Caps or covers are added by machine and the outside of the jars i s washed. Wastewaters i n - clude the overflow brine, the washwater, and losses due to breakage or s p i l l - age.
The finished product may or may not be pasteurized, depending on i t s sugar and acid content. Large quantit ies of cooling water are generated by the pasteurizers.
Finally, the products are label led and crated.
Additional wastewater i s generated by washing the floors in the f inish- ing and packing area, This wastewater will contain spi l led brines, l iquors, and pickles or parts thereof.
During the green season about 40% of the incoming cucumbers are made in- to fresh pack products. Cucumbers are graded, washed, and sent t o the packing room, where they may be blanched or shriveled in weak brine, then packed whole or cut. A1 1 freshpack products are pasteurized. Since fermentation, storage in brine, and desalting are eliminated, much of the waste associated with brined products i s eliminated. Since fresh cucumbers can be held no longer than 24 hours, the freshpack operation i s limited to the green cucumber season. In order t o pack as many as possible by freshpack, the cucumber season has been extended by planting both spring and f a l l crops and during t h i s time i t i s not unusual for plants to operate 2-3 s h i f t s per day for 6-7 days a week.
Summarizing, major sources of wastewater are as follows:
(1 ) 36-hour drain (2) spent brine (3) leakage and overflow of tanks ( 4 ) lime water from sweetenting tanks (5 ) processing waters (6) wash waters from cut te rs , s l i c e r s , e tc . (7) t ransfer losses (8) cooling water for pasteurization (9 ) loss of cover liquors
(10) water used in cleanup.
Previous --- Studies on Reduction of Wastes from Pickle Packing
Two in-depth wastes surveys of the pickle industry have been published and while some of the findings have been p u t into widespread practice, others bear repetit ion and adoption. Barnes and Weinberger (1958) emphasized the value of inventorying sources and amounts of wastes and o f reducing pollution a t the source where possible. Their survey was primarily directed toward BOD reduction. Suggestions for reducing pol 1 ution included:
(1) double-netting when removing brined cucumbers from vats to t ransfer containers to reduce dr i ppage
( 2 ) saving of left-over concentrated cover liquors for l a t e r use (3) reduction of in-pl ant spi 11 s (4 ) segregation of high-strength l iquors and storage fo r release
a t times of high stream flow (5) metering of water usage ( 6 ) automatic composited sampling of waste flows, the i r character-
ization, and record-keeping to aid i n control of plant opera- t ion.
Nemerow (1 963) surveyed a North Carol ina pickle plant and evaluated ef fec ts of the r a w wastes discharge to the receiving stream. As in the previous survey, Nemerow's attention was primarily on BOD reduction. Suggestions for reducing BOD and sol ids included:
(1) instal lation of screens over drains in syrup tanks t o aid in retaining small pickles and peels
( 2 ) avoiding overf i l l of desalting vats to eliminate loss of bri nestock
(3) dry-sweep collection of pickles and pickle parts which are dropped o n t o f loors and the i r disposal t o garbage rather than to the wastewater system.
Mercer e t a l . (1970, 1971) were able to recondition olive storage and processing brines with pilot-scale activated carbon treatment. The treated brines were used to store olives with no detectable e f fec t on product quality. The costs for a plant processing 5000 tons of olives per year, amortized over a 10-yr period, were estimated t o be $2.76/ton or $27.60 per 1000 gal of reconditioned brine. On the average, activated carbon treatment removed 38 - 65 % of the COD in the olive brines. and 21 - 30 % of t h e s u s ~ e n d ~ d snlids.
The authors estimated tha t cost could be reduced t o around $1 per ton by reactivation and reuse of spent carbon i f a centrally located reactivation f a c i l i t y could serve 10 canneries.
Lowe and Durkee (1971 ) also examined the reclamation of s a l t from 01 ive brines, using the process of evaporation by submerged combustion. In th i s process spent brines are heated by passage of gaseous combustion products d i rec t ly through the body of the l iquid. The rapid heat t ransfer from the r is ing gas bubbles takes place under low partial pressure conductions so tha t boiling takes place a t temperatures considerably less than the normal boiling point. Since there are no heat t ransfer surfaces there are no problems with fouling or corrosion, so that equipment cost can be lowered. The disadvan- tage of the process i s i t s re lat ively low thermal efficiency. The s lurry of crystals formed during submerged combusion i s about 57.5% solids and con- tains in addition to the s a l t about 6% combustible organic material. The organics are destroyed and the water removed by incineration a t 1200 F. The incinerated s a l t i s stored dry. A t time of reuse i t i s dissolved, f i l t e red or set t led to remove the ashed carbon residue, and made up into brine. In the i r studies the reconditioned brine contained 25 mgjl COD, compared to 34,700 in the spent brine.
Since cost of the submerged combustion process i s dependent on the vol- ume of water to be removed, the more concentrated brines are more economically treated.
Bl i zard (1 973) reported work on submerged combustion by USDA-Western Laboratory and Selas Corporation. Based on 5500 T of cucumbers requiring 660,000 gal of 15% brine solution and considering costs of capital amortiza- tion (10 yr bas is ) , labor, power, maintenance, f i l t r a t i o n , balanced against value of recovered s a l t , he estimated the cost of the process to be $0.06 per ton of cucumbers.
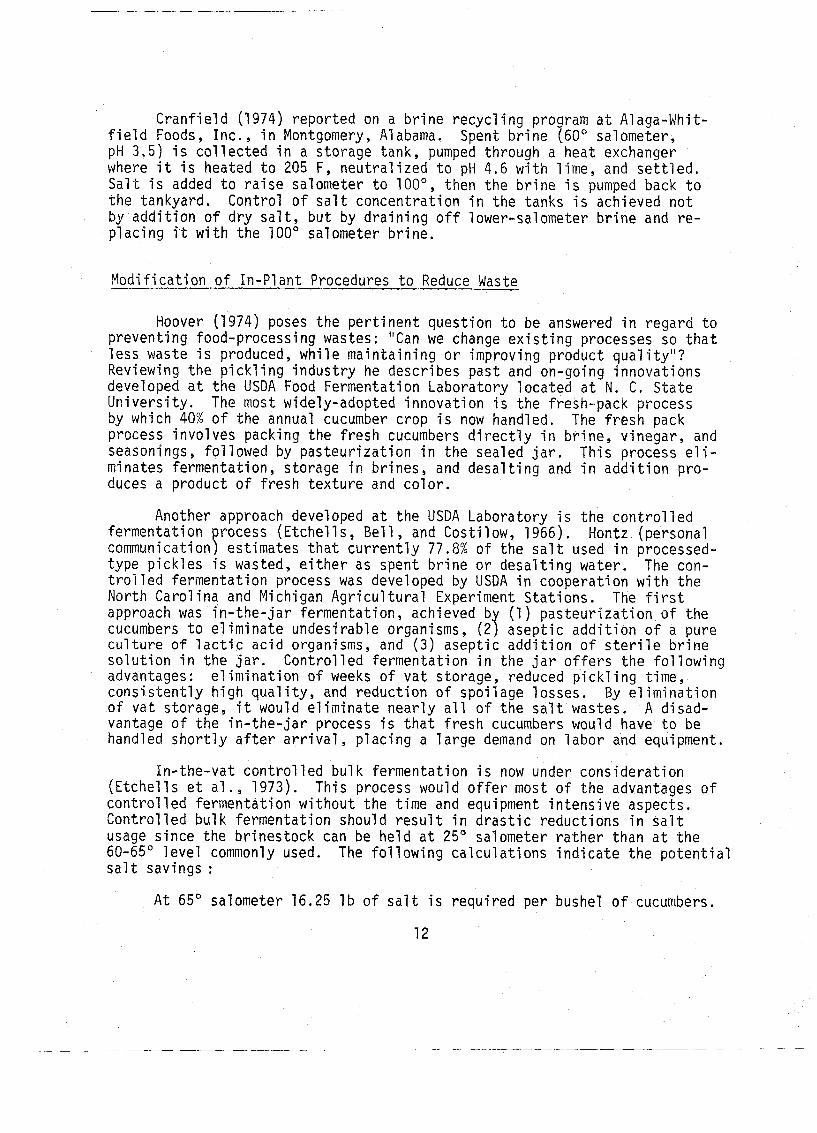
Cranfiel d (1 974) reported on a brine recycl ing program a t A1 aga-Whi t- f i e ld Foods, Inc. , in Montgomery, Alabama. Spent brine (60" salometer, pH 3.5) i s collected in a storage tank, pumped through a heat exchanger where i t i s heated to 205 F , neutralized to pH 4.6 with lime, and se t t led . Sal t i s added to raise salometer to 100°, then the brine i s pumped back to the tankyard. Control of s a l t concentration in the tanks i s achieved not by addition o f dry s a l t , b u t by draining off lower-salometer brine and re- placing i t w i t h the 100" salometer brine.
Modification - of In-Plant Procedures to Reduce Waste
Hoover (1974) poses the pertinent question t o be answered in regard to preventing food-processi ng wastes : "Can we change existing processes so tha t less waste i s produced, while maintaining or improving product quality"? Reviewing the pickling industry he describes past and on-going innovations developed a t the USDA Food Fermentation Laboratory located a t N. C . State University. The most widely-adopted innovation i s the fresh-pack process by which 40% of the annual cucumber crop i s now handled. The fresh pack process involves packing the fresh cucumbers direct ly in brine, vinegar, and seasonings, followed by pasteurization in the sealed j a r . This process e l i - minates fermentation, storage in brines, and desalting and i n addition pro- duces a product of fresh texture and color.
Another approach developed a t the USDA Laboratory i s the controlled fermentation process (Etchel 1 s , Be1 1 , and Costi 1 ow, 1966). Hontz (personal communication) estimates that currently 77.8% of the s a l t used in processed- type pickles i s wasted, e i ther as spent brine or desalting water. The con- t rol led fermentation process was developed by USDA in cooperation w i t h the North Carolina and Michigan Agricultural Experiment Stations. The f i r s t approach was in-the- j a r fermentation, achieved b (1 ) pasteurization of the cucumbers to eliminate undesirable organisms, ( 2 3 aseptic addition of a pure culture o f l a c t i c acid organisms, and (3 ) aseptic addition of s t e r i l e brine solution in the ja r . Controlled fermentation in the j a r offers the following advantages: elimination of weeks of vat storage, reduced pickling time, consistently high qual i ty , and reduction of spoilage losses. By elimination of vat storage, i t would eliminate nearly a l l of the s a l t wastes. A disad- vantage of the in-the-jar process i s that fresh cucumbers would have to be handled shortly a f t e r a r r iva l , placing a large demand on labor and equipment.
In-the-vat controlled bulk fermentation i s now under consideration (Etchells e t a l . , 1973). This process would offer most of the advantages of controlled fermentation without the time and equipment intensive aspects. Controlled bulk fermentation should resu l t in drast ic reductions in s a l t usage since the brinestock can be held a t 25" salometer rather than a t the 60-65" level commonly used. The fo1 lowing calculations indicate the potential s a l t savings :
A t 65" salometer 16.25 1b of s a l t i s required per bushel of cucumbers.
12
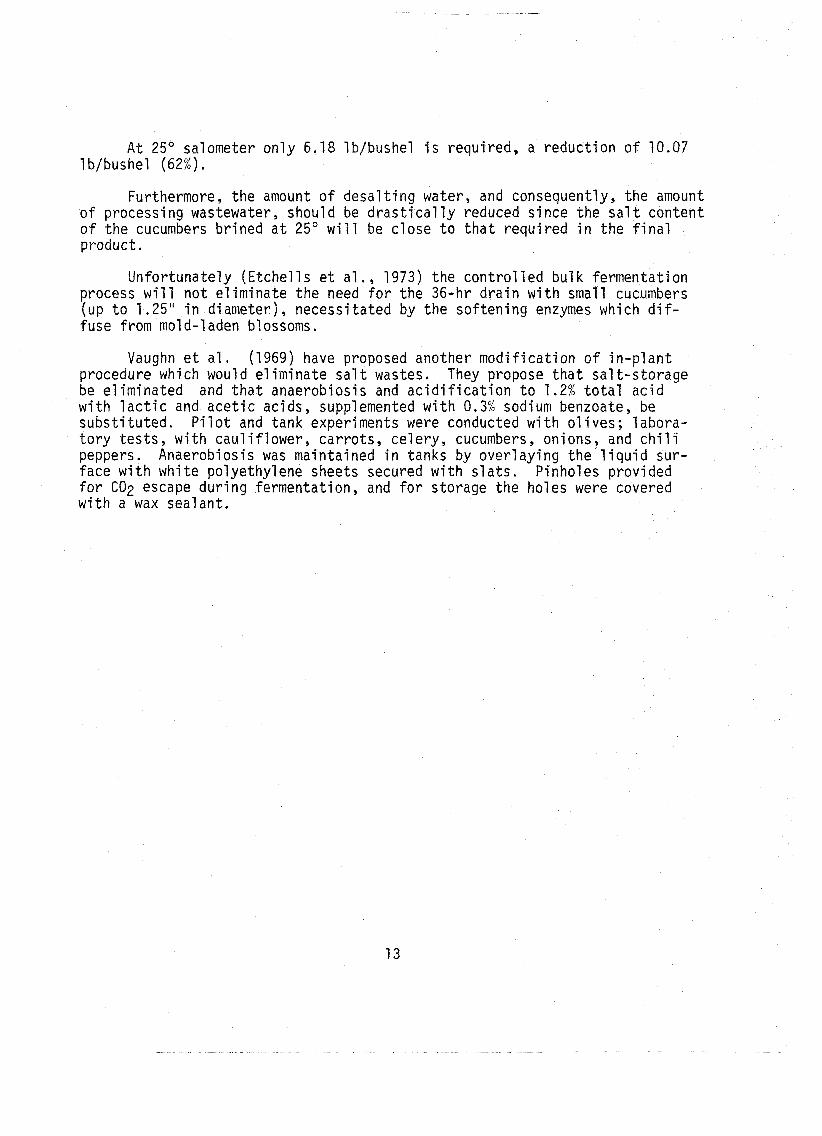
A t 25" salometer only 6.18 1 b/bushel i s required, a reduction of 10.07 1 b/bushel (62%).
Furthermore, the amount of desalting water, and consequently, the amount of processing wastewater, should be dras t ica l ly reduced since the s a l t content of the cucumbers brined a t 25' will be close to that required in the f inal product.
Unfortunately (Etchel 1 s e t a1 . , 1973) the control led bulk fermentation process will not eliminate the need for the 36-hr drain with small cucumbers ( u p t o 1.25" i n diameter), necessitated by the softening enzymes which d i f - fuse from mold-1 aden blossoms.
Vaughn e t a1 . (1969) have proposed another modification of in-plant procedure which would eliminate s a l t wastes. They propose that salt-storage be eliminated and tha t anaerobiosis and acidification t o 1.2% to ta l acid w i t h l a c t i c and acet ic acids, supplemented with 0.3% sodium benzoate, be substi tuted. Pi lot and tank experiments were conducted with 01 ives; labora- tory t e s t s , with cauliflower, carrots , celery, cucumbers, onions, and ch i l i peppers. Anaerobiosis was maintained in tanks by overlaying the l iquid sur- face with white polyethylene sheets secured with s l a t s . Pinholes provided for C02 escape during fermentation, and for storage the holes were covered with a wax sealant.

CHARACTERIZATION OF WASTEWATERS GENERATED IN PICKLE MANUFACTURE
Relatively l i t t l e information i s available in the l i t e ra tu re on the pol lutional characteristics of wastewaters from pickle manufacture, especially on the wastewaters from individual unit processes.
Results of previous studies are indicated in Tab1 es 5 and 6 . Overall , pickl ing wastewaters are characterized by high dissolved sol ids , low pH, high chloride content and high BOD.
Because of the relat ive lack of information on the character of pickl - ing wastewaters, coupled with a pressing need by pickle manufacturers to upgrade the i r wastewater treatment f a c i l i t i e s , the need for extensive survey was obvious.
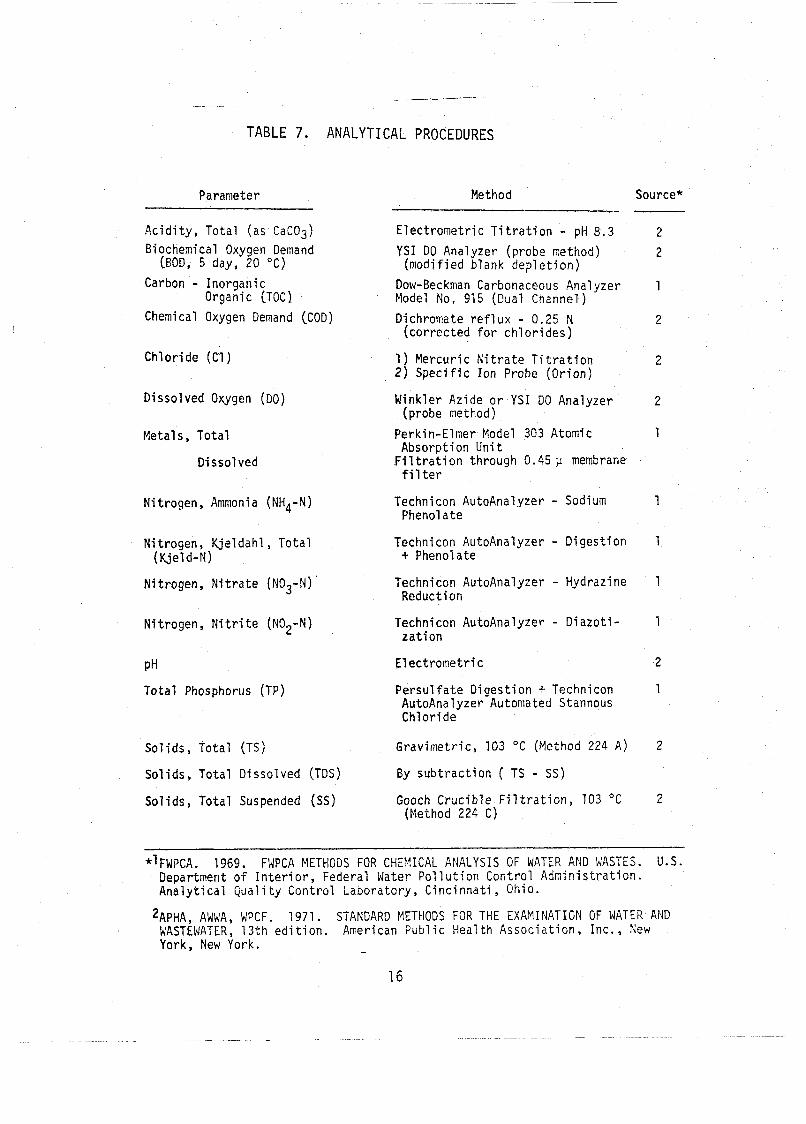
Plant A was chosen for an extensive survey of water use, overall and in unit processes; wastewater generation, overall and for unit processes; characterization of wastewater components; handling of cucumbers, s a l t , and other ingredients. Cooperation of plant personnel made possible daily meter readings, production figures, and sampling. Samples were chilled and taken to the U N C Wastewater Research Center for analysis. Table 7 describes the analytical methods employed in the study.
Plant B was also extensively studied and an industrial waste survey was conducted by graduate students from UNC- Chapel Hill (see Appendix A ) .
Plant C was sampled occasionally, primarily for comparison with resu l t s obtained a t Plants A and B .
Tankyard Wastes
A t Plant A the average tank capacity i s 6000 gallons, a s ize which ac- commodates 600 bushels of cucumbers. Each 6000-gal tank produces about 2400 gallons of spent brine. When the plant i s running a t peak capacity, 3-5 tanks are emptied each working day, i . e . , 1800-3000 bushels of cucumbers are processed each working day. On a yearly basis, about 700 tanks are pro- cessed, and thus - 1.68 million gallons of spent brine are generated.
From the tankyard, samples of brine were taken from 23 vats of whole cucumbers representing both spring and f a l l crops and 5 s izes of cucumbers; from two tanks of re l i sh ; and from vats of cauliflower, pepper, and onion. These brine samples represent the spent brines which would be discharged to waste as the vegetables are processed.
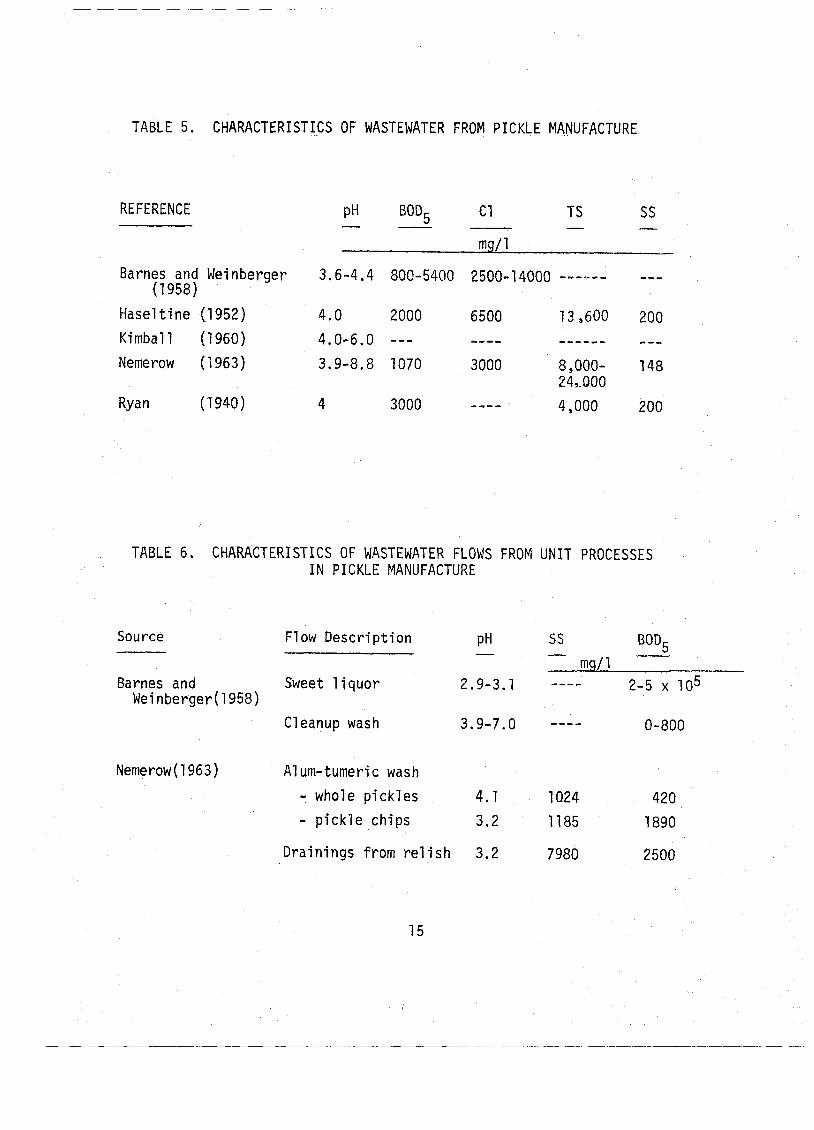
TABLE 5. CHARACTERISTICS OF WASTEWATER FROM PICKLE MANUFACTURE
REFERENCE
rng/ 1
Barnes and Weinberger 3.6-4.4 800-5400 2500-14000 ------ - - - (1 958)
Hasel t i n e (1952) 4.0 2000 6500 13,600 200 Kimbal l (1960) 4.0-6.0 --- ---- ------ --- Memerow (1 963) 3.9-8.8 1070 3000 8,000- 148
24,.000 Ryan ( 1 940) 4 3000 ---- 4,000 200
TABLE 6. CHARACTERISTICS OF WASTEWATER FLOWS FROM UNIT PROCESSES I N PICKLE MANUFACTURE
Source Flow Desc r i p t i on P H S S BOD5 - - - mg/ 1
Barnes and Sweet 1 i q u o r 2.9-3.1 ---- 2-5 x l o 5 Weinberger(1958)
Cleanup wash 3.9-7.0 ---- 0-800
Nemerow (1 963) Alum-tumeric wash
- whole p i c k l e s 4.1 1024 420
- p i c k l e ch ips 3.2 1185 1890
Dra in ings f rom r e l i s h 3.2 7980 2500
_-I-.-- -- - -
TABLE 7. ANALYTICAL PROCEDURES
Parameter
Acidity, Total ( a s CaC03) Biochemical Oxygen Demand
(BOD, 5 day, 20 "C)
Carbon - Inorganic Organic (TOC)
Chemical Oxygen Demand (COD)
Chloride (C1 )
Dissolved Oxygen (DO)
Metals, Total
Dissolved
Nitrogen, Ammonia ( N H ~ - N )
Nitrogen, Kjeldahl , Total (Kjeld-N)
Nitrogen, Ni t ra te (NO~-N)
Nitrogen , Ni t r i t e (NO*-N)
PH
Total Phosphorus (TP)
Sol ids , Total (TS)
Sol i d s , Total Dissolved (TDS)
Sol ids , Total Suspended (SS)
Electrometric T i t r a t i on - pH 8 .3
YSI DO Analyzer (probe method) (modified blank deple t ion)
Dow-Beckman Carbonaceous Analyzer Model No, 915 (Dual Channel)
Dichromate re f lux - 0.25 N (corrected f o r ch lor ides)
Method Souxe*
1 ) Mercuric Ni t ra te T i t r a t i on 2) Spec i f ic Ion Probe (Orion)
Winkler Azide o r YSI DO Analyzer (probe method)
Perkin-Elmer Model 303 Atomic Absorption Unit
F i l t r a t i o n through 0.45 membrane f i 1 t e r
Technicon AutoAnalyzer - Sodium Phenol a t e
Technicon AutoAnalyzer - Digestion + Phenolate
Technicon AutoAnalyzer - Hydrazine Reduction
Technicon AutoAnalyzer - Diazoti- zat ion
E l ectrometri c
Persu l fa te Digestion + Technicon AutoAnalyzer Automated Stannous Chloride
Gravimetric, 103 O C (Method 224 A )
By subtract ion ( TS - SS)
Gooch Crucible F i l t r a t i o n , 103 O C
(Method 224 C)
*'FWPCA. 1969. FWPCA METHODS FOR CHEMICAL ANALYSIS OF WATER AND WASTES. U.S. Department of I n t e r i o r , Federal Water Pol lut ion Control Administration. Analytical Qua1 i ty Control Laboratory, Cincinnati , Ohio.
2 ~ ~ ~ ~ , AWWA, WPCF. 1971. STANDARD METHODS FOR THE EXAMINATION OF WATER AND WASTEWATER, 13th ed i t i on . American Pub1 i c Health Association, Inc. , New York, New York. -
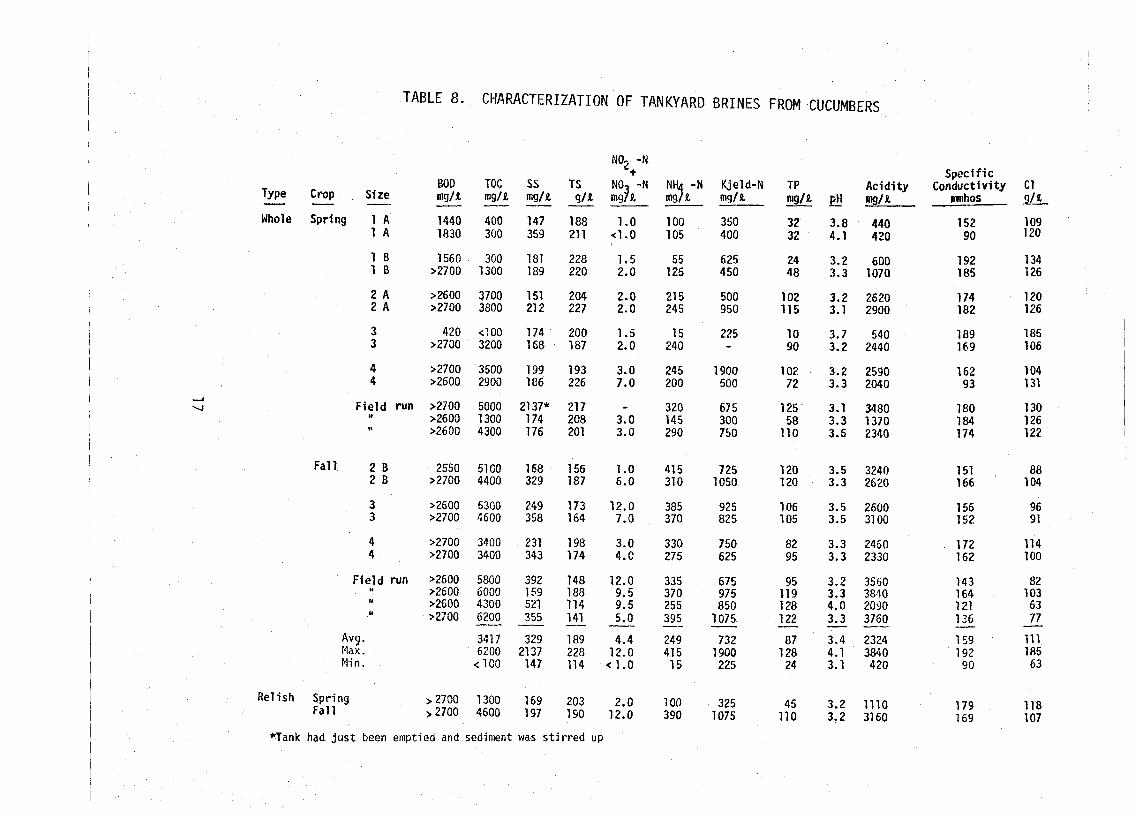
TABLE 8.
BOD TOC Type Crop Size - - - mg/R mg/a - - Whale Spring 1 A 1440 400
1 A 1830 300
CHARACTERIZATION OF TANKYARD BRINES FROM CUCUMBERS
Field run U
u
Fall 2 B 2 B
Field run ,a
Avg. blax . Min.
Re1 ish Spring > 2700 1300 Fa1 1 > 2700 4600
*Tank had just been emptied and sediment was stirred up
Specific Conductivity
mnhos
152 90
192 185
174 182
189 169
162 9 3
180 1 84 174
151 166
156 152
172 162
143 164 121 136 - 159 192 90
179 169
Brines from whole cucumbers (Table 8 ) a re , as expected, extremely high in chlorides, reflecting the high salometer storage brine strengths used in Plant A and many other plants, Additionally, these brines are extremely high in organic carbon (averaging 3400 mg/l ) , suspended sol ids (averaging 329 mg/l ) , Kjel dahl nitrogen (averaging 732 mg/l ) and phosphorus (averaging 87 mg/l). Because of the fermentation there i s a low pH (around 3.4) and a high acidity (averaging 2324 mg/l). The discovery tha t spent brines contained not only s a l t b u t high levels of other pollutants was surprising to pickle plant personnel . However, one might anticipate that when cucumbers are placed in concentrated brines soluble components will diffuse out into the brine until an equilibrium i s attained.
Values for rel ish brines were in the same ranges as those for whole cucumber brines (Tabl e 8 ) .
From the data shown in Table 8 i t i s obvious tha t spent brines from cucumbers have a very high pollutional potential . In Table 9 the spent brine character is t ics are compared with ordinary domestic sewage, which seems weak in comparison (Brown e t a1. , 1973).
TABLE 9. TANKYARD BRINE COMPARED TO TYPICAL DOMESTIC SEWAGE
Parameter Brine Sewage
TOC, mg/l SS, mg/l Kjel d-N, mg/l T P , mg/l Cl, 911 pH
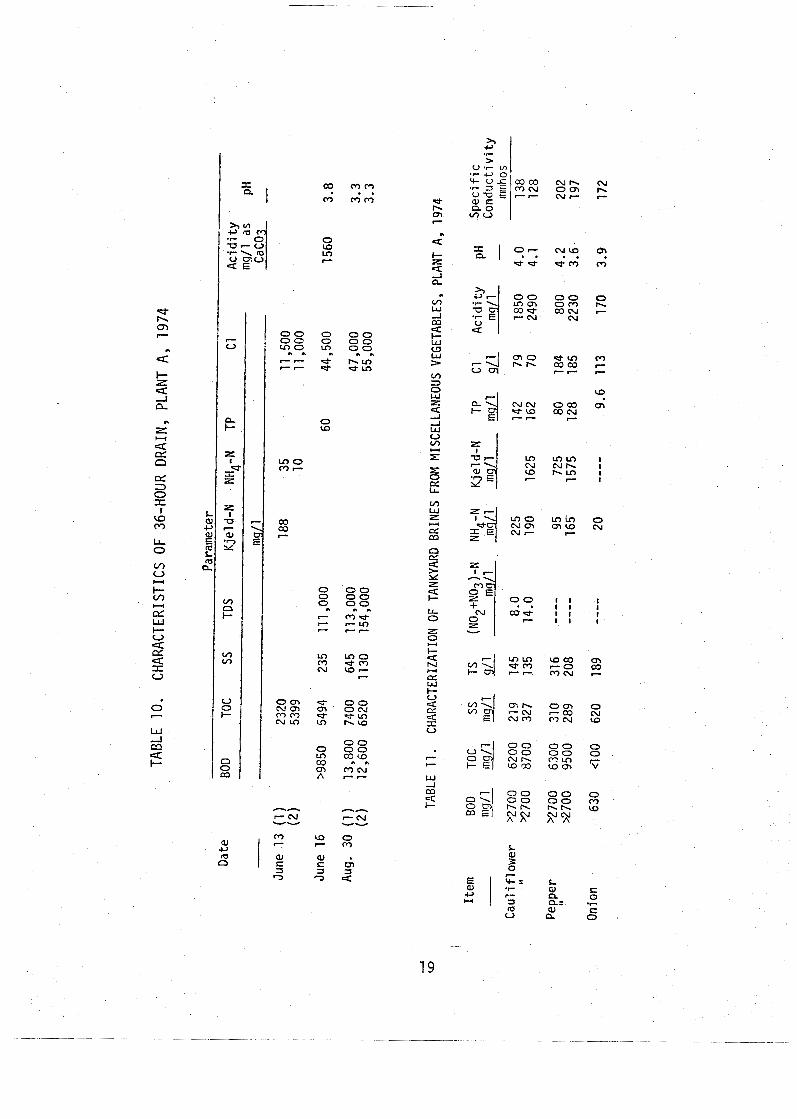
Table 10 shows the characteristics of the 36-hour drain brines from small cucumbers. Again, t h i s brine i s very high in BOD, TOC, chlorides, and ac id i ty , Since a l l of t h i s brine i s discharged t o waste (usually onto the ground) d u r - ing the green season i t consti tutes a major wastewater load during a relat ively short period.
Pepper and caul i f l ower brines are simi 1 a r t o cucumber brines (Tabl e 11 ) . Onion brines, however, are markedly different , w i t h low organic carbon levels and low acidity. I n relation to overall waste loads, the contribution of onion, pepper, and cauliflower brines i s minimal, as only a few vats of each are used each year,
Wastewaters from Processing and from Other Operations
Characteristics of processing wastewaters from several products are shown in Table 12, Processing wastewaters are generated in the desalting step.
m a P
0 0 1 N m m m Nln n q E cum zn
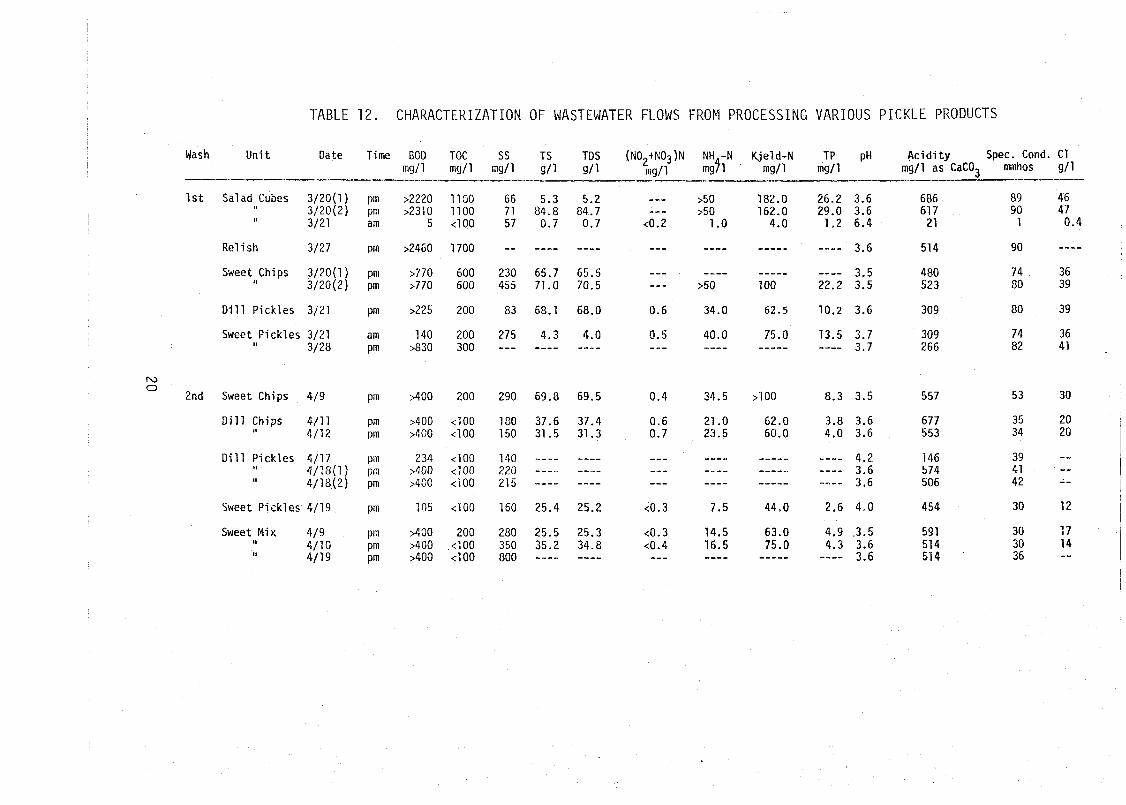
TABLE 12. CHARACTERIZATION OF WASTEWATER FLOWS FROM PROCESSING VARIOUS PICKLE PRODUCTS
Wash U n i t Date Time BGD TOC SS TS TDS (N02iN03)N N H - N Kjeld-N TP pH A c i d i t y Spec. Cond. C1 mgl l wg/l mg/l g l l g l l n g / l mg l l mg l l mg l l as CaC03 mhos g l l -
1 s t Salad Cubes 3/20(1) 3/20(2)
,I 3/21
Re1 i s h 3/27
S w e t Chips 3/20(1) I , 3/20(2)
D i l l P ick les 3 j21
Sweet P i c k l e s 3/21 I, 3/23
IV 0
2nd Sweet Chips 419
D i l l Chips 4/11 I, 4/12
Sweet P ick les 4/19
Sweet Mix 4/9 ,I 4 / l 0 I I 411 9
Qate --
Mar. 20 Mar. 27 Aug. 1
IV ' Aug.2 2
July 16 Sept. 12 Sept. 13
TABLE 13. CHARACTERIZATION OF WASTEWATER FROM CHIP MACHINE, PLANT A, 1974
PARAMETER Acidity Spec. mg/l as Cond. pH
Type o f Pack BOD TOC TS TDS SS Kjeld-N NH4-N (N02+~03)-N TP C1 CaC03 mhos - - - mq/l
Processed <2 O* 64 22 17 1.0 6.7 c1.0 4.0 C0.2 0.3 41
Fresh 50 65 I1 84 120 I 8 48 101
*Out of range of machine
TABLE 14. WASTEWATER CHARACTERISTICS - SALAD CUBES MACHINE, PLANT A, 1974
Date -
Mar. 20 (1) (2 1 (3)
Mar. 27 (4)
Aug. 1 5
PARAMETER mg/l Acidity as
BOD TOC TS TDS SS Kjeld-N NH4-N (N02+N03)-N TP C1 CaC03
mq/l 1442 800 1,015 1694 94 > 50
5 --- 660 57 4 1 17.3 34,600 394 <0.2 1.2 375 21 >2200 1100 5,200 66 182 > 50 26.2 46,400 686 >2300 1100 84,710 71 162 > 50 29.0 47,000 617 > 810 700 25,100 300 540 530 26,170 1744 10 7.5 13,600 400 975 55,020 2 54 14 8.0 13,500
Spec. Cond. w~hos
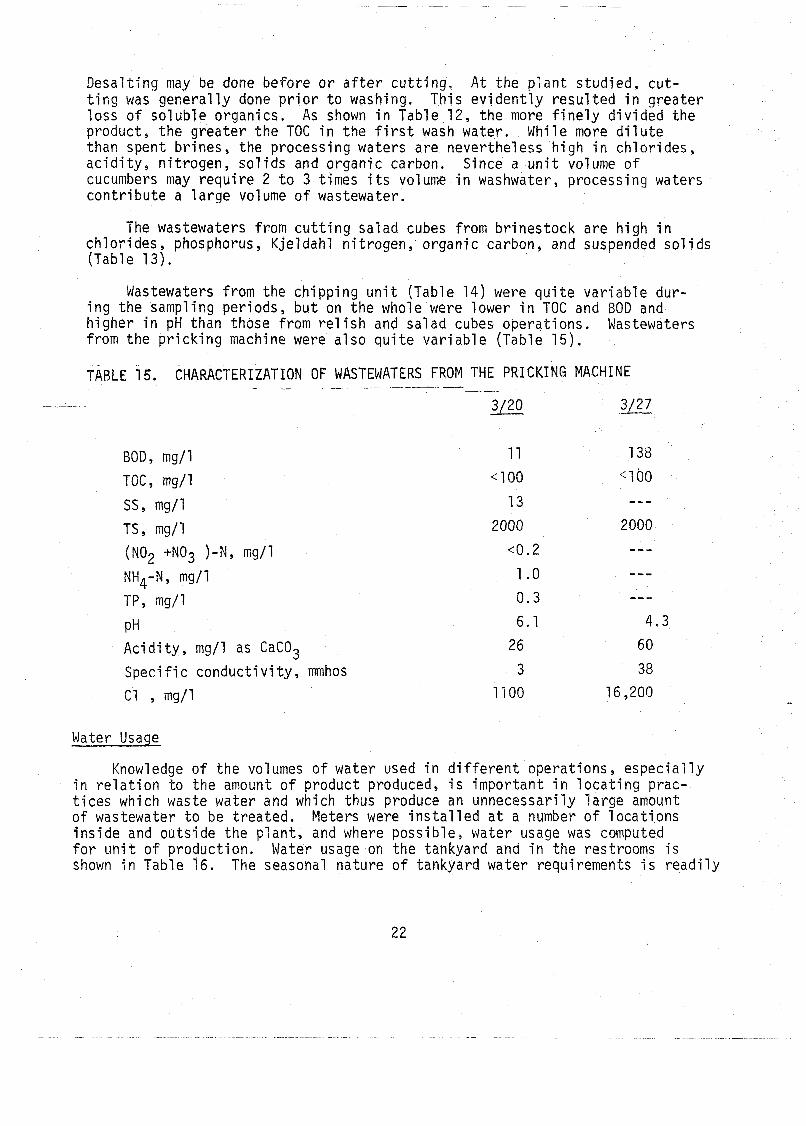
D e s a l t i n g may be done before o r a f t e r c u t t i n g , A t t h e p l a n t s tud ied , c u t - t i n g was g e n e r a l l y done p r i o r t o washing. T h i s e v i d e n t l y r e s u l t e d i n g r e a t e r l o s s of s o l u b l e o rgan ics , As shown i n Tab le 12, t h e more f i n e l y d i v i d e d t h e p roduc t , t h e g r e a t e r t h e TOC i n t h e f i r s t wash water . Whi le more d i l u t e than spent b r i n e s , t h e p rocess ing waters a r e never the less h i g h i n c h l o r i d e s , a c i d i t y , n i t r o g e n , s o l i d s and o rgan i c carbon. S ince a u n i t volume o f cucumbers may r e q u i r e 2 t o 3 t imes i t s volume i n washwater, p rocess ing waters c o n t r i b u t e a l a r g e volume o f wastewater.
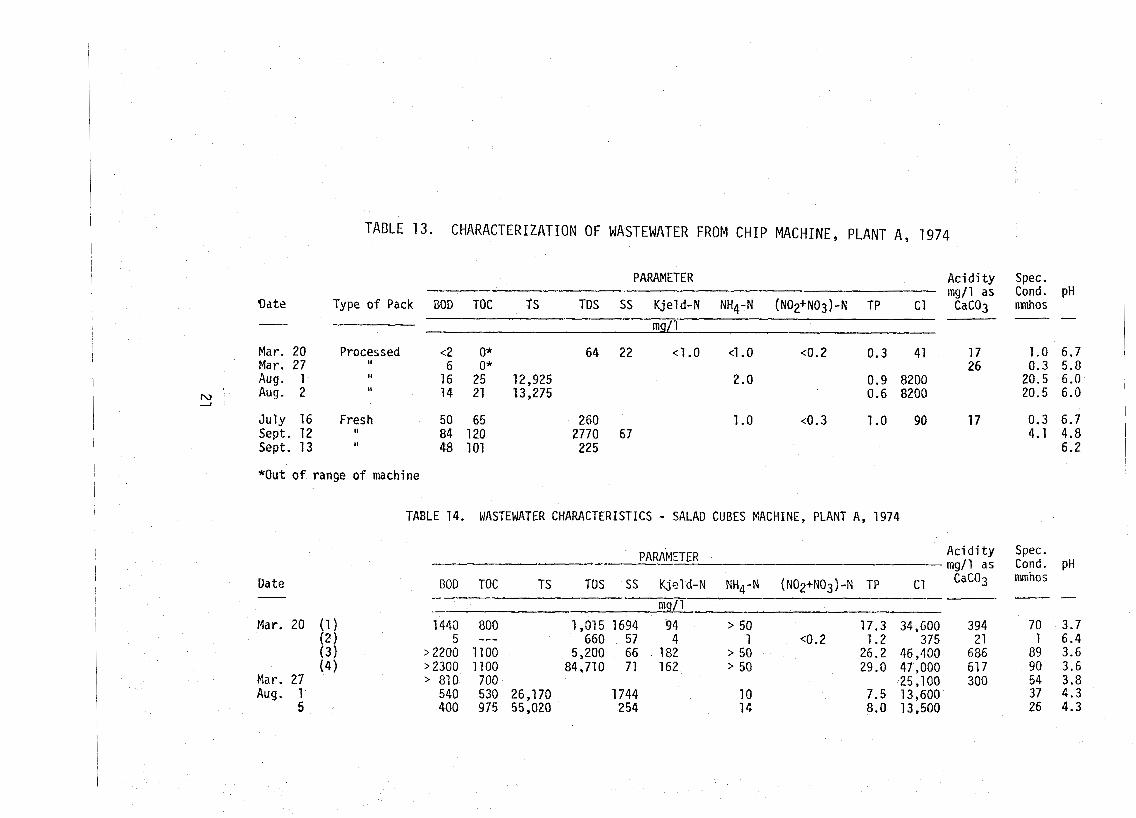
The wastewaters from c u t t i n g sa lad cubes from b r i n e s t o c k a r e h i g h i n c h l o r i d e s , phosphorus, K j e l d a h l n i t r o g e n , o rgan i c carbon, and suspended s o l i d s (Table 13).
Wastewaters f rom the c h i p p i n g u n i t (Tab le 14) were q u i t e v a r i a b l e dur - i n g t h e sampl ing per iods , b u t on t h e whole were lower i n TOC and BOD and h ighe r i n pH than those f rom r e l i s h and s a l a d cubes ope ra t i ons . Wastewaters f rom t h e p r i c k i n g machine were a l s o q u i t e v a r i a b l e (Tab le 1 5 ) .
TABLE 15. CHARACTERIZATION OF WASTEWATERS FROM THE PRICKING MACHINE - - _- _-_ ___--
BOD, mg/l
TOC, mg/l
SS, mg/l
TS, mg/l (NO2 +NO3 )-N, mg/l
NH4-N, mg/l
TP, mg/l
pH A c i d i t y , mg/l as CaC03
S p e c i f i c c o n d u c t i v i t y , mmhos
C1 , mg/l
Water Usage
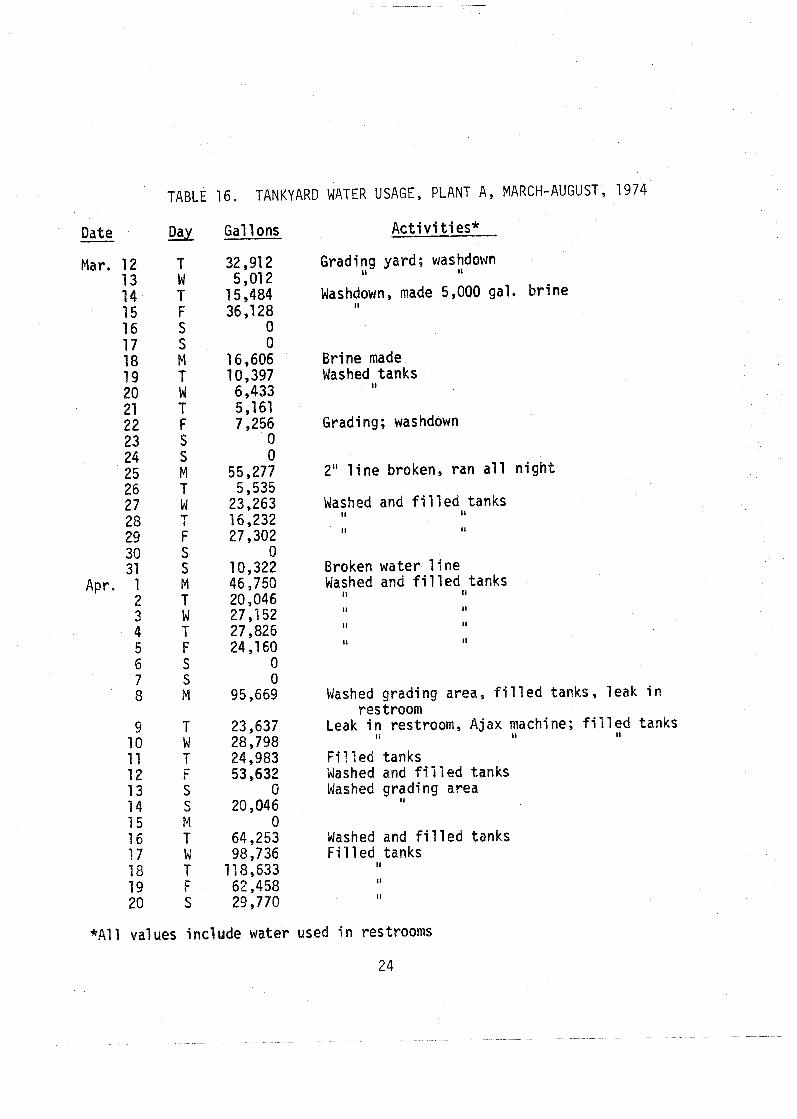
Knowledge o f t h e volumes o f wa te r used i n d i f f e r e n t opera t ions , e s p e c i a l l y i n r e l a t i o n t o t h e amount o f p roduc t produced, i s impo r tan t i n l o c a t i n g p rac - t i c e s which waste wate r and which thus produce an unnecessa r i l y l a r g e amount o f wastewater t o be t r e a t e d . Meters were i n s t a l l e d a t a number o f l o c a t i o n s i n s i d e and ou t s i de t h e p l a n t , and where poss ib l e , wa te r usage was computed f o r u n i t o f p roduc t i on . Water usage on t he tankyard and i n t h e restrooms i s shown i n Table 16. The seasonal na tu re o f tankyard wate r requi rements i s r e a d i l y
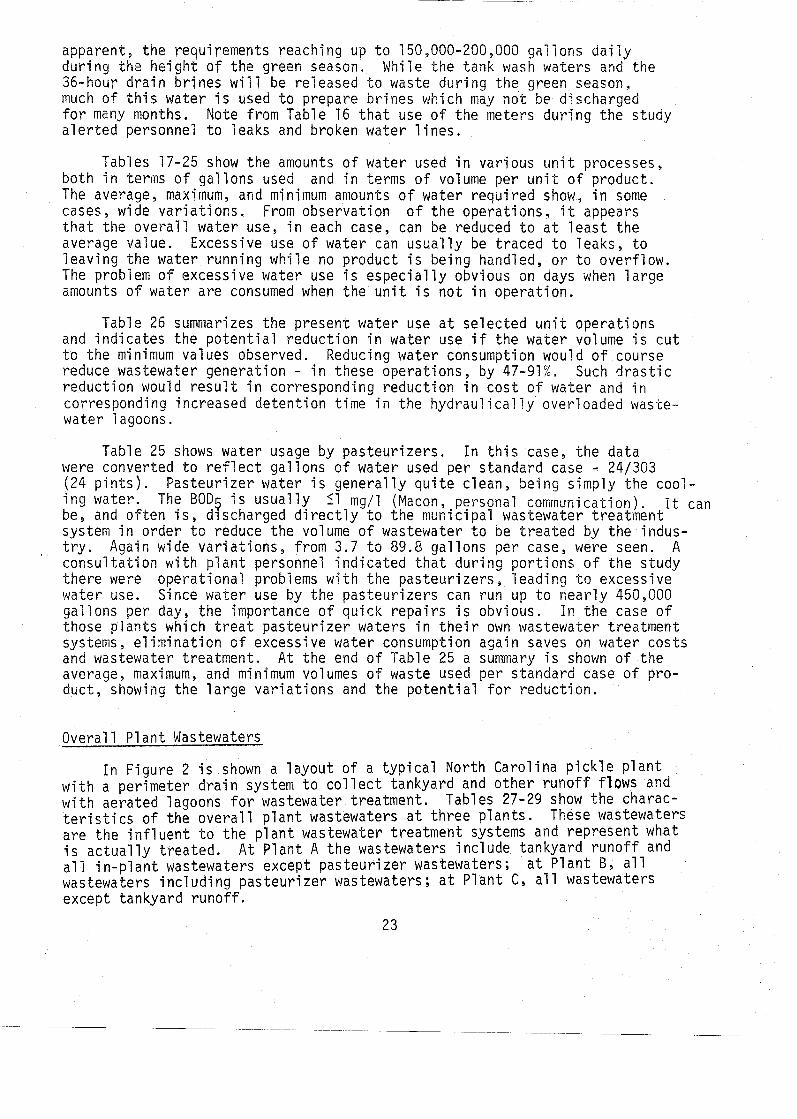
apparent, the requirements reaching u p to 150,000-200,000 gallons daily during the height of the green season, While the tank wash waters and the 36-hour drain brines will be released t o waste during the green season, much of t h i s water i s used t o prepare brines which may not be discharged for many months, Note from Table 16 that use of the meters during the study alerted personnel to leaks and broken water l ines .
Tables 17-25 show the amounts of water used in various unit processes, both in terms of gallons used and in terms of volume per unit of product. The average, maximum, and minimum amounts of water required show, in some cases, wide variations. From observation of the operations, i t appears tha t the overall water use, in each case, can be reduced t o a t leas t the average value. Excessive use of water can usually be traced t o leaks, to leaving the water running while no product i s being handled, or to overflow. The problem of excessive water use i s especially obvious on days when large amounts of water are consumed when the unit i s not i n operation.
Table 26 summarizes the present water use a t selected unit operations and indicates the potential reduction in water use i f the water volume i s cut t o the minimum values observed. Reducing water consumption would of course reduce wastewater generation - in these operations, by 47-91%. Such dras t ic reduction would resu l t in corresponding reduction in cost of water and in corresponding increased detention time in the hydraulically overloaded waste- water 1 agoons.
Table 25 shows water usage by pasteurizers. In th i s case, the data were converted to r e f l ec t gallons of water used per standard case - 24/303 (24 p in ts ) . Pasteurizer water i s generally quite clean, being simply the cool- ing water. The 0005 i s usually 51 mg/l (Macon, .personal communication). ~t can be, and often i s , discharged direct ly to the municipal wastewater treatment system in order to reduce the volume of wastewater to be treated by the indus- t ry . Again wide variations, from 3.7 to 89.8 gallons per case, were seen. A consultation with plant personnel indicated that during portions of the study there were operational problems with the pasteurizers, leading t o excessive water use. Since water use by the pasteurizers can run up t o nearly 450,000 gallons per day, the importance of quick repairs i s obvious. In the case of those plants which t r e a t pasteurizer waters in the i r own wastewater treatment systems, elimination of excessive water consumption again saves on water costs and wastewater treatment. A t the end of Table 25 a summary i s shown of the average, maximum, and minimum volumes of waste used per standard case of pro- duct, showing the large variations and the potential for reduction.
Overall Pl ant Wastewaters
In Figure 2 i s shown a layout of a typical North Carolina pickle plant with a perimeter drain system to col lect tankyard and other runoff flows and with aerated lagoons for wastewater treatment. Tables 27-29 show the charac- t e r i s t i c s of the overall plant wastewaters a t three plants. These wastewaters are the influent to the plant wastewater treatment systems and represent what i s actually treated. A t Plant A the wastewaters include tankyard runoff and a1 1 in-plant wastewaters except pasteurizer wastewaters; a t Plant 0 , a1 1 wastewaters including pasteurizer wastewaters; a t Plant C, a1 1 wastewaters except tankyard runoff.
Date - Mar. 12
13 14 15 16 17 18 19 20 21 22 2 3 24 25 2 6 2 7 2 8 2 9 30 3 1
Apr. 1 2 3 4 5 6 7 8
9 10 11 12 13 14 15 16 17 18 19 20
TABLE 16. TANKYARD WATER USAGE, PLANT A, MARCH-AUGUST, 1974
Gal 1 ons
32,912 5,012
1 5,484 36,128
0 0
16,606 10,397
6,433 5,161 7,256
0 0
55,277 5,535
23,263 16,232 27,302
0 10,322 46,750 20,046 27,152 27,826 24,160
0 0
95,669
23,637 28,798 24,983 53,632
0 20,046
0 64,253 98,736
118,633 62,458 29,770
A c t i v i t i e s *
Grading I t yard; washdown # I
Washdonn, I I made 5,000 gal. b r i n e
B r i n e made Washed I t t anks
Gradi ng ; was hdown
2" l i n e broken, r a n a l l n i g h t
Washed I t and f i l l e d I t tanks
I t I I
Broken wa te r l i n e Washed I! and f i l l e d I t tanks
I I I I
1 1 I 1
I t I 1
Washed g rad ing area, f i 11 ed tanks, 1 eak i n r e s troom
Leak i n I! restroom, A jax machine; I t f i l l e d I! tanks
F i l l e d tanks Washed and f i l l e d tanks Washed g rad ing !I area
Washed and f i 1 l e d tanks F i l l e d tanks
I 1
1 1
I I
+A1 1 values i n c l u d e water used i n restrooms
24
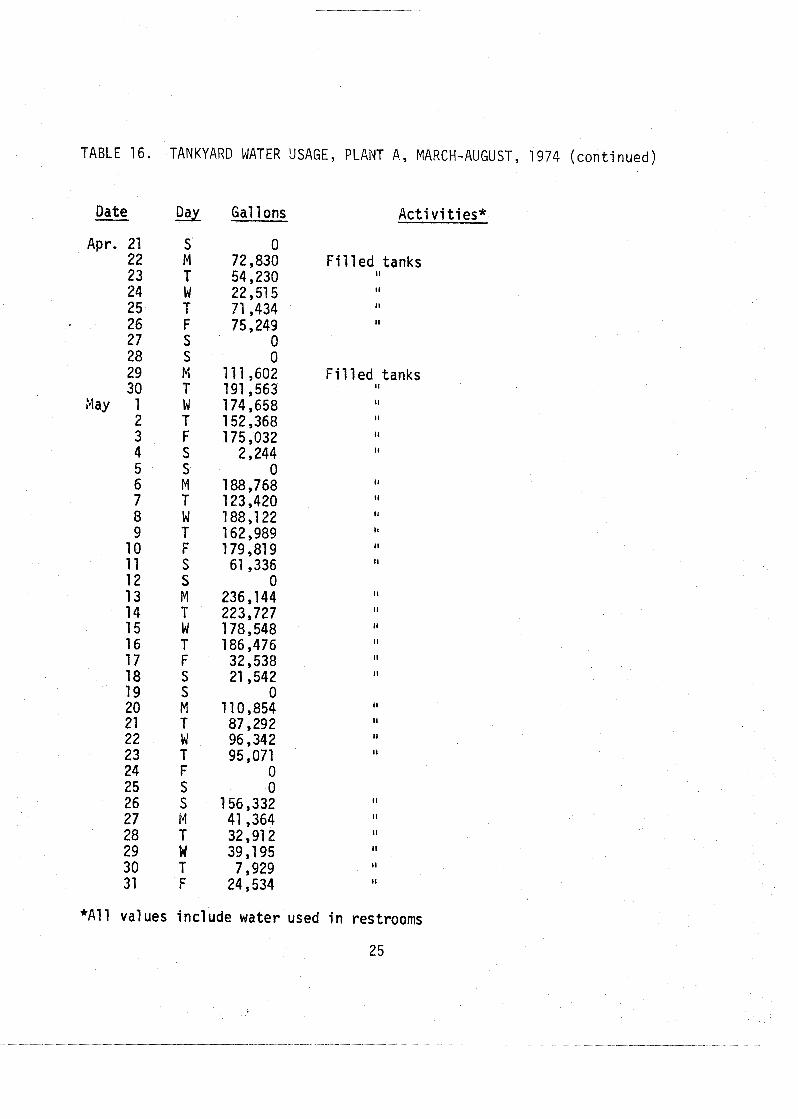
TABLE 16. TANKYARD WATER USAGE, PLANT A, MARCH-AUGUST, 1974 (con t i nued)
Date - Apr. 21
22 2 3 24 2 5 26 27 2 8 29 30
May 1 2
Da-y Gallons Act ivi t ies*
F i l l ed tanks I 1
I 1
I I
I f
Fi l led tanks I I
*All values include water used i n restrooms
25
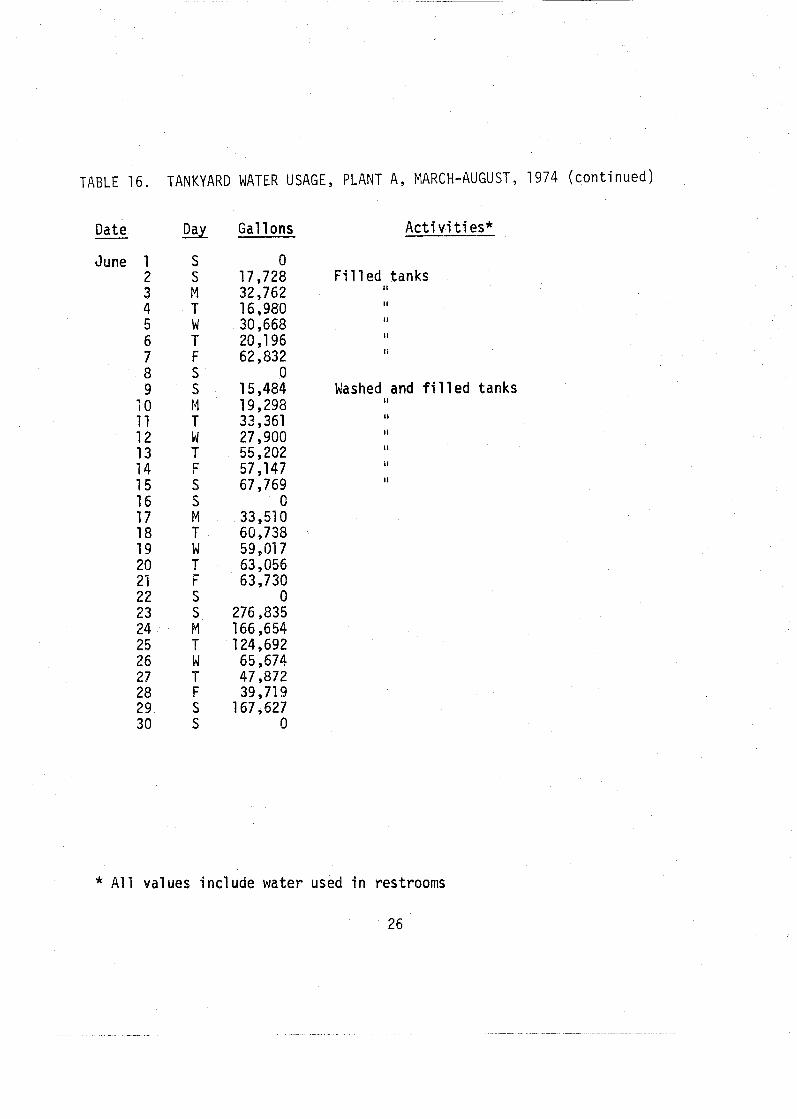
TABLE 16. TANKYARD WATER USAGE, PLANT A, MARCH-AUGUST, 1974 (cont inued)
Date - June 1
2 3 4 5 6 7 8 9
10 11 12 13 14 15 16 17 18 19 20 21 22 2 3 24 2 5 2 6 27 2 8 29 30
Day
S S M T W T F S S M T W T F S S M T W T F S S M T W T F S S
Gal 1 ons
0 17,728 32,762 16,980 30,668 20,196 62,832
0 1 5,484 19,298 33,361 27,900 55,202 57,147 67,769
0 33,510 60,738 59,017 63,056 63,730
0 276,835 166,654 124,692
65,674 47,872 39,719
167,627 0
A c t i v i ti es*
F i l l e d tanks II
I I
I1
It
I1
Washed and f i l l e d tanks I t
It
I1
II
II
I1
* A1 1 va lues i n c l u d e wate r used i n restrooms
26
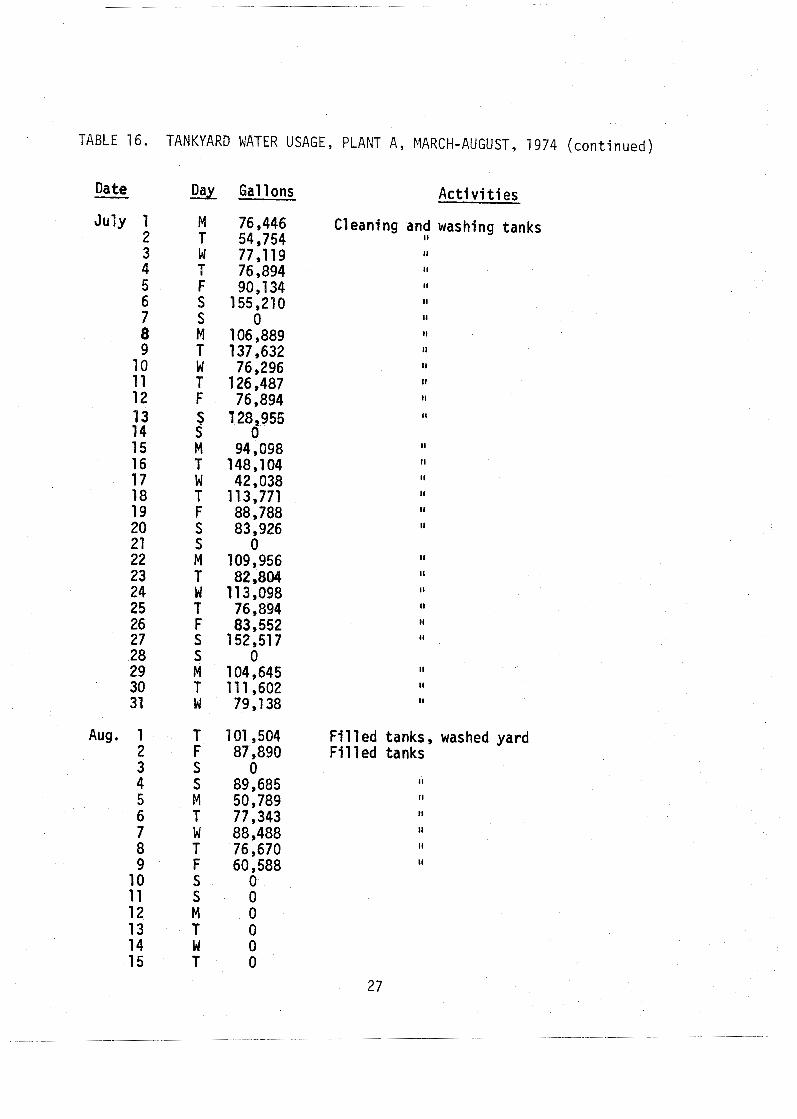
TABLE 16.
Date - July 1
2 3 4 5 6 7 8 9
10 11 12 13 14 15 16 17 18 19 20 2 1 22 23 24 25 26 2 7 28 2 9 30 31
Aug. 1 2 3 4 5 6 7 8 9
10 11 12 13 14 15
TANKYARD WATER USAGE, PLANT A, MARCH-AUGUST, 1974 (cont inued)
Day Gallons A c t i v i t i e s
Cleaning and washing tanks i1
F i l l e d tanks, washed yard F i 11 ed tanks
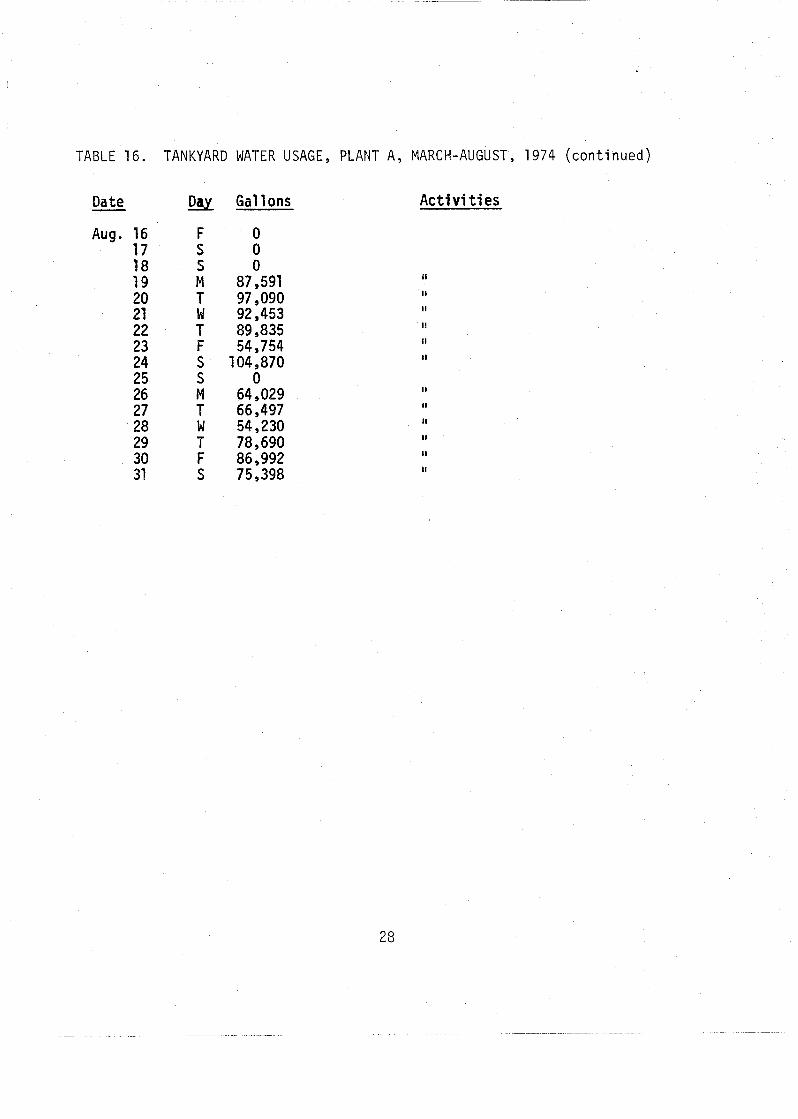
TABLE 16. TANKYARD WATER USAGE, PLANT A, MARCH-AUGUST, 1974 (cont inued)
Date - &X Gal 1 ons
Aug. 16 F 0 17 S 0 18 S 0 19 M 87,591 20 T 97,090 21 W 92,453
A c t i v i t i e s
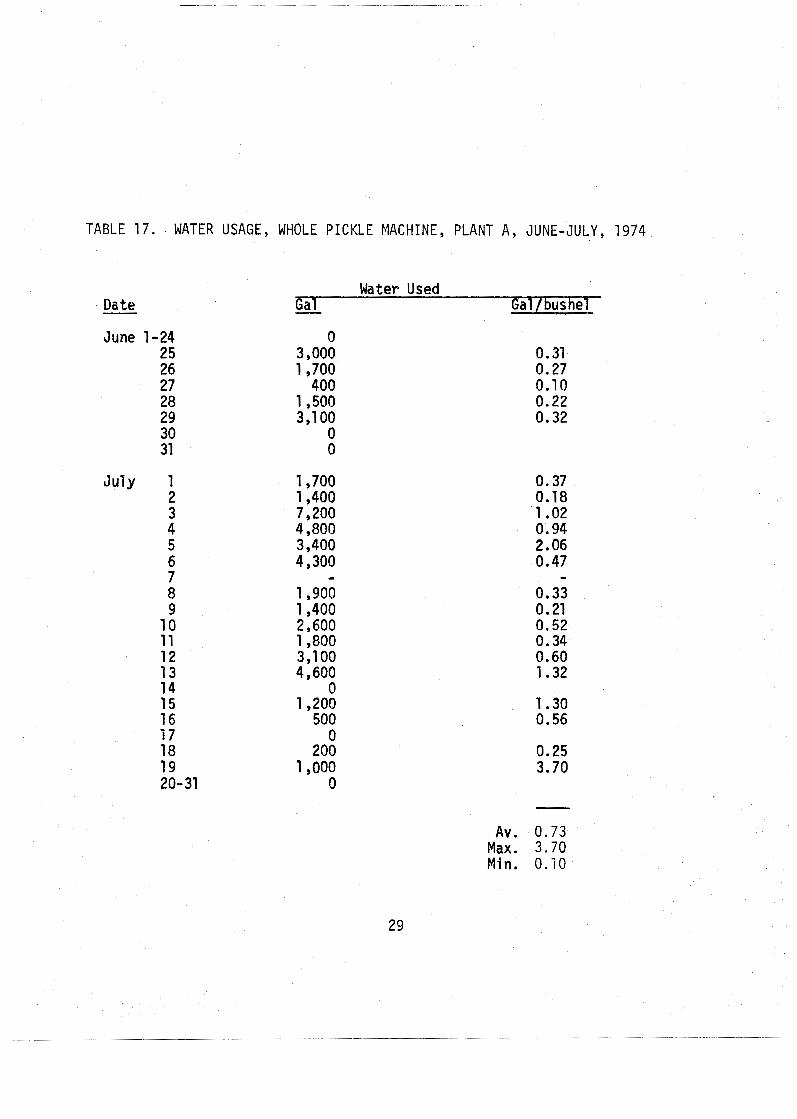
TABLE 17. WATER USAGE, WHOLE PICKLE MACHINE, PLANT A, JUNE-JULY, 1974
Date - June 1-24
25 26 2 7 28 2 9 30 31
July 1 2
Water Used -
Av, 0.73 Max. 3.70 Min. 0.10
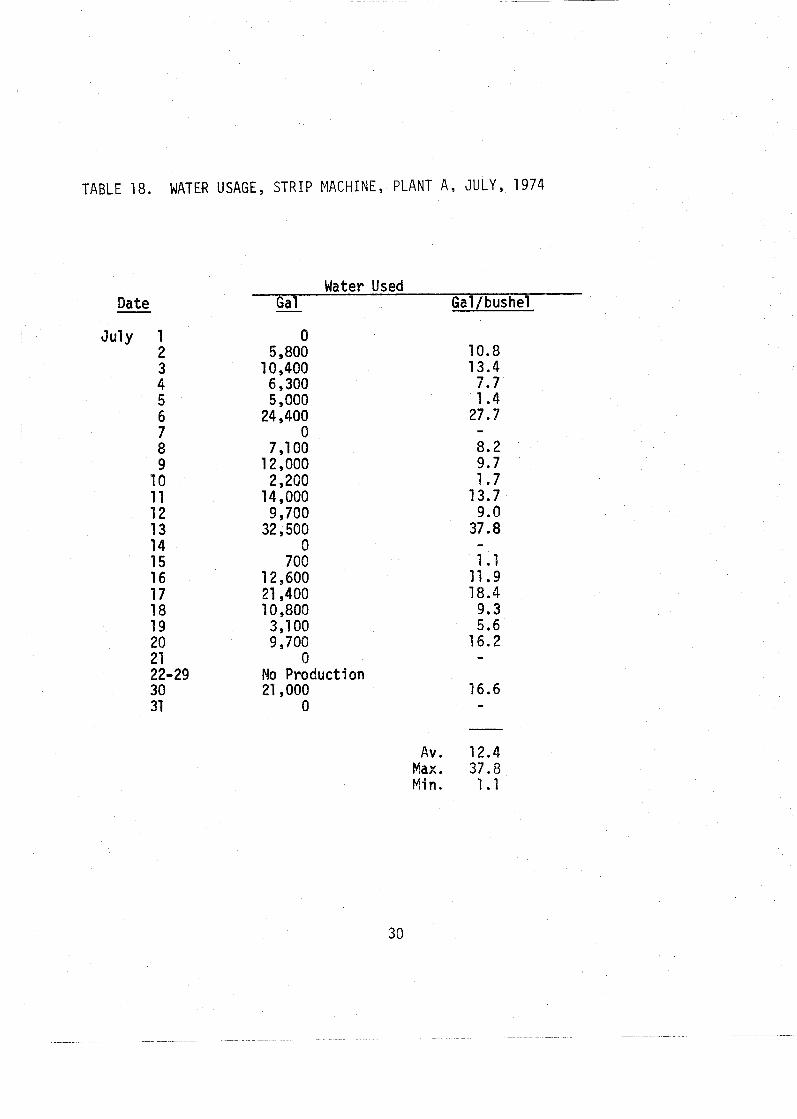
T A B L E 18. WATER USAGE, S T R I P MACHINE, PLANT A, J U L Y , 1974
Date - July 1
2 3 4 5 6 7 8 9
10 11 12 13 14 15 16 17 18 19 20 2 1 22-29 30 31
Water Used Gal - Gal / bus he1
24,400 0
7,100 12,000
2,200 14,000 9,700
32,500 0
700 12,600 21,400 10,800 3,lOO 9,700
0 No Production 21,000
0
Av. 12.4 Max. 37.8 Min. 1 . I
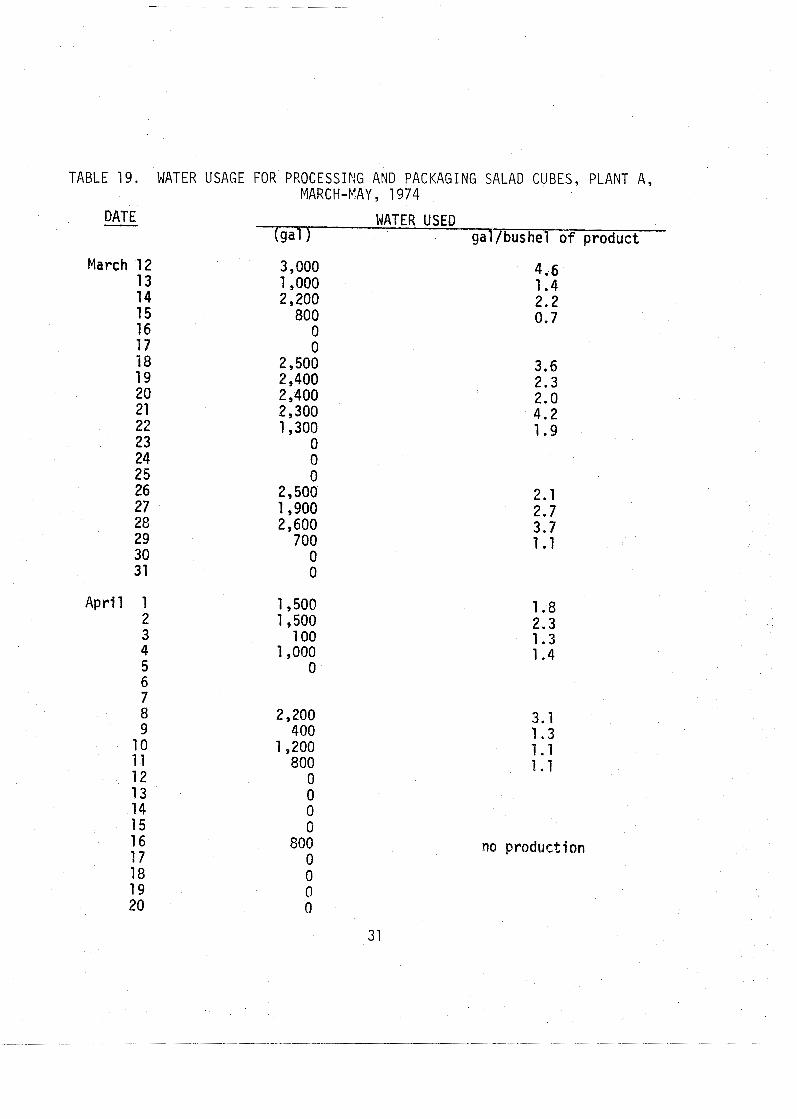
T A B L E 19. WATER USAGE FOR PROCESSING AND PACKAGING SALAD CUBES, P L A N T A, MARCH-MAY, 1974
DATE - March 1 2
13 14 15 16 17 18 19 2 0 2 1 22 2 3 24 25 26 27 28 29 30 3 1
A p r i l 1 2 3 4 5 6 7 8 9
10 11 12 l 3 14 15 16 17 18 19 20
WATER USED (gal gal/bushel o f product
na product ion
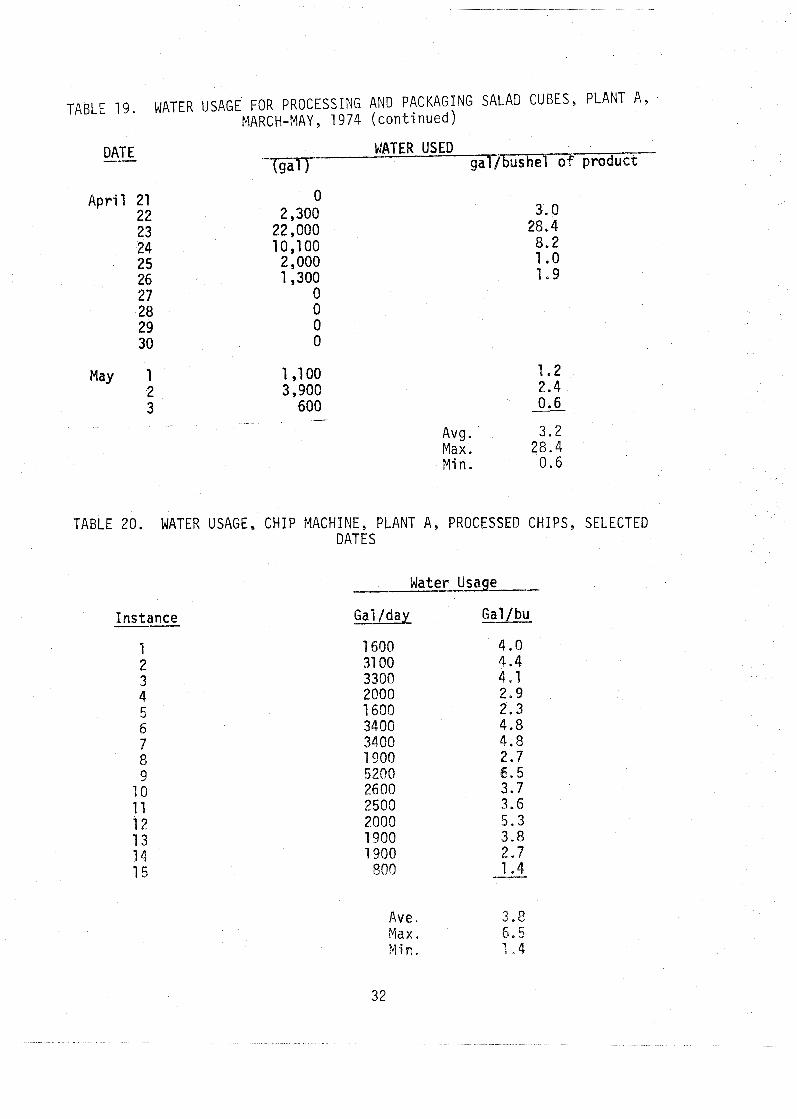
TABLE 19. WATER USAGE FOR PROCESSING AND PACKAGING SALAD CUBES, PLANT A, MARCH-MAY, 1974 (cont inued)
NATER USED -mV- gal / bushel of product
A v g . 3.2 Max. 28.4 M i n. 0.6
TABLE 20. WATER USAGE, C H I P MACHINE, PLANT A, PROCESSED CHIPS, SELECTED DATES
Instance
1 2 3 4 5 6 7 8 9
7 0 11 1 2 13 5 4 1 5
ldater Usage
Gal /clay Gal/bu
1600 4.0 31 00 4 - 4 3300 4 $1 2000 2.9 1600 2.3 3400 4.8 3400 4.5 1900 2 7 5200 .5 2600 3.7 2500 3.6 2000 5 * 3 1900 3.8 1900 2.7
800 - 1.4
Ave Max. M i n,
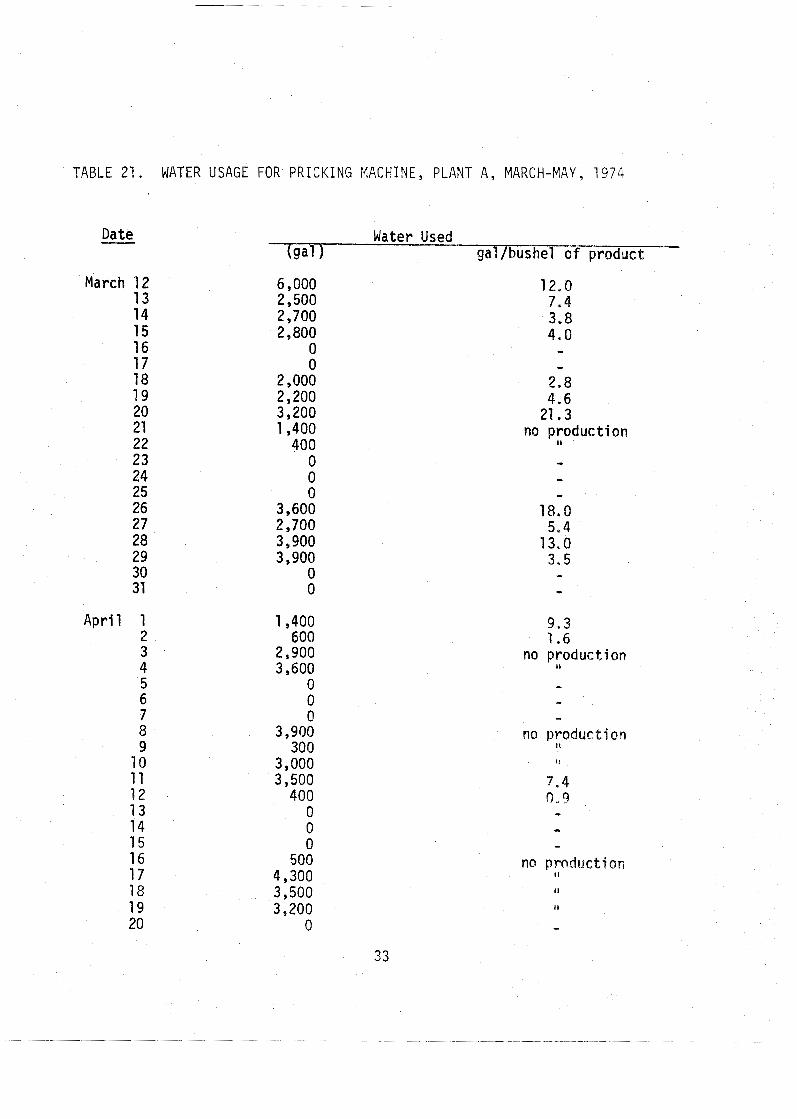
TABLE 21. WATER USAGE FOR P R I C K I N G MACHINE, PLANT A, MARCH-MAY, 1974
Date -
March 12 13 14 15 16 17 18 19 20 21 2 2 23 24 25 26 2 7 28 2 9 30 3 1
A p r i l 1 2
Water Used (gal gal jbushel of product --
- 2.8 4.6
21.3 no production
I I
9.3 1.6
no production I 1
no product ion I I
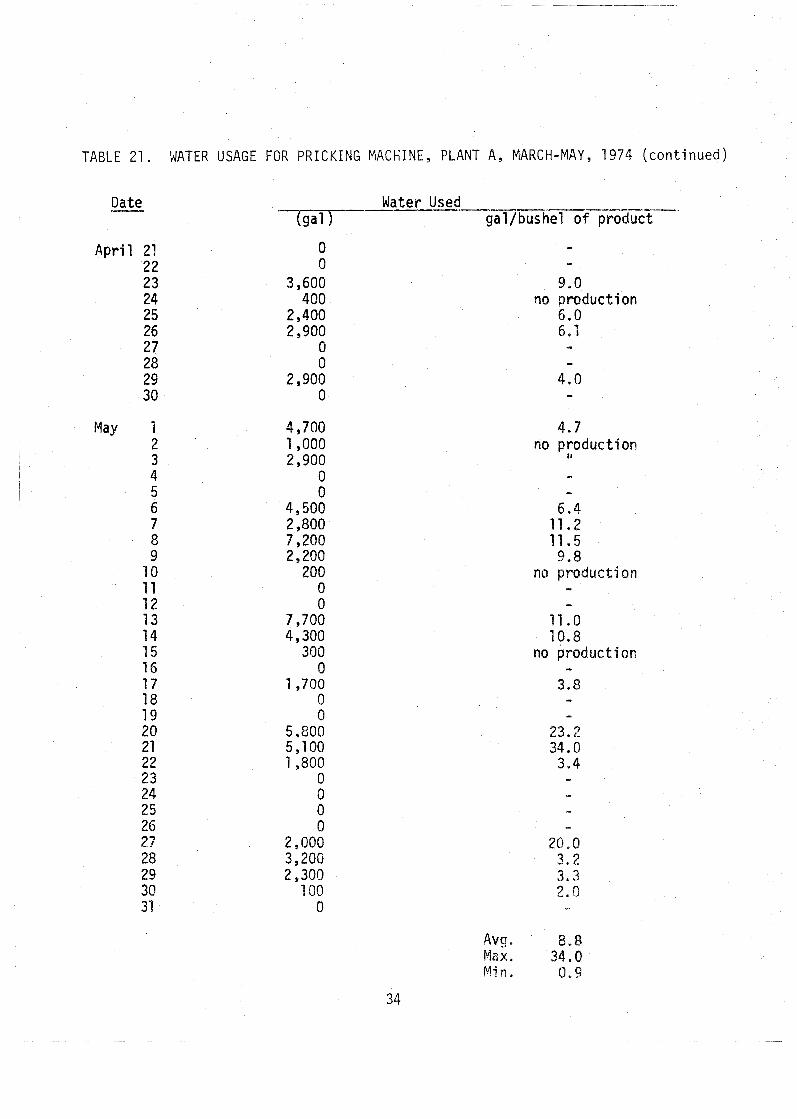
TABLE 21. WATER USAGE FOR PRICKING MACHINE, PLANT A, MARCH-MAY, 1974 (con t inued)
Date -
Apr i l 21 2 2 2 3 24 2 5 26
- Nate r Used - (ga l ) g a l / b u s he7 o f p r o d u c t
- 9,O
no p r o d u c t i o n 6.0 6$7
4.7 no p r o d u c t i o n
11
- 11 * o 10.8
no p r o d u c t i o n
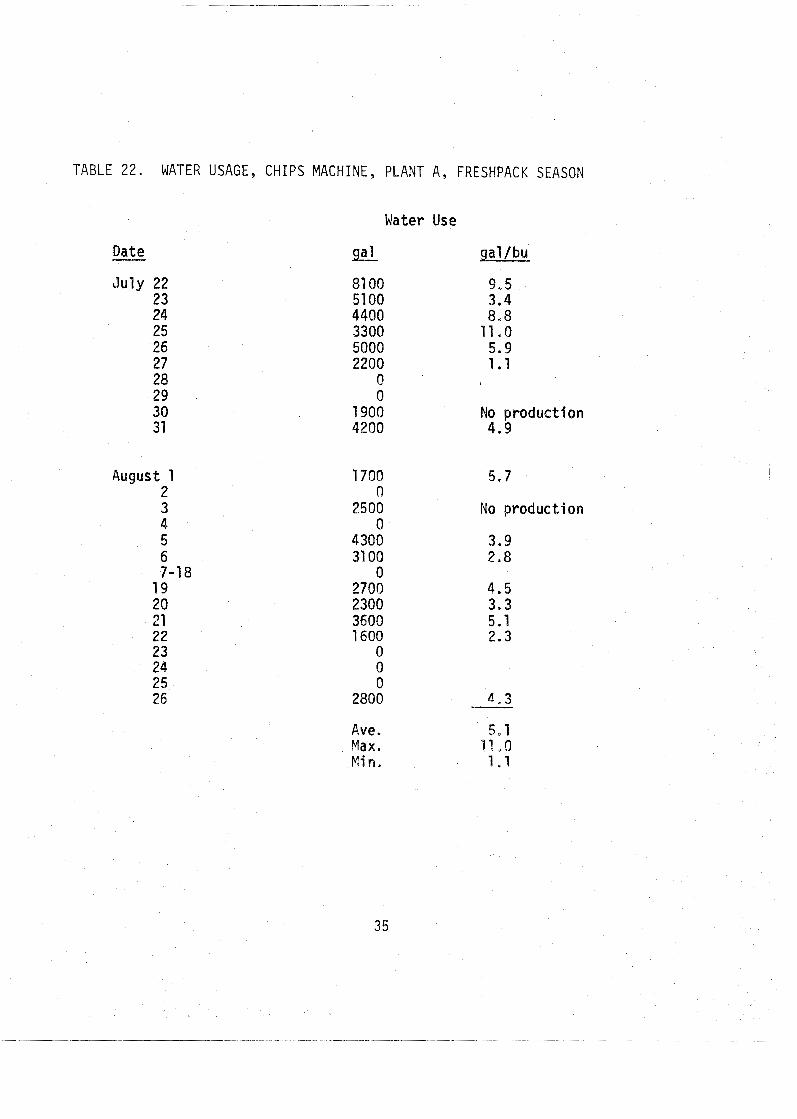
TABLE 22. WATER USAGE, C H I P S MACHINE, PLANT A, FRESHPACK SEASON
Water Use
Date - July 22
23 24 25 26 27 28 29 3 0 31
August 1 2
gal /bu
No production 4.9
1700 5,7 0
2500 No production 0
2706 2300 3600 1600
0 0 C!
2800
Ave. Max. M i r r .
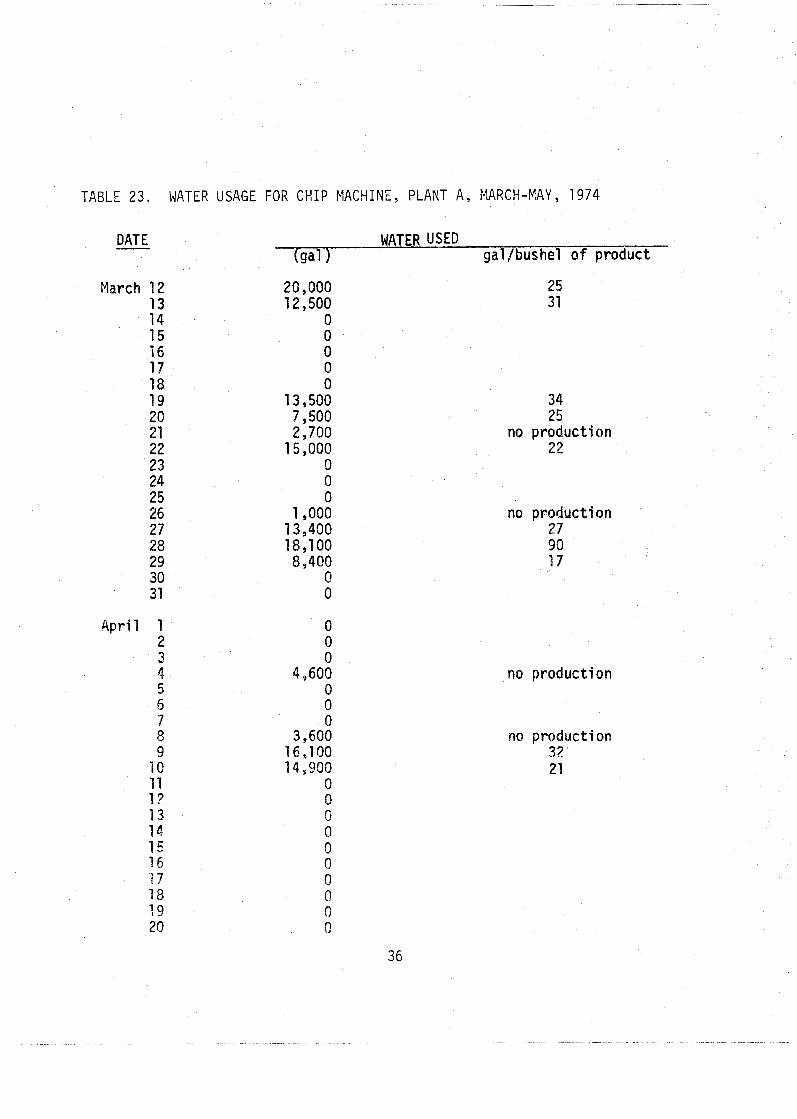
T A B L E 23. WATER USAGE FOR C H I P MACHINE, PLANT A, MARCH-MAY, 1974
DATE -
March 1 2 13 14 15 16 17 18 19 2 0 2 1 22 2 3 24 2 5 26 27 28 29 30 31
A p r i l 7 2 3 4 5 6 7 8 9
10 I1 1 7 l 3 14 15 7 6 17 78 19 2 0
WATER USED (gal ) gal bus he1 s f p r o d u c t
34 25
no p r o d u c t i o n 2 2
no p r a d u c t i ~n 2 7 9 0 17
no p r o d u c t i o n
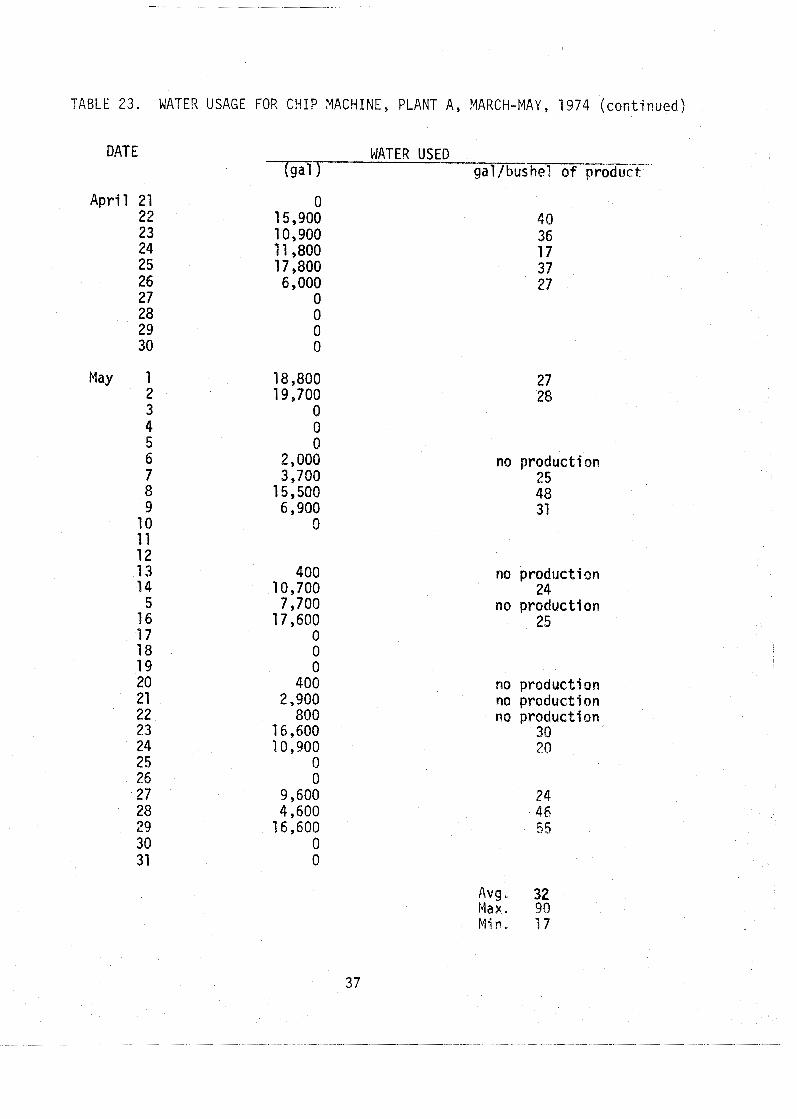
TABLE 23. WATER USAGE FOR C H I P MACHINE, PLANT A, MARCH-MAY, 1974 (cont inued)
DATE
A p r i l 21 2 2
May 1 2
WATER USED (salr g a l /bus he? o f pr&'i&kT'
no production 25 48 3 1
no production 24
no production
Avg . Max. M i q .
production production production
3 0 2 0
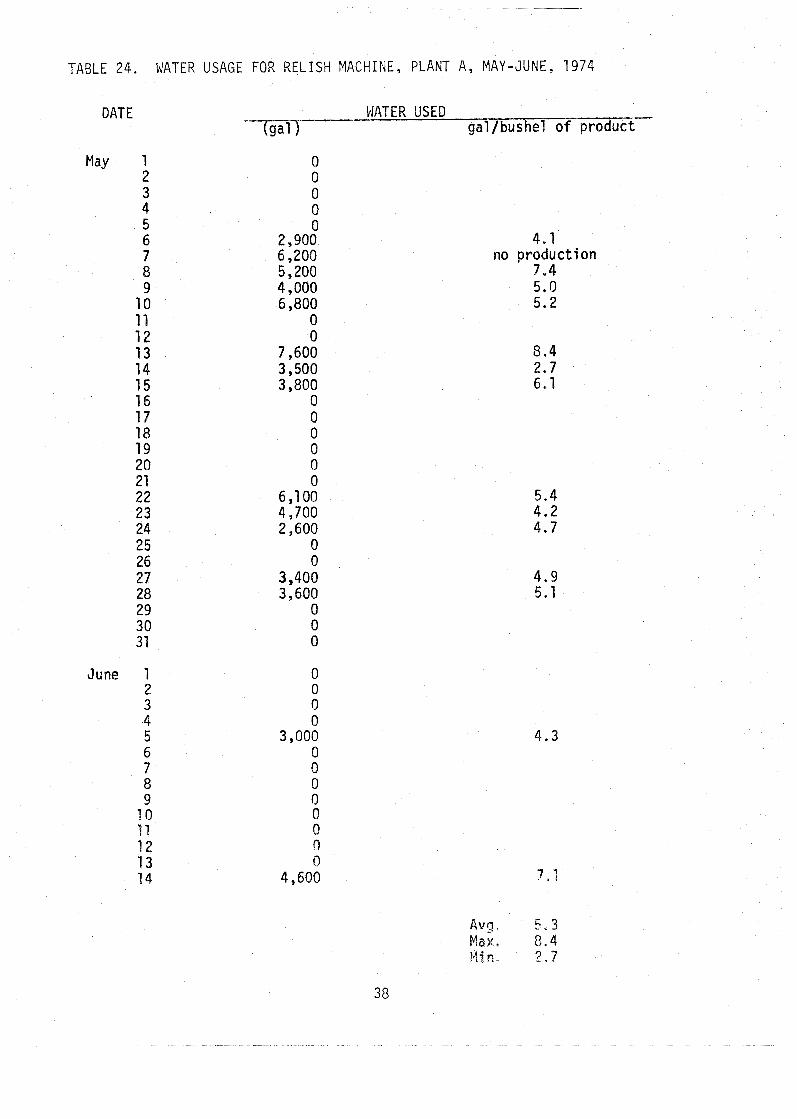
TABLE 24. WATER USAGE FOR R E L I S H MACHINE, PLANT A, MAY-JUNE, 1974
DATE
May 1 2
June 1 2 3 4 5 6 7 8 9
1 a 1 I 12 13 14
WATER USED - 5 1 ) gal/bushel o f product
4.1 no product i on
7.4 5.0 5.2
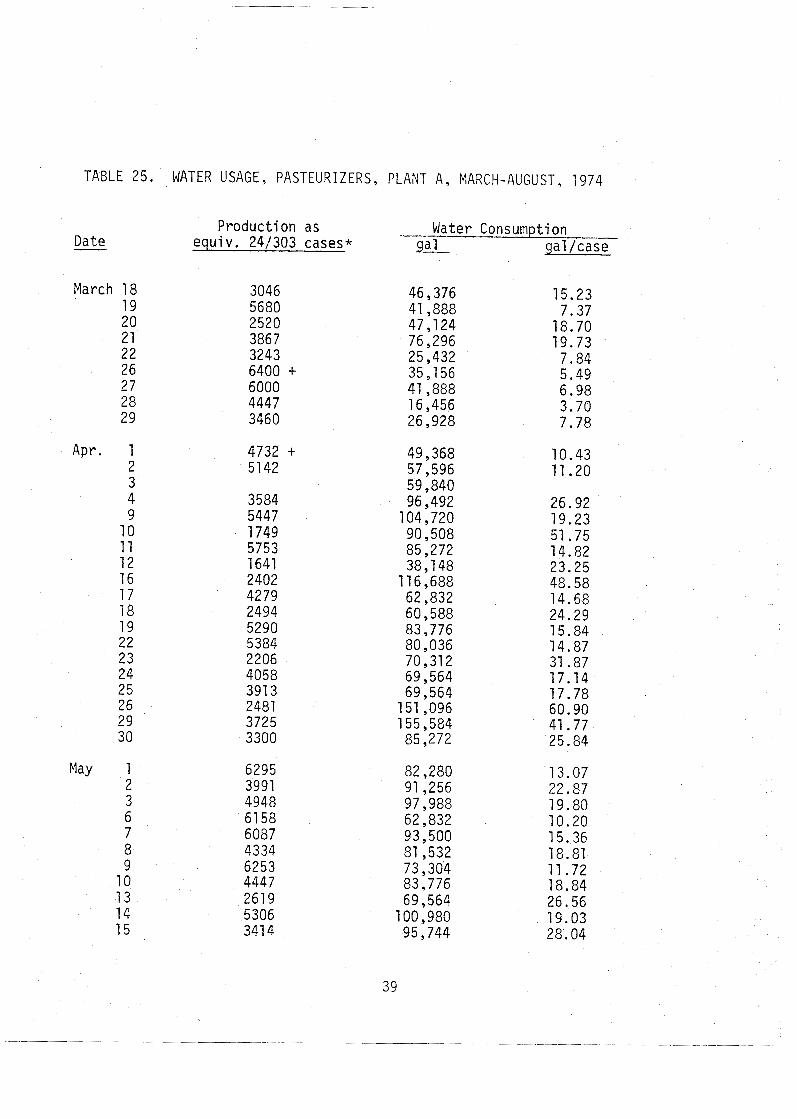
TABLE 25.
Date -
March 18 19 20 2 1 2 2 26 2 7 28 2 9
Apr. 1 2 3 4 9
10 11 12 16 17 18 19 22 2 3 24 2 5 26 2 9 3 0
May 1 2 3 6 7 8 9
10 13 14 15
WATER USAGE, PASTEURIZERS, PLANT A, MARCH-AUGUST, 1 9 7 4
Produc t ion as equi v. 24/303 cases*
Water Consumption ga l /case
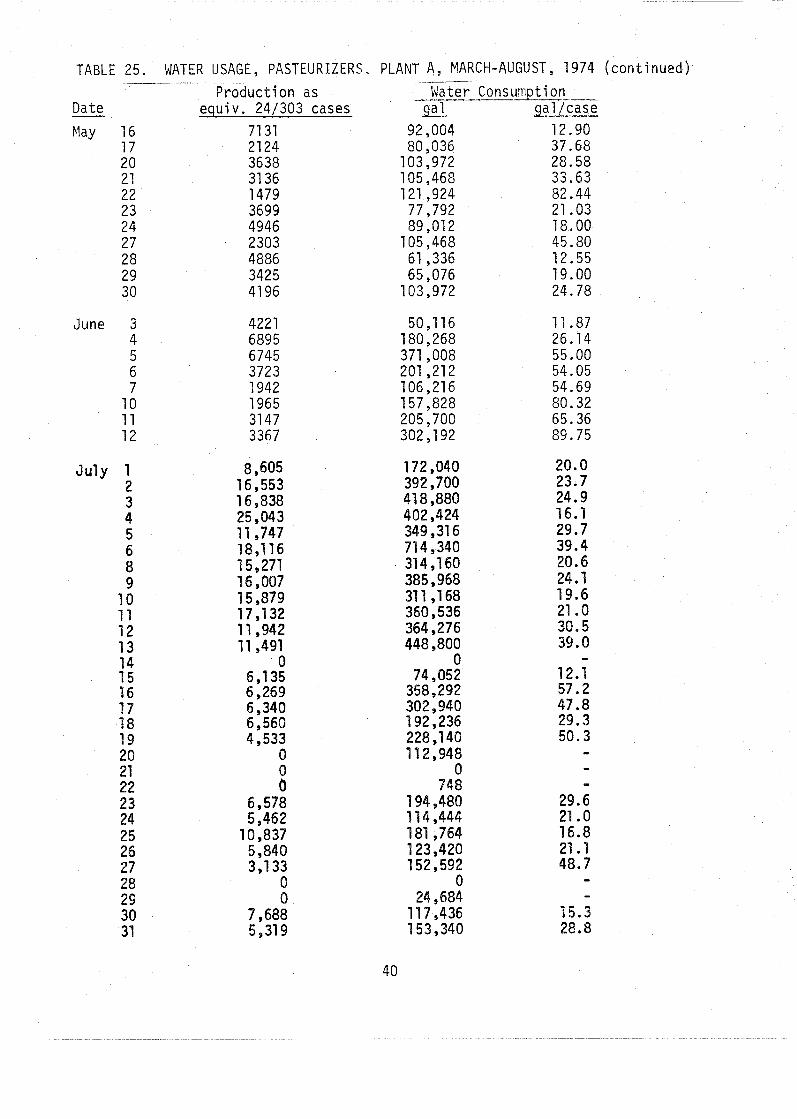
TABLE 25. WATER USAGE, PASTEURIZERS, PLANT A, MARCH-AUGUST, 1974 ( c o n t i n u e d ) -- - . - -- -
Produc t ion a s - Water Consunlpti on --- Date equ iv . 24/303 c a s e s S.1 g a l / c a s e
May 16 17 2 0 2 1 22 2 3 2 4 2 7 28 2 9 3 0
June 3 4 5 6 7
10 11 12
July 1 2
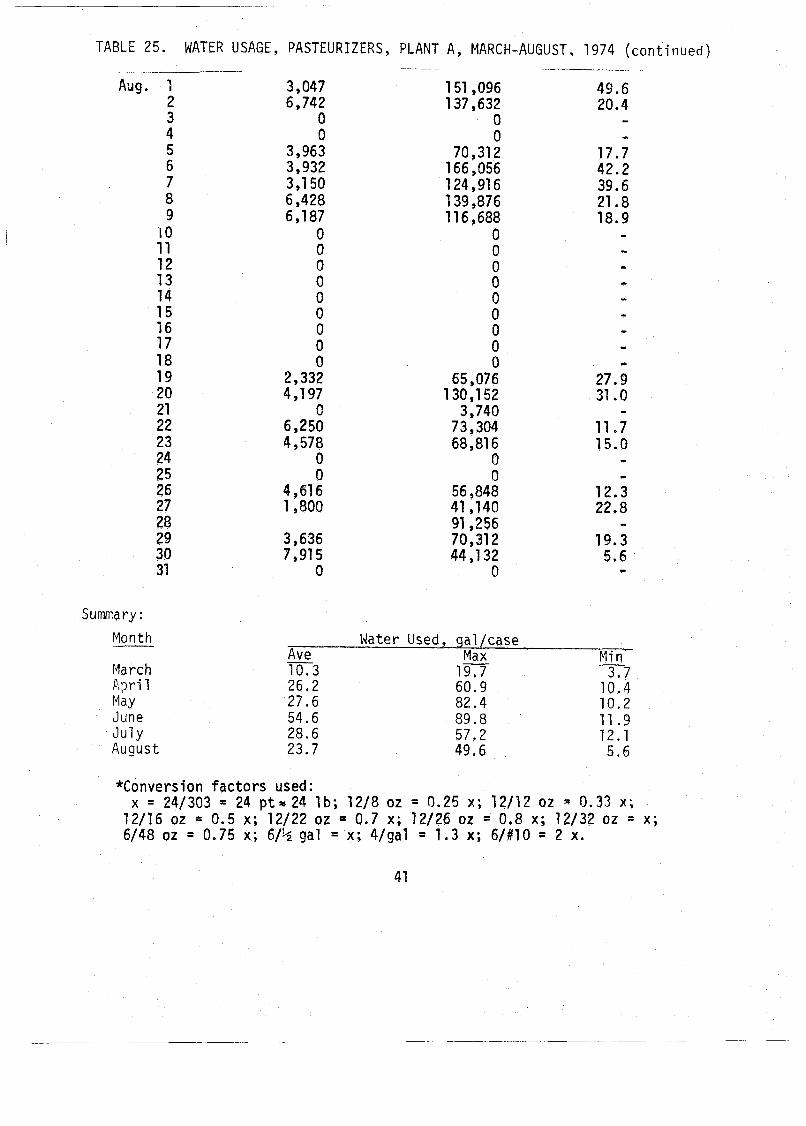
TABLE 25. WATER USAGE, PASTEURIZERS, PLANT A, MARCH-AUGUST, 1 9 7 4 ( con t i nued ) -. - -- - - . - -- - -
Aug. 1 2 3 4 5 6 7 8 9
10 11 12 13 14 15 16 17 18 19 2 0 21 2 2 23 24 2 5 26 27 28 29 30 31
Summa ry :
Month
March P p - i 1 May June Ju ly August
Water Used , ga l / c a se A v e - Max b l i n 10.3 19.7
- 3 .7
*Conversion fac tors used: x = 241303 = 24 pt 4 24 Ib; 1218 oz = 0 .25 X ; 12/12 02 0 ,33 X ;
12/16 oz = 0 . 5 x; 12/22 oz = 0 .7 x; 12/26 oz = 0 . 8 x; 12/32 oz = x; 6/48 oz = 0.75 x; 61% gal = x ; 4/gal = 1 . 3 X; 6/#10 = 2 X.
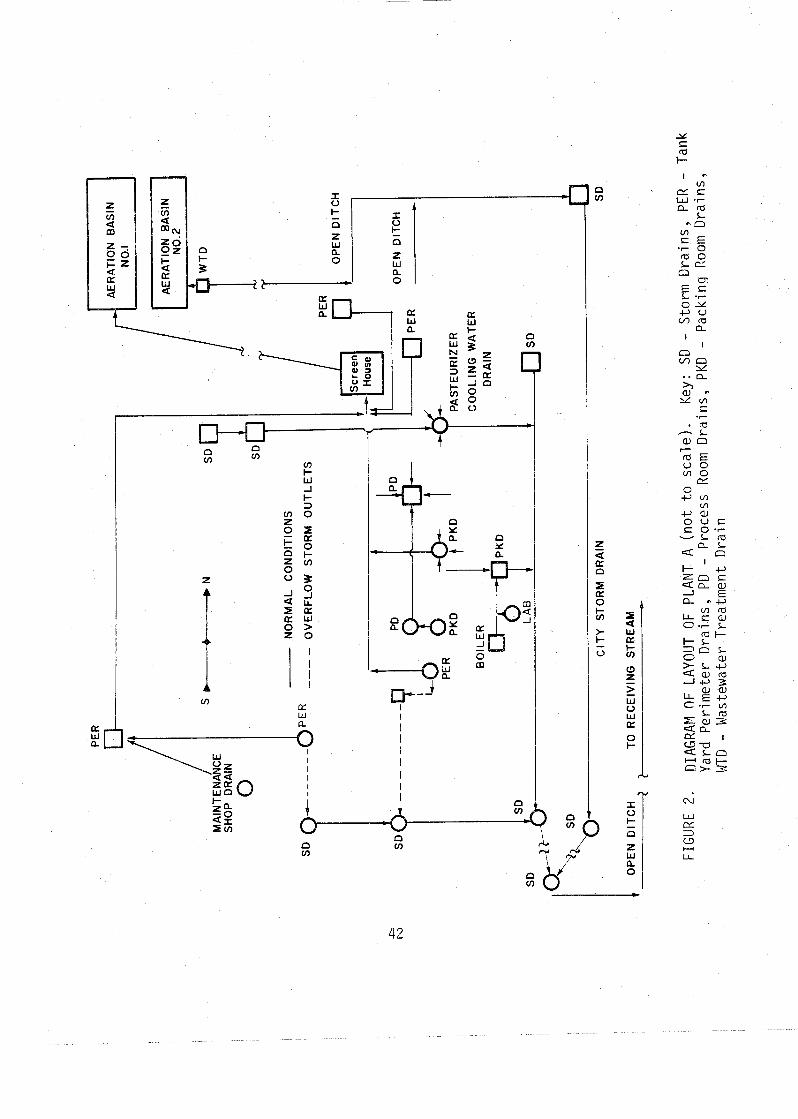
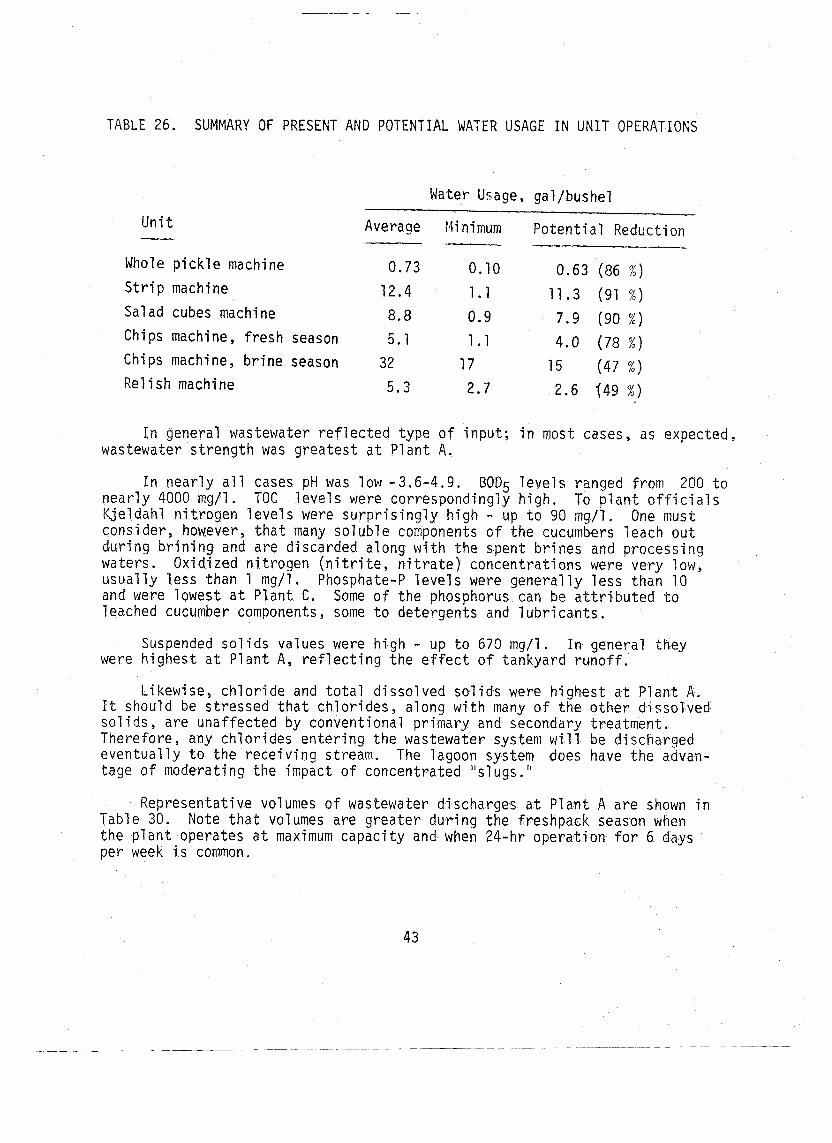
T A B L E 26. SUMMARY OF PRESENT A N D POTENTIAL WATER USAGE IN UNIT OPERATIONS
Unit --
Whole pickle machine
St r ip machine
Salad cubes machine
Chips machine, fresh season
Chi ps machine, brine season
Re1 ish machine
Water Usage, gal/bushel
Average M i nimurn Potential Reduction
0.73 0.10 0.63 (86 % ) 12.4 1 .1 11.3 (91 %)
8.8 0.9 7.9 (90 % )
5.1 1 . I 4.0 ( 7 8 % ) 3 2 17 15 (47 % )
5.3 2 .7 2.6 * ( 4 9 % )
I n general wastewater reflected type of input; in most cases, as expected, wastewater strength was greatest a t Plant A.
In nearly a1 1 cases pH was low - 3.6-4-9. BOD5 levels ranged from 200 t o nearly 4000 mg/l. TOC levels were correspondingly high. To plant o f f i c i a l s Kjeldahl nitrogen levels were surprisingly high - up t o 90 mg/l, One must consider, ho~ever , tha t many soluble components of the cucumbers leach out during brining and are discarded along with the spent brines and processing waters. Oxidized nitrogen ( n i t r i t e , n i t r a t e ) concentrations were ver,y low, usually less than 1 mg/l. Phosphate-P levels were generally less than 10 and were lowest a t Plant C . Some of the phosphorus can be at t r ibuted to leached cucumber components, some to detergents and lubricants.
Suspended sol ids values were h i g h - u p t o 670 mg/l. In general they were highest a t Plant A , reflecting the e f fec t of tankyard runoff.
Likewise, chloride and total dissolved solids were highest a t Plant A . I t should be stressed that chlorides, along with many of the other dissolved so l ids , are unaffected by conventional primary and secondary treatment. Therefore, any chlorides entering the wastewater system will be discharged eventually to the receiving stream. The lagoon system does have the advan- tage of moderating the impact of concentrated "slugs."
Representative volumes of wastewater discharges a t Plant A are shown in Table 30. Note that volumes are greater during the freshpack season when the plant operates a t maximum capacity and when 24-hr operation for 6 days per week i s common.
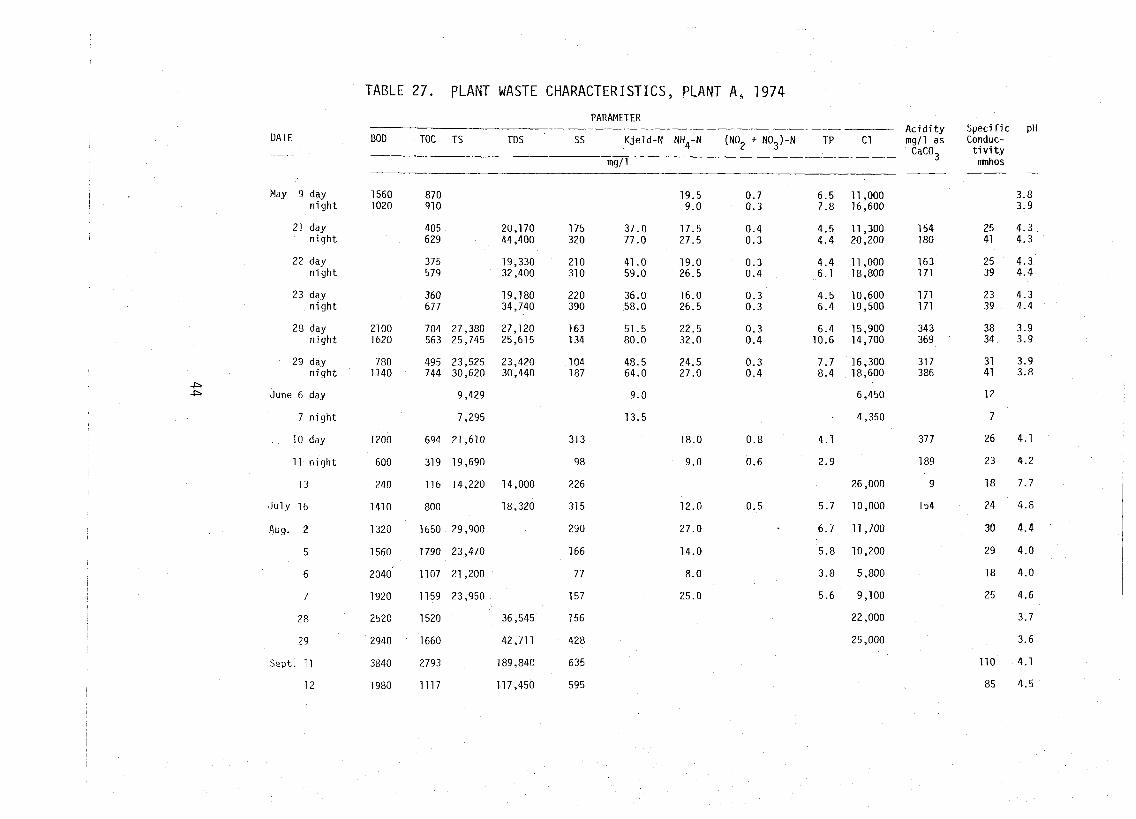
TABLE 27. PLANT WASTE CHARACTERISTICS, PLANT A, 1974
- PARAMETER
Acidi ty DATE BOD TOC TS TO S SS Kjeld-N NH4-N (NO2 + NO3)-N TP C1 mg/l a s -- -. CaC03
May 9 day 1560 870 n ight 1020 91 0
21 day n ight
22 day n ight
23 day n igh t
28 day n ight
29 day n ight
June 6 day
7 n igh t
10 day
11 n ight
13
Ju ly 16
4ug. 2
5
6
7
28
2 9
Sept . 11 3840 2793 189,840 635
12 1980 1117 117,450 595
Speci f ic pH Conduc-
t i v i t y mnhos - -
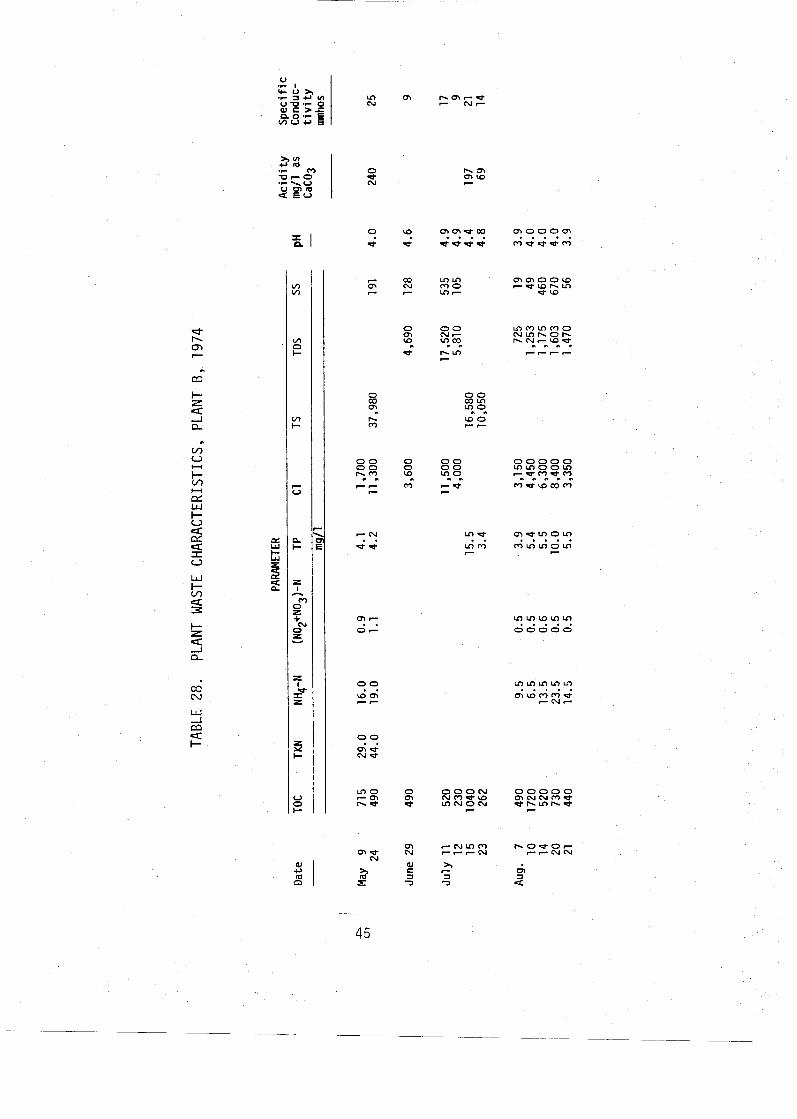
0 e N
3 e
- m -
0 w OS, h m
0 0 00 '52 7 - .-
r C U
i i
ml- . . OF-
33 w m 7 -
O ? G e Ne
m o .- m h e
m e N
3 2z
m m o o w l - b W r Z v )
e w
m m a m m d d d d d
O O O N N m e w m N O N
l-
h o b o - ,-F-NN
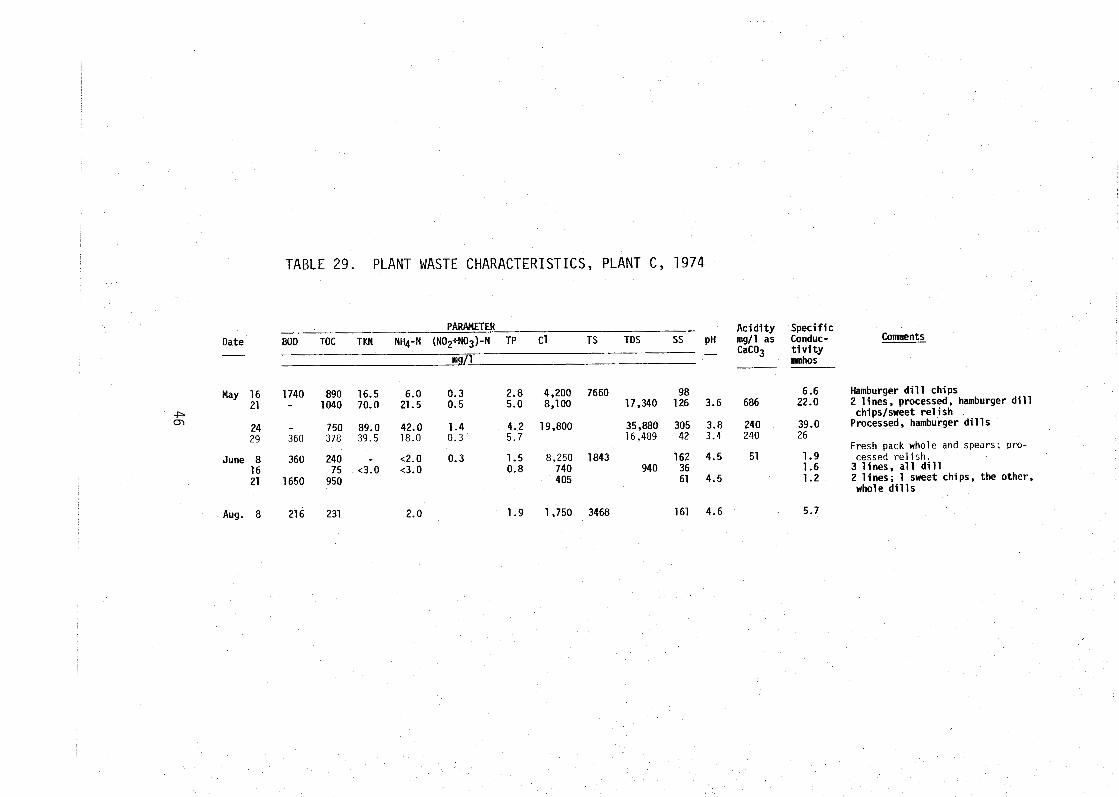
TABLE 29. PLANT WASTE CHARACTERISTICS, PLANT C, 1974
PARAMETER Ac id i t y Speci f ic BOD TOC TKN NH4-N (No2+No3)-N TP C1 TS TOS ss p~ mg/l as Conduc- Comments Date
- CaC03 ti v i t y mg/l mmhos --
May 16 1740 890 16.5 6.0 0.3 2.8 4,200 7660 98 6.6 Hamburger d i l l chips 21 - 1040 70.0 21.5 0.5 5.0 8,100 17,340 126 3.6 686 22.0 2 l ines, processed, hamburger d i l l
P chips/sweet re1 i s h m
24 - 750 89.0 42.0 1.4 4.2 19,800 35,880 305 3.8 240 39.0 Processed, hamburger d i l l s 29 360 378 39.5 18.0 0.3 5.7 16,489 42 3.4 240 26
Fresh oack whole and spears; pro-
June 8 360 240 - <2.0 0.3 1.5 8,250 1843 162 4.5 51 1.9 cessed re1 i sh. 16 75 <3.0 ~ 3 . 0 0.8 740 940 36 1.6 3 l ines, a l l d i l l 21 1650 950 405 61 4.5 1.2 2l ines; l sweetchips , theother ,
whole d i l l s
Aug. 8 216 231
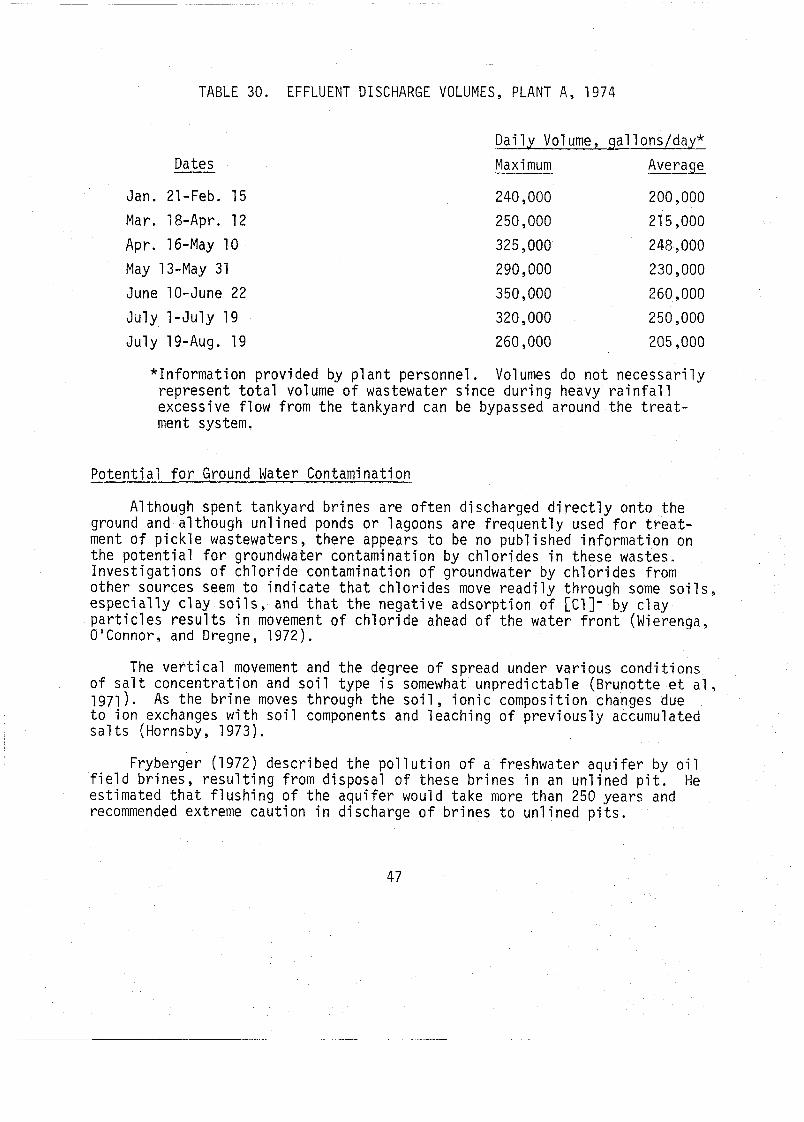
Dates
TABLE 30. EFFLUENT DISCHARGE VOLUMES, PLANT A, 1974
D a i l y Volume, ga l 1 onslday* -
Jan. 21-Feb. 15
Mar. 18-Apr. 12
Apr. 16-May 10
May 13-May 31
June 10-June 22
J u l y 1 - J u l y 19
Maximum .- Average -
J u l y 19-Aug, 19 260,000 205,000
" I n fo rma t i on p rov ided by p l a n t personnel . Volumes do n o t n e c e s s a r i l y r ep resen t t o t a l v o l ume o f wastewater s i nce d u r i n g heavy r a i n f a l l excess ive f l o w f rom t h e tankyard can be bypassed around t h e t r e a t - ment system.
P o t e n t i a l f o r Ground Water Contaminat ion
Al though spent tankyard b r i n e s a re o f t e n d ischarged d i r e c t l y on to t h e ground and a l though u n l i n e d ponds o r lagoons a r e f r e q u e n t l y used f o r t r e a t - ment of p i c k l e wastewaters, t h e r e appears t o be no pub l i shed i n f o r m a t i o n on t h e p o t e n t i a l f o r groundwater con tamina t ion by c h l o r i d e s i n these wastes. I n v e s t i g a t i o n s o f c h l o r i d e con tamina t ion o f groundwater by c h l o r i d e s f rom o t h e r sources seem t o i n d i c a t e t h a t c h l o r i d e s move r e a d i l y th rough some s o i l s , e s p e c i a l l y c l a y s o i l s , and t h a t t h e n e g a t i v e adso rp t i on o f [C1]- by c l a y p a r t i c l e s r e s u l t s i n movement o f c h l o r i d e ahead o f t h e water f r o n t (Wierenga, 0 ' Connor, and Dregne, 1972).
The v e r t i c a l movement and t h e degree o f spread under v a r i o u s c o n d i t i o n s o f s a l t concen t ra t i on and s o i l t ype i s somewhat unp red i c tab le (Bruno t te e t a1, 1971 ) . As t h e b r i n e moves th rough t h e s o i l , i o n i c compos i t ion changes due t o i o n exchanges w i t h s o i l components and l each ing o f p r e v i o u s l y accumulated s a l t s (Hornsby, 1973).
Fryberger (1972) descr ibed t h e p o l l u t i o n o f a f reshwater a q u i f e r by o i l f i e l d b r i n e s , r e s u l t i n g f rom d isposa l o f these b r i n e s i n an u n l i n e d p i t . He es t imated t h a t f l u s h i n g o f t h e a q u i f e r would t ake more than 250 years and recommended extreme c a u t i o n i n d ischarge o f b r i n e s t o u n l i n e d p i t s .
Discussion and Conclusions
In general, as expected, wastewaters from cucumber pickling operations are characterized by high chloride content, high oxygen demand, low pH, and high to ta l and suspended sol ids . Nutrient concentrations, especially Kjeld- N , are also appreciable. The 36-hour drain from small cucumbers contains about 0.6 1 b NaCl/gal and also contains appreciable organic carbon and other components leached from the cucumbers. The spent tankyard brines contain high concentrations of s a l t (1 -0-1.6 lb NaCl/gal) and also, on the average, 3400 mg/l of organic carbon, 330 mg/l of suspended so1 ids , 730 mg/l of total Kjeld-N, 90 mg/l of phosphorus, and 2300 mg/l of acidi ty (as CaCO ) . The pH f a l l s between 3 and 4. These brines have a h i g h pollutional p8tential and are much more concentrated than domestic sewage.
Desalting (processing) wastewaters are also typically of low pH and relat ively high chloride concentrations. In the f i r s t desalting water chloride levels are about 40 gm C1/1. Organic carbon levels are high and in general the more f inely divided the product, the higher the TOC as well as the Kjeld-N and phosphorus levels. Apparently, the greater the surface area exposed to the processing water, the greater the loss of soluble components and fragments of cucumber t issue.
Water requirements per unit of cucumbers handled vary widely within each unit process. Part of the variation can be attributed to leakage, overflow, or fa i lure to close valves during times when the uni t i s not in operation. The water use studies indicate that 40-90 % of the water currently used i s unnecessary. Reduction of unnecessary water use would lower the hydraulic loading on the wastewater treatment system, increasing the detention time, and would also reduce cost of water.
The potential fo r reuse of pasteurizer water in cleanup or other areas should be investigated. A1 ternatively, t o reduce 1 oading on the wastewater treatment system the possibi l i ty of discharging the re la t ive ly clean pasteurizer water to the municipal system should be investigated by plants not currently doing so.
Approximately 40-50 % of each year ' s cucumber crop i s fresh-packed rather than brined, and fresh-pack operations generally predominate during the period from May-August. However, the plant wastewater continues t o be characterized by high s a l t and organic carbon levels , since during t h i s time 50-60 % of the cucumbers are brined. Brining i s associated with intensive tankyard ac t iv i ty , including drainage of 36-hour brines from the smaller cucumbers. Sa l t spi l lage i s also most apt to occur a t th i s time. Loss of brines by overflow during rainfal l and by leakage also occurs. With perimeter drainage systems, a l l wastewaters from the tankyard area will be discharged to become a part of the overall plant wastewater. Therefore, i t i s not surprising that highsolids and chloride levels are found year-round a t plants with perimeter systems.
Because of the highly pollutional nature of tankyard brines the present widespread practices of discharging these brines untreated onto the tankyard should be questioned. In addition, the potential of chloride contamination of groundwater by tankyard runoff or by seepage from unlined wastewater treatment ponds should be investigated.
LABORATORY EVALUATION OF COAGULAT ION-PREC I P I T A T ION AND ULTRAFILTRATION FOR REGENERATION OF STORAGE BRINES
One approach t o reduc t i on o f s a l t i n p i c k l e wastewaters i s regenera- t i o n and reuse o f s a l t b r i nes w i t h i n t h e manufactur ing process. As p rev ious l y noted the re a re two major sources o f h i g h s a l t wastes: (1 ) t h e used (spent) b r i n e f rom tank ing and storage, and ( 2 ) t h e processing waters r e s u l t i n g from washing and f i r m i n g t h e s a l t s tock p r i o r t o packing. Tankyard b r i nes , which are c u r r e n t l y discharged i n t o t h e ground i n most p lan ts , are o f two s t rengths (1 ) the "36-hr d r a i n " o f -7% s a l t f rom t h e sma l l e r cucumbers, and ( 2 ) t h e s torage b r i n e o f -16% s a l t .
Coagul a t ion-Prec i p i t a t i o n
Coagul a t i o n - p r e c i p i t a t i o n as a means o f b r i n e regene ra t i on has been i n - ves t iga ted by Geisman and Henne (1973). These i n v e s t i g a t o r s , bas ing t h e i r work on e a r l i e r work by Popper e t a l . (1967), used chemical p r e c i p i t a t i o n fo l l owed by c l a r i f i c a t i o n ( f i 1 t r a t i o n ) and a c t i v a t e d carbon t reatment . Of the
chemicals tes ted , NaOH was found t o be t h e most economical and e f f e c t i v e . Br ines o f 50' and 70" salometer were t r e a t e d by adding NaOH t o a pH o f 11 .O, then f i l t e r e d through c o t t o n precoated w i t h diatomaceous ea r th . F i l t e r e f f l u e n t was passed through an a c t i v a t e d carbon bed, then n e u t r a l i z e d w i t h HC1. Geisman and Henne repo r ted COD reduc t ions o f 50-97%, b u t s ince COD da ta are n o t i nc luded i n t h e tabu la ted data, i t i s n o t poss ib le t o determine volumes used o r t he s tep i n the process respons ib le f o r t h e reduc t i on . When the pro- cess was tes ted on commercial scale, the h igh cos ts o f f i l t e r i n g and a c t i - vated carbon t reatment r e s u l t e d i n omission o f these steps. S e t t l i n g f o r 48 hr , fol lowed by removal and n e u t r a l i z a t i o n o f t he c l e a r supernatant , was sub- s t i t u ted .
P i ck les made w i t h b r i n e regenerated by t h i s method were found t o be comparable i n q u a l i t y t o those made w i t h f r e s h l y made b r i n e .
Geisman and Henne est imated t h e cos t f o r t r e a t i n g b r i nes by t h i s method a t $1450 f o r b r i n e f o r 100,000 bushels o f cucumbers. This cos t would be counterbalanced by a savings o f $3100 f o r s a l t needed f o r t h a t amount o f b r i n e .
P a l n i t k a r and McFeeters (1974) t r e a t e d spent b r i nes w i t h a1 k a l i , us ing the method of Geisman and Henne. T h e i r r e s u l t s were s i m i l a r t o those found i n our work, i ,e., l i t t l e o r no organ ic m a t e r i a l was removed and o n l y smal l amounts o f K je ldah l n i t r o g e n were removed. They fermented cucumbers ( s i z e 38) i n un t rea ted b r i ne , f resh b r i n e , base t r e a t e d b r i n e , and heat t r e a t e d b r i ne , and found t h a t t he re was no d i f f e r e n c e i n c o l o r , odor, and t e x t u r e .
Repetitive recycling experiments indicated t h a t brine could be recycled a t leas t 5 times with no ef fec t on product qual i ty , even t h o u g h there was some buildup of organics. Their work a1 so indicated a s ignif icant reduction in bloater content in pickles fermented in spent brine.
Laboratory studies conducted by Be1 1 (personal communication. 1972) indicated that coagulation-precipitation of brine with lime and N a O H a t pH 11 essent ial ly el iminated softening enzyme ac t iv i ty , e i ther by i r reversible denaturation of the enzyme or by i t s physical removal with the sludge.
Since h i g h pH coagulation-precipitation appeared to eliminate the soften- ing enzyme, laboratory studies were conducted on-site a t Plant A and a t the UNC Wastewater Research Center t o estimate amount of chemicals required for regeneration of brines by th i s method. A variety of storage brines from different s izes of cucumbers, as well as from other vegetables, was examined to determine i f the brines differed s ignif icant ly i n the i r requi rements .
A 1 i s t of tanks, contents, and dates of f i l l i n g was obtained from the yard foreman, and representative tanks were chosen for sampling, Samples were removed from a vertical sampling channel located in each tank which allows sampling a t a l l depths.
To 1-L aliquots of each brine, 0.1% (1 gm) of hydrated lime [Ca(OH)2; purified grade] was added during rapid mixing with a magnetic s t i r r e r . pH was monitored with a pH meter (Leeds and Northrup, 7400-A 2 Ser ies ) .
pH was recorded a f t e r lime addition. pH was then raised t o l l by addi- tion of 5% NaOH solution (prepared by diluting commercial NaOH solution, 50% concentration, commonly purchased by pickle plants) . After 5 min mixing during which f loc formed, the brine was transferred to a 1-L graduate cylinder and allowed to s e t t l e for 30 rnin. Then, sludge volume was noted and a portion (300 ml) of supernatant was decanted to a 500 ml beaker (Pyrex) and t i t r a t e d with acet ic acid, 6.5% (prepared by dilut ing commercial grade acet ic acid 13% concentration) t o pH 7.0. Alkali and acid requirements for different brines are indicated in Tab1 e 31 .
Samples of untreated and treated brine were analyzed for TOC, so l ids , N forms, to ta l phosphorus, and C1 . Results are shown in Table 32. As ex- pected, phosphorus content was decreased and chloride content was unaffected. No appreciable amount of organic carbon was removed, indicating that the organic carbon i s primarily i n soluble form. While a vis ible improvement in overall c l a r i t y of the brine was achieved, there was no significant change in suspended sol ids levels. Apparently there was only a qual i ta t ive d i f fe r - ence, possibly due to substi tution for some of the solids i n i t i a l l y present by a f ine l ight chemical f loc ,
The resul ts show a wide variation in buffer capacity among the various types of storage brines. Extremes generally were found in vegetables was other than cucumbers. Onion brine was especially low in buffer capacity, a n d the addition of the lime was suff ic ient t o raise pH to 11.6 and ef fec t good coagulation, Of course, l i t t l e sludge was produced. A t the other
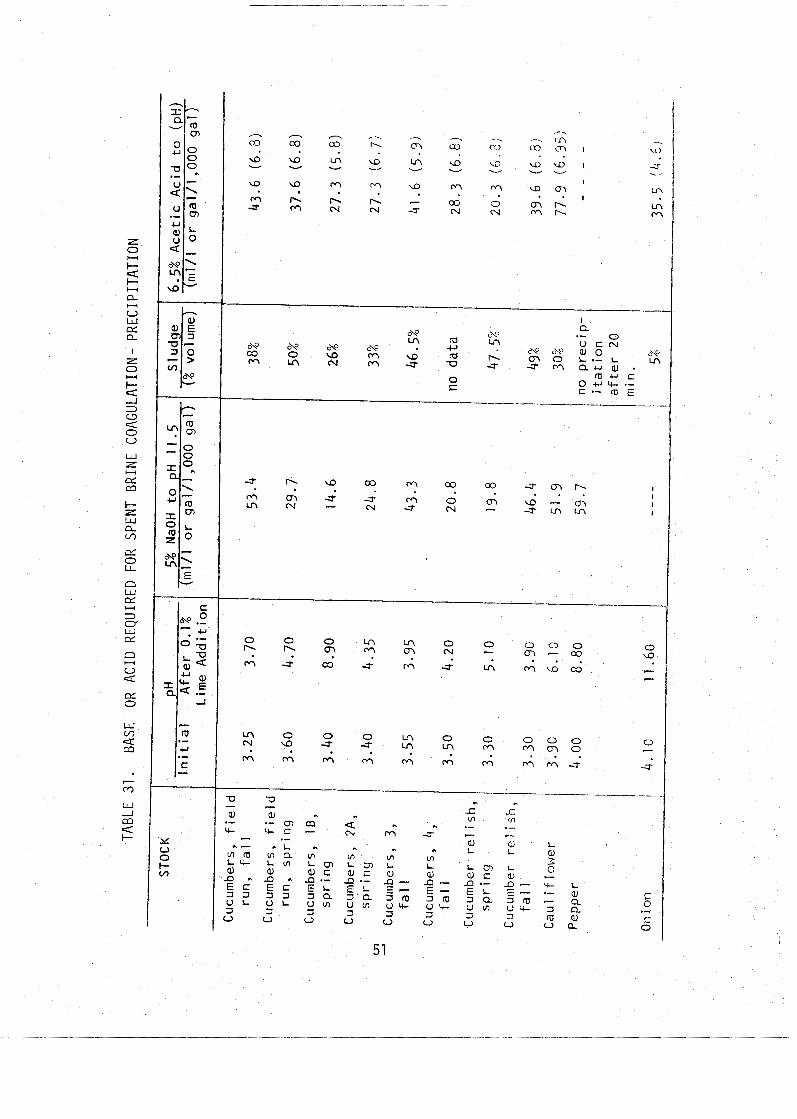
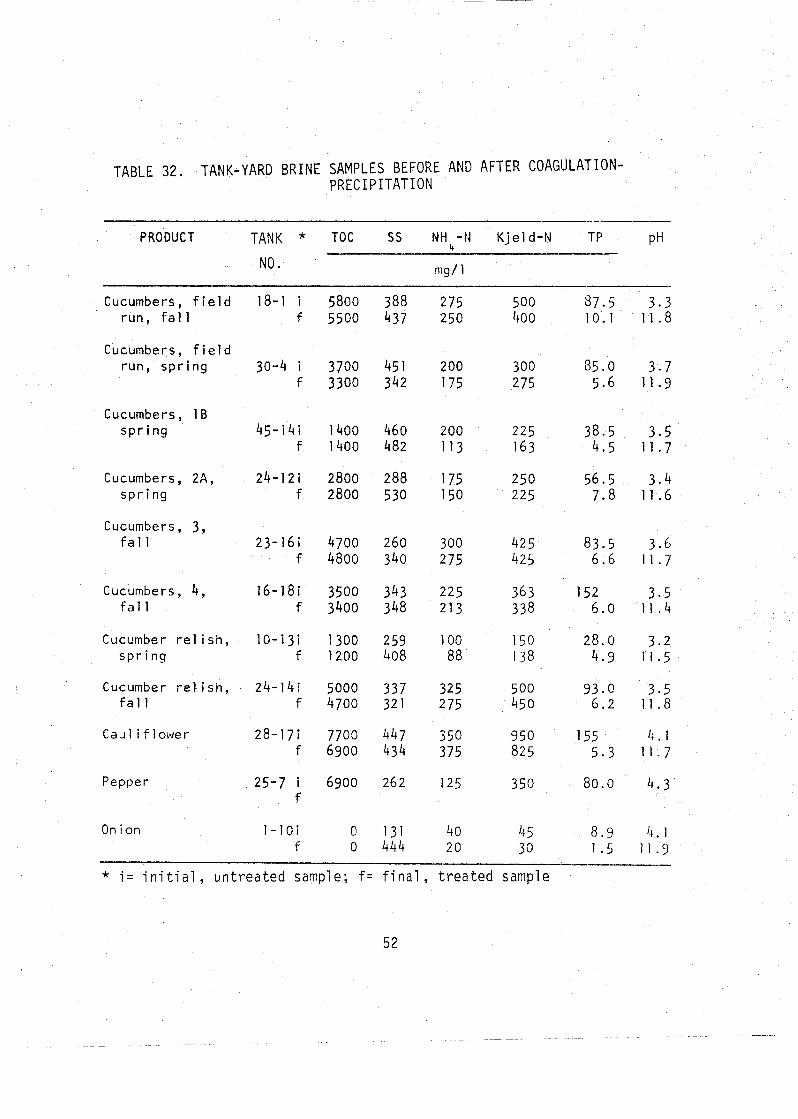
TABLE 32. TANK-YARD BRINE SAMPLES BEFORE AND AFTER COAGULATION- PRECIPITATION
PRODUCT TANK * TOC SS NH -14 K j e l d - N TP PH 4
NO. mg/ 1
Cucumbers, f i e l d 18-1 i 5800 388 275 500 57.5 3 . 3 r u n , f a 1 1 f 5500 437 250 400 10.1 11.8
Cucumbers, f i e l d run , s p r i n g 30-4 i 3700 451 200 300 85.0 3.7
f 3300 342 175 275 5.6 11.9
Cucumbers, 1B s p r i n g 45-14 i 1400 460 200 225 38.5 3.5
f 1400 482 113 163 4.5 11.7
Cucumbers, 2A, s p r i n g
Cucumbers, 3, f a 1 1
Cucumbers, 4, f a 1 1
Cucumber r e l i s h , s p r i n g
Cucumber r e l i s h , f a 1 1
C a u l i f l o w e r
Pepper
On ion 1 -10 i 0 131 40 4 5 8.9 4 .1 f 0 444 2 0 3 0 1.5 I 1 "9
* i = i n i t i a l , untreated sample; f = f i n a l , treated sample
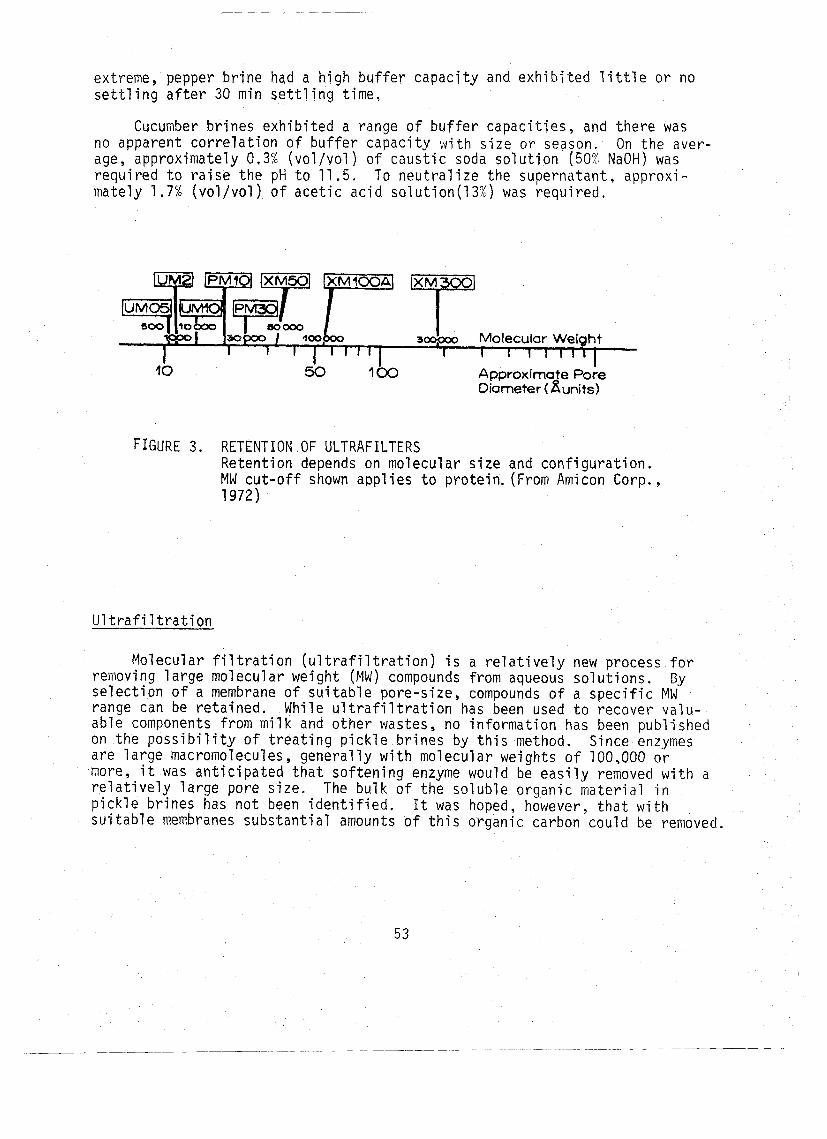
extreme, pepper brine hqd a high buffer capacity and exhibited 1 i t t l e or no s e t t l i ng a f t e r 30 min se t t l i ng time,
Cucumber brines exhibited a range of buffer capaci t ies , and there was no apparent correlation of buffer capacity with s ize or seasan. On the aver- age, approximately 0.3% (vol/vol ) of caustic soda solution (507i N a O H ) was required t o ra i se the pH t o 11.5. To neutralize the supernatant, approxi- mately 1 .7% (vol/vol ) of acetic acid solut ion(l3%) was required.
FIGURE 3. RETENTION OF ULTRAFILTERS Retention depends on molecular s ize and configuration. MW cut-off shown applies to protein. (From Amicon Corp., 1972)
Ul t r a f i 1 t ra t ion
Molecular f i l t r a t i o n ( u l t r a f i l t ra t ion) i s a relat ively new process fo r removing 1 arge molecular weight (MW) compounds from aqueous solutions. By selection of a membrane of sui table pore-size, compounds of a specif ic MW range can be retained. While u l t r a f i l t r a t ion has been used to recover valu- able components from milk and other wastes, no information has been published on the possibi l i ty of t reat ing pickle brines by th i s method. Since enzymes are large macromolecules, generally with molecular weights of 100,000 or more, i t was anticipated that softening enzyme would be easi ly removed with a re lat ively large pore s ize. The bulk of the soluble organic material i n pickle brines has n o t been ident i f ied. I t was hoped, however, that w i t h suitable membranes substantial amounts of th i s organic carbon could be removed.
A. Materials and Methods
1. Membranes
a. Type
Ami con DI af l OR ul t r a f i 1 t e r s were employed. T h j s type of f i 1 t e r consists of an anisotropic polymeric membrane on a porous substructure. Characteristics of different u l t r a f i l t e r s and microporous f i l t e r s are shown in Figure 3. For these studies the following membrane sizes were employed: X M 300, X M 100A, X M 50, PM 30, PM 10, and UM 2, The number of each type of f i l t e r indicates i t s porosity in terms of molecular weight, i . e . , X M 300 has a mean pore s ize of 300,000 M W ; XM, of 50,000 MW. As noted in Amicon l i t e ra tu re , since indicated pore s ize i s a mean value, for maximal retention a cut-off s ize well below MW of the solute to be retained i s generally chosen.
b . Membrane Preparation and Storage
Ul t ra f i l te rs of the XM ser ies are supplied ready for use. F i l te rs in the PM and U M ser ies have a glycerin film t o prevent drying out; these f i l t e r s were prepared by rinsing in d i s t i l l e d water for 1 hr with one change of water prior t o use. F i l te rs could be stored by refrigeration in 10% ethanol. In most instances, however, new f i l t e r s were used to make resu l t s more comparable.
c . Flux
During ser ial f i l t r a t i o n experiments ra te of u l t r a f i l t r a t ion was deter- mined for each of the membranes. This was done by collecting f i l t r a t e in 10 ml graduate cylinders using a stopwatch to measure time required for pro- duction of 5 ml aliquots. By use of two stopwatches, flow ra te over time could be determined.
2 . Cell
For ul t r a f i l t ra t ion studies a s t i r r ed cel l (Amicon) was employed. Cell capacity i s 50 ml of feed solution, b u t 1 arger volumes can be f i 1 tered con- tinuously by coupling a feed reservoir between the cel l and the pressurized gas tank. Magnetic s t i r r ing in the cell minimizes concentration polarization. To prevent heating of cell contents, a i r from a laboratory a i r l ine was used to cool the magnetic s t i r r e r .
3. Pretreatment of Sample
Preliminary experiments indicated tha t unless gross suspended solids were removed from the feed, u l t r a f i l t r a t ion rates were extremely slow. Therefore, feed samples were pretreated by vacuum f i l t r a t i o n through a membrane f i 1 t e r (5.0 urn pore s ize , Metricel GA-1, Gelman).
4. Temperature
All f i l t r a t i ~ n s were performed i n a constant temperature room maintained a t 21 C . Samples stored by refrigeration were allowed t o reach room tempera- ture before f i l t r a t i o n .
5. Pressure Lf 5
Pressure for the cell was provided with pressurized nitrogen gas and regulated by the pressure valve on the tank. A pressure of 30 psi was used for XM 300, XM I O O A , and XM 50 membranes; 60 ps i , for smaller pore-sized membranes.
6 . Experimental Approach
Experiments involved two approaches t o ul t r a f i 1 t r a t i on: para1 1 el and se r i a l . In the former, the feed sample was subdivided into identical aliquots, each of which was passed through a different s ize of f i l t e r . In the l a t t e r , the feed was passed through a large-pore f i l t e r , the f i l t r a t e serving as feed fo r the next f iner f i l t e r , and so on. In the second proce- dure i t was d i f f i c u l t to f i l t e r enough through the i n i t i a l membranes to provide suf f ic ien t volume for feed and analyses throughout the f i l t e r ser ies .
7 . Analytical Procedures
Pickle brine samples present d i f f i cu l t i e s in analysis due to corrosive- ness and to interference of C1 in many analytical procedures. In many cases analytical methods required modification t o compensate for these character is t ics .
a. Chloride
Chloride concentrations were measured chemically or electrometrically. In earl i e r work and in a1 1 of the coagulation-precipi ta t ion and ul t r a f i 1 t r a - tion studies C1 was determined using the high concentration modification o f the mercuric n i t r a t e method (s tandard Methods, 1971 ) . Even w i t h t h i s modification, the high sa l in i ty of spent brines required considerable ( x 50) di 1 ution of samples.
b . COD
Chemical oxygen demand ( C O D ) was measured using the procedure recorn-, mended for wastewaters (standard Methods, 1971, ) . To compensate for C1 interference, mercuric su l fa te was added in the proportions indicated.
c . TOC
Total organic carbon ( T O C ) analysis generally offers a rapid means of measuring organic carbon in wastewater. However, problems were encountered with brine samples due t o the i r high C 1 content. With the instrument available (Model 915 TOC Analyzer, Beckman Instruments), brine caused
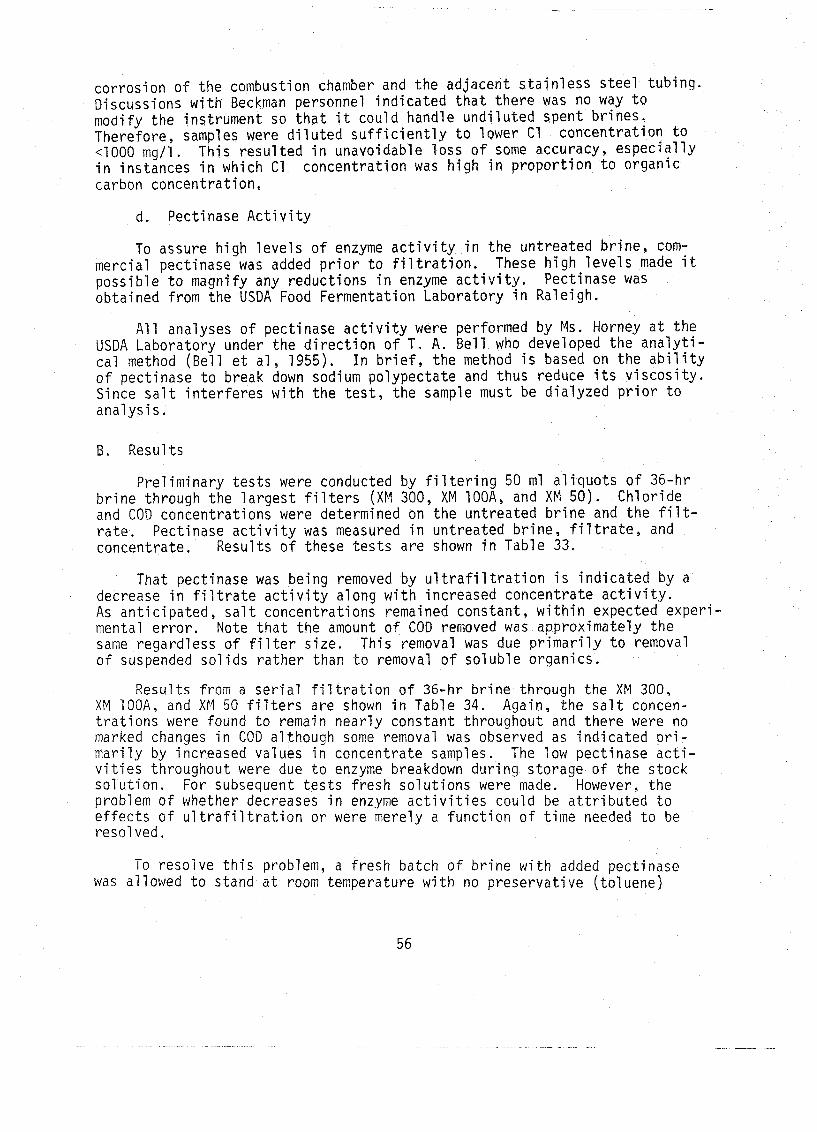
c o r r o s i o n o f t h e combustion chamber and t h e ad jacen t s t a i n l e s s s t e e l t ub ing . Discuss ions w i t h Beckman personnel i n d i c a t e d t h a t t h e r e was no way t a modify t he i ns t rumen t so t h a t i t cou ld handle u n d i l u t e d spen t b r i n e s . Therefore, samples were d i l u t e d s u f f i c i e n t l y t o lower C1 concen t ra t i on t o -4000 mg/ l . T h i s r e s u l t e d i n unavoidable l o s s o f some accuracy, e s p e c i a l l y i n ins tances i n which C1 concen t ra t i on was h i g h i n p r o p o r t i o n t o o rgan i c carbon concent ra t ion .
d. Pect inase A c t i v i t y
To assure h i g h l e v e l s o f enzyme a c t i v i t y i n t h e un t rea ted b r i n e , com- merc ia l pec t inase was added p r i o r t o f i l t r a t i o n . These h i g h l e v e l s made i t p o s s i b l e t o magni fy any reduc t i ons i n enzyme a c t i v i t y . Pect inase was ob ta ined f rom the USDA Food Fermentat ion Labora to ry i n Rale igh.
A l l analyses o f pec t inase a c t i v i t y were performed by Ms. Horney a t t h e USDA Labora to ry under t h e d i r e c t i o n o f T. A. B e l l who developed t h e a n a l y t i - c a l method (Be1 1 e t a1 , 1955). I n b r i e f , t h e method i s based on t h e a b i l i t y o f pec t inase t o break down sodium po l ypec ta te and thus reduce i t s v i s c o s i t y . Since s a l t i n t e r f e r e s w i t h t h e t e s t , t h e sample must be d i a l y z e d p r i o r t o a n a l y s i s .
B. Resu l ts
P r e l i m i n a r y t e s t s were conducted by f i l t e r i n g 50 ml a l i q u o t s o f 36-hr b r i n e through t h e l a r g e s t f i l t e r s (XM 300, XM 100A, and XM 50) . C h l o r i d e and COD concen t ra t ions were determined on t h e un t rea ted b r i n e and t h e f i l t- r a t e . Pect inase a c t i v i t y was measured i n un t rea ted b r i n e , f i l t r a t e , and concent ra te . Resu l ts o f these t e s t s a re shown i n Table 33,
That pec t inase was be ing removed by u l t r a f i l t r a t i o n i s i n d i c a t e d by a decrease i n f i l t r a t e a c t i v i t y a long w i t h inc reased concent ra te a c t i v i t y . As a n t i c i p a t e d , s a l t concen t ra t ions remained cons tan t , w i t h i n expected e x p e r i - mental e r r o r . Note t h a t t h e amount of COD removed was approx imate ly t h e same rega rd less o f f i l t e r s i z e . Th is removal was due p r i m a r i l y t o removal o f suspended s o l i d s r a t h e r than t o removal o f s o l u b l e o rgan ics .
Resu l ts f rom a s e r i a l f i l t r a t i o n o f 36-hr b r i n e th rough t h e XM 300, XM 100A, and XM 50 f i l t e r s a re shown i n Table 34. Again, t h e s a l t concen- t r a t i o n s were found t o remain n e a r l y cons tan t th roughout and t h e r e were no marked changes i n COD a l though some removal was observed as i n d i c a t e d p r i - m a r i l y by increased va lues i n concen t ra te samples. The low pec t inase a c t i - v i t i e s th roughout were due t o enzyme breakdown d u r i n g s to rage o f t h e s tock s o l u t i o n . For subsequent t e s t s f r e s h s o l u t i o n s were made. However, t h e problem o f whether decreases i n enzyme a c t i v i t i e s cou ld be a t t r i b u t e d t o e f fec ts o f u l t r a f i l t r a t i o n o r were mere ly a f u n c t i o n o f t i m e needed t o be r e s o l ved.
To r e s o l v e t h i s problem, a f r e s h ba tch o f b r i n e w i t h added pec t inase was a l lowed t o s tand a t room temperature w i t h no p r e s e r v a t i v e ( t o l uene )
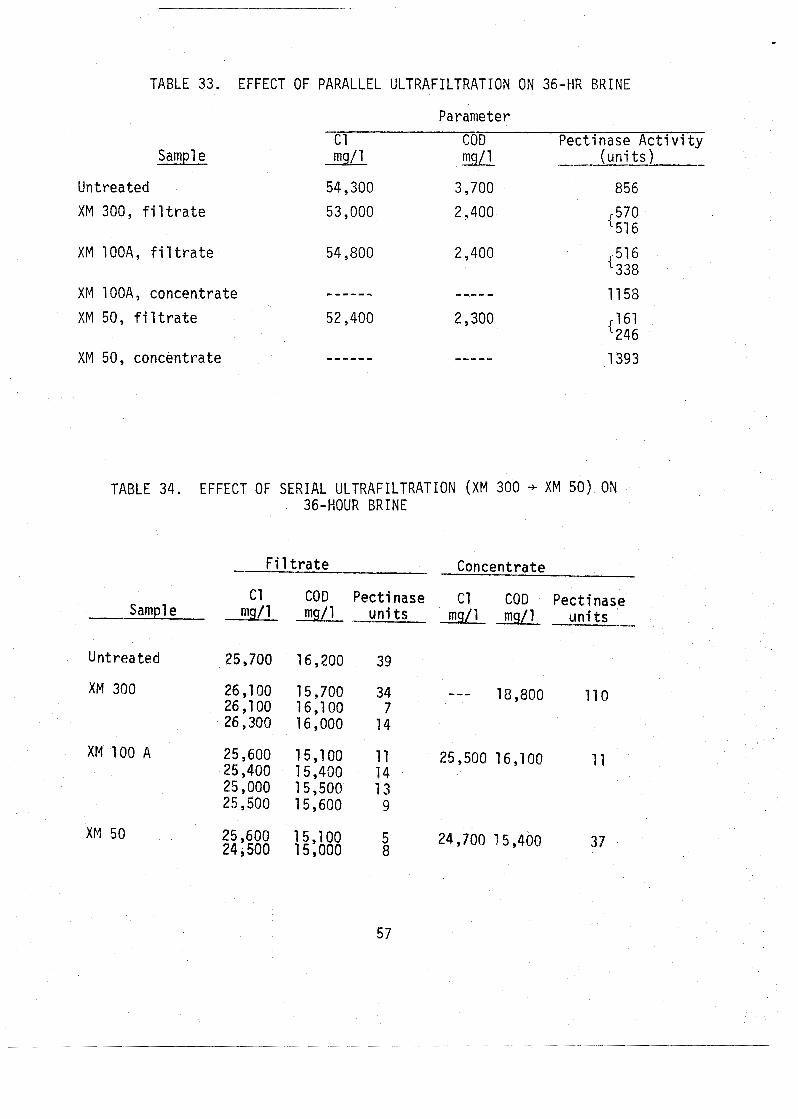
TABLE 33. EFFECT OF PARALLEL ULTRAFILTRATION ON 36-HR BRINE
Parameter
Sarnpl e
Untreated
XM 300, f i l t r a t e
XM 100Ay f i l t r a t e
XM 100A, concentrate
XM 50, f i l t r a t e
XM 50, concentrate
C 1 COD Pectinase Activity m_g/ 1 WL (uni ts ) -
TABLE 34. EFFECT OF SERIAL ULTRAFILTRATION (XM 300 -+ XM 50) ON 36-HOUR BRINE
- Fi 1 t r a t e Concentrate
C1 COD Pectinase C1 COD Pectinase Sarnpl e 1 mg/l - units mg/l mg/1 units -
Untreated
XM 300
XM 100 A
XM 50
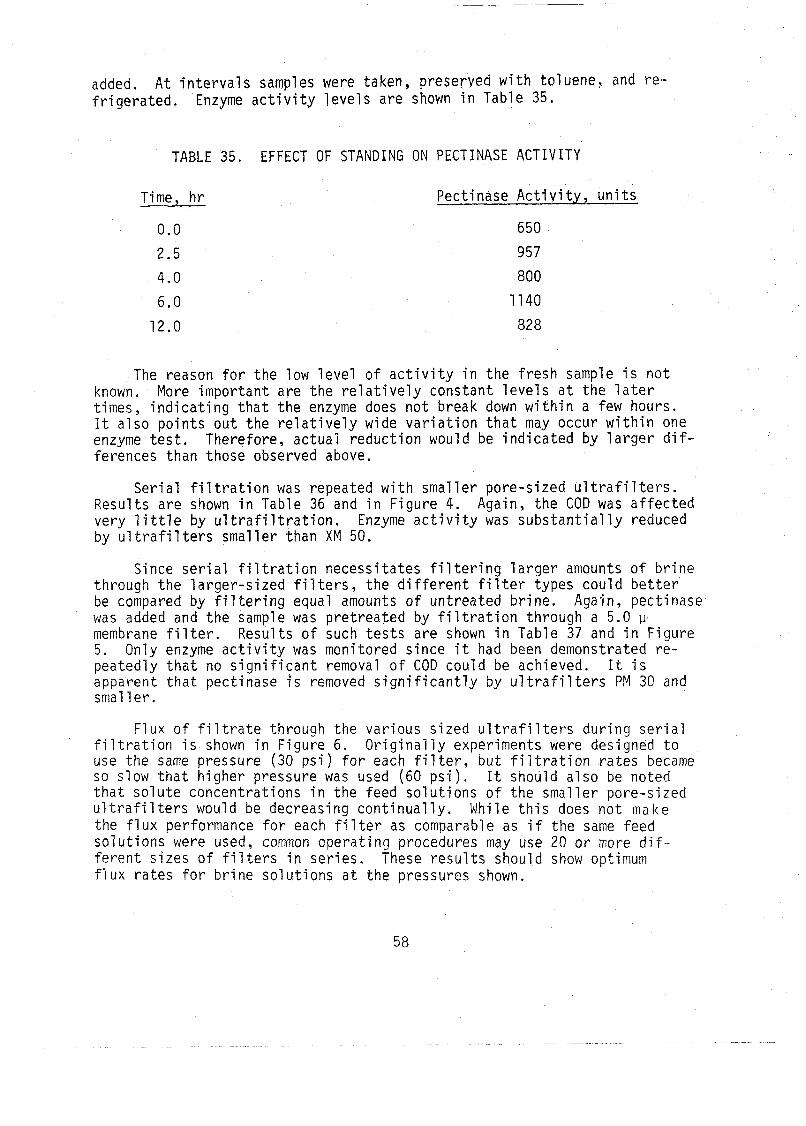
added. A t intervals samples were taken, preseryed with toluene, and re- frigerated. Enzyme ac t iv i ty levels are shown in Table 35.
TABLE 35, EFFECT OF STANDING ON PECTINASE ACTIVITY
Time, hr -
0.0 2 .5
4,O 6.0
12.0
Pectinase Activity, units
650 957 800
1140
828
The reason for the low level of ac t iv i ty in the fresh sample i s not known . More important are the relat ively constant levels a t the l a t e r times, indicating that the enzyme does not break down within a few hours. I t also points o u t the relat ively wide variation that may occur within one enzyme t e s t . Therefore, actual reduction would be indicated by larger d i f - ferences than those observed above.
Serial f i l t r a t i o n was repeated with smaller pore-sized u l t r a f i l t e r s . Results are shown in Table 36 and in Figure 4 . Again, the COD was affected very l i t t l e by u l t r a f i l t r a t ion . Enzyme ac t iv i ty was substant ial ly reduced by ul t r a f i 1 t e r s smaller than XM 50.
Since ser ial f i 1 t ra t ion necessitates f i l t e r ing larger amounts of brine through the larger-sized f i1 t e r s , the different f i l t e r types could bet ter be compared by f i l t e r ing equal amounts of untreated brine. Again, pectinase was added and the sample was pretreated by f i l t r a t i o n through a 5 .0 LI membrane f i l t e r . Results of such t e s t s are shown in Table 37 and in Figure 5 . Only enzyme ac t iv i ty was monitored since i t had been demonstrated re- peatediy that no significant removal of COD could be achieved. I t i s apparent t h a t pectinase i s removed s ignif icant ly by u l t r a f i l t e r s PM 30 and small e r .
F l u x of f i l t r a t e through the various sized u l t r a f i l t e r s during ser ia l f i l t r a t i o n i s shown in Figure 6. Originally experiments were designed t o use the same pressure (30 psi) for each f i l t e r , b u t f i l t r a t i o n rates became so slow that higher pressure was used (60 p s i ) . I t should also be noted that solute concentrations in the feed solutions of the smaller pore-sized u l t r a f i l t e r s would be decreasing continually. While th i s does not make the flux performance for each f i l t e r as comparable as i f the same feed solutions were used, common operating procedures may use 20 or more d i f - ferent sizes of f i l t e r s in ser ies . These resul ts should show optimum flux rates for brine solutions a t the pressures shown.
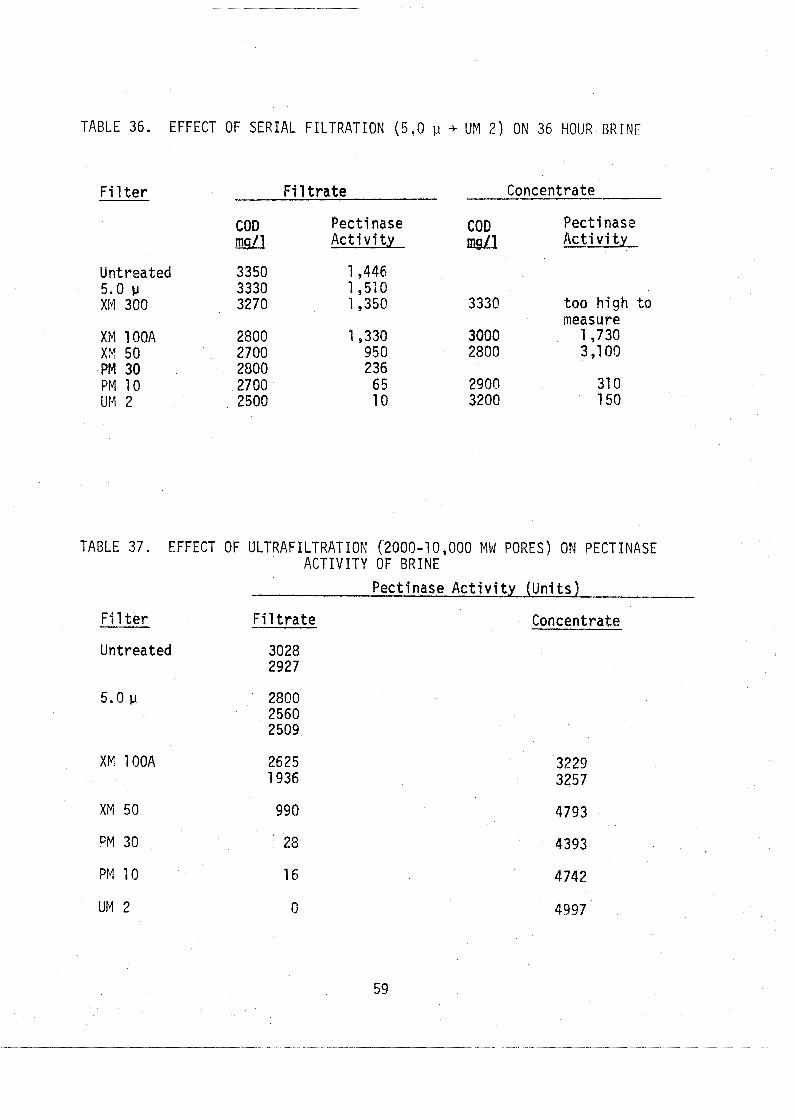
TABLE 36.
F i 1 t e r
Untreated 5.0 p XM 300
EFFECT OF SERIAL FILTRATION (5.0 p -+ UM 2 ) ON 36 HOUR BRINE
XM l O O A XM 50 PM 30 PM 10 UM 2
F i 1 trate
COD Pec t i nase ElA A c t i v i t y
Concentrate --
COD Pec t i nase JW..u A c t i v i t y
3330 t o o h igh t o measure
3000 1,730 2800 3 , I 00
TABLE 37. EFFECT OF ULTRAFILTRATION (2000-10,ooo MW PORES) ON PECTINASE ACTIVITY OF BRINE
Pect inase A c t i v i s y ( U n i t s )
F i 1 t e r F i l t r a t e - Concentrate- - Untreated 3028
2927
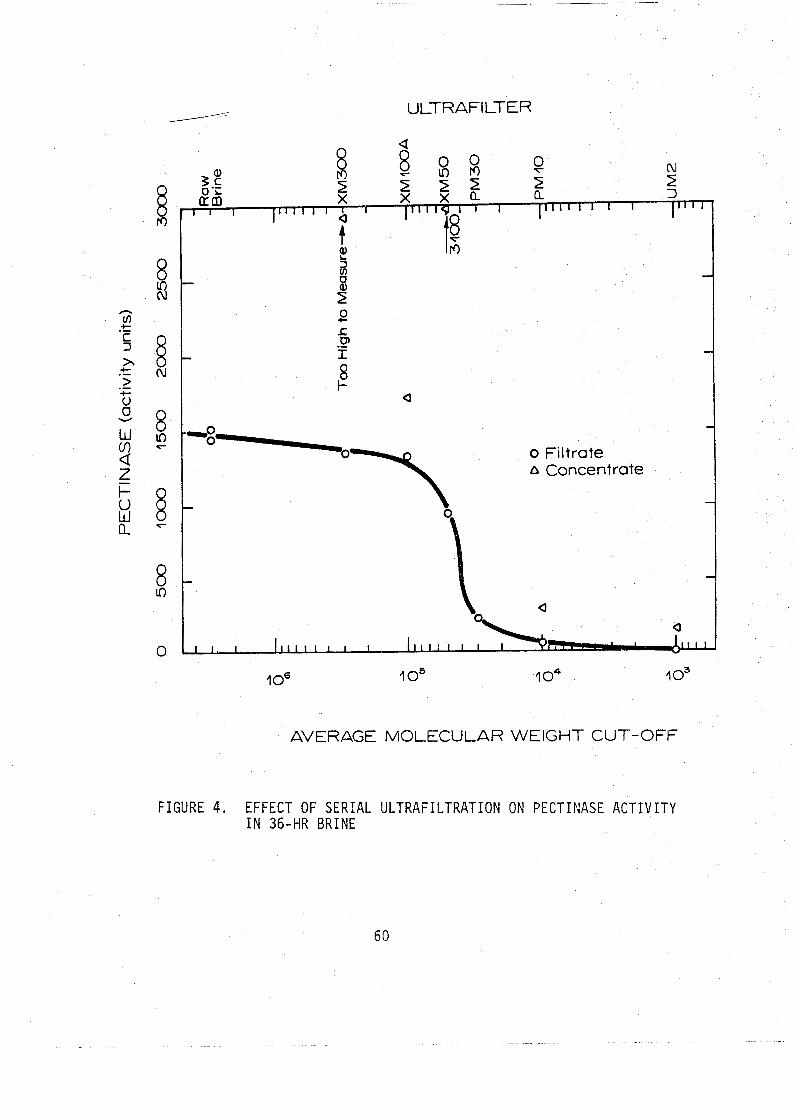
o Filtrate a Concentrate
AVERAGE MOLECULAR WEIGHT CUT-OFF
FIGURE 4. EFFECT OF SERIAL ULTRAFILTRATION ON PECTINASE ACTIVITY IN 36-HR BRINE
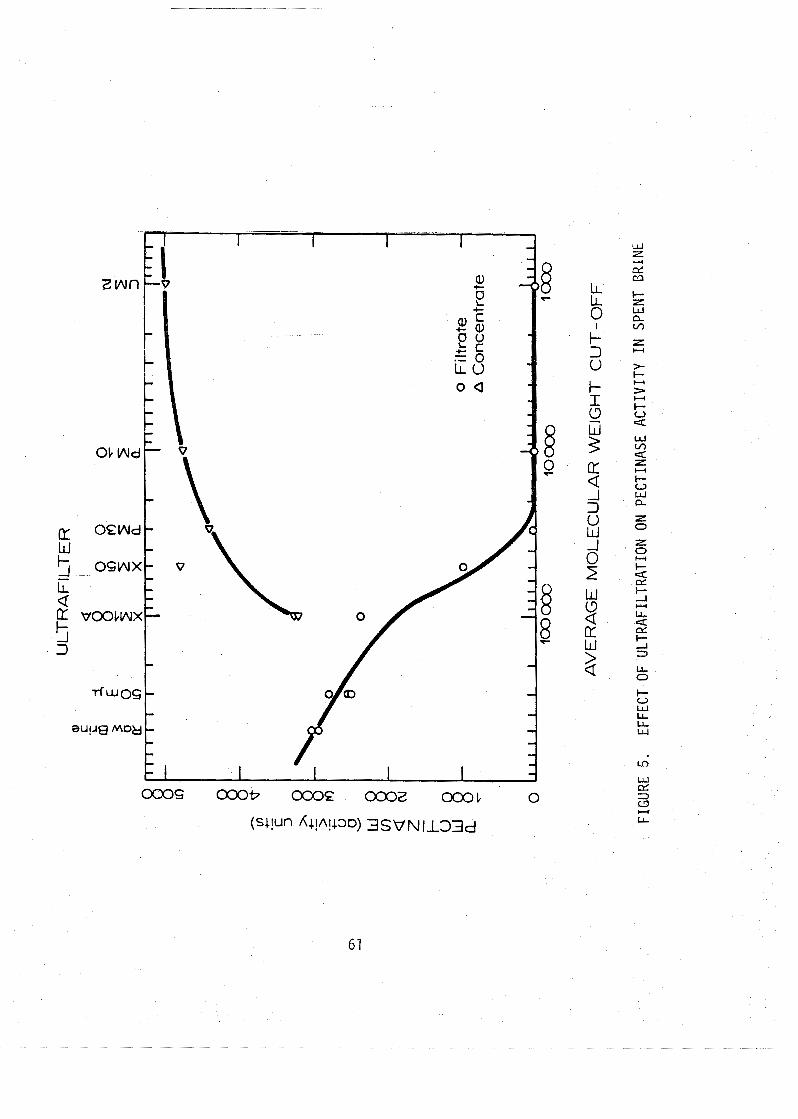
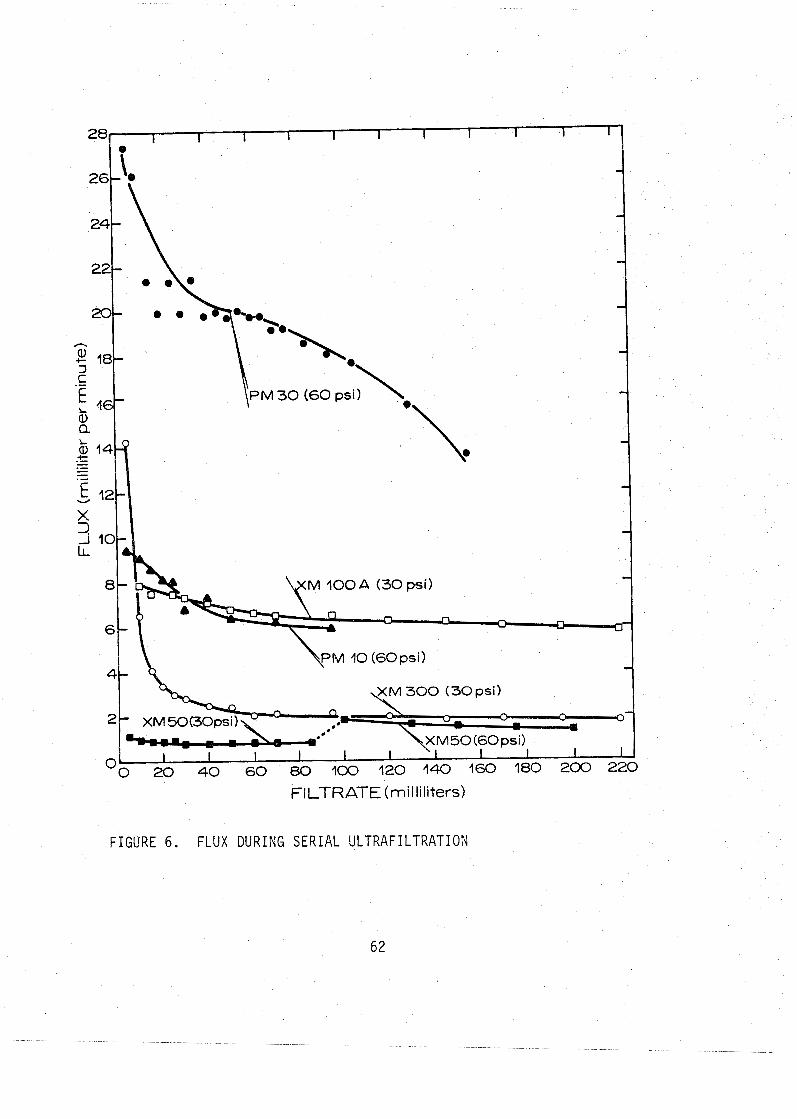
FIGURE 6. FLUX DURING SERIAL ULTRAFILTRATION
Discussion qnd Conclusions - --
Previous studies by Be1 1 had shown tha t coagulati~n-precipi ta t ion i s an effect ive means of removing pectinase ac t iv i ty from spent brines, Ultra- f i l t r a t i o n resu l t s from th i s study show that i t too i s an effect ive means of removing pectinase act ivi ty . Neither treatment substantially reduces the COD of the brine,
Further comparison of the two methods should be made in terms of economics. Economic considerations were foremost in Gei sman ! s (1 973) re- commendation of coagulation-precipitation over other methods of brine re- generation. Inflation and fuel shortages of the past few years have rend- ered cost estimates made in previous studies outdated. While the scope of th i s study does not allow detailed cost comparisons, factors to be considered for both types of treatment can be discussed.
Treatment by coagul ation-precipi tation requires large quantit ies of I caustic soda and glacial acetic acid, both of which have become more ex-
pensive and a t some times unavailable immediately upon request. Chemical costs depend on quantit ies purchased and are cheapest by tank loads of 20-23 tons. Prices given by local chemical supply companies range from $145-160 per ton for caustic soda; for ace t ic acid, from $300-340 per ton. In both cases, costs were based on tank load purchases, Cost of storage would have to be compared with increased purchase costs for lower volumes per order, Freight and handling would also require consideration.
Costs of actual treatment (assuming batch type reactors) would include a mixing chamber and se t t l i ng tank, pH monitoring equipment, and chemical feed equipment, The large quantit ies of sludge generated would require additional handling; possibly the sludge could be discharged into the aerated lagoon wastewater treatment system currently used a t most plants.
Ul t r a f i l t ra t ion eliminates the expense of chemical purchase, trans- port , and storage, and also does not present the occupational hazards associated with hand1 ing strong acids and caustics. However, the i n i t i a l costs of u l t r a f i l t r a t ion units are high, as are the costs of replacing membrane components when they become damaged or become fouled beyond regen- eration. Most waste treatment operations u t i l iz ing u l t r a f i l t r a t i o n use t h i n channel or hollow f iber systems rather than plate-type membranes. These systems are reportedly more ef f ic ien t and present less problems with clog- g i n g . Power costs are associated with u l t r a f i l t r a t ion since a pressure gradient must be maintained across the membrane. The pressure t o be main- tained depends on the flux desired and on the membrane surface area. Often i t i s more economical to increase surface area than to increase pressure, b u t th i s would have to be studied to determine the optimum area and pressure for the optimum membrane pore s ize. From the resul ts of th i s study, PM 10 s ize membranes appear t o be the largest feasible.
Both types of brine treatment require storage f a c i l i t i e s for spent brine a f t e r removal from brining vats prior to treatment, as well as s tor- age of treated brine until reuse.
The question ar ises as t o how well treated brine can be stored before reuse, Since COD remains high in the treated brines, unless the brines are stored aseptically there i s a 1i keli hood of bacterial or fungal growth and the possibi l i ty of causing off-flavors in cucumbers brined in the re- generated brine, Some companies have been reusing heat-treated brines and they report no deterioration in quality of product, b u t the possible build- u p of small molecular weight organics over a period of years cannot be dismissed. If spent brine were stored and then treated before reuse, excessive microbial growth might cause problems in sanitation. On the other hand, if stored a f t e r treatment some microbial growth m i g h t necessitate re- treatment before reuse. One plant s tores a l l s a l t as 100% saturated brine and uses no dry s a l t . Treated brine i s recycled into the 100' salometer holding tank and t h i s high s a l t concentration evidently prevents any pro- blems of microbial growth.
Recycling o f brines does seem feasible for cucumber pickling opera- t ions. From the point of view of t h i s study, u l t r a f i l t r a t ion appears more favorable as i t i s simpler in terms of handling and personnel required, b u t i t would be necessary for each plant to determine the most cost-effective method based on i t s own si tuat ion.
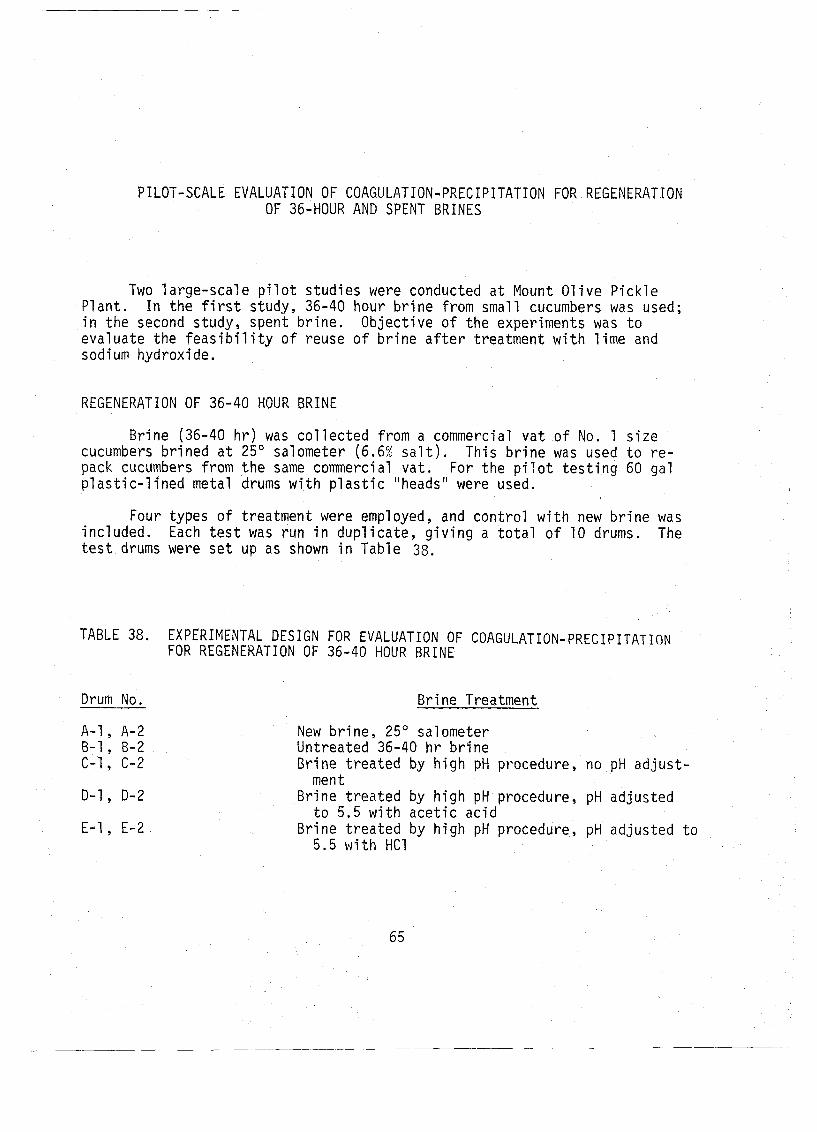
PILOT-SCALE EVALUATION OF COAGULATION-PRECIPITATION FOR REGENERATION OF 36-HOUR AND SPENT BRINES
Two large-scale pi lot studies were conducted a t Mount Olive Pickle Plant. In the f i r s t study, 36-40 hour brine from small cucumbers was used; in the second study, spent brine. Objective of the experiments was t o evaluate the f eas ib i l i t y of reuse of brine a f t e r treatment with lime and sodium hydroxide.
REGENERATION OF 36-40 HOUR BRINE
Brine (36-40 hr) was collected from a commercial vat of No. 1 s ize cucumbers brined a t 25' salometer (6.6% s a l t ) . This brine was used to re- pack cucumbers from the same commercial vat. For the p i lo t tes t ing 60 gal plastic-lined metal drums with plast ic "heads" were used.
Four types of treatment were employed, and control with new brine was included. Each t e s t was run in duplicate, giving a total of 10 drums. The t e s t drums were s e t up as shown in Table 38.
TABLE 38. EXPERIMENTAL DESIGN FOR EVALUATION OF COAGULATION-PRECIPITATION FOR REGENERATION OF 36-40 HOUR BRINE
Drum No. Brine Treatment
A-1, A - 2 New brine, 25' salometer B-1, 8-2 Untreated 36-40 hr brine 6-1, C-2 Brine treated by high pH procedure, no pH adjust-
ment D-l , D-2 Brine treated by high pH procedure, pH adjusted
to 5 .5 with acet ic acid E - 1 , E-2 Brine treated by high pH procedure, pH adjusted t o
5.5 with HC1
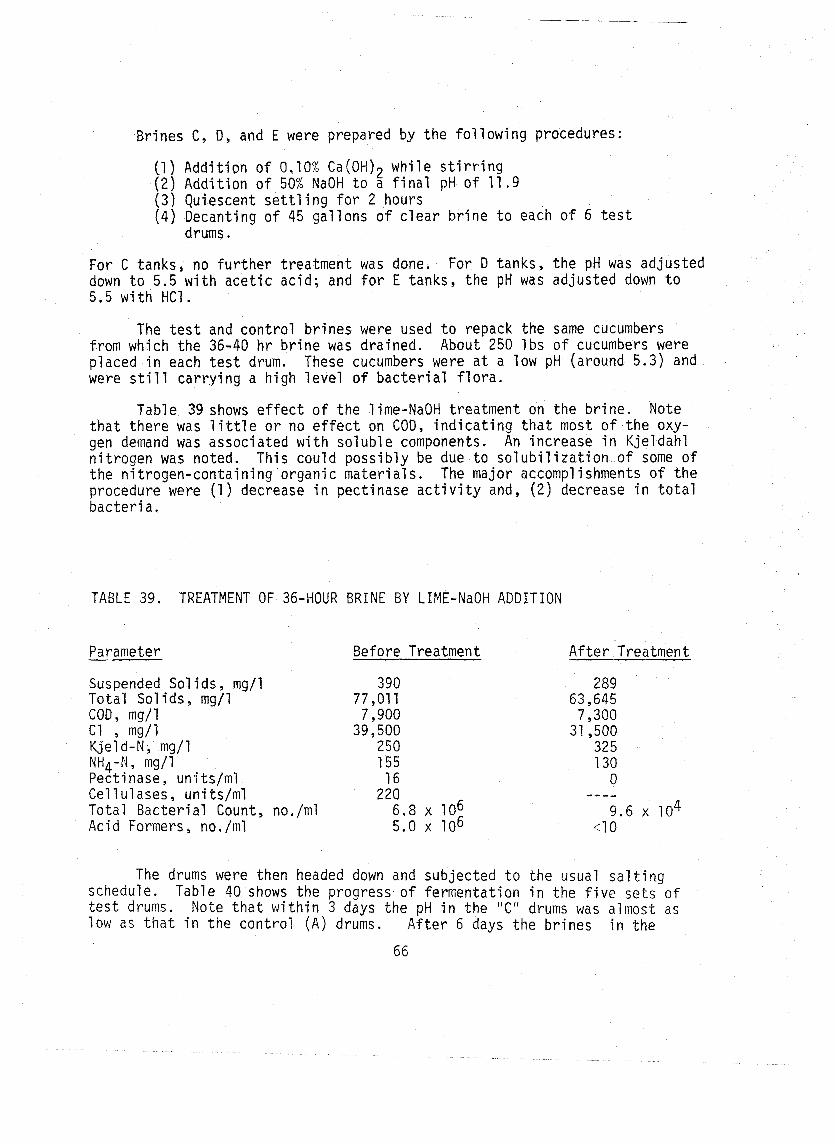
Br ines C, D, and E were prepared by t h e f o l l o w i n g procedures:
(1) Add i t i on of 0.10% Ca(OH)? w h i l e s t i r r i n g (2 ) Add i t i on of 50% NaOH t o a f i n a l pH o f 11.9 (3 ) Quiescent s e t t l i n g f o r 2 hours (4) Decanting o f 45 ga l l ons o f c l e a r b r i n e t o each o f 6 t e s t
drums.
For C tanks, no f u r t h e r t reatment was done. For D tanks, t h e pH was ad jus ted down t o 5.5 w i t h a c e t i c ac id ; and f o r E tanks, t he pH was ad jus ted down t o 5.5 w i t h HC1.
The t e s t and c o n t r o l b r i n e s were used t o repack the same cucumbers from which the 36-40 h r b r i n e was dra ined. About 250 I b s o f cucumbers were p laced i n each t e s t drum. These cucumbers were a t a low pH (around 5.3) and were s t i l l c a r r y i n g a h igh l e v e l o f b a c t e r i a l f l o r a .
Table 39 shows e f f e c t o f t he lime-NaOH t reatment on the b r i n e . Note t h a t t he re was l i t t l e o r no e f f e c t on COD, i n d i c a t i n g t h a t most o f t h e oxy- gen demand was associated w i t h so lub le components. An inc rease i n K je ldah l n i t r o g e n was noted. This cou ld p o s s i b l y be due t o s o l u b i l i z a t i o n o f some o f t h e n i t r ogen -con ta in ing organic ma te r i a l s . The major accomplishments o f t h e procedure were (1 ) decrease i n pect inase a c t i v i t y and, (2 ) decrease i n t o t a l bac te r i a .
TABLE 39. TREATMENT OF 36-HOUR BRINE BY LIME-NaOH ADDITION
Parameter
Suspended So l ids , mg/1 To ta l So l ids , mg/l COD, mg/l C l 3 mg/1 Kjeld-N, mg/l NH4-N, mg/l Pectinase, un i ts /ml C e l l u l ases , un i ts/ml To ta l B a c t e r i a l Count, no./ml Ac i d Formers, no, /m1
Before Treatment A f t e r Treatmen t
289 63,645
7,300
The drums were then headed down and subjected t o t he usual s a l t i n g schedule. Table 40 shows t h e progress o f fe rmenta t ion i n t he f i v e s e t s o f t e s t drums. Note t h a t w i t h i n 3 days t h e pH i n t h e " C " drums was almost as low as t h a t i n t h e c o n t r o l (A) drums. A f t e r 6 days t h e b r i n e s i n t he
6 6
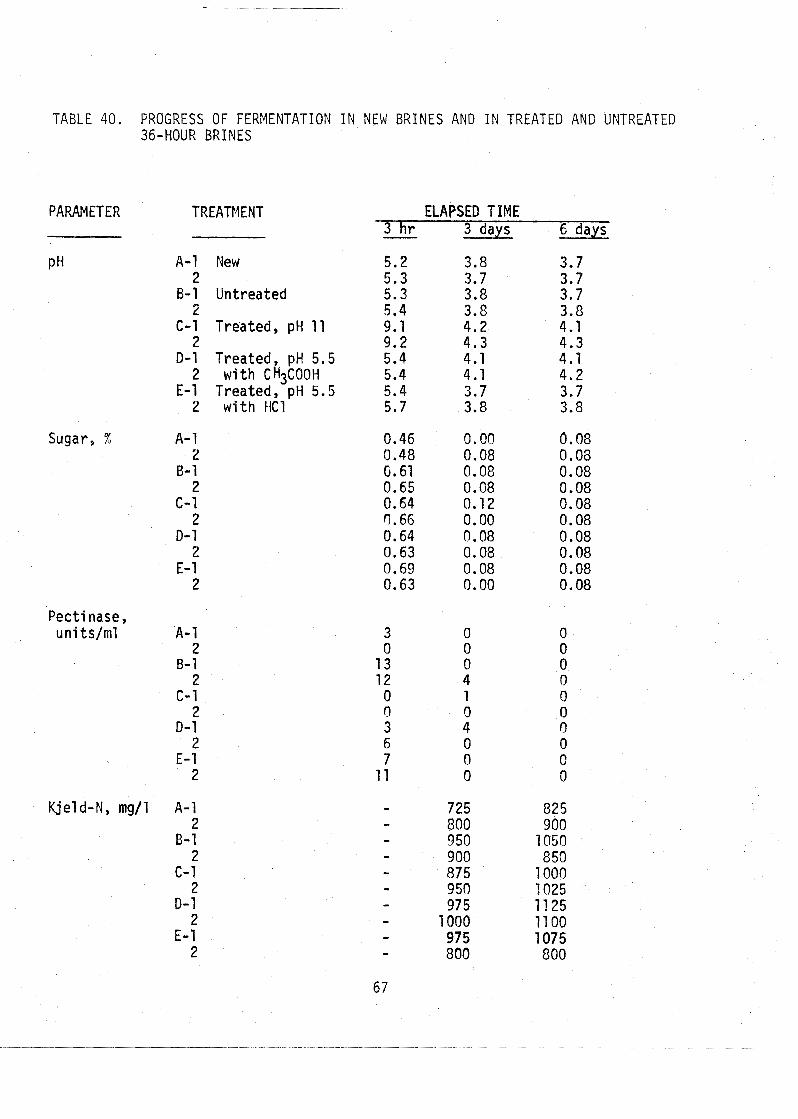
TABLE 4 0 .
PARAMETER
Sugar, "/,
Pectinase, uni ts lml
PROGRESS OF FERMENTATION I N NEW BRINES AND I N TREATED AND UNTREATED 36-HOUR BRINES
TREATMENT
A-1 New 2
B-1 Untreated 2
C-1 Treated, pH 11 2
D-1 Treated, pH 5 . 5 2 wi th CH3COOH
E-1 Treated, pH 5 . 5 2 wi th tlC1
ELAPSED TIME 3 h r 3 days G days
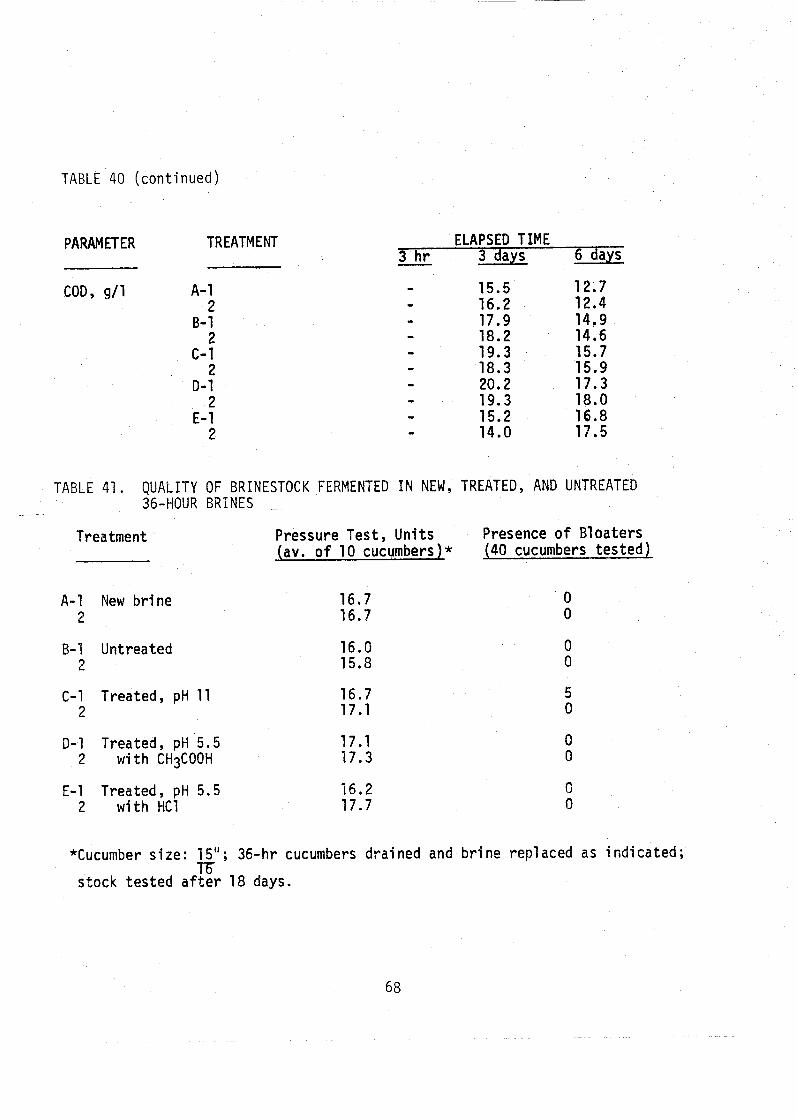
TABLE 40 (cont inued)
PARAMETER TREATMENT
COD, 911
ELAPSED TIME 3 h r - 3 days 6 days
TABLE 41. QUALITY OF BRINESTOCK FERMENTED I N NEW, TREATED, AND UNTREATED 36-HOUR BRINES .
Treatment
A-1 New b r i n e 2
B- l Untreated 2
C - l Treated, pH 11 2
D-1 Treated, pH 5.5 2 w i t h CH3COOH
Pressure Test , U n i t s (av. o f 10 cucumbers)*
E-1 Treated, pH 5.5 16.2 2 w i t h HC1 17.7
Presence o f B l o a t e r s (40 cucumbers t e s t e d )
*Cucumber s i z e : 15" ; 36-hr cucumbers d ra ined and b r i n e rep1 aced as i n d i c a t e d ; l-6
s tock t e s t e d a f t e r 18 days.
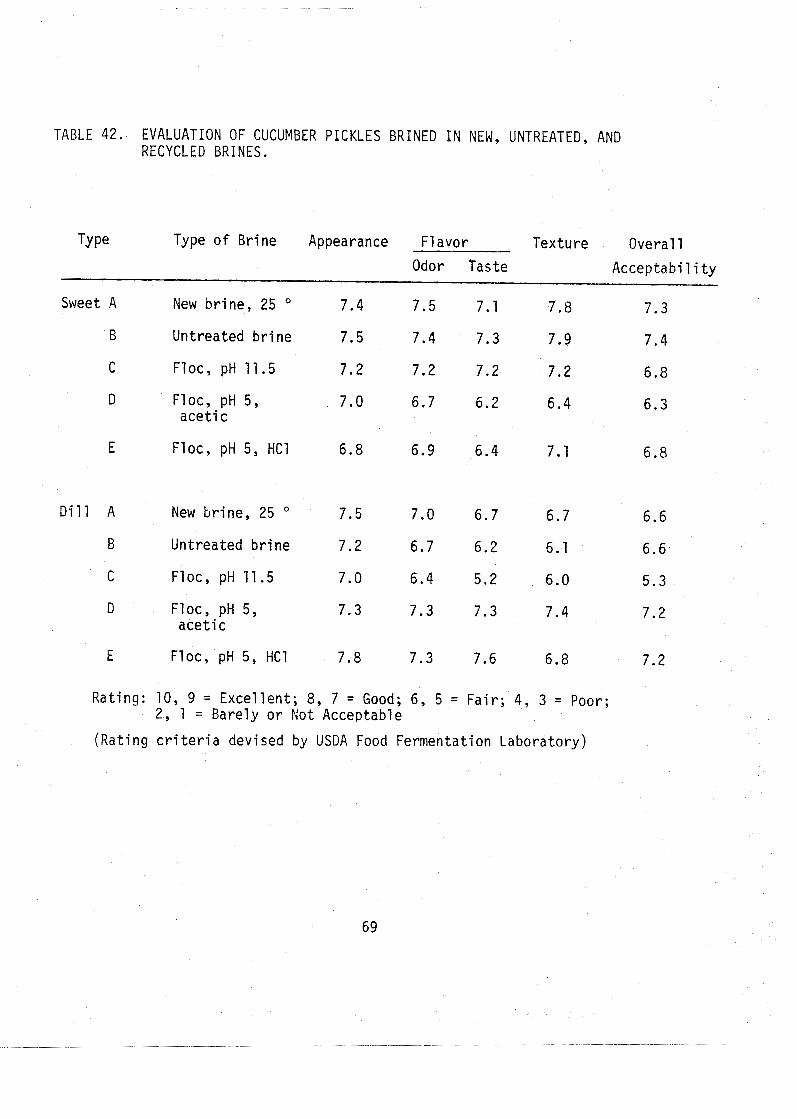
TABLE 42. EVALUATION OF CUCUMBER PICKLES BRINED I N NEW, UNTREATED, AND RECYCLED BRINES.
Type o f B r i ne Appearance F l a v o r Tex tu re Ove ra l l Odor Taste Acceptabi 1 i ty
Sweet A New b r i n e , 25 " 7.4 7.5 7.1 7.8 7.3
B Unt rea ted b r i n e 7.5 7.4 7.3 7.9 7.4
C Flocy pH 11.5 7.2 7.2 7.2 7.2 6.8
D F loc, pH 5, 7.0 6.7 6.2 6.4 6.3 a c e t i c
E Flocy pH 5, HC1 6.8 6.9 6.4 7.1 6.8
D i l l A New b r i ne , 25 " 7.5 7.0 6.7 6.7 6.6
B Unt rea ted b r i n e 7.2 6.7 6.2 6.1 6.6
C F loc, pH 11.5 7.0 6.4 5.2 6.0 5.3
D F loc, pH 5, 7.3 7.3 7.3 7.4 7.2 a c e t i c
E F loc, pH 5, HC1 7.8 7.3 7.6 6.8 7.2
Rat ing: 10, 9 = Exce l l en t ; 8, 7 = Good; 6, 5 = F a i r ; 4, 3 = Poor; 2, 1 = Ba re l y o r Not Acceptable
(Rat ing c r i t e r i a dev ised by USDA Food Fermentat ion Labora to ry )
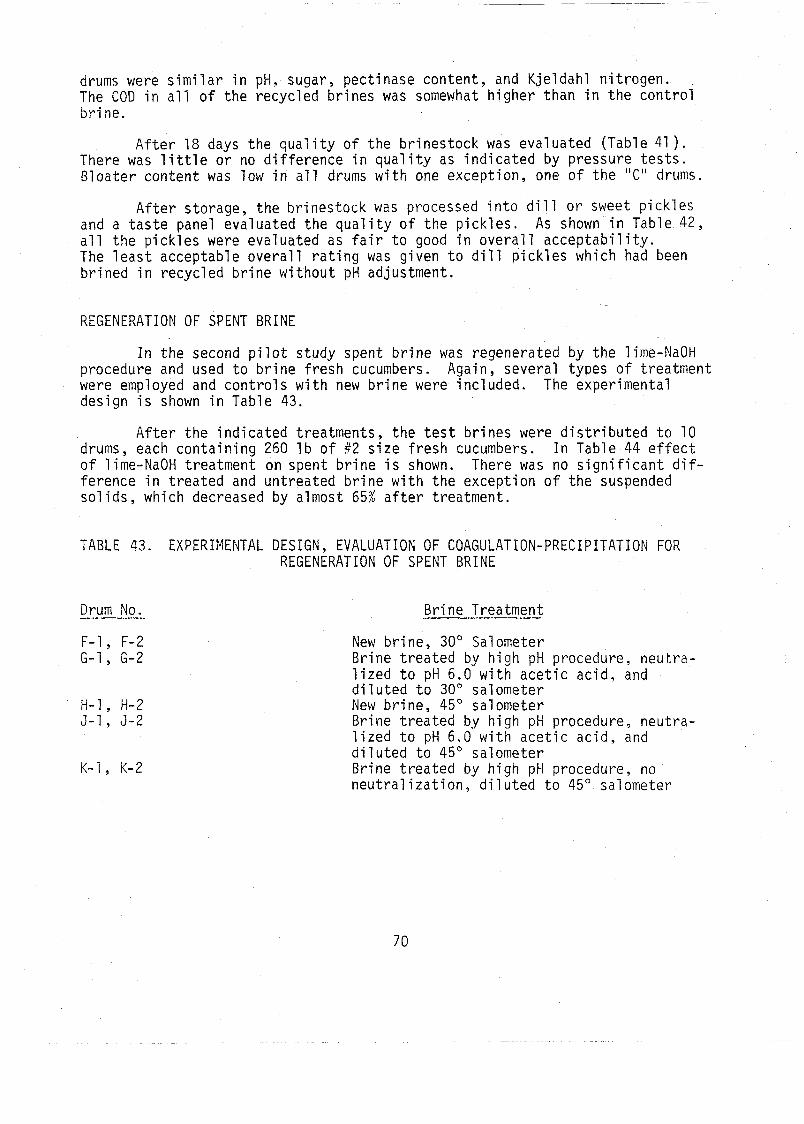
drums were similar in pH, sugar, pectinase content, and Kjeldahl nitrogen. The COD in a l l of the recycled brines was somewhat higher than i n the control bri ne.
After 18 days the qual i ty of the brinestock was evaluated (Table 41 ) . There was l i t t l e or no difference in quality as indicated by pressure t e s t s . Bloater content was low in a l l drums with one exception, one of the "C" drums.
After storage, the brinestock was processed into d i l l or sweet pickles and a t a s t e panel evaluated the qual i ty of the pickles. As shown in Table 42, a l l the pickles were evaluated as f a i r t o good i n overall acceptabili ty. The l eas t acceptable overall rating was given t o d i l l pickles which had been brined in recycled brine without pH adjustment.
REGENERATION OF SPENT BRINE
In the second p i lo t study spent brine was regenerated by the lime-NaOH procedure and used to brine fresh cucumbers. Again, several types of treatment were employed and controls with new brine were included, The experimental design i s shown in Table 43.
After the indicated treatments, the t e s t brines were distributed to 10 drums, each containing 250 1b of #2 size fresh cucumbers. I n Table 44 e f fec t of lime-NaOH treatment on spent brine i s shown. There was no s ignif icant d i f - ference in treated and untreated brine with the exception of the suspended sol ids , which decreased by almost 65% a f t e r treatment.
T A B L E 43. EXPERIMENTAL DESIGN, EVALUATION OF COAGULATION-PRECIPITATION FOR REGENERATION OF SPENT BRINE
Drum No. -- Bri ne Treatment
New brine, 30' Salometer Brine treated by h i g h pH procedure, neutra- lized to pH 6.0 with acet ic acid, and diluted t o 30' salometer New brine, 45" salometer Brine treated b y high pH procedure, neutra- lized to pH 6.0 with acetic acid, and diluted t o 45' salometer Brine treated by high pH procedure, no neutralization, diluted to 45" salometer
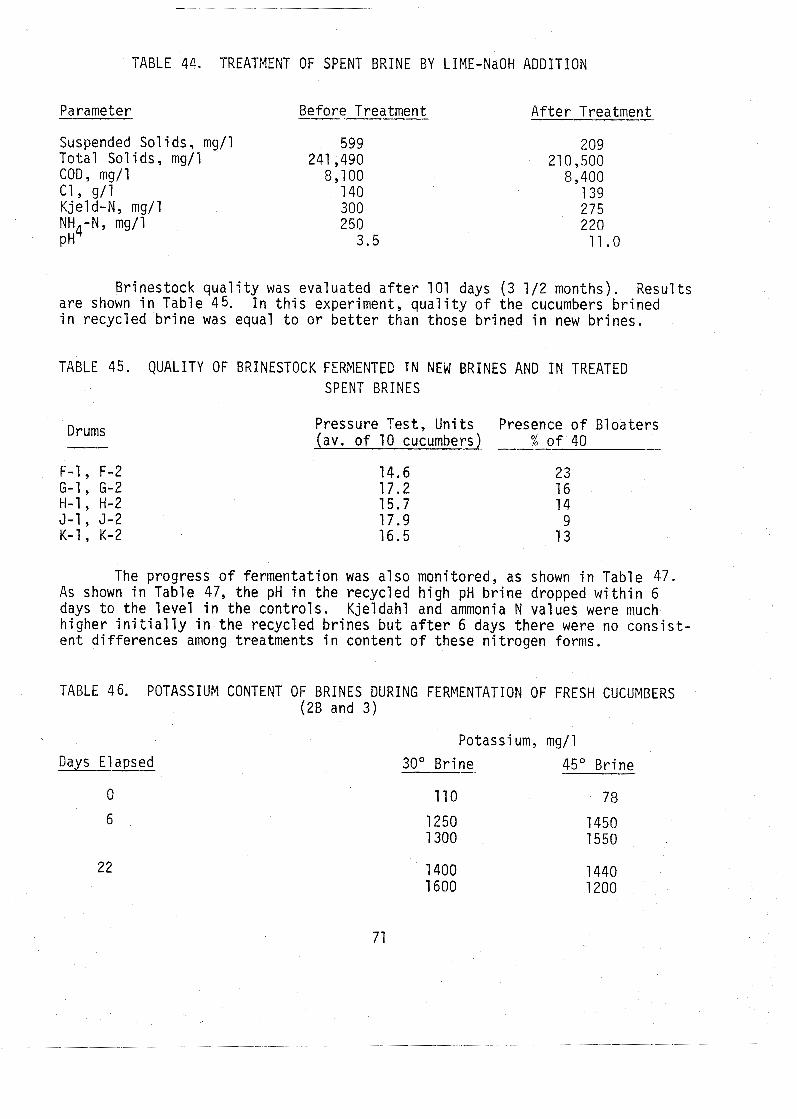
TABLE 44. TREATMENT OF SPENT BRINE BY LIME-NaOH ADDITION
Parameter Before T r e a t m e z A f t e r Treatment
Suspended So l ids , mg/l To ta l So l ids , mg/l COD, mg/l C l , g / l Kjeld-N, mg/l NH4-N, mg/l P H
Br ines tock q u a l i t y was evaluated a f t e r 101 days ( 3 1/2 months). Resul ts a re shown i n Table 45. I n t h i s experiment, q u a l i t y o f t h e cucumbers b r i n e d i n recyc led b r i n e was equal t o o r b e t t e r than those b r i ned i n new b r i nes .
TABLE 45. QUALITY OF BRINESTOCK FERMENTED TN NEW BRINES AND I N TREATED SPENT B R I N E S
Drums Pressure Test, Un i t s Presence o f B loa te rs (av. o f 10 cucumbers) - - % o f 40 -
The progress o f fermentat ion was a l s o monitored, as shown i n Table 47. As shown i n Table 47, t he pH i n t he recyc led h igh pH b r i n e dropped w i t h i n 6 days t o t he l e v e l i n t he con t ro l s . K je ldah l and ammonia N values were much h igher i n i t i a l l y i n t h e recyc led b r i nes b u t a f t e r 6 days t h e r e were no c o n s i s t - en t d i f f e rences among treatments i n con ten t o f these n i t r o g e n forms.
TABLE 46. POTASSIUM CONTENT OF BRINES DURING FERMENTATION OF FRESH CUCUMBERS (2B and 3)
Days Elapsed Potassium, mg/l
30" B r i ne -- 45" Br ine
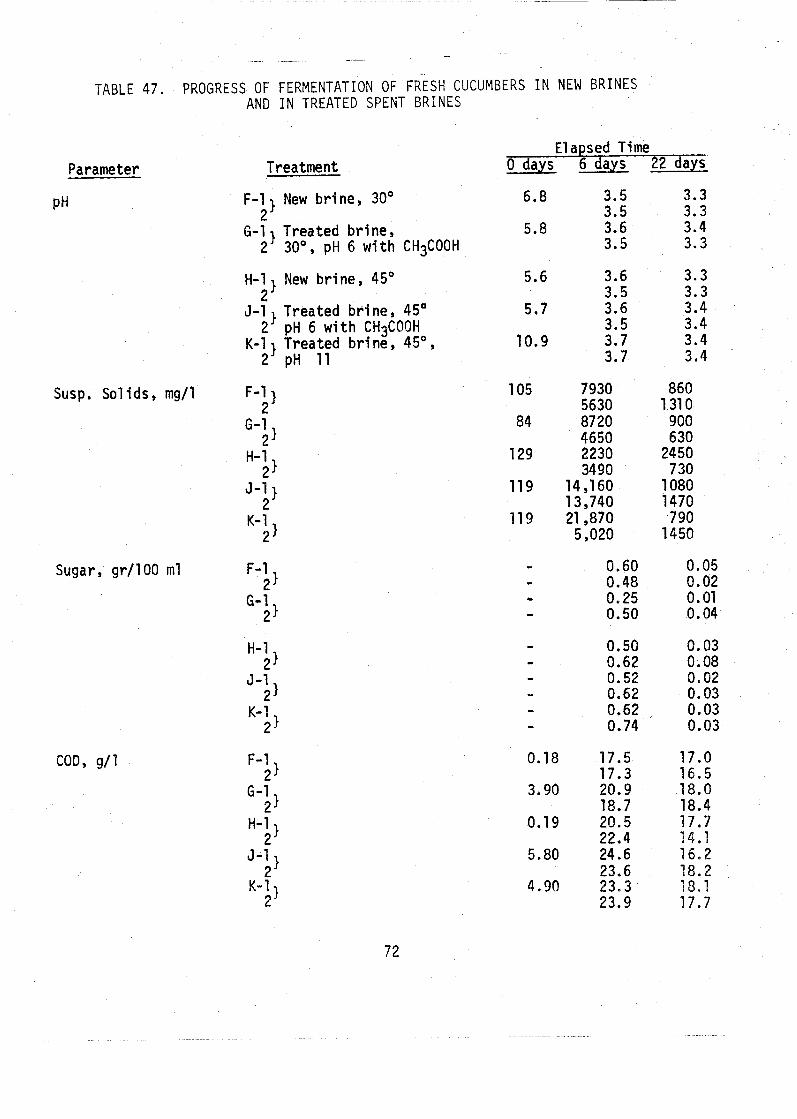
TABLE 47. PROGRESS OF FERMENTATION OF FRESH CUCUMBERS I N NEW BRINES AND I N TREATED SPENT BRINES
Parameter Treatment
F-1 New b r i n e , 30' 2
6-1 Treated b r i n e , 2 30°, pH 6 w i t h CH3COOH
H-1 I New b r i n e , 45' 2
J-1 Treated b r i n e , 45' 2 pH 6 w i t h CH3COOH
K-1 Treated b r i n e , 45O, 2 pH 11
Susp. Sol ids, mg/l F-1 1 2
Sugar, gr/100 ml F-1 2
Elapsed Time 0 days 6 days 22 days
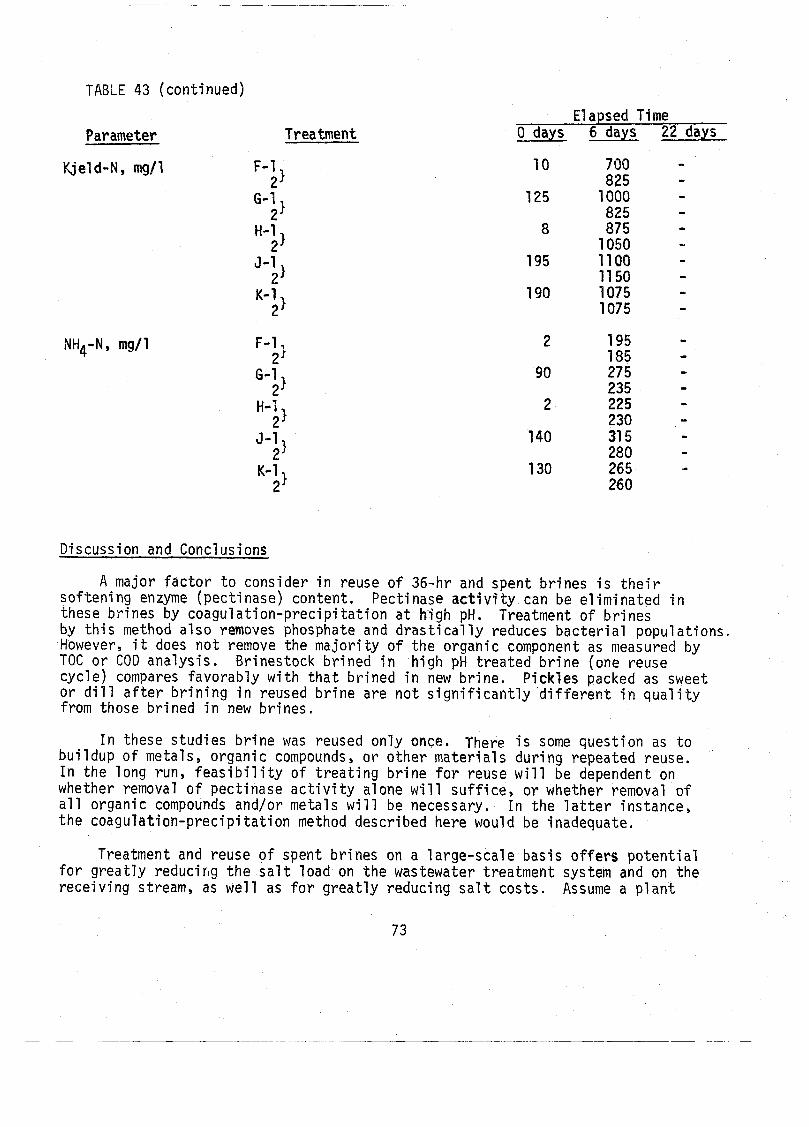
TABLE 43 (continued)
Parameter Treatment Elapsed Time
0 days 6 days 22 days
Discussion and Conclusions
A major factor to consider in reuse of 36-hr and spent brines i s t h e i r softening enzyme (pectinase) content, Pectinase ac t iv i ty can be eliminated in these brines by coagulation-precipitation a t high pH. Treatment sf brines by th is method also removes phosphate and drast ical ly reduces bacterial populations. However, i t does not remove the majority of the organic component as measured by TOC or COD analysis. Brinestock brined in h f g h pH treated brine (one reuse cycle) compares favorably w i t h that brined i n new brine. Pickles packed as sweet or d i l l a f t e r brining i n reused brine are not significantly different in quality from those brined i n new brines.
In these studies brine was reused only once. There i s some question as to buildup of metals, organic compounds, or other materials during repeated reuse. In the long r u n , f eas ib i l i t y of treating brine for reuse will be dependent on whether removal of pectinase ac t iv i ty alone will suff ice, or whether removal o f a l l organic compounds and/or metals will be necessary. In the l a t t e r instance, the coagulation-precipitation method described here would be inadequate.
Treatment and reuse of spent brines on a large-scale basis offers potential for greatly reducirrg the s a l t load on the wastewater treatment system and on the receiving stream, as well as fo r greatly reducing s a l t costs. Assume a plant
using 6,700 tons of s a l t per year (10,000 tons a t present , minus 3,300 tons saved by b e t t e r housekeeping); assume 90% of the 6,000 tons remaining i n the spent brines can be recovered by coagulat ion-precipitat ion o r u l t r a - f i l t r a t i o n . Reuse of t h i s 5,400 tons would e l iminate t h a t load on the receiving stream and i n addi t ion, o f f e r a potential savings i n s a l t co s t s , depending on the cos t of treatment.
BIOLOGICAL TREATMENT OF WASTEWATERS FROM CUCUMBER PICKLING
I n t r o d u c t i o n
The o n l y r a t i o n a l bas i s f o r unde r tak ing wastewater t r ea tmen t i s c o r - r e c t i o n o f d e f i c i e n c i e s i n qua1 i ty which cou ld cause harmfu l env i ronmenta l impact. Wastewaters f rom t h e p i c k l e i n d u s t r y c o n t a i n severa l types o f c o n s t i t u e n t s which p o t e n t i a l l y cou ld cause such d i f f i c u l t i e s , i n c l u d i n g suspended ma t te r , b iodegradable o rgan ics , and c h l o r i d e s . Technology i s a v a i l a b l e f o r removal o f any o r a l l o f them t o any e x t e n t des i red , s u b j e c t o n l y t o f i n a n c i a l 1 i m i t a t i o n s .
B i o l o g i c a l t reatment , which i nc l udes t h e types o f systems most com- monly i n s t a l l e d today, i s concerned p r i n c i p a l l y w i t h d e s t r u c t i o n and r e - moval o f b iodegradable o rgan ics and, t o a l e s s e r degree, suspended m a t t e r . I t must be recogn ized t h a t b i o l o g i c a l t rea tment has no impact on c h l o r i d e con ten ts o f wastewaters. Removal o f c h l o r i d e s would r e q u i r e appl i c a t i o n o f e n t i r e l y d i f f e r e n t techno1 ogy.
Goals o f B i o l o g i c a l Treatment
B iodegradable o rgan ic chemicals a r e those which can be u t i l i z e d by b a c t e r i a and o t h e r microorganisms as sources o f energy and elements r e - q u i r e d by them t o form a d d i t i o n a l c e l l m a t e r i a l (g rowth) . Biochemical u t i l i z a t i o n o f t h e o rgan ics leads t o t h e i r breakdown i n t o s i m p l e r chemi- c a l s and, perhaps, u l t i m a t e l y t o i n o r g a n i c ash and gases.
A l though b iodegradable o rgan ics i n wastewater d ischarges may be o b j e c t i o n a b l e f o r many reasons, t h e concern most o f t e n encountered i s based on t h e i r impact on d i sso l ved oxygen resources i n r e c e i v i n g streams. Th i s can be a t t r i b u t e d t o t h e f a c t t h a t processes i n v o l v e d i n b iochemica l t r ans fo rma t i on of carbon i n o rgan i c compounds i n c l u d e u t i 1 i z a t i o n o f oxygen and p roduc t i on of carbon d iox ide . The oxygen r e q u i r e d i s ob ta ined by t h e organisms f r om d i sso l ved oxygen i n t h e r e c e i v i n g water , t he reby imposing a "b iochemica l oxygen demand" (BOD) on t h e l i m i t e d supp ly o f t h a t gas i n t h e stream. The t o t a l amount o f BOD exer ted depends upon t h e amount o f o rgan i c chemical d ischarged and t h e e x t e n t t o which i t i s b i o - degradable. The r a t e a t which e x e r t i o n occurs i s i n f l u e n c e d by many o t h e r v a r i a b l e s , as w e l l , i n c l u d i n g t h e numbers and types o f organisms p resen t and severa l environmental fac to rs , i n c l u d i n g temperature and pH.
If dissolved oxygen in the stream i s used more rapidly than i t can be replaced from the atmosphere, and through photosynthesis by algae, i t s concentration will decrease. As more organics are added to a stream, dissolved oxygen concentration i s reduced t o progressively lower 1 eve1 s unti 1 , eventually, adverse effects are observed on survival of various types of f ish and f i sh food organisms. Addition of suf f ic ien t organics to exhaust completely the supply of t h i s essential element can render the water unsuitable for supporting any f ish l i f e . Further, under those c i r - cumstances, other types of biochemical reactions may lead t o production of foul odors in the vicini ty of the stream.
For many years, depletion of dissolved oxygen has been the stream pollution problem receiving greatest attention in the U.S.A. One should recognize tha t t h i s concern about dissolved oxygen levels i n streams and lakes i s not based on concern about human health because i t never has been demonstrated that any re1 a t i onshi p exi s t s between di ssol ved oxygen con- ten t of the water and health of the population consuming that water. Ac- cordingly, stream pollution problems relat ing to dissolved oxygen, and treatment processes directed towards removal o f constituents causing BOD, are based primarily on ma~ntenance of water qua1 i ty adequate for support of aquatic l i f e , protection of recreation uses, and prevention of local nuisances.
One way in which these problems can be minimized or eliminated i s through removing biodegradable organics from the wastewater prior to dis- charge. The origin and basic rationale for biological treatment i s based on the concept of providing f a c i l i t i e s in which environmental conditions are maintained to encourage completion of the biochemical reactions be- fore discharge of the wastewater. Thus, biological wastewater treatment processes only cause those reactions to occur in the treatment plant before discharge which otherwise would occur subsequently in the receiving stream anyway. The difference, of course, i s tha t by causing the reactions to occur before discharge the impact on dissolved oxygen in the stream i s mi ni mi zed.
This goal generally i s accomplished simply by accelerating reactions in the treatment f a c i l i t i e s to reduce necessary holding time and required land areas. That i s done through providing optimum environmental condi- t ions and increasing the numbers of microorganisms coming in contact with the organics during treatment.
lypes of Biological Treatment Systems
Of a1 1 bi 01 ogi cal treatmen which most closely approximates unit has a deceiving appearance consists simply of a basin prov depending upon character of the
t systems, the oxidation pond i s the one what happens in receiving streams and th i s of simplicity. The physical f a c i l i t y
iding a holding time of weeks or months, waste, during which bacteria and other
organisms can degrade organics in the wastewater. The reactions are the same as those which would occur over a period of many days in the receiv- ing stream i f the wastewater were discharged without treatment. Oxygen required to sa t i s fy needs of the process and to avoid nuisances i s furnished principally through photosynthesis by algae growing i n the pond. Algae are microscopic green plants having capabili ty for u t i l iz ing carbon di- oxide and producing oxygen in the presence of sunl ight . Because energy required for the process i s derived from sunlight, the rate of oxygen supply i s controlled by the amount of sunl ight intercepted and, therefore, pond area becomes the controlling design parameter. The high concentra- t ions of biodegradable organics, and the corresponding oxygen demand exert- ed, in wastewaters from even a moderate s ize pickle processing plant would require many acres of oxidation ponds, even under the best of conditions.
Frequently, i t i s more economical to provide biological treatment through using aerated lagoons. Again, the basic reactions which occur i n these units are the same as those in oxidation ponds or receiving streams. However, required land areas are smaller because oxygen i s supplied through man-made aeration systems which enhance t ransfer from the a i r t o pond contents. The aeration can be accomplished by introducing compressed a i r into the basin, resulting in t ransfer of oxygen from bubbles into the l iquid, or by surface aerators which cause violent agitation and enhance t ransfer of oxygen through the pond surface or into l iquid droplets. Adoption of th i s type of system removes the constraint of having to provide large surface area to intercept adequate sunlight and leaves as primary design parameter the retention time of the wastewater in the pond. In practice, the time provided depends upon strength of the waste, i t s char- a c t e r i s t i c s , pH, temperature and other environmental factors , as well as required quality of effluent from the system. Frequently, aerated lagoons are constructed by industries with retention times of 5-100 days. The high concentrations of organics in wastewaters from pickle processing have led to construction of f a c i l i t i e s of 15-60 days.
The types of organisms which develop during biological treatment of most wastewaters have specif ic gravity s l ight ly in excess of water and tend to agglomerate i n t o par t ic les large enough to s e t t l e a t reasonable rates . Effluent from an aerated lagoon, for example, can be passed through a se t t l i ng tank of approximately two hours retention, causing separation of most of the organisms from the liquid under the influence of gravity. Liquid from the bottom of th i s unit contains substantially higher concen- t ra t ions of microorganisms and can be returned t o the aeration basin to increase the i r population in that unit .
The rate of attack on organic constituents of wastewaters entering the aeration basin increases in proportion to population of viable organ- isms, resulting in increased treatment capacity in systems based on aera- t ion, final s e t t l i ng , and return of the se t t led sludge. This approach i s termed the "activated sludge" process. Although there are many different versions, a1 1 of them accomplish the same purpose - they accelerate the
ra te of biological destruction of organics by increasing the supply of organisms in contact with the wastewater. This allows more extensive treatment in a given f a c i l i t y , or permits construction of a substantially smaller plant to accomplish a specified degree of treatment of a given wastewater. S t i l l , the biochemical reactions which occur in t h i s type of system are basically the same as those which would occur i n receiving streams, oxidation ponds, or aerated lagoons.
Applications in Pickle Industry
A1 though several other biological treatment processes are avai 1 able, and there are many modifications of ones already outlined, the types of f a c i l i t i e s most commonly provided for treatment of wastewaters from pickle processing are aerated lagoons or activated sludge systems. Where adequate land i s available a t reasonable cost , the aerated lagoon usually i s simpler and more economical. Where space i s a t a premium, activated sludge represents a more reasonable approach. Several aspects of these processes, combined with certain character is t ics of wastewaters from the pickle industry, deserve a t leas t brief attention.
I t was pointed out e a r l i e r that biological treatment does not have s ignif icant impact on chloride content. On the other hand, i t i s possible that chlorides can have adverse e f fec ts on biological treatment because a t suff ic ient ly high concentration, growth of organisms may be inhibited. However, t h i s e f fec t usually i s observed only a t very high concentrations of chlorides and i t appears a t leas t doubtful that t he i r inhibiting ef fec ts would be important a t the levels commonly encountered in total wastewater flow from pickle processing.
A different adverse e f fec t of chlorides on the activated sludge pro- cess can resu l t from increased specific gravity of wastewater with r i s e in chloride concentration. That sometimes could interfere with se t t l i ng of organisms, which typically nave specific gravity very close to tha t of water. Of course, any thing which impedes separation of organisms in the final s e t t l i ng tank can preclude adequate concentration f o r attainment o f levels in the aeration tank which produce acceptable treatment ra tes . The exact magnitude of chloride effects in t reat ing pickle processing wastewaters in practice i s not known currently.
A further consideration i s tha t potentially harmful e f fec ts of chlo- rides may be magnified considerably in s i tuat ions where they swing rapidly through wide ranges of concentration. These changes can be more harmful t o aquatic l i f e than sustained operation a t e i ther low or high concentra- t ion. This question deserves serious consideration and should be explored carefully, especially in any treatment system in which i t i s planned t o use short re tent i on activated sludge, where chloride concentrations may vary quickly.
A factor which sometimes i s given too l i t t l e consideration in planning and design of treatment f a c i l i t i e s i s production, handling and disposal of sludge. In any biological treatment system, the biochemical reactions re- s u l t in partial destruction of biodegradable organics and u t i l iza t ion of some of the remaining wastewater constituents to produce new biologjcal cell s (growth). The proportions destroyed and converted into cel l s vary considerably depending on character of the chemical, environmental condi- t ions, and period of retention in the system. Generally, aerated lagoon and activated sludge systems similar to those employed for t reat ing waste- waters from the pickle industry produce net microbiological growth in the .range of 0.1-0.5 pounds of suspended sol ids for each pound of BOD removed from the wastewater. Failure t o remove these solids from the system in amounts corresponding to the i r net production must resu l t in accumulation in the treatment plant. There, they e i ther s e t t l e and reduce effect ive volume of the aeration tank or escape from the plant, which often i s un - acceptable because of limitations on effluent suspended sol ids and because those suspended solids themselves exert a BOD.
The present trend in requirements for effluent quality suggests tha t very soon i t will be necessary for vir tual ly a l l plants to provide f a c i l i - t i e s for sludge handling. Some al ternat ives which can be considered in- clude providing very large sludge holding lagoons, land disposal, or sludge dewatering on drying beds, vacuum f i l t e r s or sludge centrifuges followed by disposal in sanitary l andf i l l s , application to land or incin- eration. Usually, i t i s impossible for a biological treatment f a c i l i t y t o meet standards imposed upon i t by EPA and State agencies without care- ful management of suspended solids. Sludge handling problems undoubtedly will cause serious d i f f i cu l t i e s and major expense to most pickle processors and, often, may cost more to solve than construction of the biological wastewater treatment plant.
Operating problems occur sometimes in t reat ing pickle processing waste- waters because of pH variations. Organic acids i n the wastewater and pro- duction of even more organic acids during biological treatment can cause sharp decrease in pH i n the aeration tank, even though the wastewater being treated i s i n i t i a l l y about neutral in pH. Successful biological treatment requires maintenance of reasonably uniform pH, usually in the range of 6-8. Rapid variations and departures substantially outside of that range usually are harmful to the process and resu l t in lower treatment efficiency.
Activated sludge and aerated lagoon systems are basically aerobic processes, requiring presence of excess dissolved oxygen to a t ta in optimum treatment and avoid odorous conditions. Inadequate oxygen supply can per- mit dissolved oxygen concentration in the aeration tank to d r ~ p below 1 mg/l and, perhaps, exert significant adverse impact on treatment. Waste- waters from the pickle industry may suffer unusuaily serious impact from inadequate aeration because resulting increases in concentrations of organic acids also can cause drop i n pHy interfering with biological treatment be- cause of low pH and low dissolved oxygen. This makes i t especially import-
ant in t reat ing wastewaters from the pickle industry to insure that dis- solved oxygen in the aeration basin always i s maintained a t l eas t above 1 mg/l. This requires provision of more conservative a i r supply, including standby equipment t o cover fa i 1 tures , and emergency neutral i zati on equip- ment for addition of a lkal i to the aeration tank to prevent pH drop.
Biological treatment has been applied to pickle and olive wastes with good resul ts i f c r i t i ca l operating parameters are control 1 ed. Barnes and Wei nburger (1 958) reported the use of t r i ckl i ng f i 1 t e r s , activated sludge, and oxidation ponds for pickle wastes, b u t no detai 1 s were given. Hazel- t ine (1952) conducted p i lo t studies on tr ick1 ing f i l t r a t i o n of sauerkraut and pickle wastes and concluded that with proper pH control and loading 85% or more reduction of BOD could be achieved. He found that chloride concentrations of u p to 5000-6000 mg/l had l i t t l e e f fec t on treatment efficiency. B u r ~ e t t (1 974) reviewed effect of sal i ni ty variations on the activated sludge system; high sa l in i ty could be tolerated i f sharp variations were avai ded.
A11 North Carolina plants currently use aerated lagoons for waste treatment. In some cases plant growth has outstripped treatment faci 1 i - t i e s , as i s exemplified by Plant A. Plant A has two aerated lagoons, each with a capacity of close t o 2 MGD. These ponds were designed t c acconmo- date 100,000 gpd of wastewater, giving a total detention time of 40 days. However, the average hydraulic load consistently exceeds the design load by a factor of 2 or more (Table 30). A similar s i tuat ion exis t s a t Plant B. Personal observations and observations by plant personnel indicate that the dissolved oxygen level i s frequently below tha t required for aerobic degradation of wastes. The low D O , coupled with shortened deten- tion time, low pH, and high chloride levels , has resulted in marginal biological treatment efficiency.
Discharge of pickle wastes to municipal biological treatment systems has resulted in problems in a number of cases. Kimball (1960) reported the e f fec t O H a municipal system in Crosswell, Michigan when increased demand for sweet pickles and re l ish caused a t r ip l ing of the BOD load from a local pickle plant. Not only did the efficiency of the Imhoff tank - t r ickl ing f i l t e r system drop from 85 to 56%, b u t odor and corrosion pro- blems developed. In a North Carolina town some years ago the municipal Imhoff tank system had to be abandoned when wastes from the local pickle plant rusted out the system.
Effects of Treated Effluent on Receiving Streams
As pointed out previously, biological treatment does not a f fec t chloride concentration of pickle plant wastewaters. Discharge of high concentrations of s a l t can cause numerous undesirable e f fec ts of receiving streams. Such ef fec ts have been reviewed and summarized by Field e t a1 . (1973) and McKee and Wolfe (1963) and include the following:
(1 ) density s t r a t i f i ca t ion in receiving streams
( 2 ) release of mercury from sediments due t o exchange of mercury with sodium and calcium
(3) groundwater pol 1 ution (4 ) increased corrosion rates (5) toxici ty t o freshwater f i sh ( 6 ) interference with use of water for stock and wi ld l i fe watering
i f s a l t exceeds 1500 mg/l (7) interference with use of water for i r r igat ion
Salt-tolerance varies with different crops. Crop species especially sensit ive to s a l t include green and f i e ld beans, celery, radish, c i t rus f r u i t s , pear, apple, plum, peach, and avocado (Field e t a l . , 1973) and tobacco (personal communi cat i on, P. Benton, N . C . Water and Ai r Resources, Industrial Wastes Section). The overall amount of acreage i r r igated in North Carolina i s -105,000 acres; in Michigan, 139,000; and in Delaware, 15,000 (Skogerboe, 1971 ) .
McKee and Wolfe (1963) cited the following recommended chloride 1 imi t s : domestic water supply, 250 mg/l ; industrial water, 50 mg/l ; i r r iga t ion , 100 mg/l; stock and wildl i fe , 1500 mg/1,
Conclusions
Biological treatment i s designed to remove biodegradable organics from wastewater pr ior to discharge. I t has no impact on chloride content. However, high chloride levels may in ter fere with biological treatment, especially i f there are sharp variations in concentration.
The organic component of pickling wastewater i s readily treated biologically i f suf f ic ien t detention time and suf f ic ien t dissolved oxygen are available(see Appendix A ) . Since much of the acidi ty i s due to organic acids, aerobtc biological treatment will also reduce o r eliminate the need for pH adjustment with a1 ka1 i .
There are numerous adverse effects of ch 1 ori des on receiving streams . The level of chloride considered "adverse" i s highly dependent on the intended use of the stream.
REFERENCES
Almanac, of the Canninq, Freezingyeand Preserving Industries-, compiled by Edward E . Judge and Sons, Westminister, Mary1 and: Edward E . Judge & Sons (1974).
APHA, AWWA, WPCF, Standard Methods for the Examination of Waterand Waste- water, 13th ed. , New York: American Public Health Association (1971). - _IC
Barnes, G . E., and L . W. Weinberger, "Internal Housekeeping Cuts Waste Treat- ment a t Pickle Packing Plants," Waste Engineering 2: 18-21 (1958).
Bell, T. A . , U.S. Food Fermentation Laboratory, Personal Communication (1972).
Bell, T. A.,and J . L . Etchells. "Pectin Hydrolysis by Certain Salt-Tolerant Yeasts ," Applied Microbiology .- 4: 196-201 (1956).
Bell, T . A . , J . L . Etchells, and R . N . Costilow, "Softening Enzyme Activity of Cucumber Flowers from Northern Production Areas," Food Research - .- 23: 198-204 (1 958).
Be1 1, T, A . , J . L. Etchell s , and I . D. Jones, A Method for Testin~Cucuniber Sal t-Stock Brine for Softening Activity, Tublicati on ARS-72-5, m-- Agricultural Research Service (1 955).
Binsted, R . , J.D. Devey, and J.C. Dakin, Pickle and Sauce Making, 2nd ed,,Lnnsdrrn: Food Trade Ikss+U% (19621. - -
Blizard, G . F. "Submerged Combustion--The Answer to Plckle Brine Disposal ," presented a t Eastern Regional Meeting, Pickle Packers International, Inc., Atlanta, Georgia (March 9, 1973).
Brown, J . C . , L . W . L i t t l e , D. E . Francisco, and J . C . Lamb, Methods for Improvement of Trick1 ing Fi 1 t e r Plant Performance, Part I : Mechanical and Biological *Optima, EPA-670/2-73-047a, Environmental Protection Agency, Washington, D. C . (1973).
Brunette, Gerdrin, Huqon, and Simler, " A Study of Groundwater Pollution by Sal t ," in ~roceedincjs of the 5th ~nterna t ional Water Pollution Research Conference, Pergamon Press L t d . (7971 1.
Burnett, W. E . , "The Effect of Salinity Variations on the Activated Sludge Process ," Water & Sewage Works - 121 ( 3 ) : 37-38, 54-55 (1974).
Bush-Brown, J., and L . Bush-Brown, America's Garden Book, New York: Charles Scri bner' s & Sons (1 958).
Cranf ie ld , D., "Desc r i p t i on o f an Operat ing B r i ne Recycl ing Program i n Tank Yard," presented a t Eastern Regional Management Conference, P i c k l e Packers I n t e r n a t i o n a l , I nc . , Charleston, South Caro l ina (March 28, 1974).
E t c h e l l s , J. L.,and T. A. B e l l , "F i lm Yeasts on Commercial Cucumber Brines," Food Techno1 ogy 4: 71-53 (1 95O), ---
E t c h e l l s , 3. L., T. A . B e l l , and R. N. Cost i low, "Con t ro l l ed Fermentat ion Improves P i c k l i n g ," Food Processing and Market i i , May, 150-1 51 (1 966).
E t c h e l l s , 3. L., T. A. B e l l , H. P. Fleming, R. E. K e l l i n g , and R. L. Thompson, "Suggested Procedure f o r t h e Cont ro l 1 ed Fermentat ion o f Commerci a1 l y Br ined P i c k l i n g Cucumbers - The Use o f S t a r t e r Cu l tu res and Reduction o f Carbon Diox ide Accumulation," P i c k l e Pak Science 3: 4-14 (1973). - -
E t c h e l l s , J. L.,and L. H. Hontz, "Suggestions f o r B r i n i n g P i c k l i n g Cucumbers - The Use o f E q u i l i b r a t e d B r i ne Strengths, Based on the Average Br ine- Cucumber-Mass Temperature," P i c k l e Pak Science 2: 18-1 9 (1 972). -
E t c h e l l s , J . L., I . D. Jones, and T. A. B e l l , "Advances i n Cucumber P i ck l i ng , " i n Crops i n Peace and War, Washington, D. C . : U.S. Government P r i n t i n g Office, Yearbook o f A g r i c u l t u r e 1950-51 , pp. 228-236 ( l 9 5 2 ) ,
E t c h e l l s , J. L., and W. R . Moore, Jr., "Factors I n f l u e n c i n g the B r i n i n g o f P ick1 i n g Cucumbers - Quest ions and Answers ," P i c k l e Pak Science 1 (1 ) : - 1-17 (1971).
F i e l d , R., E. J. S t ruzesk i , H. E. Masters, and A. N. T a f u r i . Water P o l l u t i o n and Associated Ef fec ts f rom S t r e e t Sa1 t i n g EPA-R2-73-257, Environmental P r o t e c t i o n Agency, Washington, D. C. (1 9733.
Fryberger, J. S. , Rehabil i t a t i o n o f a Brine-Pol 1 u ted Aqu i fe r , EPA-R2-72-014, Environmental P ro tec t i on Agency, Washington, D. C . (1972).
Geisman, J. R.,and R. E. Henne, "Recycl ing B r i ne from P ick l i ng , " Ohio Report 58 ( 4 ) : 76-77 (1973). -
Hazel t i n e , T. R., " B i o l o g i c a l F i l t r a t i o n of Kraut and P i c k l e Wastes," Water and Sewage Works - 99: 161-165 (1952).
Hontz, L., V ice-pres ident , Mount O l i v e P i c k l e Company, Personal Communication, (1974 ).
Hoover, S. R. , "Prevent ion o f Food-Processing Wastes," Science 183: 824-828 (1 974).
-
Hornsby, A. G, , P r e d i c t i o n Modeling f o r S a l i n i t y Contro l i n I r r i g a t i o n Return Flows, EPA-R2-73-168, Environmental P r o t e c t i o n Agency, Washington, D. C . -(mT).
Kimbal 1 , F. L. , "Treatment Problems Caused by Cucumber Canning Wastes," Journal -- Water P o l l u t i o n Contro l Federat ion 32: 429 (1960). -
King, E. A., B i b l e P lan ts f o r American Gardens, New York: The MacMil lan Company .- (1941).
8 3
Lowe, E . , and E . L . Durkee, "Sal t Reclamation from Food Processing Brines," Proceedings of the Second National Symposi,um on Food Processing Wastes, - pp. 75-83, water p ~ l l ution Control Research Series 12060-031 71 , Envi ron- mental Protection Agency, Washington, D . C . (1971 ) .
Macon, J . , Consultant t o Mount Olive Pickle Company (1974).
McKee, J . E . , and H . W . Wo1 f e , Water Qua1 i t y C r i t e r i a , The Resources Agency of Cal i fo rn ia , S ta te Water Qua1 i t y Control Board, Publ i ca t ion No. 3-A (1 963).
Mercer, W . A . , H . J . Maagdenberg, and J . W . Ral ls , "Reconditioning and Reuse of 01 ive Processing Brines," Proceedings of the F i r s t National Symposium on Food Processing Wastes, Portland, Oregon, pp. 281-293, Water Pollution Control Research Series 12060--04/70, Environmental Protection Agency, Washington, D , C . (1970).
Mercer, W . A . , J . W . Ralls , and H . J . Maagdenberg, "Reconditioning Food Pro- cessing Brines with Activated Carbon," Chemical Engineering Progress, Symposi um Series - 67 : 435-438 (1 971 ) .
Nemerow, N . L . , Theories and Prac t i c ies of Indust r ia l Waste Treatment, Reading , Massachusetts : Addi son-Wesl ey Publ i shi ng Company, Inc. (1 963).
Palni tkar , M . P.,and R . F . McFeeters, "Use of Recycled Brines f o r Cucumber Fermentations," paper presented a t Annual Meeting of Pickle Packers, International , Inc. , Chicago, I1 1 inois (December, 1974).
Popper, K., W . M . Camirand, G . G . Walters, R . J . Bouthilet , and F . P . Boyle, "Recycles Process Brine, Prevention Pol 1 u t ion," Food Engineering - 39 (4 ) : 78-80 (1 967).
Ryan, W . A . , "Effect of Cannery Wastes on Operation of Sewage Treatment Plants ," Sewage Works Journal - - 12: 99 (1940).
Skogerboe, G. V . , Research Needs fo r I r r iga t ion Return Flow Qual i ty Control, Water Pol 1 ution Control Research Series 13030--11/71 , Environmental Protection Agency, Washington, D . C . (1971 ) .
U. S. Department of Agriculture S t a t i s t i c a l Reporting Service, Department of Commerce (1 973)-
Vaughn, R . H . , M. H . Martin, K. E . Stevenson, M . G . Johnson, and V . M . Crompton. "Sal t - f ree Storage of Olives and Other Produce f o r Future Processing," Food Techno1 ogy - 23: 124-1 26 (1 969).
Veldhui s , M . K . , J . L. Etchel 1 s , I . D . Jones, and 0 . Veerhoff, "Notes on Cucum- ber Sal t ing, ' ' F ru i t Products Journal - 20: 341 -342 (1941 ) .
Wierenga, P. J . , G . A . O'Connor, and H. E , Dregne, Soil and Water Management f o r Sa l i n i t y Control, Technical Completion Report, WRRI Report No, 0 1 8 ~ N e i - Mexico Water Resources Research I n s t i t u t e , Las Cruces , New Mexico (1 972).
LIST OF PUBLICATIONS
Horney, L. F . 9 and L. W. Little, "Removal of Pectinase from Spent Cucumber Brines by Ul trafil tratian ,I' presented at Annual Meeting, North Carolina Academy of Science (.A ril 5, 1975). Abstract to be published in Journal of the El isha Mitchel Scientific Societx 91 (1975). - ! -
Horney, L. F., Investigation of Coagul ation-Precipi tation and Ul trafil tration for the Regeneration of Brines in the Cucumber Pickle Industry, Master's report, Department of Environmental Sciences a d Engineering Sciences and Engineering, University of North Carolina at Chapel Hill (1975).
GLOSSARY
Abbreviations, "--- Units
hour gal 1 on gallons per day 1 i ter milliliter mi 11 i grams per 1 i ter mi 11 imhos molecular weight micron (+ nannometer
Abbreviations, Terms
BOD - C 1 - COD - DO - Kjeld-N - NH4-N - N02-N - NO3 - N - spec. cond.- S S C
TDS -. TOC - T P - T S -
biochemical oxygen demand chloride chemical oxygen demand dissolved oxygen total Kjeldahl nitrogen ammonia nitrogen nitrite nitrogen nitrate nitrogen specific conductivity suspended solids total dissolved solids total organic carbon total phosphorus total solids
APPENDIX A
INDUSTRIAL WASTEWATER SURVEY OF A CUCUMBER PICKLE PLANT
14. J. Garrei s, Envi ronmental Management and Protect ion C. L. Hagger, Water Resources Engineering L. R. Hontz, Environmental Management and Protect ion L. F. Horney , Envi ronmental Chemistry and B i 01 ogy D. R. Koenigshofer, A i r and I ndus t r i a l Hygiene J. C. Lamb, Professor o f Sanitary Engineering
(Edited by L. W. L i t t l e )
A Report
from
Department o f Environmental Sciences and Engineering School o f Publ ic Health
The Univers l ty o f North Carol ina a t Chapel H i l l
ABSTRACT
Manufacture of pickles results i n large quantities of wastewater that are not easily treated. The pickle plant studied i n t h i s project presently i s under pressure from the State Board of Water and A i r Resources t o imple- ment more adequate treatment of i t s wastewater discharges. The combination of present treatment faci l i t ies and operating procedures are judged to be inadeqtiute t o achieve proper treatment of the low pH, high organics and high salt content of ef f luents generated.
This investigation was undertaken t o examine some areas of concern i n production and treatment of the wastewater t o provide a basis for improving procedures and facil i t ies to reduce present treatment d i f f icul t ies .
An inventmy was conducted t o determine the volume and character o f wastewaters gemrated within the plant. Further, the contribution of wastes from each plant manufactwying area was studied t o determine where changes would be most ef fect ive. Flow measurements and wastewater sampling and analyses were employed t o yield desired infomation, sunvnarized i n the report.
Neutrulization of plant wastewater with three common alkalis was studied to compme their relative effectiveness. Small quantities of e f f Zuent were t i trated with aqueous moniwn hydroxide and sodiwn hydro=cide and with calcium hydro&&. A comparison of the neutralizing capacity o f these alkalis for th i s particuZar waste was obtained. Large quantities of alkali may be required t o raise the pH of the lagoon before biological treatment can be effective. Continued smaller additions may be needed t o maintain proper pH within the system, Sodium hydroxide appears t o be the chemical of choice.
PiZot treaeabitity studies were conducted a t bench scale to evaluate bioZogical treatability by aerated lagoons and e f fec ts of variations i n pH and saZini&y on biological treatment of wastes from the Henderson plant. Treatment faci l i t ies a t the plant were simulated i n each Zabora unit through use of a series of three aerated c o l m s . DaiZy plant ef f luent additions and transfers were made. T h e e conditions were studied: 1) neu- tratization to pH 7.0; 2 ) neutralization to pH 7.0 along with increased salinity and 3 ) neutralization to pH 5.5. Resul* indicated txctemiue re- movals of organics m d revealed only sl ight differences i n treatmen% p ~ - vided for the wastes o f di f ferent pH. Most of the organics v~emooal is accomp tished i n 95-30 days detention.
Finally, a respiration study zJas carried out t o demonstrate tke e f f ec t of shock loads on the treatability of p Z m t wastes. By measurement of dis- solved oqjgen uptake by treatment organisms, it was possible tca s d m the ef fects of Zarge differenam in sal t content and acidity ma i?reat&<li&y. These were less than had been anticipated.
INTRODUCTION
The p l ant surveyed produces p i ck l es from cucumbers and o ther vegetables and discharges wastes which are high i n organic content (BOD), suspended sol ids, chlor ides and organic acids, causing a low pH. They are t rea ted i n aerated lagoons before discharge i n t o a small creek, a small t r i b u t a r y o f a reservoir . The treatment f a c i 1 i t i e s consi s t s o f 6.7 m i 1 1 i o n gal l on aerated lagoon, pa r t i t i oned by ba f f l es t o provide continuous f low i n ser ies through four equal ly s ized basins. A Hinde Air-Aqua system provides submerged aerat ion throughout the e n t i r e lagoon. The lagoon o r i g i n a l l y was designed w i t h a detent ion t ime o f s i x t y days f o r an e f f l u e n t f low estimated a t 1 00,000 gal /day.
E f f l uen t from the lagoon has had an adverse e f f e c t on stream water q u a l i t y i n the rece iv ing creek, according t o the North Carol ina State Board Water and Af r Resources, which has ordered the p lan t t o co r rec t the delete- r ious effect on the t r i bu ta r y . Spec i f ic areas o f concern inc lude BOD, suspended so l i ds and ch lo r ide loadings, i n add i t i on t o pH.
This prel iminary study o f the problem was undertaken as a special pro- j e c t by a c lass studying " I n d u s t r i a l Water Qua1 i t y Management ," a course i n the Department of Environmental Sciences and Engineering, the Un ive rs i t y of North Carol i na a t Chapel Hi 11.
EXISTING TREATMENT FACILITIES
A1 1 i n d u s t r i a l wastewater flows from the p lant , i nc lud ing those re1 ated d i r e c t l y t o preparat ion o f product, cool ing waters, cleanup f lows and storm runof f , are c o l l ected i n a s i ng1 e sewerage system f o r treatment and disposal . The combined f low i s screened f o r removal o f some o f the la rge suspended matter and cu r ren t l y i s subjected t o treatment i n an aerated lagoon before d i scharge.
The screening operation i s manual and has been observed dur ing p l an t v i s i t s t o be s u f f i c i e n t l y clogged t o permit overf low o f unscreened waste- water i n t o the aerated lagoon. Flow passing through the screen i s d is - charged i n t o the lagoon near one end o f the f i r s t "bay."
The aerated lagoon i s approximately 270 ft wide by 330 ft long, w i t h 10 ft water depth. It i s d iv ided i n t o 4 bays by 3 long i tud ina l t imber ba f f les , w i t h openings a t a l te rna te ends which permit passage of f l ow through them i n series, Condition of the f a c i l i t y suggests t h a t some o f the f low may sho r t - c i r cu i t through leaks i n the b a f f l e wal ls , bu t t h a t i s not viewed as a serious problem i n view o f the long detent ion period.
Total volume of the aerated lagoon i s about 6.7 mil 1 ion gallons, providing detention of 67 days a t the design flow of 100,000 gallday. Actual flows through the pl ant are substanti a1 ly higher than the design value, however, especially du r ing the fresh pack season and when there is runoff dur ing rainfal l . T h i s resul ts i n actual detention periods substantially lower than the design value.
Air supply i s provided by two 40 hp blowers, rated a t 595 cfm each. The a i r diffusion system is based on use of perforated p las t ic pipe (Hinde Air-Aqua system). Because some of the tubes are submerged i n bottom deposits and have clogged or i f ices , the a i r diffusion pattern throughout the basins i s somewhat irregular and the ra te of a i r application appears t o be too low, a t leas t by visual estimate.
Recently an additional f a c i l i t y was instal led t o permit metering of flow entering the aerated 1 agoon, neutralization w i t h sodium hydroxide o r ammonium hydroxide, and addition of nutrients. The Parshall flume, pH control equipment and nutrient addition f a c i l i t i e s were not i n operation dur ing these visits. The low elevation a t which the f a c i l i t i e s were i n - s ta l led , apparently, will require lowering the water level i n the aerated lagoon and reduce effective volume of tha t u n i t when operation of the new f a c i l i t y is in i t ia ted la ter .
A 1970 report of the North Carolina Department of Water and Air Re- sources indicated influent BOD val ues ranging from 700-5,000 mg/l , wi t h effluent BOD of 3100 mg/1. pH of the influent waste was 3.6-4.2 and pH i n various sections of the aerated lagoon varied from 3.4-4.1, leading t o a recomnendation tha t the waste be neutralized w i t h sodium hydroxide o r ammoni um hydroxide. Analyses f o r nutrients indicated presence of about one-half the recommended levels of nitrogen and phosphorus and addition of both nutrients on a regularly scheduled basis was recommended. The report indicated that the treatment f a c i l i t i e s were not performing as designed (84% BOD removal instead of 90%) because of low pH, nutrient deficiencies, h i g h chloride content, and inaccurate selection of design BOD load.
PURPOSE AND SCOPE
The class undertook a limited in-plant study of processes and prac- t i ces , and investigated biological treatabi l i t y of process wastes by aerated lagoon. The period of study was March-April , 1974. During th is "off season" major plant ac t iv i t i e s are repair and maintenance of brine tanks, the f i r m i n g process, processing and packing o f sweet and sour pickles, and re1 ish-making operations, a1 1 using pi ckles stored i n brine (brine stock). The volume and nature of wastewaters produced and the range of ac t iv i t i e s are substantially lower than i n the "green season, "
Four operating processes w i th in the p lant were i d e n t i f i e d as major sources o f wastewater. Grab samples were col lected and analyzed t o deter- mine waste constituents and attempts were made t o measure flows generated by each process. Plant practices were observed and suggestions offered for t h e i r modif ication t o reduce waste materi a1 s reaching the 1 agoon.
The t r e a t a b i l i t y studies focused on determination o f whether wastes w i th these characterists can and should be treated b io log ica l l y and, tc 1 i m i ted extent, under what conditions. Also, 1 aboratory studies ws?-ct 1- ducted t o determine which a1 k a l i would be most e f fec t ive i n neutra l iz ing the low pH p lan t ef f luent. Shock ef fects o f low pH and changes i n chlor ide levels on b io log ica l a c t i v i t y o f the organisms were examined through rcspi- ra t i on ra te studies. Of necessity, a l l o f these studies were conducted w i th in a l im i ted time frame.
IN-PLANT SURVEY
Objective
The objective of t h i s phase was ident i f i ca t ion of the many chemical and organic constituents of the wastewater and measurement of the volume o f wastewater contributed t o the lagoon by each o f four p lant operating areas : 1 ) the processing room where cucumbers are colored and f i rmed , where sweet pick1 ing i s accomplished and where r e l i s h i s chopped and pre- pared; 2) the manufacturing and packing area where pickles are s l i ced and where products are packed i n t o j a rs and capped; 3) the pasteurizing area where the sealed j a rs are pasteurized, labeled and packed f o r shipment; and 4) the tankyard.
Procedure
Since a a decision wa be compared.
l im i ted study had been done previously by a company engineer, IS made t o u t i l i z e the same sampling points so tha t data might
A sketch o f the drainage system i s shown i n Figure 1. The processing room sample point was a large, shallow, open manhole r rain 15B) on the h i l l overlooking the lagoon. Three tankyard drains also emptied i n t o t h i s manhole but the wastes could be dist inguished one from another due t o three separate and easi ly sampled discharge pipes w i th in the manhole.
Two sampling points were i d e n t i f i e d i n the manufacturing area. The waste co l lec t ion box a t the end of the dra in under Line 6 served as one sample point, co l lec t ing wastes from the capping 1 ines and the pickles being packed on Line 6. The second sampling point was the waste co l lec t ion box approximately 15 fee t below the confluence o f the drains serving Lines 3 and 5 and the sor t ing and cu t t ing area. I n the pasteurization area, samples were col lected from the dra in two fee t upstream from i t s discharge t o the waste co l lec t ion box.
Flow measurements were made w i t h a four-gallon bucket and stop watch. This method was not satisfactory f o r in-plant sampling due t o the condi- tion of the drains which d i d not permit a free flow in to the bucket. The large volumes of water discharged from the pasteurizing room a t Drain 15B also made measurement d i f f icu l t .
One n i g h t was spent observing the cleanup crew.
A few simple experiments were also carried out on a p i lo t s ize screen- ing device (hydrasieve) t o determine i t s applicabi l i ty for screening sol ids from the lagoon influent.
All chemical t e s t s on the samples collected were performed i n accor- dance w i t h the procedures out1 ined i n Standard Methods fo r the Examination of Water and Wastewater. The laboratory analyses were conducted by the U N C Wastewater Research Center.
Results
From a survey of the wastewater flows i t was found tha t the drainage system from the pasteurizing area also collected wastes from the concen- t rated brine and pi ckl i n g 1 iquor preparation area. The processing room drains direct ly t o the lagoon through a pipeline which also col lects storm runoff from the railroad yard and s a l t storage area. The manufacturing- packing area and the pasteurizing area drain t o a sewer running in front of the building, which also col lect wastes from the boilers and tankyard before emptying into the lagoon.
S i l t observed i n a l l tankyard drains and dur ing periods of heavy rain- f a l l i s carried to the lagoon. Several tankyard drains were completely clogged and had apparently been so fo r some time since storm runoff and tank drainage had worn deep r ivulets i n the h i l l s ide around and alongside the drains. The steep hi1 l sides around the lagoon are essent ial ly barren permi t t ing sediment t o be carried to the lagoon. S i l ta t ion i n the lagoon contributes t o the clogging of the a i r b u b b l i n g system and t o the need for dredging .
Screens were used on several of the inside drains i n an attempt to prevent 1 arge pick1 es and pieces of pickle from reachfng the lagoon. These screens were generally i n poor condition and often d i d not f i t properly. The basket screen a t the end of Lines 3 and 5 functions only d u r i n g periods o f h i g h f l ~ w . During periods of low flow the deteriorated condition of the drain l i p allows wastes t o run under the basket and direct ly to the sewer. The screens were generally observed to need cleaning. Several times em- pl oyees were observed removing the screens and flushing screened material s into the sewers.
The influent screen a t the lagoon was clogged w i t h screened materials on every v i s i t . Qn several occasions the effluent poured over the clogged
screen i n t o the lagoon car ry ing la rge pieces o f mater ia l w i t h it. Sol i d s removed from the screen were p i l e d on the ground t o one s ide where ra i n - f a l l overf low washed them d i r e c t l y i n t o the lagoon.
From observing the n i gh t s h i f t cleanup crew, i t was noted t h a t the poor condi t ion o f the f l o o r i n g i n the packing area hindered attempts t s sweep the f l o o r clean and necessitated the use o f add i t i ona l hosing t o re - move food p a r t i c l e s trapped between the b r i c ks i n the f l o o r . These food p a r t i c l e s were hosed t o the drains and subsequently i n t o the sewers. A t - tempts t o encourage p l an t personnel t o measure the volumes o f water used i n evening cleanup by reading the water meters were unsuccessful. Accor- d ingly, no data was co l lec ted on t h i s a c t i v i t y .
The ana l y t i ca l data and f low measurements are sunanarized i n Tables 1-5. A l l o f the wastes were ac id ic , w i t h pH general ly less than 4.0. The most ac i d i c wastes were generated i n the processing area and Line 6 o f the manufacturi ng-packi ng area.
Examination o f the combined pasteur iz ing , manufacturi ng-packi ng and b o i l e r room e f f l uen t s co l lec ted a t a manhole outs ide the bu i l d i ng show lower BOD, t o t a l sol ids, organic carbon and a c i d i t y presumably due t o d i l u- t ion. Chlorides and pH, however, remained subs tan t ia l l y unchanged, f o r which there cu r ren t l y i s no explanation.
Extremely simple pre l iminary t es t s on p l a n t wastes i nd i ca te a strong po ten t ia l f o r the reduct ion o f organic loading through the use o f a Hydra- sieve as seen from the reduct ion i n BOD and so l ids given i n Table 6,
Discussion
Experience dur ing t h i s l i m i t e d study ind icated t h a t the wastes do not 1 end themsel ves t o grab-sampl i ng o r unsophist icated f low measurements. There was h igh v a r i a b i l i t y i n both volume and nature o f the wastes dur ing t h i s two-month per iod o f the off-season. Re1 iance on averages and extrap- o l a t i o n o f data co l lec ted dur ing the off-season t o the "green season" i s both u n r e a l i s t i c and unrel iab le . A wel l -planned, organized study over an e n t i r e year of the manufacturing process and o f the wastes i t generates i s needed t o provide a comprehensive and rea l i s t i c analysis o f the volume and nature o f the wastewater involved and t o determine those areas o f the p l an t where i n -p l an t process changes and water conservation w i l l substan- t i a l l y reduce waste e f f l uen t . This study must be backed up by competent and f u l l laboratory analyses o f wastes so t h a t the best treatment methods may' be determined. Short cu t so lu t ions w i l l on ly r e s u l t i n cap i t a l expen- d i tures which offer l i t t l e o r no improvement. The age and operat ion o f t h i s processing p l a n t together w f t h va r iab le nature o f ta tes the services of a consu l t ing engineer t o develop t ion.
The volume o f wastes generated i n those processes b r ine concentration, the highest oxygen demand and the
93
i t s wastes necessi- a sa t i s f ac to r y sol u-
having the greatest lowest pH determine
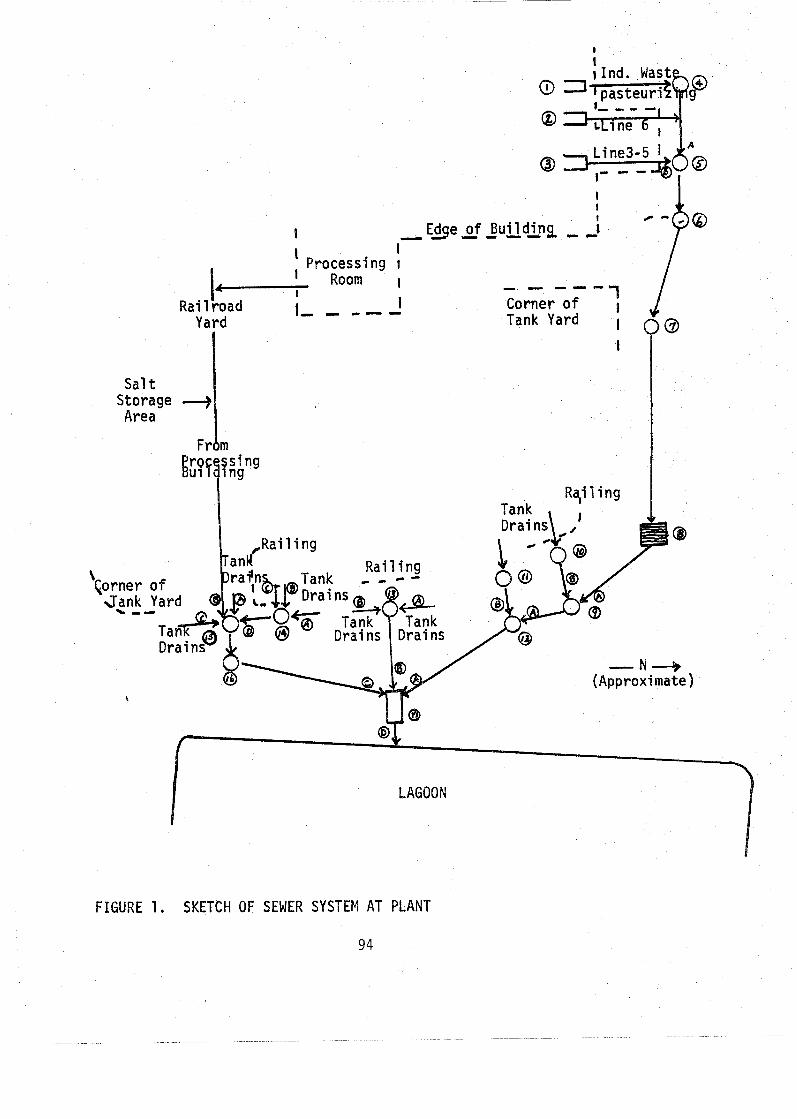
I I Ind. Wast
O 3-
FIGURE 1. SKETCH OF SEWER SYSTEM AT PLANT
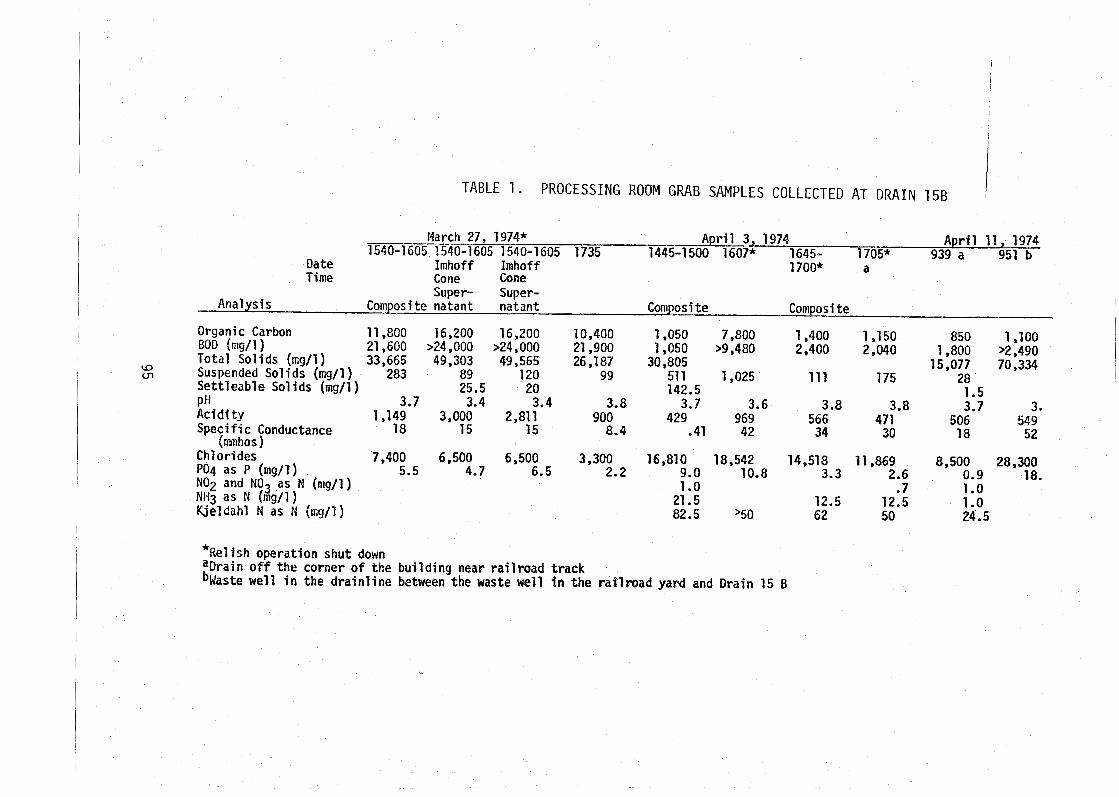
TABLE 1. PROCESSING ROOM GRAB SAMPLES COLLECTED A T DRAIN 15B
March 27, 1974* April 3, 1974 April 11, 1974 1540-1 605 1540-1 605 1540-1 605 1735 1445-1 500 1607* 1645- 1705* 939 a 951 b
Date Imhoff Imhoff Time
1700* Cone
a Cone Super- Super-
Analysis Compositenatant natant Composite Composi t e
Organic Carbon 11,800 16,200 16,200 10,400 1,050 7,800 1,400 1,150 BOD (mg/l) 21,600 >24,000 >24,000 21,900 1,050 >9,480 2,400 2,040 1,800 850 >2,490 1,100
u2 Total Solids (rr;g/l) 33,665 49,303 49,565 26 ,I 87 30,805 15,077 70,334
UI Suspended Sol i d s (mg/l ) 283 89 120 99 51 1 1,025 Set t leable Sol ids (mg/l ) 25.5 20 142.5 111 175 28 PH 3.7 3.4 3.4 3.8 1.5 Acidity 3.7 3.6 3.8 3.7 3. 900
3.8 429 1,149 3,000 2,811
18 15 15 969 566
8.4 471
.41 506
Specific Conductance 42 549
(;rinhos) 34 30 18 52 Chlorides 7,400 6,500 6,500 3,300 16,810 PO4 as P (mg/l) 5.5 4.7 6.5 2.2 9.0 NO2 and NO3 a s N (mg/l) 1 .o NH3 a s N (mg/l ) 21.5 U e f dahl N a s N irr;g/l) 82.5
* Relish operation shot down aDrai n o f f the corner of the bui 1 ding near ra i 1 road track b ~ a s t e well i n the dra in l ine between the waste well i n t h e rai l road yard and Drri n
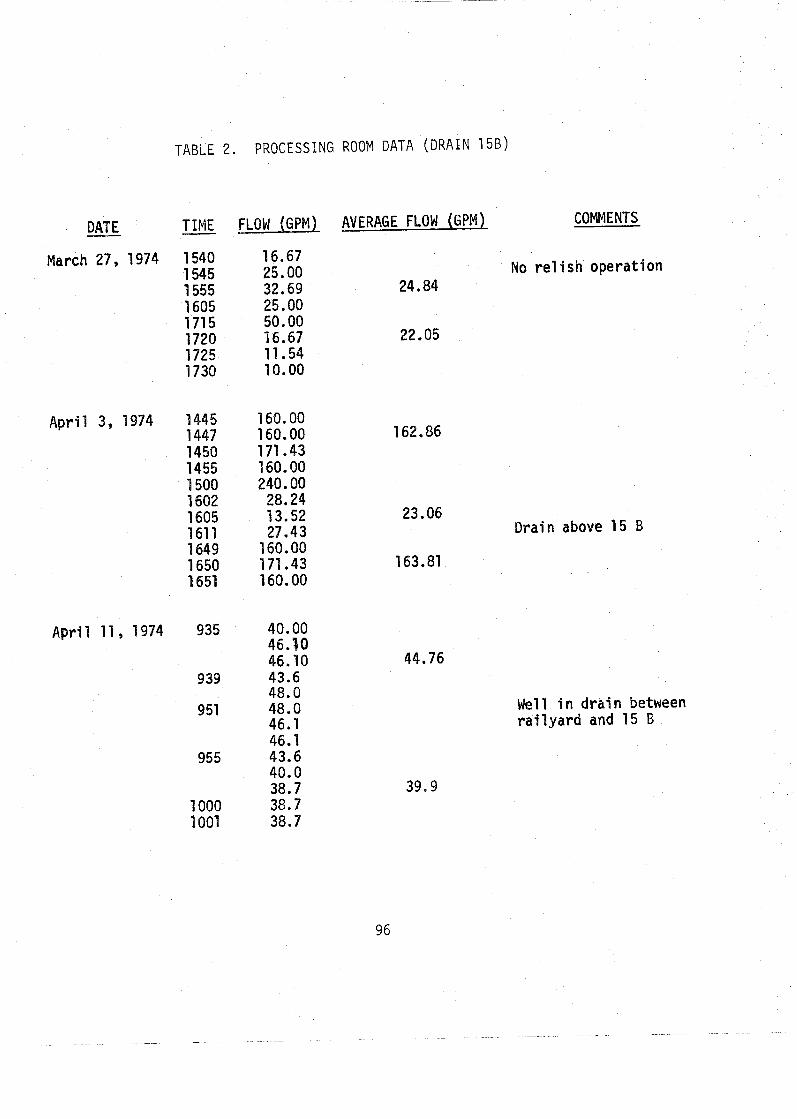
TABLE 2. PROCESSING
DATE - TIME - March 27, 1974 1540
1 545 1555 1605 171 5 1720 1925 1730
A p r i l 3, 1974 1445 1447
r i l 11,1974 935
FLOW (GPM)
16.67 25.00 32.69 25.00 50.08 16.67 11.54 10.00
168.00 160.00 171.43 160.00 240.00
28.24 13.52 27.43
160.00 171.43 160.00
40.00 46.10 46.10 43.6 48.0 48.0 46.1 46.1 43.6 40.0 38.7 38.7 38.7
ROOM DATA (DRAIN 15B)
COMMENTS
No re1 i s h operat ion
Drain above 15 B
Well i n d r a i n between r a i l y a r d and 15 B
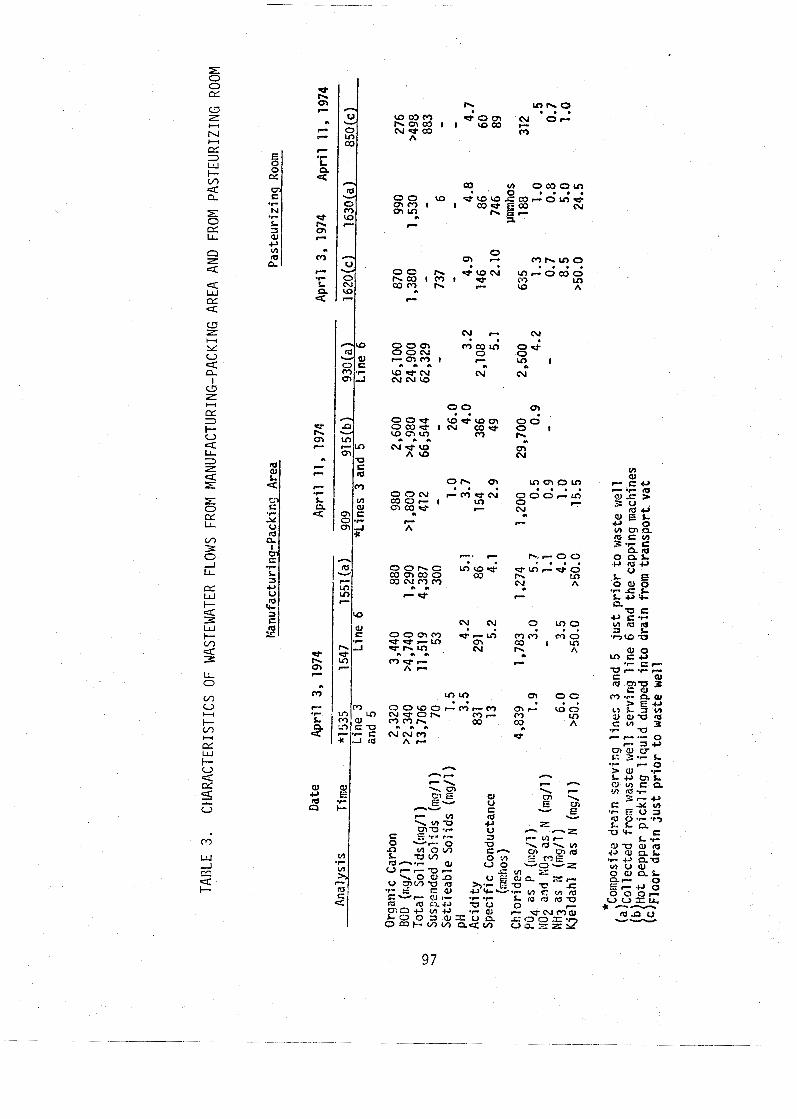
. . 000-i m a m O O N 0 T=?? ' C .)
m e w CUNIO CU
. . O O h O I n m e a m 0 3 0 aY a Na?m
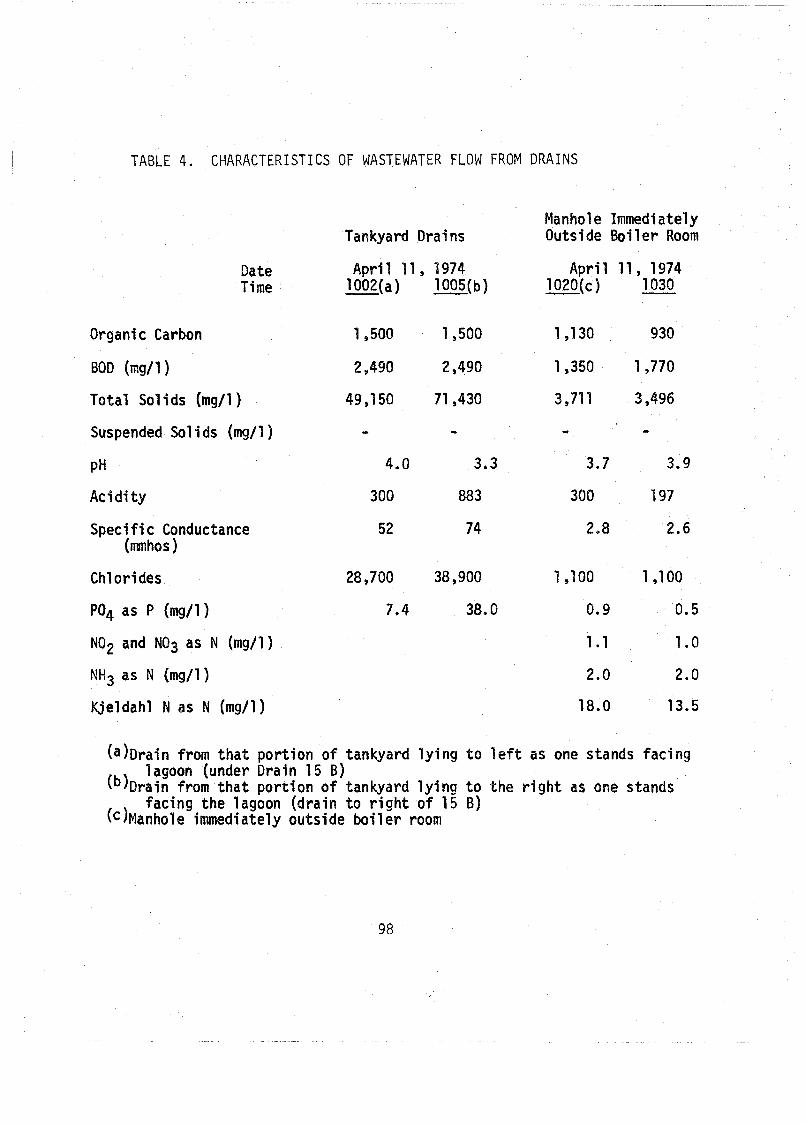
TABLE 4. CHARACTERISTICS OF WASTEWATER FLOW FROM DRAINS
Date T i me
Organi c Carbon
Suspended Sol i d s (mg/l )
P H
Ac id i t y
Speci f i c Conductance (mmhos )
Chlorides
PO4 as P (mg/l)
NO2 and NO3 as N (mg/l )
NH3 as N (mg/l)
KJeldahl N as N (mg/l)
Tankyard Drains
A p r i l 11, 1974 1002(a) 1005(b) -
Manhole Immediately Outside Bo i l e r Room
A ~ r i l 11 , 1974 1030 -
(a)Drafn from t h a t por t ion o f tankyard l y i n g t o l e f t as one stands fac ing lagoon (under Drain 15 B)
( b ) ~ r a i n from t h a t po r t i on o f tankyard l y i n g t o t h e r i g h t as one stands facing the lagoon (drain t o r i g h t o f 15 B)
( c )~anho le immediately outs ide bor l e r room
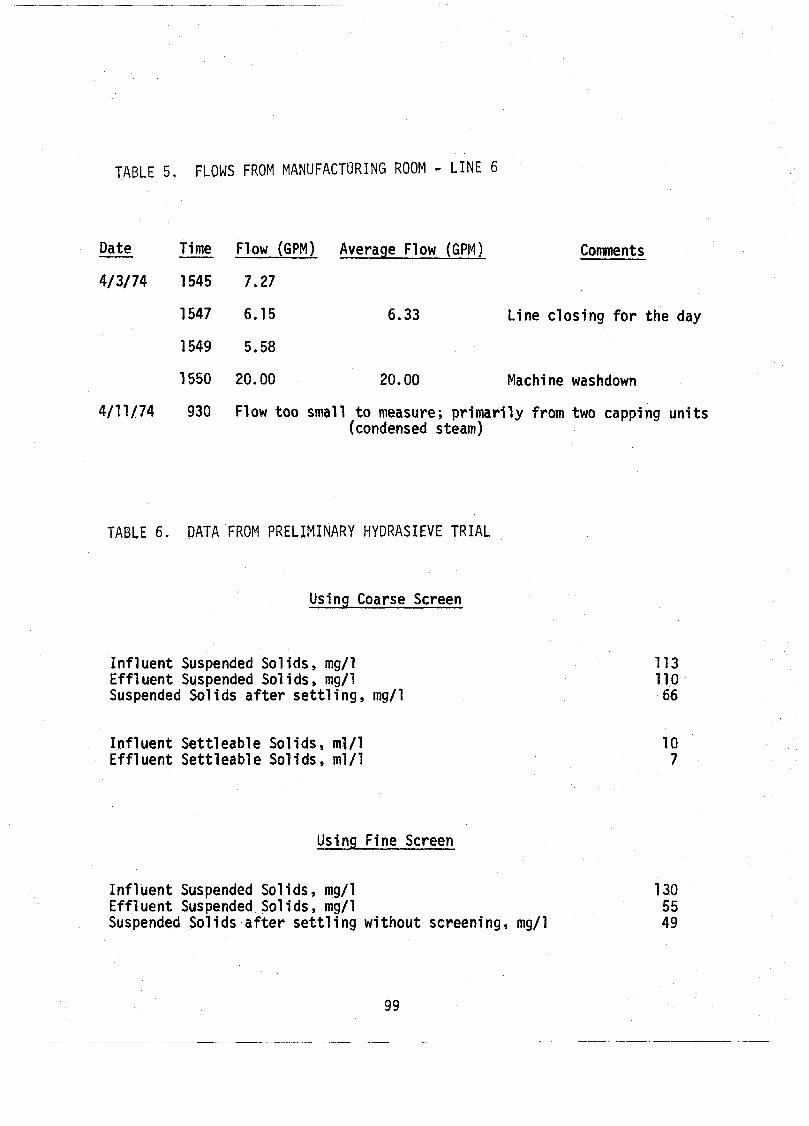
TABLE 5. FLOWS FROM MANUFACTURING ROOM - LINE 6
Date - - Time Flow (GPM) Average Flow (GPM) Comments
4/3/74 1545 7.27
1547 6.15 6.33 Line c los ing f o r t h e day
1549 5.58
1550 20.00 20.00 Machi ne was hdown
4/11/74 930 Flow too small t o measure; primari l y from two capping units (condensed steam)
TABLE 6. DATA FROM PRELIMINARY HYDRASIEVE TRIAL
Using Coarse Screen
Inf luent Suspended Sol i d s , mg/l Effl uent Suspended Sol i d s , mg/l Suspended Sol i d s a f t e r s e t t l i n g , mg/l
Inf luent S e t t l e a b l e Sol ids , ml/l Effluent S e t t l e a b l e So l ids , ml/l
Using Fine Screen
Inf 1 uent Suspended Sol i d s , mg/l Effluent Suspended Sol i ds , mg/l Suspended Sol i d s a f t e r s e t t l i n g without screening, mg/l
o f the wastes on the lagoon. Therefore, i t i s imperative t o acquire a close approximation o f the con t r ibu t ion o f each process t o the t o t a l lagoon ccpac i t y over the d i f f e r e n t "manufacturing seasons" o f the year. Monitoring o f water l i n e s t o each ind iv idua l process would provide informa- t i o n on how, where and when water i s used and, teamed w i t h good laboratory analyses o f wastes generated, would permit determining the impact of each process on the lagoon. Times o f po ten t ia l shock loading i n the lagoon could beccme apparent. Furthermore, t h i s informat ion would be useful i n determining those p lan t areas where water conservation could make substan- t i a l cont r ibut ions t o waste reduction.
Organic suspended sol i d s reaching the lagoon cause excessive oxygen demand and c r ~ . ? t e accumulations o f sludge which c log the a i r d i f fus ion system and may wxess i t a te occasional d ra in ing and dredging o f the lagoon. High sol i d s concentrations i n the wastewater from the manufacturing-packi ng area apparently or ig inated w i t h dra in ing o f the co lo r ing and f i rm ing vats, the wastewater from re1 i s h washings, the p rac t i ce o f dumping syrups 1 e f t i n vats a f t e r packi g the products and poor cleaning pract ices i n the manu- facturing-packi ng area. Control o f these wastes a1 one would g rea t l y reduce the volume o f organic mater ia ls reaching the lagoon.
From a s t z ~ d p o i n t o f oxygen deplet ion, a l l o f these wastes are impor- tant , The syrur wastes are espec ia l ly s i g n i f i c a n t due t o t h e i r excessively h igh oxygen dema ld ,
a t i o n o f a Hydrasieve on the lagoon i n f l u e n t would prevent many organic sol i d s not trapped by in -p lan t screening from reaching the lagoon. Organic wastes too f i n e t o be screened by p l an t f l o o r drains and p ick les and other vcgetaole products ca r r ied by tankyard drains t o the l a - goon could be e f f e c t i v e l e l trapped thereby reducing the oxygen-demand on the l agoon.
Recommendations
4 . Retain a consu l t i n j engineer. 2. Meter the water flow t o each process t o obta in accurate data on the
wastewater generated. 3. Reduce the so l ids reaching the lagoon i n p l an t wastes.
a ) I n i t i a t e equipment and f l o o r cleaning by ry sweep whenever possi- ble. This may requ i re c l o s i g manufacturing f o re the end o f the s h i f t an a l l factory 1 i the machines wf th hand brush
b ) El iminate hosing o f organic mater ia ls t o the f l o o r dra possible. I f hosing i s required for f i n a l cleanup, u t pressure, low f low hoses t o reduce volume o f wastewate but on ly a f te r d ry sweep.
c ) Repair f l oo r ing i n the so r t i ng and packing area so t ha t wastes m be swept up eas i l y and not trapped between b r i c ks requ i r ing use o f high-power hoses fo r f l ush ing and cleaning f loo rs .
d ) Repair f loor drains so tha t screens f i t t i g h t l y . e ) Establish a program for routine maintenance of a l l f loor drains,
screens and waste collection boxes. Provide adequate disposal fo r screenings and discourage practice of flushing screened materi a l s t o sewer.
f ) Eva1 uate the possi b i 1 i ty of screeni ng wastewater from the re1 i sh operation t o remove f ine pieces and the i r recovery.
g ) Pickles on the floor or platforms should be swept up and placed i n garbage barrels -- not flushed o r swept in to sewers or into the cracks around vats.
h) Exercise greater care i n removing by netting the cut pickles from the alum process into the transport vats.
i ) Establish routine maintenance for the influent screen a t the lagoon and provide regular and adequate removal of screened wastes.
4. Instal 1 a Hydrasieve for the screening of lagoon influent. 5. Control tankyard erosion. 6. Establish clear comuni cation between the decision-making off ices , the
1 aboratory and engineering and maintenance regarding pol i cies and imp1 ementati on of these recommendations.
7. Instruct plant personnel on the importance of a l l of these measures and why they must be accomplished.
BIOLOGICAL TREATABILITY STUDY
In attempting to determine the t r ea tab i l i ty of wastes from this plant, many variables should be examined thoroughly. The fac t tha t time available to th i s group f o r the study was rather limited required tha t some assumptions be made and tha t the group of factors studied be limited t o a few of the most important ones.
I t was assumed that before substantial improvement i n the treatment system can be made, three conditions must be corrected. These include 1 ) removal, prior to discharge in to the lagoon, of large organic sol ids i n the plant eff luent , 2 ) substantial increase in the volume of a i r supplied fo r
I aeration, and 3) possible addition of certain nutrients required by the microbial population of the treatment system b u t not available naturally i n t h i s wastewater i n optimum quantit ies. These changes are considered prerequisite t o proper treatment and were therefore incorporated into our study,
Once these conditions were eliminated o r corrected, the two most i m - portant variables remaining and the ones which distinguish pickle wastes from practically a l l other food processing wastes are the low pH and the h i g h chloride content. I t was f e l t tha t knowledge of the ef fec t of these factors on t r ea tab i l i ty would be most valuable i n improving future t r ea t - ment.
Therefore, three specif ic conditions were studied. They were (1 ) neutralization of plant eff luent to pH 7.0, ( 2 ) neutralization to pH 7.0 plus s l ight increase i n chloride conterd, ( 3 ) neutralization to pH 5.5. Compariss I of 1 w i t h 3 indicates the degree of neutral ization necessary while comparison of 1 w i t h 2 shows the e f fec t of increased chloride content. Should large scale water conservation measures be practiced i n the future without simi 1 a r decreases i n usage of s a l t , the chloride concentration of the l agoon could be expected t o r i s e s ignif icant ly above i t s present level.
The tyeatabi l i t y study was designed t o simulate treatment received i n the lagoon. This was accomplished by daily batch additions of plant eff luent , obtained from this plant and stored under refr igerat ion, t o a ser ies of aer'jted col umns.
The cy l inuvs simulated the f i r s t three stages of t h i s p lan t ' s aerated columns ranged i n height from 26-35 inches and i n diameter
inches. Several of these had conical bottoms while the a t bottomed. These minor variations i n contour and d i -
mensions should not have influenced the experiment. Each column had a tap on the side fo r removal of samples for t ransfer and analysis. No attempt was made t o s i ~ u l a t e existing a i r supply conditions or t o determine optimum a i r requirements. Instead we attempted o maintain the a i r supply a t a level such t h i P there would be no eonce i t s adequacy. Air supply to indivs'dual cf d~mns was from a co Originally, diffusers were used for aeration. After several da e were replaced w i t h large opening pipettes since the a i r flow was i te . Air supply was regu- lated by screw cl
The units were arranged i n three numbered s e t s , each of which had three columns i n serqies ("A," " B , ' h n d "C"), Each column contained 3 l i t e r s . The "A" ( f i r s t unit of ~ 3 c h s e t of three) columns were begun w i t h a see
nd e , ~ " l u e n t , effluent from the trick1 i n g f i l t e r a t t t Plant and Morgan Creek water. The other columns
m l (111 5 ~f the column volume were removed from the "A" columns a to the "B" columns u n t i l the "8" columns reached 3 l i t e r s . After t h ed t o "6" an from "A" t o "B". @
influent collected 3 time were mixed together for the ing would necessarily be pro weave gauze which removed the l a sol ids ,
Losses due t o evap~ra t ion were made u p daily. Transfers and feeding of the columns were made dai ly , The pH of the col umns was recorded daily as a simple monitoring t e s t . M re extensive analyses were done less fre- quently.
Each s e t of columns was operated under different conditions. G 1 was closest to common treatment procedure i n that the sample was ne
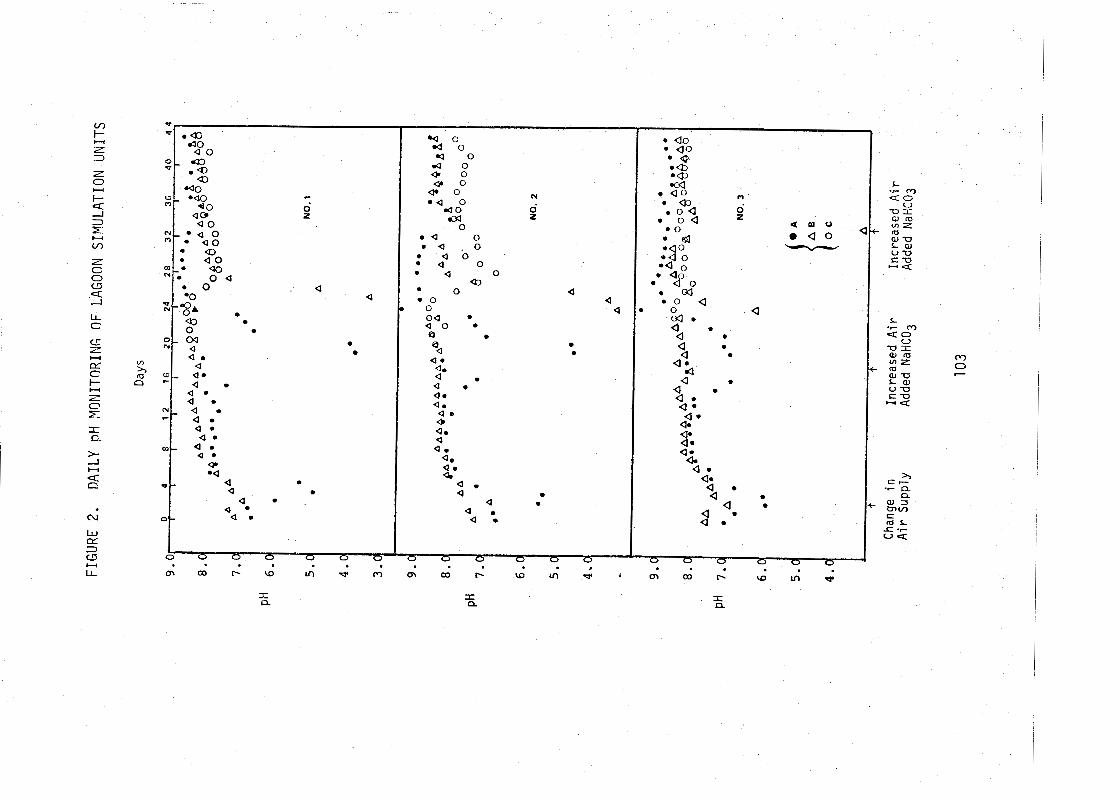
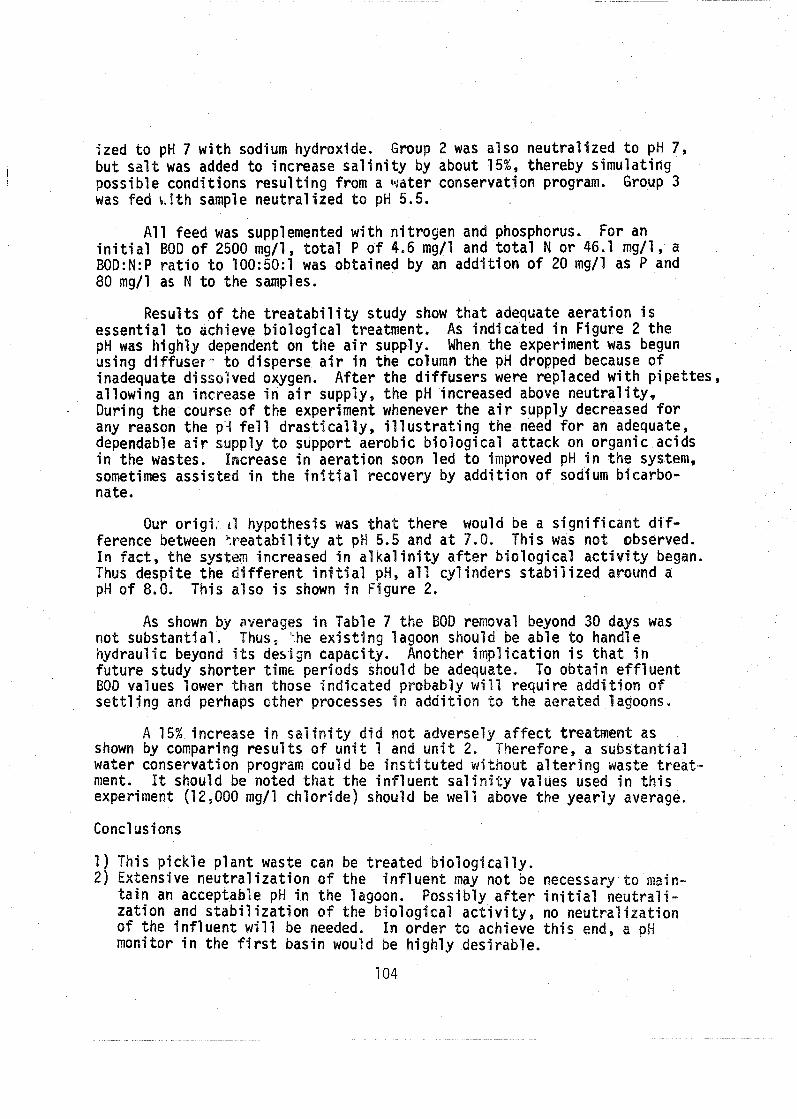
i zed t o pH 7 w i t h sodium hydroxide. Group 2 was a1 so neut ra l ized t o pH 7, but s a l t was added t o increase s a l i n i t y by about 15%, thereby s imulat ing possib le condit ions r e s u l t i n g from a bidter conservation program, Group 3 was fed ~ i t h sample neut ra l ized t o pH 5.5.
A l l feed was supplemented w i t h n i t rogen and phosphorus. For an i n i t i a l BOD o f 2500 mg/l, t o t a l P o f 4.6 mg/l and t o t a l N o r 46.1 mg/l, a 5OD:N:P r a t i o t o 100:50:1 was obtained by an add i t i on o f 20 mg/l as P and 80 mg/l as N t o the samples.
Results o f the t r e a t a b i l i t y study show t h a t adequate aerat ion i s essent ia l t o achieve b io log ica l treatment. As ind icated i n Figure 2 the pH was h igh ly dependent on the a i r supply. When the experiment was begun using d i f fuser - t o disperse a i r i n the column the pH dropped because o f inadequate dissolved oxygen. A f t e r the d i f f use rs were replaced w i t h p ipet tes , a l lowing an i n c r ase i n a i r supply, the pH increased above neu t ra l i t y , During the course o f the experiment whenever the a i r supply decreased f o r any reason the p4 f e l l d ras t i ca l l y , i l l u s t r a t i n g the need f o r an adequate, dependable a i r su p l y t o support aerobic b i o l og i ca l a t tack on organic acids i n the wastes. I crease i n aerat ion soon l e d t o improved pH i n the system, sometimes assisted i n the i n i t i a l recovery by add i t i on o f sodium bicarbo- nate.
Our o r i g i : a1 hypothesis was t ha t there would be a s i g n i f i c a n t d i f - ference between "ea tab i l i t y a t pH 5.5 and a t 7.0. This was no t observed. I n fac t , the sys m increased i n a l k a l i n i t y a f e r b io log ica l a c t i v i t y began. Thus despite the i f f e r e n t i n i t i a l pH, a l l cy l inders s t a b i l i z e d around a pH o f 8.0. This a lso i s shown i n Figure 2,
As shown by i, ages i n Table 7 the BOD removal beyond 30 days was not substant ia l . T "he e x i s t i n g lagoon shoul be able t o handle hydraul i c beyond i t s dest gn capacity. Another i m i c a t i o n i s t h a t i n fu tu re study shorter t i m ~ periods should be adequ e. To obta in ef f luent BOD values lower than those ind icated probably w i l l r equ i re add i t ron o f s e t t l i n g and perhaps other processes i n add i t i on t o the aerated lagoons.
A 15% increase i n s a l i n i t y d i d not adversely a f f e c t treatment as shown by comparing r e s u l t s o f u n i t 1 and u n i t 2. Therefore, a substant ia l water conservation program could be i n s t i t u t e d out a l t e r i n g waste t r e a t - ment. It should be noted t h a t the i n f l uen t sal values used i n t h i s experiment (12,000 mg/l ch lo r jde ) should be we1 ve the year1 y average.
Concl us i ons
1 ) This p i c k l e p lan t waste can be t r ea te b i o l og i ca l l y . 2 ) Extensive neu t ra l i za t i on o f the i n f l u e n t may not be necessary t o main-
t a i n an acceptable pH i n the l a g on. Possibly a f t e r i n i t i a l neu t ra l i - za t ion and s t a b i l i z a t i o n o f the i s l o g i c a l a c t i v i t y , no neutral i z a t i o n o f the i n f l u e n t w i l l be needed. I n order t o achieve t h i s en monitor i n the f i r s t basin would be h igh ly desirable.
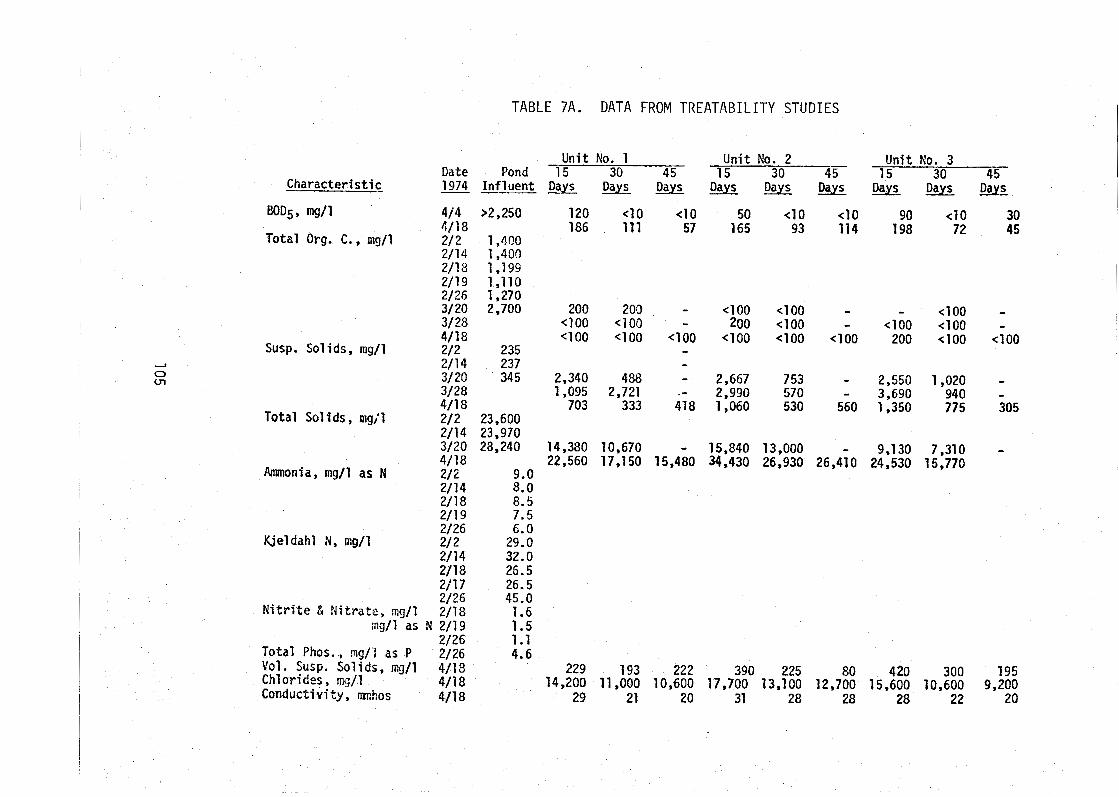
Characteristic
BODS, mg/1
Total Org. C., mg/l
Susp. Sol ids , mg/l .-.I
0 cn
Total Solids, mg;l
TABLE 7A. DATA FROM T R E A T A B I L I T Y STUDIES
Unit No. 1 Unit No. 2 Unit KO. 3 Date Pond 15 30 4 5 15 30 4 5 15 30 45 1 9 7 4 I n f l u e n t D a y s Days Days Days Days Days Days -
Nitrite & Nitrate, ng/l 2/18 i ~ g / l a s N 2/19
2/26 Total Phos. , mg/l as P 2/26 Vol. Susp. Sol ids, m3/1 4/18 Chlorides, mg/l 4/18 Conductivity, mhos 4/18
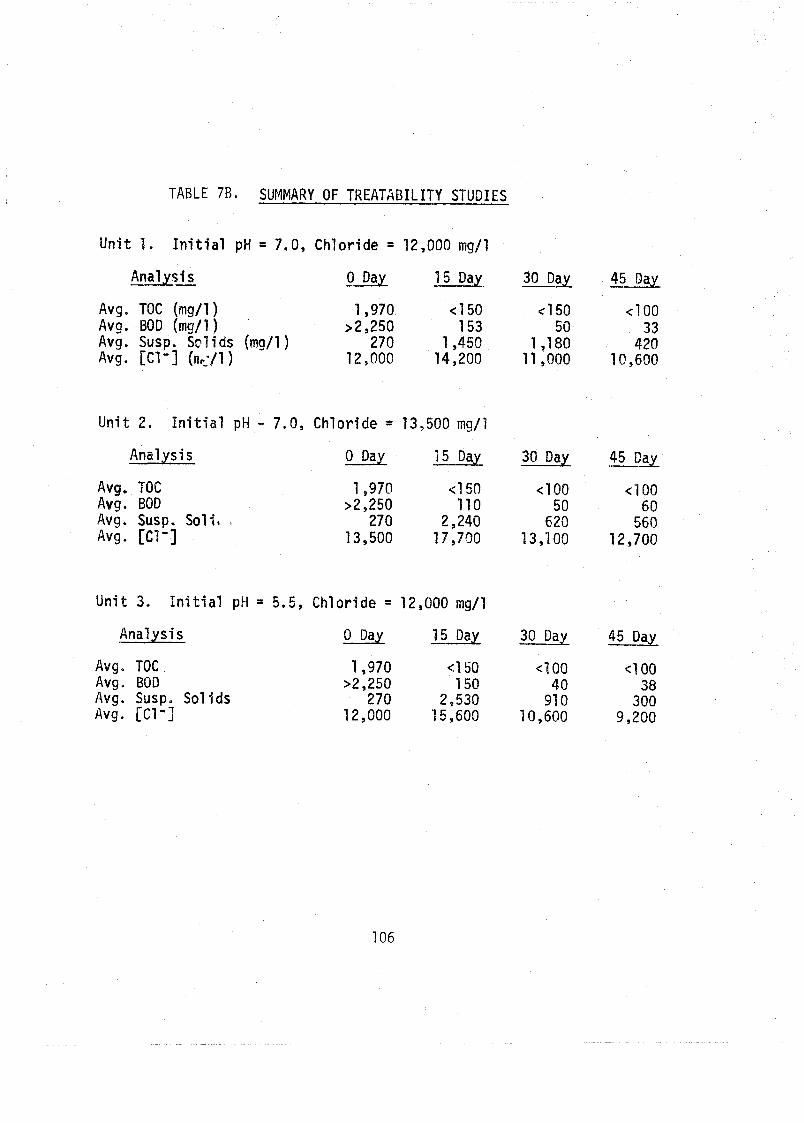
TABLE 7B. SUMMARY OF TREATABIL ITY STUD1 ES
U n i t 1. I n i t i a l pH = 7.0, Chlor ide = 12,000 mg/l
Analys is 0 Day 15 Day 30 Day 45 Day
Avg. TOC (mg/l) 1,970 e l 5 0 e l 50 < l o 0 Avg . BOD (mg/1) >2,250 153 5 0 33 Avg. Susp. Sol ids (mg/l ) 270 1,450 1,180 420 Avg. LC1 '1 (n,c/ 1 ) 12,000 14,200 11,000 10,600
U n i t 2. I n i t i a l pH - 7.0, Ch lor ide = 13,500 mg/l
Analysis 0 Day 15 Day 30 Day 45 Day
Avg. TOC 1,970 < I 50 e l 00 e l 00 Avg. BOD >2,250 110 50 60 Avg. Susp. Sol i t , 270 2,240 620 560 Avg. [Cl"] 13,500 17,790 13,100 12,700
U n i t 3. I n i t i a l pH = 5.5, Ch lor ide = 12,000 mg/l
Analys is 0 Day 15 Day 30 Day 45 Day
Avg. TOC 1,970 4 50 <I 00 <I 00 Avg. BOD >2,250 150 40 38 Avg. Susp. So l i ds 2 70 2,530 91 0 300 Avg. [Cl'] 12,000 15,600 10,600 9,200
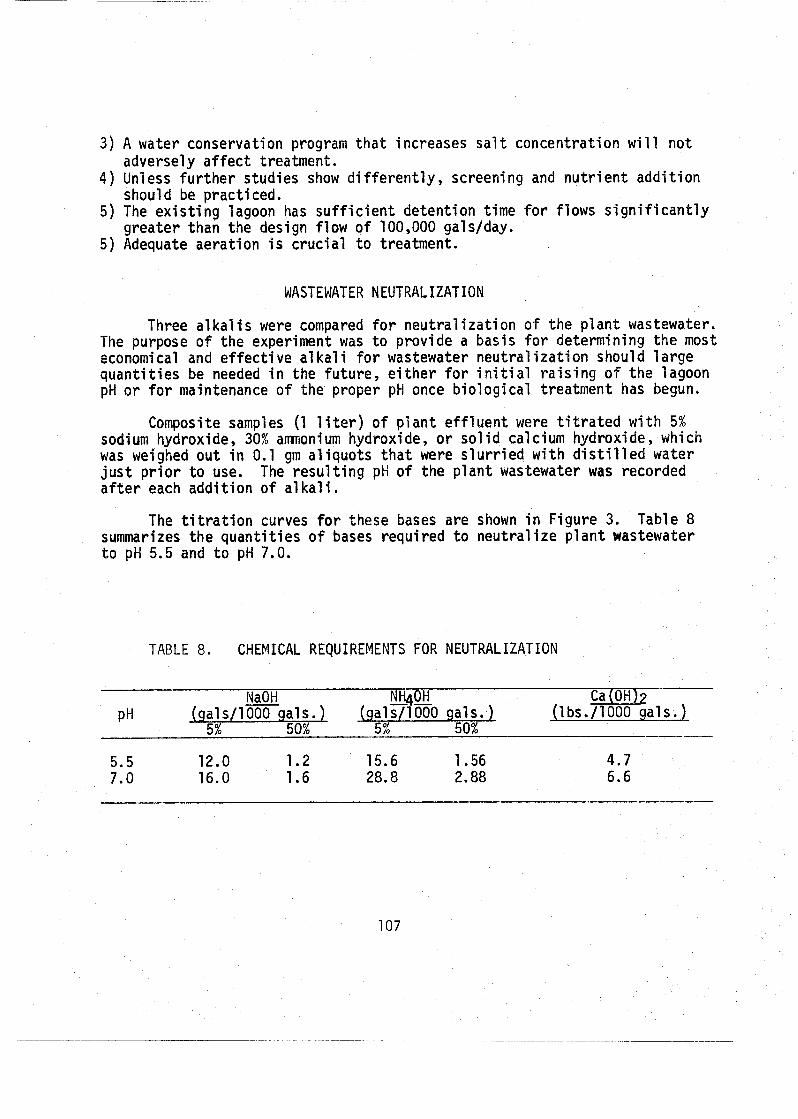
3) A water conservation program tha t increases s a l t concentrat ion w i l l no t adversely a f f e c t treatment.
4 ) Unless f u r t h e r studies show d i f f e r e n t l y , screening and n u t r i e n t add i t i on should be p r a c t i ced.
5) The e x i s t i n g lagoon has s u f f i c i e n t detent ion t ime f o r f lows s i g n i f i c a n t l y greater than the design f low o f 100,000 galslday.
5) Adequate aerat ion i s c ruc i a l t o treatment.
WASTEWATER NEUTRALIZATION
Three a l k a l i s were compared f o r neu t ra l i za t ion o f the p l an t wastewater. The purpose o f the experiment was t o provide a basis f o r determining the most economical and e f fec t i ve a1 kal i f o r wastewater neutral i z a t i o n should l a rge quan t i t i es be needed i n the fu ture , e i t h e r f o r i n i t i a l r a i s i n g o f the lagoon pH o r f o r maintenance o f the proper pH once b io log ica l treatment has begun.
Composite samples (1 1 i t e r ) o f p l an t e f f l u e n t were ti t r a t e d w i t h 5% sodium hydroxide, 30% amoni um hydroxide, o r sol i d calcium hydroxide, which was weighed out i n 0.1 gm a l iquo ts t h a t were s l u r r i e d w i t h d i s t i l l e d water j u s t p r i o r t o use. The r e s u l t i n g pH o f the p l an t wastewater was recorded a f t e r each add i t i on o f a1 kal i .
The t i t r a t i o n curves f o r these bases are shown i n Figure 3. Table 8 summarizes the quan t i t i es o f bases required t o neutral i z e p l a n t wastewater t o pH 5.5 and t o pH 7.0.
TABLE 8. CHEMICAL REQUIREMENTS FOR NEUTRALIZATION
NaOH NHlqOH Ca (OH)? PH (gal s / l m g a l s. ) ( ga l s / lm0 gals. ) (lbs./1000 gals.)
5% 50% 5 % 50% -----
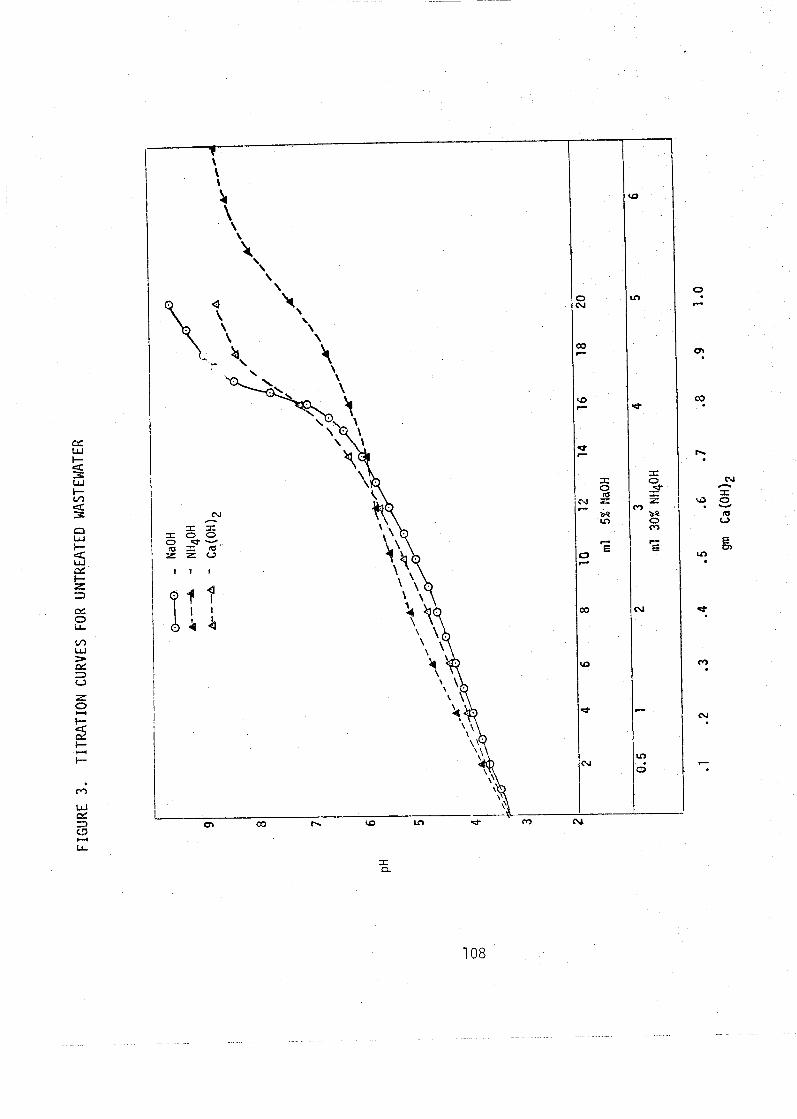
It should be noted t h a t the above f igures are i n gals/1000 ga ls f o r sodi um and amnonium hydroxide, but are i n l bs /I000 gals f o r calcium ky- droxide. A v a i l a b i l i t y and cost, i n add i t i on t o o ther fac tors , should be considered before se lec t ing the a l k a l i t o use. For example, eutrophic e f f ec t s of ammonium on the rece iv ing stream, and even the reser- vo i r , must be evaluated c a r e f u l l y before using t ha t base f o r neut ra l iza- t i on .
Concl usions and Recommendations
I f avai 1 able l o c a l l y a t a competi t ive p r i ce , sodium hydroxide appears t o be the chemical of choice because of a v a i l a b i l i t y o f storage and feed f a c i l i t i e s a t the s i t e , ease o f hand1 i ng , and minimum p r e c i p i t a t e production.
onium hydroxide should not be added i n excess o f n u t r i e n t requ i re- ments, i f any, because o f po ten t ia l downstream eut roph icat ion problems. pH should be monitored i n the aerat ion basin, ra ther than on ly i n untreated i n f l uen t waste, t o insure adequate cont ro l f o r the b to l og i ca l treatment process.
RESPIRATION RATE STUDY
Because o f the great v a r i a b i l i t y i n f lows and wastes charac te r i s t i cs , i t was important t o consider the e f f ec t s o f shock loads upon the b i o l og i ca l system. Two types o f shocks were considered i n t h i s study: low pH and changing s a l t concentrations.
Effects upon b io log ica l a c t i v i t y were noted by changes i n the resp i ra - t i o n r a t e of the m i croorganisms. The procedure followed was i n accordance w i t h a technique developed ea r l i e r , which has been reproduced i n the Appendix. A b r i e f o u t l i n e of the procedure fol lows.
Mixed l iquor (Mh) from several o f the p i l o t lagoon u n i t s was mixed and aerated f o r two days wi thout feeding t o a l low s u f f i c i e n t t ime f o r com- p l e te u t i l i z a t i o n o f r e a d i l y oxid ized mater ia l . A t t h a t po in t , the endog- enous phase of microbial growth had been reached and oxygen uptake was a t a minimum (endogenous ra te) . When mater ia l t ha t can be u t i l i r e d by the organisms i s added t o a b i o l og i ca l system i n t h a t condit ion, an increased r a t e o f oxygen uptake ( resp i ra t ion ) i s observed. No increase i n resp i ra- t i o n ind icates t h a t the mater ia l added i s not u t i l i z e d . A decrease i n the resp i ra t ion r a t e ind icates a t o x i c e f fec t .
The dissolved oxygen (DO) was measured w i t h a Weston-Stack DO meter using a probe tapered t o f i t i n t o a BOD b o t t l e . A stop watch was used t o measure 1 minute i n t e r va l s a t which t ime DO was recorded. When DO was p l o t t ed against time, a s t r a i g h t l i n e was obtained, the slope o f which gave the resp i r a t i on r a t e which was compared w i t h the endogenous ra te . Since the r a t e of oxygen uptake depends upon the number o f organisms pre- sent, the resp i r a t i on r a t e was ca lcu la ted as mg/l o f oxygen used per minute
s, The suspen Hn t h i s way
Figure 4 a lso shows e f f ec t s o f changing the ty. While increasing he s a l t concentrat ion d i d reduce the resp i r a t i on i t remained ab
te . Decreasing % e s a l i n i t y by h d nei ther a f e c t upon biologd a l a c t i v i t y . A i t i s import
note t h a t t h i s study shows acute e f f ec t s due t o shock loads a t e r n e f fec ts , which may be e i t h e r more o r less serious under various circum- stances.
Conclusions
The microorganisms are very r es i s t an t t o low pH shock loads. Wastes should be neutral ized t o maintain general ly des i rab le pH throughout the system and acceptable e f f l u e n t pH, wi thout major concern about shock loadings o f shor t durat ion. Increased s a l i n i t y does not have a g rea t l y detr imental e f f e c t i n i t i a l l y . Although f u r t h e r study on long term e f f ec t s i s necessary, water con- . servat ion programs should not be delayed f o r fea r of harmful e f f ec t s t o the aerated lagoon by the r e s u l t i n g increased s a l i n i t y .
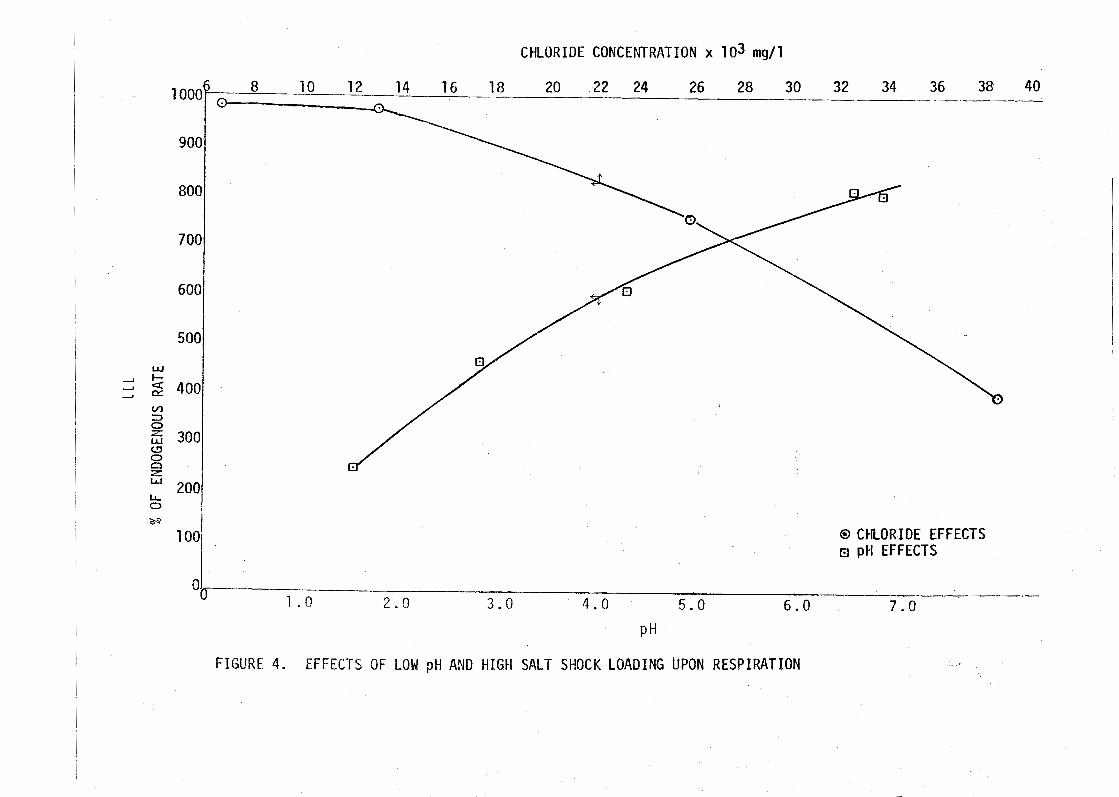
CHLORIDE CONCENTRATION x 1 0 3 mg/l
@ CHLORIDE EFFECTS o p H EFFECTS
FIGURE 4. EFFECTS OF LOW pH AND HIGH SALT SHOCK LOADING UPON RESPIRATION
Concl us i ons
The microorganisms are very res i s tan t t o low pH shock loads. Wastes shouPd be neutral imed to maintain generally desirable pH throughout the system and acceptable effluent pH, without m a j ~ r concern about shock loadings of short duration. Increased sal ini t y does not have a greatly detrimental e f fec t I n i t i a l ly. Although fur ther study on long term ef fec ts i s necessary, water conser-
ograms should not be delayed f o r fear of harmful e f fec ts t o ed lagoon by the resulting increased sa l in i ty .
S U W R Y OF CONCLUSIONS AND RECOMMENDATIONS
engineer should be retained and detailed stud1 es continued, o each manufacturing process should be metered. i d s should be reduced by pairing floors and othe cleanup procedures, imp i ng ma1 ntenance of screens, and
ecoveri ng suspended matt from the re1 ish operatio ens should be instal led the lasoon influent and
ines established, tankyard area shoul
iologically. l agoon.
APPENDIX B
COST OF PICKLE BRINE RECOVERY
by
F o r e s t 0. M i x o n , R e s e a r c h T r i a n g l e I n s t i t u t e
Based upon a conceptual model of pickle manufacture that delineates waste streams, their rates, and their concentrations, costs have been estimated for several processes for scclt concentration and for organic removal.
Based upon these estimates, reverse osmosis, butane freezing, d is t i l la t ion, and submerged combustion evaporation are most economical for sa l t concentration; biological orcidation i s more economical for organic removal.
OUTLINE
1.0 A CONCEPTUAL MODEL OF PICKLE MANUFACTURE
1 . I TANK-YARD PROCESSES 1 . 2 PROCESSING ROOM PROCEDURES 1.3 BRINE CONCENTRATING REQUIREMENTS
2.0 METHOD OF COST ESTIMATION
2.1 CAPITAL COST ESTIMATION 2.2 OPERATING COST ESTIMATION
3.0 COST ESTIMATES FOR BRINE CONCENTRATION
4 .0 COST ESTIMATES FOR ORGANIC REMOVAL
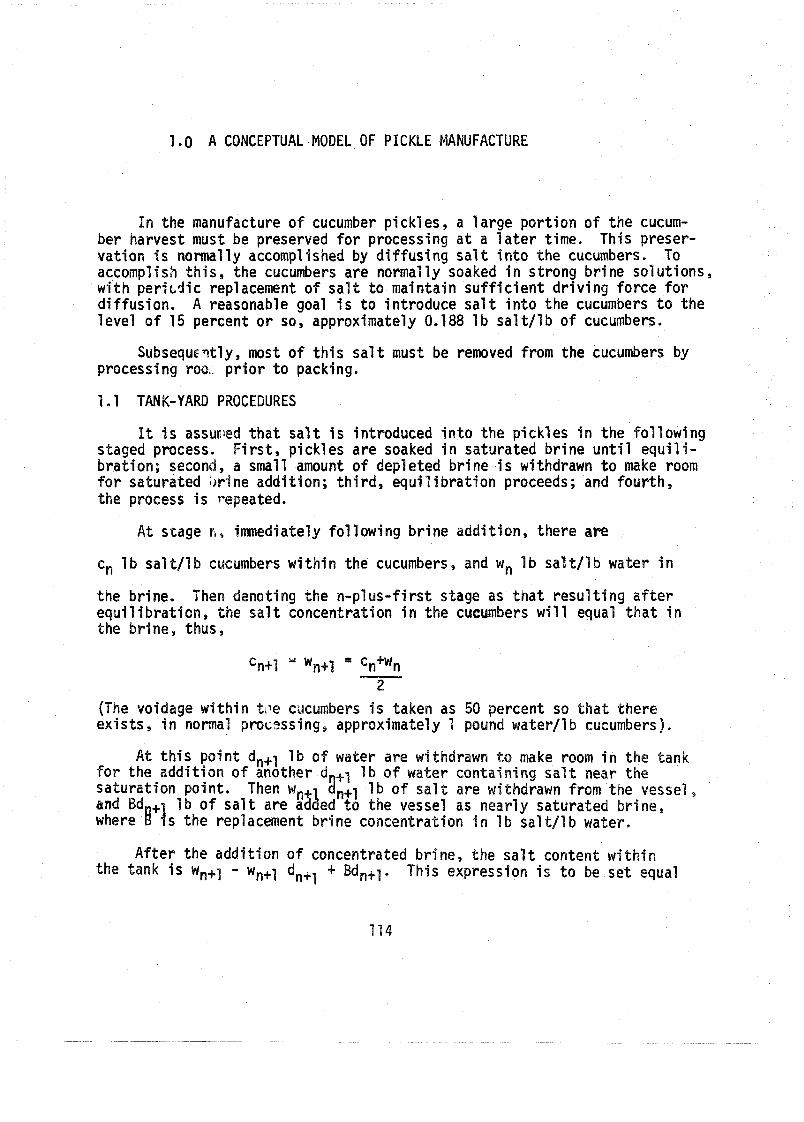
1,0 A CONCEPTUAL MODEL OF PICKLE MANUFACTURE
I n the manufacture o f cucumber p ick les , a 1 arge po r t i on o f the cucum- ber harvest must be preserved f o r processing a t a l a t e r time. This preser- vat ion i s normally accomplished by d i f f u s i n g s a l t i n t o the cucumbers. To accomplish t h i s , the cucumbers are normally soaked i n strong b r ine so lu t ions, w i t h per i cd ic replacement o f s a l t t o maintain s u f f i c i e n t d r i v i n g force f o r d i f fus ion. A reasonable goal i s t o introduce s a l t i n t o the cucumbers t o the leve l o f 15 percent o r so, approximately 0.188 1 b sal t/l b of cucumbers.
Subsequ~stly, most o f t h i s s a l t must be removed from the cucumbers by processi ng r o - p r i o r t o packing.
1.1 TANK-YARD PROCEDURES
It i s assaro.ied t h a t s a l t i s introduced i n t o the p ick les i n the fo l low ing staged process. F i r s t , p i ck les are soaked i n saturated b r ine u n t i l e q u i l i - b ra t ion; secon a small amount o f depleted b r ine i s withdrawn t o make room f o r saturated b r ine addi t ion; t h i r d , equ i l i b ra t i on proceeds; and four th , the process i s r
A t stage L , immediately fo l l ow ing b r i ne addi t lon, there are
cn I b s a l t / % b cu mbers w i t h i n the cucumbers, and wn I b sal t/l b water i n
the brine. Then not ing the n -p l us - f i r s t stage as t h a t r e s u l t i n g a f t e r equi l i brat ion, t s a l t concentrat ion i n the cueumbers wi1 l equal t h a t i n the br ine, thus,
(The vo ex is ts I
A t
idage w i t h i n tne cucumbers i s taken as 50 percent so t h a t there i n normal p m c s s l n g , approximately 1 pound water f l b cucumbers).
t h i s po in t dntl l b o f water are withdrawn t o make room i n t f o r the add i t i on o f anothe +I l b of water contai i n g s a l t near the saturat ion point . Then w, n+l I b of s a l t are withdrawn from the vessel ,
I b o f s a l t are a t o the vessel as near ly saturated br ine, s the replacement b r ine concentrat ion i I b s a l t / l b water.
A f t e r the add i t i on o f concentrated br ine, the s a l t content w i t h i n the tank i s wn+l - wn,l dn,l + Bdn+l. This expression i s t o be set eq
114
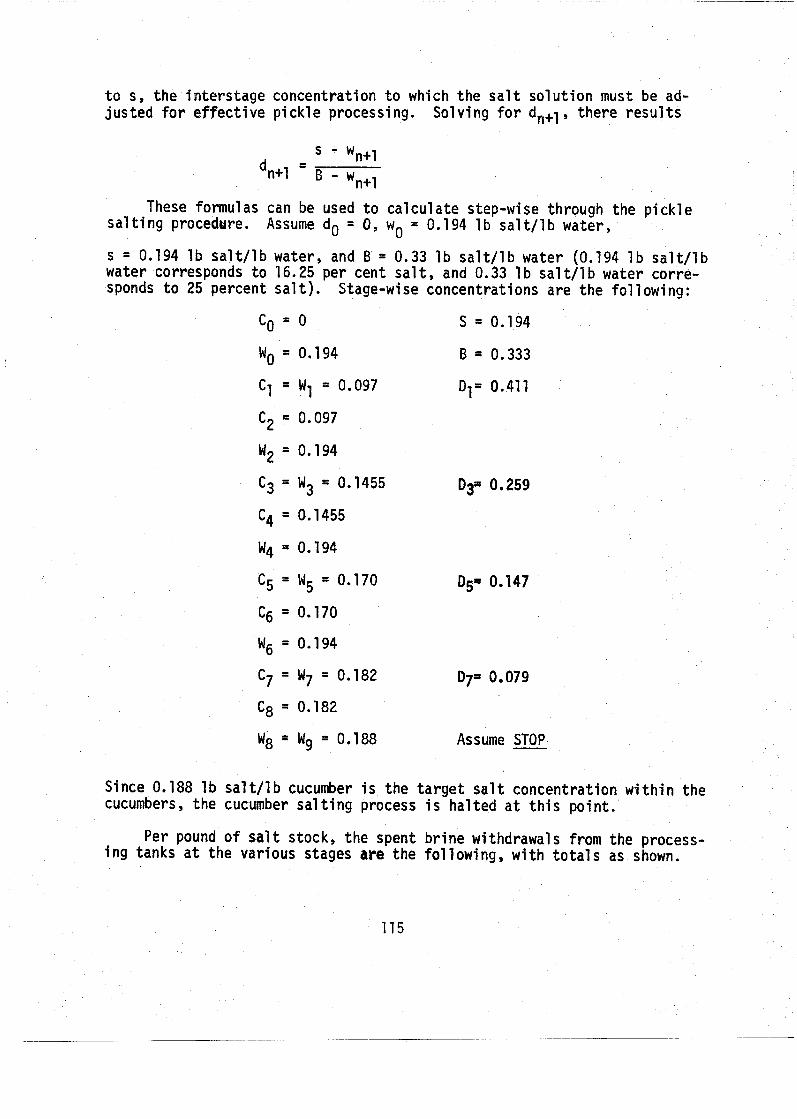
t o s , the interstage concentration t o which the s a l t solution mus t be ad- justed fo r effective pickle processing. Solving fo r dn+l, there resul t s
These formulas can be used t o calculate step-wise through the pickle sal ti ng procedure. Assume do = 0, wo = 0.194 lb s a l t l l b water,
s = 0.194 lb salt11 b water, and B = 0.33 l b sal t / l b water (0.194 1 b sal t / l b water corresponds t o 16.25 per cent s a l t , and 0.33 I b sal t / l b water corre- sponds t o 25 percent s a l t ) . Stage-wise concentrations are the fol 1 owing:
Co = 0 S = 0.194
w8 = W, = 0.188 Assume STOP
Since 0.188 l b sal t / l b cucumber i s the target s a l t concentration w i t h i n the cucumbers, the cucumber sal t ing process i s halted a t th i s po in t .
Per pound of s a l t stock, the spent brine withdrawals from the process- i n g tanks a t the various stages are the following, with to ta l s as shown.
Per pound s f s a l t s tock, ge t t he following:
0.411 1b H20 0.0399 1 b s a l t
@ 0.259 1 b H20 0.0377 1 b s a l t
0.147 l b H20 0.0250 I b s a l t
0.079 I b H20 0.0144 l b s a l t
With Totals 0.896 I b H20 0.177 1b s a l t
+ 1.00 l b stock 0.188 1b s a l t
0.493 1b s a l t
T h u s , per pound of cucumbers, the draw-down from the tanks i s 0,896 1 b water csntaining 0.177 l b s a l t o r 0,131 Ib s a l t / l b water. In addi t ion, there is 1-lb water remaining i n the tank containing 0.188 1 b s a l t .
ming t h a t 500,000 bushels of cucumbers a r e processed i n 180 days g down season, and assum ng furthermore 9 gal/bushe b/gal, the estimated wei mbers is 18 x 10 /I b cucumber, the water n 16.1 mill ion 1 t e l y 19.4 thousand
concentration i s 0.131 I b s t / l b water, w h i c h correspon s a l t . This stream I s t o concentrated t o 0.33 1 b sa
t. Consequently, the f rac t ion = 60.7 7.63
a t e r must be removed i n e ect ing this separation. T nk yard brines I s 1.21 x 10⁶
The f i na l brine solution from s a r e withdrawn f o r recessing contains 0. 188 1 b s a l t / ine i s suf f ic ien t ly
concentrated that. i t needs no fu r ther proc can be saved as i s untdl the next sea n. I t i s assumed e is stored in t he tanks unt i l the f o owing season ncentyated w i $h saturated brine t o egin processing the
1.2 PROCESSING 00M PROCEDURES
I t is assumed t h a t i n s a l t removal, each 1 b of cucumbers c b s a l t is contacted w i t h 2-1 b of water and a1 lowed t o e
After equi 1 i ra t ion there r e su l t s 1-lb of cucumbers containing
2-lb water containing 0.125 1b s a l t . This d i lu te t e s the first processing waste.
s is washed a second ti ration i s not allowed, t a t which the cucumbers co water stream from this was
e second processing waste. s an average s a l t csncentra
dills and sweets. ercent sweets (2 n t s a l t remainin
f j r s t pwacessi ng waste, based up ,600 gal/day containing 0.0626 1 ream must be concentrated t o 3 1 must be removed, leaving 4,100
0.33 Ib sa l t / l b water.
e of second processing waste i s l0,8 sa l t . This stream must be concentr
water11 b s a l t ; thus, approximately l O , O O O gal/day of s a l t f ree water must be removed to leave 800 gallday of brine w i t h concentration 0.33 7 b s a l t / I b water.
A schematic diagram of these streams along w i t h the flow rates and composStions i s given i n Figure 1.
7.3 BRINE COWCENTRATING REQUIREMENTS
Comparing water removal ra tes , i . e . , 12,000 gallday from the tank yard brines versus a total of 27,500 gal/day from processing room waste, indicates tha t equipment sized t o handle the l a t t e r could easi ly handle the former. Thus, attention is given t o the design of equipment t o hand1 e mixed pro- cessing room wastes delivered a t a r a t e of 32,400 gal/day containing 0.092 I b s a l t /I b water. Separating equipment must be sized t o remove 27,500 gallday of water leaving 4,900 gallday of saturated brine t o be used i n subsequent processing .
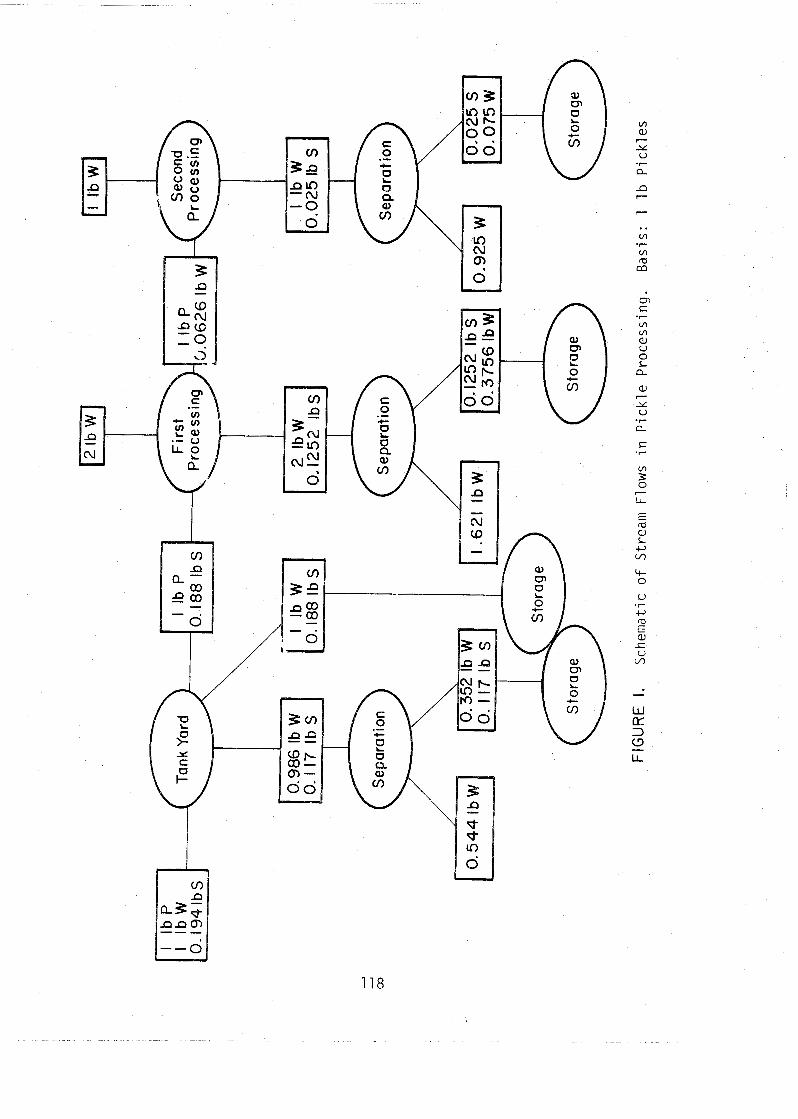
2.0 METHOD OF COST ESTIMATION
Costs have been estimated using a s l i g h t modi f ica t ion of a method developed by the Off ice o f Sal ine water1 i n which overa l l process costs are based on the costs o f the major pieces o f equipment. The cost o f the major pieces o f equipment must be estimated f r o m vendor quotes, from the 1 i t e r a - ture, o r from other means o f determination, and costs other than those f o r major equipment are taken as f ixed percentages o f the major equipment costs.
Total annual operating costs o f a p l an t are comprised o f
i t a l costs, inc lud ing major equipment, other mater ia ls, construct ion 1 abor, i n d i r e c t 1 abor, taxes, insurance, engi neering, and i n t e r e s t on construct ion cap i ta l , and
2) Annual operating costs, i n c l uding the amortized cap i t a l cost, i n t e r im replacement, taxes, insurance, operat ing labor, and overhead. The t o t a l annual operating costs can, i f desired, be expressed as the t o t a l cost per u n i t o f production. I n the case o f p i c k l e b r ine processing, s i g n i - f i can t bases f o r repor t cost/uni t o f production might be t o t a l cost per ton o f p i ck les o r t o t a l cost per ton o f sal t recovered.
2.1 CAPITAL COST ESTIMATION
Capital costs are estimated as fo l lows:
Assuming t h a t a process schematic has been drawn and t h a t major items o f equipment have been spec i f i ed and t h e i r s ize determined, costs are estimated f o r these major items o f equipment; these costs are designated as E.
I n the construct ion of the plant , o ther mater ia ls must a lso be purchased, p i ping, e l e c t r i c a l wir ing, small pumps, instrumentation, etc. These costs are re fe r red t o as other mater ia ls costs, M y and are taken as 40 percent o f E.
Labor must be provided f o r construct ion of the p lant . Construct ion 1 abor, L, i s taken as 60 percent o f E.
l ~ e n k i n s , David S. e t al. , "A Standardized Procedure f o r Estimating Costs o f Sal i ne Water Conversion", O f f i ce o f Sal ine Water, March 1956.
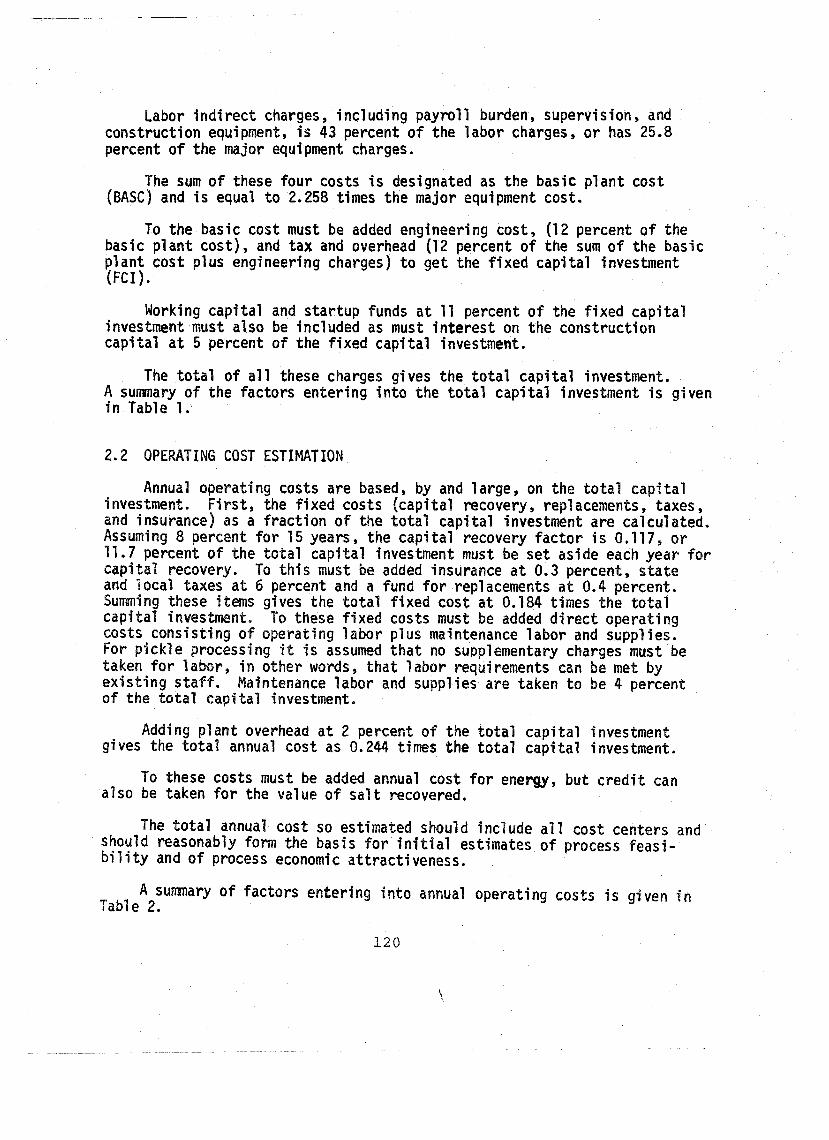
Labor i n d i r e c t charges, inc lud ing payro l l burden, supervision, and construct ion equipment, i s 43 percent o f the labor charges, o r has 25.8 percent o f the major equipment charges.
The sum o f these four costs i s designated as the basic p l an t cost (BASC) and i s equal t o 2.258 times the major equipment cost.
To the basic cost must be added engineering cost, (12 percent o f the basic p l an t cost) , and t ax and overhead (12 percent o f the sum o f the basic p l an t cost p lus engineering charges) t o ge t the f i x e d cap i t a l investment (FCI).
Working cap i ta l and s tar tup funds a t 11 percent o f the f ixed cap i t a l investment must a lso be included as must i n t e res t on the construct ion cap i t a l a t 5 percent o f the f i x e d cap i t a l investment.
The t o t a l o f a l l these charges gives the t o t a l cap i t a l investment. A summary o f the fac tors enter ing i n t o the t o t a l cap i t a l investment i s g iven i n Table 1.
2.2 OPERATING COST ESTIMATION
Annual operating costs are based, by and large, on the t o t a l cap i t a l investment. F i sst, the f i xed costs (cap i ta l recovery, replacements, taxes, and insurance) as a f r a c t i o n o f the t o t a l cap i t a l investment are calculated. Assuming 8 percent f o r 15 years, the cap i t a l recovery f a c t o r i s 0.117, o r 11.7 percent of the t o t a l cap i ta l investment must be se t aside each year f o r cap i t a l recovery. To t h i s must be added insurance a t 0.3 percent, s t a te
taxes a t 6 percent and a fund f o r replacements a t 0.4 percent. hese items gives the t o t a l f i x e d cost a t 0.184 times the t o t a l
cap i t a l i nveslment. To these f i x e d costs must be added d i r e c t operat ing costs cons is t ing of perat ing labor p lus maintenance labor and suppl ies.
i t i s assumed t h a t no supplementary charges must be other words, t ha t l abor requirements can be met by ntenance labor and supplies are taken t o be 4 percent
of the t o t a l cap i t a l investment.
Adding p lan t overhead a t 2 percent o f the t o t a l cap i t a l investment gives the t o t a l annual cost as 0.244 times the t o t a l cap i t a l investment.
To these costs must be added annual cost f o r energy, but c r e d i t can also be taken fo r the value o f s a l t recovered.
The t o t a l annual cost so estimated should include a1 1 cost centers and should reasonably form the basis f o r i n l t i a l estimates o f process feas i - bi 1 i ty and o f process economic a t t r a c t i veness.
A sumnary of fac tors enter ing i n t o annual operat ing costs i s given i n Table 2.
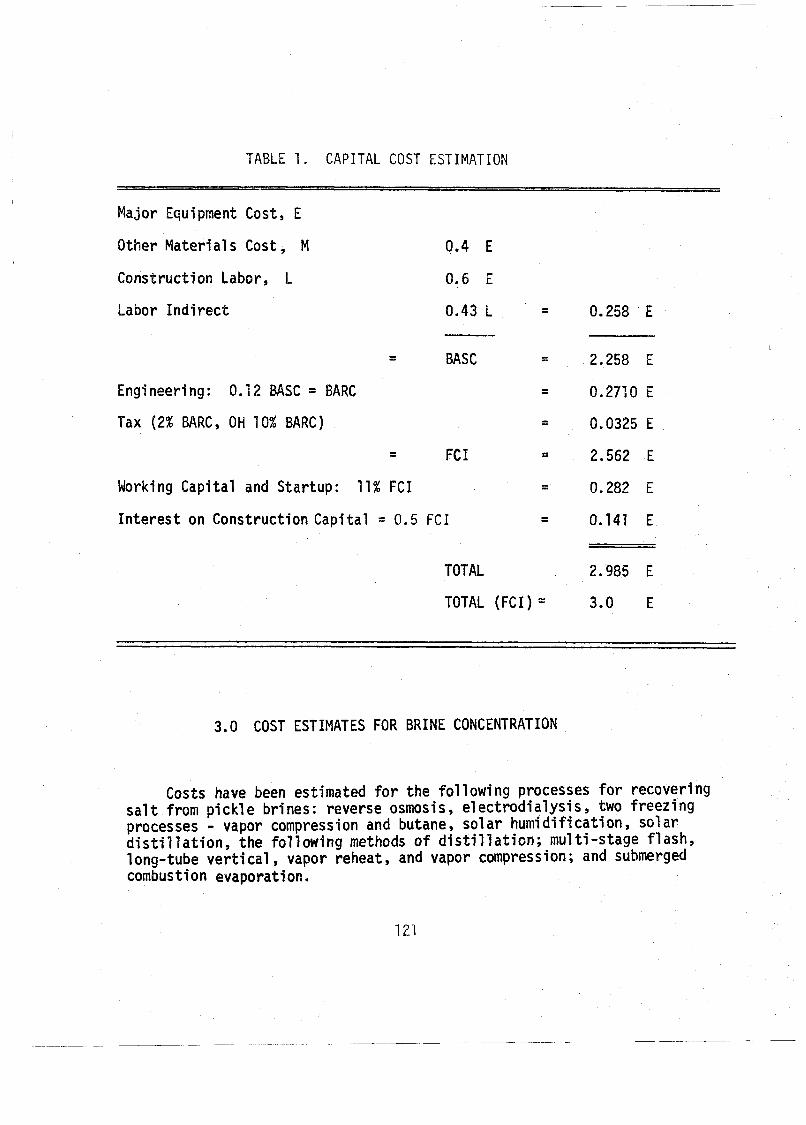
TABLE 1 . CAPITAL COST ESTIMATION
Major Equipment Cost, E
Other Mater ia ls Cost, M 0.4 E
Construction Labor, L 0.6 E
Labor I n d i r e c t 0.43 L - -
- - BASC - Engineering: 0.12 BASC = BARC - - Tax (2% BARC, OH 10% BARC) =
- - FC I - - Working Capital and Startup: 11% FCI - - In te res t on Construct ion Capi ta l = 0.5 FCI - -
TOTAL 2.985 E
TOTAL (FCI ) " 3.0 E
3.0 COST ESTIMATES FOR BRINE CONCENTRATION
Costs have been estimated f o r the fo l low ing processes f o r recovering s a l t from p i c k l e brines: reverse osmosis, e l ec t rod ia lys is , two f reez ing processes - vapor compression and butane, so lar humi d i fi cat ion, sol ar d i s t i l l a t i o n , the fo l low ing methods o f d i s t i l l a t i o n ; mul t i -s tage flash, long-tube v e r t i c a l , vapor reheat, and vapor compression; and submerged combustion evaporation.
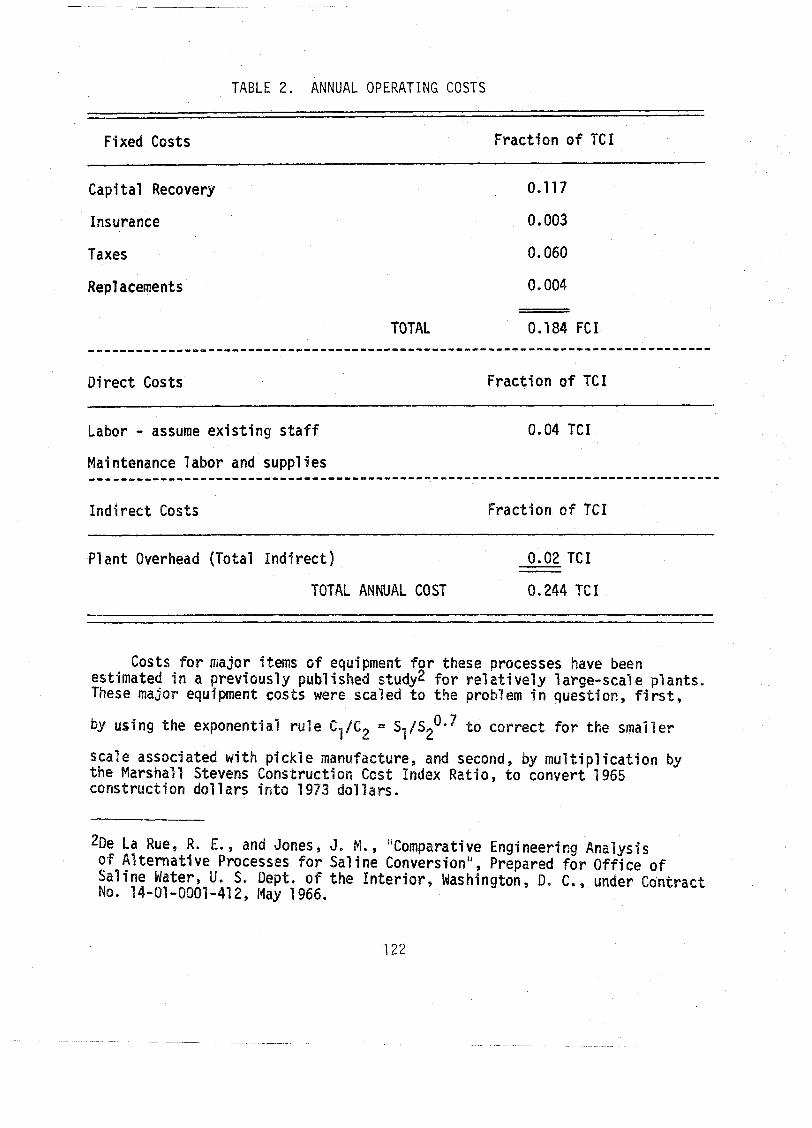
TABLE 2. ANNUAL OPERATING COSTS
Fixed Costs Fraction of TCI
Capital Recovery 0.117
Insurance 0.003
Taxes 0.060
Rep1 acements 0.004
TOTAL 0.184 FCI
Direct Costs Fraction of TC I -
Labor - assume exis t ing s t a f f 0.04 TCI
Indirect Costs Fraction of TCI
Pl ant Overhead (Total Ind i rec t ) 0.02 TCI
TOTAL ANNUAL COST 0.244 TCI
Costs f o r major items of e uipment f o r these estimated i n a viously pub1 i bed study2 f o r re1 t i vel y 1 arge-seal e plants. These major equ ent costs were scaled t o t he pro l em i n question, f irst ,
s ing the exponential r u l e C I / C 2 = S /s2Ow7 t o correct f o r t
sca le associated with pickle man c tu re , and second, by multip the Marshal 1 Stevens Construct1 o s s t Index Ratio, t o convert 1965 construction do l la r s i n to 1973 do l la r s .
2De La Rue, R. E. , and Jones, J. M. , "Comparative Engineering Analysis t e rna t ive Processes f o r Sal ine Conversion", Prepared f o r Office of
Sal ine Water, U. S. Dept. of the In t e r i o r , Washington, D. C., under Contract No. 14-01-0001-412, May 1966.
These estimates have been val idated by selected cross-checking. Sel ected types o f equipment , especi a1 l y evaporators, are % e subject of independent cost co r re l ations. These evaporators costs are ca lcu la ted f o r processing and compared w i t h evaporator cont r ibut ions t o the t o t a l cost as calculated using the OSW method. These resu l t s were i n substant ia l agree- ment.
Cost estimates are summarized i n Table 3. Reverse osmosis, butane f r e e t i ng , d i s t i 11 at ion, and submerged combusti on evaporation seem t o warrant fur ther considerat i on,
4.0 COST ESTIMATES FOR ORGANIC REMOVAL
Estimates have been made o f the cost o f two processes f o r the removal o f organic mater ia ls from p i c k l e b r i ne: submerged combustion evaporation fo l l owed by k i 1 n dry ing , and b i 01 ogi cal ox i da t i on.
For the submerged combustion process, i t has been assumed t h a t submerged combus t i o n would a1 so be used f o r sal t concentrat i on, consequent1 y the evaporator cost has been estimated as an increment t o the evaporator cos t f o r sal t concentration.
Costs o f b io log ica l ox idat ion have been estimated from pub1 ished i n - formation,3 assuming t ha t BOD removal proceeds by f i r s t order k i ne t i c s and t ha t the costs would be i den t i ca l t o those f o r municipal waste treatment provid ing the residence t ime i s increased t o account f o r the higher BOD i n p i ck l e brines. Under these assumptions, the t ime required f o r ox idat ion o f BOD a t a concentrat ion of 4000 mg/l i t e r i s 2.3 times the t ime required f o r ox idat ion o f 200 mg/l i t e r , taken as representat ive o f municipal sewage. Thus, the p l an t s ize should be 2.3 times 25,000 gal/day o r about 63,000 gal/day. Total cap i ta l investment estimates were based on t h i s s i ze p lant .
Cost estimates fo r organic removal are summarized i n Table 4.
J ~ m i t h , R., "A Compilation o f Cost Information f o r Conventional and Advanced Wastewater Treatment Pl ants and Processes, " Prepared f o r Federal Water Pol 1 u t i o n Control Admini s t ra t ion , Cincinnat i , Ohio, 1967.
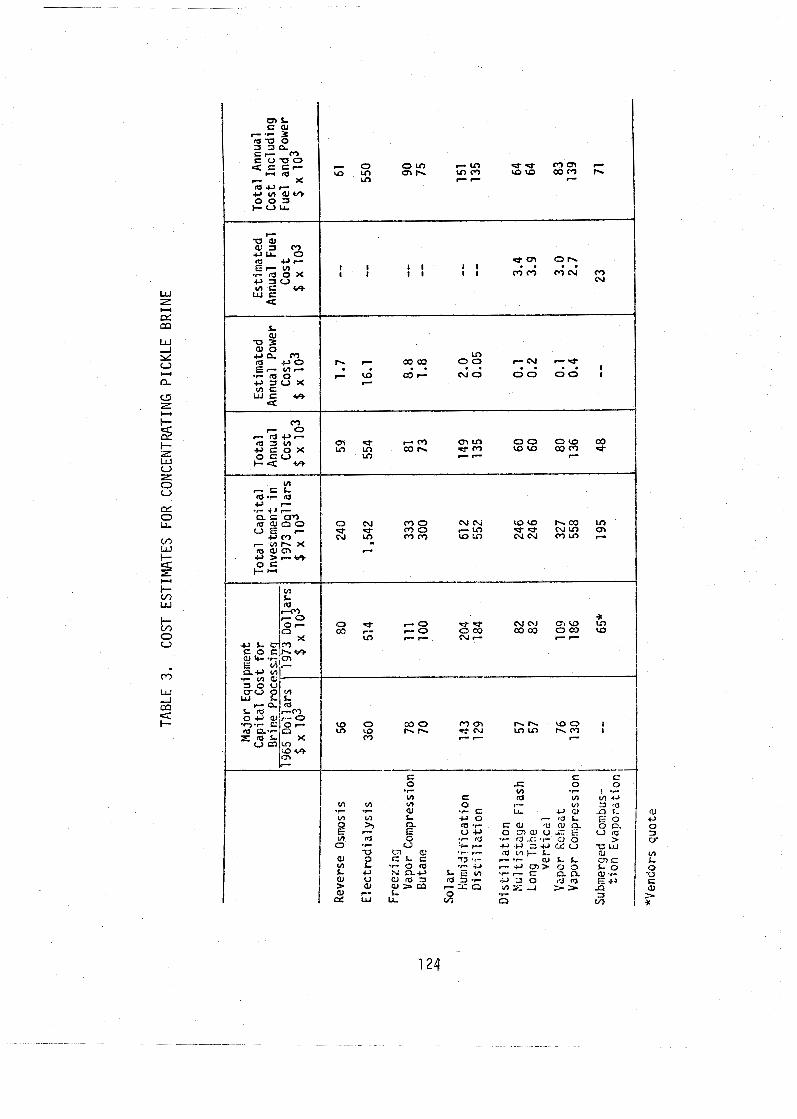
C 0 C
c c .P
0 V)
0
V) 'r I 'r
r V)
R1 Vi VlU V) V) .,- C al 0 "- u1 3 m
h .r K
V) V) u o LL - 1 n ~ F - o C ~ R , as- n i22 E
' d . r E T ~ ci OJ n O R uc, otna,uca V I U
V) a 0 *r rb O r f3 .r UJ 0 Q v- 0
> % P - d-'C)JCltLU u u
u m d l 'C' f w L 0 l - L R, W U 6 E - C - r - - r n , L L c n r V) I- . r O I w r - + ( 5 r 3 . 0 0 L O I- ~1 N ac, L ' Z G - - c ~ L L (U U f f l a 3 - 3 - r - 9 2 0 t i y r ' J E+J > (U ( U > C O F-xa "I>:& >> n aJ C Z G k 0 .r V) n 3
0
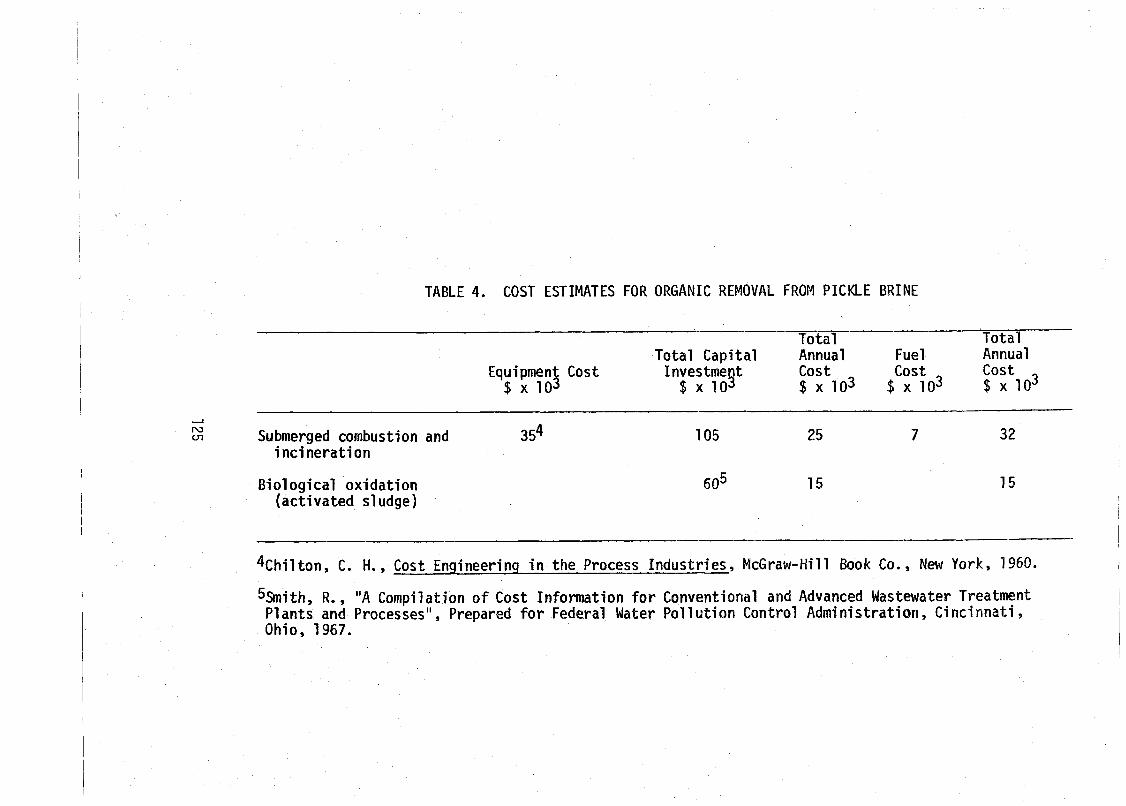
TABLE 4. COST ESTIMATES FOR ORGANIC REMOVAL FROM PICKLE BRINE
Total Total Total Capital Annual Fuel Annual
Equipmen 5 Cost Investment Cost Cost Cost 8 x 10 $ x 103 1 x 1 0 3 $ ~ 1 0 3 s x 1 0 3
-I
N ~n Submerged combustion and 354
inc inerat ion
Biological oxidation (activated sludge)
%hi l ton, C. H., Cost Engineering i n the Process Industries, McGraw-Hill Book Co., New York, 1960.
S~mith, R., "A Compilation o f Cost Information f o r Conventional and Advanced Wastewater Treatment Plants and Processes", Prepared f o r Federal Water Pol 1 ut ion Control Admi n is t ra t i sn , C i nc i nnat i , Ohio, 1967.