Embed Size (px)
Citation preview
Technical Publication SJ 90-1
Characterizationof Agricultural PumpDischarge Qualityin theUpper St. JohnsRiver Basin
St. Johns River Water Management District
Technical Publication SJ 90-1
CHARACTERIZATION OF AGRICULTURAL PUMPDISCHARGE QUALITY IN THE UPPER
ST . JOHNS RIVER BASIN
by
Carol Fall
Department of Surface Water ProgramsSt . Johns River Water Management District
Palatka , Florida
1990
NORTHWEST FLORIDA
WATER MANAGEMENT DISTRICT
ST. JOHNS RIVER
WATER MANAGEMENT DISTRICT
SUWANNEE RIVER
WATER MANAGEMENT DISTRICT
SOUTHWEST FLORIDA
WATER MANAGEMENT DISTRICT
SOUTH FLORIDA
WATER MANAGEMENT DISTRICT
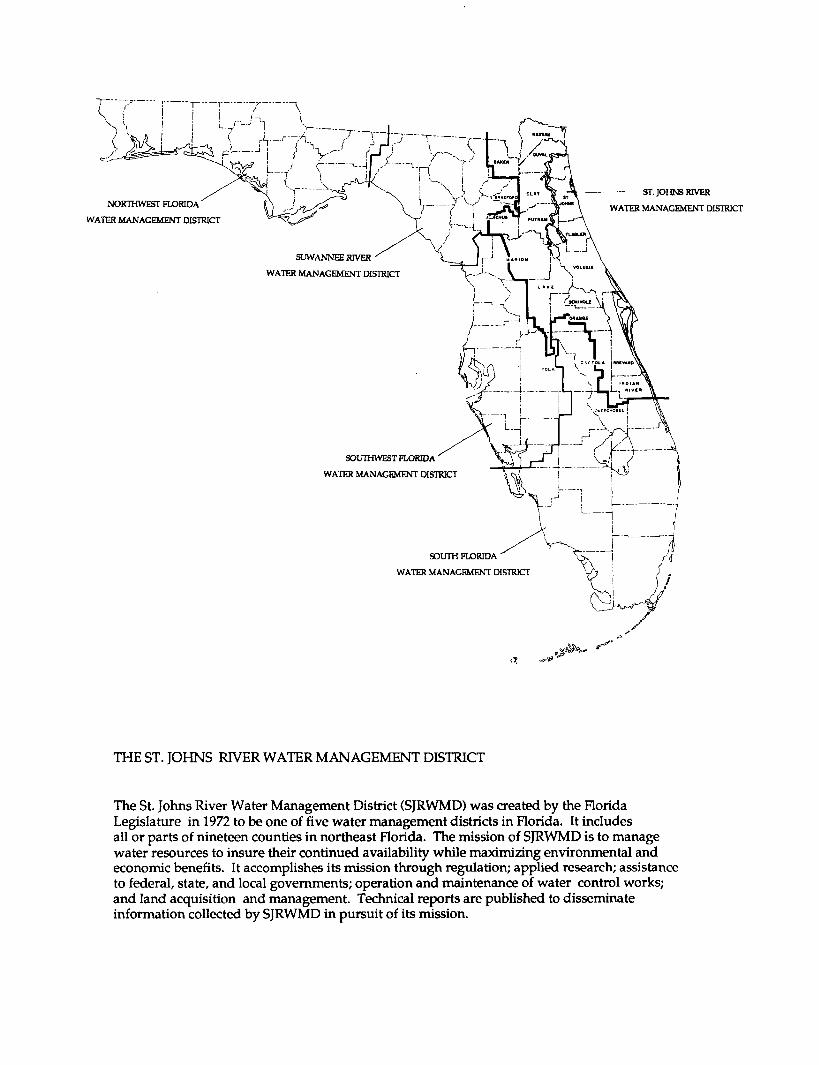
THE ST. JOHNS RIVER WATER MANAGEMENT DISTRICT
The St. Johns River Water Management District (SJRWMD) was created by the FloridaLegislature in 1972 to be one of five water management districts in Florida. It includesall or parts of nineteen counties in northeast Florida. The mission of SJRWMD is to managewater resources to insure their continued availability while maximizing environmental andeconomic benefits. It accomplishes its mission through regulation; applied research; assistanceto federal, state, and local governments; operation and maintenance of water control works;and land acquisition and management. Technical reports are published to disseminateinformation collected by SJRWMD in pursuit of its mission.
CONTENTS
List of Figures vii
List of Tables ix
ABSTRACT 1
INTRODUCTION 3
Purpose 3
Background 3
METHODS OF INVESTIGATION 7
RESULTS 19
Comparison of Pump Discharge to Receiving Water Body and WaterQuality Standards 19
Dissolved Oxygen and Biochemical Oxygen Demand 19Suspended Solids and Turbidity 19Metals and Minerals 21Nutrients 21Pesticides 21
Comparisons Between Pumps 21
Comparison of Pump Discharge Quality to Regulatory ComplianceData 23
DISCUSSION 27
CONCLUSION 31
Literature Cited 33
Appendix A : Station Descriptions and Data 35
Appendix B: Statistical Summary 43
FIGURES
Figure Page
1 Location of the upper St . Johns River basin study area . . . A
2 Typical floodplain levee system 5
3 Pump sample stations in the upper St . Johns River basin . . 8
4 Stations selected to represent existing water quality inthe receiving water body 12
5 Comparison of pump discharge quality : ammonia , totalKjeldahl , and nitrate plus nitrite nitrogen 22
6 Comparison of pump discharge quality : orthophosphate andtotal phosphorus 24
7 Upper St . Johns River Basin Project map 30
-vii-

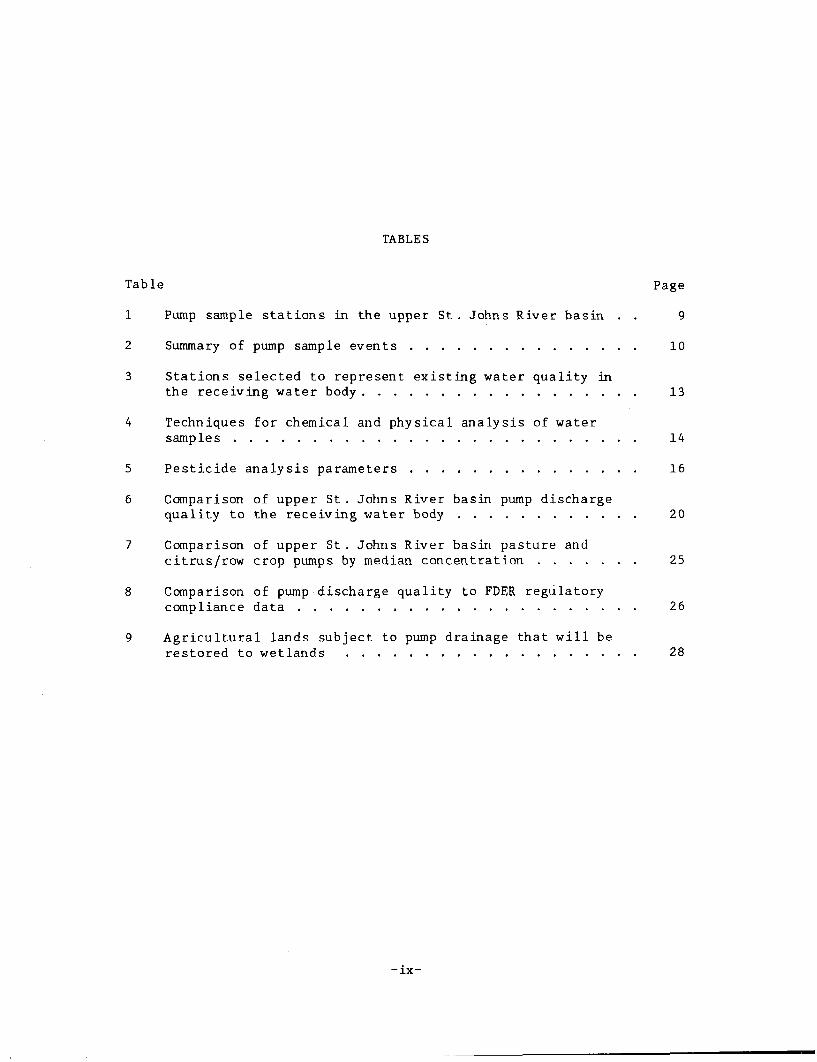
TABLES
Table Page
1 Pump sample stations in the upper St . Johns River basin . . 9
2 Summary of pump sample events 10
3 Stations selected to represent existing water quality inthe receiving water body 13
4 Techniques for chemical and physical analysis of watersamples 14
5 Pesticide analysis parameters 16
6 Comparison of upper St . Johns River basin pump dischargequality to the receiving water body 20
7 Comparison of upper St . Johns River basin pasture andcitrus/row crop pumps by median concentration 25
8 Comparison of pump discharge quality to FDER regulatorycompliance data 26
9 Agricul tural lands subject to pump drainage that will berestored to wetlands 28
-ix-
ABSTRACT
The St . Johns River Water Management District and Florida Institute ofTechnology collected 58 samples from 9 pumps in the upper St . JohnsRiver basin to characterize the water quality of agriculturaldischarges . Median dissolved oxygen levels in pump discharges were2 .8 mg/1 and violated state water quality standards 89 percent of thetime . The median suspended solids concentration was 10 .8 mg/1 in pumpdischarges, approximately three times higher than the median of thereceiving water body . No violations of the Class I water qualitystandard for chloride were observed in the pump discharges . Nutrientlevels in pump discharges were two to five times higher than levelsfound in the receiving water body. Nitrate-nitri te nitrogen was mostabundant in the pumps of Fellsmere Joint Ventures , with medianconcentrations from 0 .16 to 0 .69 mg/1 . Fellsmere Joint Ventures ' No .10 pump (Mary A) discharged the highest levels of total phosphorus(median=0 .54 m g / 1 ) . No violations of pesticide water qualitystandards were detected in the pump discharge or receiving water body .Regulatory compliance data provided by the pump owners producedresults similar to this study .
-1-

INTRODUCTION
PURPOSE
Discharges from agricultural pumps have been cited as a sourceof water quality problems in the upper St . Johns River basin (FDER ,1982). In 1982, the St. Johns River Water Management District(SJRWMD) began sampling pump events to provide information forregulatory and basin management purposes . This report documents pumpdischarge quality in terms of state water quality standards andbackground conditions .
BACKGROUND
To convert parts of the upper St . Johns River basin (Figure 1)to agricultural and urban use , landowners typically built a leveearound a portion of the floodplain , dug an interior drainage network ,and installed pumps to l if t excess water over the levee and dischargeinto the remaining f loodplain (Figure 2 ) . In this manner , 222 ,486acres of the total floodplain (approximately 62 percent) were isolated(Lowe et al . 1984) .
Most of the former floodplain is used for agriculture . In1980 , approximately 70 percent of the basin was rough or improvedpasture and 5 percent was row crop or citrus (SJRWMD 1980).Agricultural uses have intensified since then as pasture has beenconverted to row crops , such as corn and carrots . In some areas ,poorly maintained levee or pump systems allowed marsh vegetation torecolonize former pasture .
The reduced ability of the remaining floodplain to assimilatenutrients , combined with increased nutrient loads from formerfloodplain that has been converted to agricultural use , hasintensified water quality problems in the basin (Sullivan 1979) .Based on data collected by the Florida Department of EnvironmentalRegulation (FDER) and Game and Fresh Water Fish Commission (FGFWFC) ,Sullivan (1979) concluded that agricultural pumps caused lower thannormal dissolved oxygen levels. CH2M Hill (1979) also documented lowdissolved oxygen levels in pump discharges for Deseret Ranch butconcluded that the pumps had an insignificant impact on the waterquality of the receiving body. These divergent conclusions, based on
-3-
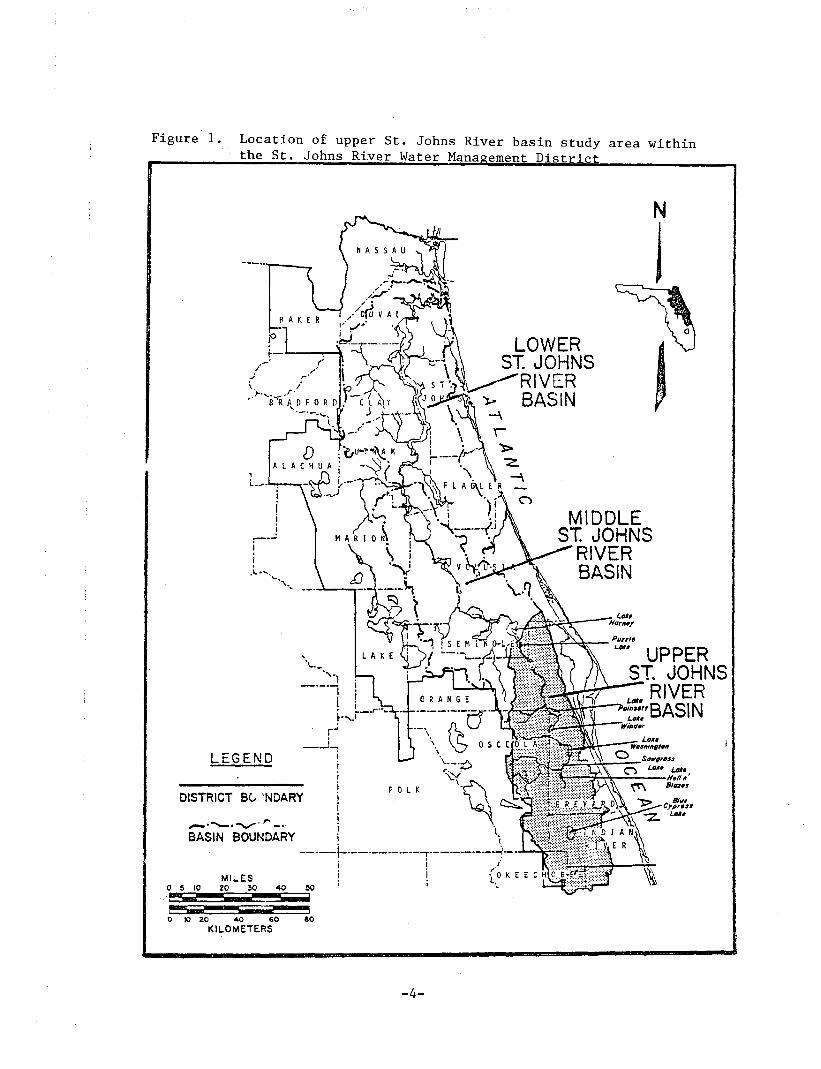
Figure 1. Location of upper St. Johns River basin study area withinthe St. Johns River Water Management District
>-^-A Y-B R A D F O R D . 1 (
LOWERST. JOHNS
RIVERBASIN
LEGEND
DISTRICT BOUNDARY
.x-~ •"•>—• "̂ x'" ^*—•
BASIN BOUNDARY
MIDDLEST. JOHNS
RIVERBASIN
Horary
UPPERST. JOHNS
RIVER ;BASIN
0 10 20 4O €0 80KILOMETERS
-4-
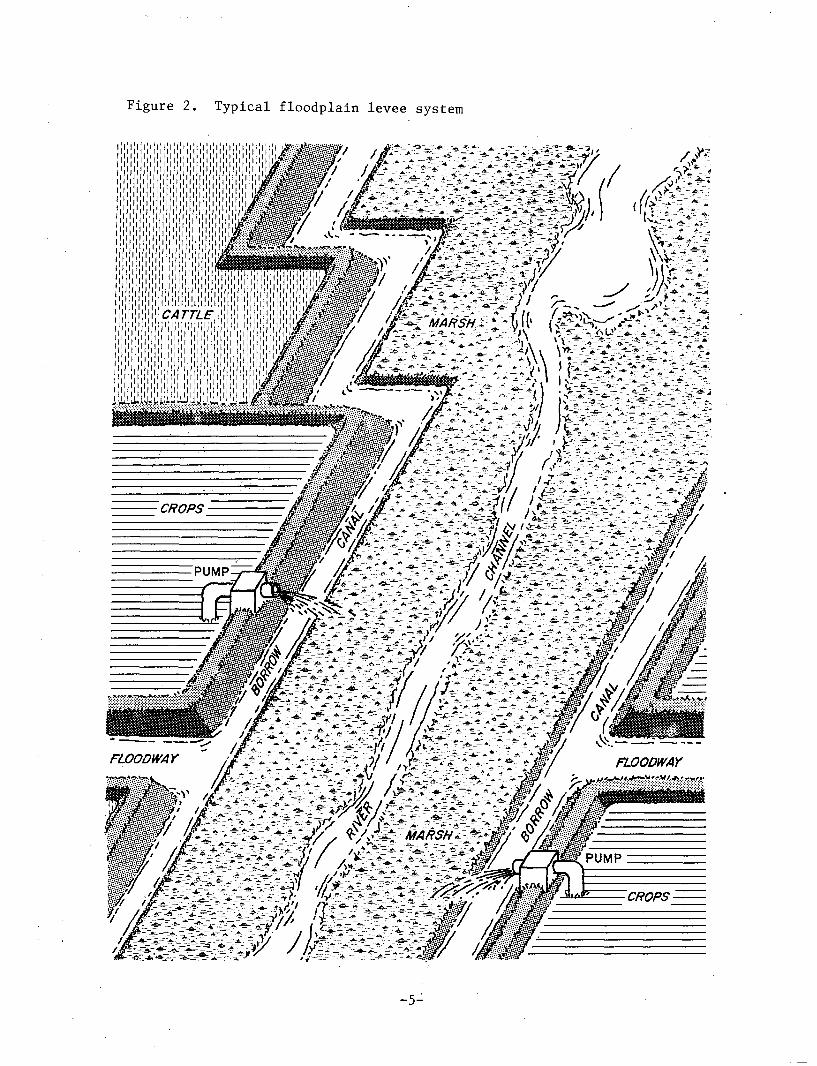
Figure 2. Typical floodplain levee system
i 'R--*--^-* ..-* i"-_^»:.:*:.--Hi?-vr*->*-"-*
- "I'i ' i ' i ' i ' i ' i ' iVi'iVi'i1 V ' ' ' ' ' 'I I I I I I I I 1 I I I I I I' I' I' I' I I I 1, 1 , 1 , 1 , 1 , 1 . 1 , 1 , 1 , 1 . 1 . 1 , 1 , 1 . 1 . I.I. 1 , 1 , 1 , 1 . 1 , 1
•«;**",'•". '̂-JV^- f/ ^r/^*^-.*-:v^-*:*rv;i~^C<*// %*s>Sfc -̂'i*i:&$&& i/&ym^•~ "«.•> ...-* -^ s.'f / I »:*• -f - •»--- .« i ^-<l:-. r -'
-5-
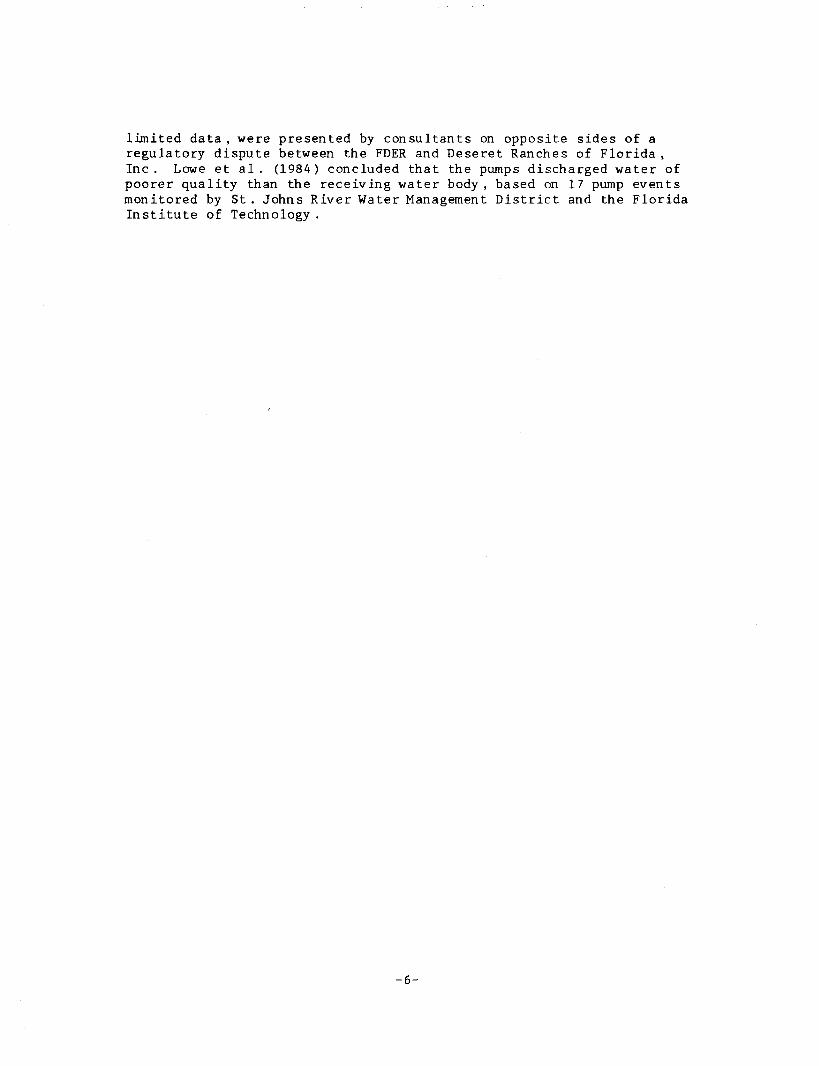
limited data , were presented by consultants on opposite sides of aregulatory dispute between the FDER and Deseret Ranches of Florida ,Inc. Lowe et al . (1984) concluded that the pumps discharged water ofpoorer quality than the receiving water body , based on 17 pump eventsmonitored by St . Johns River Water Management District and the FloridaInstitute of Technology .
-6-
METHODS OF INVESTIGATION
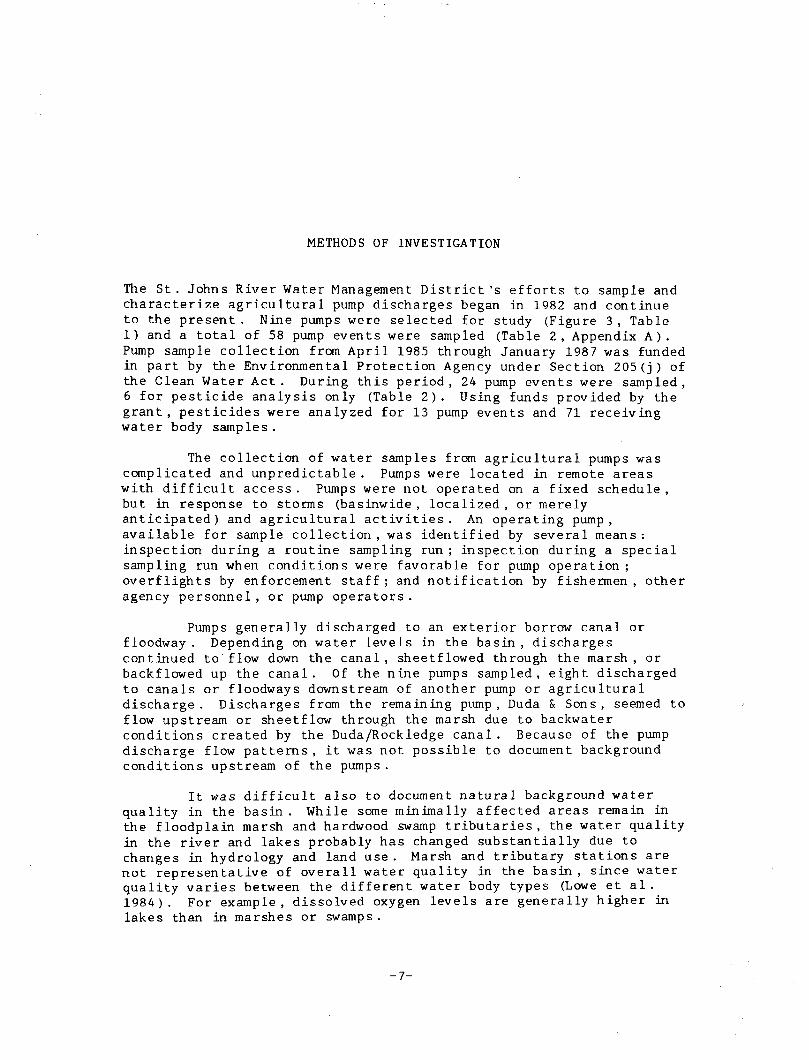
The St . Johns River Wate r Management District 's e f f o r t s to sample andcharacterize agricultural pump discharges began in 1982 and continueto the present . Nine pumps were selected for study (Figure 3 , Table1) and a total of 58 pump events were sampled (Table 2 , Appendix A ) .Pump sample collection from Apri l 1985 through January 1987 was fundedin part by the Environmental Protection Agency under Section 205 (j ) ofthe Clean Water A c t . During this per iod, 24 pump events were sampled,6 for pesticide analysis only (Table 2). Using funds provided by thegrant , pesticides were analyzed for 13 pump events and 71 receivingwater body samples .
The collection of water samples from agricultural pumps wascomplicated and unpredictable . Pumps were located in remote areaswith d i f f i cu l t access . Pumps were not operated on a fixed schedule ,but in response to storms (basinwide , localized , or merelyanticipated) and agricultural activities. An operating pump,available for sample collection , was identified by several means :inspection during a routine sampling run ; inspection during a specialsampling run when conditions were favorable for pump operation ;overflights by enforcement s taff ; and notification by fishermen , otheragency personnel , or pump operators.
Pumps generally discharged to an exterior borrow canal orfloodway . Depending on water levels in the basin , dischargescontinued to flow down the canal , sheetflowed through the marsh , orbackflowed up the canal. Of the nine pumps sampled, eight dischargedto canals or floodways downstream of another pump or agricul turaldischarge. Discharges from the remaining pump, Duda & Sons, seemed toflow upstream or sheetflow through the marsh due to backwaterconditions created by the Duda/Rockledge canal . Because of the pumpdischarge flow patterns , it was not possible to document backgroundconditions upstream of the pumps .
It was difficult also to document natural background waterquality in the basin . While some minimally a f fec ted areas remain inthe floodplain marsh and hardwood swamp tributaries , the water qualityin the river and lakes probably has changed substantially due tochanges in hydrology and land use . Marsh and tributary stations arenot representative of overall water quality in the basin , since waterquality varies between the d i f fe rent water body types (Lowe et al .1984) . For example, dissolved oxygen levels are generally higher inlakes than in marshes or swamps .
Figure 3. Pump sample stations in the upper St. Johns River basin
-8-
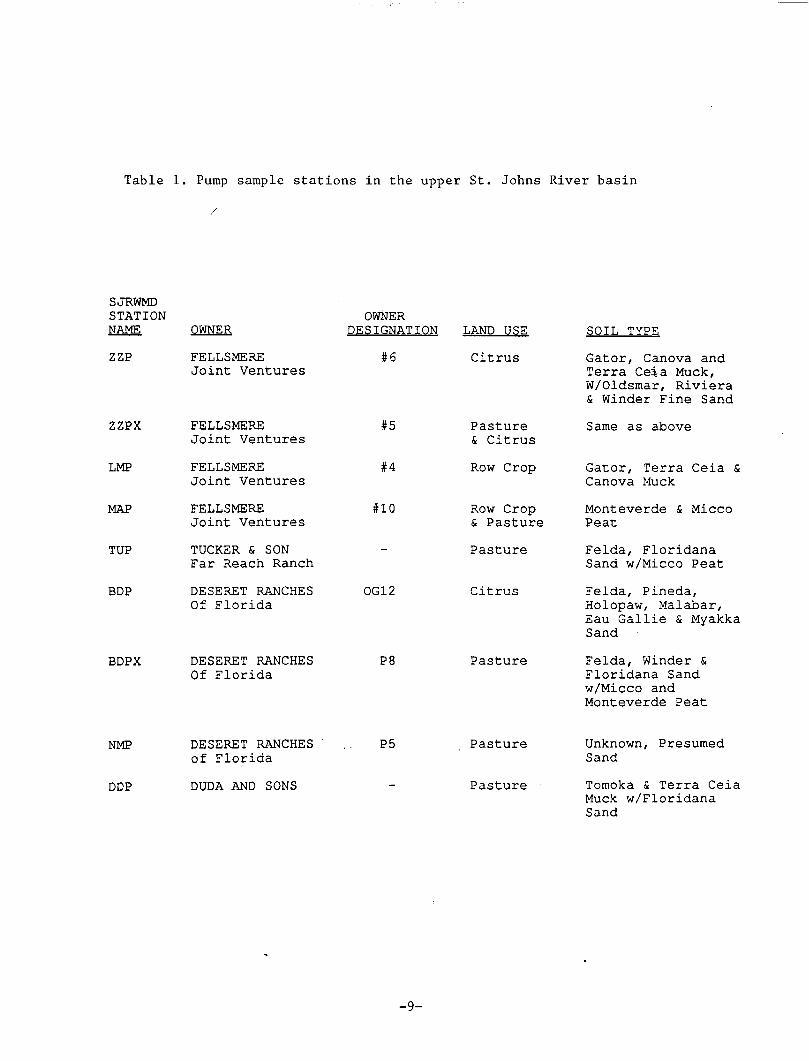
Table 1. Pump sample stations in the upper St. Johns River basin
SJRWMDSTATIONNAME
ZZP
ZZPX
LMP
MAP
TUP
BDP
BDPX
OWNER
FELLSMEREJoint Ventures
FELLSMEREJoint Ventures
FELLSMEREJoint Ventures
FELLSMEREJoint Ventures
TUCKER & SONFar Reach Ranch
DESERET RANCHESOf Florida
DESERET RANCHESOf Florida
OWNERDESIGNATION LAND USE
#6
#5
#4
#10
OG12
P8
Citrus
Pasture& Citrus
Row Crop
Row Crop& Pasture
Pasture
Citrus
Pasture
SOIL TYPE
Gator, Canova andTerra Ceia Muck,W/Oldsmar, Riviera& Winder Fine Sand
Same as above
Gator, Terra Ceia &Canova Muck
Monteverde & MiccoPeat
Felda, FloridanaSand w/Micco Peat
Felda, Pineda,Holopaw, Malabar,Eau Gallie & MyakkaSand
Felda, Winder &Floridana Sandw/Micco andMonteverde Peat
NMP
DDP
DESERET RANCHESof Florida
DUDA AND SONS
P5 Pasture
Pasture
Unknown, PresumedSand
Tomoka & Terra CeiaMuck w/FloridanaSand
-9-
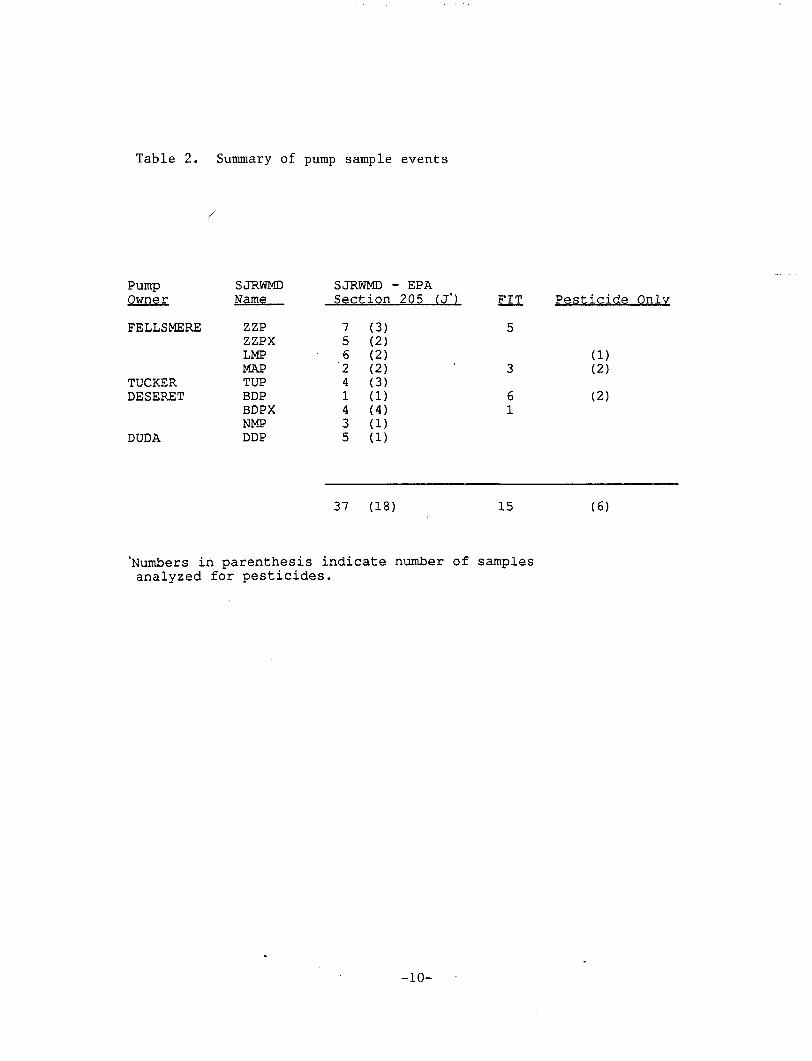
Table 2. Summary of pump sample events
Pump SJRWMD SJRWMD - EPAOwner Name Section 205 (J*) FIT Pesticide Only
FELLSMERE ZZP 7 (3) 5ZZPX 5 (2)LMP 6 (2) (1)MAP '2 (2) ' 3 (2)
TUCKER TUP 4 (3)DESERET BDP 1 ( 1 ) 6 (2)
BDPX 4 (4) 1NMP 3 (1)
DUDA DDP 5 (1)
37 (18) 15 (6)
'Numbers in parenthesis indicate number of samplesanalyzed for pesticides.
-10-
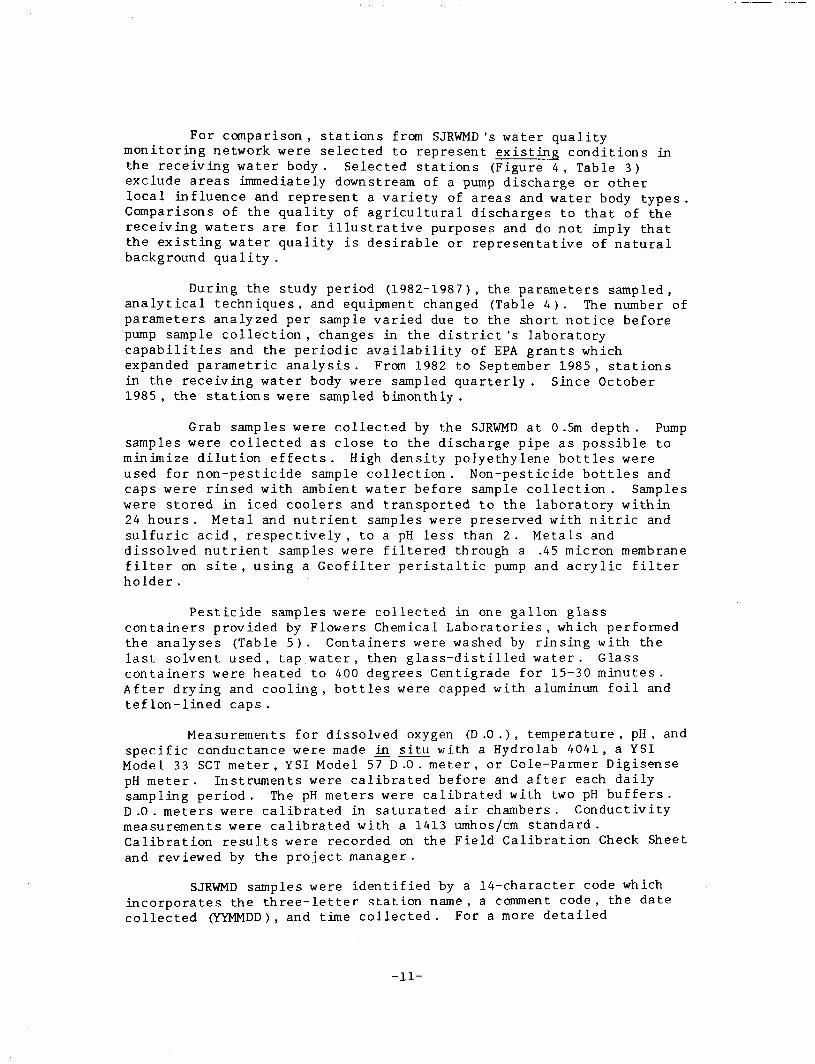
For comparison , stations from SJRWMD 's water qualitymonitoring network were selected to represent existing conditions inthe receiving water body . Selected stations (Figure 4 , Table 3)exclude areas immediately downstream of a pump discharge or otherlocal influence and represent a variety of areas and water body types .Comparisons of the quality of agricultural discharges to that of thereceiving waters are for illustrative purposes and do not imply thatthe existing water quality is desirable or representative of naturalbackground quality .
During the study period (1982-1987), the parameters sampled,analytical techniques, and equipment changed (Table 4 ) . The number ofparameters analyzed per sample varied due to the short notice beforepump sample collection , changes in the district 's laboratorycapabilities and the periodic availability of EPA grants whichexpanded parametric analysis . From 1982 to September 1985 , stationsin the receiving water body were sampled quarterly . Since October1985 , the stations were sampled bimonthly .
Grab samples were collected by the SJRWMD at 0.5m depth. Pumpsamples were collected as close to the discharge pipe as possible tominimize dilution e f f e c t s . High density polyethylene bottles wereused for non-pesticide sample collection . Non-pesticide bottles andcaps were rinsed with ambient water before sample collection . Sampleswere stored in iced coolers and transported to the laboratory within24 hours . Metal and nutrient samples were preserved with nitric andsulfuric acid , respectively , to a pH less than 2 . Metals anddissolved nutrient samples were f i l tered through a .45 micron membranef i l ter on site, using a Geofi l ter peristaltic pump and acrylic f i l terholder .
Pesticide samples were collected in one gallon glasscontainers provided by Flowers Chemical Laboratories , which performedthe analyses (Table 5 ) . Containers were washed by rinsing with thelast solvent used , tap water , then glass-distilled w a t e r . Glasscontainers were heated to 400 degrees Centigrade for 15-30 minutes .A f t e r drying and cooling, bott les were capped with aluminum foil andteflon-lined caps .
Measurements for dissolved oxygen (D .0 .) , temperature, pH , andspecific conductance were made in situ with a Hydrolab 4041, a YSIModel 33 SCT me te r , YSI Model 57 D .0 . m e t e r , or Cole-Parmer DigisensepH m e t e r . Instruments were calibrated before and a f t e r each dailysampling period. The pH meters were calibrated with two pH b u f f e r s .D .0 . meters were calibrated in saturated air chambers . Conductivitymeasurements were calibrated with a 1413 umhos/cm standard .Calibration results were recorded on the Field Calibration Check Sheetand reviewed by the project manager .
SJRWMD samples were identified by a 14-character code whichincorporates the three-letter station name , a comment code , the datecollected (YYMMDD) , and time collected. For a more detailed
-11-
Figure 4. Stations selected to represent existing waterquality in the receiving water body
-12-
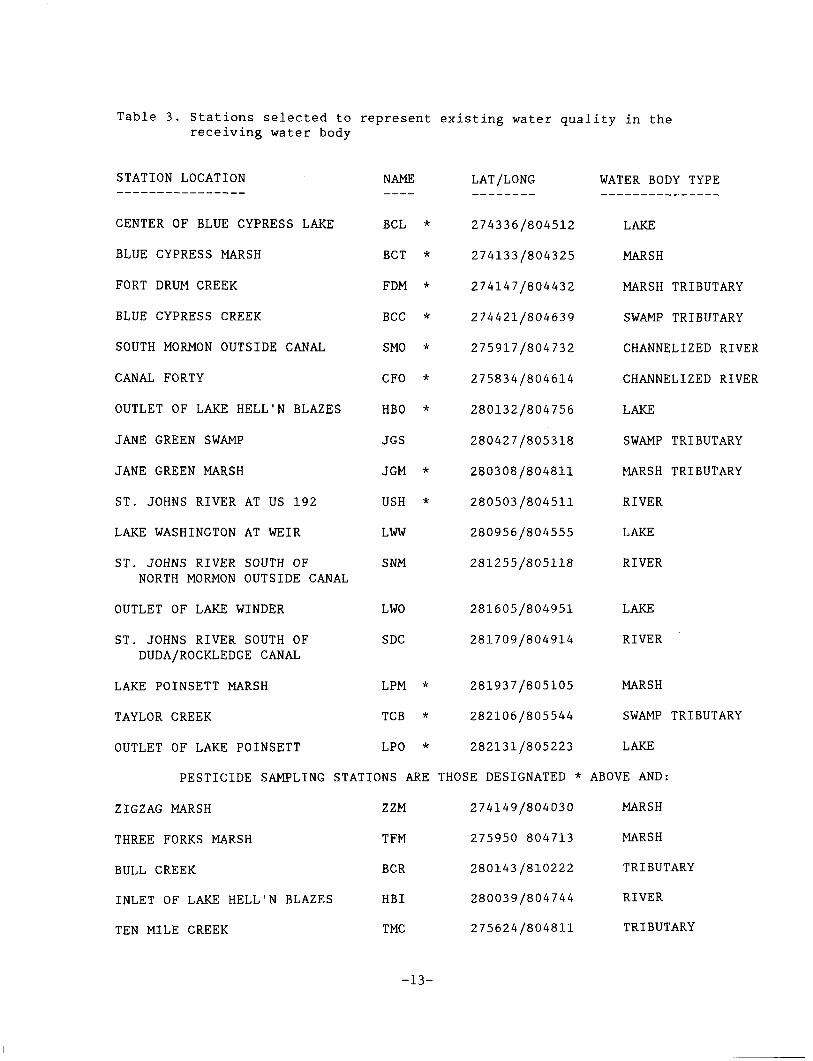
Table 3. Stations selected to represent existing water quality in thereceiving water body
NAMESTATION LOCATION
CENTER OF BLUE CYPRESS LAKE
BLUE CYPRESS MARSH
FORT DRUM CREEK
BLUE CYPRESS CREEK
SOUTH MORMON OUTSIDE CANAL
CANAL FORTY
OUTLET OF LAKE HELL'N BLAZES
JANE GREEN SWAMP
JANE GREEN MARSH
ST. JOHNS RIVER AT US 192
LAKE WASHINGTON AT WEIR
ST. JOHNS RIVER SOUTH OFNORTH MORMON OUTSIDE CANAL
OUTLET OF LAKE WINDER
ST. JOHNS RIVER SOUTH OFDUDA/ROCKLEDGE CANAL
LAKE POINSETT MARSH
TAYLOR CREEK
OUTLET OF LAKE POINSETT
PESTICIDE SAMPLING STATIONS ARE
ZIGZAG MARSH ZZM
THREE FORKS MARSH TFM
BULL CREEK BCR
INLET OF LAKE HELL'N BLAZES HBI
TEN MILE CREEK TMC
LAT/LONG WATER BODY TYPE
BCL *
BCT *
FDM *
BCC *
SMO *
CFO *
HBO *
JGS
JGM *
USH *
LWW
SNM
LWO
SDC
LPM *
TCB *
LPO *
274336/804512
274133/804325
274147/804432
274421/804639
275917/804732
275834/804614
280132/804756
280427/805318
280308/804811
280503/804511
280956/804555
281255/805118
281605/804951
281709/804914
281937/805105
282106/805544
282131/805223
LAKE
MARSH
MARSH TRIBUTARY
SWAMP TRIBUTARY
CHANNELIZED RIVER
CHANNELIZED RIVER
LAKE
SWAMP TRIBUTARY
MARSH TRIBUTARY
RIVER
LAKE
RIVER
LAKE
RIVER
MARSH
SWAMP TRIBUTARY
LAKE
THOSE DESIGNATED *
274149/804030
275950 804713
280143/810222
280039/804744
275624/804811
ABOVE AND:
MARSH
MARSH
TRIBUTARY
RIVER
TRIBUTARY
-13-
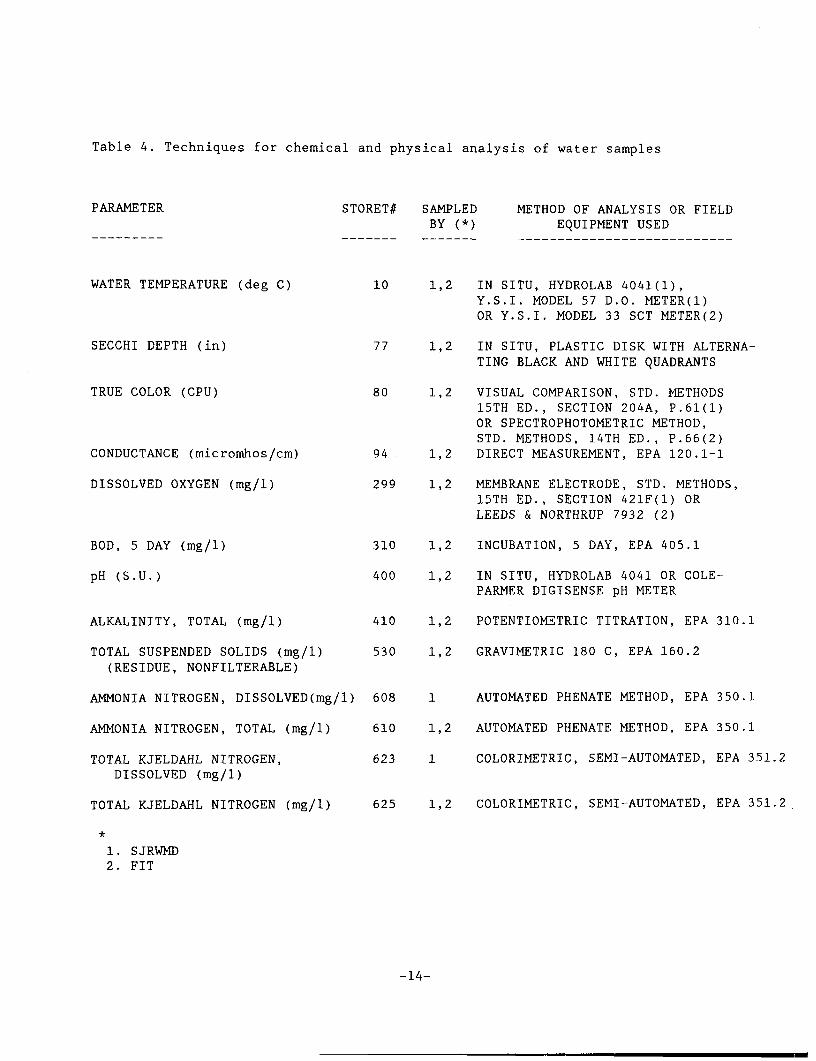
Table 4. Techniques for chemical and physical analysis of water samples
PARAMETER STORET#
WATER TEMPERATURE (deg C) 10
SECCHI DEPTH (in)
TRUE COLOR (CPU)
CONDUCTANCE (micromhos/cm)
DISSOLVED OXYGEN (mg/1)
BOD, 5 DAY (mg/1)
pH (S.U.)
ALKALINITY, TOTAL (mg/1)
TOTAL SUSPENDED SOLIDS (mg/1)(RESIDUE, NONFILTERABLE)
AMMONIA NITROGEN, DISSOLVED(mg/l) 608
AMMONIA NITROGEN, TOTAL (mg/1) 610
TOTAL KJELDAHL NITROGEN,DISSOLVED (mg/1)
SAMPLEDBY (*)
METHOD OF ANALYSIS OR FIELDEQUIPMENT USED
77
80
94
299
310
400
410
530
1
1
1
1
1
1
1
1
,2
,2
,2
,2
,2
,2
,2
,2
1,2 IN SITU, HYDROLAB 4041(1),Y.S.I. MODEL 57 D.O. METER(l)OR Y.S.I. MODEL 33 SCT METER(2)
IN SITU, PLASTIC DISK WITH ALTERNA-TING BLACK AND WHITE QUADRANTS
VISUAL COMPARISON, STD. METHODS15TH ED., SECTION 204A, P.61(1)OR SPECTROPHOTOMETRIC METHOD,STD. METHODS, 14TH ED., P.66(2)DIRECT MEASUREMENT, EPA 120.1-1
MEMBRANE ELECTRODE, STD. METHODS,15TH ED., SECTION 421F(1) ORLEEDS & NORTHRUP 7932 (2)
INCUBATION, 5 DAY, EPA 405.1
IN SITU, HYDROLAB 4041 OR COLE-PARMER DIGISENSE pH METER
POTENTIOMETRIC TITRATION, EPA 310.1
GRAVIMETRIC 180 C, EPA 160.2
1 AUTOMATED PHENATE METHOD, EPA 350.1
1,2 AUTOMATED PHENATE METHOD, EPA 350.1
623 1 COLORIMETRIC, SEMI-AUTOMATED, EPA 351.2
TOTAL KJELDAHL NITROGEN (mg/1) 625 1,2 COLORIMETRIC, SEMI-AUTOMATED, EPA 351.2
1. SJRWMD2. FIT
-14-
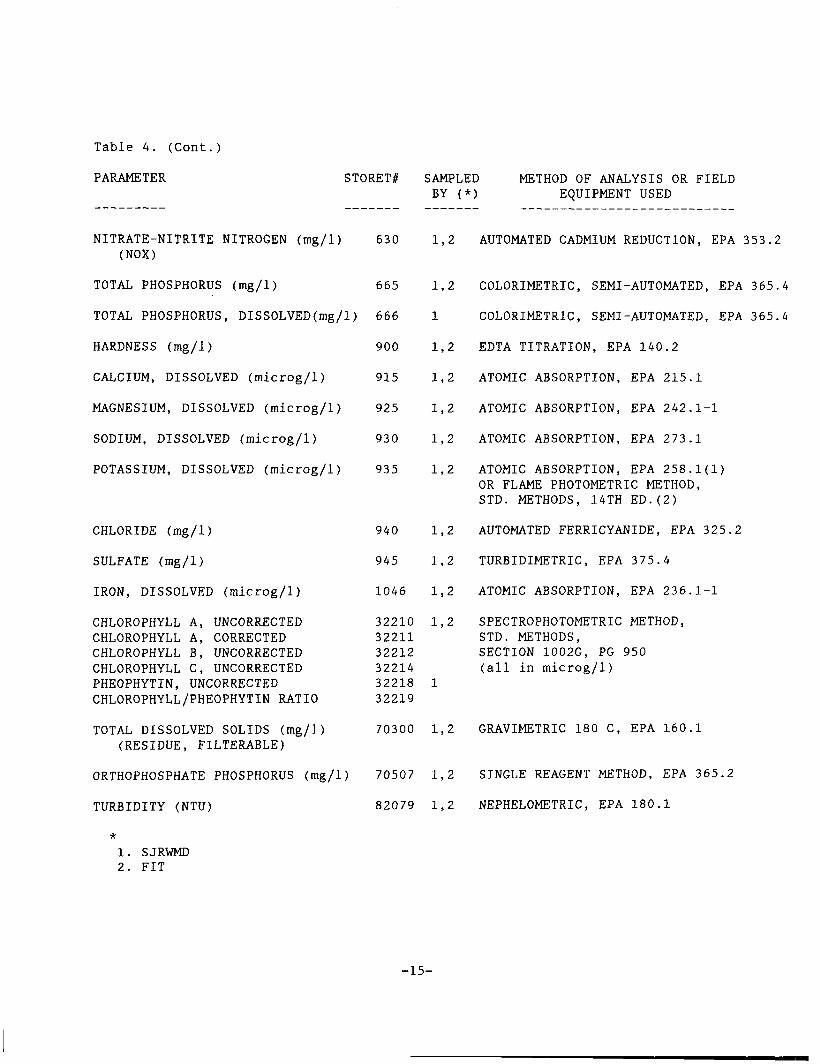
Table 4. (Cont.)
PARAMETER STORET#
NITRATE-NITRITE NITROGEN (mg/1) 630(NOX)
TOTAL PHOSPHORUS (mg/1) 665
TOTAL PHOSPHORUS, DISSOLVED(mg/1) 666
HARDNESS (mg/1) 900
CALCIUM, DISSOLVED (microg/1) 915
MAGNESIUM, DISSOLVED (microg/1) 925
SODIUM, DISSOLVED (microg/1) 930
POTASSIUM, DISSOLVED (microg/1) 935
SAMPLEDBY (*)
METHOD OF ANALYSIS OR FIELDEQUIPMENT USED
1,2 AUTOMATED CADMIUM REDUCTION, EPA 353.2
TOTAL DISSOLVED SOLIDS (mg/1)(RESIDUE, FILTERABLE)
1,2
1
1,2
1,2
1,2
1,2
1,2
CHLORIDE (mg/1) 940 1,2
SULFATE (mg/1) 945 1,2
IRON, DISSOLVED (microg/1) 1046 1,2
CHLOROPHYLL A, UNCORRECTED 32210 1,2CHLOROPHYLL A, CORRECTED 32211CHLOROPHYLL B, UNCORRECTED 32212CHLOROPHYLL C, UNCORRECTED 32214PHEOPHYTIN, UNCORRECTED 32218 1CHLOROPHYLL/PHEOPHYTIN RATIO 32219
ORTHOPHOSPHATE PHOSPHORUS (mg/1) 70507 1,2
TURBIDITY (NTU) 82079 1,2
COLORIMETRIC, SEMI-AUTOMATED, EPA 365.4
COLORIMETRIC, SEMI-AUTOMATED, EPA 365.4
EDTA TITRATION, EPA 140.2
ATOMIC ABSORPTION, EPA 215.1
ATOMIC ABSORPTION, EPA 242.1-1
ATOMIC ABSORPTION, EPA 273.1
ATOMIC ABSORPTION, EPA 258.1(1)OR FLAME PHOTOMETRIC METHOD,STD. METHODS, 14TH ED. (2)
AUTOMATED FERRICYANIDE, EPA 325.2
TURBIDIMETRIC, EPA 375.4
ATOMIC ABSORPTION, EPA 236.1-1
SPECTROPHOTOMETRIC METHOD,STD. METHODS,SECTION 1002G, PG 950(all in microg/1)
70300 1,2 GRAVIMETRIC 180 C, EPA 160.1
SINGLE REAGENT METHOD, EPA 365.2
NEPHELOMETRIC, EPA 180.1
1. SJRWMD2. FIT
-15-
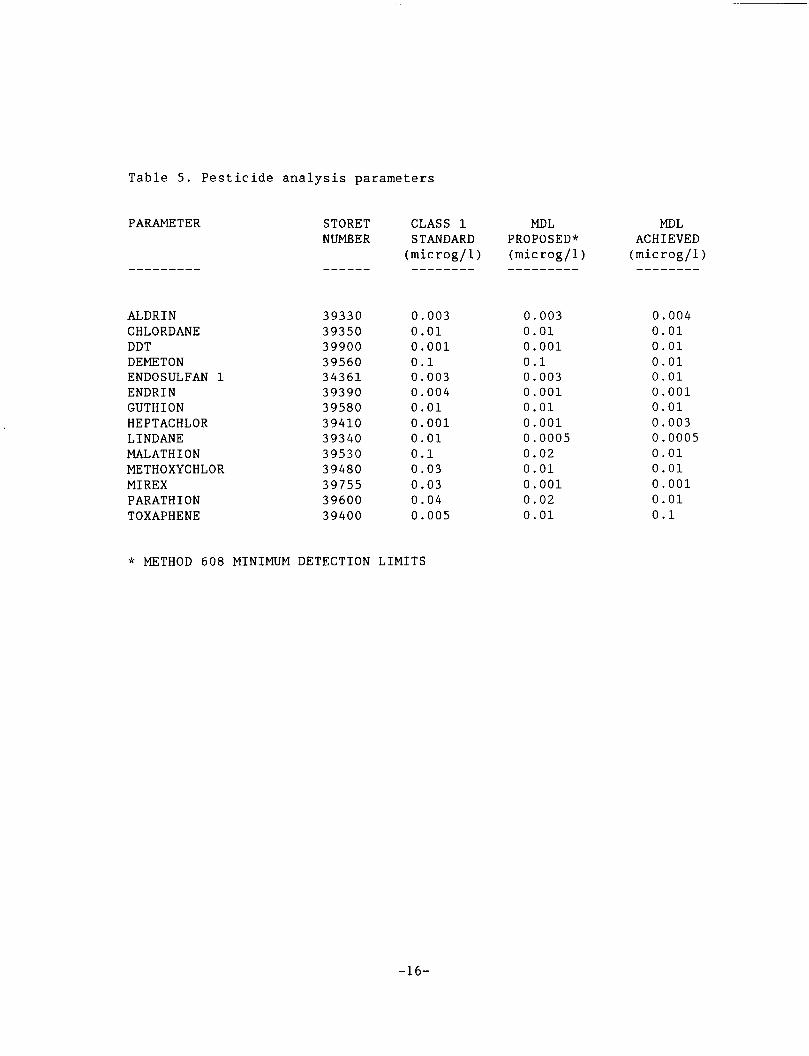
Table 5. Pesticide analysis parameters
PARAMETER
ALDRINCHLORDANEDDTDEMETONENDOSULFAN 1ENDRINGUTHIONHEPTACHLORLINDANEMALATHIONMETHOXYCHLORMIREXPARATHIONTOXAPHENE
STORETNUMBER
CLASS 1STANDARD(microg/1)
3933039350399003956034361393903958039410393403953039480397553960039400
00000000000000
.003
.01
.001
.1
.003
.004
.01
.001
.01
.1
.03
.03
.04
.005
MDLPROPOSED*(microg/1 )
0.0030.010.0010.10.0030.0010.010.0010.00050.020.010.0010.020.01
MDLACHIEVED(microg/1)
0.0040.010.010.010.010.0010.010.0030.00050.010.010.0010.010.1
* METHOD 608 MINIMUM DETECTION LIMITS
-16-
description of sample collection techniques , re fer to the SJRWMD WaterQuality Monitoring Field Manual (Fall and Osburn 1985 ) .
In the work performed by Florida Institute of Technology( F I T ) , one gallon grab samples were collected as close to the pumpdischarge as possible . Chemical analysis of all samples was performedin accordance with EPA recommended procedures as described in EPAdocument EPA/600-4-79-020 (Table 4 ) . One sample from each site wasanalyzed in duplicate and EPA reference samples were routinelyanalyzed .
Compliance data provided to FDER by Deseret Ranches ofFlorida, Inc . , Rollins Blue Cypress Ranch, Fellsmere Joint Ventures,I n c . , and Berry Groves , I n c . , were tabulated for comparison. Noquality assurance information was provided with the data . Sampleanalysis was performed for Deseret by Bionomics Analytical Laboratory ,for Rollins Ranch by Flowers Chemical Laboratories , and for BerryGroves and Fellsmere Joint Ventures by Flowers, Pioneer Laboratories,or Agri-Business Cooperative . One hundred f i f ty- two samples werecollected from 12 different pumps from 1981 to 1986 . According to thepermit conditions , compliance samples should be collected at the pumpintake. Samples were generally analyzed for pH , specific conductance,dissolved oxygen , five day biochemical oxygen demand , total suspendedsolids, total dissolved solids, chloride, sulfate , total Kje ldahlnitrogen, nitrate and/or nitrite nitrogen, total phosphorus, andselected pesticides .
-17-

RESULTS
COMPARISON OF PUMP DISCHARGE TO RECEIVING WATER BODY AND WATER QUALITYSTANDARDS
Dissolved Oxygen and Biochemical Oxygen Demand
Median dissolved oxygen concentration in pump discharges was2.8 mg/1 and ranged from 0.0 to 9.5 mg/1 (Table 6 ) . Only 11 percentof the discharges met the minimum state water quality standard of 5mg/1 (Chapter 17-3, Florida Administrative C o d e ) . In comparison,median dissolved oxygen in the receiving water body was 3 .5 mg/1 andranged from 0 to 11 .8 mg/1 . Thirty-nine percent of the measurementsexceeded 5 mg/1 .
Pump discharges contained a slightly higher BOD (median = 2 .7mg/1) than the receiving water body (median = 1.6 m g / 1 ) .
Suspended Solids and Turbidity
The median suspended solids concentration of pump discharges ,10 .8 mg/1 , was four times higher than that of the receiving waterbody , at 2 .7 mg/1 . Values exceeding 100 mg/1 were observed atFellsmere 's N o . 10 and N o . 6 pumps (MAP, ZZP ; see Table 1, Figure 3for pump designations). High suspended solid levels in the receivingwater body were recorded at marsh sites and ref lect the d i f f icul ty ofcollecting water samples in a shallow marsh .
Median turbidity levels in pump discharges were 4 .2 NTU andranged from 1 .1 to 73 .0 NTU . Violations of state water qualitystandards were observed twice, at Fellsmere 's N o . 10 (MAP) and N o . 5(ZZPX ) pumps. Turbidity levels in the receiving water body were muchlower , with a median concentration of 1 .3 mg/1 . In 314 measurements ,no violations of Chapter 17-3 standards were observed in the receivingwater body .
-19-
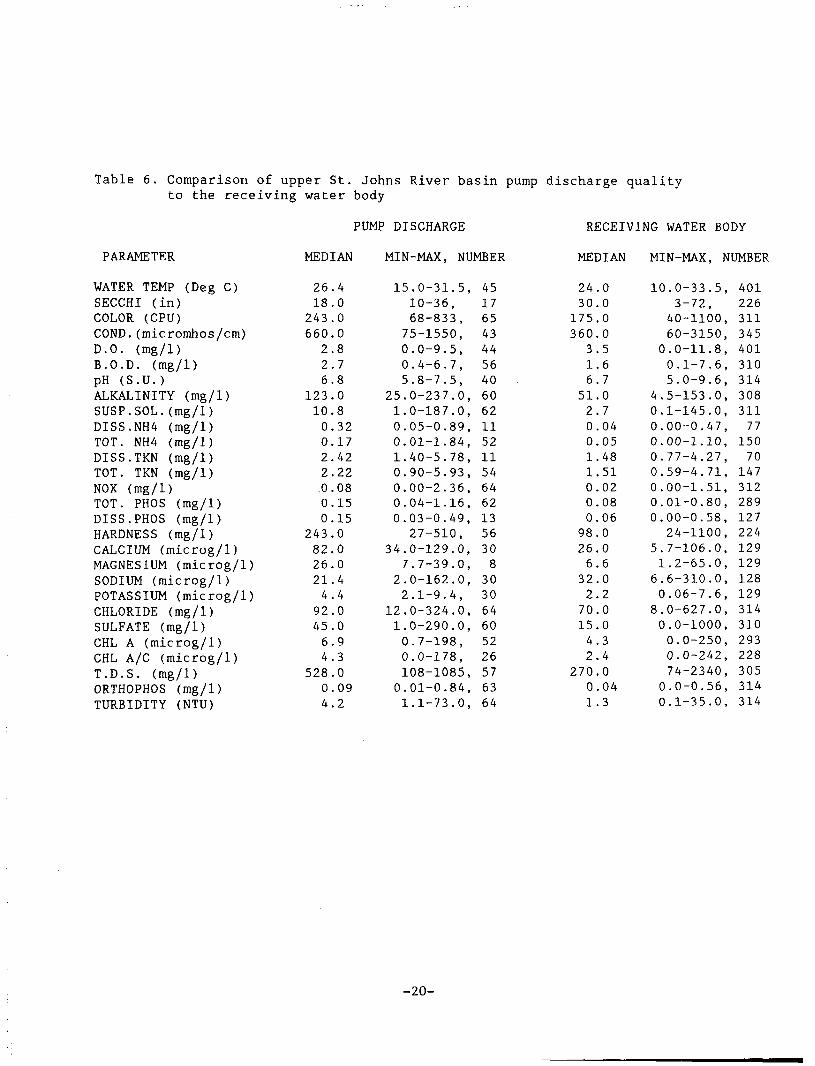
Table 6. Comparison of upper St. Johns River basin pump discharge qualityto the receiving water body
PUMP DISCHARGE RECEIVING WATER BODY
PARAMETER
WATER TEMP (Deg C)SECCHI (in)COLOR (CPU)COND.(micromhos/cm)D.O. (mg/1)B.O.D. (mg/1)pH (S.U.)ALKALINITY (mg/1)SUSP.SOL.(mg/1)DISS.NH4 (mg/1)TOT. NH4 (mg/1)DISS.TKN (mg/1)TOT. TKN (mg/1)NOX (mg/1)TOT. PHOS (mg/1)DISS.PHOS (mg/1)HARDNESS (mg/1)CALCIUM (microg/1)MAGNESIUM (microg/1)SODIUM (microg/1)POTASSIUM (microg/1)CHLORIDE (mg/1)SULFATE (mg/1)CHL A (microg/1)CHL A/C (microg/1)T.D.S. (mg/1)ORTHOPHOS (mg/1)TURBIDITY (NTU)
MEDIAN MIN-MAX, NUMBER MEDIAN MIN-MAX, NUMBER
2618243660226
123100022.000
2438226214924564
52804
.4
.0
.0
.0
.8
.7
.8
.0
.8
.32
.17
.42
.22
.08
.15
.15
.0
.0
.0
.4
.4
.0
.0
.9
.3
.0
.09
.2
15 .0-3110-36
.5,9
68-833,75-1550,
2510010000
005.........
.0-9.
.4-6.
.8-7.0-2370-18705-0.01-1.40-5.90-5.00-2.04-1.03-0.
5,7,5,.0,.0,89,84,78,93,36,16,49,
27-510,34
2
121
.7,
2,
.
00
0-129.7-390-162.1-9.0-3240-290
.0,
.0,
.0,4,.0,.0,
.7-198,
.0-178,108-1085,0101-0..1-73
84,.0,
4517654344564060621152115464621356308303064605226576364
2430175360
316
512001100098266322701542
27001
.0
.0
.0
.0
.5
.6
.7
.0
.7
.04
.05
.48
.51
.02
.08
.06
.0
.0
.6
.0
.2
.0
.0
.3
.4
.0
.04
.3
10
0
4.0.0.0.0.0.0.0.0.
5.1
6.08.0
00
.0-33.5,3-72,40-1100,60-3150,.0-11.8,0.1-7.6,5.0-9.6,5-153.0,1-145.0,00-0.47,00-1.10,77-4.27,59-4.71,00-1.51,01-0.80,00-0.58,24-1100,7-106.0,.2-65.0,6-310.0,.06-7.6,0-627.0,.0-1000,0.0-250,0.0-242,74-2340,.0-0.56,.1-35.0,
4012263113454013103143083117715070
147312289127224129129128129314310293228305314314
-20-
Metals and Minerals
For pumps which discharged to Class I wa te r s , no violations ofthe chloride standard were observed. The highest chlorideconcentrations (192-199 tng/1) were observed at Fellsmere 's N o . 10(MAP) and Deseret 's OG12 (BDP) pumps. During the study per iod,chloride levels in the Class I receiving water body exceeded 250 mg/1on four occasions, each at Station SMO . Since this station is locatedin a canal upstream of most of the pump discharges and the violationsoccurred in February 1982, May 1984, and May 1986, the high chloridelevels are probably due to bank seepage and evaporation, notagricultural pump discharge . The instantaneous water quality standardfor total dissolved solids (less than 1000 mg/1) was violated once atFel lsmere 's N o . 4 pump ( IMP) .
Pump discharges were generally more mineralized than thereceiving water body. Mean calcium, magnesium, potassium, sulfate ,and alkalinity levels in pump discharges were twice those found in thereceiving water body (Table 6 ) .
Nutrients
Nutrient levels in pump discharges were generally two to fivetimes higher than levels found in the receiving water body . The pumpstypically discharged high levels of inorganic nitrogen , exhibitingmedian concentrations of 0 .08 mg/1 for nitrate-nitrite nitrogen and0.17 mg/1 for ammonia nitrogen , compared to 0 .02 mg/1 and 0 .03 mg/1 ,respectively, in the receiving water body (Table 6 ) . Median totalphosphorus and orthophosphate concentrations in the pump dischargeswere 0 .15 mg/1 and 0 .09 mg/1 , respectively , compared to 0 .08 mg/1 and0.04 mg/1 in the receiving water body .
Pumps discharged nutrients primarily in a dissolved form . Anaverage 67 percent of the total phosphorus, 75 percent of the ammonia,and 94 percent of the total Kjeldahl nitrogen were not removed byfiltering .
Pesticides
Concentrations of 14 selected pesticides (Table 5) were belowminimum detection limits for 13 pump discharge samples and 71 ambientwater quality samples .
COMPARISONS BETWEEN PUMPS
Water quality varied considerably among pumps (Appendix B ) .Fellsmere 's pumps, Nos . 5 /6 , 10, and 4 ( Z Z P / Z Z P X , MAP , and LMP )discharged nitrate-nitrite concentrations much higher than theremaining pumps (Figure 5 ) , ranging from 0 .32 to 0.81 mg/1. Median
-21-
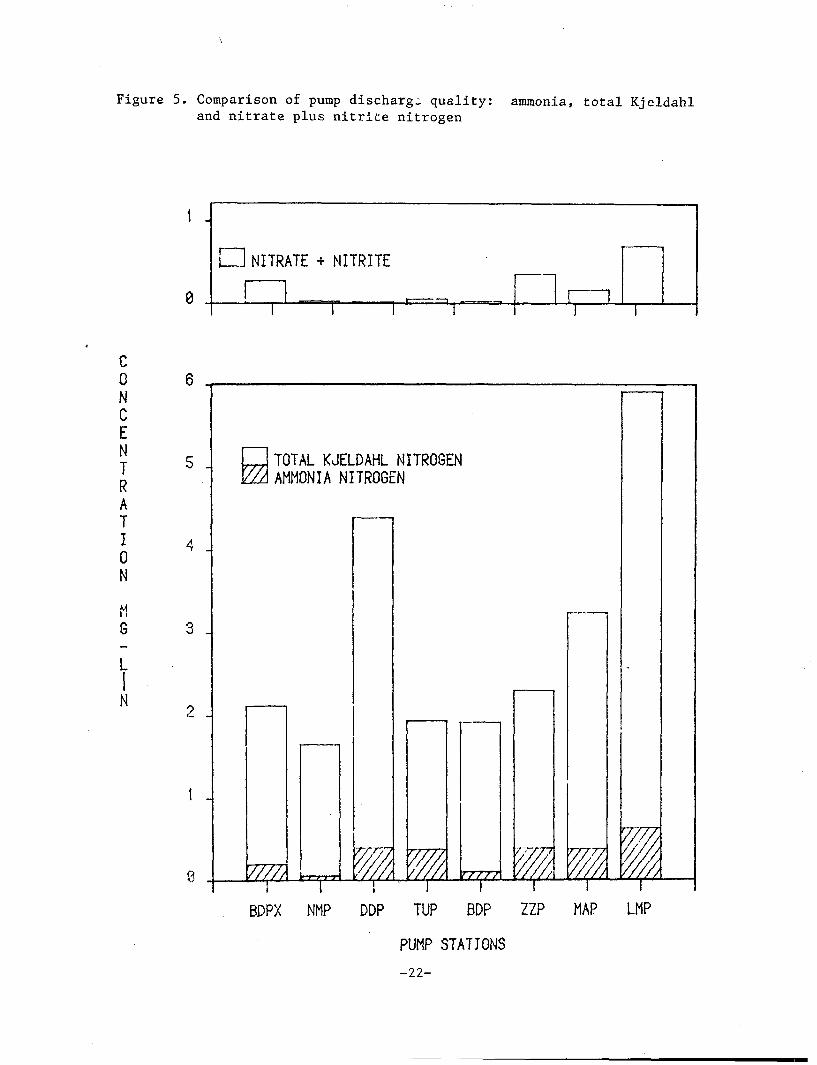
Figure 5. Comparison of pump discharge quality: ammonia, total Kjeldahland nitrate plus nitrite nitrogen
t .
fl
NITRATE + NITRITE
l i l t~|
1 I
c0NCENTRATI0N
M6
L
N
5 .
4 .
3 .
2 .
TOTAL KJELDAHL NITROGENAMMONIA NITROGEN
77,
BDPX NMP DDP TUP BDP IIP
PUMP STATIONS
MAP LMP
-22-
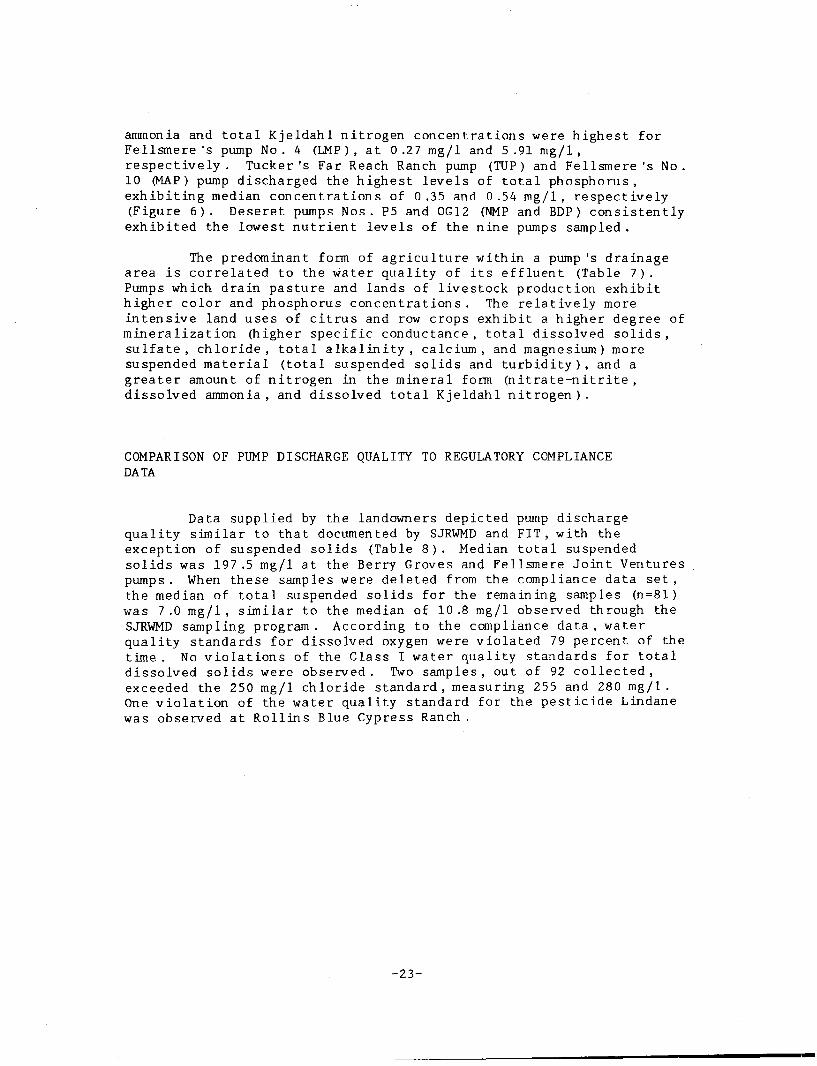
ammonia and total Kje ldahl nitrogen concentrations were highest forFellsmere 's pump No . 4 (LMP ) , at 0 .27 mg/1 and 5 .91 mg/1 ,respectively. Tucker ' s Far Reach Ranch pump (TUP) and Fellsmere 's N o .10 (MAP) pump discharged the highest levels of total phosphorus,exhibiting median concentrations of 0 .35 and 0 .54 mg/1 , respectively(Figure 6 ) . Deseret pumps Nos . P5 and OG12 (NMP and BDP) consistentlyexhibited the lowest nutrient levels of the nine pumps sampled .
The predominant form of agr icul ture within a pump 's drainagearea is correlated to the water quality of its e f f luen t (Table 7 ) .Pumps which drain pasture and lands of livestock production exhibithigher color and phosphorus concentrations . The relatively moreintensive land uses of citrus and row crops exhibit a higher degree ofmineralization (higher specific conductance, total dissolved solids,sulfa te , chloride, total alkal ini ty, calcium, and magnesium) moresuspended material (total suspended solids and tu rb id i ty ) , and agreater amount of nitrogen in the mineral form (nitrate-nitri te,dissolved ammonia, and dissolved total Kjeldahl n i t rogen) .
COMPARISON OF PUMP DISCHARGE QUALITY TO REGULATORY COMPLIANCEDATA
Data supplied by the landowners depicted pump dischargequality similar to that documented by SJRWMD and F I T , with theexception of suspended solids (Table 8 ) . Median total suspendedsolids was 197 .5 mg/1 at the Berry Groves and Fellsmere Joint Venturespumps . When these samples were deleted from the compliance data set ,the median of total suspended solids for the remaining samples (n = 81)was 7.0 mg/1, similar to the median of 10.8 mg/1 observed through theSJRWMD sampling program . According to the compliance data , waterquality standards for dissolved oxygen were violated 79 percent of thetime . No violations of the Class I water quality standards for totaldissolved solids were observed. Two samples, out of 92 col lec ted ,exceeded the 250 mg/1 chloride standard, measuring 255 and 280 mg/1 .One violation of the water quality standard for the pesticide Lindanewas observed at Rollins Blue Cypress Ranch .
-23-
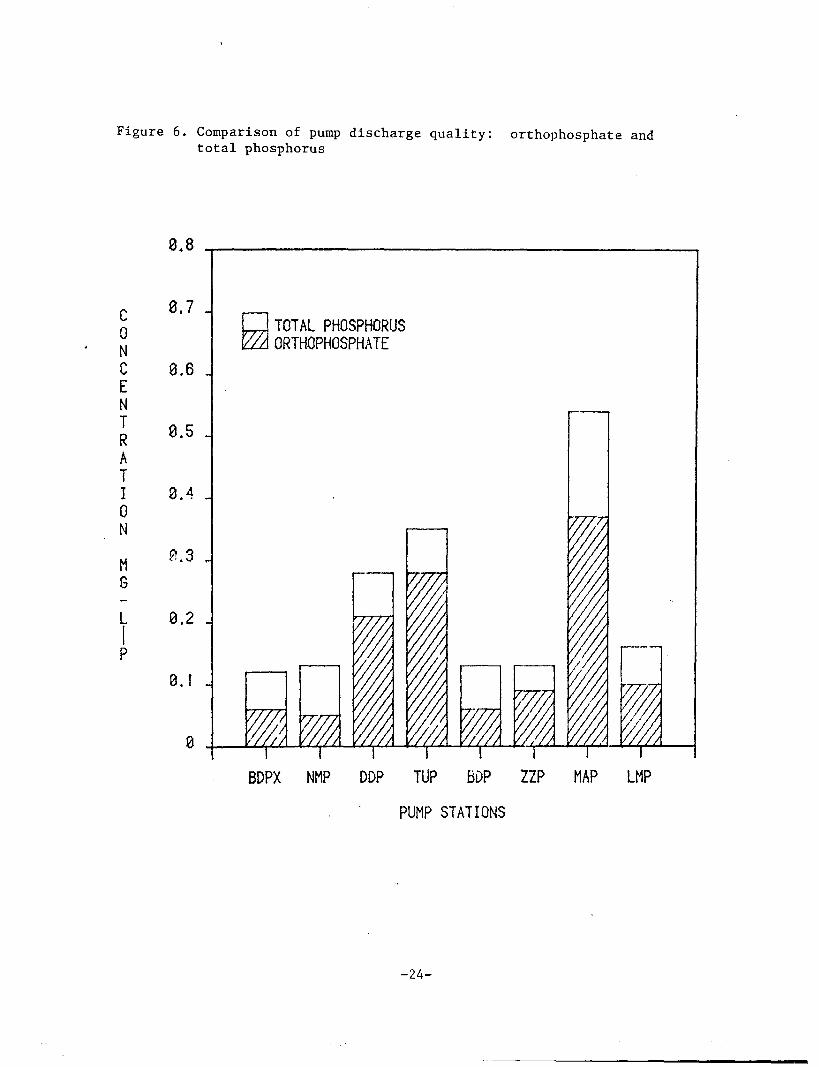
Figure 6. Comparison of pump discharge quality: orthophosphate andtotal phosphorus
c0NCENTRATI0N
MG
L
P
048
0,7
8.6
0.5
0.4 _
0.2 .
0.1 -
8
TOTAL PHOSPHORUSORTHOPHOSPHATE
m
7777,
w,.BDPX
\NMP
IDDP
ITUP
IBDP 2ZP
PUMP STATIONS
IMAP
IIMP
-24-
Table 7. Comparison of upper St. Johns River basin pasture and citrus/rowcrop pumps by median concentration
PASTURE PUMPS
PARAMETER MEDIAN
WATER TEMP (Deg C) 26.5COLOR (CPU) 300.0COND. (micromhos/cm) 450.0D.O. (mg/1) 1.1B.O.D. (mg/1) 3.2PH (S.U.) 6.5ALKALINITY (mg/1) 56.0SUSP.SOL. (mg/1) 6.0DISS. NH4 (mg/1) 0.23TOT. NH4 (mg/1) 0.12DISS. TKN (mg/1) 2.03TOT. TKN (mg/1) 2.14NOX (mg/1) 0.03TOT.PHOS.(mg/1) 0.23DISS. PHOS. (mg/1) 0.14HARDNESS (mg/1) 137.0CALCIUM (micg/1) 34.4MAGNESIUM (micg/1) 13.9SODIUM (micg/1) 6.0POTASSIUM (micg/1) 3.5CHLORIDE (mg/1) 64.0SULFATE (mg/1) 23.0CHLOROPHYLL A (micg/ 1) 5.5T.D.S. (mg/1) 304.0ORTHOPHOSPHATE (mg/1) 0.17TURBIDITY (NTU) 2.8
MIN-MAX, NUMBER
CIRUS/ROW CROP PUMPS
MEDIAN MIN-MAX, NUMBER
15120
52510.0.1.0.0.0.0.273068.
1210
.0-31.5
.0-550.75-15500.0-8.81.1-6.1.8-7.35.0-169..0-28.008-0.6301-1.8457-2.4295-5.2100-0.3406-0.7512-0.24.0-446..0-107..0-37.03-162.92.1-9.2.0-324..0-290..7-35.8
,o,9
9
,
9
o,9
y
,
9
9
9
,
9
o,0,9
9
9
o,o,9
108-1085,01.01-0.51,.1-14.0 9
16191516171317184
144
1619184155455191716171818
26200800326
150130032000
280842921498618
55405
.2
.0
.0
.8
.6
.9
.0
.0
.58
.18
.20
.40
.25
.16
.12
.0
.1
.0
.4
.5
.0
.5
.2
.0
.09
.5
20.68.
5-30.0-833
0,.0,
77-1450,0.0.6.75.1.0.0.1.0.0.0.0.29.36.1322
38.14.1.
5-9.54-6.72-7.50-2375-18705-0.02-1.40-5.90-5.00-2.04-1.03-0.2-5100-129.0-39.0-72.5-9.0-1990-2091-197
»*
,.0,.0,89,50,78,93,36,16,49,.0,.0,.0,-0,4,.0,.0,.8,
284-1042,0.101-0..4-73
84,.0,
24352423302332337
287
2734339
311951919343226303435
-25-
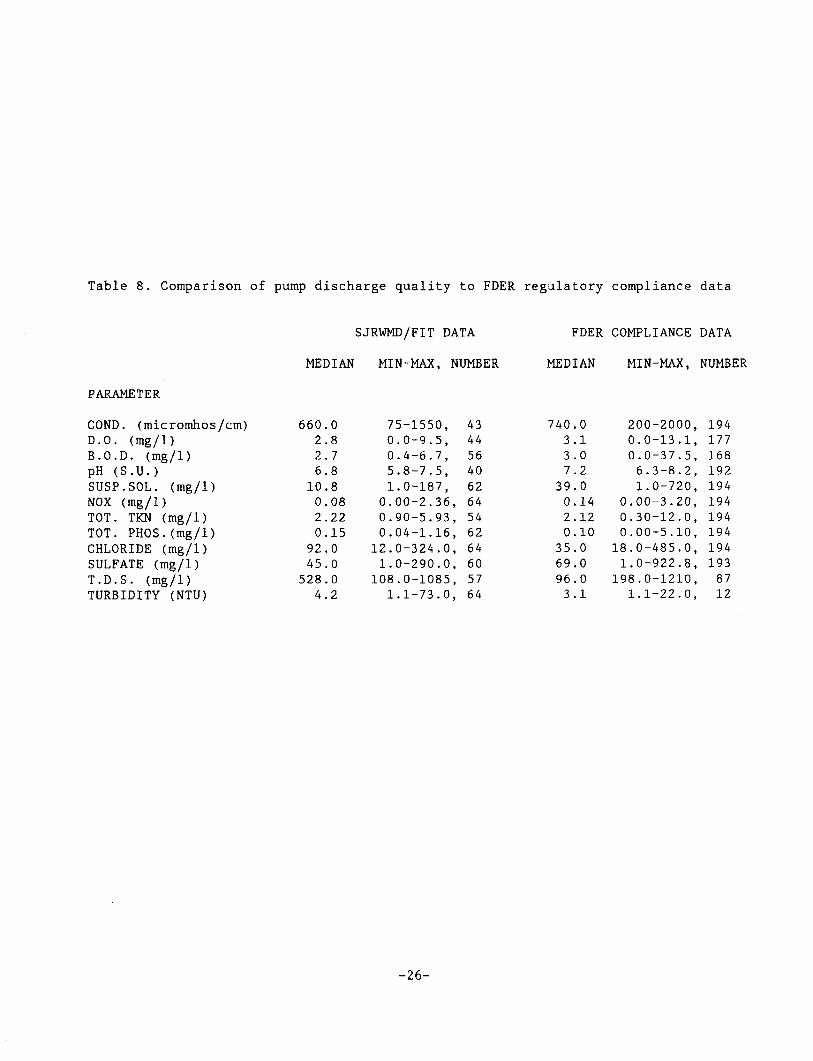
Table 8. Comparison of pump discharge quality to FDER regulatory compliance data
PARAMETER
COND. (micromhos/cm)D.O. (mg/1)B.O.D. (mg/1)pH (S.U.)SUSP.SOL. (mg/1)NOX (mg/1)TOT. TKN (mg/1)TOT. PHOS.(mg/l)CHLORIDE (mg/1)SULFATE (mg/1)T.D.S. (mg/1)TURBIDITY (NTU)
SJRWMD/FIT DATA
MEDIAN MIN-MAX, NUMBER
FDER COMPLIANCE DATA
MEDIAN MIN-MAX, NUMBER
6602261002092455284
.0
.8
.7
.8
.8
.08
.22
.15
.0
.0
.0
.2
75-1550,0051
0.0.0.12.1.1081
.0-9.
.4-6.
.8-7.
5,7,5,
.0-187,00-2.90-5.04-1.0-3240-290
36,93,16,.0,.0,
.0-1085,
.1-73 .0,
434456406264546264605764
740337
39020
3569963
.0
.1
.0
.2
.0
.14
.12
.10
.0
.0
.0
.1
200-2000,00.0-13.0-376.3-8
.1,
.5,
.2,1.0-720,
0.0.0.18.1.1981
00-3.30-1200-5.0-4850-922
20,.0,10,.0,.8,
.0-1210,
.1-22•0,
1941771681921941941941941941938712
-26-
DISCUSSION
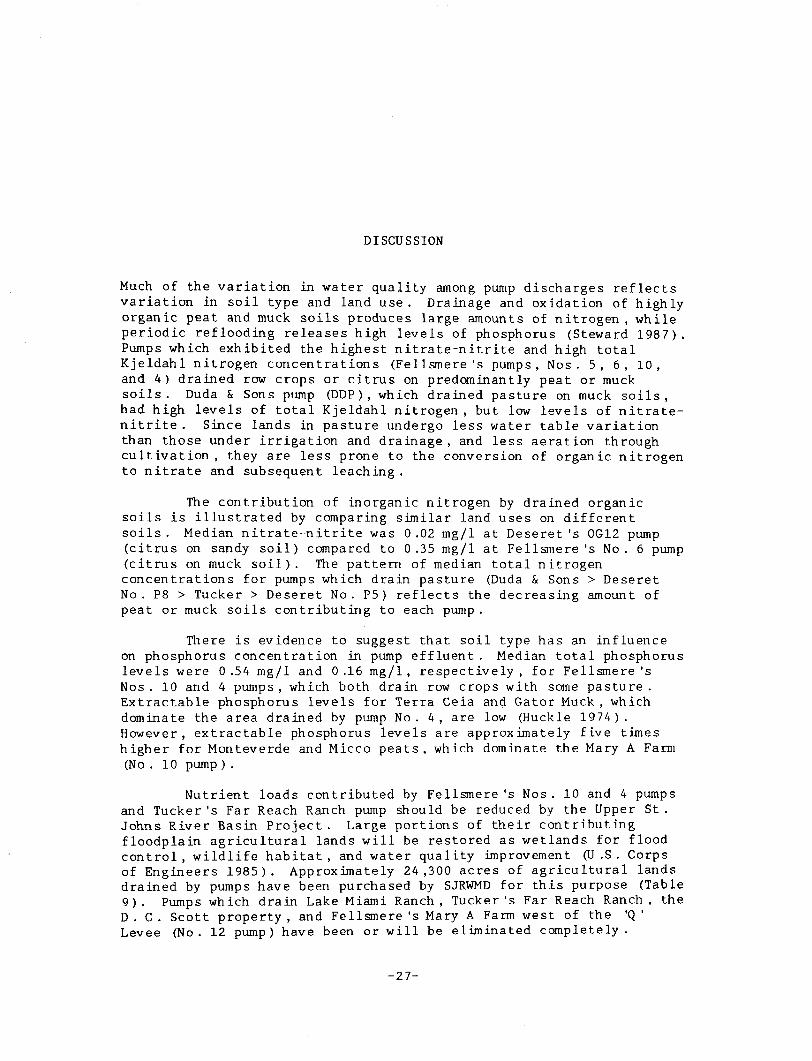
Much of the variation in water quality among pump discharges ref lectsvariation in soil type and land use . Drainage and oxidation of highlyorganic peat and muck soils produces large amounts of nitrogen , whileperiodic reflooding releases high levels of phosphorus (Steward 1987) .Pumps which exhibited the highest nitrate-nitrite and high totalKjeldahl nitrogen concentrations (Fellsmere 's pumps, Nos . 5, 6, 10,and 4) drained row crops or citrus on predominantly peat or mucksoils. Duda & Sons pump (DDP) , which drained pasture on muck soils,had high levels of total Kjeldahl nitrogen , but low levels of nitrate-nitrite . Since lands in pasture undergo less water table variationthan those under irrigation and drainage , and less aeration throughcultivation , they are less prone to the conversion of organic nitrogento nitrate and subsequent leaching .
The contribution of inorganic nitrogen by drained organicsoils is illustrated by comparing similar land uses on d i f fe ren tsoils. Median nitrate-nitrite was 0.02 mg/1 at Deseret 's OG12 pump(citrus on sandy soil) compared to 0.35 mg/1 at Fellsmere 's N o . 6 pump(citrus on muck soi l ) . The pattern of median total nitrogenconcentrations for pumps which drain pasture (Duda & Sons > DeseretN o . P8 > Tucker > Deseret N o . P5) ref lects the decreasing amount ofpeat or muck soils contributing to each pump .
There is evidence to suggest that soil type has an influenceon phosphorus concentration in pump e f f luen t . Median total phosphoruslevels were 0 .54 mg/1 and 0 .16 mg/1 , respect ively, for Fellsmere 'sNos . 10 and 4 pumps , which both drain row crops with some pasture .Extractable phosphorus levels for Terra Ceia and Gator Muck , whichdominate the area drained by pump No . 4 , are low (Huckle 1 9 7 4 ) .However , extractable phosphorus levels are approximately five timeshigher for Monteverde and Micco pea ts , which dominate the Mary A Farm(No . 10 pump ) .
Nutrient loads contributed by Fellsmere 's Nos . 10 and 4 pumpsand Tucker 's Far Reach Ranch pump should be reduced by the Upper St .Johns River Basin Project . Large portions of their contributingfloodplain agricultural lands will be restored as wetlands for floodcontrol , wi ldl i fe habitat , and water quality improvement (U .S . Corpsof Engineers 1985). Approximately 24 ,300 acres of agricultural landsdrained by pumps have been purchased by SJRWMD for this purpose (Table9 ) . Pumps which drain Lake Miami Ranch, Tucker ' s Far Reach Ranch, theD . C . Scott property , and Fellsmere 's Mary A Farm west of the 'Q 'Levee (No . 12 pump) have been or will be eliminated complete ly .
-27-
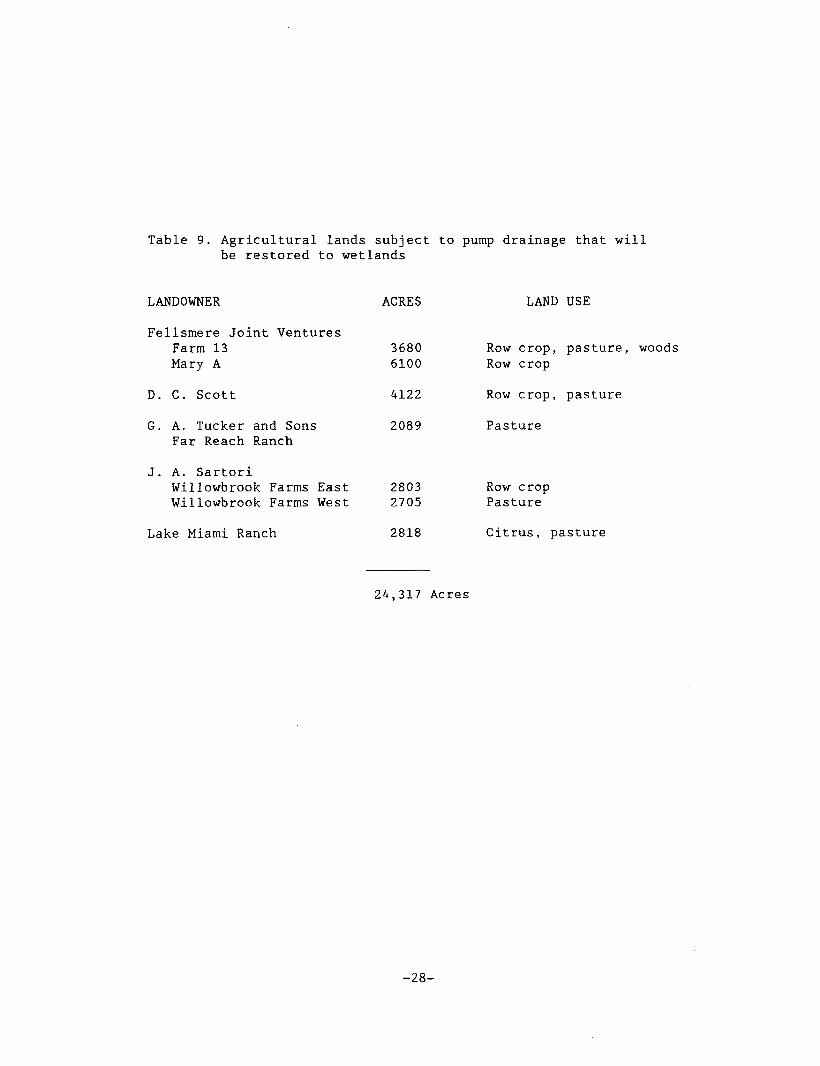
Table 9. Agricultural lands subject to pump drainage that willbe restored to wetlands
LANDOWNER ACRES
Fellsmere Joint VenturesFarm 13 3680Mary A 6100
D. C. Scott 4122
G. A. Tucker and Sons 2089Far Reach Ranch
J. A. SartoriWillowbrook Farms East 2803Willowbrook Farms West 2705
Lake Miami Ranch 2818
LAND USE
Row crop, pasture, woodsRow crop
Row crop, pasture
Pasture
Row cropPasture
Citrus, pasture
24,317 Acres
-28-
Fellsmere 's No . A pump has been dismantled and approximately 3 ,680acres of row crop and pasture are being reflooded .
In addition to reducing the acreage drained by pumps in thebasin , the project will segregate and detain some agricultural runoffin Water Management Areas (Figure 7 ) . Fellsmere 's Nos . 5 and 6 pumps,a relocated No . 4 pump , and Berry Groves pump will discharge to theSt . Johns Water Management Area (SJWMA ) . The long retention times(minimum of 38 days) provided by the SJWMA are expected to reducesuspended solids, BOD, and inorganic nitrogen levels. However ,Fellsmere Joint Ventures plans to convert approximately 8 ,000 acres ofimproved pasture to c i t rus , row c rop , watercress , and sod. Thisintensification of land use will occur on predominantly organic soils(Gator , Canova , and Terra Ceia m u c k ) and should increase the net
nitrogen load discharged by Fellsmere 's pumps . The net e f fec t on thereceiving water body will depend on the nutrient removal ability ofthe SJWMA .
Large agricultural detention reservoirs in the upper St . JohnsRiver basin reduced inorganic nitrogen concentrations by 85 to 89percent (Fall and Hendrickson 1988), part ly through conversion toorganic nitrogen . Typically , total nitrogen and phosphorusconcentrations were reduced by less than 50 percent . Dissolved oxygenlevels increased by about one-third in the St . Johns Water ControlDistrict reservoir . Reductions in chloride and total dissolved solidsconcentrations were not significant , statistically . Therefore , thereservoirs seem to be an appropriate method to reduce nutrient levels,particularly inorganic nitrogen , discharged by agricul turaloperations. However , the reservoirs are less effect ive at addressingthe mineralization and dissolved oxygen problems which beset the upperSt . Johns River basin unless they reduce the volume discharged and ,thereby , reduce pollutant loads .
Pesticide samples were analyzed for species listed in Chapter17-3 F A .C . (Table 3 ) . It is not known whether these pesticides wereapplied in the study area . In addition , the sampling intervals werenot designed to match the recommended application times for theanalyzed pesticides . Although one can conclude that the analyzedpesticides are not persistently present in the receiving water body ,fur ther conclusions regarding the source or presence of additionalpesticide species are unwarranted .
-29-
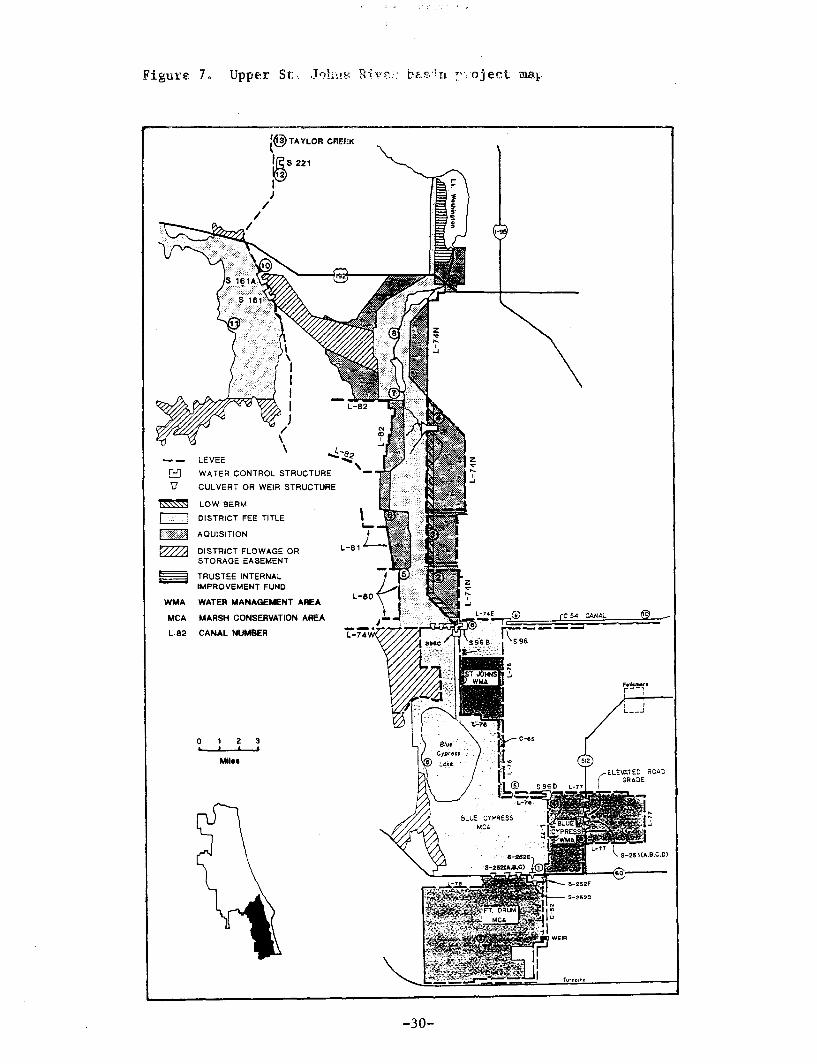
Figure. 7« Upper St, Johus Rlv?.;,' bae:!n project map
|P3) TAYLOR CREFIK
LEVEE
WATER CONTROL STRUCTURE
CULVERT OR WEIR STRUCTURE
LOW BERM
DISTRICT FEE TITLE
AOU1SITION
DISTRICT FLOWAGE ORSTORAGE EASEMENT
TRUSTEE INTERNALIMPROVEMENT FUND
WATER MANAGEMENT AREA
MARSH CONSERVATION AREA
CANAL NUMBER
ELEVATED ROADGRADE
-30-
CONCLUSION
Agricul tural pumps in the upper St . Johns River basin discharged waterof poorer quality than that of the receiving water body . Nutrient ,suspended solid, and mineral levels were two to five times higher inpump discharges compared to the receiving water body . Dissolvedoxygen levels in pump discharges were generally below state waterquality standards and the levels found in the receiving water body .Regulatory compliance data submitted to FDER documented resultssimilar to the SJRWMD monitoring program .
Differences in water quality discharged by individual pumpswere due primarily to soil type and land use . Intensive drainage oforganic soils , which produced the poorest water quality , should bediscouraged or treatment before discharge be required . The Upper St .Johns River Basin Project will eliminate selected pumps and reduce thedrainage area of others .
-31-

LITERATURE CITED
Belanger , T . V . , S . D . Van Vonderen , and T . J . Carberry . 1983 .Analysis of selected water quality factors in the upper St . JohnsRiver basin . Report to the St . Johns River Water ManagementDistrict . Melbourne , Fla . : Florida Institute of Technology .
CH2M H i l l . 1979. Assessment of water quality . Report for DeseretRanches of Florida . Gainesville , Fla .
Fall , C . J . and W . L . Osburn . 1985 . Water quality monitoring fieldmanual . Pa la tka , F l a . : St . Johns River Water Management Distr ict .
Fall , C . J . and J . C . Hendrickson . 1988 . An investigation of theSt . Johns Water Control District : Reservoir water quality and farmpractices . Technical Publication SJ 88-5 . Palatka , Fla . : St . JohnsRiver Water Management District .
Florida Department of Environmental Regulation . 1982 . St . JohnsRiver—Water Quality . February , 1982. Orlando, F l a . : S t . JohnsRiver District .
Buckle , H . F . , H . D . Dollar , and R . F . Pendleton . 1974 . Soil surveyof Brevard County , Florida . Washington, D .C . : Soil ConservationService , U . S . Department of Agriculture .
Lowe , E . F . , J . E . Brooks , C . J . Fall , L . R . Gerry , and G . B . Hal l .1984 . Diagnostic study . U . S . EPA Clean Lakes Program, Phase I ,diagnostic-feasibility study of the upper St . Johns River chain oflakes . V o l . I . Technical Publication SJ 84-15. Pa la tka , F l a . : S t .Johns River Water Management District .
St . Johns River Water Management District . 1980 . Upper St . JohnsRiver basin surface water management plan , vo l . 2 . Pala tka , Fla .
Steward, J. S. 1987. Potential nutrient loss from drained andflooded peat soils in the upper St . Johns River basin ( D r a f t ) .Palatka , Fla . : St . Johns River Water Management District .
Sull ivan, J . H. 1979. E f f e c t s of Agricultural Discharges in theUpper St . Johns River . Gainesville , Fla . : Water and Air Research .
-33-
U .S . Army Corps of Engineers. 1985. Spt . 2, Upper St . Johns andrelated areas . General design memorandum ; Upper St . Johns Riverbasin . Pt . 3 , Central and southern Florida project for floodcontrol and other purposes . Jacksonville , Fla . : JacksonvilleDistrict .
-34-
Appendix A
STATION DESCRIPTIONS AND DATA
-35-
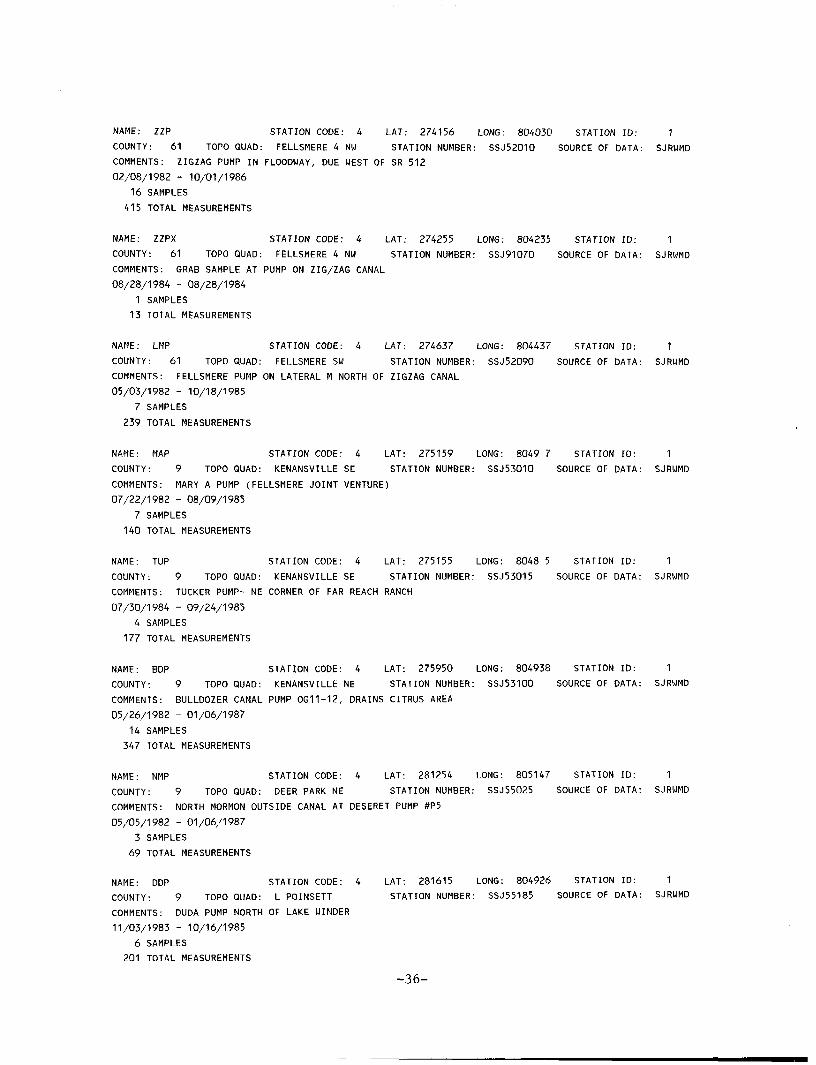
NAME: ZZP STATION CODE: 4 LAT: 274156 LONG: 804030 STATION ID: 1
COUNTY: 61 TOPO QUAD: FELLSMERE 4 NW STATION NUMBER: SSJ52010 SOURCE OF DATA: SJRUMD
COMMENTS: ZIGZAG PUMP IN FLOODWAY, DUE WEST OF SR 512
02/08/1982 - 10/01/1986
16 SAMPLES
415 TOTAL MEASUREMENTS
NAME: ZZPX STATION CODE: 4 LAT: 274255 LONG: 804235 STATION ID: 1
COUNTY: 61 TOPO QUAD: FELLSMERE 4 NU STATION NUMBER: SSJ91070 SOURCE OF DATA: SJRWMD
COMMENTS: GRAB SAMPLE AT PUMP ON ZIG/ZAG CANAL
08/28/1984 - 08/28/1984
1 SAMPLES
13 TOTAL MEASUREMENTS
NAME: LMP STATION CODE: 4 LAT: 274637 LONG: 804437 STATION ID: 1
COUNTY: 61 TOPO QUAD: FELLSMERE SW STATION NUMBER: SSJ52090 SOURCE OF DATA: SJRWMD
COMMENTS: FELLSMERE PUMP ON LATERAL M NORTH OF ZIGZAG CANAL
05/03/1982 - 10/18/1985
7 SAMPLES
239 TOTAL MEASUREMENTS
NAME: MAP STATION CODE: 4 LAT: 275159
COUNTY: 9 TOPO QUAD: KENANSVILLE SE STATION NUMBER:
COMMENTS: MARY A PUMP (FELLSMERE JOINT VENTURE)
07/22/1982 - 08/09/1985
7 SAMPLES
140 TOTAL MEASUREMENTS
LONG: 8049 7 STATION ID: 1
SSJ53010 SOURCE OF DATA: SJRWMD
NAME: TUP STATION CODE: 4 LAT: 275155 LONG: 8048 5 STATION ID: 1
COUNTY: 9 TOPO QUAD: KENANSVILLE SE STATION NUMBER: SSJ53015 SOURCE OF DATA: SJRUMD
COMMENTS: TUCKER PUMP- NE CORNER OF FAR REACH RANCH
07/30/1984 - 09/24/1985
4 SAMPLES
177 TOTAL MEASUREMENTS
NAME: BDP STATION CODE: 4 LAT: 275950 LONG: 804938 STATION ID: 1
COUNTY: 9 TOPO QUAD: KENANSVILLE NE STATION NUMBER: SSJ53100 SOURCE OF DATA: SJRUMD
COMMENTS: BULLDOZER CANAL PUMP OG11-12, DRAINS CITRUS AREA
05/26/1982 - 01/06/1987
14 SAMPLES
347 TOTAL MEASUREMENTS
NAME: NMP STATION CODE: 4 LAT: 281254 LONG: 805147 STATION ID: 1
COUNTY: 9 TOPO QUAD: DEER PARK NE STATION NUMBER: SSJ55025 SOURCE OF DATA: SJRWMD
COMMENTS: NORTH MORMON OUTSIDE CANAL AT DESERET PUMP #P5
05/05/1982 - 01/06/1987
3 SAMPLES
69 TOTAL MEASUREMENTS
NAME: DDP STATION CODE: 4
COUNTY: 9 TOPO QUAD: L POINSETT
COMMENTS: DUDA PUMP NORTH OF LAKE WINDER
11/03/1983 - 10/16/1985
6 SAMPLES
201 TOTAL MEASUREMENTS
LAT: 281615 LONG: 804926 STATION ID: 1
STATION NUMBER: SSJ55185 SOURCE OF DATA: SJRWMD
-36-
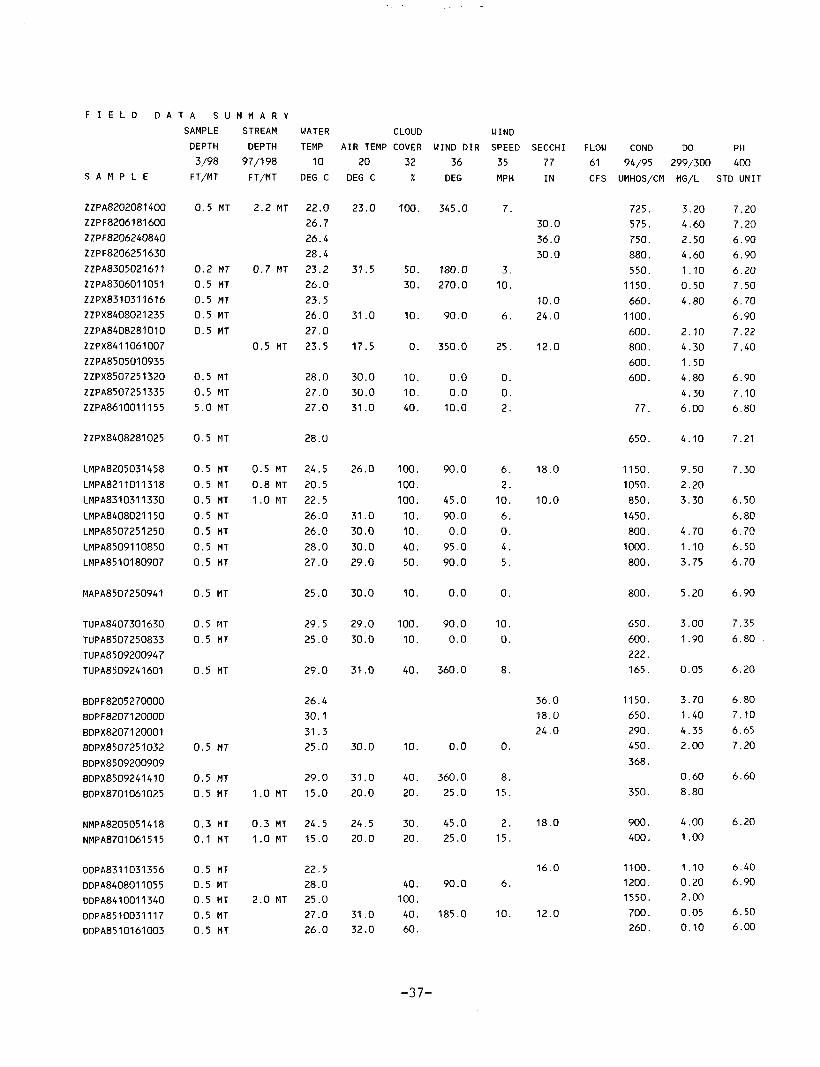
F I E L D
S A M P L E
ZZPA8202081400ZZPF8206181600ZZPF8206240840ZZPF8206251630ZZPA8305021611ZZPA8306011051ZZPX8310311616ZZPX8408021235
ZZPA8408281010ZZPX841 1061007ZZPA8505010935ZZPX8507251320ZZPA8507251335ZZPA8610011155
ZZPX8408281025
LMPA8205031458LMPA821 101 1318LMPA8310311330
LMPA8408021150LMPA8507251250LMPA85091 10850LHPA85 101 80907
MAPA8507250941
TUPA8407301630
TUPA8507250833TUPA8509200947TUPA8509241601
BDPF8205270000BDPF82071 20000
BDPX82071 20001BDPX8507251032BDPX8509200909BDPX8509241410BDPX8701 061025
NMPA8205051418NMPA8701061515
DDPA8311031356
DDPA8408011055
DDPA8410011340
DDPA8510031117
DDPA8510161003
SAMPLE
DEPTH
3/98
FT/MT
0.5 MT
0.2 MT0.5 MT
0.5 MT
0.5 MT
0.5 MT
0.5 MT
0.5 MT
5.0 MT
0.5 MT
0.5 MT
0.5 MT
0.5 MT0.5 MT0.5 MT0.5 MT
0.5 MT
0.5 MT
0.5 MT0.5 MT
0.5 MT
0.5 MT
0.5 MT
0.5 MT
0.3 MT
0.1 MT
0.5 MT
0.5 MT
0.5 MT
0.5 MT
0.5 MT
STREAM WATER
DEPTH TEMP
97/198 10
FT/MT DEG C
2.2 MT 22.026.726.428.4
0.7 MT 23.226.023.526.027.0
0.5 MT 23.5
28.027.027.0
28.0
0.5 MT 24.50.8 MT 20.51.0 MT 22.5
26.026.028.027.0
25.0
29.525.0
29.0
26.430.131.325.0
29.0
1.0 MT 15.0
0.3 MT 24.51.0 MT 15.0
22.528.0
2.0 MT 25.027.026.0
AIR TEMP
20DEG C
23.0
31.5
31.0
17.5
30.030.031.0
26.0
31.030.030.029.0
30.0
29.030.0
31.0
30.0
31.020.0
24.520.0
31.032.0
CLOUD
COVER
32%
100.
50.30.
10.
0.
10.10.40.
100.
100.100.10.10.
40.50.
10.
100.10.
40.
10.
40.20.
30.20.
40.100.40.60.
WIND DIR
36DEG
345.0
180.0270.0
90.0
350.0
0.00.010.0
90.0
45.0
90.00.095.090.0
0.0
90.00.0
360.0
0.0
360.025.0
45.025.0
90.0
185.0
WIND
SPEED
35
MPH
7.
3.
10.
6.
25.
0.0.2.
6.2.10.6.0.4.5.
0.
10.0.
8.
0.
8.15.
2.15.
6.
10.
SECCHI
77
IN
30.0
36.0
30.0
10.024.0
12.0
18.0
10.0
36.018.024.0
18.0
16.0
12.0
FLOW COND DO PH
61 94/95 299/300 400
CFS UMHOS/CM MG/L STD UNIT
725.
575.
750.880.550.1150.660.1100.600.800.600.600.
77.
650.
1150.1050.850.
1450.800.1000.800.
800.
650.600.222.165.
1150.650.290.450.368.
350.
900.400.
1100.1200.1550.700.260.
3.20
4.60
2.50
4.60
1.10
0.50
4.80
2.10
4.30
1.50
4.80
4.30
6.00
4.10
9.50
2.20
3.30
4.70
1.10
3.75
5.20
3.00
1.90
0.05
3.70
1.40
4.35
2.00
0.60
8.80
4.00
1.00
1.10
0.20
2.00
0.05
0.10
7.20
7.20
6.90
6.90
6.20
7.50
6.70
6.90
7.22
7.40
6.90
7.10
6.80
7.21
7.30
6.50
6.80
6.70
6.50
6.70
6.90
7.35
6.80
6.20
6.80
7.10
6.65
7.20
6.60
6.20
6.40
6.90
6.50
6.00
-37-
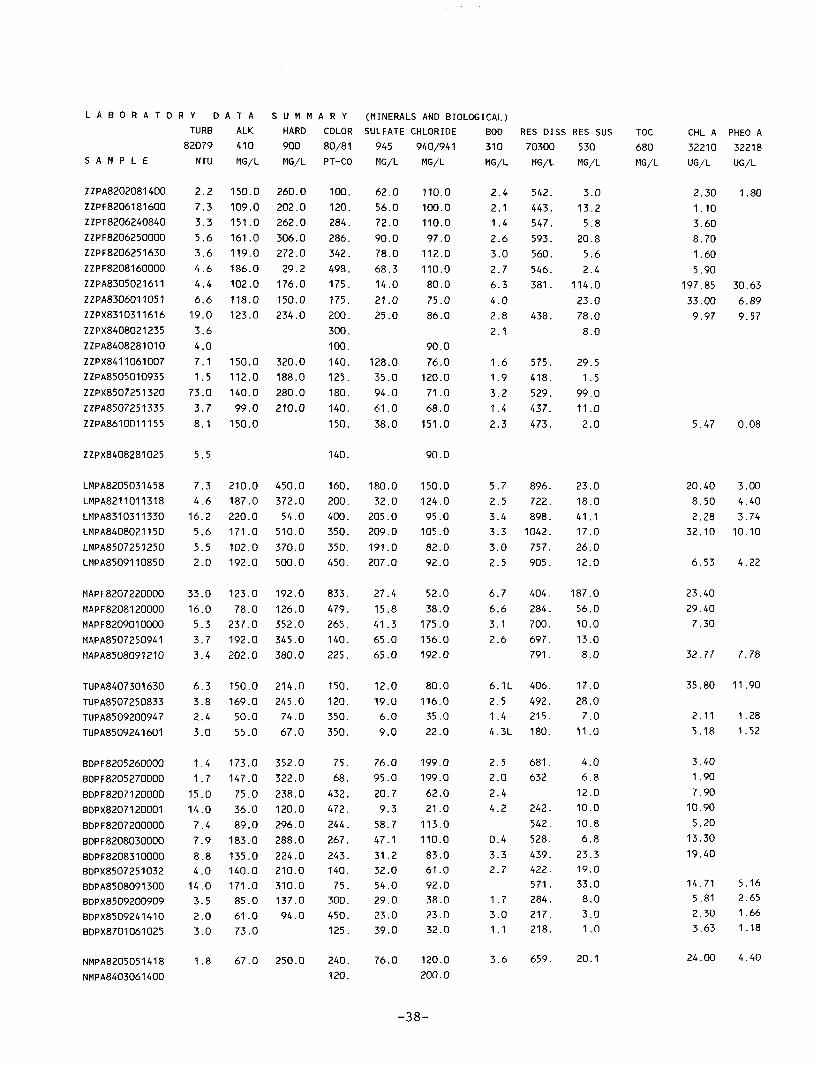
L A B O R A T O
S A M P L E
ZZPA8202081400ZZPF8206181600ZZPF8206240840ZZPF8206250000ZZPF8206251630ZZPF82081 60000ZZPA8305021611ZZPA8306011051ZZPX8310311616
ZZPX8408021235ZZPA8408281010ZZPX841 1061007ZZPA8505010935ZZPX8507251320ZZPA8507251335ZZPA8610011155
R Y DTURB82079
NTU
2.27.33.35.63.64.64.4
6.619.03.64.07.11.5
73.03.78.1
A T AALK410MG/L
150.0109.0151.0161.0119.0186.0102.0118.0123.0
150.0112.0140.099.0
150.0
S U M MHARD
900MG/L
260.0
202.0262.0306.0272.029.2176.0150.0234.0
320.0188.0280.0210.0
A R YCOLOR
80/81
PT-CO
100.
120.284.286.342.498.175.
175.200.300.100.140.125.180.140.150.
(MINERALS AND BIOLOGICAL)
SULFATE
945
MG/L
62.056.072.090.078.068.314.0
21.025.0
128.035.094.061.038.0
CHLORIDE
940/941MG/L
110.0
100.0110.0
97.0112.0110.080.0
75.086.0
90.0
76.0120.071.068.0
151.0
BOD310MG/L
2.42.11.42.63.02.76.3
4.02.82.1
1.61.93.21.4
2.3
RES DISS
70300
MG/L
542.
443.547.
593.560.546.381.
438.
575.418.529.437.
473.
RES SUS TOC
530 680
MG/L MG/L
3.0
13.2
5.8
20.85.62.4
114.023.078.08.0
29.51.599.011.02.0
CHL A
32210
UG/L
2.301 .103.608.701.605.90
197.8533.009.97
5.47
PHEO A
32218UG/L
1.80
30.636.899.57
0.08
ZZPX8408281025 5.5 140. 90.0
LMPA8205031458LMPA8211011318LMPA831 031 1330LMPA8408021150LMPA8507251250LMPA85091 10850
MAPF8207220000MAPF82081 20000MAPF8209010000MAPA8507250941MAPA8508091210
TUPA8407301630TUPA8507250833TUPA8509200947TUPA8509241601
BDPF8205260000BDPF8205270000BDPF8207 120000BDPX82071 20001BDPF8207200000BDPF8208030000BDPF8208310000BDPX8507251032BDPA8508091300BDPX8509200909
BDPX8509241410
BDPX8701061025
NMPA8205051418
NMPA8403061400
7.34.616.25.65.52.0
33.016.05.33.73.4
6.33.82.4
3.0
1.41.7
15.014.07.47.98.84.014.03.52.03.0
1.8
210.0187.0220.0171.0102.0192.0
123.078.0237.0192.0202.0
150.0169.050.055.0
173.0147.075.036.089.0183.0
135.0140.0171.085.061.073.0
67.0
450.0372.054.0510.0370.0500.0
192.0126.0352.0345.0380.0
214.0245.074.067.0
352.0322.0
238.0120.0296.0288.0
224.0210.0310.0137.094.0
250.0
160.200.400.350.350.450.
833.479.265.140.225.
150.120.350.
350.
75.68.
432.472.244.267 .
243.140.75.300.450.125.
240.120.
180.032.0205.0209.0
191.0207.0
27.415.841.365.065.0
12.019.06.0
9.0
76.095.020.79.358.747.131.232.054.029.023.039.0
76.0
150.0124.095.0105.082.092.0
52.038.0175.0156.0192.0
80.0116.035.0
22.0
199.0199.062.021.0113.0110.083.061.092.038.023.032.0
120.0200.0
5.72.53.43.33.02.5
6.76.63.12.6
6.1L2.51.44.3L
2.52.02.44.2
0.43.32.7
1 .73.01.1
3.6
896.722.898.1042.757.905.
404.284.700.697.791.
406.492.215.180.
681.
632.
242.
542.
528.
439.
422.
571.
284.
217.
218.
659.
23.0
18.0
41 .1
17.0
26.0
12.0
187.0
56.0
10.0
13.0
8.0
17.0
28.0
7.011.0
4.06.812.0
10.0
10.8
6.823.3
19.0
33.0
8.0
3.0
1.0
20.1
20.408.502.2832.10
6.53
23.4029.407.30
32.77
35.80
2.115.18
3.401.907.9010.905.20
13.3019.40
14.715.812.303.63
24.00
3.004.403.7410.10
4.22
7.78
11.90
1.281.52
5.162.651 .661.18
4.40
-38-
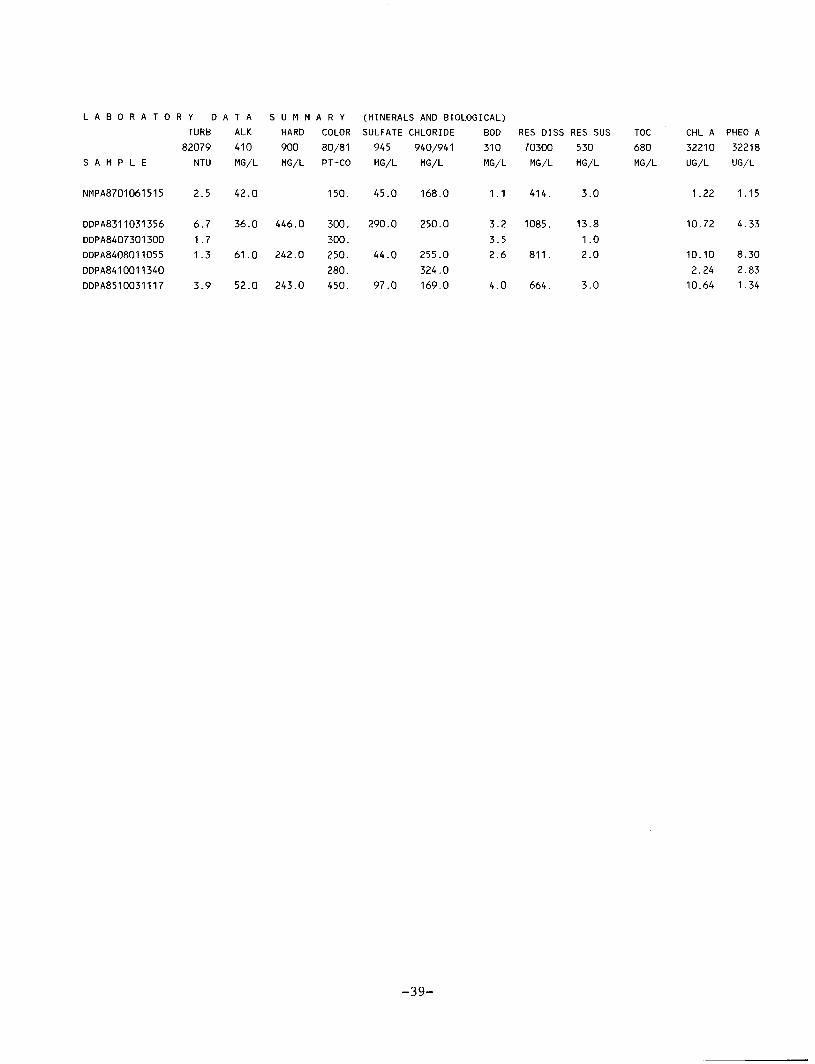
L A B O R A T O R Y D A T A S U M M A R Y (MINERALS A N D BIOLOGICAL)
S A M P L E
NMPA8701061515
DDPA8311031356
DDPA8407301300
DDPA8408011055
OOPASA10011340
DDPA8510031117
TURB
82079
NTU
2.5
6.7
1.7
1.3
3.9
ALK HARD COLOR SULFATE CHLORIDE
410 900 80/81 945 940/941
MG/L MG/L PT-CO MG/L MG/L
42.0
36.0 446.0
61.0 242.0
52.0 243.0
150. 45.0
300. 290.0
300.
250. 44.0
280.
450. 97.0
168.0
250.0
255.0
324.0
169.0
BOD RES DISS RES SUS TOC
310 70300 530 680
MG/L MG/L MG/L MG/L
1.1 414.
3.2 1085.
3.5
2.6 811.
4.0 664.
3.0
13.8
1.0
2.0
3.0
CHL A PHEO A
32210 32218
UG/L UG/L
1.22 1.15
10.72 4.33
10.10 8.30
2.24 2.8310.64 1.34
-39-
(NUTRIENTS AND METALS)
S A M P L E
ZZPA8202081400ZZPF8206181600ZZPF8206240840ZZPF8206250000ZZPF8206251630ZZPF82081 60000ZZPA8305021611ZZPA8306011051ZZPX8310311616
ZZPX8408021235ZZPA8408281010ZZPX8411061007ZZPA8505010935ZZPX8507251320ZZPA8507251335ZZPA8610011155
P ORTHO
70507
MG/L
0.0700.2300.0500.1000.0900.1000.055
0.131
0.0880.1070.0690.0460.1720.1140.010
P TOTAL
665
MG/L
0.120
0.240
0.080
0.1700.1200.1400.1840.349
0.1190.1670.0710.0660.4670.2020.037
TKN625MG/L
2.3002.3001.8002.4003.400
5.0501.9903.1801.3404.7701.9001.500
NH3N
610
MG/L
0.150
0.240
0.070
0.110
0.180
1.5000.1750.6030.0580.8620.8910.025
NOX
630MG/L
0.4100.3900.5801.0800.8300.3200.016
0.3200.2110.1480.5830.0211.0601.3300.005
NITRATE POT
620 935
MG/L MG/L
6.60
7.00
7.10
9.402.48
4.90
MAG
925MG/L
13.00
IRON CALCIUM SODIUM
1046 915 930
UG/L MG/L MG/L
0.90 62.50 11.201.00 75.30 18.000.80 91.30 19.001.00 73.70 21.401.02 100.10 10.20
ZZPX8408281025 0.040 0.102 2.860 0.196 0.285
LMPA8205031458LMPA8211011318
LMPA831 031 1330LMPA8408021150LMPA8507251250LMPA85091 10850
MAPF8207220000
MAPF8208120000MAP F820901 0000MAPA8507250941MAPA8508091210
TUPA8407301630
TUPA8507250833TUPA8509200947TUPA8509241601
BDPF8205260000BDPF8205270000BDPF8207120000BDPX82071 20001BDPF8207200000BDPF 8208030000BDPF8208310000BDPX8507251032
BDPA8508091300
BDPX8509200909BDPX8509241410BDPX8701061025
NMPA8205051418
NMPA8403061400
0.030
0.052
0.1520.0840.2200.122
0.6200.8400.1000.3650.207
0.507
0.1230.3280.413
0.0100.0100.2300.0600.0700.0900.0600.2900.0490.0480.0620.009
0.060
0.1400.126
0.1920.4330.155
1 .0301 .1600.1900.5370.283
0.7150.3060.3790.754
0.0600.0500.2700.1400.1100.1400.2900.4730.1270.0710.1190.059
0.1800.104
5.9305.890
4.2004.4003.0003.2402.330
2.950
2.2401.6502.960
0.9001.2002.4002.7001.7002.2002.5002.1601.9202.0502.1201 .310
0.2701.4400.191
0.3500.4200.1700.8620.094
0.0261.8400.0530.312
0.0500.0400.1800.1900.1000.1000.090
0.1180.3930.1860.048
0.010K0.1950.7670.9112.3600.607
0.7200.6700.0600.1640.008
0.005K0.0640.0950.077
0.0200.0200.020K0.020K0.0500.0800.0400.2670.005K0.1480.3170.343
0.010K0.007
444
4
433
3442423
4
.40
.60
.70
.50
.40
.85
.72
.60
.80
.93
.14
.06
.83
.49
.40
39.00 200.0022.00 540.0029.00 1020
32.00 551.
29201590520.
0000.000
.00
.00
.00
.00
.00
.10
.20
.84
.96
.61
.41
.84
20.00 300.00
124.0078.00
100.00
129.00
60.1036.00104.90
100.9084.9064.1034.4084.1080.1088.90
61.00
72.0069.0059.00
59.00
10.208.7021.90
24.3026.7019.008.3020.9021.402.00
78.00
-40-
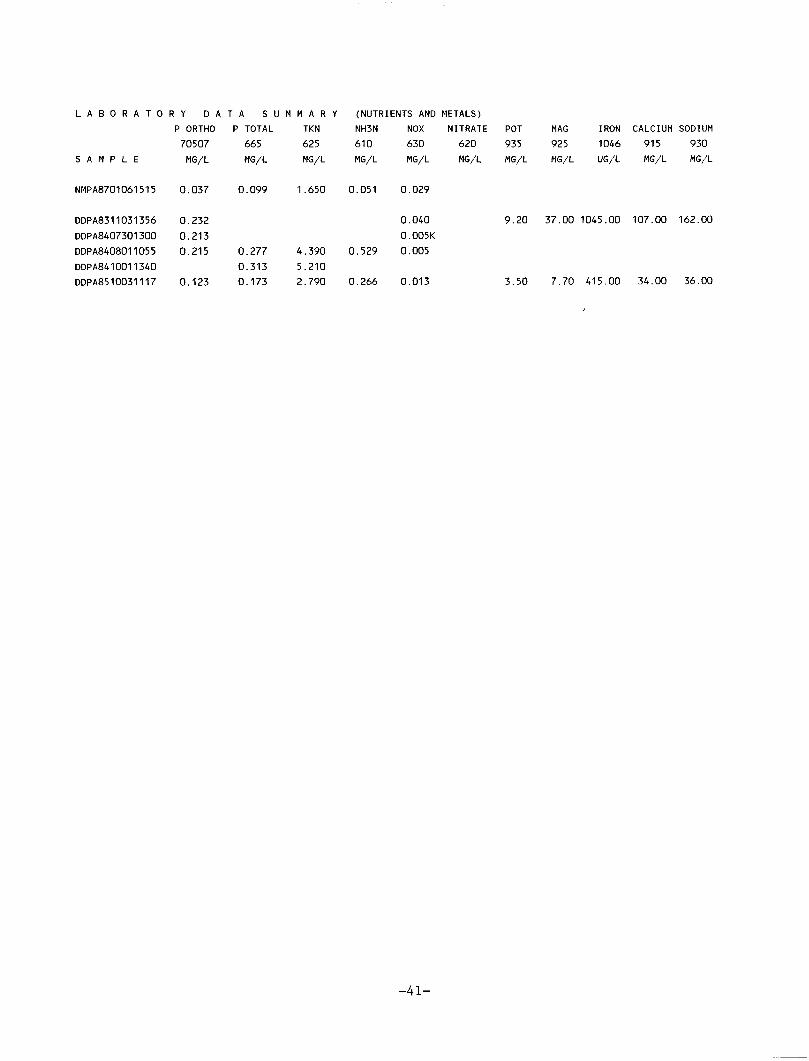
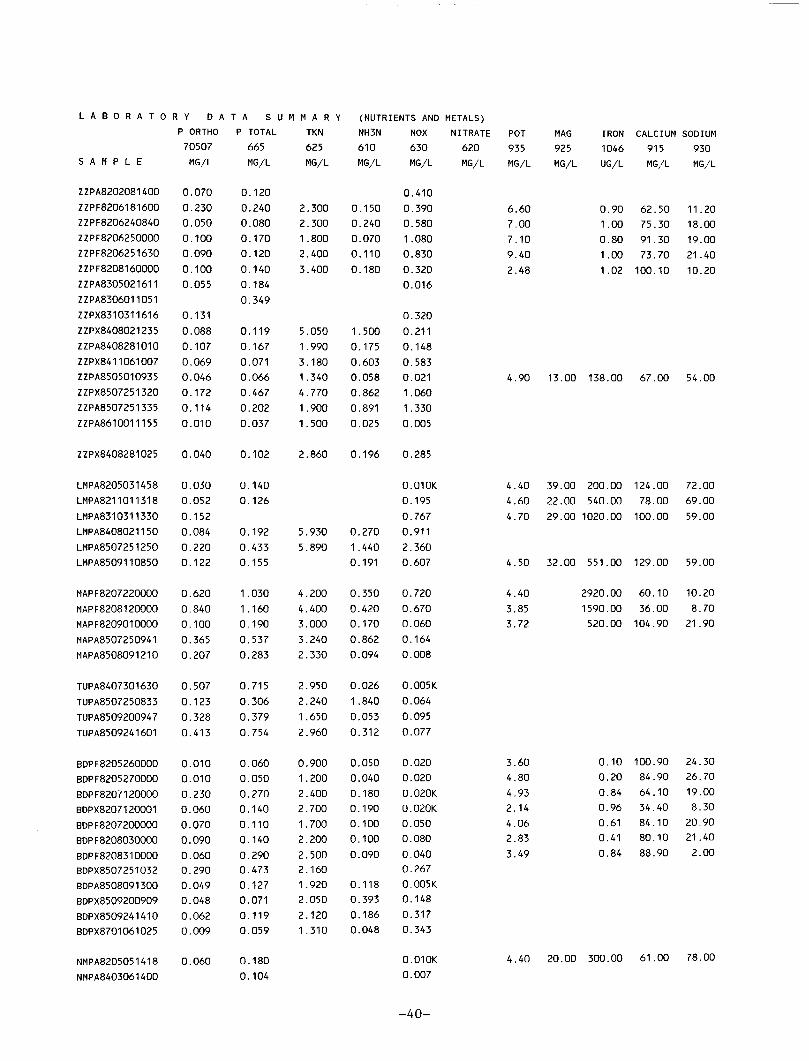
L A B O R A T O R Y D A T A S U M M A R Y (NUTRIENTS A N D METALS)
P ORTHO P TOTAL TKN NH3N NOX NITRATE POT MAG IRON CALCIUM SODIUM
70507 665 625 610 630 620 935 925 1046 915 930
S A M P L E M6/L MG/L MG/L MG/L MG/L MG/L MG/L MG/L UG/L MG/L MG/L
NMPA8701061515 0.037 0.099 1.650 0.051 0.029
DDPA8311031356 0.232 0.040 9.20 37.00 1045.00 107.00 162.00
DDPA8407301300 0.213 0.005K
DDPA8408011055 0.215 0.277 4.390 0.529 0.005
DDPA8410011340 0.313 5.210
DDPA8510031117 0.123 0.173 2.790 0.266 0.013 3.50 7.70 415.00 34.00 36.00
-41-

Appendix B
STATISTICAL SUMMARY
-A3-
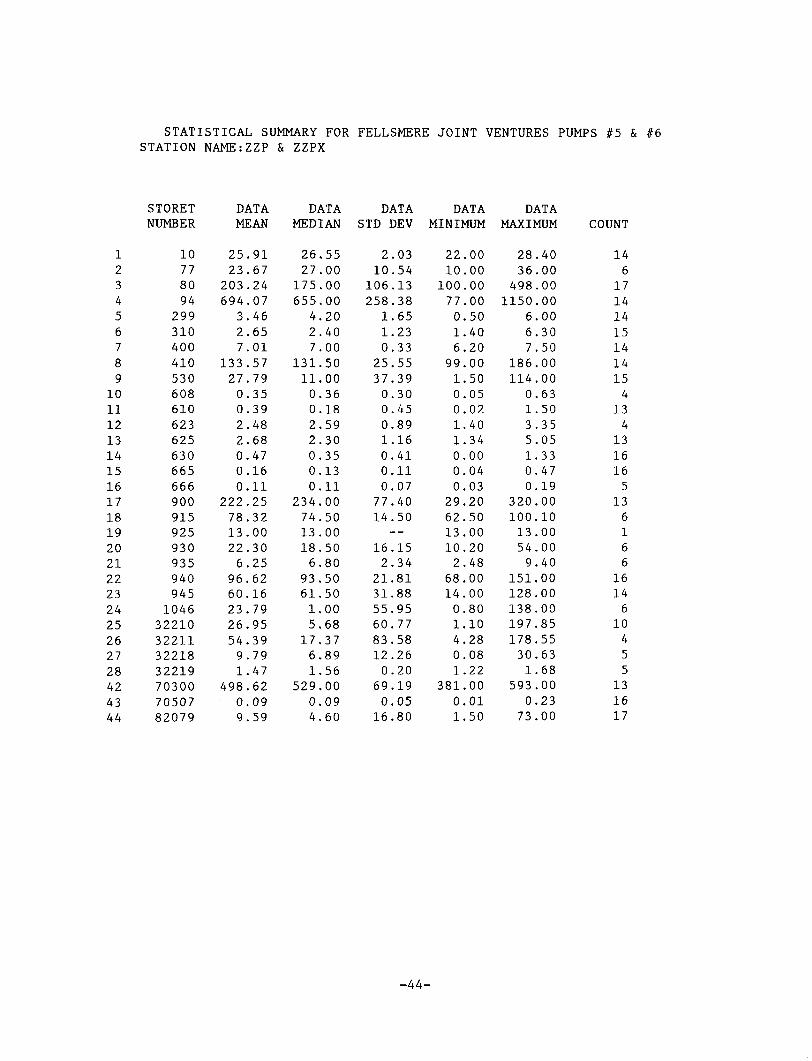
STATISTICAL SUMMARY FOR FELLSMERE JOINT VENTURES PUMPS #5 & #6STATION NAME:ZZP & ZZPX
123456789
10111213141516171819202122232425262728424344
STORETNUMBER
10778094299310400410530608610623625630665666900915925930935940945104632210322113221832219703007050782079
DATAMEAN
25.9123.67203.24694.073.462.657.01
133.5727.790.350.392.482.680.470.160.11
222.2578.3213.0022.306.2596.6260.1623.7926.9554.399.791.47
498.620.099.59
DATAMEDIAN
26.5527.00175.00655.004.202.407.00
131.5011.000.360.182.592.300.350.130.11
234.0074.5013.0018.506.8093.5061.501.005.6817.376.891.56
529.000.094.60
DATASTD DEV
2.0310.54106.13258.381.651.230.3325.5537.390.300.450.891.160.410.110.0777.4014.50—
16.152.3421.8131.8855.9560.7783.5812.260.2069.190.0516.80
DATAMINIMUM
22.0010.00100.0077.000.501.406.2099.001.500.050.021.401.340.000.040.0329.2062.5013.0010.202.4868.0014.000.801.104.280.081.22
381.000.011.50
DATAMAXIMUM
28.4036.00498.001150.00
6.006.307.50
186.00114.000.631.503.355.051.330.470.19
320.00100.1013.0054.009.40
151.00128.00138.00197.85178.5530.631.68
593.000.2373.00
COUNT
146
171414151414154
134
1316165
136166
16146
10455
131617
-44-
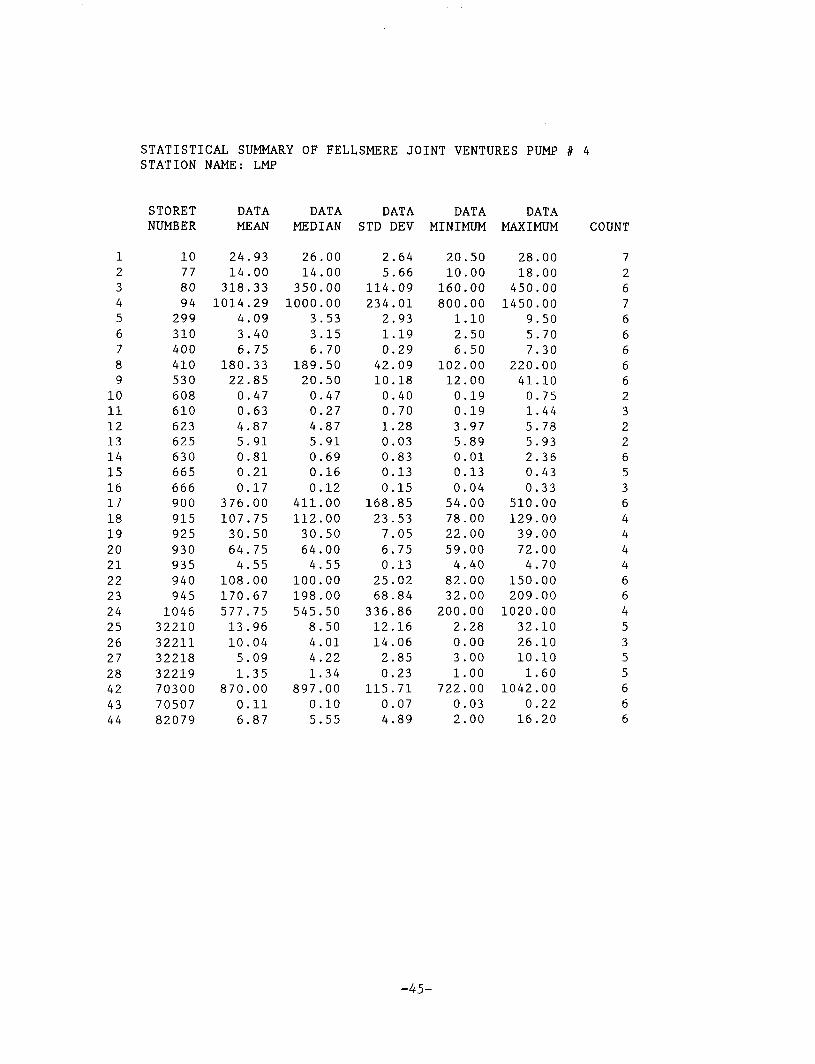
STATISTICAL SUMMARY OF FELLSMERE JOINT VENTURES PUMP // 4STATION NAME: LMP
12345678910111213141516171819202122232425262728424344
STORETNUMBER
10778094299310400410530608610623625630665666900915925930935940945104632210322113221832219703007050782079
DATAMEAN
24.9314.00318.331014.29
4.093.406.75
180.3322.850.470.634.875.910.810.210.17
376.00107.7530.5064.754.55
108.00170.67577.7513.9610.045.091.35
870.000.116.87
DATAMEDIAN
26.0014.00350.001000.00
3.533.156.70
189.5020.500.470.274.875.910.690.160.12
411.00112.0030.5064.004.55
100.00198.00545.508.504.014.221.34
897.000.105.55
DATASTD DEV
2.645.66
114.09234.012.931.190.2942.0910.180.400.701.280.030.830.130.15
168.8523.537.056.750.1325.0268.84336.8612.1614.062.850.23
115.710.074.89
DATAMINIMUM
20.5010.00160.00800.001.102.506.50
102.0012.000.190.193.975.890.010.130.0454.0078.0022.0059.004.4082.0032.00200.002.280.003.001.00
722.000.032.00
DATAMAXIMUM
28.0018.00450.001450.00
9.505.707.30
220.0041.100.751.445.785.932.360.430.33
510.00129.0039.0072.004.70
150.00209.001020.0032.1026.1010.101.60
1042.000.2216.20
COUNT
7267666662322653644446645355666
-45-
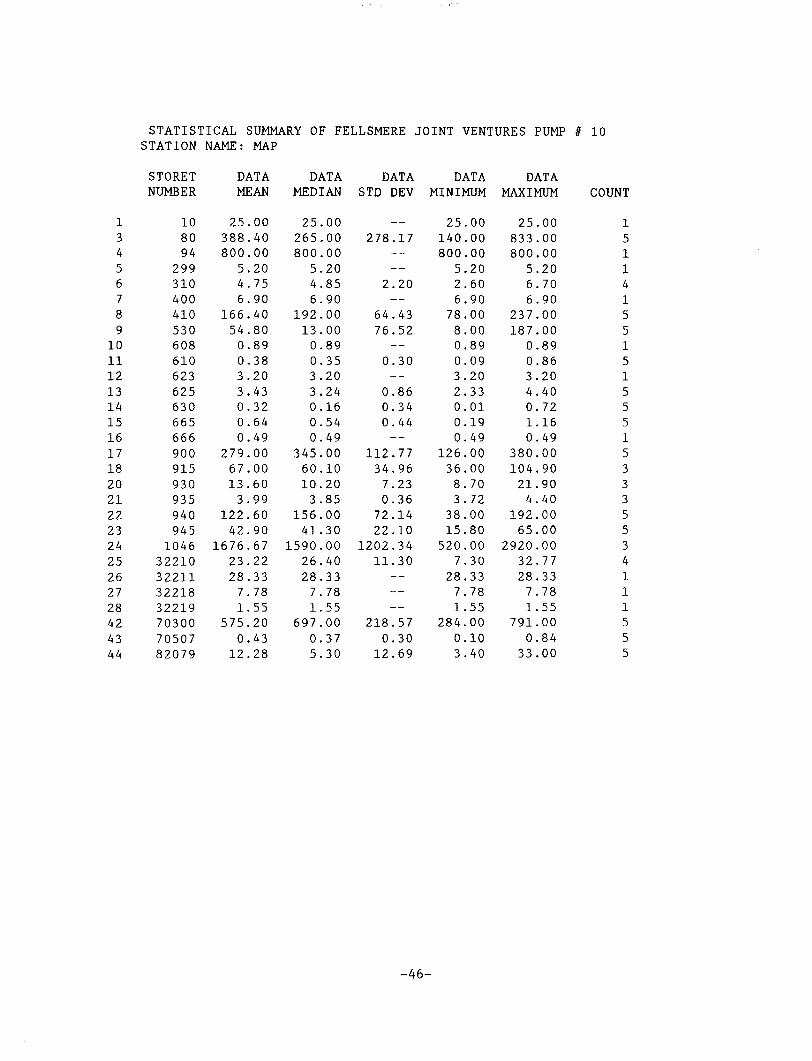
STATISTICAL SUMMARY OF FELLSMERE JOINT VENTURES PUMP # 10STATION NAME: MAP
13456789
101112131415161718202122232425262728424344
STORETNUMBER
108094299310400410530608610623625630665666900915930935940945104632210322113221832219703007050782079
DATAMEAN
25.00388.40800.005.204.756.90
166.4054.800.890.383.203.430.320.640.49
279.0067.0013.603.99
122.6042.90
1676.6723.2228.337.781.55
575.200.4312.28
DATAMEDIAN
25.00265.00800.005.204.856.90
192.0013.000.890.353.203.240.160.540.49
345.0060.1010.203.85
156.0041.30
1590.0026.4028.337.781.55
697.000.375.30
DATASTD DEV
—278.17——2.20—
64.4376.52—0.30—0.860.340.44—
112.7734.967.230.3672.1422.10
1202.3411.30———
218.570.3012.69
DATAMINIMUM
25.00140.00800.005.202.606.9078.008.000.890.093.202.330.010.190.49
126.0036.008.703.7238.0015.80520.00
7.3028.337.781.55
284.000.103.40
DATAMAXIMUM
25.00833.00800.005.206.706.90
237.00187.000.890.863.204.400.721.160.49
380.00104.9021.904.40
192.0065.00
2920.0032.7728.337.781.55
791.000.8433.00
COUNT
15114155151555153335534111555
-46-
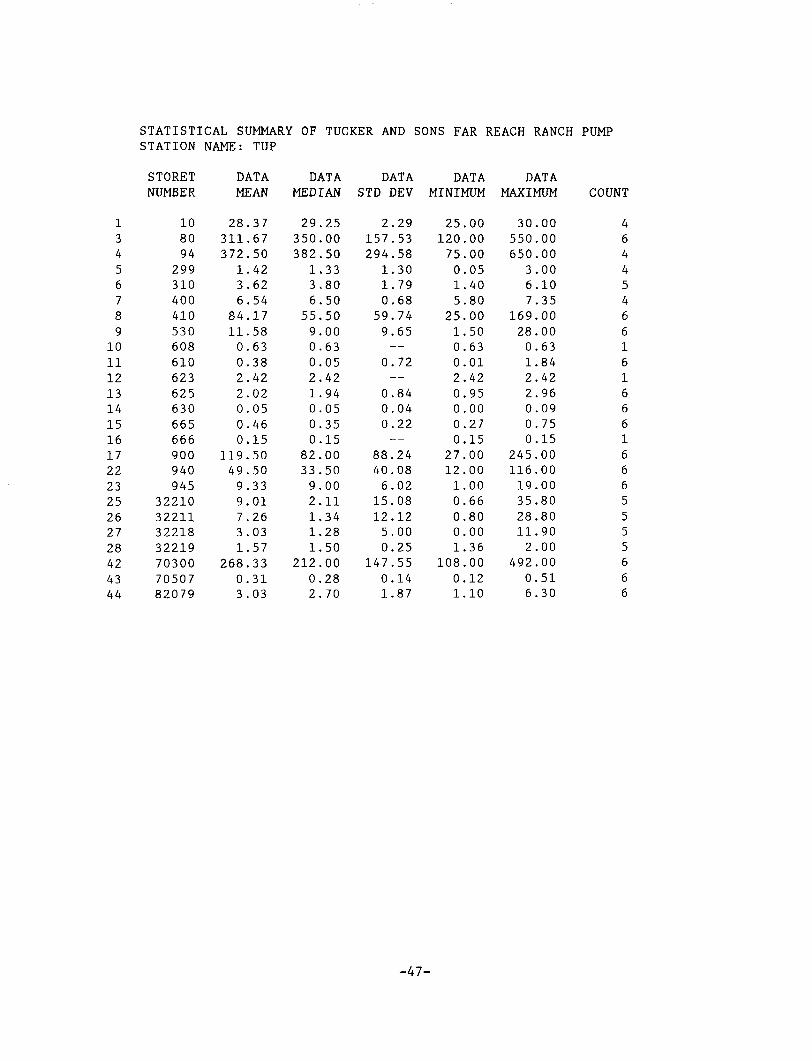
STATISTICAL SUMMARY OF TUCKER AND SONS FAR REACH RANCH PUMPSTATION NAME: TUP
13456789
1011121314151617222325262728424344
STORETNUMBER
108094299310400410530608610623625630665666900940945
32210322113221832219703007050782079
DATAMEAN
28.37311.67372.501.423.626.54
84.1711.580.630.382.422.020.050.460.15
119.5049.509.339.017.263.031.57
268.330.313.03
DATAMEDIAN
29.25350.00382.50
1.333.806.5055.509.000.630.052.421.940.050.350.1582.0033.509.002.111.341.281.50
212.000.282.70
DATASTD DEV
2.29157.53294.581.301.790.6859.749.65—0.72—0.840.040.22—
88.2440.086.0215.0812.125.000.25
147.550.141.87
DATAMINIMUM
25.00120.0075.000.051.405.8025.001.500.630.012.420.950.000.270.15
27.0012.001.000.660.800.001.36
108.000.121.10
DATAMAXIMUM
30.00550.00650.003.006.107.35
169.0028.000.631.842.422.960.090.750.15
245.00116.0019.0035.8028.8011.902.00
492.000.516.30
COUNT
4644546616166616665555666
-47-
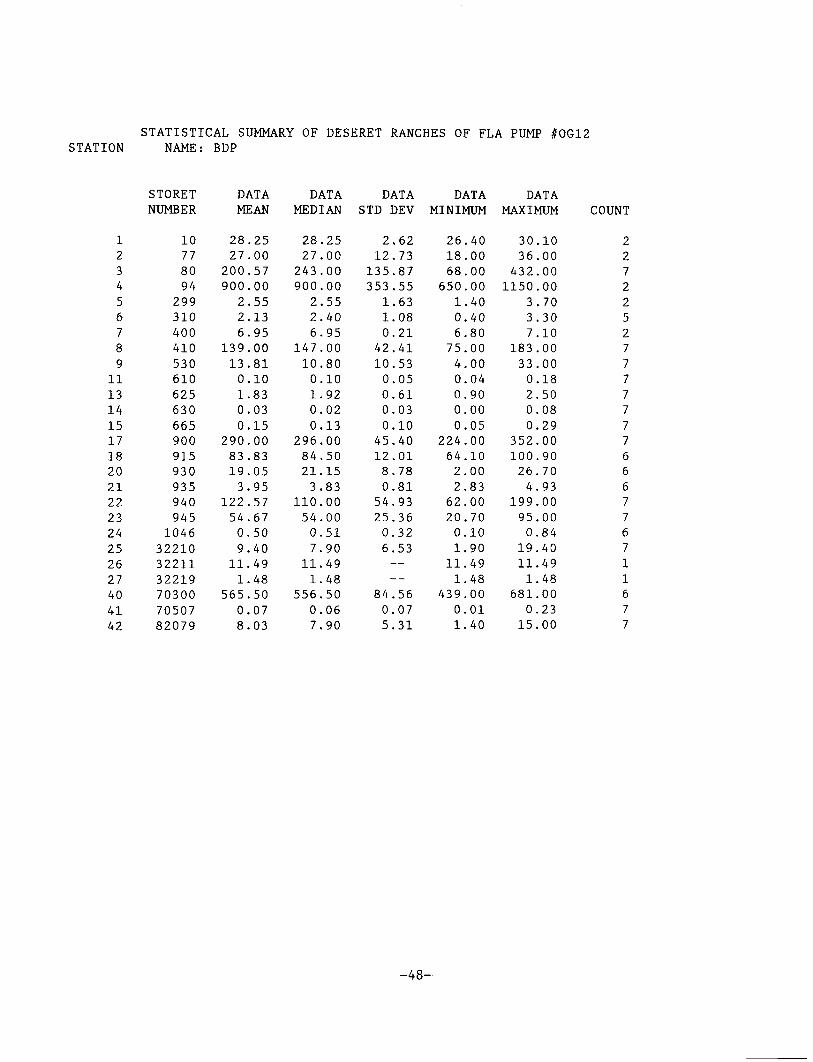
STATIONSTATISTICAL SUMMARY OF DESERET RANCHES OF FLA PUMP //OG12
NAME: BDP
1234567891113141517182021222324252627404142
STORETNUMBER
107780942993104004105306106256306659009159309359409451046322103221132219703007050782079
DATAMEAN
28.2527.00200.57900.002.552.136.95
139.0013.810.101.830.030.15
290.0083.8319.053.95
122.5754.670.509.4011.491.48
565.500.078.03
DATAMEDIAN
28.2527.00243.00900.002.552.406.95
147.0010.800.101.920.020.13
296.0084.5021.153.83
110.0054.000.517.90
11.491.48
556.500.067.90
DATASTD DEV
2.6212.73135.87353.551,631.080.2142.4110.530.050.610.030.1045.4012.018.780.8154.9325.360.326.53——
84.560.075.31
DATAMINIMUM
26.4018.0068.00650.001.400.406.8075.004.000.040.900.000.05
224.0064.102.002.8362.0020.700.101.9011.491.48
439.000.011.40
DATAMAXIMUM
30.1036.00432.001150.00
3.703.307.10
183.0033.000.182.500.080.29
352.00100.9026.704.93
199.0095.000.8419.4011.491.48
681.000.2315.00
COUNT
22722527777777666776711677
-48-
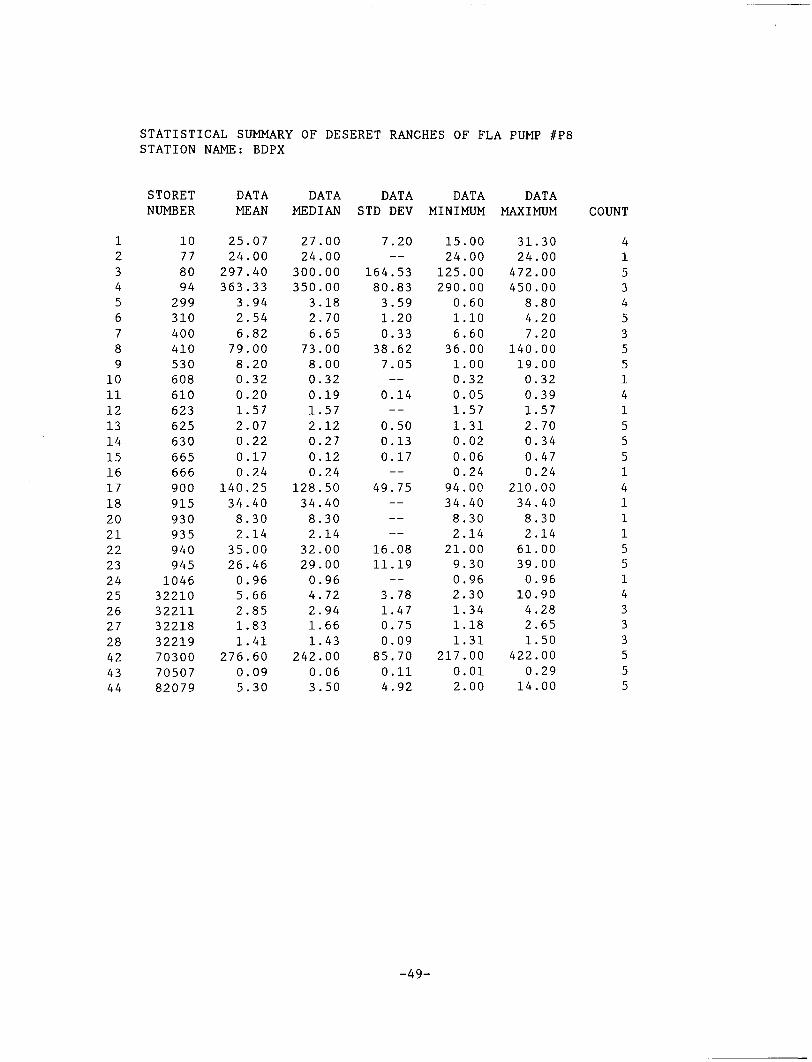
STATISTICAL SUMMARY OF DESERET RANCHES OF FLA PUMP #P8STATION NAME: BDPX
123456789
101112131415161718202122232425262728424344
STORETNUMBER
10778094299310400410530608610623625630665666900915930935940945104632210322113221832219703007050782079
DATAMEAN
25.0724.00297.40363.333.942.546.8279.008.200.320.201.572.070.220.170.24
140.2534.408.302.1435.0026.460.965.662.851.831.41
276.600.095.30
DATAMEDIAN
27.0024.00300.00350.003.182.706.6573.008.000.320.191.572.120.270.120.24
128.5034.408.302.1432.0029.000.964.722.941.661.43
242.000.063.50
DATASTD DEV
7.20—
164.5380.833.591.200.3338.627.05—0.14—0.500.130.17—
49.75———
16.0811.19—3.781.470.750.0985.700.114.92
DATAMINIMUM
15.0024.00125.00290.000.601.106.6036.001.000.320.051.571.310.020.060.2494.0034.408.302.1421.009.300.962.301.341.181.31
217.000.012.00
DATAMAXIMUM
31.3024.00472.00450.008.804.207.20
140.0019.000.320.391.572.700.340.470.24
210.0034.408.302.1461.0039.000.9610.904.282.651.50
422.000.2914.00
COUNT
415345355141555141115514333555
-49-
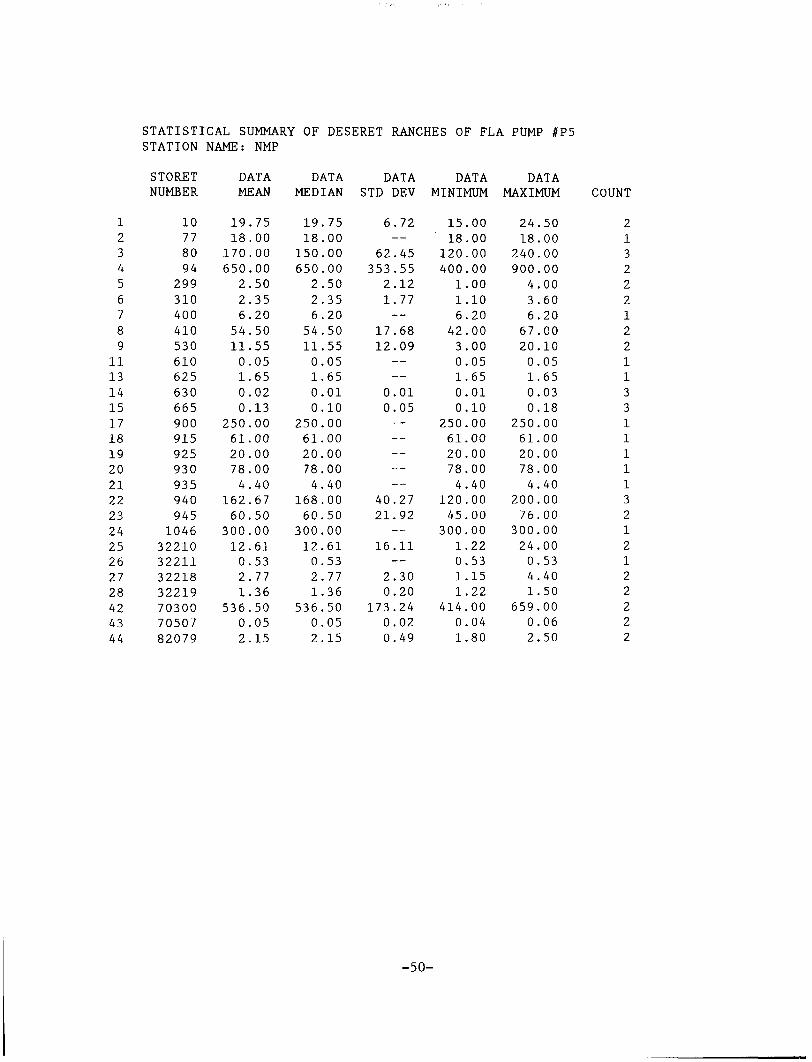
STATISTICAL SUMMARY OF DESERET RANCHES OF FLA PUMP #P5STATION NAME: NMP
123456789
11131415171819202122232425262728424344
STORETNUMBER
10778094
299310400410530610625630665900915925930935940945104632210322113221832219703007050782079
DATAMEAN
19.7518.00170.00650.002.502.356.2054.5011.550.051.650.020.13
250.0061.0020.0078.004.40
162.6760.50300.0012.610.532.771.36
536.500.052.15
DATAMEDIAN
19.7518.00150.00650.002.502.356.2054.5011.550.051.650.010.10
250.0061.0020.0078.004.40
168.0060.50300.0012.610.532.771.36
536.500.052.15
DATASTD DEV
6.72—
62.45353.552.121.77—
17.6812.09——0.010.05—————
40.2721.92—
16.11—2.300.20
173.240.020.49
DATAMINIMUM
15.0018.00120.00400.001.001.106.2042.003.000.051.650.010.10
250.0061.0020.0078.004.40
120.0045.00300.001.220.531.151.22
414.000.041.80
DATAMAXIMUM
24.5018.00240.00900.004.003.606.2067.0020.100.051.650.030.18
250.0061.0020.0078.004.40
200.0076.00300.0024.000.534.401.50
659.000.062.50
COUNT
2132221221133111113212122222
-50-
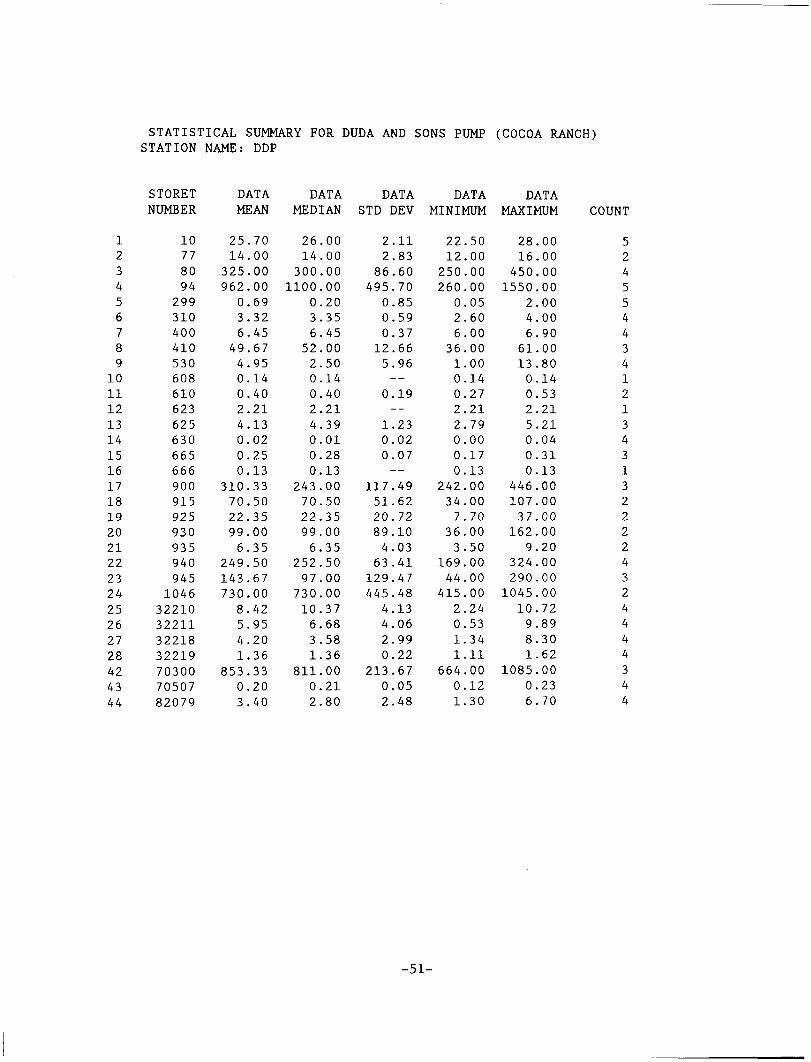
STATISTICAL SUMMARY FOR DUDA AND SONS PUMP (COCOA RANCH)STATION NAME: DDP
12345678910111213141516171819202122232425262728424344
STORETNUMBER
10778094299310400410530608610623625630665666900915925930935940945104632210322113221832219703007050782079
DATAMEAN
25.7014.00325.00962.000.693.326.4549.674.950.140.402.214.130.020.250.13
310.3370.5022.3599.006.35
249.50143.67730.008.425.954.201.36
853.330.203.40
DATAMEDIAN
26.0014.00300.001100.00
0.203.356.4552.002.500.140.402.214.390.010.280.13
243.0070.5022.3599.006.35
252.5097.00730.0010.376.683.581.36
811.000.212.80
DATASTD DEV
2.112.8386.60495.700.850.590.3712.665.96—0.19—1.230.020.07—
117.4951.6220.7289.104.0363.41129.47445.484.134.062.990.22
213.670.052.48
DATAMINIMUM
22.5012.00250.00260.000.052.606.0036.001.000.140.272.212.790.000.170.13
242.0034.007.7036.003.50
169.0044.00415.002.240.531.341.11
664.000.121.30
DATAMAXIMUM
28.0016.00450.001550.00
2.004.006.9061.0013.800.140.532.215.210.040.310.13
446.00107.0037.00162.009.20
324.00290.001045.0010.729.898.301.62
1085.000.236.70
COUNT
5245544341213431322224324444344
-51-