Embed Size (px)
Citation preview
TECHNISCHE MECHANIK, 32, 2-5, (2012), 577 – 586submitted: November 1, 2011
Characterization of High Carbon Steel C68 at Elevated Temperatures andDifferent Strain Rates
M. Vautrot, P. Balland, O.S. Hopperstad, L. Tabourot, J. Raujol-Veille, F. Toussaint
This paper presents high-temperature tensile testing. This method is used to characterize the mechanical behaviourof a high-carbon steel C68 at temperatures up to 720◦C. Samples are heated by an induction system controlledwith a pyrometer. A high-speed camera (500 fps) is used to determine the displacement field with a digital imagecorrelation software. For such tests a specific marking procedure of the sample is applied. Stress-strain curves aregiven from room temperature up to 720◦C at strain rates ranging from 10−3 /s to 10−1 /s. Elastic parametersof the material are measured at room temperature using cyclic tests. Bridgman’s method is used to determine theequivalent stress-plastic strain curve during the necking phase.
Introduction
In the field of metal forming, extreme conditions are nowadays imposed to materials in order to always producemore precise parts with more added value at lower cost. Under such conditions, a numerical simulation appearsnow as one of the best solutions to check the feasibility of the forming operation when compared with some costly,time-consuming, trial and error empirical methods. The finite element method requires elaborate constitutiveequations describing the mechanical behavior (namely a stress-strain relationship) as realistic as possible. Asgeneral modeling approaches that could describe the mechanical behavior for any material under any loadingconditions do not exist yet, each process and material combination requires a dedicated modeling strategy. Indeed,any phenomenological model has strong limitations: it is basically capable of giving back experimental evidencecorresponding to those used in the experimental identification. Consequently, it is crucial that the experimentalcharacterization makes use of loading conditions corresponding to those imposed by the processing of the materialif one wants to succeed in the simulation of the forming process. Respecting these preliminary conditions, theexperimental protocol should assure the best determination of the stress-strain relation for a given representativeelementary volume. The case study is here an incremental forming process (Raujol-Veille et al., 2011) appliedto C68 steel sheets in order to obtain industrial components with accurate geometry. An induction device is usedto heat the workpiece before forming. Such process imposes strain rates ranging for 0 to 102 /s for productivityreason and temperatures up to 720◦C (just below phase transition temperature) to obtain good ductility and avoidfracture of the material during forming. Formed parts are subjected to considerable springback during unloading,giving the elastic parameters an important role.
Within this industrial framework, the material characterization should be in accordance with the following specifi-cations:
• testing should impose the same thermo-mechanical conditions as those imposed by the process,
• the quality of the results of the mechanical characterization of materials should be obtained at reasonabledelay and good financial cost from an industrial point of view.
Therefore one needs to build an experimental database that gives stress-strain curves in the elastic and plasticdomains for various temperatures and for a range of strain rates corresponding to those imposed by the process.The objective of this paper is to define and validate the experimental setup that will be used to characterize the C68steel behavior under such conditions. Some preliminary results are given to show the efficiency of the proposedmethod.
577
After a brief presentation of the material in the first section, the second section describes the procedure for high-temperature tensile testing. Then, the third section presents some first experimental results for the elastic andplastic behaviour of the C68 material.
1 Material
The C68 steel is delivered in 1.54 mm thick sheets in an annealed state. Its chemical composition is reported inTable 1.
C Mn Si P S P+S Cr Al0.65-0.73 0.50-0.80 0.15-0.35 0-0.035 0-0.025 0-0.05 0.15-0.30 0.005-0.030
Table 1. C68 chemical composition (in weight %)
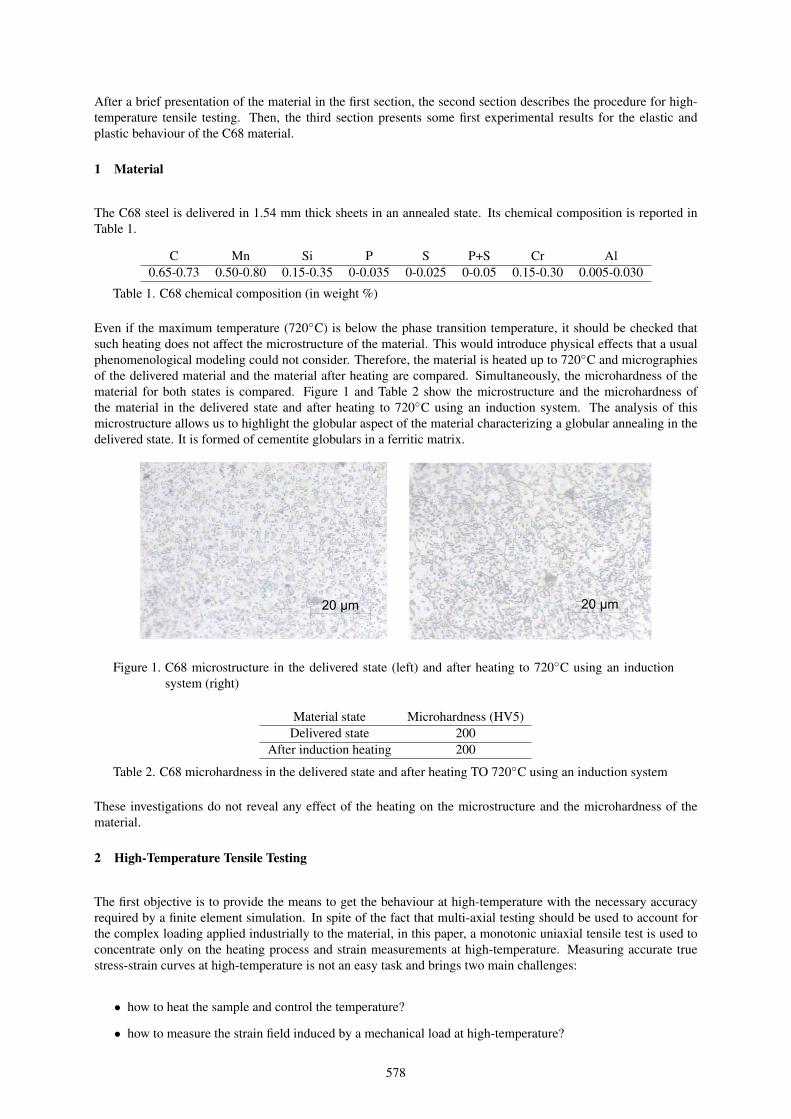
Even if the maximum temperature (720◦C) is below the phase transition temperature, it should be checked thatsuch heating does not affect the microstructure of the material. This would introduce physical effects that a usualphenomenological modeling could not consider. Therefore, the material is heated up to 720◦C and micrographiesof the delivered material and the material after heating are compared. Simultaneously, the microhardness of thematerial for both states is compared. Figure 1 and Table 2 show the microstructure and the microhardness ofthe material in the delivered state and after heating to 720◦C using an induction system. The analysis of thismicrostructure allows us to highlight the globular aspect of the material characterizing a globular annealing in thedelivered state. It is formed of cementite globulars in a ferritic matrix.
20 µm 20 µm
Figure 1. C68 microstructure in the delivered state (left) and after heating to 720◦C using an inductionsystem (right)
Material state Microhardness (HV5)Delivered state 200
After induction heating 200
Table 2. C68 microhardness in the delivered state and after heating TO 720◦C using an induction system
These investigations do not reveal any effect of the heating on the microstructure and the microhardness of thematerial.
2 High-Temperature Tensile Testing
The first objective is to provide the means to get the behaviour at high-temperature with the necessary accuracyrequired by a finite element simulation. In spite of the fact that multi-axial testing should be used to account forthe complex loading applied industrially to the material, in this paper, a monotonic uniaxial tensile test is used toconcentrate only on the heating process and strain measurements at high-temperature. Measuring accurate truestress-strain curves at high-temperature is not an easy task and brings two main challenges:
• how to heat the sample and control the temperature?
• how to measure the strain field induced by a mechanical load at high-temperature?
578
To heat a sample at this temperature, several experimental devices can be employed like high-temperature furnace,ohmic heating or induction heating (Pan et al., 2010). Some furnaces are capable of heating up a sample to720◦C but with lower heating and cooling rates due to a large thermal inertia in the chamber. Moreover, digitalimage correlation (DIC) is penalized when using furnaces because of the quality of recorded digital images wewant to obtain. The ohmic and the induction heating allow for rapid heating but with some difficulties to controltemperature.
Both contact and non-contact techniques can be used to measure high-temperature strains. Commonly, high-temperature strains are measured by extensometers or strain gauges. But this technique can only give us theaverage strain in a local area. To obtain full-field strain measurements, a non-contact optical technique like DICis necessary. Lyons et al. (1996) succeeded to determine the full-field strain using DIC at high-temperature up to650◦C for an Inconel 718 alloy. His method is used by Liu et al. (1998a,b) to characterize Alloy 800 and Alloy718 at high-temperatures. Pan et al. (2010) devised an experimental set-up using the DIC technique to extract thefull-field strain of metals and alloys at temperatures from room temperature up to 550◦C. In this paper, tests areconducted at temperatures from room temperature to 720◦C.
In order to obtain the accurate local strain, digital image correlation is used in combination with an inductionsystem. The induction system is chosen for two reasons: (1) the sample is not enclosed in a chamber and it makesit easier to use a camera, and (2) it is used in the industrial process. Furthermore, a non-contact technique, likeDIC, could allow us to develop, in the next stage, a heterogeneous test to account for complex loading conditionsas explained above. An extensometer is not suitable for such tests. This section describes the experimental setupcorresponding to these prescriptions.
2.1 Experimental Set-Up
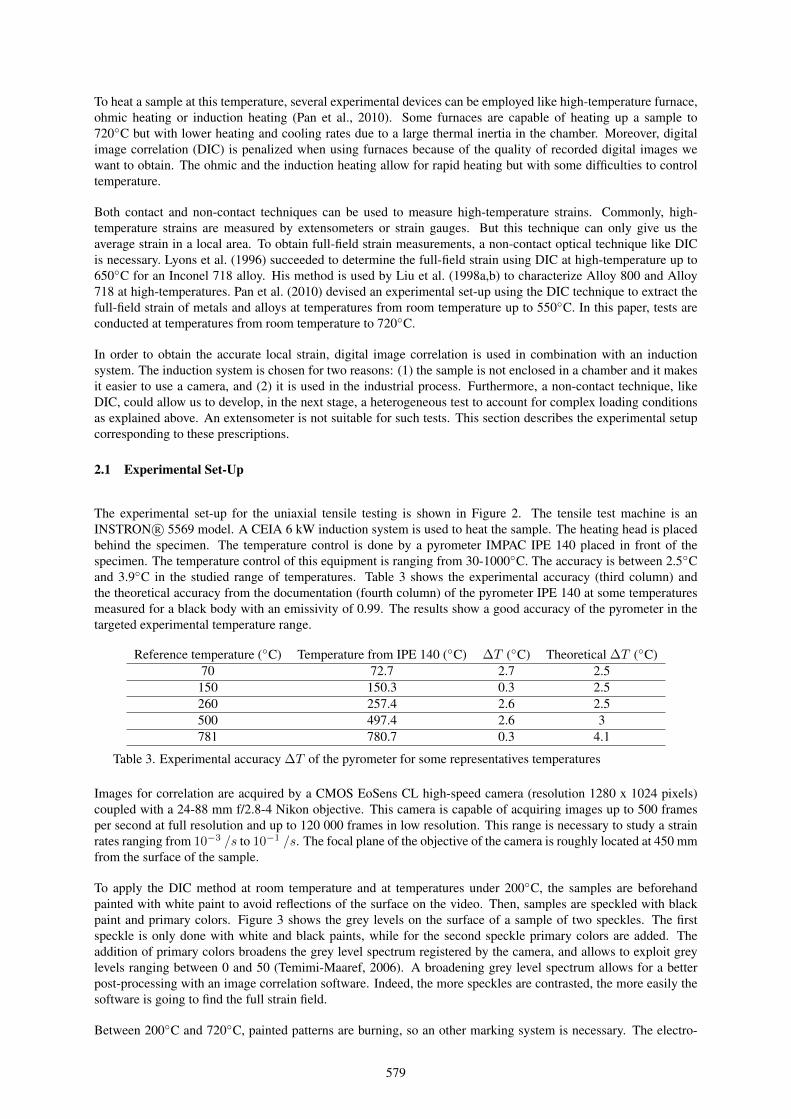
The experimental set-up for the uniaxial tensile testing is shown in Figure 2. The tensile test machine is anINSTRON R© 5569 model. A CEIA 6 kW induction system is used to heat the sample. The heating head is placedbehind the specimen. The temperature control is done by a pyrometer IMPAC IPE 140 placed in front of thespecimen. The temperature control of this equipment is ranging from 30-1000◦C. The accuracy is between 2.5◦Cand 3.9◦C in the studied range of temperatures. Table 3 shows the experimental accuracy (third column) andthe theoretical accuracy from the documentation (fourth column) of the pyrometer IPE 140 at some temperaturesmeasured for a black body with an emissivity of 0.99. The results show a good accuracy of the pyrometer in thetargeted experimental temperature range.
Reference temperature (◦C) Temperature from IPE 140 (◦C) ∆T (◦C) Theoretical ∆T (◦C)70 72.7 2.7 2.5
150 150.3 0.3 2.5260 257.4 2.6 2.5500 497.4 2.6 3781 780.7 0.3 4.1
Table 3. Experimental accuracy ∆T of the pyrometer for some representatives temperatures
Images for correlation are acquired by a CMOS EoSens CL high-speed camera (resolution 1280 x 1024 pixels)coupled with a 24-88 mm f/2.8-4 Nikon objective. This camera is capable of acquiring images up to 500 framesper second at full resolution and up to 120 000 frames in low resolution. This range is necessary to study a strainrates ranging from 10−3 /s to 10−1 /s. The focal plane of the objective of the camera is roughly located at 450 mmfrom the surface of the sample.
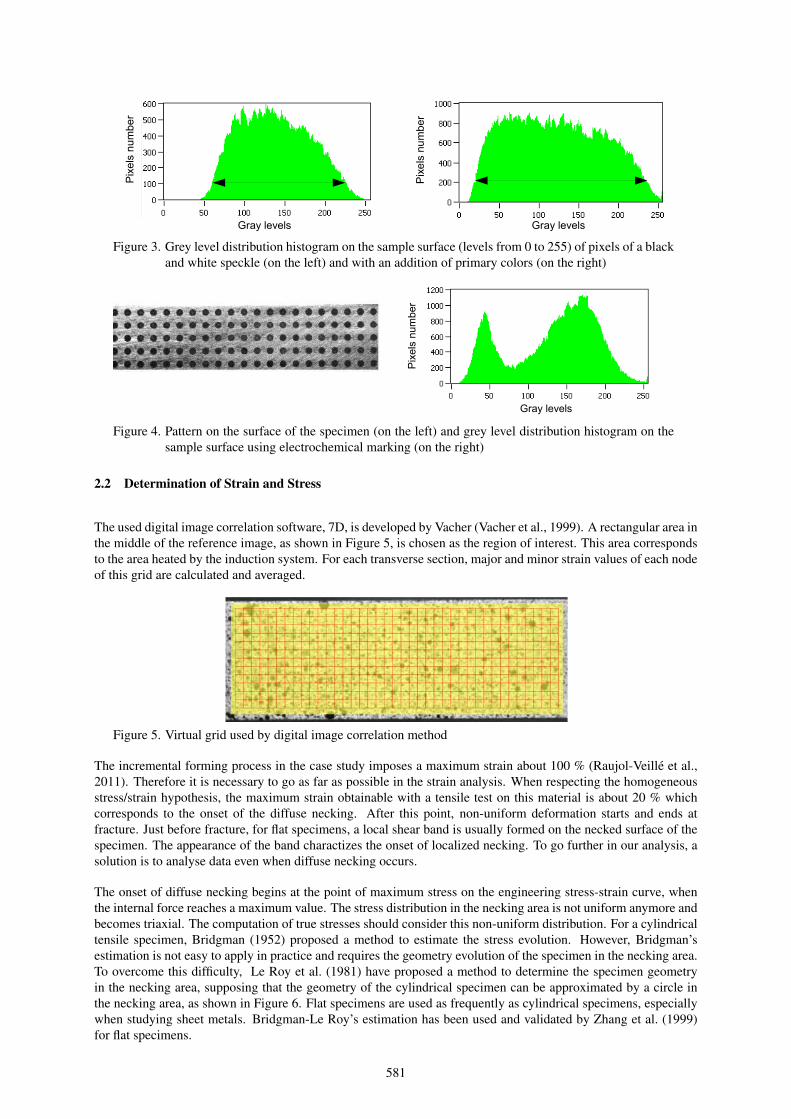
To apply the DIC method at room temperature and at temperatures under 200◦C, the samples are beforehandpainted with white paint to avoid reflections of the surface on the video. Then, samples are speckled with blackpaint and primary colors. Figure 3 shows the grey levels on the surface of a sample of two speckles. The firstspeckle is only done with white and black paints, while for the second speckle primary colors are added. Theaddition of primary colors broadens the grey level spectrum registered by the camera, and allows to exploit greylevels ranging between 0 and 50 (Temimi-Maaref, 2006). A broadening grey level spectrum allows for a betterpost-processing with an image correlation software. Indeed, the more speckles are contrasted, the more easily thesoftware is going to find the full strain field.
Between 200◦C and 720◦C, painted patterns are burning, so an other marking system is necessary. The electro-
579
Induction system
Heating
High speed camera
LightingWhite LEDs
Pyrometer
Control system
Tensile testmachine
Temperature
Strain rate
Displacement
DIC Software
Pictures
Mechanical behaviour
of the material
Stress
Strain
Temperaturecontrol
Strain measurementStress measurement
High speed camera
Lighting
Specimen
Fix grip
Mobile grip
Induction system
Figure 2. Experimental setup and synoptic of the experimental configuration in the case of uniaxial tensiletests
chemical marking ME3000S from Metaletch has been chosen to realize a pattern on the surface of the sample.With this system, an oxide film is created on the surface using a stencil and an electrochemical machine. Thechosen pattern is a regular grid composed of 1 mm-diameter filled circles with 2 mm spacing as shown in Figure 4.In that case, the grey level spectrum is less homogeneous than in the first case with paints, but it is the only meansto use DIC, which is still better than using the crosshead displacement.
To obtain usable images, homogeneous and stable lighting of the sample surface is required. Indeed, if a specklereceives light with a stronger intensity than another, DIC would be affected leading to inaccurate displacementdetermination. Even worse, under such conditions the software would sometimes be unable to process images.The lighting system is a bar of LEDs including 3 rows of 32 LEDs which diffuses white light with wavelength inthe range 400-700 nm.
580
Gray levels Gray levels
Pixe
ls n
umbe
r
Pix
els
num
ber
Figure 3. Grey level distribution histogram on the sample surface (levels from 0 to 255) of pixels of a blackand white speckle (on the left) and with an addition of primary colors (on the right)
Pixe
ls n
umbe
rGray levels
Figure 4. Pattern on the surface of the specimen (on the left) and grey level distribution histogram on thesample surface using electrochemical marking (on the right)
2.2 Determination of Strain and Stress
The used digital image correlation software, 7D, is developed by Vacher (Vacher et al., 1999). A rectangular area inthe middle of the reference image, as shown in Figure 5, is chosen as the region of interest. This area correspondsto the area heated by the induction system. For each transverse section, major and minor strain values of each nodeof this grid are calculated and averaged.
Figure 5. Virtual grid used by digital image correlation method
The incremental forming process in the case study imposes a maximum strain about 100 % (Raujol-Veille et al.,2011). Therefore it is necessary to go as far as possible in the strain analysis. When respecting the homogeneousstress/strain hypothesis, the maximum strain obtainable with a tensile test on this material is about 20 % whichcorresponds to the onset of the diffuse necking. After this point, non-uniform deformation starts and ends atfracture. Just before fracture, for flat specimens, a local shear band is usually formed on the necked surface of thespecimen. The appearance of the band charactizes the onset of localized necking. To go further in our analysis, asolution is to analyse data even when diffuse necking occurs.
The onset of diffuse necking begins at the point of maximum stress on the engineering stress-strain curve, whenthe internal force reaches a maximum value. The stress distribution in the necking area is not uniform anymore andbecomes triaxial. The computation of true stresses should consider this non-uniform distribution. For a cylindricaltensile specimen, Bridgman (1952) proposed a method to estimate the stress evolution. However, Bridgman’sestimation is not easy to apply in practice and requires the geometry evolution of the specimen in the necking area.To overcome this difficulty, Le Roy et al. (1981) have proposed a method to determine the specimen geometryin the necking area, supposing that the geometry of the cylindrical specimen can be approximated by a circle inthe necking area, as shown in Figure 6. Flat specimens are used as frequently as cylindrical specimens, especiallywhen studying sheet metals. Bridgman-Le Roy’s estimation has been used and validated by Zhang et al. (1999)for flat specimens.
581
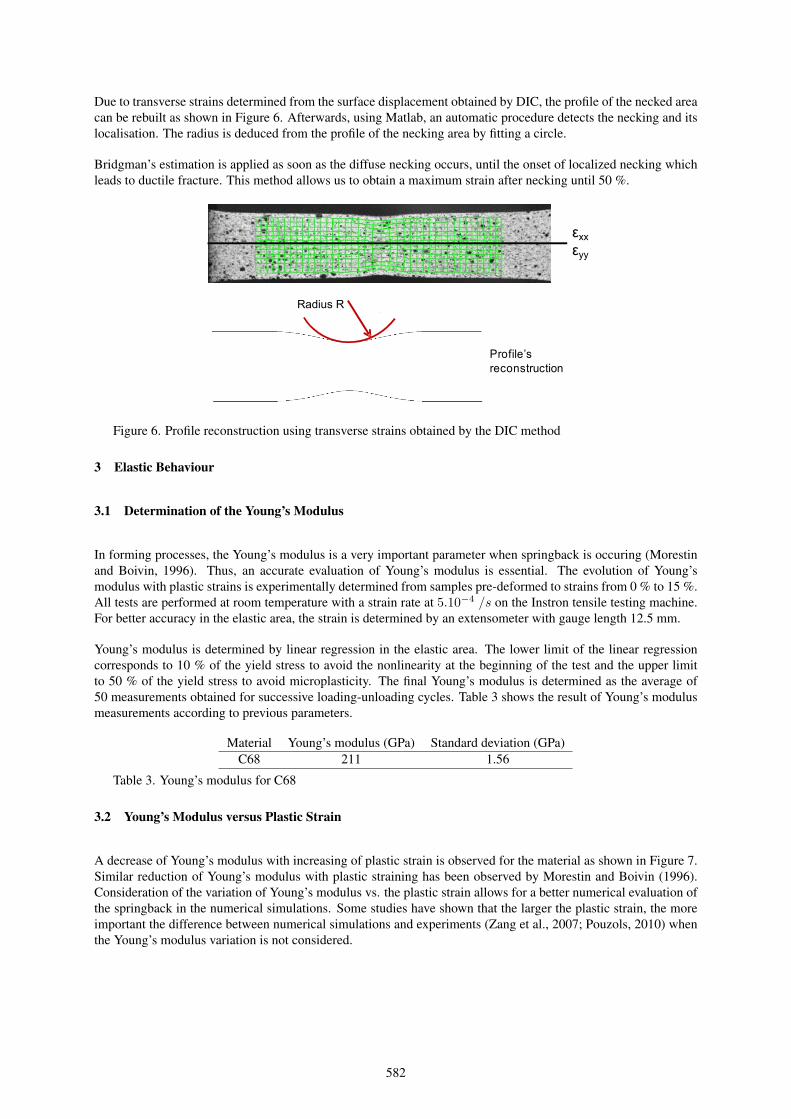
Due to transverse strains determined from the surface displacement obtained by DIC, the profile of the necked areacan be rebuilt as shown in Figure 6. Afterwards, using Matlab, an automatic procedure detects the necking and itslocalisation. The radius is deduced from the profile of the necking area by fitting a circle.
Bridgman’s estimation is applied as soon as the diffuse necking occurs, until the onset of localized necking whichleads to ductile fracture. This method allows us to obtain a maximum strain after necking until 50 %.
Rayon R
εxxεyy
Profile’s reconstruction
Radius R
Figure 6. Profile reconstruction using transverse strains obtained by the DIC method
3 Elastic Behaviour
3.1 Determination of the Young’s Modulus
In forming processes, the Young’s modulus is a very important parameter when springback is occuring (Morestinand Boivin, 1996). Thus, an accurate evaluation of Young’s modulus is essential. The evolution of Young’smodulus with plastic strains is experimentally determined from samples pre-deformed to strains from 0 % to 15 %.All tests are performed at room temperature with a strain rate at 5.10−4 /s on the Instron tensile testing machine.For better accuracy in the elastic area, the strain is determined by an extensometer with gauge length 12.5 mm.
Young’s modulus is determined by linear regression in the elastic area. The lower limit of the linear regressioncorresponds to 10 % of the yield stress to avoid the nonlinearity at the beginning of the test and the upper limitto 50 % of the yield stress to avoid microplasticity. The final Young’s modulus is determined as the average of50 measurements obtained for successive loading-unloading cycles. Table 3 shows the result of Young’s modulusmeasurements according to previous parameters.
Material Young’s modulus (GPa) Standard deviation (GPa)C68 211 1.56
Table 3. Young’s modulus for C68
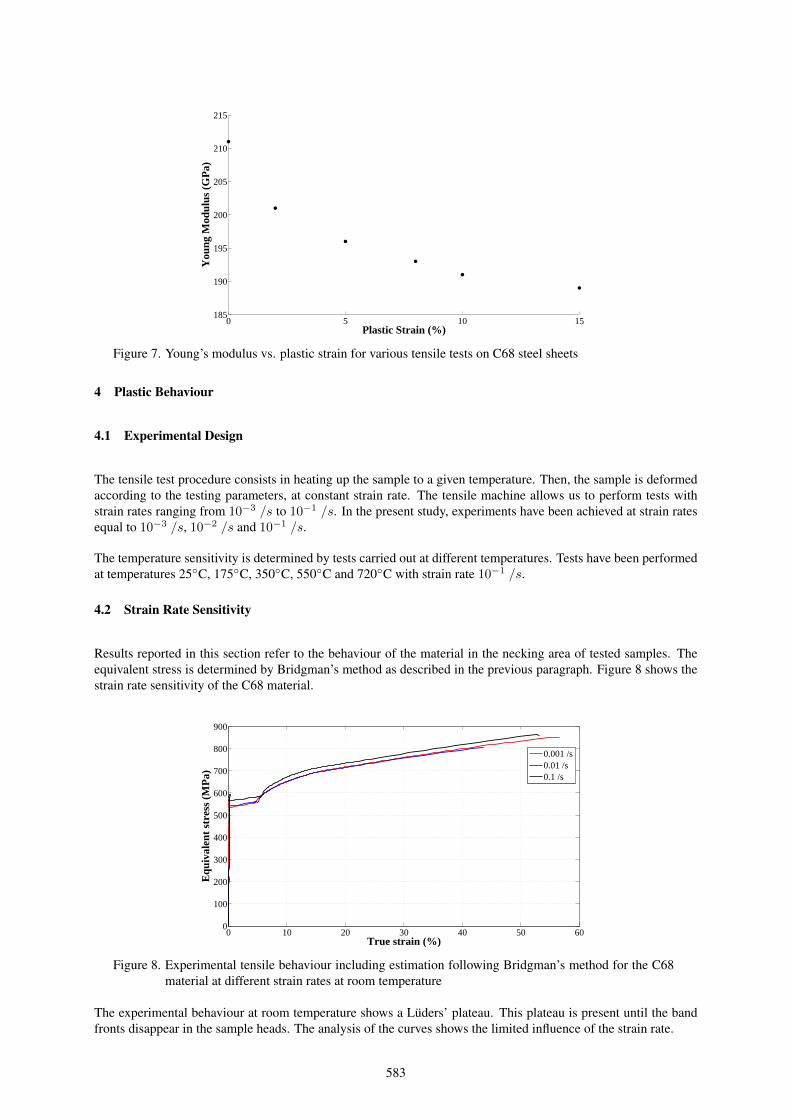
3.2 Young’s Modulus versus Plastic Strain
A decrease of Young’s modulus with increasing of plastic strain is observed for the material as shown in Figure 7.Similar reduction of Young’s modulus with plastic straining has been observed by Morestin and Boivin (1996).Consideration of the variation of Young’s modulus vs. the plastic strain allows for a better numerical evaluation ofthe springback in the numerical simulations. Some studies have shown that the larger the plastic strain, the moreimportant the difference between numerical simulations and experiments (Zang et al., 2007; Pouzols, 2010) whenthe Young’s modulus variation is not considered.
582
0 5 10 15185
190
195
200
205
210
215
Plastic Strain (%)
You
ng M
odul
us (
GP
a)
Figure 7. Young’s modulus vs. plastic strain for various tensile tests on C68 steel sheets
4 Plastic Behaviour
4.1 Experimental Design
The tensile test procedure consists in heating up the sample to a given temperature. Then, the sample is deformedaccording to the testing parameters, at constant strain rate. The tensile machine allows us to perform tests withstrain rates ranging from 10−3 /s to 10−1 /s. In the present study, experiments have been achieved at strain ratesequal to 10−3 /s, 10−2 /s and 10−1 /s.
The temperature sensitivity is determined by tests carried out at different temperatures. Tests have been performedat temperatures 25◦C, 175◦C, 350◦C, 550◦C and 720◦C with strain rate 10−1 /s.
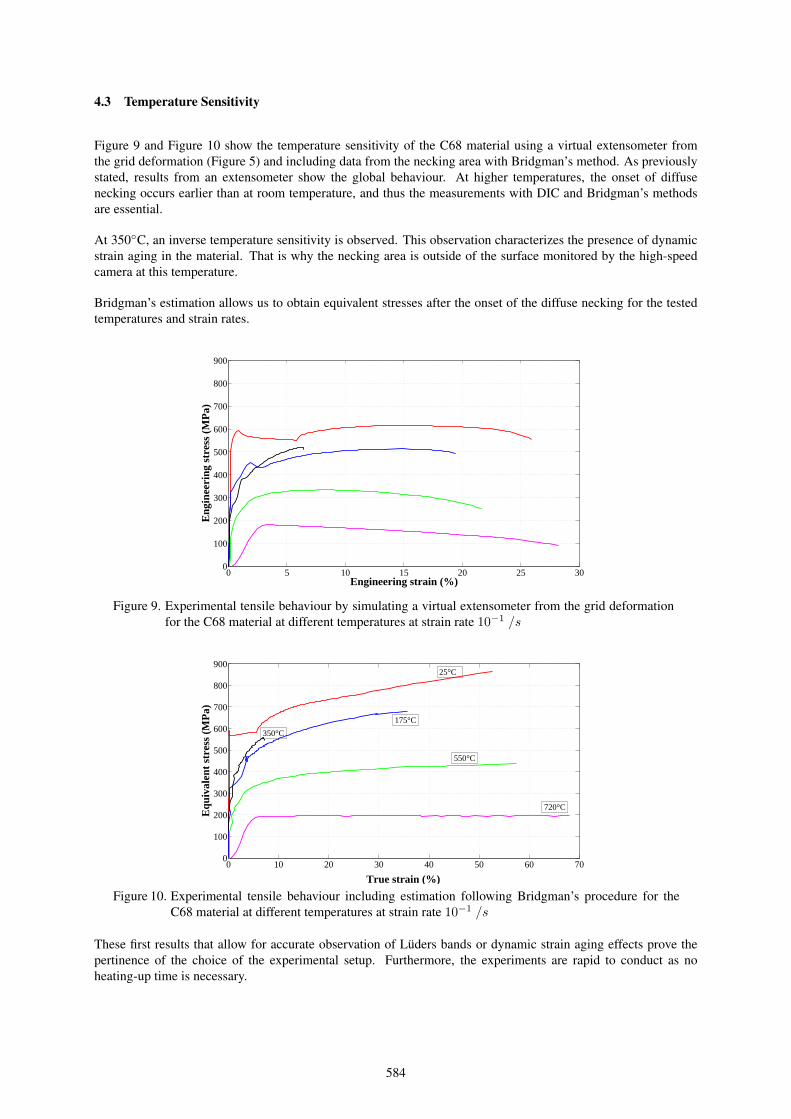
4.2 Strain Rate Sensitivity
Results reported in this section refer to the behaviour of the material in the necking area of tested samples. Theequivalent stress is determined by Bridgman’s method as described in the previous paragraph. Figure 8 shows thestrain rate sensitivity of the C68 material.
0 10 20 30 40 50 600
100
200
300
400
500
600
700
800
900
True strain (%)
Equ
ival
ent
stre
ss (
MP
a)
0.001 /s0.01 /s0.1 /s
Figure 8. Experimental tensile behaviour including estimation following Bridgman’s method for the C68material at different strain rates at room temperature
The experimental behaviour at room temperature shows a Luders’ plateau. This plateau is present until the bandfronts disappear in the sample heads. The analysis of the curves shows the limited influence of the strain rate.
583
4.3 Temperature Sensitivity
Figure 9 and Figure 10 show the temperature sensitivity of the C68 material using a virtual extensometer fromthe grid deformation (Figure 5) and including data from the necking area with Bridgman’s method. As previouslystated, results from an extensometer show the global behaviour. At higher temperatures, the onset of diffusenecking occurs earlier than at room temperature, and thus the measurements with DIC and Bridgman’s methodsare essential.
At 350◦C, an inverse temperature sensitivity is observed. This observation characterizes the presence of dynamicstrain aging in the material. That is why the necking area is outside of the surface monitored by the high-speedcamera at this temperature.
Bridgman’s estimation allows us to obtain equivalent stresses after the onset of the diffuse necking for the testedtemperatures and strain rates.
0 5 10 15 20 25 300
100
200
300
400
500
600
700
800
900
Engineering strain (%)
Eng
inee
ring
str
ess
(MP
a)
Figure 9. Experimental tensile behaviour by simulating a virtual extensometer from the grid deformationfor the C68 material at different temperatures at strain rate 10−1 /s
0 10 20 30 40 50 60 700
100
200
300
400
500
600
700
800
900
True strain (%)
Equ
ival
ent
stre
ss (
MP
a)
25°C
720°C
550°C
175°C
350°C
Figure 10. Experimental tensile behaviour including estimation following Bridgman’s procedure for theC68 material at different temperatures at strain rate 10−1 /s
These first results that allow for accurate observation of Luders bands or dynamic strain aging effects prove thepertinence of the choice of the experimental setup. Furthermore, the experiments are rapid to conduct as noheating-up time is necessary.
584
5 Conclusions and Prospects
Metallic materials are increasingly deformed in severe conditions in forming processes. Therefore, it is neces-sary to carry out relevant experiments to determine accurately the mechanical behaviour of the material at high-temperature and various strain rates.
To estimate the springback, an important phenomenon in a forming process, the characterization of the materialincludes an accurate determination of the Young’s modulus using loading-unloading cycles. The Young’s modulusis only determined for a strain rate of 10−3 /s at room temperature.
An experimental set-up for high-temperature tensile testing is proposed in this paper. This set-up includes aninduction system to heat the sample, controlled by a pyrometer. The full strain field is measured by the digitalimage correlation method. When the necking occurs, the stress distribution across the section is estimated byBridgman’s method.
Such equipment allows a characterization of the C68 steel which, despite a large utilization in industry, is not re-ported in today’s available bibliography. The analysis of the first results shows a clear sensitivity to the temperature.Strain rate effects should be studied at higher strain rates and elevated temperatures because the rate sensitivity inthe available range is not obvious. Other devices such as Hopkinson bars could be used. Further experimentalplan will investigate the interaction effect of temperature and strain rate on the C68 steel. Full characterization willprovide a database for further modeling and simulation.
References
Bridgman, P.: Studies in Large Plastic Flow and Fracture. McGraw-Hill (1952).
Le Roy, G.; Embury, J.; Edwards, G.; Ashby, M.: A model of ductile fracture based on the nucleation and growthof voids. Acta Metallurgica, 29, (1981), 1509–1522.
Liu, J.; Lyons, J.; Sutton, M.; Reynolds, A.: Experimental characterization of crack tip deformation fields in alloy718 at high temperatures. Journal of Engineering Materials and Technology, 120, (1998a), 71–78.
Liu, J.; Sutton, M.; Lyons, J.; Deng, X.: Experimental investigation of near crack tip creep deformation in alloy800 at 650c. International Journal of Fracture, 91, (1998b), 233–268.
Lyons, J.; Liu, J.; Sutton, M.: High-temperature deformation measurement using digital image correlation. Exper-imental Mechanics, 36, (1996), 64–70.
Morestin, F.; Boivin, M.: On the necessity of taking into account the variation in the young modulus with plasticstrain in elastic-plastic software. Nuclear Engineering and Design, 162, (1996), 107–116.
Pan, B.; Wu, D.; Xia, Y.: High-temperature deformation field measurement by combining transient aerodynamicheating simulation system and reliability-guided digital image correlation. Optics and Lasers in Engineering,48, (2010), 841–848.
Pouzols, V.: Optimisation d’operations industrielles de pliage par la methode des elements finis. Ph.D. thesis,Universite de Savoie (2010).
Raujol-Veille, J.; Toussaint, F.; Tabourot, L.; Vautrot, M.; Balland, P.: Fe simulation of a thin-wall short-tubeforming process. In: ESAFORM (2011).
Temimi-Maaref, N.: Comportement thermo-mcanique et rupture de polypropylnes. Etude exprimentale et modli-sation.. Ph.D. thesis, Ecole des Mines de Paris (2006).
Vacher, P.; Dumoulin, S.; Morestin, F.; Mguil-Touchal, S.: Bidimentional strain measurement using digital images.Proceedings of the Institution of Mechanical Engineers, Part C: Journal of Mechanical Engineering Science,213(8), (1999), 811–817.
Zang, S.; Liang, J.; Guo, C.: A constitutive model for spring-back prediction in which the change of youngmodulus with plastic deformation is considered. International Journal of Machine Tools & Manufacture, 47,(2007), 1791–1797.
585

Zhang, Z. L.; Hauge, W.; Ødegard, J.; Thaulow, C.: Determining material true stress-strain curve from tensilespecimens with rectangular cross-section. International Journal of Solids and Structures, 36, (1999), 3497–3516.
Addresses: Mathieu Vautrot, Pascale Balland, Laurent Tabourot, Jonathan Raujol-Veille, Franck Toussaint,Laboratoire SYMME, Universite de Savoie, Annecy le Vieux.Odd Sture Hopperstad, SIMLab, Norwegian University of Science and Technology, Trondheim.email:[email protected]; [email protected];[email protected]; [email protected];[email protected]; [email protected]
586