Embed Size (px)
Citation preview
General rights Copyright and moral rights for the publications made accessible in the public portal are retained by the authors and/or other copyright owners and it is a condition of accessing publications that users recognise and abide by the legal requirements associated with these rights.
• Users may download and print one copy of any publication from the public portal for the purpose of private study or research. • You may not further distribute the material or use it for any profit-making activity or commercial gain • You may freely distribute the URL identifying the publication in the public portal
If you believe that this document breaches copyright please contact us providing details, and we will remove access to the work immediately and investigate your claim.
Downloaded from orbit.dtu.dk on: Jul 14, 2018
Characterization of impregnated GDC nano structures and their functionality in LSMbased cathodes
Klemensø, Trine; Chatzichristodoulou, Christodoulos; Nielsen, Jimmi; Bozza, Francesco; Thydén, KarlTor Sune; Kiebach, Wolff-Ragnar; Ramousse, SeverinePublished in:Solid State Ionics
Link to article, DOI:10.1016/j.ssi.2012.07.011
Publication date:2012
Document VersionPublisher's PDF, also known as Version of record
Link back to DTU Orbit
Citation (APA):Klemensø, T., Chatzichristodoulou, C., Nielsen, J., Bozza, F., Thydén, K. T. S., Kiebach, W-R., & Ramousse, S.(2012). Characterization of impregnated GDC nano structures and their functionality in LSM based cathodes.Solid State Ionics, 224, 21-31. DOI: 10.1016/j.ssi.2012.07.011
Characterization of impregnated GDC nano structures and their functionality in LSMbased cathodes
Trine Klemensø ⁎, Christodoulos Chatzichristodoulou, Jimmi Nielsen, Francesco Bozza, Karl Thydén,Ragnar Kiebach, Severine RamousseDepartment of Energy Conversion and Storage, Technical University of Denmark, Risø Campus, Frederiksborgvej 399, DK-4000 Roskilde, Denmark
a b s t r a c ta r t i c l e i n f o
Article history:Received 7 May 2012Received in revised form 28 June 2012Accepted 16 July 2012Available online 3 August 2012
Keywords:Solid oxide fuel cell electrodeImpregnationInfiltrationNano particleTriple phase boundaryMeso porous materials
Porous composite cathodes of LSM–YSZ (lanthanum strontium manganite and yttria stabilized zirconia) wereimpregnated with GDC (gadolinia doped ceria) nano particles. The impregnation process was varied usingnone or different surfactants (Triton X-45, Triton X-100, P123), and the quantity of impregnated GDCwas variedvia the precursor concentration and number of impregnation cycles. The obtained structures were characterizedwith Kr and N2 adsorption/desorption isotherms, mercury intrusion porosimetry, in-situ high temperature X-raydiffraction, scanning electronmicroscopy (SEM) and electrochemical impedance spectroscopy (EIS). The perfor-mance of the impregnated LSM–YSZ cathodewas correlatedwith the GDC load, and the density and connectivityof the GDC phase, whereas crystallite size and surface area appeared less significant. The impregnated GDC wasindicated to be preferentially situated on the LSM phase and the LSM grain boundaries. The observations suggestthat the improved performance associatedwith GDC nano particles is related to the particles placed near the TPB(triple phase boundary) zone. The GDC extends the TPB by creating an ionic conducting network on top of theLSM particles and on top of the insulating low conducting zirconates at the LSM–YSZ interface.
© 2012 Elsevier B.V. All rights reserved.
1. Introduction
The impregnation or infiltrationwith nano particles is an increasing-ly applied method to improve the electrochemical performance of elec-trode materials, particularly in SOFC (solid oxide fuel cell) electrodes.The terms impregnation and infiltration are used interchangeably, butwith a tendency to use impregnation when introducing lower loadingsinto the electrode, as e.g. done in heterogeneous catalysis, and infiltra-tion when higher loadings and percolating phases are formed in theprocess. As both approaches are used in the literature for electrodes,as well as in this study, the terms will be used synonymously.
A vast number of electrode backbones impregnatedwith a large var-iation of impregnation compositions have been investigated, and sever-al reviews in the field exist, most recently by Jiang et al. [1] on SOFCcathode impregnation, and S.P. Jiang [2] on SOFC electrodes. Despitethe extensive research in the area, the functionality of the nanoparticlesis not yet fully understood. The apparent discrepancies in the literatureare described in detail in the reviews and summarized in the following.In many cases, the infiltrated nano particles provide enhanced ionicconductivity to the structure, thereby increasing the active TPB (triplephase boundary) zone. This is believed to be the case in LSM backbones
infiltratedwith YSB (yttria stabilized bismuth oxide) or GDC. Better per-formance is observed with higher loadings of GDC [3,4], and with YSBwhich has a higher oxide ion conductivity than GDC [1].
However, for several impregnated systems, a similar effect is ob-served irrespective of differences in the oxide ion conductivity of theimpregnated nano particles. This is especially seen for systems wherethe impregnated backbone is a composite possessing both ionic andelectronic conductivities. For example, LSM–YSZ composite cathodesinfiltrated with CeO2 or doped ceria have shown similar performance[1]. Also, similar performance was observed for YSZ–LSM or YSZ–LSFinfiltrated electrodes, which were further impregnated with Pd, CeO2,SDC (samaria doped ceria), YSZ, CaO, or K2O, despite the impregnatedmaterials differing widely in oxide ion conductivity and catalytic activ-ity [1]. Most recently, Liu et al. [5] studied Ni-based anodes impregnatedwith SDC, CeO2, Sm2O3 or Al2O3 and showed that similar performancewas obtained for all the materials except for Al2O3, despite the differ-ences in oxide ion conductivity.
The later observations point to the nano particles having a morestructural effect than pure extension of the TPB or only catalytic nature.Among the suggested explanations are the nano particles acting as im-purity scavengers, and the effect beingmore a function of their size thanthe material [1,6]. Bidrawn et al. [1,7] suggested surface area modifica-tion by the nano particles, irrespective of thematerial properties, whichcould explain the similar performance enhancement. Also recently, itwas shown that the impregnation precursor solution can chemicallymodify the electrode surface [8]. Another, or an additional mechanism
Solid State Ionics 224 (2012) 21–31
⁎ Corresponding author. Tel.: +45 46775756.E-mail address: [email protected] (T. Klemensø).
0167-2738/$ – see front matter © 2012 Elsevier B.V. All rights reserved.doi:10.1016/j.ssi.2012.07.011
Contents lists available at SciVerse ScienceDirect
Solid State Ionics
j ourna l homepage: www.e lsev ie r .com/ locate /ss i
associated with the nano particles, could be enhanced catalytic effectknown as NEMCA from catalysis [9] or spillover mechanism [10].
A key to further understanding of the impregnation effect is charac-terization of the formed nano structures, which will be the focus of thecurrent study. In this work, LSM–YSZ cathodes impregnated with GDCare taken as example. The impregnated material is restricted to GDC,and the microstructure of the impregnated phase is varied by using im-pregnation precursors of different concentrations and with differentsurfactants, and different loads of infiltrated GDC. The microstructuresare characterized, and the effect of the nano structure is discussedwith respect to the electrical and electrochemical performance.
2. Experimental
2.1. Sample preparation
Symmetrical cells were prepared by screen printing the com-posite cathode of 50/50 wt.% La0.75Sr0.25Mn1.05O3±δ (LSM25) andZr0.84Y0.16O1.92 (8YSZ) onto both sides of a 16 cm2 sintered 8YSZ elec-trolyte layer. The electrolyte was produced in-house by tape castingand had a post-sintered thickness of ca. 200 μm. After printing, thecathodes were sintered above 1000 °C. The sintered 16 cm2 cellswere used for analyses of the specific surface area and pore size distri-bution (gas sorption), mercury intrusion porosimetry, electron mi-croscopy and X-ray diffraction, before and after impregnation. Someof the 16 cm2 cells were further cut into 6×6 mm2 samples for elec-trochemical cell testing. The smaller cells were painted with goldpaste (Ferro) and sintered above 850 °C before impregnation.
Impregnation solutions with low GDC precursor concentration(LC) and high concentration (HC), and with and without surfactantswere prepared and are summarized in Table 1. The impregnation so-lutions were prepared by dissolving Gd(NO3)3·6H2O (Alfa Aesar) andCe(NO3)3·6H2O (Alfa Aesar) at a mole ratio of 1:4 in ultrapure water.In some of the solutions, a surfactant was added, which was eitherTriton X-100 (Sigma Aldrich), Pluronic P123 (BASF), or Triton X-45(Fluka), and the surfactants will be denoted S1, S2 and S3, respective-ly, as shown in Table 1. A surfactant concentration of 0.4–0.6 g per10 g water was chosen, which is believed to be a factor of ca. 10 to100 above the critical micelle concentration (CMC) for the surfactant.The CMC and the micelle properties are to a high degree dependenton the temperature, and the components in the solution as well astheir concentrations. Therefore, a significant spread in the reportedvalues exists. The reported CMC values for Triton X-100 are between0.103 and 0.6 mg/mL [11–15], for Triton X-45 between 0.04 and0.057 mg/mL [13–15], and for P123 between 0.04 and 0.4 mg/mL[16,17]. The solutions were prepared at ambient temperature, whichis believed to be above the Krafft temperature for P123, whereself-assembly is observed [16]. For Triton X-100, ambient tempera-ture also appeared to be above the Krafft point as the prepared solu-tions were transparent. However, the solution with Triton X-45 wasmilky at room temperature in accordance with a reported Krafft
point of 35 °C [13]. At higher temperatures, the Tritons can again be-come insoluble at the cloud point, which is reported to be 38 °C forTriton X-45, and 64–68.5 °C for Triton X-100 [11,13]. The impregna-tion was carried out by dripping an excess of the solution onto thesample and drying in a vacuum chamber, before heating abruptly to300 °C to form the GDC phase. To obtain higher GDC loadings, the im-pregnation process was repeated.
Some of the precursors were examined by in-situ high tempera-ture X-ray diffraction (HT-XRD) to follow the formation and growthof the crystalline phases. This was done by dripping the solution ontop of a Pt foil and heating from room temperature to 900 °C with dif-fraction patterns recorded every 50–100 °C.
The conductivity of the impregnated GDC phase was evaluated bymeasurements on an infiltrated model YSZ backbone. Since the con-ductivity of the LSM–YSZ backbone is dominated by the electronicconductivity of LSM, it is difficult to distinguish the contribution ofthe infiltrated GDC phase. Instead, porous samples of 8YSZ were fab-ricated and infiltrated with a precursor, and the total conductivitywas measured before and after infiltration by impedance spectrosco-py. The porous 8YSZ samples were fabricated from a tape cast slurrycontaining graphite as pore former and sintered to an open porosityof 27% (see [18] for details). Sintered Au paste was used as currentcollector as described earlier.
Dense pellets were prepared to examine the 2-dimensional struc-ture of the impregnated GDC. The samples were made by dripping pre-cursor solution onto the surface of a LSM–YSZ pellet. The pellets wereprepared by mixing the two powders, LSM25 and 8YSZ (50:50 wt.%ratio), and uniaxially press-forming the powder into disks. The pressedpellets were sintered at 1300 or 1500 °C, and the surface of the diskspolished to 0.25 μm for finish. To remove any mechanically inducedstresses in the surface from the polishing step, the pellets wereannealed at 1000 °C, before dripping precursor onto the pellet surfacein an amount corresponding to impregnation with the LC precursor(10.6±1.0 mg/m2), and followed by heat treatment at 650 °C.
2.2. Instruments
The microstructure of the cathodes, before and after impregnationwith the various precursors, was examined using an Autopore IV9500V1.05 instrument (Micromeritics Instrument Corporation, Norcross,GA) for porosity and pore size distribution. BET specific surface area andpore size distributionwere calculated fromdata collected on anAutosorb1MP instrument (Quantachrome Instruments, FL). The samples weredegassed at 300 °C for 3 h prior to the adsorption/desorption measure-ments. The BET surface areawas calculated from the adsorption isothermin the pressure ratio range p/p0 between 0.05 and maximum 0.30 usingeither Kr or N2 adsorption at 77.35 K. The pore size distribution was cal-culated from isotherms of the N2 adsorption/desorption at 77.35 K usingthe BJH and t-plot calculations implemented in the Autosorp 1 software.In some cases, the pore size distribution was also analyzed with Kradsorption at 87.27 K, a technique useful for analyzing pore sizes forlow surface area samples with pore sizes below ca. 10 nm as describedby Thommes [19]. These measurements were carried out with aQuantachrome AS1Win at Quantachrome, Odelzhausen, Germany.
Scanning electron microscopy (SEM) was used for studying frac-tured surfaces of the samples, as well as the surface of the pellets. Thestudies were carried out at a low accelerating voltage of 5 kV witha high-resolution FESEM (Supra 35) and a Crossbeam 1540XB (bothfrom Carl Zeiss, Germany).
A Bruker D8 Advance diffractometer with CuKα radiation and a PSDLynxEye detector equipped with an MRI high temperature stage wasused for the in-situ HT-XRD experiments. The volume weighted meancrystallite size was calculated from the XRD diffractograms using theDouble-Voigt approach, where crystallite size and strain compriseLorentzian and Gaussian component convolutions varying in 2θ as afunction of 1/cosθ and tanθ, respectively. Diffraction data from a well
Table 1Impregnation solutions (precursors) and samples tested. The nomenclature is based onthe surfactant type (S1 is Triton X-100, S2 is P123, S3 is Triton X-45), and the GDC loadcontained in the precursor (LC is low concentration, HC is high concentration) reflectedas the amount of GDC impregnated in one step relative to the backbone (shown in wt.%and mg/m2 backbone in the table).
Name Surfactant type Surfactant concentrationin g/10 g H2O
GDC in wt.% GDC in mg/m2
LC None – 3.3±0.3 10.6±1.0LC-S1 Triton X-100 0.6 3.1±0.3 9.7±1.0HC None – 12.0±1.2 38.1±3.8HC-S1 Triton X-100 0.6 11.4±1.4 36.1±3.6HC-S2 P123 0.6 12.9±1.3 40.8±4.1HC-S3 Triton X-45 0.4 9.9±1.0 31.3±3.1
22 T. Klemensø et al. / Solid State Ionics 224 (2012) 21–31
crystallized Ce0.9Gd0.1O1.95 sample were used to derive the instrumentfunction.
The impregnated cathode layers and the porous 8YSZ sampleswere tested in a symmetrical cell configuration. The cells were placedbetween two platinum grids that were loaded with a small weight tofacilitate electrical contact between the grids and the Au current col-lector layers on the cell. The cells were characterized by impedancemeasurements at open circuit voltage (OCV), and at temperatures of650–750 °C. Measurements were collected in the frequency rangefrom 0.05 Hz to 82541 Hz, with 10 points/decade and a root meansquare amplitude of 0.05 V. The measurements were carried out instagnant air.
3. Results
3.1. In-situ HT-XRD
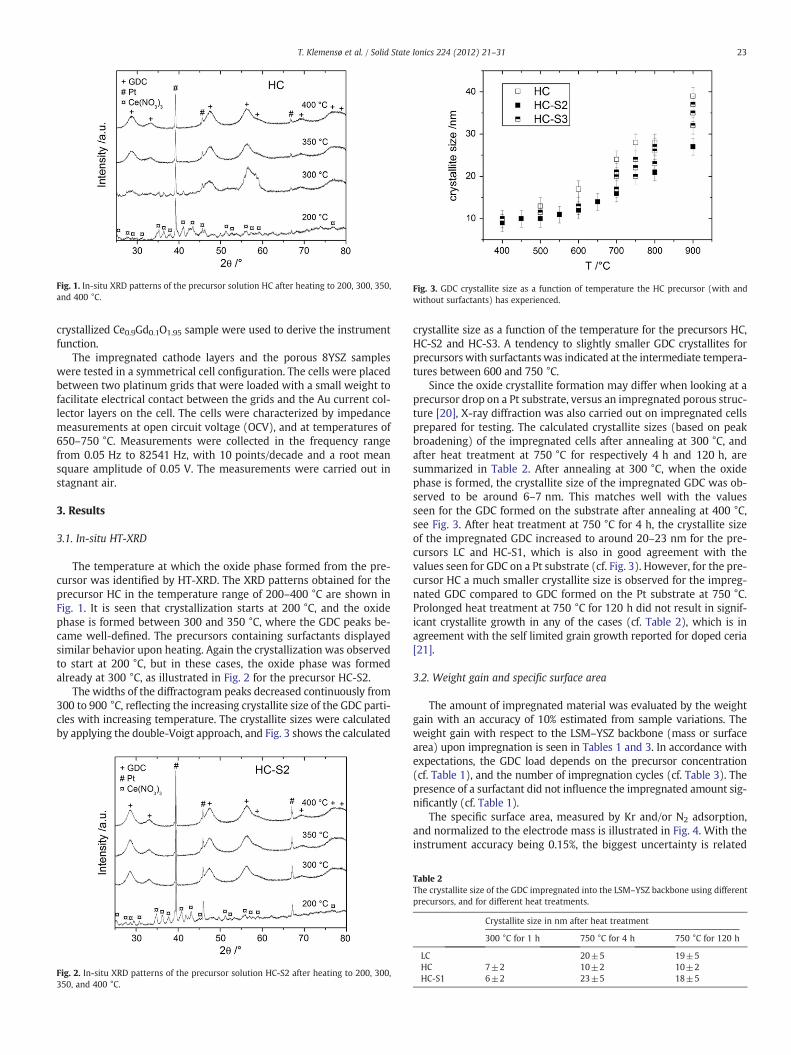
The temperature at which the oxide phase formed from the pre-cursor was identified by HT-XRD. The XRD patterns obtained for theprecursor HC in the temperature range of 200–400 °C are shown inFig. 1. It is seen that crystallization starts at 200 °C, and the oxidephase is formed between 300 and 350 °C, where the GDC peaks be-came well-defined. The precursors containing surfactants displayedsimilar behavior upon heating. Again the crystallization was observedto start at 200 °C, but in these cases, the oxide phase was formedalready at 300 °C, as illustrated in Fig. 2 for the precursor HC-S2.
The widths of the diffractogram peaks decreased continuously from300 to 900 °C, reflecting the increasing crystallite size of the GDC parti-cles with increasing temperature. The crystallite sizes were calculatedby applying the double-Voigt approach, and Fig. 3 shows the calculated
crystallite size as a function of the temperature for the precursors HC,HC-S2 and HC-S3. A tendency to slightly smaller GDC crystallites forprecursors with surfactants was indicated at the intermediate tempera-tures between 600 and 750 °C.
Since the oxide crystallite formation may differ when looking at aprecursor drop on a Pt substrate, versus an impregnated porous struc-ture [20], X-ray diffraction was also carried out on impregnated cellsprepared for testing. The calculated crystallite sizes (based on peakbroadening) of the impregnated cells after annealing at 300 °C, andafter heat treatment at 750 °C for respectively 4 h and 120 h, aresummarized in Table 2. After annealing at 300 °C, when the oxidephase is formed, the crystallite size of the impregnated GDC was ob-served to be around 6–7 nm. This matches well with the valuesseen for the GDC formed on the substrate after annealing at 400 °C,see Fig. 3. After heat treatment at 750 °C for 4 h, the crystallite sizeof the impregnated GDC increased to around 20–23 nm for the pre-cursors LC and HC-S1, which is also in good agreement with thevalues seen for GDC on a Pt substrate (cf. Fig. 3). However, for the pre-cursor HC a much smaller crystallite size is observed for the impreg-nated GDC compared to GDC formed on the Pt substrate at 750 °C.Prolonged heat treatment at 750 °C for 120 h did not result in signif-icant crystallite growth in any of the cases (cf. Table 2), which is inagreement with the self limited grain growth reported for doped ceria[21].
3.2. Weight gain and specific surface area
The amount of impregnated material was evaluated by the weightgain with an accuracy of 10% estimated from sample variations. Theweight gain with respect to the LSM–YSZ backbone (mass or surfacearea) upon impregnation is seen in Tables 1 and 3. In accordance withexpectations, the GDC load depends on the precursor concentration(cf. Table 1), and the number of impregnation cycles (cf. Table 3). Thepresence of a surfactant did not influence the impregnated amount sig-nificantly (cf. Table 1).
The specific surface area, measured by Kr and/or N2 adsorption,and normalized to the electrode mass is illustrated in Fig. 4. With theinstrument accuracy being 0.15%, the biggest uncertainty is related
Fig. 1. In-situ XRD patterns of the precursor solution HC after heating to 200, 300, 350,and 400 °C.
Fig. 2. In-situ XRD patterns of the precursor solution HC-S2 after heating to 200, 300,350, and 400 °C.
Fig. 3. GDC crystallite size as a function of temperature the HC precursor (with andwithout surfactants) has experienced.
Table 2The crystallite size of the GDC impregnated into the LSM–YSZ backbone using differentprecursors, and for different heat treatments.
Crystallite size in nm after heat treatment
300 °C for 1 h 750 °C for 4 h 750 °C for 120 h
LC 20±5 19±5HC 7±2 10±2 10±2HC-S1 6±2 23±5 18±5
23T. Klemensø et al. / Solid State Ionics 224 (2012) 21–31

to sample variations. Based on measurements of identically impreg-nated samples, an uncertainty of 10% was estimated, and for thenon-impregnated LSM–YSZ backbone an uncertainty of 2% was mea-sured. The LSM–YSZ backbonewasmeasured to have a specific surfacearea of 3.16±0.06 m2/g, and upon impregnation the surface area in-creased dramatically for all the precursors. For the low concentrationprecursors (with resulting lower GDC loads), the surface area in-creased to ca. 12±1 m2/g (for LC), and to 16±2 m2/g (for LC-S1).For the high concentration precursors, and with resulting higher GDCloads, the surface area increased even more, up to above 20 m2/g.
Fig. 4 further indicates that the surfactants influence the formedsurface area. Comparing the low concentration precursors (LC andLC-S1), it appears that S1 has a slight positive effect, and similarlywhen comparing the effect of S1 for the high concentration precur-sors (HC and HC-S1), whereas S2 and S3 appear to have a negative ef-fect on the formed surface area.
Generally, the surface area per mass backbone does not vary sig-nificantly with GDC load, with the exception of the highest loadwith HC-S1 (cf. Fig. 4). However, as the load of GDC differs, a possibleeffect may not be seen when normalizing to the backbone. Thus, tofurther evaluate the effect of the GDC load on the surface area forma-tion, Fig. 5 shows the surface areas normalized to the load of impreg-nated GDC. Using this normalization, surface areas in the range of50–300 m2/g GDC are obtained. These values correspond well withthe impregnated GDC being nano sized, and possibly having some de-gree of meso porosity. In contrast to Fig. 4, the highest surface area isnow obtained with the low load and LC precursor, and a dramatic de-crease in surface area is seen as the GDC load increases for this pre-cursor. For the HC precursor on the other hand, a slight increase orconstant surface area is seen with increasing GDC load. In Fig. 5 rep-resentation, an effect of the surfactants is also indicated. Comparing
HC and HC-S1, higher surface areas are seen with S1, whereas S2and S3 do not appear to have a significant effect.
The change in surface area as a function of heat treatment was alsomeasured. Fig. 6 illustrates how the surface area decreased as thesample was exposed to heat treatment at 750 °C for 4 and 120 h, re-spectively. A more rapid decrease was indicated for the samplesformed with HC precursors compared to LC, and also slightly morepronounced for HC-S1. Furthermore, the main degradation appearedto occur within the first hours at 750 °C, and then diminishing withtime. Since crystallite growth was not detected during the heat treat-ment (cf. Table 2), the decrease in surface area is indicated to be relat-ed to agglomeration of the GDC nano particles upon heat treatment.
3.3. Porosity and pore size distribution
Pore size distributions can be evaluated by different techniques,and which is more accurate will depend on the amount of sampleavailable for the measurement, as well as the pore size range. To eval-uate which technique is more suitable, the pore size distributionswere analyzed using mercury intrusion (Washburn calculation), andN2 andKr adsorption/desorption isotherms (in agreementwith conven-tion, BJH calculation was used on the N2 desorption branch since no ar-tifact from N2 appeared when comparing the isotherm adsorption/desorption branches). Fig. 7 shows the curves obtained with the differ-ent techniques on a sample impregnated with 11 wt.% GDC using HCprecursor. The amount of meso porosity was seen to be limited, andthe majority of the porosity has pore diameters above 100 nm. Kr ad-sorption at 87.27 K is only a valid method for pore size evaluationb10 nm, and therefore appeared to be a less relevant technique forthis kind of samples [19]. A low amount of micro porosity (b2 nmpores) was also indicated by the t-plot calculations on the adsorption
Table 3Summary of the porosity data obtained with different techniques, Hg refers to mercury intrusion, N2 and Kr refer to N2 and Kr adsorption, respectively. The impregnated GDC inwt.% is included for comparison. Samples of the type HC-S1 with higher amounts of infiltrated GDC (more cycles) have the extensions a and b in the name.
Sample GDC in wt.% Heat treatment Porosity by Hg in % Porosityb30 nm by N2 in cm3/g Porosityb10 nm by Kr in cm3/g
LSM–YSZ – – 16±1 – 0.000415HC 12.2±1.2 – 13±1 0.008481 0.002469HC 12.2±1.2 750 °C for 120 h 10±1 – –
HC-S1 11.4±1.1 – 10±1 0.004877 –
HC-S1-a 27.1±2.7 – 8±1 – –
HC-S1-b 30.9±3.1 – 7±1 – –
HC-S1 11.4±1.1 750 °C for 120 h 8±1 – –
HC-S2 9.9±1.0 – 10±1 0.003935 –
HC-S3 12.9±1.3 – 13±1 0.006014 –
Fig. 4. The surface area normalized to the LSM–YSZ backbone mass as a function of theimpregnation GDC amount. For the data point without error bar, the symbol size is rep-resentative for the error.
Fig. 5. The surface area normalized to the impregnated GDC mass as a function of theimpregnated GDC. For data points without error bars, the symbol size is representativefor the error.
24 T. Klemensø et al. / Solid State Ionics 224 (2012) 21–31
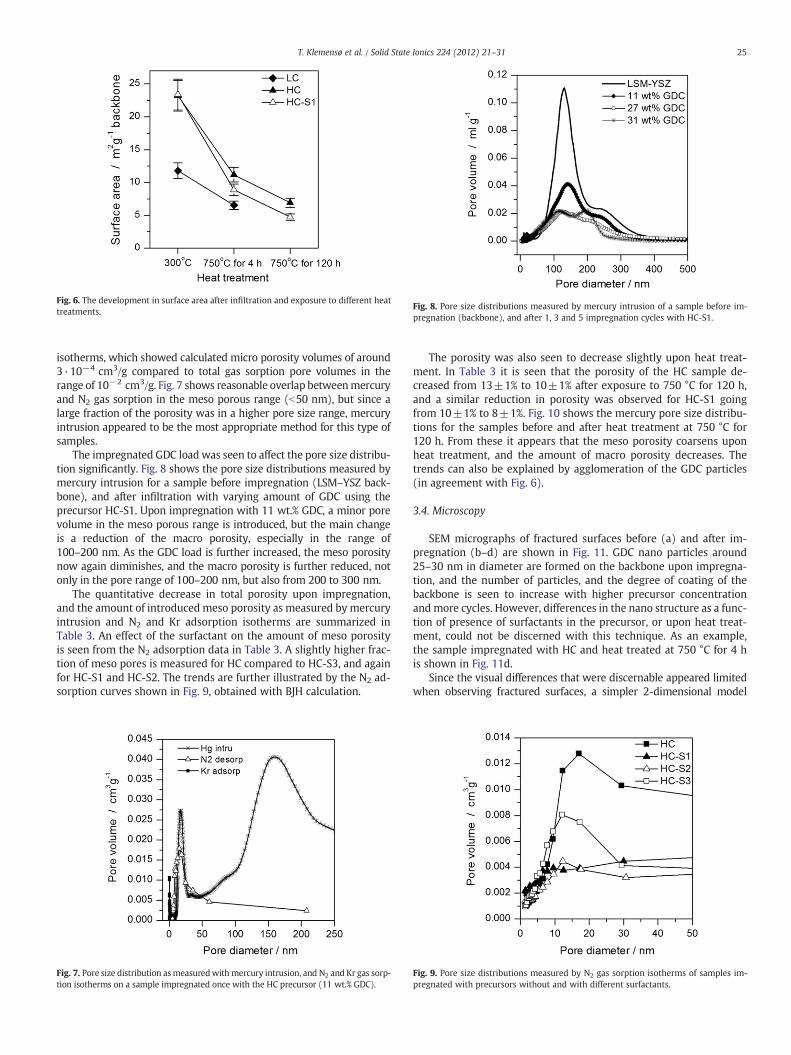
isotherms, which showed calculated micro porosity volumes of around3·10−4 cm3/g compared to total gas sorption pore volumes in therange of 10−2 cm3/g. Fig. 7 shows reasonable overlap betweenmercuryand N2 gas sorption in the meso porous range (b50 nm), but since alarge fraction of the porosity was in a higher pore size range, mercuryintrusion appeared to be the most appropriate method for this type ofsamples.
The impregnated GDC load was seen to affect the pore size distribu-tion significantly. Fig. 8 shows the pore size distributions measured bymercury intrusion for a sample before impregnation (LSM–YSZ back-bone), and after infiltration with varying amount of GDC using theprecursor HC-S1. Upon impregnation with 11 wt.% GDC, a minor porevolume in the meso porous range is introduced, but the main changeis a reduction of the macro porosity, especially in the range of100–200 nm. As the GDC load is further increased, the meso porositynow again diminishes, and the macro porosity is further reduced, notonly in the pore range of 100–200 nm, but also from 200 to 300 nm.
The quantitative decrease in total porosity upon impregnation,and the amount of introduced meso porosity as measured by mercuryintrusion and N2 and Kr adsorption isotherms are summarized inTable 3. An effect of the surfactant on the amount of meso porosityis seen from the N2 adsorption data in Table 3. A slightly higher frac-tion of meso pores is measured for HC compared to HC-S3, and againfor HC-S1 and HC-S2. The trends are further illustrated by the N2 ad-sorption curves shown in Fig. 9, obtained with BJH calculation.
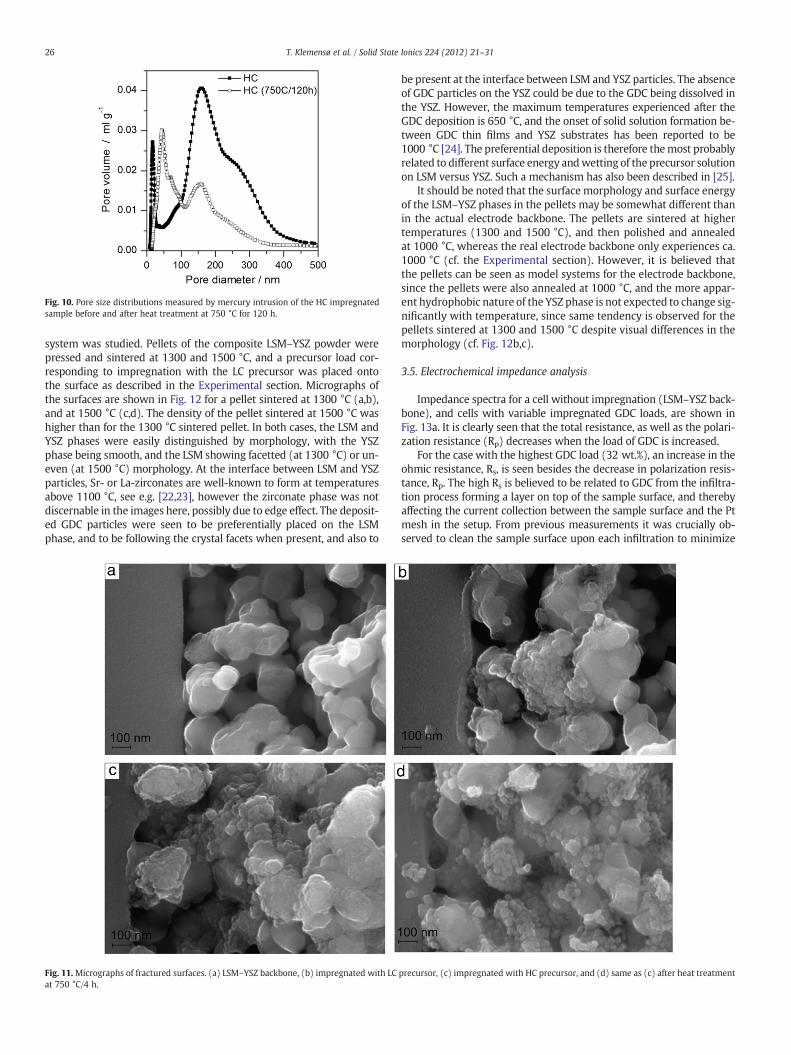
The porosity was also seen to decrease slightly upon heat treat-ment. In Table 3 it is seen that the porosity of the HC sample de-creased from 13±1% to 10±1% after exposure to 750 °C for 120 h,and a similar reduction in porosity was observed for HC-S1 goingfrom 10±1% to 8±1%. Fig. 10 shows the mercury pore size distribu-tions for the samples before and after heat treatment at 750 °C for120 h. From these it appears that the meso porosity coarsens uponheat treatment, and the amount of macro porosity decreases. Thetrends can also be explained by agglomeration of the GDC particles(in agreement with Fig. 6).
3.4. Microscopy
SEM micrographs of fractured surfaces before (a) and after im-pregnation (b–d) are shown in Fig. 11. GDC nano particles around25–30 nm in diameter are formed on the backbone upon impregna-tion, and the number of particles, and the degree of coating of thebackbone is seen to increase with higher precursor concentrationandmore cycles. However, differences in the nano structure as a func-tion of presence of surfactants in the precursor, or upon heat treat-ment, could not be discerned with this technique. As an example,the sample impregnated with HC and heat treated at 750 °C for 4 his shown in Fig. 11d.
Since the visual differences that were discernable appeared limitedwhen observing fractured surfaces, a simpler 2-dimensional model
Fig. 6. The development in surface area after infiltration and exposure to different heattreatments.
Fig. 7. Pore size distribution asmeasuredwithmercury intrusion, and N2 and Kr gas sorp-tion isotherms on a sample impregnated once with the HC precursor (11 wt.% GDC).
Fig. 8. Pore size distributions measured by mercury intrusion of a sample before im-pregnation (backbone), and after 1, 3 and 5 impregnation cycles with HC-S1.
Fig. 9. Pore size distributions measured by N2 gas sorption isotherms of samples im-pregnated with precursors without and with different surfactants.
25T. Klemensø et al. / Solid State Ionics 224 (2012) 21–31
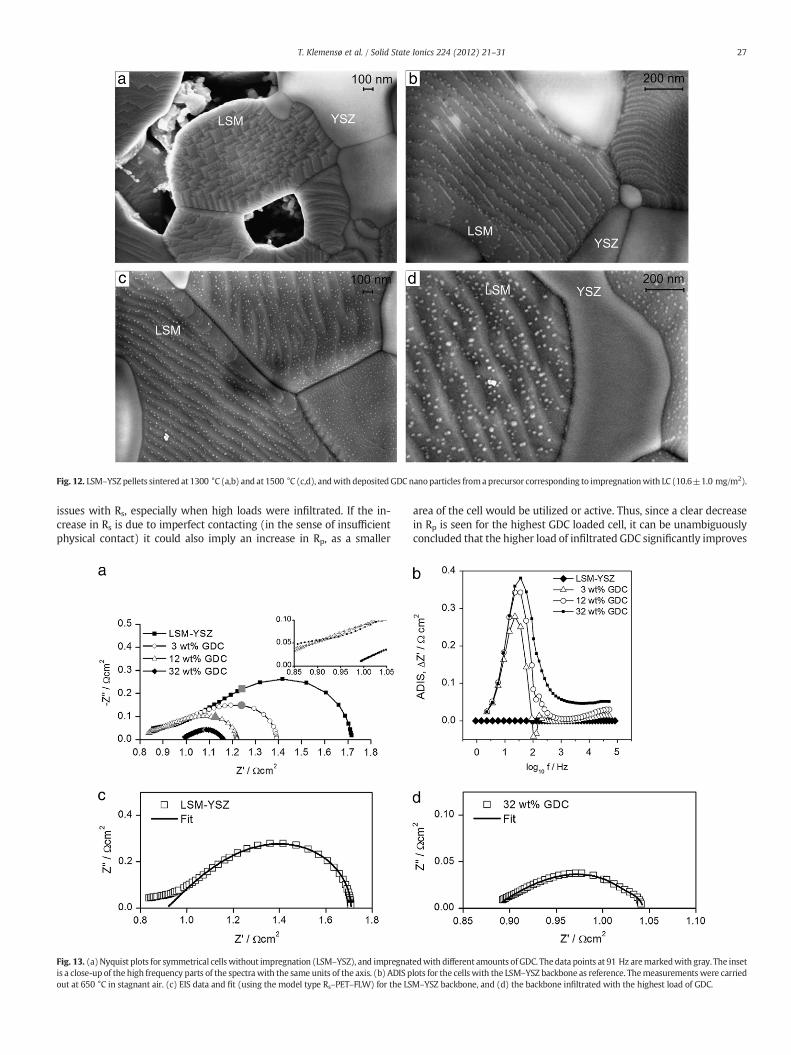
system was studied. Pellets of the composite LSM–YSZ powder werepressed and sintered at 1300 and 1500 °C, and a precursor load cor-responding to impregnation with the LC precursor was placed ontothe surface as described in the Experimental section. Micrographs ofthe surfaces are shown in Fig. 12 for a pellet sintered at 1300 °C (a,b),and at 1500 °C (c,d). The density of the pellet sintered at 1500 °C washigher than for the 1300 °C sintered pellet. In both cases, the LSM andYSZ phases were easily distinguished by morphology, with the YSZphase being smooth, and the LSM showing facetted (at 1300 °C) or un-even (at 1500 °C) morphology. At the interface between LSM and YSZparticles, Sr- or La-zirconates are well-known to form at temperaturesabove 1100 °C, see e.g. [22,23], however the zirconate phase was notdiscernable in the images here, possibly due to edge effect. The deposit-ed GDC particles were seen to be preferentially placed on the LSMphase, and to be following the crystal facets when present, and also to
be present at the interface between LSM and YSZ particles. The absenceof GDC particles on the YSZ could be due to the GDC being dissolved inthe YSZ. However, the maximum temperatures experienced after theGDC deposition is 650 °C, and the onset of solid solution formation be-tween GDC thin films and YSZ substrates has been reported to be1000 °C [24]. The preferential deposition is therefore themost probablyrelated to different surface energy andwetting of the precursor solutionon LSM versus YSZ. Such a mechanism has also been described in [25].
It should be noted that the surface morphology and surface energyof the LSM–YSZ phases in the pellets may be somewhat different thanin the actual electrode backbone. The pellets are sintered at highertemperatures (1300 and 1500 °C), and then polished and annealedat 1000 °C, whereas the real electrode backbone only experiences ca.1000 °C (cf. the Experimental section). However, it is believed thatthe pellets can be seen as model systems for the electrode backbone,since the pellets were also annealed at 1000 °C, and the more appar-ent hydrophobic nature of the YSZ phase is not expected to change sig-nificantly with temperature, since same tendency is observed for thepellets sintered at 1300 and 1500 °C despite visual differences in themorphology (cf. Fig. 12b,c).
3.5. Electrochemical impedance analysis
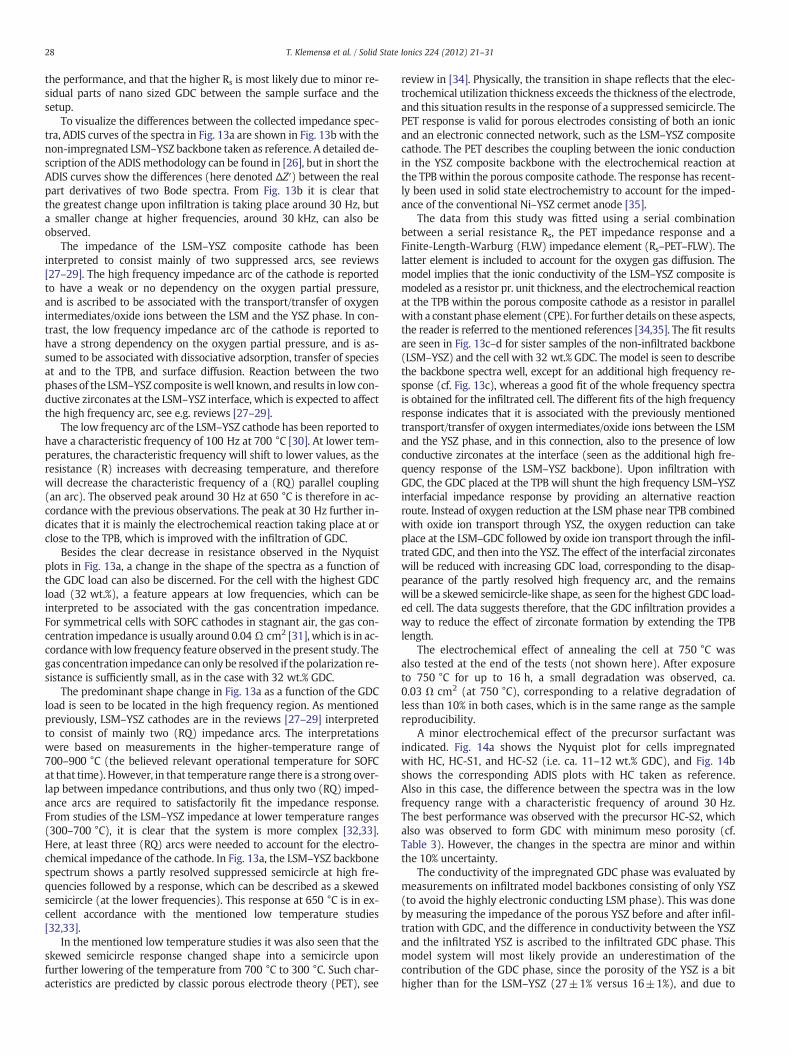
Impedance spectra for a cell without impregnation (LSM–YSZ back-bone), and cells with variable impregnated GDC loads, are shown inFig. 13a. It is clearly seen that the total resistance, as well as the polari-zation resistance (Rp) decreases when the load of GDC is increased.
For the case with the highest GDC load (32 wt.%), an increase in theohmic resistance, Rs, is seen besides the decrease in polarization resis-tance, Rp. The high Rs is believed to be related to GDC from the infiltra-tion process forming a layer on top of the sample surface, and therebyaffecting the current collection between the sample surface and the Ptmesh in the setup. From previous measurements it was crucially ob-served to clean the sample surface upon each infiltration to minimize
Fig. 10. Pore size distributions measured by mercury intrusion of the HC impregnatedsample before and after heat treatment at 750 °C for 120 h.
Fig. 11. Micrographs of fractured surfaces. (a) LSM–YSZ backbone, (b) impregnated with LC precursor, (c) impregnated with HC precursor, and (d) same as (c) after heat treatmentat 750 °C/4 h.
26 T. Klemensø et al. / Solid State Ionics 224 (2012) 21–31
issues with Rs, especially when high loads were infiltrated. If the in-crease in Rs is due to imperfect contacting (in the sense of insufficientphysical contact) it could also imply an increase in Rp, as a smaller
area of the cell would be utilized or active. Thus, since a clear decreasein Rp is seen for the highest GDC loaded cell, it can be unambiguouslyconcluded that the higher load of infiltrated GDC significantly improves
Fig. 12. LSM–YSZ pellets sintered at 1300 °C (a,b) and at 1500 °C (c,d), andwith depositedGDCnanoparticles fromaprecursor corresponding to impregnationwith LC (10.6±1.0 mg/m2).
Fig. 13. (a)Nyquist plots for symmetrical cellswithout impregnation (LSM–YSZ), and impregnatedwith different amounts of GDC. Thedata points at 91 Hz aremarkedwith gray. The insetis a close-up of the high frequency parts of the spectra with the same units of the axis. (b) ADIS plots for the cells with the LSM–YSZ backbone as reference. Themeasurements were carriedout at 650 °C in stagnant air. (c) EIS data and fit (using the model type Rs–PET–FLW) for the LSM–YSZ backbone, and (d) the backbone infiltrated with the highest load of GDC.
27T. Klemensø et al. / Solid State Ionics 224 (2012) 21–31
the performance, and that the higher Rs is most likely due to minor re-sidual parts of nano sized GDC between the sample surface and thesetup.
To visualize the differences between the collected impedance spec-tra, ADIS curves of the spectra in Fig. 13a are shown in Fig. 13b with thenon-impregnated LSM–YSZ backbone taken as reference. A detailed de-scription of the ADIS methodology can be found in [26], but in short theADIS curves show the differences (here denoted ΔZ′) between the realpart derivatives of two Bode spectra. From Fig. 13b it is clear thatthe greatest change upon infiltration is taking place around 30 Hz, buta smaller change at higher frequencies, around 30 kHz, can also beobserved.
The impedance of the LSM–YSZ composite cathode has beeninterpreted to consist mainly of two suppressed arcs, see reviews[27–29]. The high frequency impedance arc of the cathode is reportedto have a weak or no dependency on the oxygen partial pressure,and is ascribed to be associated with the transport/transfer of oxygenintermediates/oxide ions between the LSM and the YSZ phase. In con-trast, the low frequency impedance arc of the cathode is reported tohave a strong dependency on the oxygen partial pressure, and is as-sumed to be associated with dissociative adsorption, transfer of speciesat and to the TPB, and surface diffusion. Reaction between the twophases of the LSM–YSZ composite iswell known, and results in low con-ductive zirconates at the LSM–YSZ interface, which is expected to affectthe high frequency arc, see e.g. reviews [27–29].
The low frequency arc of the LSM–YSZ cathode has been reported tohave a characteristic frequency of 100 Hz at 700 °C [30]. At lower tem-peratures, the characteristic frequency will shift to lower values, as theresistance (R) increases with decreasing temperature, and thereforewill decrease the characteristic frequency of a (RQ) parallel coupling(an arc). The observed peak around 30 Hz at 650 °C is therefore in ac-cordance with the previous observations. The peak at 30 Hz further in-dicates that it is mainly the electrochemical reaction taking place at orclose to the TPB, which is improved with the infiltration of GDC.
Besides the clear decrease in resistance observed in the Nyquistplots in Fig. 13a, a change in the shape of the spectra as a function ofthe GDC load can also be discerned. For the cell with the highest GDCload (32 wt.%), a feature appears at low frequencies, which can beinterpreted to be associated with the gas concentration impedance.For symmetrical cells with SOFC cathodes in stagnant air, the gas con-centration impedance is usually around 0.04 Ω cm2 [31], which is in ac-cordancewith low frequency feature observed in the present study. Thegas concentration impedance can only be resolved if the polarization re-sistance is sufficiently small, as in the case with 32 wt.% GDC.
The predominant shape change in Fig. 13a as a function of the GDCload is seen to be located in the high frequency region. As mentionedpreviously, LSM–YSZ cathodes are in the reviews [27–29] interpretedto consist of mainly two (RQ) impedance arcs. The interpretationswere based on measurements in the higher-temperature range of700–900 °C (the believed relevant operational temperature for SOFCat that time). However, in that temperature range there is a strong over-lap between impedance contributions, and thus only two (RQ) imped-ance arcs are required to satisfactorily fit the impedance response.From studies of the LSM–YSZ impedance at lower temperature ranges(300–700 °C), it is clear that the system is more complex [32,33].Here, at least three (RQ) arcs were needed to account for the electro-chemical impedance of the cathode. In Fig. 13a, the LSM–YSZ backbonespectrum shows a partly resolved suppressed semicircle at high fre-quencies followed by a response, which can be described as a skewedsemicircle (at the lower frequencies). This response at 650 °C is in ex-cellent accordance with the mentioned low temperature studies[32,33].
In the mentioned low temperature studies it was also seen that theskewed semicircle response changed shape into a semicircle uponfurther lowering of the temperature from 700 °C to 300 °C. Such char-acteristics are predicted by classic porous electrode theory (PET), see
review in [34]. Physically, the transition in shape reflects that the elec-trochemical utilization thickness exceeds the thickness of the electrode,and this situation results in the response of a suppressed semicircle. ThePET response is valid for porous electrodes consisting of both an ionicand an electronic connected network, such as the LSM–YSZ compositecathode. The PET describes the coupling between the ionic conductionin the YSZ composite backbone with the electrochemical reaction atthe TPBwithin the porous composite cathode. The response has recent-ly been used in solid state electrochemistry to account for the imped-ance of the conventional Ni–YSZ cermet anode [35].
The data from this study was fitted using a serial combinationbetween a serial resistance Rs, the PET impedance response and aFinite-Length-Warburg (FLW) impedance element (Rs–PET–FLW). Thelatter element is included to account for the oxygen gas diffusion. Themodel implies that the ionic conductivity of the LSM–YSZ composite ismodeled as a resistor pr. unit thickness, and the electrochemical reactionat the TPB within the porous composite cathode as a resistor in parallelwith a constant phase element (CPE). For further details on these aspects,the reader is referred to the mentioned references [34,35]. The fit resultsare seen in Fig. 13c–d for sister samples of the non-infiltrated backbone(LSM–YSZ) and the cell with 32 wt.% GDC. Themodel is seen to describethe backbone spectra well, except for an additional high frequency re-sponse (cf. Fig. 13c), whereas a good fit of the whole frequency spectrais obtained for the infiltrated cell. The different fits of the high frequencyresponse indicates that it is associated with the previously mentionedtransport/transfer of oxygen intermediates/oxide ions between the LSMand the YSZ phase, and in this connection, also to the presence of lowconductive zirconates at the interface (seen as the additional high fre-quency response of the LSM–YSZ backbone). Upon infiltration withGDC, the GDC placed at the TPB will shunt the high frequency LSM–YSZinterfacial impedance response by providing an alternative reactionroute. Instead of oxygen reduction at the LSM phase near TPB combinedwith oxide ion transport through YSZ, the oxygen reduction can takeplace at the LSM–GDC followed by oxide ion transport through the infil-trated GDC, and then into the YSZ. The effect of the interfacial zirconateswill be reduced with increasing GDC load, corresponding to the disap-pearance of the partly resolved high frequency arc, and the remainswill be a skewed semicircle-like shape, as seen for the highest GDC load-ed cell. The data suggests therefore, that the GDC infiltration provides away to reduce the effect of zirconate formation by extending the TPBlength.
The electrochemical effect of annealing the cell at 750 °C wasalso tested at the end of the tests (not shown here). After exposureto 750 °C for up to 16 h, a small degradation was observed, ca.0.03 Ω cm2 (at 750 °C), corresponding to a relative degradation ofless than 10% in both cases, which is in the same range as the samplereproducibility.
A minor electrochemical effect of the precursor surfactant wasindicated. Fig. 14a shows the Nyquist plot for cells impregnatedwith HC, HC-S1, and HC-S2 (i.e. ca. 11–12 wt.% GDC), and Fig. 14bshows the corresponding ADIS plots with HC taken as reference.Also in this case, the difference between the spectra was in the lowfrequency range with a characteristic frequency of around 30 Hz.The best performance was observed with the precursor HC-S2, whichalso was observed to form GDC with minimum meso porosity (cf.Table 3). However, the changes in the spectra are minor and withinthe 10% uncertainty.
The conductivity of the impregnated GDC phase was evaluated bymeasurements on infiltrated model backbones consisting of only YSZ(to avoid the highly electronic conducting LSM phase). This was doneby measuring the impedance of the porous YSZ before and after infil-tration with GDC, and the difference in conductivity between the YSZand the infiltrated YSZ is ascribed to the infiltrated GDC phase. Thismodel system will most likely provide an underestimation of thecontribution of the GDC phase, since the porosity of the YSZ is a bithigher than for the LSM–YSZ (27±1% versus 16±1%), and due to
28 T. Klemensø et al. / Solid State Ionics 224 (2012) 21–31
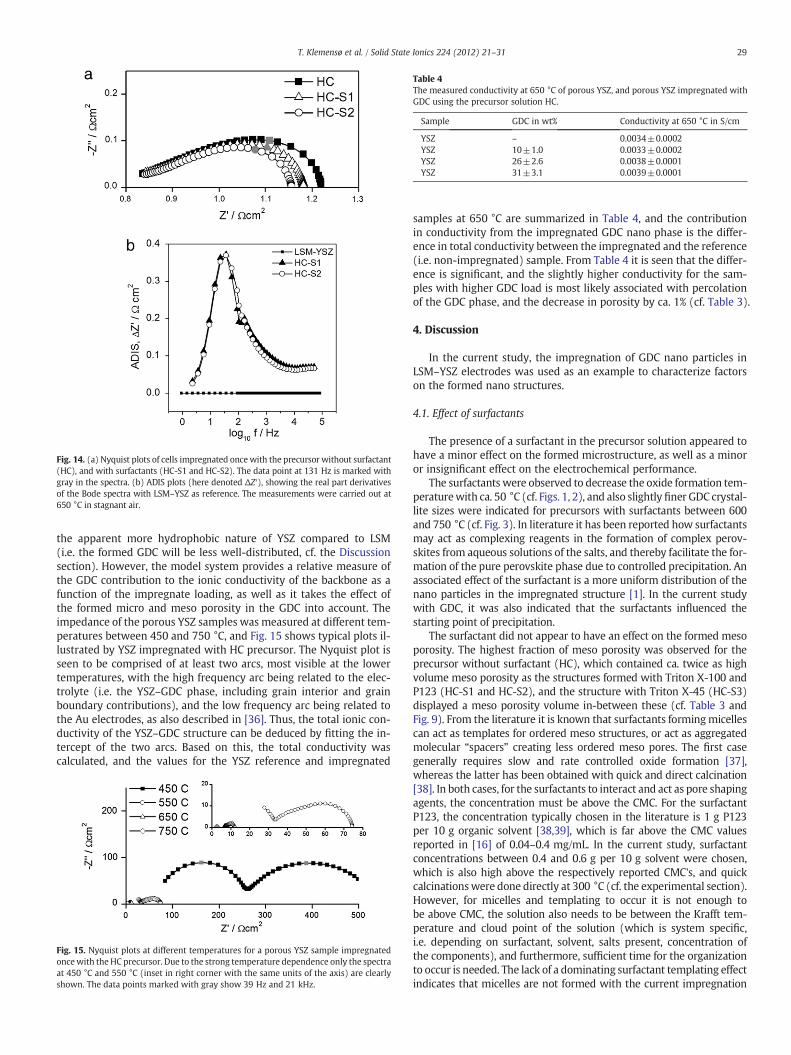
the apparent more hydrophobic nature of YSZ compared to LSM(i.e. the formed GDC will be less well-distributed, cf. the Discussionsection). However, the model system provides a relative measure ofthe GDC contribution to the ionic conductivity of the backbone as afunction of the impregnate loading, as well as it takes the effect ofthe formed micro and meso porosity in the GDC into account. Theimpedance of the porous YSZ samples was measured at different tem-peratures between 450 and 750 °C, and Fig. 15 shows typical plots il-lustrated by YSZ impregnated with HC precursor. The Nyquist plot isseen to be comprised of at least two arcs, most visible at the lowertemperatures, with the high frequency arc being related to the elec-trolyte (i.e. the YSZ–GDC phase, including grain interior and grainboundary contributions), and the low frequency arc being related tothe Au electrodes, as also described in [36]. Thus, the total ionic con-ductivity of the YSZ–GDC structure can be deduced by fitting the in-tercept of the two arcs. Based on this, the total conductivity wascalculated, and the values for the YSZ reference and impregnated
samples at 650 °C are summarized in Table 4, and the contributionin conductivity from the impregnated GDC nano phase is the differ-ence in total conductivity between the impregnated and the reference(i.e. non-impregnated) sample. From Table 4 it is seen that the differ-ence is significant, and the slightly higher conductivity for the sam-ples with higher GDC load is most likely associated with percolationof the GDC phase, and the decrease in porosity by ca. 1% (cf. Table 3).
4. Discussion
In the current study, the impregnation of GDC nano particles inLSM–YSZ electrodes was used as an example to characterize factorson the formed nano structures.
4.1. Effect of surfactants
The presence of a surfactant in the precursor solution appeared tohave a minor effect on the formed microstructure, as well as a minoror insignificant effect on the electrochemical performance.
The surfactants were observed to decrease the oxide formation tem-peraturewith ca. 50 °C (cf. Figs. 1, 2), and also slightly finer GDC crystal-lite sizes were indicated for precursors with surfactants between 600and 750 °C (cf. Fig. 3). In literature it has been reported how surfactantsmay act as complexing reagents in the formation of complex perov-skites from aqueous solutions of the salts, and thereby facilitate the for-mation of the pure perovskite phase due to controlled precipitation. Anassociated effect of the surfactant is a more uniform distribution of thenano particles in the impregnated structure [1]. In the current studywith GDC, it was also indicated that the surfactants influenced thestarting point of precipitation.
The surfactant did not appear to have an effect on the formed mesoporosity. The highest fraction of meso porosity was observed for theprecursor without surfactant (HC), which contained ca. twice as highvolume meso porosity as the structures formed with Triton X-100 andP123 (HC-S1 and HC-S2), and the structure with Triton X-45 (HC-S3)displayed a meso porosity volume in-between these (cf. Table 3 andFig. 9). From the literature it is known that surfactants formingmicellescan act as templates for ordered meso structures, or act as aggregatedmolecular “spacers” creating less ordered meso pores. The first casegenerally requires slow and rate controlled oxide formation [37],whereas the latter has been obtained with quick and direct calcination[38]. In both cases, for the surfactants to interact and act as pore shapingagents, the concentration must be above the CMC. For the surfactantP123, the concentration typically chosen in the literature is 1 g P123per 10 g organic solvent [38,39], which is far above the CMC valuesreported in [16] of 0.04–0.4 mg/mL. In the current study, surfactantconcentrations between 0.4 and 0.6 g per 10 g solvent were chosen,which is also high above the respectively reported CMC's, and quickcalcinationswere done directly at 300 °C (cf. the experimental section).However, for micelles and templating to occur it is not enough tobe above CMC, the solution also needs to be between the Krafft tem-perature and cloud point of the solution (which is system specific,i.e. depending on surfactant, solvent, salts present, concentration ofthe components), and furthermore, sufficient time for the organizationto occur is needed. The lack of a dominating surfactant templating effectindicates that micelles are not formed with the current impregnation
Fig. 14. (a) Nyquist plots of cells impregnated oncewith the precursor without surfactant(HC), and with surfactants (HC-S1 and HC-S2). The data point at 131 Hz is marked withgray in the spectra. (b) ADIS plots (here denoted ΔZ′), showing the real part derivativesof the Bode spectra with LSM–YSZ as reference. The measurements were carried out at650 °C in stagnant air.
Fig. 15. Nyquist plots at different temperatures for a porous YSZ sample impregnatedoncewith the HC precursor. Due to the strong temperature dependence only the spectraat 450 °C and 550 °C (inset in right corner with the same units of the axis) are clearlyshown. The data points marked with gray show 39 Hz and 21 kHz.
Table 4The measured conductivity at 650 °C of porous YSZ, and porous YSZ impregnated withGDC using the precursor solution HC.
Sample GDC in wt% Conductivity at 650 °C in S/cm
YSZ – 0.0034±0.0002YSZ 10±1.0 0.0033±0.0002YSZ 26±2.6 0.0038±0.0001YSZ 31±3.1 0.0039±0.0001
29T. Klemensø et al. / Solid State Ionics 224 (2012) 21–31
protocol, and points to the main function of the surfactant being im-proved wetting of the solution on the backbone.
An important feature in the impregnated nano structures is thedistribution uniformity of the nano particles. The wetting and theuniformity have been correlated for various systems [1,37] and refer-ences in these. The suggested improved wetting obtained with sur-factants, matches with the observed slightly smaller GDC crystallitesin the cases with surfactant (cf. Fig. 3). The quick calcination, donedirectly at 300 °C, is also likely to contribute to the uniformity. Fromheterogeneous catalyst preparation, it is known that quick dryingrates minimize capillary flow of the impregnated precursor [40], andZhao et al. [20] reported how faster calcination rates promoted the nu-cleation and produced finer and a well-connected impregnated phase.To fully verify the hypothesis of the surfactant effect in the currentstudy, contact angle measurements or experiments with slower calci-nation rates could also be carried out, but has not been included inthis study.
From the electrochemical characterization it was indicated that theperformance was slightly affected by the presence of a surfactant inthe precursor (cf. Fig. 14). Slightly better performance in the electro-chemical frequency range (10–100 Hz) was obtained with HC-S2 pre-cursor, and this effect could be related to a more uniform distribution,and also correlate to a lower amount ofmeso porosity (cf. Table 3). Theobserved trend cannot be a reflection of differences in the GDC load asthe load was similar (10–13 wt.%) and with the lowest load for HC-S2(cf. Table 3).
4.2. Effect of GDC load
The electrochemical characterization displayed a clear correlationbetween performance and impregnatedGDC load (cf. Fig. 13). The intro-duction of GDC nano particles was associated with an increase in thetotal electrode surface area, which went from ca. 3 up to ca. 35 m2/gLSM–YSZ backbone (cf. Fig. 4). However, the formed surface area didnot appear correlated to theGDC load. For the low concentration precur-sor (LC), the formed GDC surface area decreased until the GDC load wassimilar to the HC samples, and for HC samples the formed GDC surfacewas almost constant irrespective of the GDC load (cf. Fig. 5). Accordingto the micrographs in Fig. 11, the GDC forms agglomerates that arecoating the backbone rather than well-dispersed nano particles, andthe surface area measurements indicate that a coating-like layer isobtained at around 10 wt.% infiltrated GDC. Once a coat can be formed,any additional GDC nano particles introduced will pack within and ontop of the layer, thereby decreasing the inter-particular meso porosity,and forming a multi-layer like coat that displays a similar surface area.The interpretation can be supported by themeasured pore size distribu-tions, where the meso porosity was seen to disappear with increasingGDC load (cf. Fig. 8). Furthermore, it was observed that the porosity de-creased (cf. Table 3), and the pores with pore diameter b300 nm wereclogging up (cf. Fig. 8) with the increasing GDC load.
Whereas the higher GDC load and better performance cannot becorrelated to the specific surface area, they appear correlated to thedensity of the GDC layer (cf. Table 3) and was indicated to be correlat-ed with the connectivity/percolation of the GDC layer (cf. Table 4).The observations indicate that the main function of the GDC is to ex-tend the TPB zone by acting as an additional ionic network on top ofthe LSM surface and at the LSM–YSZ interface.
Upon annealing at 750 °C the surface area was seen to decreaseand almost reverse to the original surface area of the backbone(cf. Fig. 6). The annealing was associated with limited GDC crystallitegrowth and performance loss, and also the performance loss waslimited. The apparent stability of the GDC nano particles is ascribedto the self limiting growth of doped ceria, and only agglomerationof the GDC particles therefore occurs (reducing the surface area, andcreating more uniform pore size distribution, cf. Fig. 10). The limitedsensitivity of the performance to agglomeration can be explained bythe agglomeration occurring without affecting the ionic conductivityand the network extension of the GDC phase significantly.
4.3. The functionality of impregnated GDC
In the current study, the main electrochemical response upon GDCinfiltration was seen around a frequency of 30 Hz, which fitted wellwith the characteristic frequency of LSM-based cathodes reportedpreviously, and which indicated that it is mainly the electrochemicalreaction taking place at or close to the TPB (i.e. transfer of species atthe TPB), which is improved with the infiltration of GDC.
A change in the high frequency response was also observed, andreflected as a change in the shape of the high frequency part of thespectra upon infiltration with GDC. Using classical PET, the changein shape could be explained and related to the infiltrated GDC placedat the TPB shunting the high frequency LSM–YSZ interfacial imped-ance response.
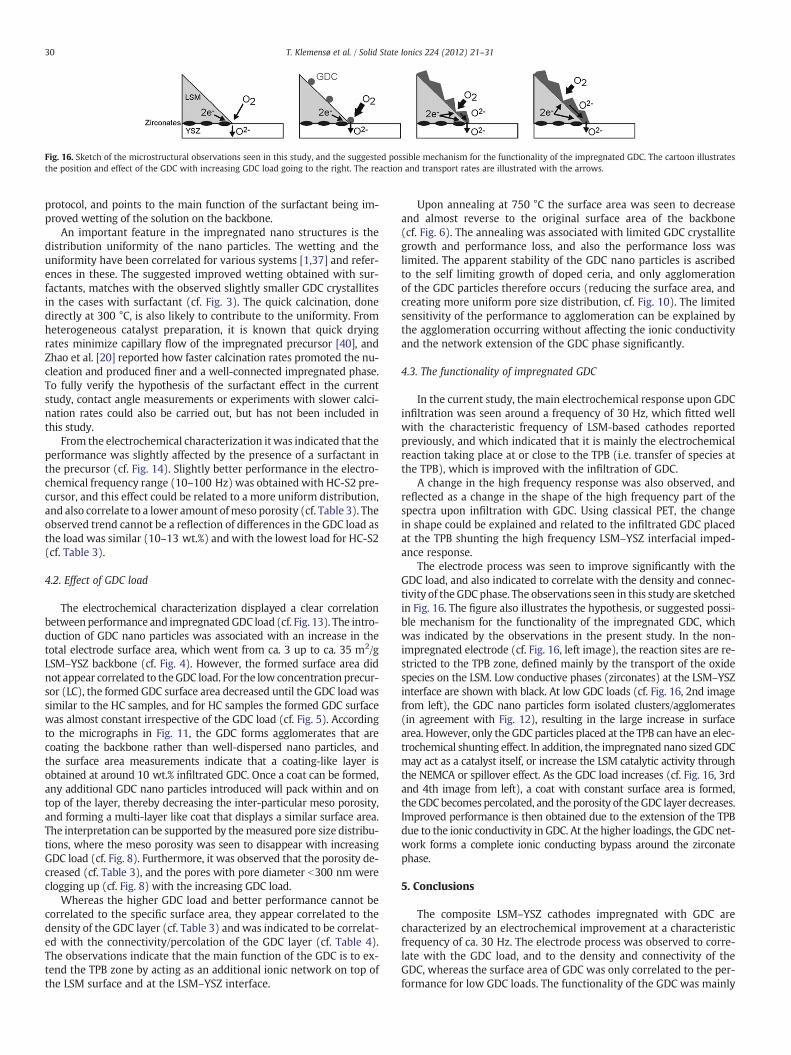
The electrode process was seen to improve significantly with theGDC load, and also indicated to correlate with the density and connec-tivity of the GDC phase. The observations seen in this study are sketchedin Fig. 16. The figure also illustrates the hypothesis, or suggested possi-ble mechanism for the functionality of the impregnated GDC, whichwas indicated by the observations in the present study. In the non-impregnated electrode (cf. Fig. 16, left image), the reaction sites are re-stricted to the TPB zone, defined mainly by the transport of the oxidespecies on the LSM. Low conductive phases (zirconates) at the LSM–YSZinterface are shown with black. At low GDC loads (cf. Fig. 16, 2nd imagefrom left), the GDC nano particles form isolated clusters/agglomerates(in agreement with Fig. 12), resulting in the large increase in surfacearea. However, only the GDC particles placed at the TPB can have an elec-trochemical shunting effect. In addition, the impregnated nano sized GDCmay act as a catalyst itself, or increase the LSM catalytic activity throughthe NEMCA or spillover effect. As the GDC load increases (cf. Fig. 16, 3rdand 4th image from left), a coat with constant surface area is formed,theGDCbecomes percolated, and the porosity of theGDC layer decreases.Improved performance is then obtained due to the extension of the TPBdue to the ionic conductivity in GDC. At the higher loadings, the GDC net-work forms a complete ionic conducting bypass around the zirconatephase.
5. Conclusions
The composite LSM–YSZ cathodes impregnated with GDC arecharacterized by an electrochemical improvement at a characteristicfrequency of ca. 30 Hz. The electrode process was observed to corre-late with the GDC load, and to the density and connectivity of theGDC, whereas the surface area of GDC was only correlated to the per-formance for low GDC loads. The functionality of the GDC was mainly
Fig. 16. Sketch of the microstructural observations seen in this study, and the suggested possible mechanism for the functionality of the impregnated GDC. The cartoon illustratesthe position and effect of the GDC with increasing GDC load going to the right. The reaction and transport rates are illustrated with the arrows.
30 T. Klemensø et al. / Solid State Ionics 224 (2012) 21–31

related to an extension of the TPB, created by the ionic conductingGDC network on top of the LSM particles and zirconate phases. Theinvestigations show that tailoring of the impregnated structure is animportant parameter, if the full potential of impregnated electrodesis to be obtained.
Acknowledgments
This work was supported financially by the Department of EnergyConversion and Storage, Technical University of Denmark. Part ofthis work was further supported by Topsoe Fuel Cell A/S and theDanish National Advanced Technology Foundation. The authors aregrateful to Dr. Carsten Blum and Helmut Gronegger at Quantachrome,Germany, for performing the Kr adsorption measurements at 87.27 K.The authors also thank the technical staff at the Department of EnergyConversion and Storage for technical support in sample fabricationand characterization.
References
[1] Z. Jiang, C. Xia, F. Chen, Electrochim. Acta 55 (2010) 3595–3605.[2] S.P. Jiang, Int. J. Hydrogen Energy 37 (2012) 449–470.[3] S.P. Jiang, Y.J. Leng, S.H. Chan, K.A. Khor, Electrochem. Solid-State Lett. 6 (2003)
A67–A70.[4] S.P. Jiang, W. Wang, J. Electrochem. Soc. 152 (2005) A1398–A1408.[5] Z. Liu, D. Ding, B. Liu, W. Guo, W. Wang, C. Xia, J. Power. Sources 196 (2011)
8561–8567.[6] M. Mogensen, M. Søgaard, P. Blennow, K.K. Hansen, In: Lucerne Fuel Cell Forum,
Switzerland, 2008, p. A0402, paper.[7] F. Bidrawn, G. Kim, N. Aramrueang, J.M. Vohs, R.J. Gorte, J. Power. Sources 195 (2010)
720–728.[8] C. Knöfel, H.-J. Wang, K.T.S. Thydén, M. Mogensen, Solid State Ionics 195 (2011)
36–42.[9] M. Backhaus-Ricoult, K. Adib, T. St.Clair, B. Luerssen, L. Gregoratti, A. Barinov,
Solid State Ionics 179 (2008) 891–895.[10] A. Babaei, S.P. Jiang, J. Li, J. Electrochem. Soc. 156 (2009) B1022–B1029.[11] K. Streletzky, G.D.J. Phillies, Langmuir 11 (1995) 42–47.[12] E. Gonick, J.W. McBain, J. Am. Ceram. Soc. 69 (1947) 334–336.[13] Z.Wang, J.-H. Xu,W. Zhang, B. Zhuang, H. Qi, Colloids Surf. B Biointerfaces 61 (2008)
118–122.
[14] R.W. Egan, M.A. Jones, A.L. Lehninger, J. Biol. Chem. 251 (1976) 4442–4447.[15] S.K. Hait, S.P. Moulik, J. Surfactants Deterg. 4 (2001) 303–309.[16] Y.-L. Su, H.-Z. Liu, Korean J. Chem. Eng. 20 (2003) 343–346.[17] J. Jansson, K. Schillén, G. Olofsson, R. Cardoso da Silva, W. Loh, J. Phys. Chem. B 108
(2004) 82–92.[18] T. Klemensø, K. Thydén, M. Chen, H.-J. Wang, J. Power. Sources 195 (2010)
7295–7301.[19] M. Thommes, Quantachrome Instruments Powder Tech Note 39, February 2006.[20] F. Zhao, Z. Wang, M. Liu, L. Zhang, C. Xia, F. Chen, J. Power. Sources 185 (2008)
13–18.[21] J.L.M. Rupp, A. Infortuna, L.J. Gauckler, Acta Mater. 54 (2006) 1721–1730.[22] A. Mitterdorfer, L.J. Gauckler, Solid State Ionics 111 (1998) 185–218.[23] C. Chatzichristodoulou, M. Chen, J.R. Bowen, L. Yi-Lin, J. Am. Ceram. Soc. 93 (2010)
2884–2890.[24] X.D. Zhou, B. Scarfino, H.U. Anderson, Solid State Ionics 175 (2004) 19–22.[25] S. Lee, N. Miller, H. Abernathy, K. Gerdes, A. Manivannan, J. Electrochem. Soc. 158
(2011) B735–B742.[26] S.H. Jensen, A. Hauch, P.V. Hendriksen, M. Mogensen, N. Bonanos, T. Jacobsen,
J. Electrochem. Soc. 154 (2007) B1325–B1330.[27] M.J. Jørgensen, M. Mogensen, J. Electrochem. Soc. 148 (2001) A433–A442.[28] S.P. Jiang, J. Mater. Sci. 43 (2008) 6799–6833.[29] S.B. Adler, Chem. Rev. 104 (2004) 4791–4843.[30] R. Barfod,M.Mogensen, T. Klemensø, A. Hagen, Y.L. Liu, P.V. Hendriksen, J. Electrochem.
Soc. 154 (2007) B371–B378.[31] J. Nielsen, T. Jacobsen, M. Wandel, Electrochim. Acta 56 (2011) 7963–7974.[32] N. Bonanos, P. Holtapples, M.J. Jørgensen, In: Lucerne Fuel Cell Forum, Switzerland,
2002, pp. 578–585.[33] In: N. Bonanos, B.C.H. Steele, E.P. Butler, E. Barsoukov, J.R. McDonald (Eds.), Im-
pedance Spectroscopy—Theory, Experiment, and Application, John Wiley & SonsInc., Hoboken, NJ, 2005, pp. 258–263.
[34] In: A. Lasia, M. Schlesinger (Eds.), Modern Aspects of Electrochemistry, vol. 43,Springer, 2009, pp. 67–138.
[35] V. Sonn, A. Leonide, E. Ivers-Tiffée, J. Electrochem. Soc. 155 (2008) B675–B679.[36] V. Singh, S. Babu, A.S. Karakoti, A. Agarwal, S. Seal, J. Nanosci. Nanotechnol. 10
(2010) 1–9.[37] R. Chao, J.R. Kitchin, K. Gerdes, E.M. Sabolsky, P.A. Salvador, ECS Trans. 35 (2011)
2387–2399.[38] M. Lundberg, B. Skårman, F. Cesar, L.R. Wallenberg, Microporous Mesoporous
Mater. 54 (2002) 97–103.[39] P. Yang, D. Zhao, D.I. Margolese, B.F. Chmelka, G.D. Stucky, Nature 396 (1998)
152–155.[40] A.V. Nelmark, L.I. Kheifez, V.B. Fenelonov, Ind. Eng. Chem. Prod. Res. Dev. 20 (1981)
439–450.
31T. Klemensø et al. / Solid State Ionics 224 (2012) 21–31