Embed Size (px)
Citation preview
End-of-test Performance and Wear Characterization of NASA’s Evolutionary Xenon Thruster (NEXT) Long-Duration Test
Rohit Shastry, Daniel A. Herman, George C. Soulas, Michael J. Patterson
National Aeronautics and Space Administration
www.nasa.gov
Presented at the 50th AIAA/ASME/SAE/ASEE Joint Propulsion Conference
July 29, 2014
NASA Glenn Research Center, Cleveland, OH 44135, USA
National Aeronautics and Space Administration
Presentation Outline • Overview and Status Update • Diagnostics Repair Summary • Ion Current Density Profiles • Component Performance and Wear
• Discharge Chamber/Cathode • Neutralizer Cathode • Ion Optics Assembly
• Characterization of Facility Effects • Measured Facility Backsputter Rates • Prediction of Accelerator Grid Current at Zero Pressure
• Summary
End-of-test Performance and Wear Characterization of NASA’s Evolutionary Xenon Thruster (NEXT) Long-Duration Test 2
National Aeronautics and Space Administration
NASA’s Evolutionary Xenon Thruster • The NEXT project advances the capability of ion propulsion systems,
offering mission enhancement with broad mission applicability
• NEXT provides a significant advancement beyond the state-of-the-art NSTAR system
• Higher power, higher thrust, higher specific impulse
• Wider throttling range, higher thruster service life capability
• Evolutionary design allows us to take advantage of over 58,000 hours of NSTAR operating time and lessons learned • Addresses NSTAR issues and failure modes
End-of-test Performance and Wear Characterization of NASA’s Evolutionary Xenon Thruster (NEXT) Long-Duration Test 3
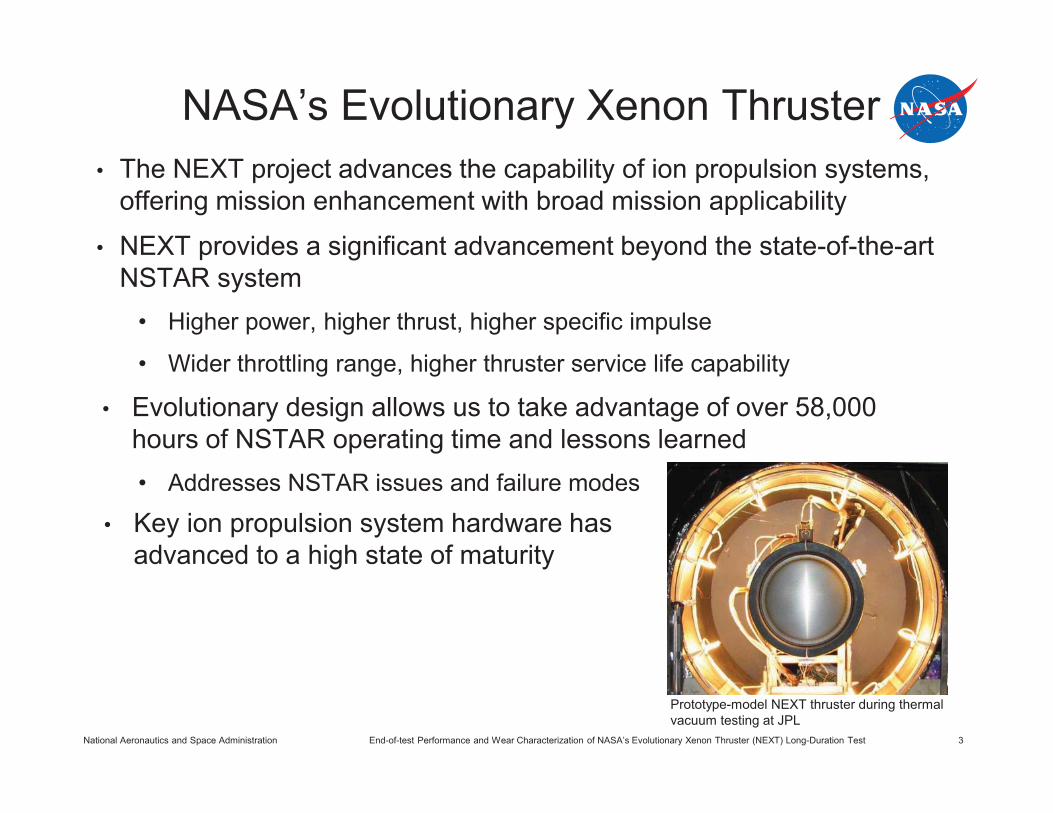
• Key ion propulsion system hardware has advanced to a high state of maturity
Prototype-model NEXT thruster during thermal vacuum testing at JPL
National Aeronautics and Space Administration
Purpose of the NEXT Long-Duration Test (LDT) • Initiated as part of a comprehensive thruster service life assessment,
utilizing both testing and modeling analyses, comprised of: • NEXT 2,000 h EM thruster wear test
• NEXT thruster service life model development
• NEXT PM1R thruster and propellant management system wear test
• NEXT LDT
• Goals of the NEXT LDT • Qualify the NEXT thruster propellant throughput capability to an initial value of 450 kg
• Validate the thruster service life models
• Characterize thruster performance over test duration
• Measure critical thruster component erosion rates
• Identify unknown life-limiting mechanisms
• Objective to demonstrate 450 kg throughput redefined after completion in December 2009 to test-to-failure of thruster or voluntary test termination
End-of-test Performance and Wear Characterization of NASA’s Evolutionary Xenon Thruster (NEXT) Long-Duration Test 4
National Aeronautics and Space Administration
NEXT LDT Throttling Profile Throttle
Segment Operating Condition
(JB, VB) Input Power,
kW Segment
Duration, kh End of Segment
Date
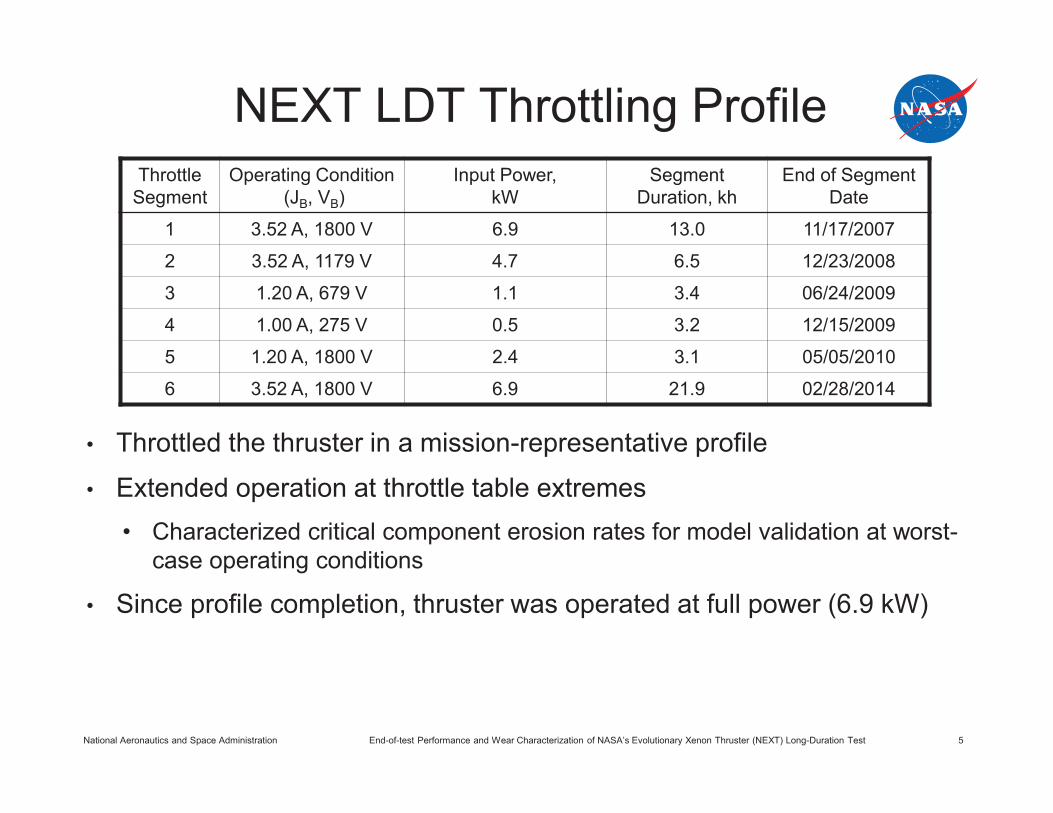
1 3.52 A, 1800 V 6.9 13.0 11/17/2007
2 3.52 A, 1179 V 4.7 6.5 12/23/2008
3 1.20 A, 679 V 1.1 3.4 06/24/2009
4 1.00 A, 275 V 0.5 3.2 12/15/2009
5 1.20 A, 1800 V 2.4 3.1 05/05/2010
6 3.52 A, 1800 V 6.9 21.9 02/28/2014
End-of-test Performance and Wear Characterization of NASA’s Evolutionary Xenon Thruster (NEXT) Long-Duration Test 5
• Throttled the thruster in a mission-representative profile
• Extended operation at throttle table extremes • Characterized critical component erosion rates for model validation at worst-
case operating conditions
• Since profile completion, thruster was operated at full power (6.9 kW)
National Aeronautics and Space Administration End-of-test Performance and Wear Characterization of NASA’s Evolutionary Xenon Thruster (NEXT) Long-Duration Test 6
NEXT LDT Status Update • Decision was made in April 2013 to voluntarily terminate the NEXT LDT
• A comprehensive post-test performance characterization was completed across the entire NEXT throttle table (40 conditions)
• The main facility was vented to atmosphere in order to repair diagnostics that had failed over the course of the test • Thruster was retracted into a separate port, isolated and kept under hard vacuum
during repair process
• Using full suite of diagnostics, a comprehensive end-of-test performance characterization was completed across the entire NEXT throttle table • These data are the subject of this presentation
• Thruster was vented to atmosphere in April 2014 and post-test inspection is underway
• At the end of the test, the NEXT LDT: • accumulated 51,184 hour of high-voltage operation
• processed 918 kg of xenon
• delivered 35.5 MN-s of total impulse
National Aeronautics and Space Administration
Diagnostics Repair Summary
End-of-test Performance and Wear Characterization of NASA’s Evolutionary Xenon Thruster (NEXT) Long-Duration Test 7
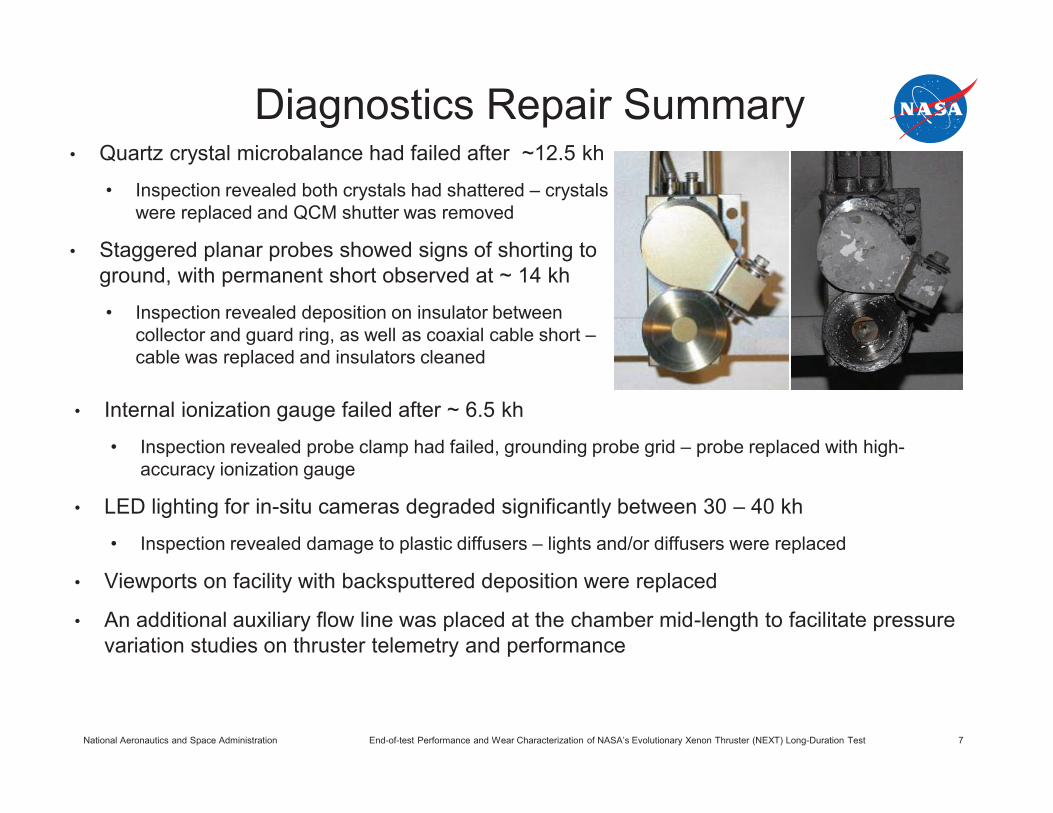
• Quartz crystal microbalance had failed after ~12.5 kh
• Inspection revealed both crystals had shattered – crystals were replaced and QCM shutter was removed
• Staggered planar probes showed signs of shorting to ground, with permanent short observed at ~ 14 kh
• Inspection revealed deposition on insulator between collector and guard ring, as well as coaxial cable short – cable was replaced and insulators cleaned
• Internal ionization gauge failed after ~ 6.5 kh
• Inspection revealed probe clamp had failed, grounding probe grid – probe replaced with high-accuracy ionization gauge
• LED lighting for in-situ cameras degraded significantly between 30 – 40 kh
• Inspection revealed damage to plastic diffusers – lights and/or diffusers were replaced
• Viewports on facility with backsputtered deposition were replaced
• An additional auxiliary flow line was placed at the chamber mid-length to facilitate pressure variation studies on thruster telemetry and performance
National Aeronautics and Space Administration End-of-test Performance and Wear Characterization of NASA’s Evolutionary Xenon Thruster (NEXT) Long-Duration Test 8
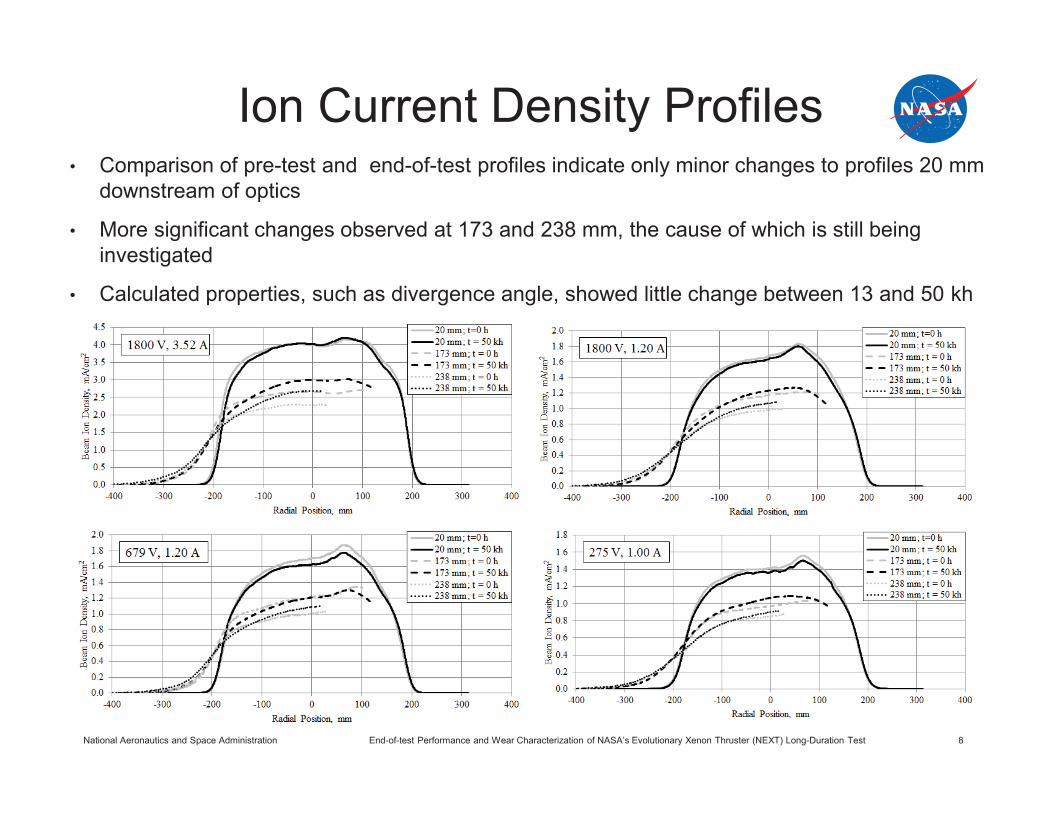
Ion Current Density Profiles • Comparison of pre-test and end-of-test profiles indicate only minor changes to profiles 20 mm
downstream of optics
• More significant changes observed at 173 and 238 mm, the cause of which is still being investigated
• Calculated properties, such as divergence angle, showed little change between 13 and 50 kh
National Aeronautics and Space Administration End-of-test Performance and Wear Characterization of NASA’s Evolutionary Xenon Thruster (NEXT) Long-Duration Test 9
Discharge Chamber Performance
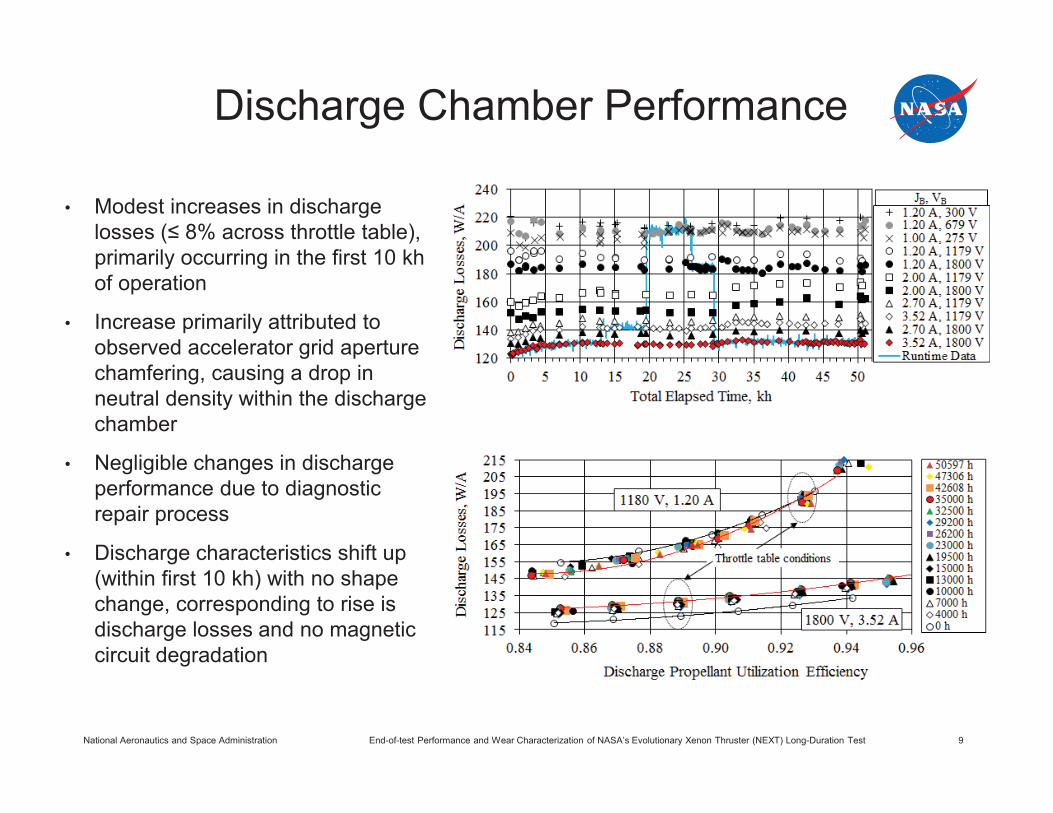
• Modest increases in discharge losses (≤ 8% across throttle table), primarily occurring in the first 10 kh of operation
• Increase primarily attributed to observed accelerator grid aperture chamfering, causing a drop in neutral density within the discharge chamber
• Negligible changes in discharge performance due to diagnostic repair process
• Discharge characteristics shift up (within first 10 kh) with no shape change, corresponding to rise is discharge losses and no magnetic circuit degradation
National Aeronautics and Space Administration End-of-test Performance and Wear Characterization of NASA’s Evolutionary Xenon Thruster (NEXT) Long-Duration Test 10
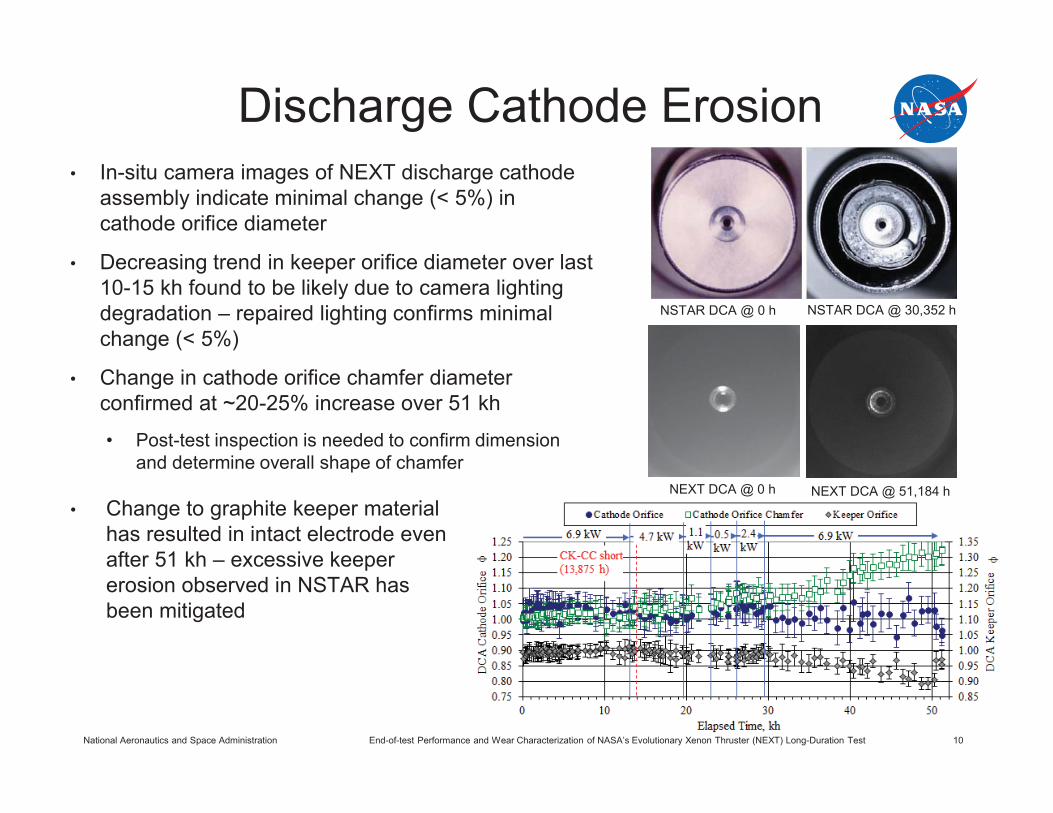
Discharge Cathode Erosion
NEXT DCA @ 0 h NEXT DCA @ 51,184 h
NSTAR DCA @ 0 h NSTAR DCA @ 30,352 h
• In-situ camera images of NEXT discharge cathode assembly indicate minimal change (< 5%) in cathode orifice diameter
• Decreasing trend in keeper orifice diameter over last 10-15 kh found to be likely due to camera lighting degradation – repaired lighting confirms minimal change (< 5%)
• Change in cathode orifice chamfer diameter confirmed at ~20-25% increase over 51 kh
• Post-test inspection is needed to confirm dimension and determine overall shape of chamfer
• Change to graphite keeper material has resulted in intact electrode even after 51 kh – excessive keeper erosion observed in NSTAR has been mitigated
National Aeronautics and Space Administration End-of-test Performance and Wear Characterization of NASA’s Evolutionary Xenon Thruster (NEXT) Long-Duration Test 11
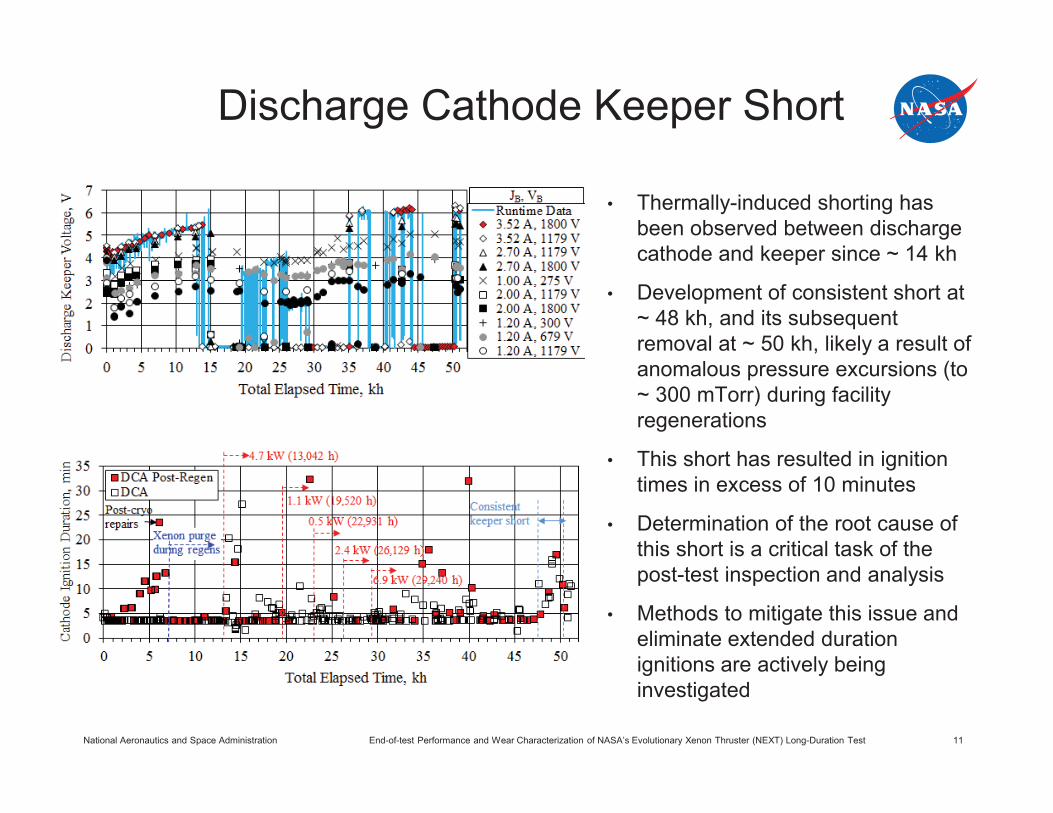
Discharge Cathode Keeper Short
• Thermally-induced shorting has been observed between discharge cathode and keeper since ~ 14 kh
• Development of consistent short at ~ 48 kh, and its subsequent removal at ~ 50 kh, likely a result of anomalous pressure excursions (to ~ 300 mTorr) during facility regenerations
• This short has resulted in ignition times in excess of 10 minutes
• Determination of the root cause of this short is a critical task of the post-test inspection and analysis
• Methods to mitigate this issue and eliminate extended duration ignitions are actively being investigated
National Aeronautics and Space Administration End-of-test Performance and Wear Characterization of NASA’s Evolutionary Xenon Thruster (NEXT) Long-Duration Test 12
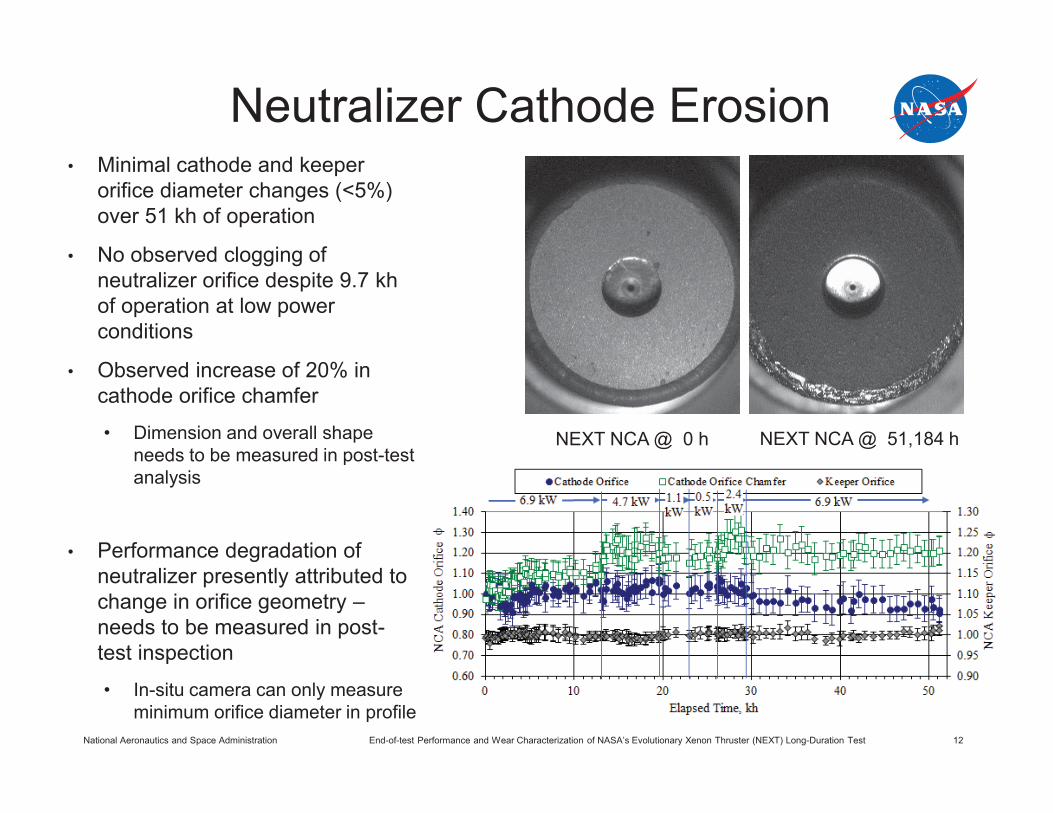
Neutralizer Cathode Erosion
NEXT NCA @ 0 h NEXT NCA @ 51,184 h
• Minimal cathode and keeper orifice diameter changes (<5%) over 51 kh of operation
• No observed clogging of neutralizer orifice despite 9.7 kh of operation at low power conditions
• Observed increase of 20% in cathode orifice chamfer
• Dimension and overall shape needs to be measured in post-test analysis
• Performance degradation of neutralizer presently attributed to change in orifice geometry – needs to be measured in post-test inspection
• In-situ camera can only measure minimum orifice diameter in profile
National Aeronautics and Space Administration End-of-test Performance and Wear Characterization of NASA’s Evolutionary Xenon Thruster (NEXT) Long-Duration Test 13
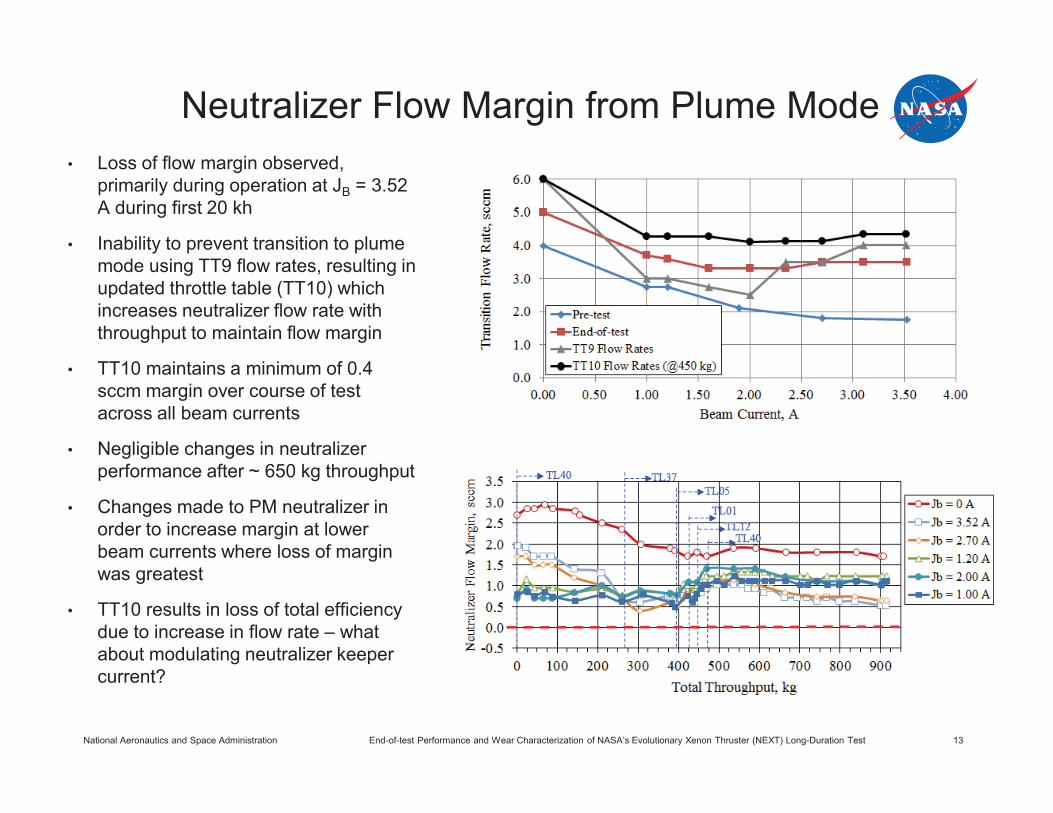
Neutralizer Flow Margin from Plume Mode • Loss of flow margin observed,
primarily during operation at JB = 3.52 A during first 20 kh
• Inability to prevent transition to plume mode using TT9 flow rates, resulting in updated throttle table (TT10) which increases neutralizer flow rate with throughput to maintain flow margin
• TT10 maintains a minimum of 0.4 sccm margin over course of test across all beam currents
• Negligible changes in neutralizer performance after ~ 650 kg throughput
• Changes made to PM neutralizer in order to increase margin at lower beam currents where loss of margin was greatest
• TT10 results in loss of total efficiency due to increase in flow rate – what about modulating neutralizer keeper current?
National Aeronautics and Space Administration End-of-test Performance and Wear Characterization of NASA’s Evolutionary Xenon Thruster (NEXT) Long-Duration Test 14
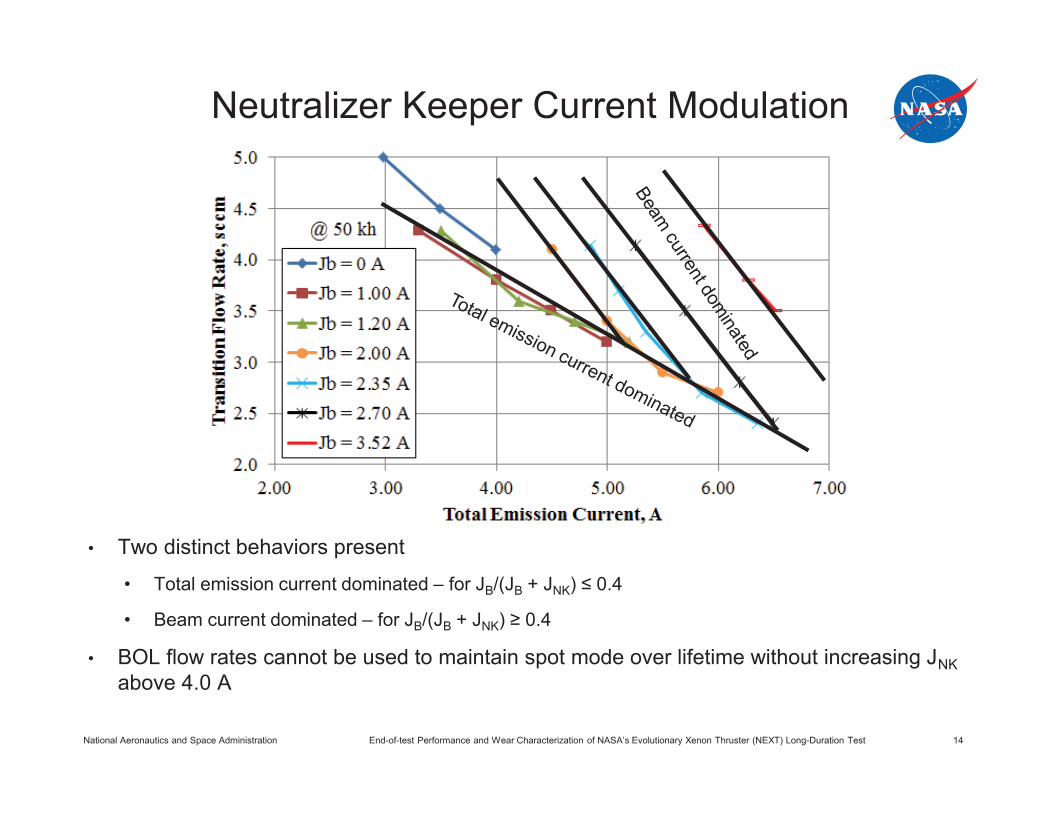
Neutralizer Keeper Current Modulation
• Two distinct behaviors present
• Total emission current dominated – for JB/(JB + JNK) ≤ 0.4
• Beam current dominated – for JB/(JB + JNK) ≥ 0.4
• BOL flow rates cannot be used to maintain spot mode over lifetime without increasing JNK above 4.0 A
National Aeronautics and Space Administration End-of-test Performance and Wear Characterization of NASA’s Evolutionary Xenon Thruster (NEXT) Long-Duration Test 15
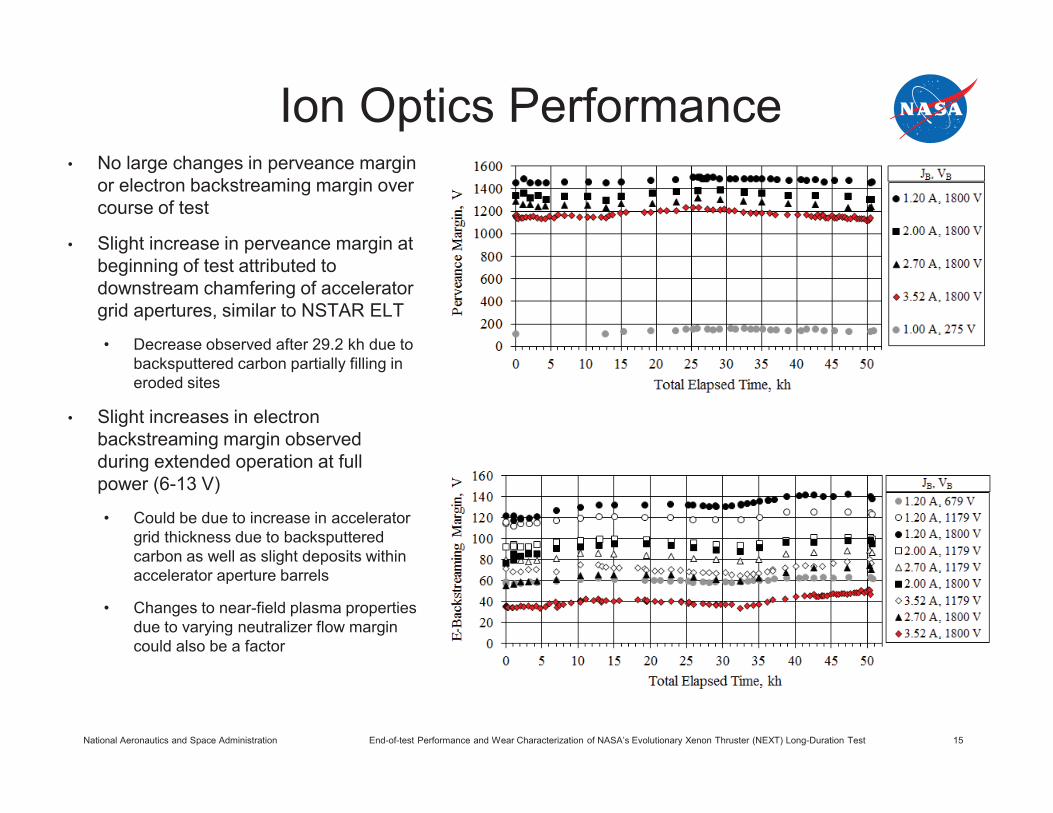
Ion Optics Performance • No large changes in perveance margin
or electron backstreaming margin over course of test
• Slight increase in perveance margin at beginning of test attributed to downstream chamfering of accelerator grid apertures, similar to NSTAR ELT
• Decrease observed after 29.2 kh due to backsputtered carbon partially filling in eroded sites
• Slight increases in electron backstreaming margin observed during extended operation at full power (6-13 V)
• Could be due to increase in accelerator grid thickness due to backsputtered carbon as well as slight deposits within accelerator aperture barrels
• Changes to near-field plasma properties due to varying neutralizer flow margin could also be a factor
National Aeronautics and Space Administration End-of-test Performance and Wear Characterization of NASA’s Evolutionary Xenon Thruster (NEXT) Long-Duration Test 16
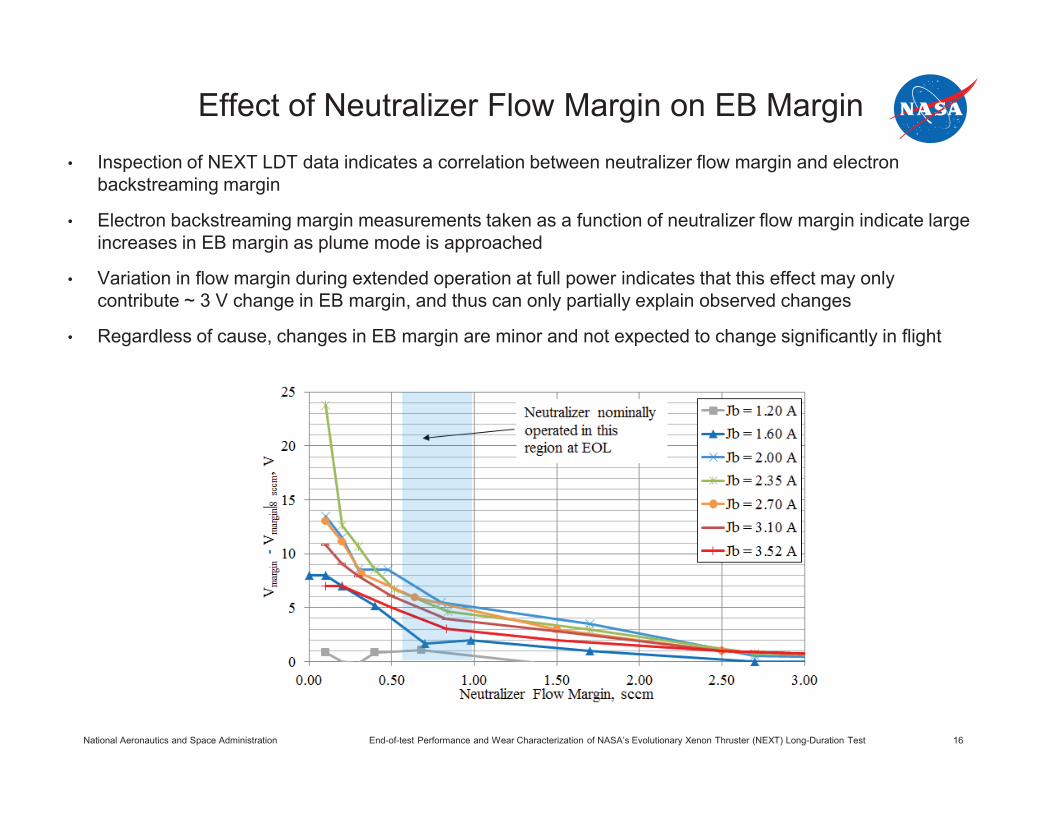
Effect of Neutralizer Flow Margin on EB Margin • Inspection of NEXT LDT data indicates a correlation between neutralizer flow margin and electron
backstreaming margin
• Electron backstreaming margin measurements taken as a function of neutralizer flow margin indicate large increases in EB margin as plume mode is approached
• Variation in flow margin during extended operation at full power indicates that this effect may only contribute ~ 3 V change in EB margin, and thus can only partially explain observed changes
• Regardless of cause, changes in EB margin are minor and not expected to change significantly in flight
National Aeronautics and Space Administration End-of-test Performance and Wear Characterization of NASA’s Evolutionary Xenon Thruster (NEXT) Long-Duration Test 17
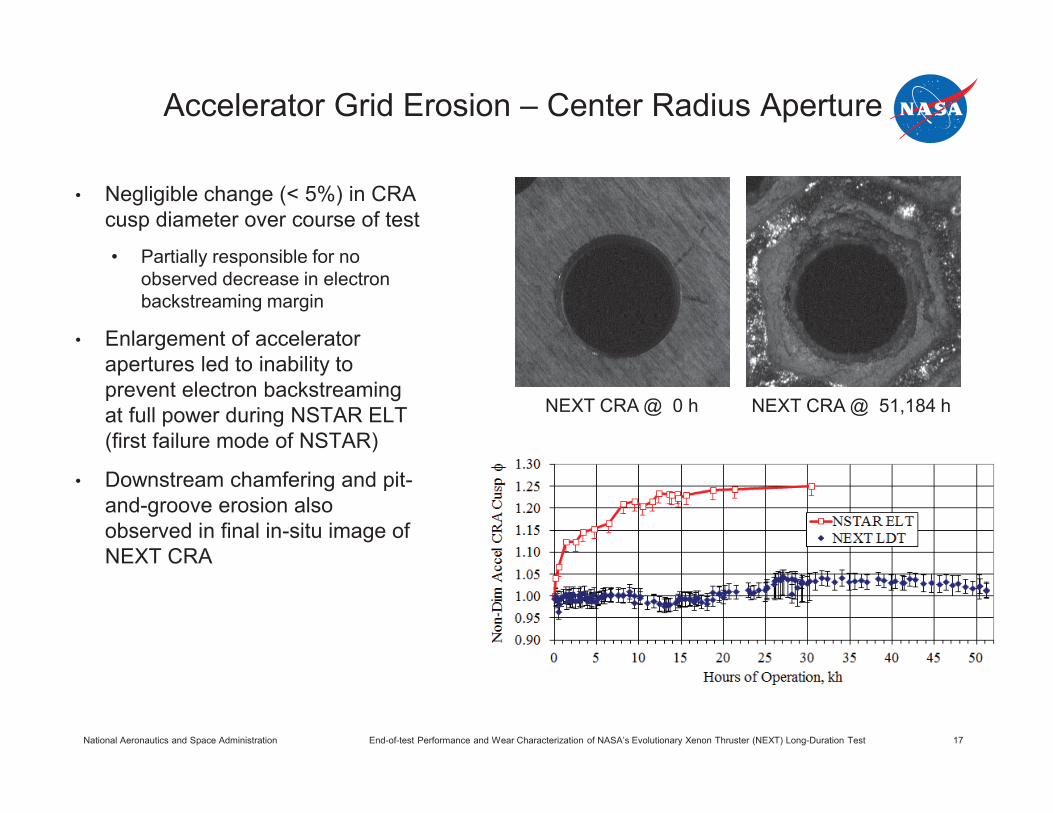
Accelerator Grid Erosion – Center Radius Aperture
NEXT CRA @ 0 h NEXT CRA @ 51,184 h
• Negligible change (< 5%) in CRA cusp diameter over course of test
• Partially responsible for no observed decrease in electron backstreaming margin
• Enlargement of accelerator apertures led to inability to prevent electron backstreaming at full power during NSTAR ELT (first failure mode of NSTAR)
• Downstream chamfering and pit-and-groove erosion also observed in final in-situ image of NEXT CRA
National Aeronautics and Space Administration End-of-test Performance and Wear Characterization of NASA’s Evolutionary Xenon Thruster (NEXT) Long-Duration Test 18
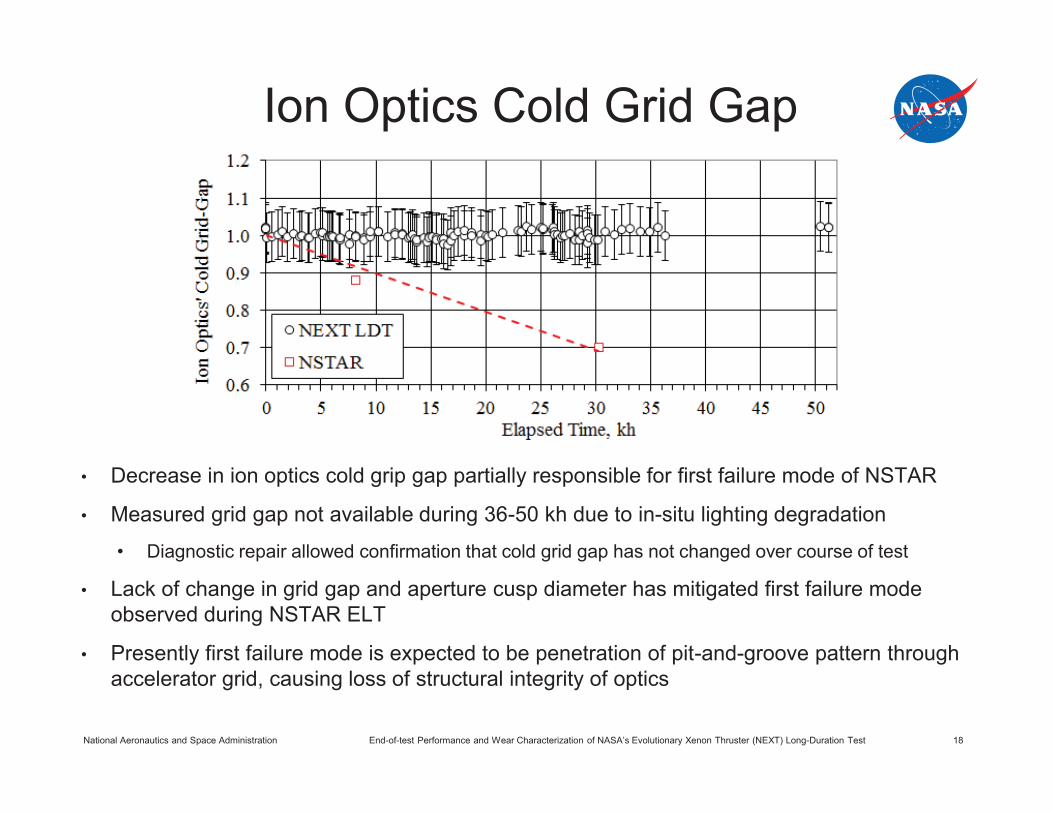
Ion Optics Cold Grid Gap
• Decrease in ion optics cold grip gap partially responsible for first failure mode of NSTAR
• Measured grid gap not available during 36-50 kh due to in-situ lighting degradation
• Diagnostic repair allowed confirmation that cold grid gap has not changed over course of test
• Lack of change in grid gap and aperture cusp diameter has mitigated first failure mode observed during NSTAR ELT
• Presently first failure mode is expected to be penetration of pit-and-groove pattern through accelerator grid, causing loss of structural integrity of optics
National Aeronautics and Space Administration End-of-test Performance and Wear Characterization of NASA’s Evolutionary Xenon Thruster (NEXT) Long-Duration Test 19
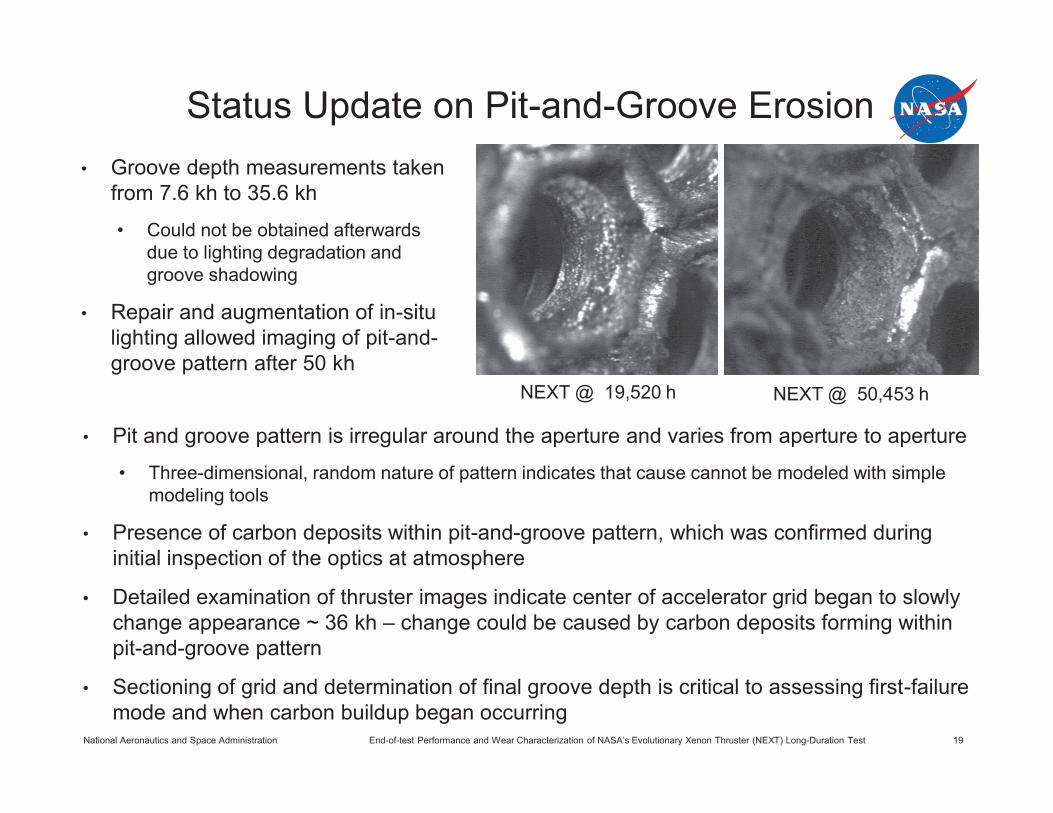
Status Update on Pit-and-Groove Erosion
NEXT @ 19,520 h NEXT @ 50,453 h
• Groove depth measurements taken from 7.6 kh to 35.6 kh
• Could not be obtained afterwards due to lighting degradation and groove shadowing
• Repair and augmentation of in-situ lighting allowed imaging of pit-and-groove pattern after 50 kh
• Pit and groove pattern is irregular around the aperture and varies from aperture to aperture
• Three-dimensional, random nature of pattern indicates that cause cannot be modeled with simple modeling tools
• Presence of carbon deposits within pit-and-groove pattern, which was confirmed during initial inspection of the optics at atmosphere
• Detailed examination of thruster images indicate center of accelerator grid began to slowly change appearance ~ 36 kh – change could be caused by carbon deposits forming within pit-and-groove pattern
• Sectioning of grid and determination of final groove depth is critical to assessing first-failure mode and when carbon buildup began occurring
National Aeronautics and Space Administration End-of-test Performance and Wear Characterization of NASA’s Evolutionary Xenon Thruster (NEXT) Long-Duration Test 20
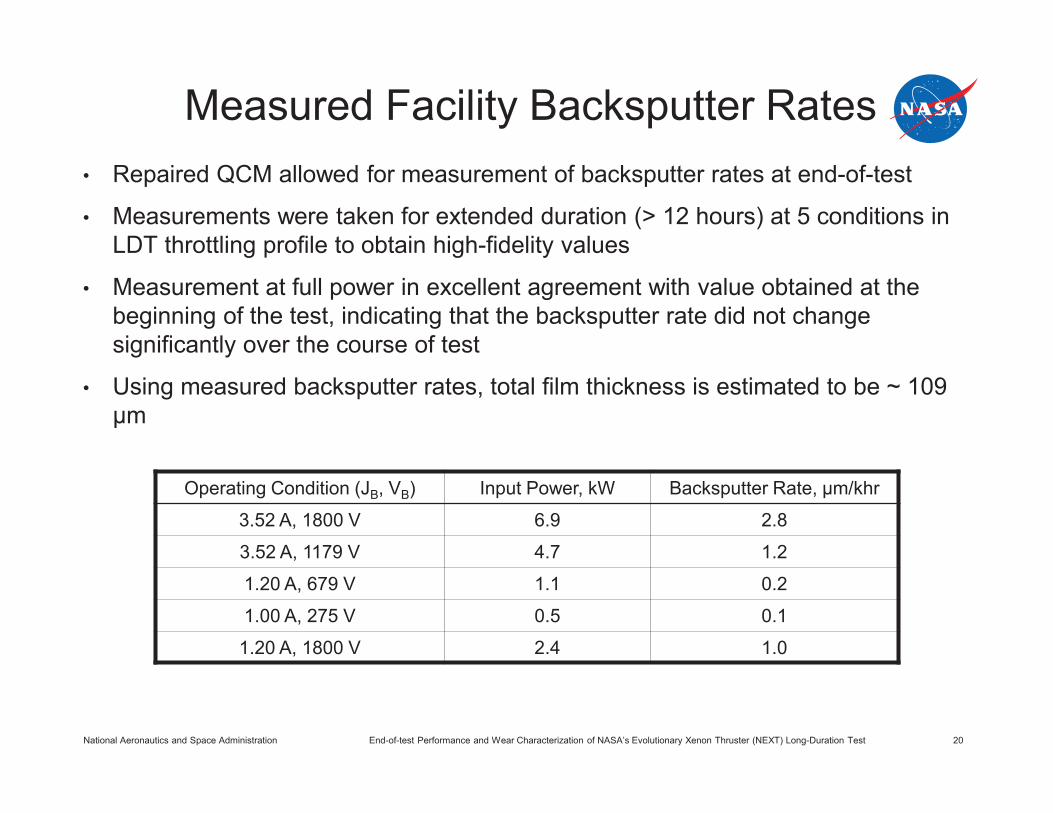
Measured Facility Backsputter Rates
Operating Condition (JB, VB) Input Power, kW Backsputter Rate, μm/khr
3.52 A, 1800 V 6.9 2.8
3.52 A, 1179 V 4.7 1.2
1.20 A, 679 V 1.1 0.2
1.00 A, 275 V 0.5 0.1
1.20 A, 1800 V 2.4 1.0
• Repaired QCM allowed for measurement of backsputter rates at end-of-test
• Measurements were taken for extended duration (> 12 hours) at 5 conditions in LDT throttling profile to obtain high-fidelity values
• Measurement at full power in excellent agreement with value obtained at the beginning of the test, indicating that the backsputter rate did not change significantly over the course of test
• Using measured backsputter rates, total film thickness is estimated to be ~ 109 μm
National Aeronautics and Space Administration End-of-test Performance and Wear Characterization of NASA’s Evolutionary Xenon Thruster (NEXT) Long-Duration Test 21
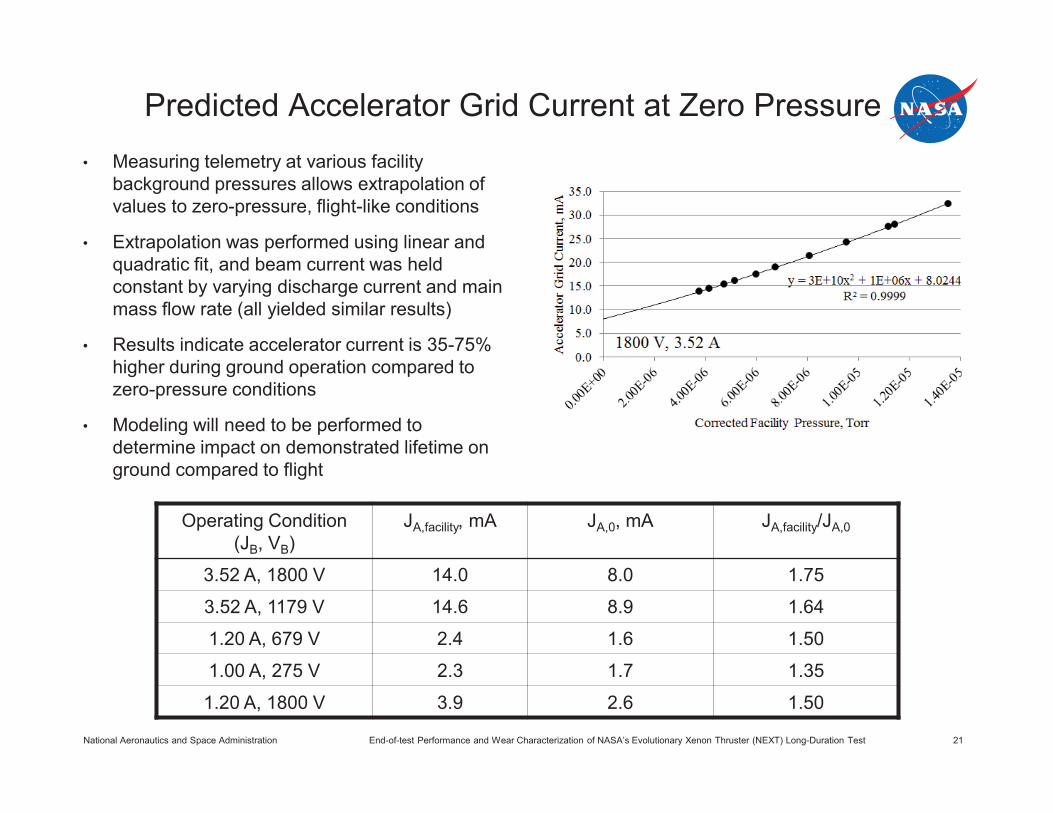
Predicted Accelerator Grid Current at Zero Pressure
Operating Condition (JB, VB)
JA,facility, mA JA,0, mA JA,facility/JA,0
3.52 A, 1800 V 14.0 8.0 1.75
3.52 A, 1179 V 14.6 8.9 1.64
1.20 A, 679 V 2.4 1.6 1.50
1.00 A, 275 V 2.3 1.7 1.35
1.20 A, 1800 V 3.9 2.6 1.50
• Measuring telemetry at various facility background pressures allows extrapolation of values to zero-pressure, flight-like conditions
• Extrapolation was performed using linear and quadratic fit, and beam current was held constant by varying discharge current and main mass flow rate (all yielded similar results)
• Results indicate accelerator current is 35-75% higher during ground operation compared to zero-pressure conditions
• Modeling will need to be performed to determine impact on demonstrated lifetime on ground compared to flight
National Aeronautics and Space Administration End-of-test Performance and Wear Characterization of NASA’s Evolutionary Xenon Thruster (NEXT) Long-Duration Test 22
Summary • The NEXT LDT has successfully completed or exceeded all of its goals that were defined
at the beginning of the test in 2005
• As part of the voluntary test termination process, a comprehensive end-of-test performance and wear characterization was made after repairing numerous diagnostics that had failed over the course of the test
• These results have confirmed many of the trends observed over the course of test, including:
• Steady performance with minimal degradation
• Mitigation of the first-failure mode of NSTAR through negligible aperture enlargement and change in ion optics grid gap
• Mitigation of excessive keeper erosion
• The first failure mode of NEXT is expected to be loss of structural integrity of the ion optics due to penetration of the pit-and-groove pattern through the accelerator grid
• Observation of carbon deposits within the pattern at 50 kh necessitates a final groove depth measurement in atmosphere to assess status of the first failure in ground testing
• NEXT LDT test article has been vented to atmosphere and post-test inspections are presently underway

National Aeronautics and Space Administration Your Title Here 23


![Planetary surface mineralogical characterization using ... · web client is based on the JavaScript version of NASA’s World Wind [8] a general-purpose 3D/4D client used as a virtual](https://img.pdfslide.net/doc/110x75/605a5eff718938718c60cfc7/planetary-surface-mineralogical-characterization-using-web-client-is-based-on.jpg)