Embed Size (px)
Citation preview

351
http://dx.doi.org/10.7494/geol.2013.39.4.351
ChArACTEriZATiON Of NEAr-SurfACE SEdimENTS BASEd ON ElECTriCAl rESiSTiviTy
TOmOgrAphy mEASurEmENTS iN ThE viCiNiTy Of ThE wAwEl hill (KrAKOw, pOlANd)
michał ĆwiKliK
AGH University of Science and Technology, Faculty of Geology, Geophysics and Environmental Protection, Department of Geophysics;
al. Mickiewicza 30, 30-059 Krakow, Poland; e-mail: [email protected]
Abstract: The Electrical Resistivity Tomography (ERT) method was applied at the SW foot of the Wa-wel Hill was applied. The survey was carried out along five survey lines (P1–P5), 50 m long each. The Wenner alpha array with spacing a = 0.5 m, 1.0 m, 1.5 m, 2.0 m, 2.5 m, 4.0 m, 5.5 m, 7.5 m, and 10.0 m was used. The basic electrode spacing was 0.5 m. In apparent resistivity contours and sec-tions we can distinguish two zones, which have noticeably different resistivity values. The low resistivi-ty zone dominates in the deeper part of the section on all survey lines, especially on the profiles located in the close neighbourhood of the Vistula River. The relative high resistivity zone is probably the effect of complex local geology, as well as the influence of the limestone of the Wawel Hill. Based on ERT inversion results, three resistivity zones were distinguished. Then the probable lithological or/and an-thropogenic character was assigned to them. The shallowest zone has the thickness of about 0.5 m and results probably from accumulation of weathered limestone fragments derived from the Wawel Hill. It may be that high resistivity zones have anthropogenic character. Below, a zone of water-bearing sands was recorded, which may result from redevelopment and reclamation of this area. Thickness of this zone increases towards the Vistula River. Another zone, which can be identified with limestone, was identified on survey lines P4 and P5. This could also be result of accumulation of the calcareous debris for the purpose of planation of the area. In order to generalize and simplify the characterization of the quaternary sediments, 1D interpretation was made. The method allows us to estimate the depth of groundwater, which in that place is about 5 m.
Key words: applied geophysics, electrical resistivity tomography, near-surface, Wawel Hill
Geology, Geophysics & Environment 2013 Vol. 39 No. 4 351–361
M. Ćwiklik352
iNTrOduCTiON
The discussed geoelectrical studies were conducted at the foot of Wawel Hill with the Resistivity Imaging method. The major aim of the research was to recognize the shallow geology of the area in terms of electrical properties and lithology.
The Electrical Resistivity Tomography (ERT) method, often referred to as resistivity imaging (Dahlin 1996, Loke 2003), is one of the most frequently applied geoelectrical methods. Due to its features, such as precision mapping of geological structure and full automation of the measurement process, the method has found wide use in geomorphol-ogy (Schrott & Sass 2008), environmental studies (Georgaki et al. 2008), archaeology (Misiewicz 1998), engineering (Mościcki & Antoniuk 2008) and ecological problems (Sechman et al. 2013).
The ERT method enables 2D and even 3D characterization of subsurface. The method augments the capabilities of two more traditional methods: DC resistivity sounding, also known as Vertical Electrical Sounding – VES (Keller & Frischknecht 1966) and electrical profiling. The DC resistivity sounding method is dedicated to the investigation of the re-sistivity distribution in vertical direction and electrical profiling in horizontal direction. In the traditional methods the results of studies are interpreted in 1D model category (VES method) or simplified 2D quality models (electrical profiling).While the ERT allows 2D/3D geology structure recognition (Dahlin 1996).
The ERT method requires a placement of a proper number of electrodes at an equal distance from each other. Usually about one hundred electrodes are used, which are joined with a multi-core cable with a resistivity meter system. The meter system is linked with a commutator, which allows plumbing in any four electrodes to the transmitter-receiver part. The choice of electrode, their connection and initiation of measurement is usually realized by digital control with a laptop computer. The measurement is carried out by assuming a meas-urement scheme (module) and most frequently is beginning from the smallest one. After the value of apparent resistivity for a concrete point has been obtained, the measurement array is “moved” along the survey line in accordance with the formerly defined measure-ment step. When the array achieves the last measurement point, the same process is repeated for a larger array. In most cases the survey is realized to complete the set of measurements (Loke 2003).
The result of ERT study is usually shown in the so called Apparent Resistivity Pseu-dosection (ARP), which is a function of the size and type of the measurement array, meas-urement point location and resistivity space distribution. The ARP reflects and qualitatively approximates the geological structure. The quantitative information is received by inversion. Through the inversion (solution of reverse task) the 2D distribution of interpreted resistivity is received as function of depth and distance. In the final survey phase, geological interpreta-tion is carried out by an attempt to assign a probable lithological character to the interpreted resistivity distribution.

Characterization of near-surface sediments based on... 353
mEThOd
The Electrical Resistivity Tomography (ERT) method in the south western part of the foot of the Wawel Hill (Krakow, Poland) was applied. The survey was carried out along five survey lines (P1–P5), 50 m long each (Fig. 1). The Wenner alpha array with spacing a = 0.5 m, 1.0 m, 1.5 m, 2.0 m, 2.5 m, 4.0 m, 5.5 m, 7.5 m, and 10.0 m was used. The basic electrode spacing was 0.5 m. The field survey was performed with the laboratory resistivity meter system GEOMES-RR5, which was adapted to the field survey.
The field data were interpreted with the Res2Dinv software (Loke 2003). A standard (smoothness constrain) inversion was applied to the field data although robust inversion op-tions (Loke et al. 2003) were tested, as well. In order to simplify the characterization of the quaternary sediments, 1D interpretation was done (Mościcki 2008b). In this method, we assume that we can choose (in an arbitrary way) some windows in apparent resistivity pseu-dosection, where we can estimate the local geological structure (assuming that the geologi-cal structure is layered in the case). For the chosen window the average Vertical Electrical Sounding (VES) curve is calculated. In the next step, the VES curve is inverted with the use of standard software for 1D inversion (Mościcki 2008a). In this case, IP2Win software (Bo-bachev 2001) was used. The procedure for the P1 profile was applied.
STudy ArEA
location
The Wawel Hill on the left bank of the Vistula River reaches on 228 meters above the sea level. The Hill is also a dominant element in the panorama of the central part of Krakow.
On the top of the Hill there is the Wawel Royal Castle, which used to be the residence of the Polish Crown (Rotter et al. 2005). At present the place is on the UNESCO World Her-itage List, because it has always played a paramount historical and cultural role for Poland and Europe (http://whc.unesco.org/en/list/29).
geology
The simplified geology setting is shown in Figure 1. Structurally, the Wawel Hill is a horst of Jurassic limestone (Tyczyńska 1967). In the Miocene the area, and especially grabens were covered with clay deposits, which subsequently were almost completely erod-ed.Thickness of the clay deposit in wells in the vicinity of the Wawel Hill is not more than 1.5 m. The Quaternary sediments rest above and are represented by fluvial and gracial sand and gravel, which are covered by the soil horizon (Kmietowicz-Drathowa 1964). The shal-lowest part of geological structure is represented an anthropogenic layer. Its relatively high thickness, especially at the foot of the Wawel Hill, is probably related to a high number of buildings of defensive character in the area. This type of development can be observed in the picture of the 18th century (Rotter et. al. 2005).

M. Ćwiklik354
fig. 1. Location of the study area and simplified geology
The groundwater in the vicinity of the Wawel Hill is related to the aquifer hosted by jointed and karstified Jurassic limestone. The water table is almost on the same level as the Vistula River (Kleczkowski 1964).
SurvEy rESulTS
Qualitative analysis
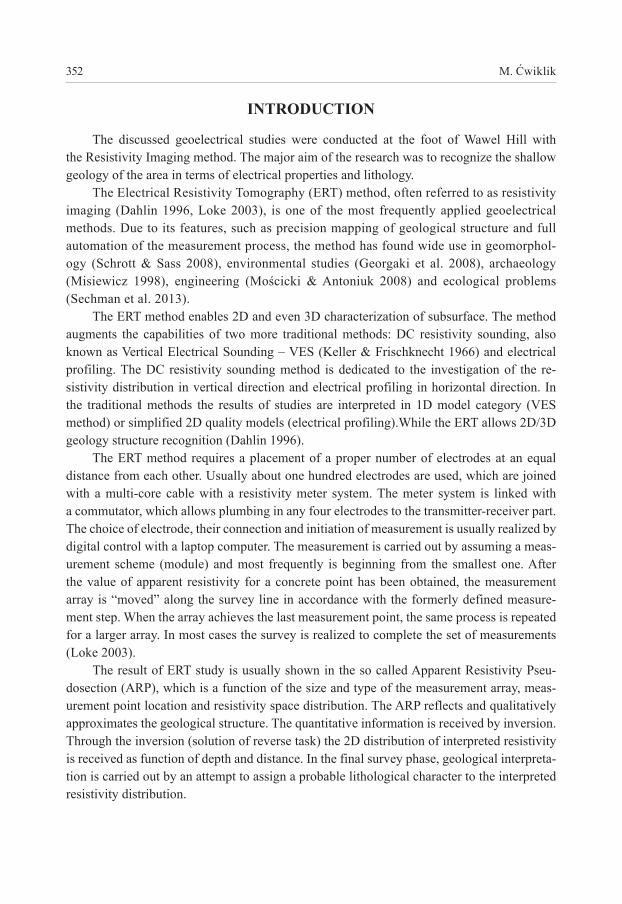
The field data was presented as apparent resistivity pseudosections (Fig. 2A) and con-tours (Fig. 2B).
In apparent resistivity contours and sections low and high resistivity zones are shown. The high resistivity zone HR1 is visible in the shallowest part of the section on all survey lines (P1–P5). This zone is evident on apparent resistivity contours for spacing a = 0.5 m. For higher spacing value the next high resistivity HR2 zone dominates clearly in the survey lines P4 and P5.

Characterization of near-surface sediments based on... 355
fig.
2. T
he E
RT d
ata
qual
itativ
e an
alys
is: A
) app
aren
t res
istiv
ity p
seud
osec
tion;
B
) app
aren
t res
istiv
ity c
onto
urs f
or d
iffer
ent s
paci
ng
AB

M. Ćwiklik356
The low resistivity zones (LR) dominate in the deeper part of the section, especially on the profiles (P1–P3) located in the close neighbourhood of the Vistula River.
The available geological data suggest that limestone should be expected in the deep-er part of the study area. As a result, the value of apparent resistivity should increase for the largest spacing range. Nevertheless, it is noticeable for the P1–P3 profiles, only.
Quantitative analysis
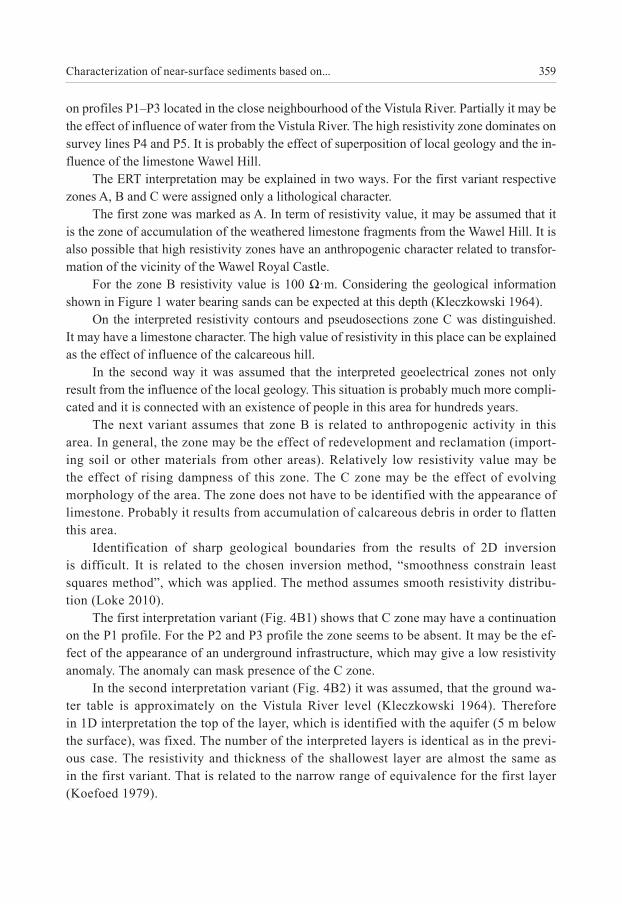
The inversion data was presented as interpreted resistivity cross-sections (Fig. 3A) and contours (Fig. 3B).
An evident change in the geoelectrical “structure” between the P3 and P4 profile might be observed. Close to the Vistula River, on the P1, P2 and P3 profiles, sediments which have resistivity value to 150 Ω·m predominate. Closer to the Wawel Hill dominate sediments the resistivity value of which is about 400 Ω·m.
On the interpreted resistivity cross section the following zones were distinguished:– Zone A – the shallowest one. The resistivity value reaches about 400 Ω·m. The thick-
ness is variable and does not exceed 0.5 m. – Zone B – the resistivity value between 100 and 150 Ω·m. The zone reaches about 2 m
below the ground. – Zone C – it is the zone with the resistivity value above 400 Ω·m. The zone is the thick-
est on the P5 profile and dominates there. The situation is similar on the P4 profile. On profile P3 the zone piches out laterally.
Furthermore, the “af” zone was distinguished on the profiles P1 and P2. This zone should be identified with “inversion side effects”. The resistivity values marked in this way are less reliable.
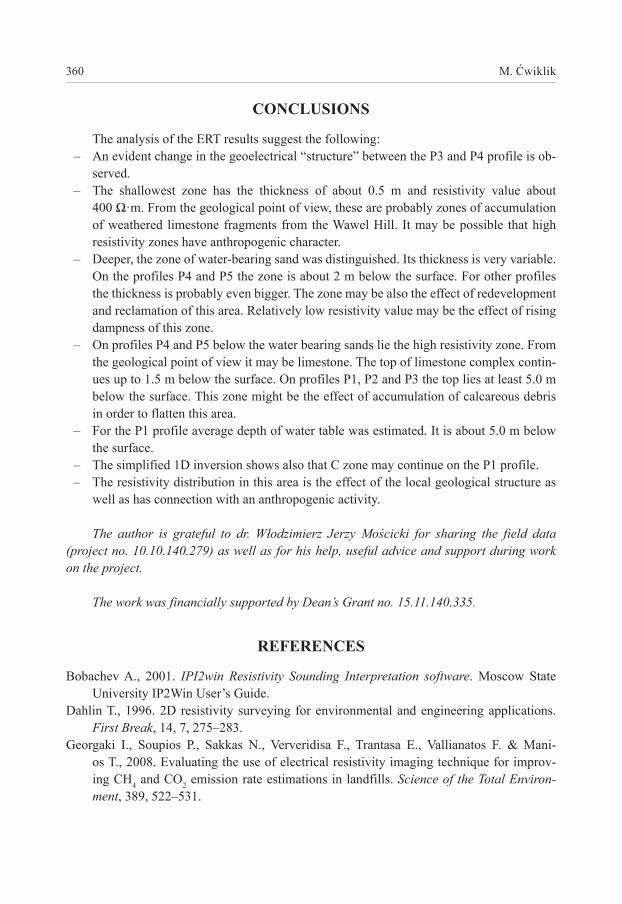
In order to estimate general “hydrogeological” setup, the simplified 1D inversion was applied for the P1 profile, which is the nearest to the Vistula River. In the Figure 4B1 and 4B2, for earlier chosen windows (W1–W4) two interpreted variants are shown. The possibility of existing a relative high resistivity layer (300 Ω·m) for the first variant was checked. This resistivity value was fixed in the inversion. For the first variant (Fig. 4B1) four layers were interpreted for the first two windows. This sequence is different for win-dows W3 and W4 where we can observe only three layers. In this case the uppermost high resistivity layer disappeared. The lowest layer has resistivity from the range 31–36 Ω m.
The second variant of the interpretation is shown on the Figure 4B2. In this variant it is assumed, that the water table is 5 m below the surface. The resistivity of the last inter-preted layers is very similar to the previous case. The intermediate layer, which is marked with orange colour in the windows W3 and W4, has greater thickness and lower resistivity than in the first case. For the windows W1 and W2 this layer has lower resistivity and is relatively thick.

Characterization of near-surface sediments based on... 357
fig.
3. R
esul
ts o
f the
ERT
dat
a in
vers
ion
with
Res
2Din
v: A
) int
erpr
eted
resi
stiv
ity c
ross
sect
ion;
B
) int
erpr
eted
resi
stiv
ity c
onto
urs f
or d
iffer
ent d
epth
leve
ls
AB

M. Ćwiklik358
fig. 4. Analysis of the ERT data for the P1 survey line: A) apparent resistivity pseudosection; B1) and B2) variants of the simplified 1D analysis; C) results of the ERT data inversion
diSCuSSiON
On apparent resistivity contours (Fig. 2B) and sections (Fig. 2A) the low and high resis-tivity anomaly zones were revealed in the qualitative way. The low resistivity zones dominate
A
B1
B2
C
Characterization of near-surface sediments based on... 359
on profiles P1–P3 located in the close neighbourhood of the Vistula River. Partially it may be the effect of influence of water from the Vistula River. The high resistivity zone dominates on survey lines P4 and P5. It is probably the effect of superposition of local geology and the in-fluence of the limestone Wawel Hill.
The ERT interpretation may be explained in two ways. For the first variant respective zones A, B and C were assigned only a lithological character.
The first zone was marked as A. In term of resistivity value, it may be assumed that it is the zone of accumulation of the weathered limestone fragments from the Wawel Hill. It is also possible that high resistivity zones have an anthropogenic character related to transfor-mation of the vicinity of the Wawel Royal Castle.
For the zone B resistivity value is 100 Ω·m. Considering the geological information shown in Figure 1 water bearing sands can be expected at this depth (Kleczkowski 1964).
On the interpreted resistivity contours and pseudosections zone C was distinguished. It may have a limestone character. The high value of resistivity in this place can be explained as the effect of influence of the calcareous hill.
In the second way it was assumed that the interpreted geoelectrical zones not only result from the influence of the local geology. This situation is probably much more compli-cated and it is connected with an existence of people in this area for hundreds years.
The next variant assumes that zone B is related to anthropogenic activity in this area. In general, the zone may be the effect of redevelopment and reclamation (import-ing soil or other materials from other areas). Relatively low resistivity value may be the effect of rising dampness of this zone. The C zone may be the effect of evolving morphology of the area. The zone does not have to be identified with the appearance of limestone. Probably it results from accumulation of calcareous debris in order to flatten this area.
Identification of sharp geological boundaries from the results of 2D inversion is difficult. It is related to the chosen inversion method, “smoothness constrain least squares method”, which was applied. The method assumes smooth resistivity distribu-tion (Loke 2010).
The first interpretation variant (Fig. 4B1) shows that C zone may have a continuation on the P1 profile. For the P2 and P3 profile the zone seems to be absent. It may be the ef-fect of the appearance of an underground infrastructure, which may give a low resistivity anomaly. The anomaly can mask presence of the C zone.
In the second interpretation variant (Fig. 4B2) it was assumed, that the ground wa-ter table is approximately on the Vistula River level (Kleczkowski 1964). Therefore in 1D interpretation the top of the layer, which is identified with the aquifer (5 m below the surface), was fixed. The number of the interpreted layers is identical as in the previ-ous case. The resistivity and thickness of the shallowest layer are almost the same as in the first variant. That is related to the narrow range of equivalence for the first layer (Koefoed 1979).
M. Ćwiklik360
CONCluSiONS
The analysis of the ERT results suggest the following:– An evident change in the geoelectrical “structure” between the P3 and P4 profile is ob-
served.– The shallowest zone has the thickness of about 0.5 m and resistivity value about
400 Ω·m. From the geological point of view, these are probably zones of accumulation of weathered limestone fragments from the Wawel Hill. It may be possible that high resistivity zones have anthropogenic character.
– Deeper, the zone of water-bearing sand was distinguished. Its thickness is very variable. On the profiles P4 and P5 the zone is about 2 m below the surface. For other profiles the thickness is probably even bigger. The zone may be also the effect of redevelopment and reclamation of this area. Relatively low resistivity value may be the effect of rising dampness of this zone.
– On profiles P4 and P5 below the water bearing sands lie the high resistivity zone. From the geological point of view it may be limestone. The top of limestone complex contin-ues up to 1.5 m below the surface. On profiles P1, P2 and P3 the top lies at least 5.0 m below the surface. This zone might be the effect of accumulation of calcareous debris in order to flatten this area.
– For the P1 profile average depth of water table was estimated. It is about 5.0 m below the surface.
– The simplified 1D inversion shows also that C zone may continue on the P1 profile.– The resistivity distribution in this area is the effect of the local geological structure as
well as has connection with an anthropogenic activity.
The author is grateful to dr. Włodzimierz Jerzy Mościcki for sharing the field data (project no. 10.10.140.279) as well as for his help, useful advice and support during work on the project.
The work was financially supported by Dean’s Grant no. 15.11.140.335.
rEfErENCES
Bobachev A., 2001. IPI2win Resistivity Sounding Interpretation software. Moscow State University IP2Win User’s Guide.
Dahlin T., 1996. 2D resistivity surveying for environmental and engineering applications. First Break, 14, 7, 275–283.
Georgaki I., Soupios P., Sakkas N., Ververidisa F., Trantasa E., Vallianatos F. & Mani-os T., 2008. Evaluating the use of electrical resistivity imaging technique for improv-ing CH4 and CO2 emission rate estimations in landfills. Science of the Total Environ-ment, 389, 522–531.

Characterization of near-surface sediments based on... 361
Keller G.V. & Frischknecht F.C. 1966. Electrical Methods in Geophysical Prospecting. Per-gamon Press, Oxford.
Kleczkowski A., 1964. Zarys warunków hydrogeologicznych na terenie miasta Krakowa. Sprawozdania z Posiedzeń Komisji Naukowych Polskiej Akademii Nauk, Oddział w Krakowie, styczeń-marzec 1964, 22.
Kmietowicz-Drathowa I., 1964. Rys budowy geologicznej czwartorzędu okolic Krakowa.Sprawozdania z Posiedzeń Komisji Naukowych Polskiej Akademii Nauk, Oddziałw Krakowie, 269–274.Koefoed O., 1979. Geosounding Principles. Elsevier, Amsterdam.Loke M.H., 2003. Rapid 2D resistivity & IP inversion using least-squares method. Geotomo
Software. Manual.Loke M.H., 2010. Tutorial: 2-D and 3-D electrical imaging surveys. Geotomo Software.Loke H., Ackworth I. & Dahlin T., 2003. A comparison of smooth and blocky inversionmethods in 2D electrical imaging surveys. Exploration Geophysics, 34, 182–187.Misiewicz K., 1998. Metody geofizyczne w planowaniu badań wykopaliskowych.
P.PH GROSS, Warszawa.Mościcki W.J. & Antoniuk J., 1998. Metoda obrazowania elektrooporowego (resistivity
imaging). Przykład badań dla celów geologiczno-inżynierskich. Materiały V Konfe-rencji Naukowo-Technicznej: Geofizyka w geologii, górnictwie i ochronie środowiska, Kraków, 315–325.
Mościcki W.J., 2008a. 2D resistivity imaging of an anisotropic 3D body – results of a labora-tory experiment. Near Surface 2008, 14th European Meeting of Environmental and En-gineering Geophysics, 15–17 September 2008, Krakow, Poland. Extended Abstracts & Exhibitors’ Catalogue, P23.
Mościcki W.J., 2008b.The application of resistivity investigations in archaeology – two case studies from Kraków. Poland. Near Surface 2008, 14th European Meeting of Environ-mental and Engineering Geophysics, 15–17 September 2008, Krakow, Poland. Extend-ed Abstracts & Exhibitors’ Catalogue, P58.
Rotter A. & Szelerewicz M., 2005. Smocza Jama w Wawelu: Przewodnik. Wydawnictwo Karpaty – Andrzej Łączyński, Kraków.
Schrott L. & Sass O., 2008. Application of field geophysics in geomorphology, advances and limitations exemplified by case studies. Geomorphology, 93, 55–73.
Sechman H., Mościcki W.J. & Dzieniewicz M., 2013. Pollution of near-surface zone in the vi-cinity of gas wells. Geoderma, 197, 193–204.
Tyczyńska M., 1967. Rzeźba i budowa geologiczna terytorium miasta Kraków. Folia Geo-graphica, Series Geographica – Physica, Środowisko geograficzne terytorium miasta Krakowa, 1, 19–27.
Unesco World Heritage List, [on-line:] http://whc.unesco.org/en/list/29 [access: December 2013].