Embed Size (px)
Citation preview

Characterization of PIM kinases and cancer stem cell
features in trophoblast cells
Dissertation
zur Erlangung des akademischen Grades
Doctor of Philosophy (Ph.D.)
vorgelegt dem Rat der Medizinischen Fakultät
der Friedrich-Schiller-Universität Jena
von STELLA MARY
geboren am 12.04.1985 in Portblair, India

Gutachter
1. Prof. Dr. med. Udo Markert. Universitätsklinikun Jena, Jena
2. Prof. Dr. Regine Heller. Friedrich-Schiller Universität Jena, Jena
3. Prof. Dr. Udo Jeschke. Ludwig-Maximilians-Universität München, München.
Tag der öffentlichen Verteidigung: 15.12.2015

DEDICATED TO MY GRANDPARENTS
„Gedruckt mit Unterstützung des Deutschen Akademischen Austauschdienst"

TABLE OF CONTENTS
LIST OF ABBREVIATION .................................................................................................................... i
SUMMARY ............................................................................................................................................ iv
ZUSAMMENFASSUNG ....................................................................................................................... vi
CHAPTER 1 INTRODUCTION ........................................................................................................... 1
1.1 Pregnancy-An enigma of new life ............................................................................................ 1
1.2 Stages in Pregnancy ................................................................................................................. 2
1.3 Ovulation and Implantation ....................................................................................................... 2
1.4 Placentation ................................................................................................................................ 5
1.5 Soluble factors involved in pregnancy: hormones, growth factors, cytokines ................ 10
1.6 LIF in pregnancy ...................................................................................................................... 12
1.7 Signaling network-mechanism ............................................................................................... 14
1.8 Pathologies in pregnancy ....................................................................................................... 16
1.9 PIM kinases .................................................................................................................................. 18
1.10 Structure and Function .......................................................................................................... 18
1.11 Signaling pathways mechanism .......................................................................................... 19
1.12 PIM kinases in Cancer .......................................................................................................... 21
1.13 Stem cells ................................................................................................................................ 22
1.14 Cancer stem cell (CSC) ........................................................................................................ 24
1.15 3D culture-Spheroid............................................................................................................... 25
1.16 PIM kinases -LIF-Stem cell-trophoblast ............................................................................. 25
CHAPTER 2 OBJECTIVE ................................................................................................................. 26
2.1 Part I ........................................................................................................................................... 26
2.2 Part II .......................................................................................................................................... 26
2.3 Experimental Design Part I ...................................................................................................... 27
2.4 Experimental Design Part II ..................................................................................................... 28
CHAPTER 3 MATERIALS AND METHODS .................................................................................. 29
3.1. Part I .......................................................................................................................................... 29

ii
3.1.1 General Procedure ............................................................................................................... 29
3.1.2 Reagents and antibodies or compounds .............................................................................. 29
3.1.3 Ethical aspects ...................................................................................................................... 29
3.1.4 Isolation of primary trophoblast cells .................................................................................. 30
3.1.5 RNA extraction, PCR and quantitative real-time PCR ........................................................... 30
3.1.6 Gel Electrophoresis............................................................................................................... 33
3.1.7 Western blotting .................................................................................................................. 33
3.1.8 Immunocytochemistry (ICC) ................................................................................................. 34
3.1.9 Immunofluorescence (IF) ..................................................................................................... 35
3.1.10 Incubation of cells with PIM-Kinase Inhibitor IX, SGI-1776 ................................................ 36
3.1.11 Cell Viability Assay (MTS) ................................................................................................... 36
3.1.12 Cell Proliferation (BrdU) ..................................................................................................... 36
3.1.13 Apoptosis (Annexin V assay) .............................................................................................. 37
3.2 PART II ...................................................................................................................................... 37
3.2.1 Cell cultures and cell line ...................................................................................................... 37
3.2.2 Generation of spheroids ....................................................................................................... 37
3.2.3 Viability analysis of formed spheroids ................................................................................. 38
3.2.4 Spheroid Stimulation ............................................................................................................ 38
3.2.5 Flow Cytometry .................................................................................................................... 38
3.2.6 Western Blot ......................................................................................................................... 38
3.3 Statistics................................................................................................................................... 39
CHAPTER 4 RESULTS ..................................................................................................................... 40
PART I .............................................................................................................................................. 40
4.1 Identification of PIM kinases (PIM1, PIM2 and PIM3) in trophoblastic cells ................... 40
4.2 Effect of LIF upon stimulation in trophoblastic cells ............................................................... 41
4.2.1 Gene expression level........................................................................................................... 41
4.2.2 Protein expression level ....................................................................................................... 43

4.2.3 Localization and distribution of PIM kinases ........................................................................ 46
4.3 PIM kinase inhibition in trophoblastic cells by SGI-1776 ................................................... 49
4.3.1 Effect on Cell viability and proliferation ............................................................................... 49
4.3.2 SGI-1776 effect on potential PIM Kinase targets ................................................................. 52
4.3.3 Apoptosis induction by SGI-1776 ......................................................................................... 56
PART II ............................................................................................................................................. 59
4.4 HTR8/SVneo cell characterization of Stem cell property ................................................... 59
4.4.1 Characterization of spheroids formed from HTR8/SVneo cells ........................................... 59
4.4.2 Morphology and cell viability by microscopic analysis ......................................................... 59
4.4.3 Western Blot analysis ........................................................................................................... 60
4.4.4 Flow cytometer analysis ....................................................................................................... 63
CHAPTER 5 DISCUSSION ............................................................................................................... 66
CHAPTER 6 CONCLUSION ............................................................................................................. 74
CHAPTER 7 REFERENCES ............................................................................................................ viii
APPENDIX .......................................................................................................................................... xxii
ACKNOWLEDGMENT ..................................................................................................................... xxiv
CURRICULUM VITAE ...................................................................................................................... xxv
EHRENWÖRTLICHE ERKLÄRUNG ............................................................................................ xxxii

List of abbreviations
i
LIST OF ABBREVIATION
Akt Synonym of PKB (Protein kinase B) BAD Bcl-2-associated death promoter Bp Base pairs BSA Bovine serum albumin BrdU Bromodeoxyuridine (5-bromo-2'-deoxyuridine) cDNA Complementary deoxyribonucleic acid CASP Caspases, or cysteine-aspartic proteases or cysteine-dependent
aspartate-directed proteases CAM Cell adhesion molecule CC Cell column CD Cluster differentiation CDX2 Caudal type homeobox 2 CL Corpus Luteum CLC Cardiotrophin-like cytokine CLL Chronic lymphocytic leukemia CO2 Carbon dioxide CSC Cancer stem cell CTB Cytotrophoblast DMSO Dimethyl sulfoxide DNA Deoxyribonucleic acid DNase Deoxyribonuclease dNTP Deoxynucleoside triphosphate dT Deoxythymidine DTT Dithiothreitol EBS Embryonic stem cell ECM Extracellular matrix Ectb Endovascular cytotrophoblast
EDTA Ethylendiaminetetraacetic acid
EGF Epidermal-Growth-Factor
ElF-4E Eukaryotic translation initiation factor 4E
Ep-CAM Epithelial cell adhesion molecule
EVT Extravillous trophoblast
FBS Fetal bovine serum
FSH Follicle stimulating hormone
FSR Follicle stimulating hormone receptor
Fwd Forward
G Gravitational acceleration
GAPDH Glyceraldehyde 3-phosphate dehydrogenase
GDM Gestational diabetes mellitus
G-CSF Granulocyte colony-stimulating factor
GM-CSF Granulocyte-macrophage Colony-stimulating factor
Gp130 Glycoprotein 130
Grb-2 Growth factor receptor-bound protein 2

List of abbreviations
ii
HBEGF Heparin-binding EGF-like growth factor
hES Human embryonic stem cells
HCG Human chorion gonadotropin
HGF Hepatocyte growth factor
HIF Hypoxia inducible factor
HIF-α Hypoxia Inducible factor-alpha
HOXA9 Homeobox protein Hox-A9
Hpl Human placental lactogen
Hsp Heat shock proteins
ICM Inner cell mass
Ictb Interstitial cytotrophoblast
IL Interleukin
IL-11 Interleukin- 11
IL-6 Interleukin- 6
IUGR Intra-uterine growth restriction
JAK/STAT Janus kinase/Signal transducer and activator of transcription
JNK Jun N-terminal kinase
LE Luminal epithelium
LH Luteinizing hormone
LIF Leukemia inhibitory factor
LIFR Leukemia inhibitory factor receptor
MCL1 Myeloid cell leukemia sequence 1
MMP-2 Matrix Metalloproteinase-2
MMP-9 Matrix Metalloproteinase-9
MMPs Matrix Metalloproteinases
MDR1 Multi Drug Resistant gene 1
MTS 3-(4, 5-dimethylthiazol-2-yl)-5-(3-carboxymethoxyphenyl)-2-(4-
sulfophenyl)-2H-tetrazolium
mTOR Mammalian target of Rapamycin
MYC Myelocytomatosis viral oncogene
NaCl Sodium chloride
NANOG Homeobox protein nanOg
NCBI National Center for Biotechnology Information
OSM Oncostatin M
p-BAD Phospho Bcl-2-associated death promoter
PAA Polyacrylamide
PAGE Polyacrylamide gel electrophoresis
PBS Phosphate buffered saline
PCR Polymerase chain reaction
POU5F1 POU domain, class 5, homebox 1
PKC Protein kinase C
p-MYC Phospho-myelocytomatosis viral oncogene
PVDF Polyvinyl

List of abbreviations
iii
qRT-PCR Quantitative real time polymerase chain reaction
Rev Reverse
Src Sarcoma
sFlt-3 Soluble fms-like tyrosine kinase-3
SH2 Src homology 2
SOCS Suppressors of cytokines signaling
SOS Son of sevenless
SOX2 SRY (sex determining region Y)-box 2
sPlGF soluble placental growth factor
SSE4A Stage-specific embryonic antigen 4
STAT3 Signal transducer and activator of transcription
STB Syncytiotrophoblast
VEGF vascular endothelial growth factor
SYGR Green I N’, N’-dimethyl-[4-[(E)-(3-methyl-1, 3-benothizol-2-
ylidene) methyl]-1-Phenylquinolin-1-ium-2-yl]-N-propylpropane-1,
3-diamine
TAE Tris-acetate-EDTA
Taq Thermus aquaticus
TBS Tris-buffered saline
TEMED N, N, N’, N’- Tetramethylethylen diamine
TGF-ß Transforming growth factor beta
Tr Trophoectoderm
VEGFA Vascular endothelial growth factor A
v/v volume to volume ratio
w/v weight to volume ratio
Summary
iv
SUMMARY
Part I
The proviral insertion in murine (PIM) lymphoma proteins are a serine
/threonine kinase family composed of three isoforms: PIM1, PIM2 and PIM3 which
play a critical role in the control of the cell survival, proliferation, homing,
migration, apoptosis inhibition, micro-environmental signaling and drug
resistance. Overexpression of PIM kinases has been reported in several human
tumors, mainly in hematological cancers. PIM kinases are cytokine dependent
and mainly regulated by the Janus Kinase/Signal Transducer Activator of
Transcription (JAK/STAT) signaling pathway. This is mainly activated by members
of the Interleukin-6 (IL-6) family, but also others. Also Leukemia Inhibitory Factor
(LIF) and Oncostatin M (OSM) belong to this family. Different trophoblast
subtypes form the interface between mother and fetus and exert a crucial role in
implantation and placentation necessary for successful pregnancy. Several
pathologies are related with excessive trophoblast invasion, such as placenta
percreta or choriocarcinoma, or with shallow invasion such as preeclampsia. The
major aim of this part of the thesis was to further investigate the involvement of
PIM kinases in regulation of trophoblast behavior. This may help to understand
not only the physiology of embryo implantation and placentation, but also to
identify potential disorders, which may lead to pregnancy complications.
In the human immortalized first trimester extravillous trophoblast cell line
HTR8/SVneo and in the choriocarcinoma cell line JEG-3, we have analyzed the
mRNA expression of PIM1, PIM2 and PIM3 by quantitative real time-PCR, and
their protein expression by Western blotting and immunocytochemistry. We have
further investigated the expression kinetics after stimulation with LIF. We have
inhibited PIM kinases by using SGI-1776 at different doses for up to 3 days.
Subsequently, we have studied the kinetics of cell viability by MTS assays and the
proliferation by BrdU assays. Development of apoptosis was analyzed by Western
blotting for BAD, BCL-XL, (cleaved) PARP and CASP3 as also the expression
and phosphorylation of the potential PIM target c-MYC. Additionally, apoptosis
and necrosis was tested by flow cytometry by annexin V and propidium iodide
binding.

Summary
v
The major results are that all analyzed PIM kinases are expressed in both
cell lines and further increased upon stimulation with LIF. Inhibition of PIM kinases
significantly reduces viability and proliferation and induces apoptosis as assessed
by increased cleaved PARP and annexin V/propidium iodide binding.
Simultaneously, phosphorylation of c-MYC was reduced.
These results demonstrate the involvement of PIM kinases in LIF-induced
regulation in two different trophoblastic cell lines which may indicate similar
functions in primary cells.
Part II
Trophoblast cells have the ability to differentiate into embryonic lineages,
which behave similar to tumor cells. In previous studies of our group, it has been
demonstrated that trophoblast cells are able to form spheroids. We hypothesized that
HTR8/SVneo-derived spheroids may have properties similar to cancer stem-like cells
(CSCs). As per literature, formation of spheroids promotes proliferation, migration
and invasion in tumors (or also in trophoblast cell lines). HTR8/SVneo cells were
used as a model for the analysis of tumor-like behavior of trophoblast cells. Our aim
was to study and characterize the cancer stem cell-like properties in spheroids
formed from HTR8/SVneo cells and the effect of cytokines such as LIF and OSM
upon stimulation. We have observed that the HTR8/SVneo cells forming spheroids
expressed the stem cell surface marker CD44+ve high/CD34+ve low /CD24+ve low. Upon
LIF stimulation these markers showed a decreased expression. The stemness-
related transcription factors NANOG and CDX2 were constitutively expressed. Upon
OSM treatment the expression level of NANOG is increased and that of CDX2
decreased. Hence, we conclude that HT8/SVneo cells contain a fraction or side-
population that expresses stemness related factors. Functions and capabilities of
these cells remain to be investigated.

Zusammenfassung
vi
ZUSAMMENFASSUNG
Teil I
Die “Proviral Insertion in Murine (PIM) Lymphoma” Proteine bilden eine
Serin/Threonin Kinase Familie bestehend aus drei Isoformen: PIM1, PIM2 and
PIM3. Diese spielen eine entscheidende Rolle bei der Kontrolle der Zellviabilität,
der Proliferation, des “Homing”, der Migration, der Apoptose und anderer
Vorgänge. Die Überexpression von PIM Kinasen wurde in verschiedenen
humanen Tumoren beobachtet, vorwiegend in hämatologischen. PIM Kinasen
sind Zytokin-abhängig und werden vorwiegend durch Janus Kinase/Signal
Transducer Activator of Transcription (JAK/STAT) Signalwege aktiviert. Diese
werden vor allem von Zytokinen der Interleukin-6 (IL-6) Familie aktiviert, aber
nicht ausschließlich. Auch Leukemia Inhibitory Factor (LIF) und Oncostatin M
(OSM) gehören zu dieser Familie. Verschiedene Trophoblast-Subtypen formen
die Grenzfläche zwischen Mutter und Fetus und spielen eine bedeutende Rolle in
der Implantation und Plazentation und sind somit notwendig für eine erfolgreiche
Schwangerschaft. Mehrere Pathologien sind assoziiert mit exzessiver
Trophoblast-Invasion, so wie Placenta percreta or Chorioncarcinom, oder mit
schwacher Invasion so wie Präeclampsie. Das Ziel dieses Teils der Arbeit war die
weitere Untersuchung der Beteilung von PIM Kinasen an der Regulation des
Verhaltens von trophoblastären Zellen. Die Ergebnisse können dazu beitragen,
nicht nur die Physiologie der Embryo-Implantation and Placentation weiter zu
verstehen, sondern auch potenzielle Störungen, die zu
Schwangerschaftskomplikationen führen können. Wir haben die humane
immortalisierte extravillöse Ersttrimester Trophoblast-Zelllinie HTR8/SVneo und
die Chorioncarcinom-Zelllinie JEG-3 als Modelle benutzt. Die mRNA-Expression
von PIM1, PIM2 und PIM3 wurde mittels quantitativer real time-PCR, und die
Protein Expression mittels Western blotting und Immunozytochemie gemessen.
Wir haben darüber hinaus die Expressionskinetik nach Stimulation mit LIF
untersucht. Wir haben die PIM Kinasen mittels verschiedener Dosen SGI-1776
bis zu 3 Tagen inhibiert. Anschließend haben wir die Kinetik der Zellviabilität
mittels MTS Assays und die Proliferation mittels BrdU Assays untersucht. Das
Fortschreiten der Apoptose wurde mittels Western blotting für BAD, BCL-XL,
(gespaltenes) PARP und CASP3 analysiert sowie die Expression und

Zusammenfassung
vii
Phosphorylierung des potenziellen PIM Targets c-MYC. Zusätzlich wurden
Apoptose und Nekrose durchflusszytometrisch durch Annexin V- und
Propidiumiodid-Bindung bestimmt.
Die wichtigsten Ergebnisse sind, dass alle analyzierten PIM Kinasen in
beiden Zelllinien exprimiert werden, was durch Stimulation mit LIF weiter
gesteigert wurde. Die Inhibierung der PIM Kinasen reduzierte signifikant die
Viabilität und Proliferation der Zellen und induzierte signifikant die Apoptose,
besonders deutlich durch den Anstieg an gespaltenem PARP sowie durch
gesteigerte Annexin V und Propidiumiodid-Bindung. Gleichzeitig war die
Phosphorylierung von c-MYC reduziert.
Diese Ergebnisse demonstrieren die Beteiligung von PIM Kinasen an der
LIF-induzierten Regulation in zwei verschiedenen trophoblastären Zelllinien, was
auf ähnliche Funktionen in primären Zellen hindeutet.
Teil II
In früheren Studien unserer Gruppe konnten wir zeigen, dass
Trophoblastzellen in der Lage sind Spheroide zu formen. Wir haben erwartet, dass
HTR8/SVneo-Zell-Spheroide ähnliche Eigenschaften wie Tumor-Stammzellen
entwickeln. In der Literatur wurde berichtet, dass die Bildung von Spheroiden die
Proliferation, Migration und Invasion in Tumoren (oder auch in Trophoblastzelllinien)
steigert. HTR8/SVneo-Zellen wurden von uns als Modell genutzt zur Untersuchung
von tumor-ähnlichem Verhalten von Trophoblastzellen. Unser Ziel war, Tumor-
Stammzell-ähnliche Eigenschaften in aus HTR8/SVneo-Zellen geformten Spheroiden
zu untersuchen und die Effekte der Zytokine LIF und OSM zu testen. Wir haben
beobachtet, dass HTR8/SVneo-Zellen in Spheroiden die
Stammzelloberflächenmarker CD44+ve high/CD34+ve low /CD24+ve low exprimieren. Nach
Stimulation mit LIF zeigten diese Marker eine verminderte Expression. Die
Stammzell-assoziierten Transkriptionsfaktoren NANOG und CDX2 wurden konstitutiv
exprimiert. Nach Behandlung mit LIF stieg die Expression von NANOG und
verminderte sich die Expression von CDX2. Wir schlussfolgern deswegen, dass
HTR8/SVneo-Zellen eine Fraktion oder Neben-Population aufweisen, die Stammzell-
assoziierte Faktoren exprimiert. Die Funktionen und Fähigkeiten dieser Zellen sollten
in späteren Studien untersucht werden.
Introduction
1
CHAPTER 1 INTRODUCTION
1.1 Pregnancy-An enigma of new life
Pregnancy is a beautiful event of creation of new life on earth, which is accompanied
by its own enigma towards its success and failure. So far, researchers are doing all
the possible to unravel this mystery.
It goes back in the times when a famous scholar in the field of reproduction biology
named Medawar in 1953 put these words into the world of science to solve the need
of understanding pregnancy and its complications Billington (2003).
Pregnancy has its own charm to pull anyone towards its riddle and create quest to
unwind the story. In literature pregnancy is defined as the period taking place up to
38-40 weeks from the time of its start.
Pregnancy has been always viewed as a close cooperative interaction and regulation
between a mother and her fetus. During implantation, fetal derived cells (trophoblast)
invade the maternal endometrium and remodel the endometrial spiral arteries into
low-resistance vessels that are unable to constrict (Haig 1993) .
Migratory interstitial cytotrophoblasts play a role in the preparation of the myometrium
segments of the utero-placental arteries for the second wave of endovascular
trophoblast migration that occurs in the second trimester of human pregnancy
(Pijnenborg et al. 1983).
Columns of trophoblast cells advance to the base of the implantation site where they
spread out to form a cytotrophoblastic cell. In addition, cytotrophoblasts advance into
the lumen of the spiral arteries. They are responsible for remodeling these vessels to
form wide, low-resistance conduits. In human and great apes, there is additional
invasion of the endometrium and its vessels by trophoblasts originating from the base
of the anchoring villi. Deep trophoblast invasion that extends remodeling of the spiral
arteries to segments in the inner myometrium evolved in the common ancestor of
gorilla, chimpanzee and human (Carter et al. 2015).

Introduction
2
1.2 Stages in Pregnancy
During pregnancy, the woman undergoes many physiological changes including
hematological, renal, metabolic, cardiovascular and respiratory. Human pregnancy is
divided into three stages or trimesters. The first twelve weeks of pregnancy are
termed to be first trimester which includes fertilization of egg travelling down the
fallopian tube and attachment, invasion of the blastocyst into the endometrium of the
uterus. There, the embryo and placenta start their journey with several modifications
in terms of immunological tolerance and building a favorable environment for their
development (Duc-Goiran et al. 1999).
There is a high risk of miscarriage during the first trimester. During first trimester, a
large number of cells expressed by the decidua are leukocytes, among that the
largest single population are natural killer cells with smaller numbers of macrophages
and T cells (Hohn und Denker 2002). However by the end of pregnancy these NK
cells are the smallest cell population left (Starkey et al. 1988). The second trimester
is from week thirteen to twenty eight, where the movement of fetus can be felt by the
mother. The third trimester is from week 29 to 40.
1.3 Ovulation and Implantation
After the woman’s last day of the menstrual period cycle, the uterus begins a
proliferative phase until the rise of the follicle stimulation hormone (FSH) that
subsequently leads to ovulation in order to give rise to mature oocyte. The fusion of
this egg cell with a male gamete to form a zygote is called fertilization. This stage is
also considered an event of initiation of the pregnancy.
In humans implantation has been conceptualized as a stepwise process involving
apposition and adherence of a blastocyst to the endometrium, followed by breaching
of luminal epithelium and finally invasion into maternal tissues.

Introduction
3
In order for implantation to happen, endometrium has to undergo changes and
becomes decidua (Salamonsen et al. 2003), which is accomplished by the
modification of endometrial stromal cells, uterine vessels and glands as well as
immune cells (Lunghi et al. 2007). From (Figure.1) it is shown after fertilization, the
embryo develops from morula to blastocyst (after day 5), a spherical structure
composed of cells called inner cell mass (ICM), and outside of it is trophoblast cells.
The ICM subsequently develops into the fetus.
Implantation starts after the hatching of the blastocyst to the zona pellucida (day 6).
window of implantation (WOI), is characterized by two situations: 1. Endometrium
receptivity (Duc-Goiran et al. 1999), 2. Blastocyst invasion competence as a result it
breaches the uterine epithelium (day 7). The first cell-to-cell contact can be
recognized when apical plasma membranes of trophoblast and uterine epithelial cells
adhere (Hohn und Denker 2002) (Poehlmann et al. 2005a). The expression of
adhesion molecules such as integrin’s, adherins, selectin and immunoglobulin
superfamily, is involved in this process.
The ICM begins to differentiate into different layers and begins to produce human
chorionic gonadotropin (HCG), a hormone that insures the implanting embryo. The
trophoblast mediates the attachment and invasion into the uterine wall over next few
weeks. Thereby, placenta develops and continues production of progesterone
initiated by corpus luteum that controls and maintains decidualization. The decidua is
the uterine basis of the mother guaranteeing that the fetus is provided with nutrient
and oxygen needed for its successful growth and development. (Norwitz 2006)
(Damjanov 2014). Progesteron has been implicated in immunosuppression at the
feto-maternal interface, hence protecting the fetus from unwanted immunological
response. Due to higher secretion of progesterone from the corpus luteum (CL), the
secretory phase replaces proliferative phase in order to prepare the endometrium for
implantation by stimulating endometrial glands (Lee et al. 2011a) (Szekeres-Bartho et
al. 2009) (Santoro et al. 2000). Implantation is regulated by a complex interplay
between endometrium and trophoblast.

Introduction
4
The endometrium controls the trophoblast invasion by secreting cytokines and
protease inhibitors, which in turn modulate the invasion of trophoblast. Less HCG is
produced due to the closer presence of trophoblast to the endometrium, allowing
further differentiation of trophoblast into anchoring type cells. Decidualization
continues and regulates the placental formation and the expression of regulatory
factors such as surface antigens, metalloproteases and major histocompatibility
(MHC) molecules (Hess et al. 2007). Decidua basalis is characterized by infiltration of
immune-competent subsets cells like natural killer cells (NK) cells, progenitor cells,
some T cells (Trundley und Moffett 2004), macrophages and a few B cells. Decidua
in simple terms may be capable of inducing an immunological reaction against the
implanting blastocyst, or later placenta. These cells produce a respective cytokine
profile regulating implantation and trophoblast invasion (Saito 2000).
Ovulation
Fertilization Zona pellucida
Day 7
Day 6
Day 5
Day 2-3
Day 4
Day 1
Implantation
Figure 1. Ovulation and implantation.
Fertilization occurs in the fallopian tube within 24 to 48 h of ovulation. The initial stages of
development, from fertilized ovum (zygote) to a solid mass of cells (morula), occur as the
embryo passes through the fallopian tube encased within a non-adhesive protective shell
(the zona pellucida). Modified (Red-Horse et al. 2004)
Introduction
5
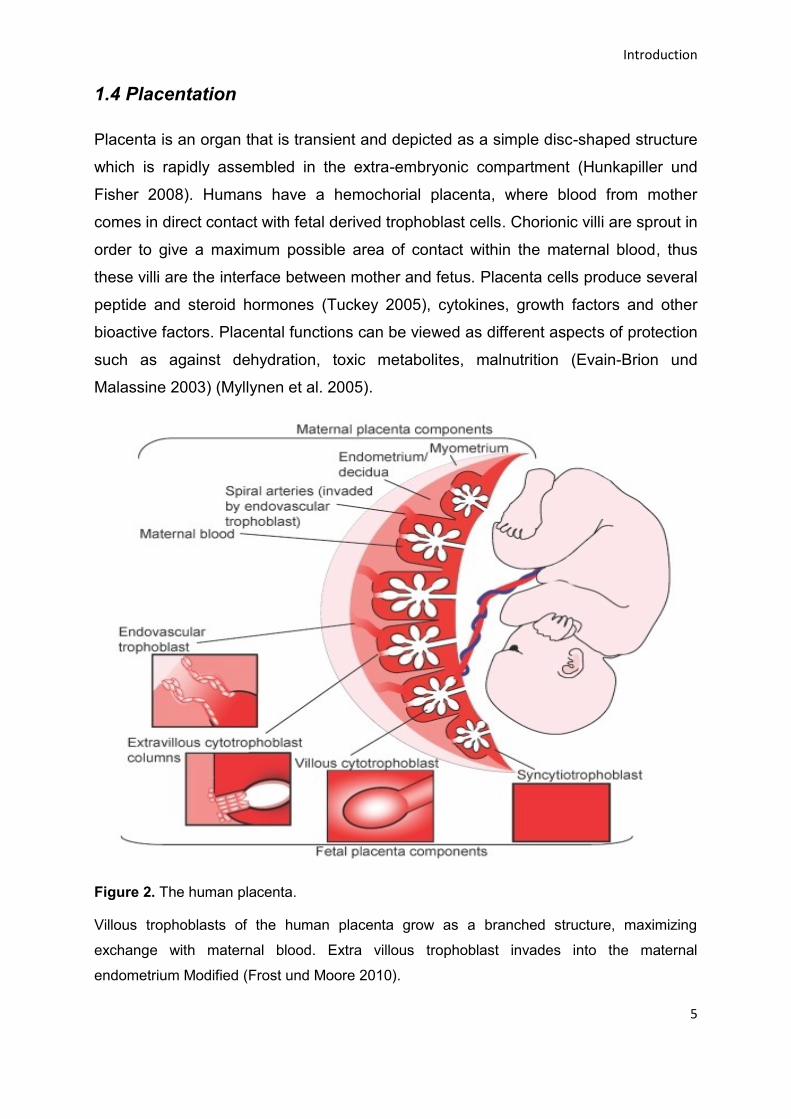
1.4 Placentation
Placenta is an organ that is transient and depicted as a simple disc-shaped structure
which is rapidly assembled in the extra-embryonic compartment (Hunkapiller und
Fisher 2008). Humans have a hemochorial placenta, where blood from mother
comes in direct contact with fetal derived trophoblast cells. Chorionic villi are sprout in
order to give a maximum possible area of contact within the maternal blood, thus
these villi are the interface between mother and fetus. Placenta cells produce several
peptide and steroid hormones (Tuckey 2005), cytokines, growth factors and other
bioactive factors. Placental functions can be viewed as different aspects of protection
such as against dehydration, toxic metabolites, malnutrition (Evain-Brion und
Malassine 2003) (Myllynen et al. 2005).
Figure 2. The human placenta.
Villous trophoblasts of the human placenta grow as a branched structure, maximizing
exchange with maternal blood. Extra villous trophoblast invades into the maternal
endometrium Modified (Frost und Moore 2010).
Introduction
6
Trophoblast cells are embryonic tissue formed during early stage of pregnancy
deriving from the “trophoectoderm” (Figure.2). They form the outer layer of the
blastocyst, providing the nutrients to the embryo and further develop into large part of
placenta (Haig 1993). Trophoblast further proliferates and differentiates into two
layers. 1). Cytotrophoblast (CTB): Single celled, inner layer of the trophoblast
(Bischof und Irminger-Finger 2005), which further develops into extra-villous
trophoblast cells (EVT) formed from the tip of the villi, growing out from placenta,
penetrating the decidualized uterus (Handwerger 2010) and 2). Syncytiotrophoblast
(STB) a multinucleated cell complex (Mi et al. 2000) (Fisher et al. 1989) that divides
maternal and fetal blood streams in gestation, also secreting human chorionic
gonadotropin (HCG) (Soncin et al. 2015) (Faas et al. 2014). STB is formed by the
fusion of cytotrophoblasts and is responsible for initiation of invasion of endometrium
(Faas et al. 2014). (Fig 3) The deeper penetration of maternal tissues is achieved by
cytotrophoblasts. Both cells resemble to each other and can be identified
histochemically (Haig 1993). One of the modulating mechanisms during villous
branching is by the human placental macrophage (Hofbauer cell) (Anteby et al.
2005). The arterioles that supply blood to the endometrium becomes highly coiled are
known as spiral arteries (Fig 4). They transport the maternal blood to the placenta.
The maternal tissues that line the uterus are called decidua. They shed with the
placenta during delivery (Haig 1993). The hemochorial placentation (Fig 5 ) which
requires an epithelial-to-endothelial conversion (Iruela-Arispe 1997) and it arises
primarily through differentiation, proliferation, migration and invasion of the
endometrium and its vasculature by the CTB (Duc-Goiran et al. 1999). Similarities
have been frequently asserted between growing fetus and invading cancer (Quenby
und Brosens 2013) (Pollheimer und Knofler 2005) (Koldovsky 1999) in terms of
invasion, migration and proliferation. Malign cells have similarities with CTB and EVT,
which show highly invasive characteristics especially during implantation and first
trimester of pregnancy: There is involvement of autocrine/paracrine communications,
adhesion molecules and protease profiles. In healthy pregnancy the invasive growth
by EVT is restricted to the uterus of the first trimester (Lunghi et al. 2007). EVT cells
enter the decidua and subsequently later the myometrial stroma as interstitial
trophoblast (Brosens et al. 2002).

Introduction
7
There they form giant cells and lose invasiveness. EVT also surround and destroy
smooth muscle cells (SMC) of spiral arteries hence replacing the fibroid material.
Further, EVT invade the lumen of the arteries to replace the endothelium of the
vessels (Zhou et al. 1997). MHC class I molecules are expressed in EVT cells, in
particular human leukocyte antigen HLA-C, E and G which are good ligands for many
killer immunoglobulin receptors (KIR) present on NK cells. Such interactions modify
the cytokine receptors and regulate adhesion molecules as well as Matrix Metallo
Proteinases (MMP) (Matthiesen et al. 2005). MMPs, α5β1 integrin’s, VE-cadherin’s
and trophoblast specific HLA class I (e.g. HLA-G) support EVT invasion. Although the
invasiveness of the trophoblast is known to be regulated in local and temporal terms,
the regulation of these activities is also related to differentiation pathways leading to
formation of non-invasive villous trophoblast serving endocrine as well as nutritive
functions (Hohn und Denker 2002).
Figure 3. Placental chronic villi
Stem from the chorionic plate and lie within the intervillous space. The point of attachment
between anchoring villi and the underlying tissue is the basal plate (box B). Enlargement of
the area in box. Undifferentiated CTB in the anchoring villi give rise to invasive CTBs that
invade the uterine interstitium (interstitial invasion) and the maternal endothelium
(endovascular invasion). Modified (Hunkapiller und Fisher 2008)

Introduction
8
Figure 4. Spiral artery remodeling
Maternal spiral artery remodeling through the combined action of interstitial and
endovascular extravillous trophoblast cells. EVT cells invade uterine wall and maternal spiral
arteries replacing smooth muscle with fibroid material and part of vessel endothelium, thus
evoking artery dilatation. Decidual immune cells, like macrophages and NK cells facilitate
deep invasion of EVT cells up to myometrial portions of spiral arteries. Modified (Lunghi et al.
2007).
Introduction
9
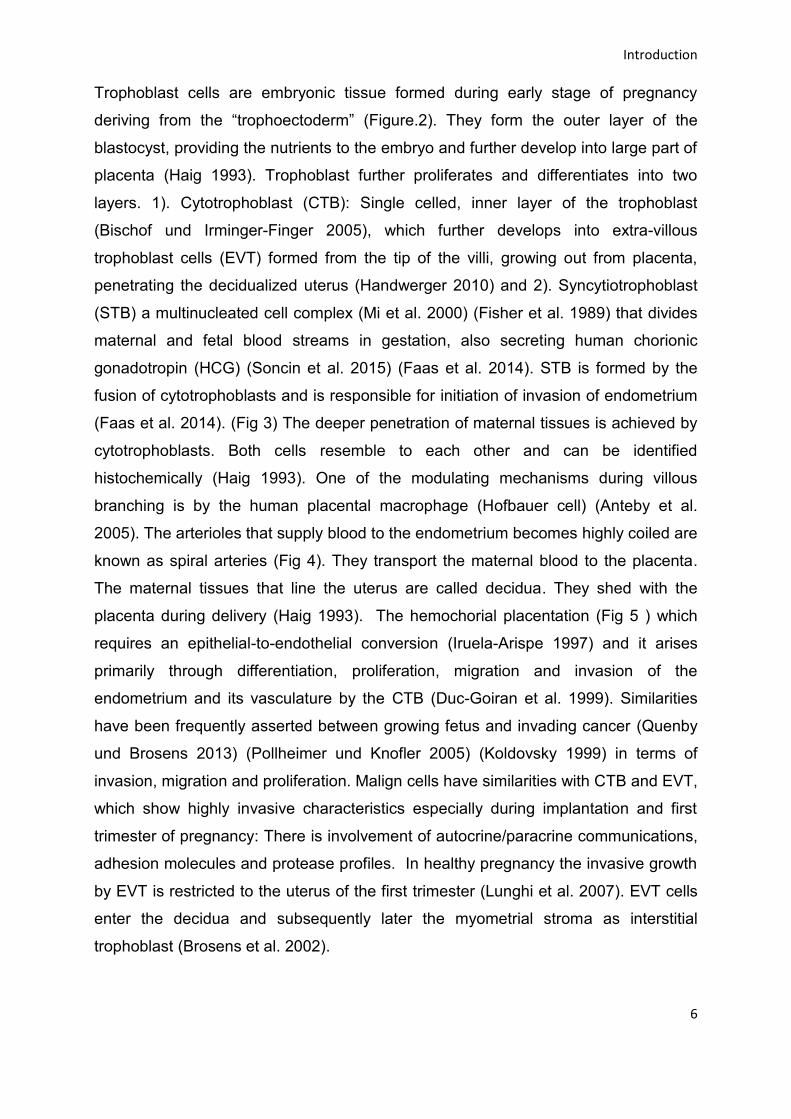
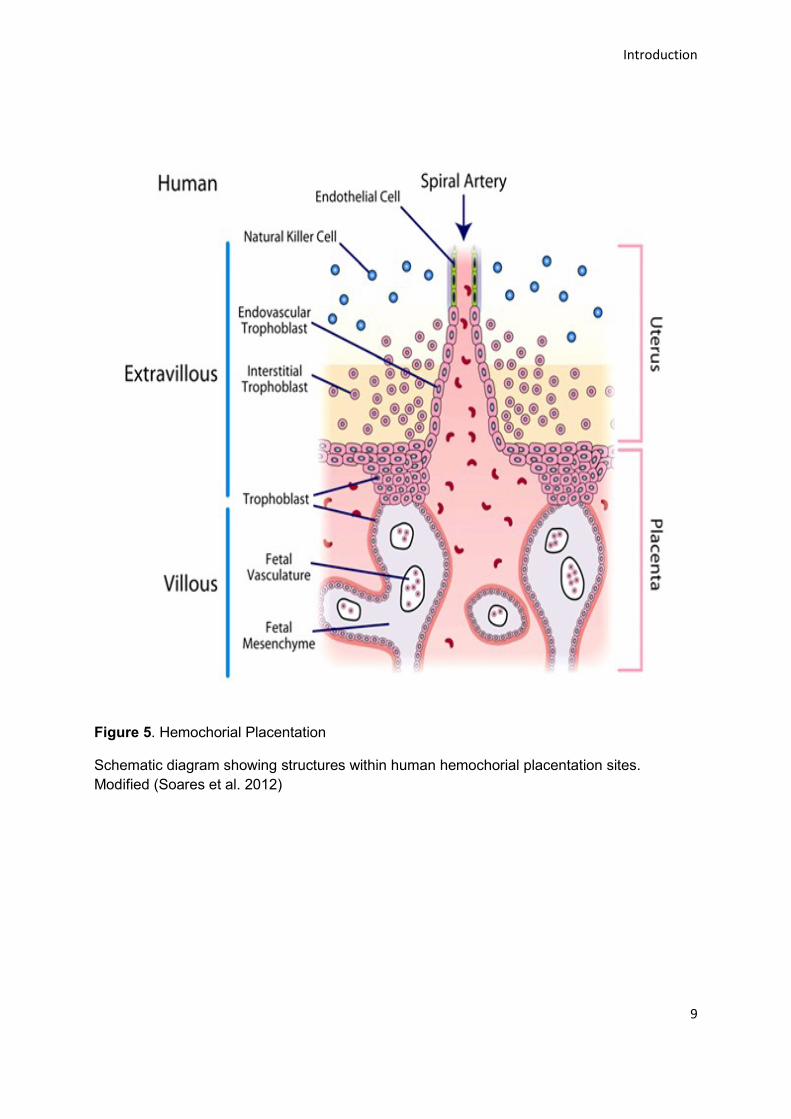
Figure 5. Hemochorial Placentation
Schematic diagram showing structures within human hemochorial placentation sites.
Modified (Soares et al. 2012)

Introduction
10
1.5 Soluble factors involved in pregnancy: hormones, growth
factors, cytokines
A large number of hormones, growth factors and cytokines (Figure 6) are produced
by both the pre-implantation embryo and the maternal endometrium: hormones like
HCG, progesterone, growth factors like TGF, cytokines and receptors (Duc-Goiran et
al. 1999). Pregnancy hormones are important for maintenance of the corpus luteus
acting on luteotropic hormone that stimulates the production of progesterone via
luteinizing hormone-receptors (LHR). Estrogen regulates uNK cells in the
decidualization process, which helps the fetus to attach to the endometrium (Gibson
et al. 2015). Human placental growth hormone (hPGH) and hPlacental lactogen
(hPL) are released into both maternal and fetal circulation. They are found in the
syncytiotrophoblast layer of placenta helping in stimulating the insulin-like growth
factor (IGF) production and modulating metabolism, resulting in increased availability
of glucose and amino acid to the fetus (Handwerger und Freemark 2000).
Growth factor expression/secretion is stimulated by paracrine interactions of diverse
maternal and placental cell types. Predominant growth factors of the fetal-maternal
interface as well as their mutual stimulations are shown in below Figure 6. During the
early stage of blastocyst, epidermal growth factor (EGF) and transforming growth
factor (TGF) are co-expressed with EGF-receptors (EGF-R) suggesting an autocrine
function in human development. Platelet-derived growth factor (PDGF) with its two
receptor subunits, α and β is expressed from 8-cell stage onwards, while blastocyst
secrets IGF factor II (IGF-II) (Srivastava et al. 2013). With the exception of TGFβ all
factors depicted were shown to positively influence trophoblast proliferation and/or
migration/invasion. Some soluble ligands such as HCG may play key roles in
trophoblast motility since several growth factors trigger their secretion and also
promote trophoblast migration through elevation of VEGF and LIF secretion. Hence,
when studying effects of a particular growth factor on trophoblast migration direct as
well as indirect effects must be considered. Colony stimulating factor I (CSF-I),
similar to EGF and TGF, promotes EVT proliferation and stimulates production of
MMPs and TIMPs in EVT. VEGF is synthesized by decidua macrophages and
promotes EVT cell proliferation.

Introduction
11
Cytokines are small multifunctional proteins often derived from leukocytes and have
primarily been described through their immunomodulatory actions. The maternal–
fetal interface is considered to be immunosuppressed to allow development of the
semi-allogeneic placental fetal unit. However, cytokine profiles of the decidua and
different decidual cell types suggest that the situation in vivo might be more complex
than in vitro. Cytokines do not only play a role in immunoregulation, but also in other
aspects of the establishment of pregnancy, including the regulation of trophoblast
invasion and spiral artery remodeling. Dysregulation of decidua-derived cytokines
may be involved in the etiology of unexplained spontaneous miscarriage (Lash und
Ernerudh 2015). Cytokines are regulated at the transcriptional and translational
level, usually leading to an altered proliferation, and differentiation in the target cell.
(Table 1) One of the main functions of cytokines is regulation of inflammation,
typically mediated by Th1 type (pro inflammatory) and Th2 type (anti-inflammatory).
Representative Th1 type cytokines are interleukin 2 (IL-2) or interferon (IFN) γ. Th2
type cytokines are IL-4, IL-10, IL-13 and others.
Table 1. Summary of some assorted cytokine profiles during pregnancy
Name Function
TNF- α (Toder et al. 2003) Activates intercellular signaling in embryonic
development
IFN- γ (Resch et al. 2004) Release of prostaglandins
IL-1 (Prutsch et al. 2012) Interacts with endometrial glandular epithelial
cells, trophoblast cell motility
IL-6 (Prins et al. 2012) Expressed in endometrial stromal cells and
involved in pro-inflammatory reactions,
supports trophoblast invasion
IL-8 (Jovanovic et al. 2010) Trophoblast cell migration and invasion

Introduction
12
Cytokines
BA
Figure 6. Cytokines, Hormones and Growth factors.
Interplay between growth factors expressed at the fetal-maternal interface. Stimulating
(arrows) as well as inhibitory effects on expression / secretion are depicted. Modified (Knofler
2010). B. Cytokines in embryo growth and development (Yessoufou und Moutairou 2011).
1.6 LIF in pregnancy
Leukemia Inhibitory factor (LIF), is a secreted multifunctional glycoprotein belonging
to the IL-6 super family, regulating various cellular function via binding to the
membrane bound ligand receptor of LIF-receptor (LIFR) and gp130 (Mathieu et al.
2012). Its production is unregulated by progesterone and IL-4, and down regulated
by various inflammatory mediators like IFN-γ. Successful embryo implantation
depends on an ideal cross talk between embryo and receptive endometrium which
includes bilateral secretion and reception of LIF. It is produced by endometrium and
blastocyst regulates growth and development of the embryo, There are three splice
variants of LIF, which include diffusible, membrane-associated and truncated forms
acting in paracrine fashion (Aghajanova 2004). Throughout the period of
implantation, ovarian steroids regulate the expression of LIF, LIFR and gp130 in
utero (Sherwin et al. 2004). In human, TGF-β and HCG increase LIF secretion by
endometrial epithelial cells form follicular and secretory phase during menstrual cycle

Introduction
13
(Perrier d'Hauterive et al. 2004). LIF stimulates stromal decidualization by increasing
the production of cytokines and prostaglandins.
LIF is also involved in enhancing embryo-endometrial interaction through pinopodes
and adhesion molecules by stimulating trophoblast cell differentiation and increasing
trophoblast capability to invade the uterine stroma. LIF acts as a pro-inflammatory
cytokine and its decrease is involved in recurrent miscarriages’ (Bischof und
Irminger-Finger 2005) (Bischof und Irminger-Finger 2005). Noteworthy, LIF plays vital
role in recruitment of a specific cohort of leucocytes which participates in
inflammatory response during implantation. There are numerous factors (Figure 7)
which are influenced due to the presence and absence of LIF during embryo and
endometrial interaction, such as: heparin binding-epidermal growth factor (HB-EGF),
epiregulin, amphiregulin, estrogen, progesterone, interleukins (e.g. IL-5, IL-6),
prostaglandins (e.g. E2), cyclooxygenase (Lee et al. 2011b), NK cells, peroxisome
proliferator-activated receptor, HCG or mucin (which is a glycocalyx expressed at the
apical membrane of luminal epithelial and its expression is reduced during
trophoblast invasion) (Sharma und Kumar 2012), junctional adhesion molecules (Su
et al. 2012), Matrix metalloproteins (MMPs) and Tissue inhibitory proteins (TIMPs)
(Wang et al. 2002a);(Song et al. 2000);(Salleh und Giribabu 2014) as shown in
(Figure 7).

Introduction
14
Figure 7. Summary of the known roles of LIF in embryo implantation.
LIF increases the expression of implantation genes in receptive endometrium. Modified
(Salleh und Giribabu 2014).
1.7 Signaling network-mechanism
During human pregnancy, implantation and invasion of placental trophoblast into
uterine wall is an essential event which is remarkable, flexibility of the trophoblast in
fulfilling various functions such as secretions of hormones, anchorage of the
placenta, modulating the decidual angiogenesis/ morphogenesis and spiral artery
remodeling of maternal tissues, which requires increase blood flow (Knofler 2010).
These processes are mediated by a complex network of signaling and adhesive
factors (Massuto et al. 2010). Several extracellular stimuli (Table 2) initiate
intracellular signal transduction upon interaction with receptor tyrosine kinase (RTKs),
G-coupled receptors (GPCRs) and others, which ultimately leads to the activation of
critical signaling cascades.

Introduction
15
Table 2. Summary of signaling pathways in human
(Soncin et al. 2015); (Knofler 2010); (Gundogan et al. 2011); (Busch et al. 2009).
Signaling factor Cell/Tissue Type Function
FAK First trimester CTB Increased differentiation into EVT
HGF/c trophoblast Promotes EVT migration
Notch First trimester CTB and explants Variable effects (ECM-dependent)
PKA Term CTB Promotes STB differentiation
PI3K/Akt Third trimester cell line Promotes EVT migration
PPARγ First trimester and term CTB Inhibit invasion of EVT, promotes STB differentiation
Wnt Choriocarcinoma cell line, first trimester CTB
Promote cell-cell fusion and stimulates migration/invasion of EVT
Activin/Nodal First trimester Inhibits cell invasion, proliferation and differentiation of EVT anchoring, induce apoptosis
mTOR Immortalized first trimester trophoblast
cell
Mediates trophoblast invasion
through MMP
To understand the molecular networks involved in regulating an immune response,
the cytokine receptor signaling and transduction pathways have been extensively
studied and reported. Cytokines are regulators of embryogenesis and participate in
inflammation triggering the onset of labor in late pregnancy (Orsi 2008). The Janus
kinase/signal transducer activator of transcription (JAK/STAT) signaling network
provides a very fast intracellular signal from a receptor to the nucleus. JAK/STAT
consist of three main components: 1. Receptors, 2. Janus kinases, 3. STATs. The
receptors are triggered by growth factors, interferon, interleukins and other chemical
messengers which thereby, further activates JAK upon auto phosphorylation (SH2
domain binding) which then activates the STATs (SH2-domain possessing protein
binds to the phosphorylated receptor, in turn STAT becomes phosphorylated
(Aaronson und Horvath 2002). STATs are described as ligand-induced transcription
factors (Darnell et al. 1994);(Darnell 1997);(Murray 2007).
Introduction
16
Encoding genes and alternative post translational proteolytic cleavage generate
additional forms (Jatiani et al. 2010) of STAT1, STAT2, STAT3 (Schaefer et al.
1995), STAT4 (STAT-4α and STAT-4β) and STAT5 (STAT-5a and STAT-5b) (Lin et
al. 1996). EVT cells resemble tumor in their invasive and destructive properties,
mainly during first trimester of pregnancy. LIF provides an extracellular signal
stimulating invasion in trophoblast cells and induces STAT3 DNA binding activity in
choriocarcinoma cells. STAT3 phosphorylation correlates with trophoblast
invasiveness (Corvinus et al. 2003); (Poehlmann et al. 2005a). IL-11 activates STAT3
in choriocarcinoma cells and increases invasion (Suman et al. 2009). STAT3
activation induces expression of suppressors of cytokine signaling (SOCS3). Its
absence is lethal to the embryo due development of placental insufficiency, hence
SOCS3 seems to be important for pregnancy by regulating LIF-driven trophoblast
differentiation (Fitzgerald et al. 2009). STAT3 activation is sustained by IL-10
expression in trophoblast cells resulting in increased cell motility (Dallagi et al. 2015).
1.8 Pathologies in pregnancy
To achieve successful pregnancy, it requires well-coordinated implantation of the
embryo into the receptive decidua, placentation, trophoblast invasion of the maternal
decidua and myometrium in addition to remodeling of the uterine spiral arteries.
Failure of any of these steps can lead to a range of pregnancy complications,
including miscarriage, infertility, pre-eclampsia, inter-uterine growth restriction
(IUGR), placenta accrete, placenta previa, pre-term birth (PTB), pre-term labor (PTL)
(Lash und Ernerudh 2015) or choriocarcinoma. Recurrent pregnancy loss (RPL)
(Shahine und Lathi 2015); (Gammill et al. 2015) is a multifactorial condition of 3 or
more consecutive pregnancy losses that affects 1-5% couples. Infertility is a very
common complication defined as the inability to establish successful pregnancy
within a certain period of time. Preterm birth is defined as before 37th week of
pregnancy, which in worse cases may cause neonatal death or long term handicaps
infants (Simons und Schatz 2012), It may be induced by insufficient trophoblast
invasion (Hoesli et al. 2002). IUGR is a complicated disorder with varying etiology in
pregnancy, characterized by failure of the embryo to accomplish its normal growth,
hence resulting in morbidity and cardiovascular disease in adult life, it is mainly
associated with placental dysfunction (Gourvas et al. 2012).

Introduction
17
Preeclampsia is defined as high blood pressure, proteinuria and inflammation with an
onset in the second half of pregnancy, it may occur as a result of abnormal
placentation (Figure 8) due to loss of trophoblast differentiation. It has a high
incidence in developed countries (Scioscia et al. 2015); (Sifakis et al. 2015).
Choriocarcinoma is a rare but an aggressive and destructive malignant form of
trophoblastic neoplasm that is associated with distant metastasis (Emin et al. 2015);
(Froeling und Seckl 2014), it arises from hydatidiform mole, hyperplasia of
trophoblast and villous cistern formation (Feist et al. 2015), although choriocarcinoma
is not common in Europe or US but its prevalence is found ten times higher in Asian,
African and south American countries. All gestational trophoblastic diseases (GTD)
produce HCG, which often serves as diagnostic tool being a good parameter for
progress of the disease or success of therapy (Khoo 2003).
Figure 8. Pathology during pregnancy
Trophoblast invasion into the spiral arteries in the placental bed in normal pregnancy and in
preeclampsia, modified (VanWijk et al. 2000).
Introduction
18
1.9 PIM kinases
Proviral insertion sites in moloney murine leukemia virus or PIM genes were
identified as oncogenes in mid 1980s nearly three decades ago. PIM proteins
belonging to serine/threonine kinases family consist of three different isoforms (PIM1,
PIM2 and PIM3) and are highly evolutionary conserved (Narlik-Grassow et al. 2014);
(Nawijn et al. 2011).
1.10 Structure and Function
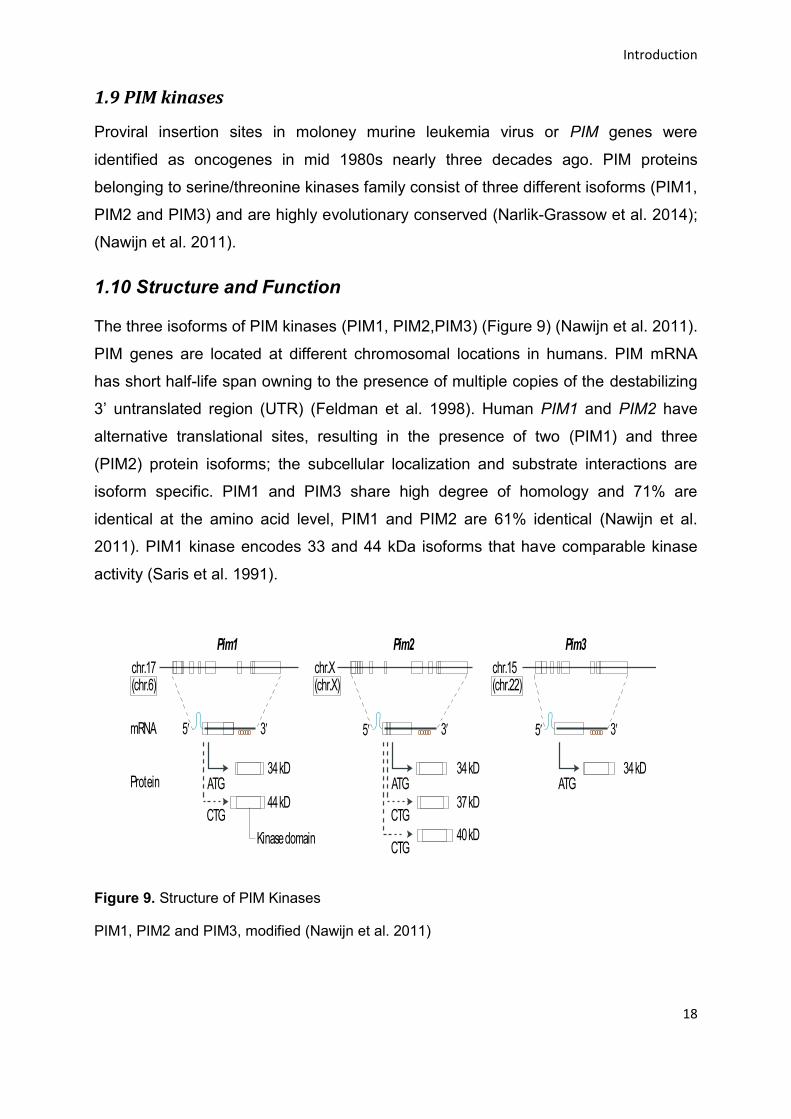
The three isoforms of PIM kinases (PIM1, PIM2,PIM3) (Figure 9) (Nawijn et al. 2011).
PIM genes are located at different chromosomal locations in humans. PIM mRNA
has short half-life span owning to the presence of multiple copies of the destabilizing
3’ untranslated region (UTR) (Feldman et al. 1998). Human PIM1 and PIM2 have
alternative translational sites, resulting in the presence of two (PIM1) and three
(PIM2) protein isoforms; the subcellular localization and substrate interactions are
isoform specific. PIM1 and PIM3 share high degree of homology and 71% are
identical at the amino acid level, PIM1 and PIM2 are 61% identical (Nawijn et al.
2011). PIM1 kinase encodes 33 and 44 kDa isoforms that have comparable kinase
activity (Saris et al. 1991).
chr.17(chr.6)
chr.X(chr.X)
chr.15(chr.22)
mRNA 5 3 5 3 5 3
ATG
CTG
Protein
Nature Reviews | Cancer
Pim1 Pim2 Pim3
34 kD 34 kD
44 kD 37 kD
40 kD
ATG
CTG
34 kDATG
CTGKinase domain
Pre-B cell lymphomas
Hyperplastic growth and
transformation of large pre-B
cells owing to the accumulation
of mutations that affect their
ability to keep pre-B cell
receptor and MYC levels at
bay.
Kozak sequence
The consensus gccRccAUGG (R
represents a purine) sequence
in the 5 region of eukaryotic
mRNA that is the optimal
ribosomal-binding site and
facilitates initiation of
translation.
Primary response gene
PRG. Upon mitogenic stimuli,
upregulation of PRG
transcription is rapid but
transient and does not require
de novo protein synthesis.
Most PRGs are transcription
factors and propagate
signalling by regulating
expression of a cascade of
downstream secondary target
genes.
For example, tumour outgrowth is substantially accelerated
in Eμ–Pim1 mice carrying two copies of this transgene,
and Pim1-transgenic mice carrying an optimized Kozak
sequence to promote efficient Pim1 expression could
not be maintained as a transgenic line because the mice
succumbed to lymphomas before they could reproduce
(A.B., unpublished observations).
The strong dependency of MYC-induced lympho-
mas on the expression of Pim family kinases was further
illustrated by MuLV insertional mutagenesis (FIG. 2) in
Pim1-deficient Eμ–Myc-transgenic mice, in which pro-
viral activation of Pim2 occurred in 90% of the tumours
and tumour latency was prolonged9,10. Moreover, inser-
tional mutagenesis on a Pim1;Pim2-deficient back-
ground resulted in the proviral activation of Pim3, a
gene not previously found to be provirally activated in
a Pim1- or Pim2-proficient background9, emphasizing the
strong selective advantage associated with the activation
of genes that can substitute for Pim1 and Pim2.
Regulation of Pim kinase activityPim kinases are constitutively active11,12, and the induc-
tion of PIM kinase activity is largely regulated at the
transcriptional and translational levels. The signals that
induce PIM gene expression are diverse, and cell type
dependent. Normally, Pim kinases are broadly expressed
in haematopoietic13–15, neuronal16,17, vascular smooth
muscle18, cardiomyocyte19, endothelial20 and epithelial
cell lineages21,22, as well as in early progenitors of some
of these cells types23,24, and in embryonic stem (ES)
cells14,20,25.
Regulation of Pim gene expression and translation.
Pim genes generally display characteristics of primary
response genes (PRGs) that are induced by the activation
of transcription factors downstream of growth factor sig-
nalling pathways, such as the Janus kinase and signal
transducer and activator of transcription (Jak–STAT)
pathway26–30 and nuclear factor-κB (NF-κB; also known
as NFKB1)31,32. Of special interest for the role of Pim
kinases in solid tumours is the recent observation that
hypoxia induces PIM1 expression, in a hypoxia-inducible
factor1α (HIF1α)-independent manner33,34. Finally, one
study reported that Krüppel-like factor 5 (KLF5) induces
PIM1 expression upon DNA damage, thereby protecting
cells from apoptosis35.
Pim mRNA transcripts have a short half-life owing
to the presence of multiple copies of the destabiliz-
ing AUUU(A) sequence in the 3 untranslated region
(UTR)15,36 (FIG. 1). The dominant effect of the 3 UTR on
PIM protein levels is reflected by the proviral activation
At a glance
• Pim kinases are frequently overexpressed in human haematological malignancies and
solid cancers, and they are often associated with strongly elevated MYC levels.
• Overexpression of Pim kinases is associated with a good prognosis in some solid
cancers, such as prostate cancer, but is associated with a poor prognosis in other
solid cancers and most haematological malignancies.
• Pim kinases are serine/threonine kinases that have consititutive activity (and therefore
lack the need for post-translational activation). As their mRNA and proteins have a
very short half-life, the activity of Pim kinases is largely regulated at the transcriptional
and translational levels.
• Pim kinases mediate survival signalling through phosphorylation of BCL-2-associated
agonist of cell death (BAD), which induces release of the anti-apoptotic BCL-2 and
BCL-2-like 1 (also known as BCL-X) proteins and thus lowers the threshold for
apoptosis. Pim kinases might also induce BAD activities towards the regulation of
glucose metabolism.
• PIM2 can regulate cap-dependent translation in a mammalian target of rapamycin
complex 1 (mTORC1)-independent manner, and in parallel to the PI3K–Akt pathway.
This activity has been found to be relevant for certain human haematological
malignancies, and is not shared with PIM1 or PIM3.
• PIM1 can bind to MYC–MAX complexes and phosphorylate H3S10 at E-boxes, thereby
setting off a cascade of events that leads to transcriptional pause release of RNA
polymerase II at MYC-driven promoters. It remains unknown whether this activity
contributes to tumorigenesis in vivo or whether other Pim family members share this
activity with PIM1.
• Pim kinases are promising targets for pharmacological inhibition, as the structural
conformation of the ATP-binding pocket in the active site is different from that of
other protein kinases, which in theory should allow the design of specific and
selective inhibitors. The lack of any overt phenotypes in Pim1–/–;Pim2–/–;Pim3–/– mice
indicates that such drugs might have a low toxicity profile.
Figure 1 | Pim genes, transcripts and proteins. Pim genes are located at different chromosomal locations in the mouse
and human genome, as indicated by black numbers and numbers in orange boxes, respectively. Pim mRNA transcripts are
encoded by 6 exons (dark blue boxes) with large 5 and 3 untranslated regions (UTRs; white boxes) containing a G/C-rich
region (light blue lariat) and five copies of AUUUA destabilizing motifs ( orange circles), respectively15. Different protein
isoforms are synthesized using alternative translation initiation sites (solid and dashed arrows) and additional codons
present at the 5 of these mRNAs are depicted as light blue boxes. PIM protein isoforms have different molecular masses
but retain their serine/threonine kinase activity43. Pim kinases have no regulatory domains and their highly conserved
kinase domain is indicated by a white box. The Pim family of serine/threonine kinases has a high degree of homology —
PIM1 and PIM3 are 71% identical at the amino acid level, and PIM1 and PIM2 are 61% identical (not shown)15.
REVIEWS
24 | JANUARY 2011 | VOLUME 11 www.nature.com/reviews/cancer
© 2011 Macmillan Publishers Limited. All rights reserved
Figure 9. Structure of PIM Kinases
PIM1, PIM2 and PIM3, modified (Nawijn et al. 2011)

Introduction
19
The larger isoform localizes to the plasma membrane whereas the shorter isoform is
primarily localized in the nucleus (Xie et al. 2006). PIM1 is highly expressed in
hematopoietic, gastric, head and neck tumors (Bachmann et al. 2006). PIM2 has
three isoforms (34, 37, and 40 kDa), with no protein functions or interaction reported
so far and is highly expressed in lymphoid and brain tissues (Cohen et al. 2004).
PIM3 kinase has only one isoform (Nawijn et al. 2011) and is highly expressed in
kidney, breast and brain tissues.
1.11 Signaling pathways mechanism
PIM kinases are mainly responsible for cell cycle regulation, anti-apoptotic activity
and the homing and migration of receptor tyrosine kinases mediated via the cytokine
dependent JAK/STAT pathway (Blanco-Aparicio und Carnero 2013) and NFKB (Zhu
et al. 2002). PIM kinase gene expression is described in many cell types such as in
neuronal, hematopoietic, endothelial, vascular smooth muscle, epithelial cell lineages
(Gapter et al. 2006), cardiomyocytes, as well as in early progenitors cells (Cottage et
al. 2010) and embryonic stem cells (Fischer et al. 2011); (Cottage et al. 2012). The
PIM kinase gene expression is largely regulated at the transcriptional and
translational level. PIM kinases act downstream of multiple oncogenic tyrosine
receptors, Janus kinase (JAK) (Wernig et al. 2008) and FMS-like tyrosine 3(FLT3)
(Kim et al. 2005). JAK/STAT pathways play a critical role in regulation of the
expression of PIM genes and represent alternatives to the secondary messenger
signaling. When cytokines bind to a cell membrane receptor, JAKs phosphorylate
the receptor domain in the cytoplasm, creating an intracellular binding site for STATs
which in turn bind to phosphorylated JAK, leading to STAT dimer formation and
translocation into the nucleus, where STATs induce transcription.STAT3 specifically
binds to promoter sequences of PIM1, enhancing its transcription and expression in
response to a variety of cell mitogens such as interleukins and growth factors.
Interestingly, PIM activates SOCS proteins and functions as part of negative
feedback mechanism that serves to restraint JAK/STAT network (Peltola et al. 2004).
At the translational level the expression of PIM kinases is mainly regulated by the
stability of mRNA. PIM mRNA transcripts have very short half-life as mentioned
earlier and due to which the AUUU(Haig 1993) sequence located in the 3’ UTR is
destabilized.
Introduction
20
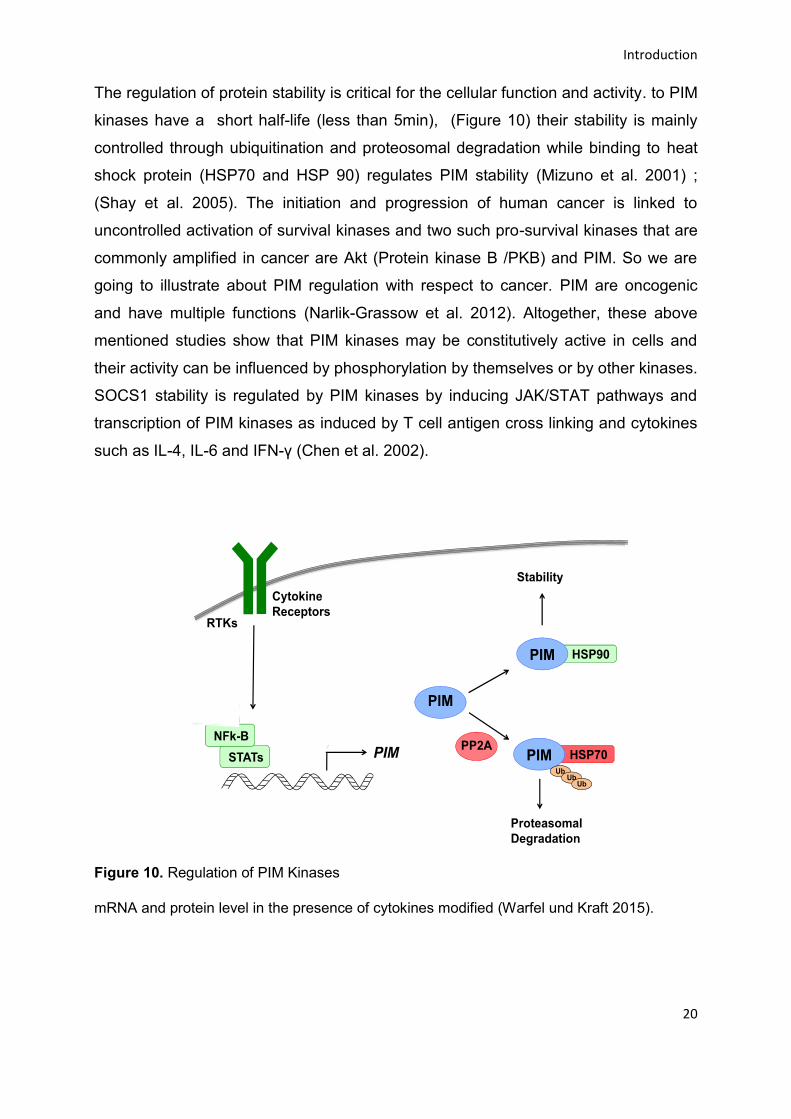
The regulation of protein stability is critical for the cellular function and activity. to PIM
kinases have a short half-life (less than 5min), (Figure 10) their stability is mainly
controlled through ubiquitination and proteosomal degradation while binding to heat
shock protein (HSP70 and HSP 90) regulates PIM stability (Mizuno et al. 2001) ;
(Shay et al. 2005). The initiation and progression of human cancer is linked to
uncontrolled activation of survival kinases and two such pro-survival kinases that are
commonly amplified in cancer are Akt (Protein kinase B /PKB) and PIM. So we are
going to illustrate about PIM regulation with respect to cancer. PIM are oncogenic
and have multiple functions (Narlik-Grassow et al. 2012). Altogether, these above
mentioned studies show that PIM kinases may be constitutively active in cells and
their activity can be influenced by phosphorylation by themselves or by other kinases.
SOCS1 stability is regulated by PIM kinases by inducing JAK/STAT pathways and
transcription of PIM kinases as induced by T cell antigen cross linking and cytokines
such as IL-4, IL-6 and IFN-γ (Chen et al. 2002).
Figure 10. Regulation of PIM Kinases
mRNA and protein level in the presence of cytokines modified (Warfel und Kraft 2015).
Introduction
21
1.12 PIM kinases in Cancer
PIM kinases play important roles in regulating tumor cell proliferation by influencing
cell cycle progression via p21 (Zhang et al. 2007), p27 (Wang et al. 2002b), p53
(Hogan et al. 2008) and CDC25C (Bachmann et al. 2006). One of the primary
machineries of survival and apoptosis for PIM kinases is elicited through their pro-
survival effect via the Bcl-2 family members, that has both pro-apoptotic (BAD and
BAX) and anti-apoptotic (BCL-2 and BCL-XL) effects, where PIM kinases
phosphorylate the BAD at ser 112, which disrupts the association with BCL-2,
promoting binding and retention in the cytosol (Yan et al. 2003), hence resulting in
anti-apoptotic activity. PIM kinases also inhibit the activation of CASP 3 and 9 (Chen
et al. 2009b) (Chen et al. 2009a). The expression of PIM kinases in cancer is
sufficient and converges to control the mTOR signaling pathway axis via upstream
and downstream effectors (Sengupta et al. 2010); (Beharry et al. 2011).
All the three isoforms of PIM kinases were reported to be genes co-activated with
myc in murine lymphoid tumors (Nawijn et al. 2011). Overexpression of PIM kinases
has been reported in a variety of human tumors. PIM1 expression is correlated to
aggressive tumors and despite its frequent presence in human cancers, it is
considered as weak oncogene. Studies in mice have shown though the incidence of
tumor is evident but the oncogenic activity is low. However, the expression of PIM
kinases is found to be enhanced in human prostate cancer cell lines (Kim et al.
2010). The most interesting evidence supporting the cooperative property of PIM
kinases is explained by their synergism with c-MYC. MYC is a proto-oncogene, which
upon overexpression results in apoptosis in normal cells. PIM kinases contribute to
tumorigenesis by enhancing MYC regulated signaling pathways. PIM kinases are
most evident in myeloid leukemia like acute myeloid leukemia (AML) (Natarajan et al.
2013). PIM is reported to mediate several B cell tumors, including B cell non-
Hodgkin’s lymphoma (NHL), Burkits lymphoma and multiple myeloma. PIM2
overexpression leads to progression of tumor (Hiasa et al. 2015), PIM and PIM3
kinase are increased in lymphoproliferative diseases associated with Epstein bar
virus (EBV). Microarray analyses and immunohistochemical reports have shown that
PIM isoforms are elevated in several tumors, including pancreatic (Li und Mukaida
2014), gastric (Yan et al. 2012), renal (Mahalingam et al. 2011), hepatocarcinoma
(Leung et al. 2015); (Endo et al. 2007) and colon cancers (Peng et al. 2013).

Introduction
22
The PIM1/STAT3 signaling pathway plays a critical role in endothelial differentiation
(Iwakura et al. 2011).
STAT
LIF
Pimkinases(pim1,Pim2,Pim3)
Cellsurvival
Extra-cellularMembrane
Intra-cellularMembrane
Apoptosis
Figure 11. Schematic representation of PIM kinases in cell survival and apoptosis.
1.13 Stem cells
Discovery of stem cells was a team effort in 1963. Later in the 1980s the research
was coined and from there on, it has been a boom to the world of science aiming to
solve many diseases and pathologies (Thomson et al. 1998). Stem cells is the
undeveloped or undifferentiated biological cell, that can differentiate and divide
(mitosis) into new specialized cells which possess the ability of unlimited proliferation,
self-renewal and generation of new tissues. The two main types of stem cells are 1.
Embryonic stem cells (ESC) and 2. Non-embryonic stem cells. From (Figure. 12)
embryonic stem cells have the property of being pluripotent or totipotent due to their
nature to differentiate into new cell type. Non-embryonic stem cells (non-ESC) are
multi-potent as these cells have a more limited potential to differentiate into various
cell types.

Introduction
23
ESC have a great ability to spontaneously differentiate and are more prevalent as
non-ESC (Thomson et al. 1995); (Thomson und Marshall 1998); (Tuch 2006). ESC
cells are obtained from the inner cell mass of blastocysts, which is formed in the
initial days of pregnancy, when the blastocyst implants the uterus. These stem cells
derived from human blastocyst have normal karyotype, express cell surface markers
and have high telomerase activity. Under favorable microenvironment these cells
contribute to the formation of three germ layers, namely endoderm, mesoderm and
ectoderm. There are two distinct subtypes of blastocyst derived stem cells: 1. ESC
and 2. Trophoblast stem cell (TSC). TSC help to study trophoblastic development,
which could provide important information for managing pregnancy related
pathologies in human (Tanaka et al. 2014).
Figure 12. Schematic representation of blastocyst derived stem cells
Modified (Landry und Zucker 2004)

Introduction
24
1.14 Cancer stem cell (CSC)
ESC and TSC can be characterized by the presence of transcription factors
responsible for the stemness and by cell surface proteins which support maintaining
stem cell properties. It has been reported (Figure. 13) that TSC have the ability to
differentiate into embryonic lineages which may enact as tumor cells. (Lansdown und
Rees 2011); (Shih Ie 2011); (Sivasubramaiyan et al. 2009). Cancer stem cells (CSC)
were first reported in acute myeloid leukemia (AML) expressing CD34 (Lapidot et al.
1994). They a rare population of cells which has indefinite potential for self-renewal
driving tumorigenesis (Reya et al. 2001).
Figure 13. Schematic representation of the cell heterogeneity in stem cells
Normal cancer cells and cancer stem cell population, modified (Reya et al. 2001)
During blastocyst implantation and invasion, trophoblast cells differentiate in a
fashion mimicking cancerous cells and during cancer progression there is similar
behavior of cell differentiation and proliferation as during blastocyst implantation and
invasion. CSC is involved as a subpopulation of tumor cell. CSC and TSC are used in
research aiming to treat pathologies and diseases which might give valuable
information to find novel treatments.

Introduction
25
SOX2, Oct-4, NANOG and CDX2 are transcriptional factors essential to maintain
self-renewal and undifferentiated stem cells. The expression of surface molecules
characterizes stem cells, such as CD44 (multi structural and multifunctional cell
surface molecule which is involved in cell differentiation, cell migration, cell
proliferation), CD24 (cell adhesion molecule), CD34 (cell adhesion factor and cell
migration) and CD133 (involved in stem cell differentiation and cell invasion).
1.15 3D culture-Spheroid
The 3-dimentional (3D) cell culture system is an artificial environment where
biological cells are allowed to grow and interact with their surrounding 3-
dimensionally. Living tissue cells exist in 3D microenvironment with cell-cell and cell-
matrix communication and complex transport machinery for nutrients for the growth
of cells. When cells are grown on non-adherent surfaces they may form spheroid
structures that mimic the 3D environment. 3D culture systems reflect the complexities
of tissues more realistic than conventional 2D systems (Friedrich et al. 2009).
1.16 PIM kinases -LIF-Stem cell-trophoblast
As it is stated previously PIM kinases are mainly regulated by the cytokine dependent
JAK/STAT pathway. LIF is one of the important factors playing a crucial role during
implantation, placentation, trophoblast formation and invasion, migration and
proliferation and signals via the JAK/STAT pathway. Pluripotency is supported by
PIM kinases (PIM and PIM3) (Aksoy et al. 2007); (Iwakura et al. 2011). PIM3 kinase
regulates STAT3 signaling which inhibits cell proliferating in human liver cancers
(Wang et al. 2014). PIM kinases are found to support the propagation of
mesenchymal stem cells (Zhao et al. 2014) and PIM1 kinase in rejuvenation of
human cardiac progenitor cells (Mohsin et al. 2013).
Hence these above mentioned data triggered and lead to the aim of this study.

Objective
26
CHAPTER 2 OBJECTIVE
To characterize PIM kinase functions and the stem cell like properties of trophoblastic
cells.
2.1 Part I
To identify PIM kinases in trophoblastic cells.
To analyze the effect of LIF stimulation on trophoblastic cells.
To investigate the functional effects of a chemical inhibitor for PIM kinase.
2.2 Part II
To characterize the spheroids formation of HTR8/SVneo cell that resembles their
Cancer stem cell (CSC) like properties.
To analyze the effect of cytokines stimulation on the formed spheroids.

Objective
27
2.3 Experimental Design Part I

Objective
28
2.4 Experimental Design Part II

Materials and Methods
29
CHAPTER 3 MATERIALS AND METHODS
3.1. Part I
3.1.1 General Procedure
All investigations were carried out by applying different methods and were performed
at least three times. Information regarding each method has been described below,
followed by materials and further specific information on individual methods.
3.1.2 Reagents and antibodies or compounds
Antibodies against PIM1, PIM2 and PIM3 kinase, BCL-XL, phospho-BAD, BAD,
CASP3, cleaved CASP3, cleaved PARP, phospho-c-MYC, c-MYC, GAPDH, alpha
tubulin, and HRP secondary antibody, were purchased from Cell Signaling
Technologies (UK). Recombinant Human Leukemia Inhibitory Factor (LIF) was
purchased from Merck Millipore (Germany). SGI-1776 a chemical inhibitor for PIM
kinases was purchased from Merck Millipore (Germany).
3.1.3 Ethical aspects
Experimental investigation of placentae was performed based on a vote of the local
ethics committee at the Friedrich-Schiller University Jena. All analyzed placentae
were destined for disposal.
Table 3. Culture conditions and Cell line conservation
Cell line Culture
properties
Organism Morphology Biosafety
level
Origin Tissue
Primary
trophoblast
cells
Adherent Human Epithelial 2 First or third
trimester
Placenta
HTR8/SVneo
(GrahamCH,’93)
Adherent Human Fibroblast 1 Immortalized
primary
trophoblast cell
Placenta
JEG-3
(Kohler’70)
Adherent Human Epithelial 1 Choriocarcinoma Placenta

Materials and Methods
30
The immortalized human primary trophoblast cell line HTR8/SVneo was a kind gift from Dr.
Charles Graham, Ontario, Canada, the choriocarcinoma cell line JEG-3 was obtained from
ATCC® HTB-36™. Both cell lines were maintained in the recommended tissue culture
media supplemented with 10% fetal bovine serum (FBS) (Sigma Aldrich, Steinheim,
Germany), 1000 U/ml penicillin and streptomycin (Life technologies, Grand Island, New
York, USA). Cell lines were verified as authentic and were tested for mycoplasma
contamination on a quarterly basis using mycoplasma kits (INtRON biotechnology Inc.
Sungnam, Korea), which were found to be negative. All cells were grown under
standardized conditions (37°C, 5% CO2, humidified tissue culture incubator). HTR8/SVneo
(monolayer) were cultured in RPMI medium (Life technologies) and JEG-3 (monolayer)
was cultured in Hams F12 media (Life technologies).
3.1.4 Isolation of primary trophoblast cells
The primary trophoblast cells were isolated from term placenta tissue not more than 1 h
following collection. The protocol for isolation was adapted and modified from (Kliman et
al. 1986) and (Moore et al. 1997) in our Placenta Laboratory. In brief, placenta tissue was
cut into small pieces followed by a washing step in sterile 1X PBS to remove blood as
much as possible. Tissue was transferred into a new tissue culture flask. The obtained
tissue samples were digested enzymatically with a mixture of collagenase, proteases and
DNase for 30 min at 37° C. After a washing step the isolated cells were separated by a
Percoll gradient (Percoll, Pharmacia, Sweden) and centrifuged at 100 g for 10 min. The
layer within the 25% Percoll was carefully collected and washed. To avoid contamination
RNA lysis buffer was added to the collected isolated cells.
3.1.5 RNA extraction, PCR and quantitative real-time PCR
Total cellular RNA was extracted using TRIZOL reagent (Invitrogen, Darmstadt, Germany)
and quantification of total RNA was determined by Nano Drop ND-1000
spectrophotometer (PeqLab Biotechnologies GmbH, Erlangen, Germany). Samples with
purity ratio more than 1.8 at A260/A280 were stored at -80°C. cDNA was generated from
150 ng-300 ng of DNase-free RNA using Maxima Reverse Transcriptase (Thermo Fisher
Scientific Biosciences GmbH, Waltham, MA, USA) as per manufactures’ instructions.
Reverse transcription (RT) was performed using a thermocycler (Eppendorf, Germany).

Materials and Methods
31
Amplification reactions were set up in a reaction volume of 20µL by use of Dream Taq
DNA Polymerase (Thermo Fisher Scientific Biosciences GmbH, Waltham, MA, USA) and
real time quantitative polymerase chain reaction was performed using SYBR green master
mix with ROX reference dye (Thermo Fisher Scientific Biosciences GmbH, Waltham, MA,
USA) in a Real-time PCR machine Stratagene Mx3005P (Agilent Technologies Inc., Santa
clara, CA, USA). PCR primers were self-designed using software tools NCBI, genome
browser, Primer3 and the specificity were confirmed using Keinefold and InsilicoPCR
UCSC genome browser respectively. The applied concentrations ranged from 0.1 μM up
to 1 μM, followed by a gradient PCR and real time PCR. Briefly, HTR8/SVneo and JEG-3
were cultured and seeded in 6 well plates at a density of 4.5x10⁵ cells/well, followed by
incubation until 24 h to reach 80% confluence and cells were stimulated with LIF
(10ng/mL). Highly purified salt-free primers for the target genes PIM1 PIM2 and PIM3
(Sigma Aldrich Germany) have been designed and optimized to an equal annealing
temperature of 60°C. PCRs were optimized in a Thermo cycler (Master cycler Gradient,
Eppendrorf, Germany) with regard to Dream Taq.
Table 4. Primer Details
Gene Name
(PCR Product)
Primer sequence Gene ID
PIM1(109bp)
Fwd 5’CATCCTTATCGACCTCAATCG-3’
NM_001243186.
1 Rev 5’TATACACTCGGGTCCCATCG-3’
PIM2 (107bp)
Fwd 5’TCACAGATCGACTCCAGGTG-3’
NM_006875.3 Rev 5’CATAGCAGTGCGACTTCGAG-3’
PIM3 (128bp)
Fwd 5’ATGCTGCTCTCCAAGTTCGGCTCCCTGGCG-3’
NM_001001852.
3
Rev 5’ TCCTGTGCCGGCTCGGGTCGCTCCAGCACC 3’
HMBS (281bp)
Fwd 5’ GAAATCATTGCTATGTCCACCAC 3’
NM_008093.1 Rev 5’ CTTCCCACCACACTCTTCTC 3’
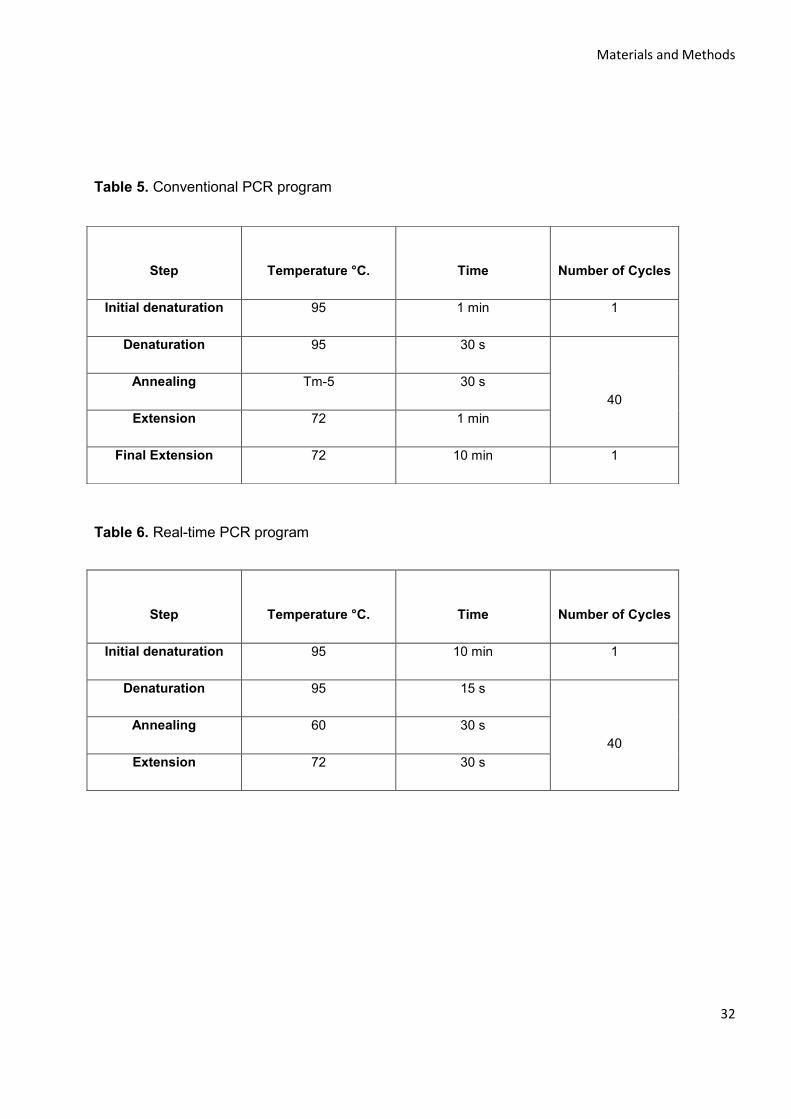
Materials and Methods
32
Table 5. Conventional PCR program
Table 6. Real-time PCR program
Step
Temperature °C.
Time
Number of Cycles
Initial denaturation 95 1 min 1
Denaturation 95 30 s
40
Annealing Tm-5 30 s
Extension 72 1 min
Final Extension 72 10 min 1
Step
Temperature °C.
Time
Number of Cycles
Initial denaturation 95 10 min 1
Denaturation 95 15 s
40
Annealing 60 30 s
Extension 72 30 s

Materials and Methods
33
3.1.6 Gel Electrophoresis
Gel electrophoresis was performed to separate the PCR amplificates. According to the
fragment size 2% agarose gel electrophoreses were prepared with additional 4 µl –
“20,000X Red Safe Nucleic Acid staining solution” (final concentration 1X) (INtRON
biotechnology Inc. Sungnam, Korea). All PCR amplificates were mixed with 6X orange
DNA loading dye (Thermo Fisher scientific, Bioscience, USA) final concentration 1X and
filled into the well pockets of the prepared gels. Detection for the fragment length was
performed by adding 5 µl of the O’GeneRuler 50bp DNA ladder (Thermo Fisher scientific,
Bioscience, USA) and loading on the gel.
Amplificates and ladder were separated with electric field of constant voltage 90 V in an
electrophoresis chamber (PeqLab Biotechnologies GmbH, Erlangen, Germany) filled with
1X Tris-acetate-EDTA buffer (TAE). All separated DNA fragments were visualized using
Ultra violet (UV) light based detection system MF-ChemiBIS 3.2” (Biostep, DNR Bio-
Imaging systems, Jerusalem, Israel) and the corresponding "Gel capture" software
(Version 5.1).
3.1.7 Western blotting
The expression of PIM kinases (PIM1, PIM2 and PIM3) was analyzed by Western blot.
Briefly, cells were seeded in 6 well plates at a density of 4.5x10⁵ cells/well, and each plate
was incubated for 24 h to reach adherence and confluence. Subsequently, after serum
starvation for 4 h, cells were stimulated with or without LIF (10 ng/ml) from 2 minutes until
60 minutes. Then, cells were rinsed with cold phosphatase buffered saline (PBS; 1X; GE
healthcare or PAA, Pasching/Linz, Austria) and harvested. The cells were lysed using Cell
lysis buffer (Cell Signaling Technologies Inc., Beverly, Massachusetts) and lysates were
centrifuged at 10,000 x g for 10 min at 4° C. Protein concentrations of the resulting
supernatant were determined at 660 nm using a Pierce® BCA Protein Assay (Thermo
Fisher Scientific Biosciences GmbH, Waltham, MA, USA). Total protein (20-30µg)
equivalent concentrations of cell lysate protein were boiled for 7 min at 95° C and resolved
in 10-12% SDS PAGE electrophoresis at 60 mA constant for 1 h, followed by protein
transfer to a PVDF membrane (Thermo Fisher Scientific Biosciences GmbH, Waltham,
MA, USA).

Materials and Methods
34
Membranes were blocked with 5 % bovine serum albumin (BSA) in Tris-buffered saline
containing 0.1 % Tween 20 (TBST) for 1 h before overnight incubation at 4° C with various
primary antibodies: anti-PIM1, anti-PIM2, anti-PIM3, anti-BCLXL, anti-phospho-BAD, anti-
BAD, anti-c-MYC, anti-phospho-c-MYC, anti-CASP 3, anti-cleaved CASP 3 and anti-
cleaved PARP, typically at 1:1000 dilution. Blots were rinsed with 1X TBST and incubated
with a secondary antibody anti-rabbit IgG, HRP-linked (Cell Signaling Technologies,
Beverly, Massachusetts) at a dilution 1:10,000 for 90 min at room temperature. Reactive
bands were visualized by exposure to Luminata Forte Western HRP substrate (Merck
Millipore, Billerica, Massachusetts) a chemical reagent for detection.
Expression was quantified by using the ultra-sensitive chemiluminescence gel
documentation system MF-ChemiBIS 3.2” (Biostep, DNR Bio-Imaging systems,
Jerusalem, Israel) and densitometry quantification of the respective band intensities was
performed using Gel capture Total Lab 1000 image program software.
3.1.8 Immunocytochemistry (ICC)
Immunocytochemistry was performed to confirm the localization and distribution of the
expression of PIM kinases in the cell models. HTR8/SVneo and JEG-3 cells were cultured
on super frost plus microscope slides (Thermo Scientific, USA) in slides culture chambers
(NUNC quadri PERM, Germany). Before seeding the cells , cell culture slides were
washed in ethanol (75%) and placed into slide chamber until air dry. 100,000 cells/slides
were seeded and incubated overnight followed by LIF (10 ng/ml) stimulation up to 1 h.
Staining of cells was performed by using Vectastain Elite rabbit IgG kit (Vector
Laboratories, Burlingame, USA). Cells were fixed with methanol/ethanol (1:1) for 5 min
followed by washing steps with 1X PBS and permeabilized and blocked using 10% goat
serum in 0.1% Tween 20 in PBS for 20 min. Cells were washed 3 times in PBS (1X) (GE
healthcare or PAA, Pasching/Linz, Austria) and incubated with 1:100 diluted primary
antibodies anti-PIM1, anti-PIM2, anti-PIM3 (Cell Signaling) or rabbit (DA1E) mAb IgG
Isotype control (Cell Signaling) in antibody diluent (DAKO, Hamburg, Germany) for 1 h.

Materials and Methods
35
Later, the slides with cells were rinsed 3 times with PBS (1X) and incubated with
biotinylated affinity-purified anti-rabbit-IgG (Cell Signaling Technologies) for 30 min,
followed by treatment with a solution of avidin/Biotinylated enzyme complex (ABC; Thermo
Fisher Scientific, Bonn, Germany), followed by 2 min substrate staining with DAB
chromogen (DAKO, Hamburg, Germany), followed by washing in distilled water for 2 min
and finally, by counterstaining with haematoxylin solution for 1 min. The so prepared slides
were dehydrated by ethanol-to-xylene treatment and embedded with Histofluid (Paul
Marienfild, Lauda-Köngshofen, Germany). The images of the slides were visualized on a
Zeiss Axioplan2 microscope (Carl Zeiss, Jena, Germany).
3.1.9 Immunofluorescence (IF)
HTR8/SVneo and JEG-3 cells were cultured on super frost plus microscope slides
(Thermo scientific, USA). Cell culture slides were washed in ethanol (75%) and placed into
a slide chamber until air dry. 100,000 cells/slides were incubated overnight followed by
LIF (10ng/ml) stimulation up to 1 h. Staining of cells was performed by using Vectastain
Elite rabbit IgG kit ( vector Laboratories, Burlingame, USA) where cells were fixed with
methanol/ethanol (1:1) for 5 min followed by washing steps with 1X PBS and
permeabilization and blocking by using 10% goat serum in 0.1% Tween 20 in PBS for 20
min. Cells were washed 3 times in PBS (1X) (GE healthcare or PAA, Pasching/Linz,
Austria) and incubated with the primary antibodies (1:200 dilution) anti-PIM1, anti-PIM2,
anti-PIM3 (Cell signaling) or rabbit (DA1E) mAb IgG Isotype control (Cell Signaling
Technologies) in antibody diluent (DAKO, Hamburg, Germany) overnight at 4 °C. Later,
cells were rinsed 3 times with PBS (1X) and incubated with secondary antibody labeled
with fluorescent Cy3 conjugated goat anti-rabbit-IgG (Dianova GmbH, Hamburg,
Germany) for 1 h at room temperature, followed by the treatment of the solution with
avidin/biotinylated enzyme complex (ABC; Thermo Fisher Scientific, Bonn, Germany), by
DAPI (4', 6-diamidino-2-phenylindole) mounting media staining and embedding. The
images of the slides were visualized on a Zeiss Axioplan2 microscope (Carl Zeiss, Jena,
Germany).

Materials and Methods
36
3.1.10 Incubation of cells with PIM-Kinase Inhibitor IX, SGI-1776
SGI-1776 {N-((1-Methylpiperidin-4-yl)methyl)-3-(3(trifluoromethoxy)phenyl)imidazo[1,2-
b]pyridazin-6-amine, 2H₂SO₄AS (Calbiochem ®, Millipore Merck, Darmstadt, Germany) is
a chemical inhibitor for PIM kinases which is ATP competitive inhibitor of PIM1,2,3 and
had to be resolved in dimethlysulfoxide (DMSO) (Sigma Aldrich, Steinheim, Germany).
The respective DMSO concentration in medium served as negative control. 500.000
cells/well were seeded in 6 well plates.
After 24 h, cells were treated with either PIM1 kinase inhibitor SGI-1776 or DMSO (0.01%)
control vehicle reagents. After incubation for further 24 h protein was extracted for Western
blotting.
3.1.11 Cell Viability Assay (MTS)
Viable cells were evaluated using a colorimetric MTS (3-(4, 5-dimethylthiazol-2-yl)-5-(3-
carboxymethoxyphenyl)-2-(4-sulfophenyl)-2H-tetrazolium) CellTiter 96® AQueous One
Solution Cell Proliferation Assay (MTS) (Promega, USA). Cells were seeded at a density
of 5 x 10³ cells/well in triplicates in 96-well plates with outer wells left for blank. After 24 h
of incubation, the media was changed and 0.01% DMSO vehicle, or SGI-1776 at different
concentrations (5 µM, 10 µM and 20 µM) were added and incubated. After further 24 h, 0.5
mg/ml MTS dye was added and the cells were incubated for an additional 4 h prior to
measurement. Formazan crystals were dissolved in DMSO for 5 min and the plates were
read at 490 nm wavelength spectrophotometrically with a reference of 650nm.
3.1.12 Cell Proliferation (BrdU)
Cell proliferation was quantified using 5’-bromo-2’-deoxyuridine (BrdU) incorporation, a
Cell Proliferation ELISA, BrdU (Colometric) kit (Roche Diagnostics GmbH, Mannheim,
Germany). It is based on the detection of BrdU incorporated into genomic DNA of
proliferating cells. Cells were seeded at a density of 5 x 10³ cells/well (in a final volume of
100 µl/well) in triplicates in 96-well plates with outer wells left for distilled water. After 24 h
of incubation, the media was changed followed by incubating the cells with or without SGI-
1776 at different concentrations (5 µM, 10 µM and 20 µM) or 0.01% DMSO vehicle for 24
h at 37 °C at 5% CO2. Briefly, cells were labeled with BrdU and allowed to accrue within
proliferation cells for 2 h.

Materials and Methods
37
Next step, cells were fixed by using FixDenate for 30 min at room temperature followed by
incubating with an anti-BrdU-POD monoclonal antibody for 90 min.
Later, the antibody conjugate was removed by flicking off and washing the wells three
times with washing solution PBS 1X. Finally, substrate solution was added and incubated
until color development was sufficient. Absorbance was measured at 492 nm.
3.1.13 Apoptosis (Annexin V assay)
Apoptosis was measured by flow cytometry using an annexin V FITC conjugated (Immuno
Tools, Freisoythe, Germany) and Propidium Iodide (PI) apoptosis kit (BD Bioscience USA)
according to manufacturers’ instructions. Briefly, cells were seeded in 6 well plates at a
density of 4.5x10⁵ cells/well, and incubated for 24 h to reach adherence and confluence,
followed by incubation with or without SGI-1776 at different concentrations (5 µM, 10 µM
and 20 µM) or and 0.01% DMSO vehicle. After further incubation for 24 h at 37 ° C at 5%
CO2, cells were harvested, washed with cold PBS (1X) and re-suspended in annexin V
FITC conjugated (which binds extra-cellularity to apoptotic cells)/ Propidium iodide (PI;
which stains necrotic cells) for 15mins in dark at room temperature. Fluorescence of 104
labeled cells was measured by flow cytometry using a FACSCalibur ™ (BD Bioscience
USA). Viable cells were quantified by subtracting the apoptotic (Annexin V-FITC positive)
and necrotic fractions (PI positive).
3.2 PART II
3.2.1 Cell cultures and cell line
The immortalized human primary trophoblast cell line HTR8/SVneo was used for
experiments. The cell line was maintained under standardized conditions (37°C, 5% CO2,
humidified atmosphere). HTR8/SVneo cells were cultured in RPMI medium supplemented
with 10% fetal bovine serum (FBS) and 1000 U/ml Penicillin and streptomycin.
3.2.2 Generation of spheroids
Cells were cultured and seeded on non-adherent petri dishes (Greiner, Germany) at a
density of 1X10⁶ cells/petri dish, incubated for 72 h (humidified atmosphere, at 37 °C and
5% CO2). Subsequently, spheroids were formed.

Materials and Methods
38
3.2.3 Viability analysis of formed spheroids
The spheroid viability was analyzed by application of cell tracker dyes, which stain living
cells (Cell Tracker™ Probes for long-term tracing of living cells: Cell Tracker™ Green
BODIPY; 8-chloromethyl-4, 4-difluoro-1, 3, 5, 7-tetramethyl-4-bora-3a, 4a-diaza-s-
indacene; Life Technologies, Germany). Spheroids formed on 5th to 7th day were taken for
analysis after centrifugation and aspiration of the supernatant. The spheroids were gently
re-suspended in pre-warmed Cell Tracker™ dye working solution and incubated for 15–45
min. Subsequently, cells were centrifuged at 1300 rpm for 5 min. The dye working solution
was replaced with fresh, pre-warmed medium and cells were incubated for another 30
minutes at 37°C and 5% CO2 and observed under microscope.
3.2.4 Spheroid Stimulation
Spheroids were formed under simultaneous stimulation with 10 and 50 ng/ml human
recombinant LIF (Millipore Merck, Germany) or human recombinant OSM (Life
Technologies, Germany) or without as control.
3.2.5 Flow Cytometry
The HTR8/SVneo cells cultured as monolayers or spheroids were stimulated with LIF or
OSM (10 ng/ml and 50 ng/ml). After 72 h, the monolayer cells and spheroids were stained
with fluorescence labeled antibodies against surface molecules CD44 (multi structural and
multifunctional molecule involved in cell differentiation, migration, and proliferation), CD34
(adhesion molecule, migration and invasion), CD24 (cell adhesion molecule) and CD133
(involved in stem cell differentiation and cell invasion) (all from Miltenyi Biotech GmbH
Bergisch Gladbach, Germany) and incubated at 4 °C in a shaker Orbital Taumler Plymax
1040 (Heidolph Instruments GmbH & Co. KG, Schwabach, Germany). After 30 min, cells
were washed in PBS 1X, resuspended in FACS Flow buffer ( BD, Bioscience, USA) and
analyzed on a flow cytometry FACS Calibur ( BD, Bioscience, USA).
3.2.6 Western Blot
The expression of CDX2, SOX2, OCT4 and NANOG, which are transcriptional factors
essential to maintain self-renewal and the status of undifferentiated embryonic stem cells,
was analyzed by Western blotting.

Materials and Methods
39
The formed spheroids were harvested and rinsed with cold PBS (1X) (GE healthcare or
PAA, Pasching/Linz, Austria) and harvested. Spheroids were lysed using Cell lysis buffer
(Cell Signaling Technologies Inc., Beverly, Massachusetts) and cell lysates were
centrifuged at 10,000 x g for 10 min at 4°C. Protein concentrations of the resulting
supernatant were determined by a Pierce® BCA Protein Assay (Thermo Fisher Scientific
Biosciences GmbH, Waltham, MA, USA) at 660 nm wavelength. Total protein (20-30 µg)
equivalent concentrations of cell lysate protein were boiled for 7 min at 95° C and resolved
in 10-12% SDS PAGE electrophoresis at 60 mA constant for 1 h, followed by protein
transfer to PVDF membrane (Thermo Fisher Scientific Biosciences GmbH, Waltham, MA,
USA). Membranes were blocked with 5 % bovine serum albumin (BSA) in Tris-buffered
saline containing 0.1 % Tween 20 (TBST) for 1 h before overnight incubation at 4° C with
primary antibodies against CDX2, NANOG, OCT4A, and SOX2, typically at 1:1000
dilutions. Blots were rinsed with 1X TBST and incubated with a secondary HRP-linked
anti-rabbit IgG antibody (Cell Signaling Technologies Inc., Beverly, Massachusetts) at a
dilution 1:10,000 for 90 min at room temperature. Reactive bands were visualized by
exposure to Luminata Forte Western HRP substrate (Merck Millipore, Billerica,
Massachusetts) a chemical reagent for detection. Expression was quantified by using the
ultra-sensitive chemiluminescence gel documentation system MF ChemiBIS 3.2 (Biostep
DNR Bio-Imaging systems, Jerusalem, Israel) and densitometry quantification of the
respective band intensities was performed using Total Lab 1000 image program software.
3.3 Statistics
All experiments were repeated at least three times. Data is presented as mean ± Standard
Deviation (SD). The quantification was done using delta delta cycle threshold (∆∆Ct)
method. Two-tailed Student’s t-test was performed for statistical comparisons between
experimental groups. P<0.05 was defined as statistically significant.

Results
40
CHAPTER 4 RESULTS
PART I
4.1 Identification of PIM kinases (PIM1, PIM2 and PIM3) in trophoblastic
cells
All three PIM kinase family members were expressed at the mRNA level in primary
trophoblast cells, HTR8/SVneo (immortalized transformed trophoblast cells) and JEG-3
(choriocarcinoma) cells (Fig 14.). Shown is the PCR agarose gel electrophoresis.
Figure 14. PCR gel electrophoresis PIM kinase expression
(A) expression PIM kinase in primary trophoblast cells (T1-T3), HTR8/SVneo, JEG-3 and K562
(Leukemic) cells.(B) PIM3 kinase re-designed primer.

Results
41
4.2 Effect of LIF upon stimulation in trophoblastic cells
During pregnancy LIF plays a very important role in trophoblast functions, hence we have
stimulated the cell lines (HTR8/SVneo and JEG-3) with LIF (10 ng/ml) from 2’-60’ min and
studied the expression level of PIM kinase family members (PIM1, PIM2 and PIM3), by
real-time quantitative polymerase chain reaction (qPCR) and Western blot analysis. (n=3).
4.2.1 Gene expression level
In HTR8/SVneo cells, the gene expression level of PIM1 and PIM3 kinase was significantly
increased 60 min after LIF stimulation whereas PIM2 kinase was not significantly altered
(Fig 15.A). In JEG-3 cells the gene expression levels of PIM2 (2 min after LIF stimulation)
and PIM3 kinase (60 min after LIF stimulation) exhibits significant increase but not that of
PIM1 kinase (Fig 15.B). The fold changed was observed by normalization to reference
gene HMBS. K562 was not positive for all PIM kinase so it was not further used in this
study.
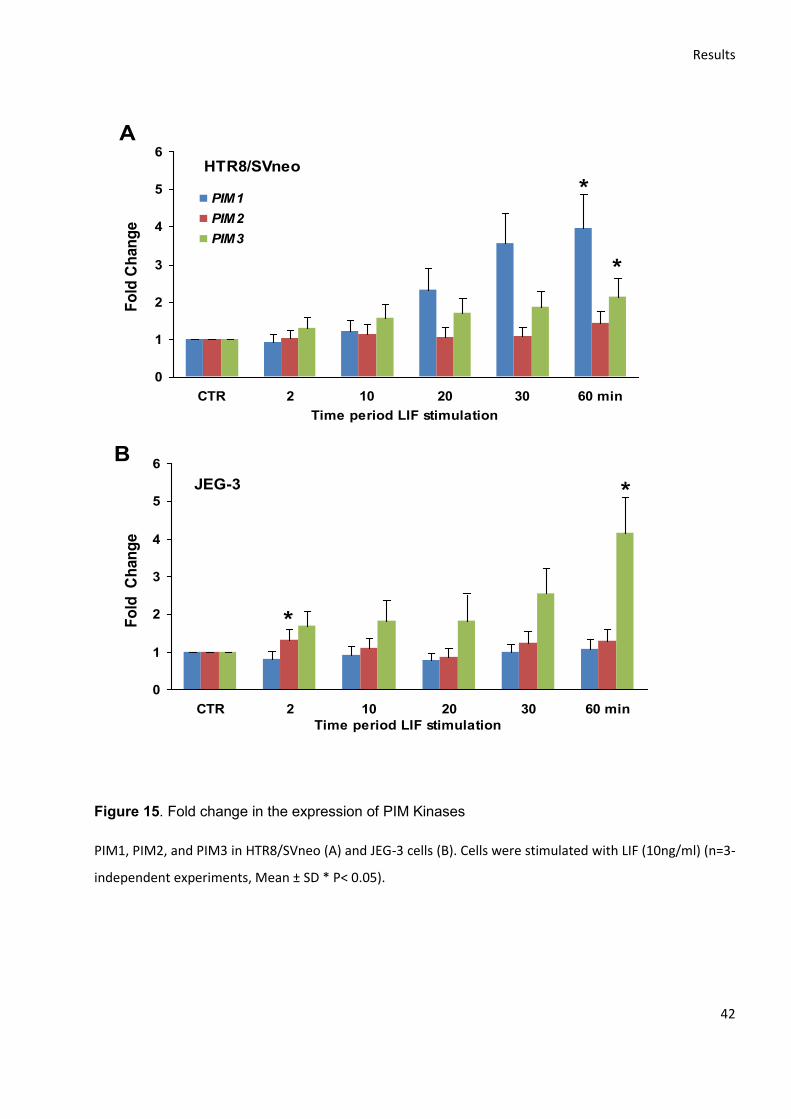
Results
42
JEG-3
0
1
2
3
4
5
6
CTR 2 10 20 30 60 min
Time period LIF stimulation
Fo
ld C
han
ge
*
B
*
HTR8/SVneo
0
1
2
3
4
5
6
CTR 2 10 20 30 60 min
Time period LIF stimulation
Fo
ld C
han
ge
PIM1
PIM2
PIM3
*
*
A
Figure 15. Fold change in the expression of PIM Kinases
PIM1, PIM2, and PIM3 in HTR8/SVneo (A) and JEG-3 cells (B). Cells were stimulated with LIF (10ng/ml) (n=3-
independent experiments, Mean ± SD * P< 0.05).
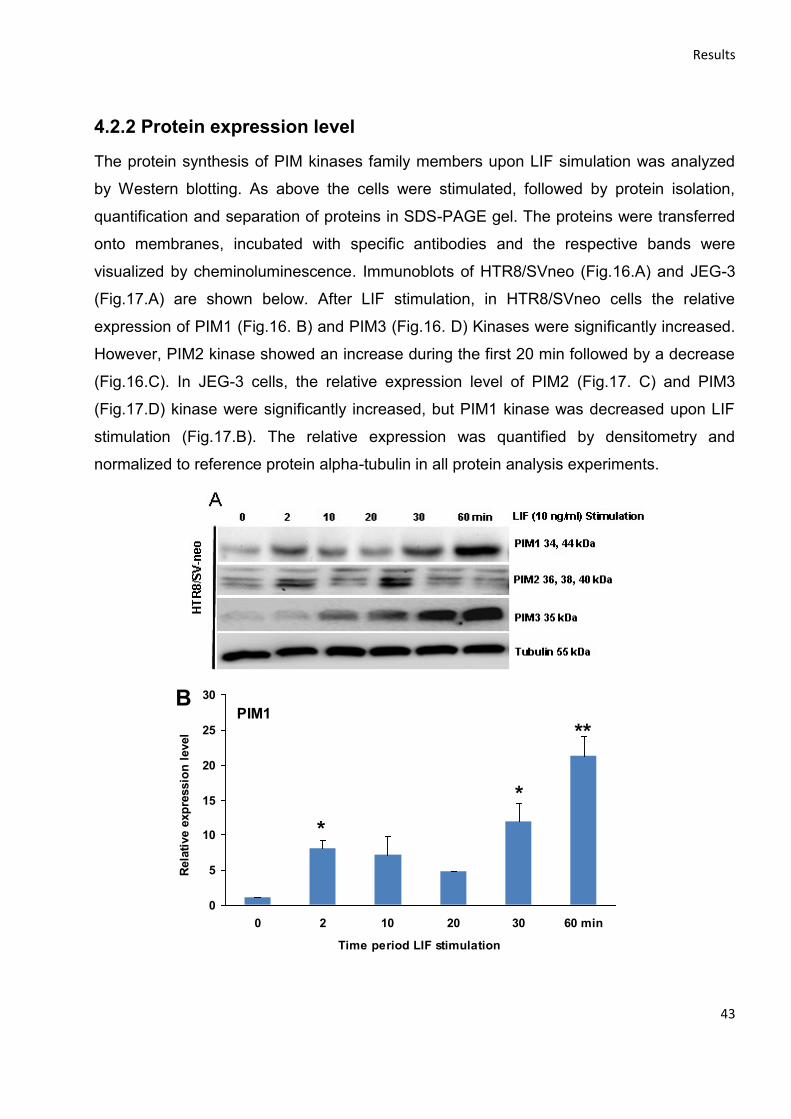
Results
43
PIM1
0
5
10
15
20
25
30
0 2 10 20 30 60 min
Time period LIF stimulation
Rela
tive e
xp
ressio
n l
evel
*
**
*
B
4.2.2 Protein expression level
The protein synthesis of PIM kinases family members upon LIF simulation was analyzed
by Western blotting. As above the cells were stimulated, followed by protein isolation,
quantification and separation of proteins in SDS-PAGE gel. The proteins were transferred
onto membranes, incubated with specific antibodies and the respective bands were
visualized by cheminoluminescence. Immunoblots of HTR8/SVneo (Fig.16.A) and JEG-3
(Fig.17.A) are shown below. After LIF stimulation, in HTR8/SVneo cells the relative
expression of PIM1 (Fig.16. B) and PIM3 (Fig.16. D) Kinases were significantly increased.
However, PIM2 kinase showed an increase during the first 20 min followed by a decrease
(Fig.16.C). In JEG-3 cells, the relative expression level of PIM2 (Fig.17. C) and PIM3
(Fig.17.D) kinase were significantly increased, but PIM1 kinase was decreased upon LIF
stimulation (Fig.17.B). The relative expression was quantified by densitometry and
normalized to reference protein alpha-tubulin in all protein analysis experiments.

Results
44
PIM2
0
0.5
1
1.5
2
2.5
3
0 2 10 20 30 60 min
Time period LIF stimulation
Rela
tive e
xp
ressio
n l
evel **
**
C
PIM3
0
0.5
1
1.5
2
2.5
3
0 2 10 20 30 60 min
Time period LIF stimulation
Rela
tive e
xp
ressio
n l
evel
***
*******
D
Figure 16. Protein expression in HTR8/SVneo cells.
(A) Representative Immunoblots of the protein expression of PIM1, PIM2, and PIM3 upon LIF
stimulation in HTR8/SVneo cells. (B, C and D) Densitometry analysis of the relative expression of
PIM1, PIM2, and PIM3 kinases in HTR8/SVneo cells. PIM1 and PIM3 kinase expression in
HTR8/SVneo cells shows an increase, whereas PIM2 was increased for short duration, later
decresed (* p< 0.05; p< 0.01; p< 0.001 Student’s t-test). Cells were stimulated with LIF (10 ng/ml).
Normalized to loading control alpha-tubulin. n=3- independent experiments, Mean ± SD

Results
45
PIM1
0
0.5
1
1.5
0 2 10 20 30 60 min
Time periodd LIF stimulation
Rela
tive e
xp
ressio
n l
evel
******
**
B
PIM2
0
0.5
1
1.5
2
0 2 10 20 30 60 min
Time period LIF stimulation
Rela
tive e
xp
ressio
n l
evel
C

Results
46
PIM3
0.0
0.5
1.0
1.5
2.0
0 2 10 20 30 60 min
Time period LIF stimulation
Rela
tive e
xp
ressio
n l
evel
*D
Figure 17. Protein expression in JEG-3 cells.
(A) Representative Immunoblots of the protein expression of PIM1, PIM2, and PIM3 with tubulin
as reference control upon LIF stimulation in JEG-3 cells. (B, C and D) Densitometry analysis of the
relative expression of PIM1, PIM2, and PIM3 in JEG-3 cells. PIM2 and PIM3 kinase expression in
JEG-3 cells shows an increase, whereas PIM1 was relatively decreased (*p< 0.05; p< 0.01; p<
0.001; Student’s t-test). Cells were stimulated with LIF (10ng/ml). Normalized to loading control
alpha-tubulin. N=3- independent experiments, Mean ± SD.
4.2.3 Localization and distribution of PIM kinases
Immunostaining was performed to investigate the morphological localization and
distribution of PIM kinases in cell lines. Both immunocytochemistry (ICC) and
immunofluorescence (IF) staining were used to study the expression of PIM1, PIM2 and
PIM3 kinases upon LIF stimulation up to 1 h. Below figures represent the morphological
distributions of PIM1 kinase. In unstimulated cells, PIM1 kinase was localized in
cytoplasmic, PIM2 in the nucleus and PIM3 was present all over the cells. Upon LIF
stimulation, in HTR8/SVneo (Fig. 18) PIM1 and PIM2 kinase has evidently increase
whereas PIM3 kinase is decreased distribution with respect to Isotype control and
unstimulated. In JEG-3, (Fig. 19) PIM1 and PIM3 (evidently increased) whereas PIM2
kinase is not evidently increase after LIF stimulation.

Results
47
Figure 18. Immune staining in HTR8/SVneo cells.
IF (From left three columns, merge; nuclei: DAPI; blue, Cy3: red) and ICC (right column, DAB
staining -brown) staining showing expression of PIM1, PIM2 and PIM3 kinases in HTR8/SVneo
cells. PIM1 and PIM2 show an increase, PIM3 show decrease upon stimulation with LIF (10 ng/ml,
1 h).
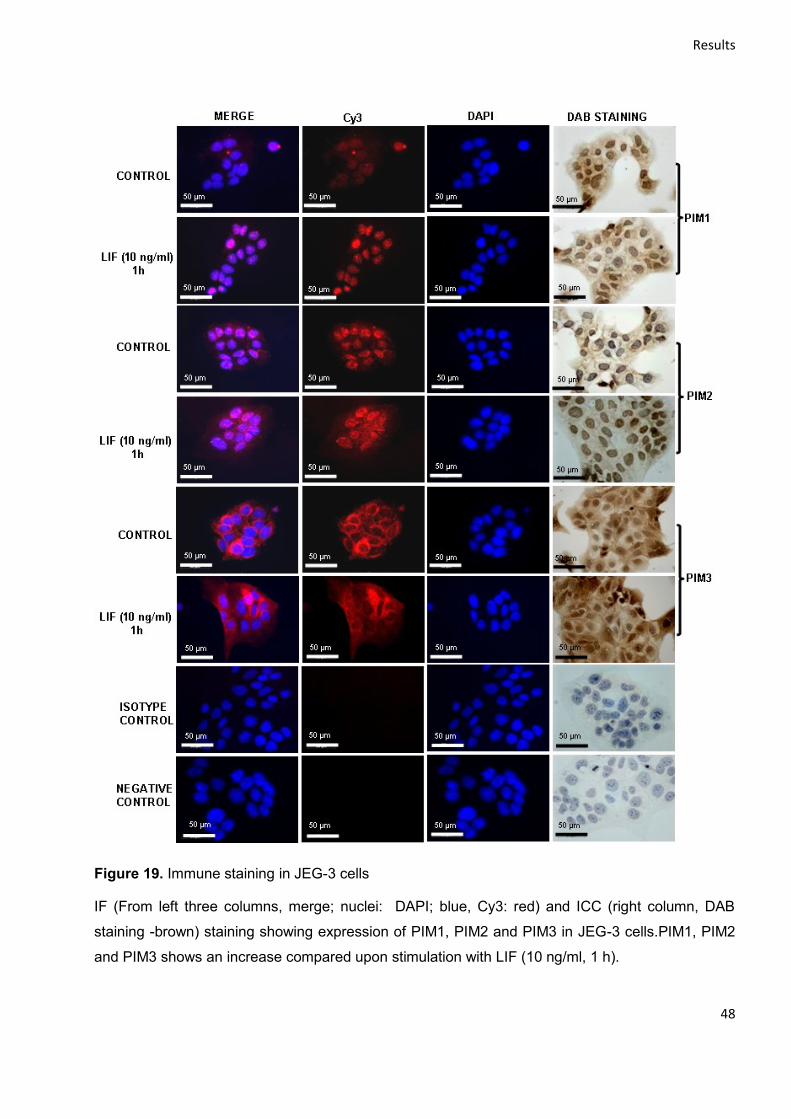
Results
48
Figure 19. Immune staining in JEG-3 cells
IF (From left three columns, merge; nuclei: DAPI; blue, Cy3: red) and ICC (right column, DAB
staining -brown) staining showing expression of PIM1, PIM2 and PIM3 in JEG-3 cells.PIM1, PIM2
and PIM3 shows an increase compared upon stimulation with LIF (10 ng/ml, 1 h).

Results
49
4.3 PIM kinase inhibition in trophoblastic cells by SGI-1776
Cells were incubated with chemical inhibitor, PIM-Kinase Inhibitor IX, SGI-1776; used to
inhibit the PIM kinases activity. The functional investigation shows the effect of SGI-1776
on cell viability and proliferation. (n=3)
4.3.1 Effect on Cell viability and proliferation
The viability of cells upon SGI-1776 inhibition decreased in dose dependent manner with
respect to controls. On day 1 and 2, there was significant reduction of viability at 10 and 20
µM SGI-1776. On day 3 at 20µM there were no viable cells in neither cell line. In
HTR8/SVneo cells (Fig. 20 A) there was significant decrease in proliferation on day 1 at 20
µM SGI-1776, on day 2 and day 3 at 10 and 20µM. In JEG-3 cells (Fig. 20 B) on day 1 at
concentrations of 10 and 20µM SGI-1776 decreased viability on day 1 and which was
almost completely inhibited on days 2 and day 3. Hence the above data demonstrate that
PIM kinases inhibition reduces the cell viability.
The incorporation of BrdU showed similar effect as that of viability where, in HTR8/SVneo
cells (Fig. 21 A) on day 1 there is reduction in proliferation rate of cells. On days 2 and 3
showed significant decreased cell proliferation in dose dependent manner. In JEG-3 cells
(Fig. 21 A) on day 1, day 2 and day 3 has decreased cell proliferation at 10 and 20 µM/ml
concentrations respectively.

Results
50
Figure 20. Cell Viability assay
Effect of PIM-kinase inhibitor IX, SGI-1776 (chemical inhibitor) on cell viability (MTS assay) in
HTR8/SVneo (A) and JEG-3 cells (B), that were untreated, treated with 0.1% DMSO vehicle alone,
or with 5 µM, 10 µM, or 20 µM for 24 h, 48 h or 72 h (n=3 independent experiments, mean ± SD;
*p< 0.05, Student’s t-test).
HTR8/SVneo and PIM-Kinase Inhibitor IX, SGI-1776
0
1
2
3
4
5
Day 0 Day 1 Day2 Day3
Rela
tive c
ell
via
bil
ity (
MT
S)
CTR
DMSO
5 µM
10 µM
20 µM
****
*
**
*
*
A
* **
JEG-3 and PIM-Kinase Inhibitor IX, SGI-1776
0
1
2
3
4
5
Day 0 Day 1 Day2 Day3
Rela
tive c
ell
via
bil
ity (
MT
S)
** *
**
*
**
B
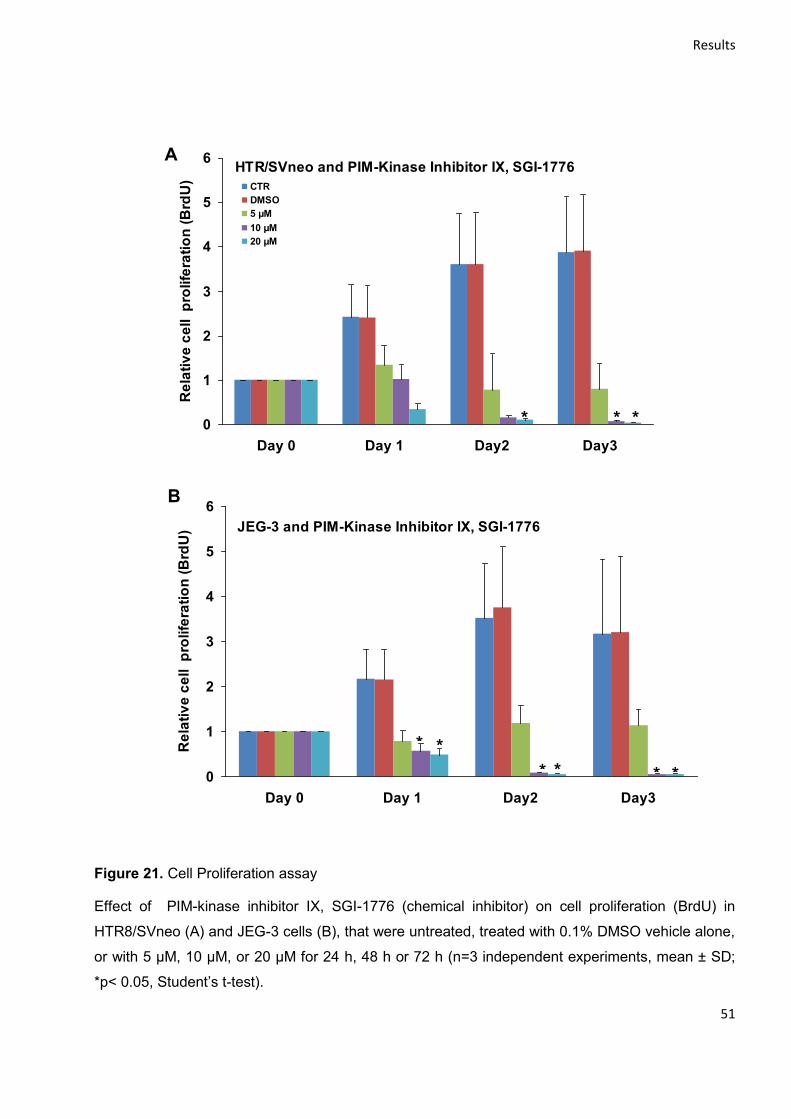
Results
51
Figure 21. Cell Proliferation assay
Effect of PIM-kinase inhibitor IX, SGI-1776 (chemical inhibitor) on cell proliferation (BrdU) in
HTR8/SVneo (A) and JEG-3 cells (B), that were untreated, treated with 0.1% DMSO vehicle alone,
or with 5 µM, 10 µM, or 20 µM for 24 h, 48 h or 72 h (n=3 independent experiments, mean ± SD;
*p< 0.05, Student’s t-test).
HTR/SVneo and PIM-Kinase Inhibitor IX, SGI-1776
0
1
2
3
4
5
6
Day 0 Day 1 Day2 Day3
Re
lati
ve
ce
ll p
rolife
rati
on
(B
rdU
)CTR
DMSO
5 µM
10 µM
20 µM
A
* * *
JEG-3 and PIM-Kinase Inhibitor IX, SGI-1776
0
1
2
3
4
5
6
Day 0 Day 1 Day2 Day3
Re
lati
ve
ce
ll p
rolife
rati
on
(B
rdU
)
* *
* * * *
B
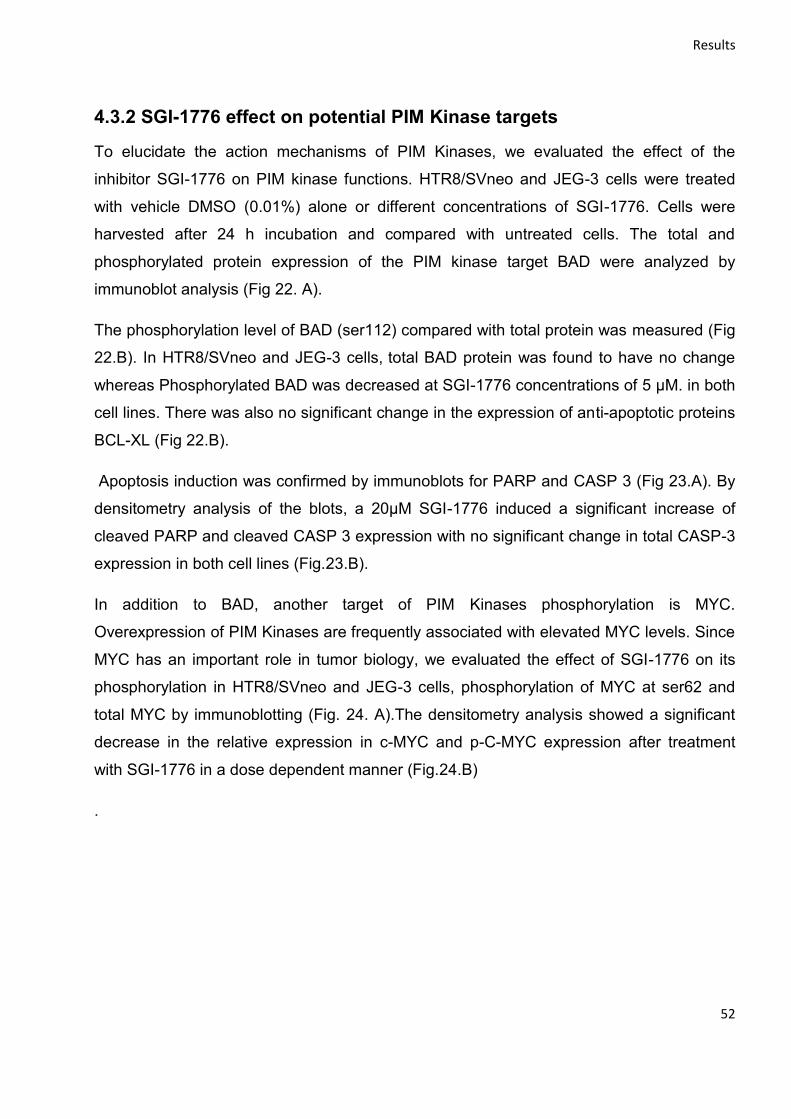
Results
52
4.3.2 SGI-1776 effect on potential PIM Kinase targets
To elucidate the action mechanisms of PIM Kinases, we evaluated the effect of the
inhibitor SGI-1776 on PIM kinase functions. HTR8/SVneo and JEG-3 cells were treated
with vehicle DMSO (0.01%) alone or different concentrations of SGI-1776. Cells were
harvested after 24 h incubation and compared with untreated cells. The total and
phosphorylated protein expression of the PIM kinase target BAD were analyzed by
immunoblot analysis (Fig 22. A).
The phosphorylation level of BAD (ser112) compared with total protein was measured (Fig
22.B). In HTR8/SVneo and JEG-3 cells, total BAD protein was found to have no change
whereas Phosphorylated BAD was decreased at SGI-1776 concentrations of 5 µM. in both
cell lines. There was also no significant change in the expression of anti-apoptotic proteins
BCL-XL (Fig 22.B).
Apoptosis induction was confirmed by immunoblots for PARP and CASP 3 (Fig 23.A). By
densitometry analysis of the blots, a 20µM SGI-1776 induced a significant increase of
cleaved PARP and cleaved CASP 3 expression with no significant change in total CASP-3
expression in both cell lines (Fig.23.B).
In addition to BAD, another target of PIM Kinases phosphorylation is MYC.
Overexpression of PIM Kinases are frequently associated with elevated MYC levels. Since
MYC has an important role in tumor biology, we evaluated the effect of SGI-1776 on its
phosphorylation in HTR8/SVneo and JEG-3 cells, phosphorylation of MYC at ser62 and
total MYC by immunoblotting (Fig. 24. A).The densitometry analysis showed a significant
decrease in the relative expression in c-MYC and p-C-MYC expression after treatment
with SGI-1776 in a dose dependent manner (Fig.24.B)
.

Results
53
Cleaved PARP
0
0.5
1
1.5
2
2.5
CTR DMSO 5 µM 10 µM 20 µM
SGI-1776 diff conc
Rela
tive e
xp
ressio
n l
evel
HTR8/Svneo
JEG-3
*
*
D
BCL-XL
0
0.5
1
1.5
CTR DMSO 5 10 20
SGI-1776 (µM)
Rela
tive e
xp
ressio
n l
evel
Phospho-BAD (Ser112)
0
0.5
1
1.5
CTR DMSO 5 10 20
SGI-1776 (µM)
Rela
tive e
xp
ressio
n l
evel
***
B
BAD
0
0.5
1
1.5
CTR DMSO 5 10 20
SGI-1776 (µM)
Rela
tive e
xp
ressio
n l
evel
Figure 22. Immunoblot analysis of pro-apoptosic protein.
(A) Immunoblot analysis of potential target proteins in HTR8/SVneo and JEG-3 cells. Cells were
treated with 0.1% DMSO alone or with 5, 10, or 20 µM/ml SGI-1776 for 24 h. (B) (C) and (D)
Densitometry analysis of potential PIM kinase target proteins in HTR8/SVneo and JEG-3 cells. The
protein levels of p-BAD (ser112), total BAD and BCL-XL were normalized to GAPDH as loading
control (n=3 independent experiments, mean ± SD, * p<0.05, ** p<0.01 Student’s t-test).

Results
54
Cleaved PARP
0
0.5
1
1.5
2
2.5
CTR DMSO 5 µM 10 µM 20 µM
SGI-1776 diff conc
Rela
tive e
xp
ressio
n l
evel
HTR8/Svneo
JEG-3
*
*
D
Figure 23. Immunoblot analysis of anti-apoptotic proteins.
(A) Immunoblot analysis of apoptosis indicating proteins (cleaved PARP, CASP-3, cleaved CASP-
3) in HTR8/SVneo and JEG-3 cells. Cells were treated with 0.1% DMSO alone or with 5, 10, or 20
µM/ml SGI-1776 for 24 h. (B) Densitometry analysis of potential target proteins in HTR8/SVneo
and JEG-3 cells. The protein levels of CASP3, cleaved CASP3 and cleaved PARP were
normalized to tubulin loading control (n=3 independent experiments, mean ± SD, * p<0.05,
Student’s t-test).
CASP3
0
0.5
1
1.5
CTR DMSO 5 10 20
SGI-1776 (µM)
Rela
tive e
xp
ressio
n l
evel
B
Cleaved CASP3 (Asp175)
0
1
2
3
4
5
6
7
CTR DMSO 5 10 20
SGI-1776 (µM)
Rela
tive e
xp
ressio
n l
evel
*
*
Cleaved PARP
0
0.5
1
1.5
2
2.5
CTR DMSO 5 10 20
SGI-1776 (µM)
Rela
tive e
xp
ressio
n l
evel *
*

Results
55
Cleaved PARP
0
0.5
1
1.5
2
2.5
CTR DMSO 5 µM 10 µM 20 µM
SGI-1776 diff conc
Rela
tive e
xp
ressio
n l
evel
HTR8/Svneo
JEG-3
*
*
D
Figure 24. Protein analysis of Potential targets of PIM kinases
(A) Immunoblot analysis of potential PIM Kinase target protein c-MYC in HTR8/SVneo and
JEG-3 cells. Cells were treated with 0.1% DMSO alone or with 5, 10, or 20 µM/ml SGI-1776
for 24 h 10 (B) Densitometry analysis of p-c-MYC and c-MYC in HTR8/SVneo and JEG-3
cells. (n=3 independent experiments, mean ± SD, * p<0.05, Student’s t-test).
Phospho-c-MYC (Ser62)
0
0.5
1
1.5
CTR DMSO 5 10 20
SGI-1776 (µM)
Rela
tive e
xp
ressio
n l
evel
*
*
B
c-MYC
0
0.5
1
1.5
CTR DMSO 5 10 20
SGI-1776 (µM)
Rela
tive e
xp
ressio
n l
evel
*

Results
56
4.3.3 Apoptosis induction by SGI-1776
Both cell lines HTR8/SVneo and JEG-3 cells were treated with different
concentrations of SGI-1776, and then stained with annexin V-FITC/PI and analyzed
by flow cytometry to measure the apoptosis induction (Fig. 25 and Fig. 26.).
HTR8/SVneo cells were incubated for 24 h with 5, 10 and 20 µM/ml SGI-1776,
which resulted in a significant increase in apoptosis (Fig. 25.A). After treating JEG-3
cells with 20 µM SGI-1776 for 24 h, a significant increase in the apoptosis of more
than 20% was observed (Fig. 26.A).

Results
57
0
5
10
15
20
25
30
35
40
CTR DMSO 5 10 20
SGI-1776 (µM)
% A
po
pto
sis
an
d N
ecro
sis
HT
R8/S
Vn
eo
Apoptosis
Necrosis
*
*
*
*
*
*
Figure 25. Apoptosis assay by annexin V showing the cell death in HTR8/SVneo cells.
(A) Flow cytometry for Apoptosis assay by annexin V showing the cell death in HTR8/SVneo
cells treated with SGI-1776. Cells were either treated with 0.1%DMSO alone or treated with
5, 10, 20 µM/ml SGI-1776 and cells were harvested after 24 h and stained with annexin V
and Propidium Iodide (PI). Lower panel represents the relative percentage of Apoptosis in
HTR8/SVneo cells respectively. (n=3- independent experiments, Mean ± SD * P< 0.05).

Results
58
0
5
10
15
20
25
CTR DMSO 5 10 20
SGI-1776 (µM)
%
Ap
op
tos
is a
nd
Nec
rosis
JE
G-3
Apoptosis
Necrosis
*
*
*
*
Figure 26. Apoptosis assay by annexin V showing the cell death in JEG-3 cells
(A) Flow cytometry for Apoptosis assay by annexin V showing the cell death in JEG-3 cells
treated with SGI-1776. Cells were either treated with 0.1%DMSO alone or treated with 5, 10,
20 µM/ml SGI-1776 and cells were harvested after 24 h and stained with annexin V and
Propidium iodide (PI). Lower panel represent the relative percentage of apoptosis in JEG-3
cells respectively. (n=3- independent experiments, Mean ± SD * P< 0.05).

Results
59
PART II
4.4 HTR8/SVneo cell characterization of Stem cell property
4.4.1 Characterization of spheroids formed from HTR8/SVneo cells
HTR8/SVneo cells were used as a model to investigate cancer stem cell like (CSC)
properties exhibited upon 3-dimensional (3 D) culture by generating spheroids on a
non-adherent surface.
4.4.2 Morphology and cell viability by microscopic analysis
Spheroid were generated seeding cells at a density of 1x10⁶ cells on petri dishes
(non-adherent) with or without stimulation with LIF (10 and 50 ng/ml) and incubated
for up to 72 h under standard conditions. Formed spheroids were further analyzed
and compared with cells cultured in conventional 2D models (Fig.27.A-C). Spheroids
are small round-shaped aggregates of cells with diameters of approximately 50-
500µm. Spheroids were incubated with cell tracker fluorescence dye, which stains
the viable cells (Fig.27.D-E) and Spheroids treated with LIF showed no change in
morphology and number of spheroids generated (Fig. 27 F).

Results
60
Figure 27. Spheroid formation in the HTR8/SVneo cell line
(A) Initial monolayer morphology 200x; (B) 200X and (C) 400X: spontaneous spheroid
formation on day 3 on non-adherent surface at 200µm and 400µm.(D) and (E) Viability test of
spheroids via cell tracker staining at 200X and 400X respectively; (F) spheroids after LIF
stimulation (no change in morphology, however tendency to form lower number of
spheroids).
4.4.3 Western Blot analysis
Western blot analysis was performed with spheroids generated for stem cell
transcription factors NANOG, CDX2, SOX2 and OCT4A. We detected, that spheroids
formed from HTR8/SVneo cells express transcription factors involved in maintenance
of stemness. These include CDX2 which is the most specific trophoblast stem cell
marker and NANOG. Upon LIF stimulation, the expression of transcription factors
was altered. NANOG expression increased and CDX2 expression (Fig. 28.A)
decreased significantly in spheroids with 50 ng/ml LIF stimulation compared with
control monolayer cultures. Vinculin served as housekeeping reference. SOX2 and
OCT4A were not expressed, (data not shown).
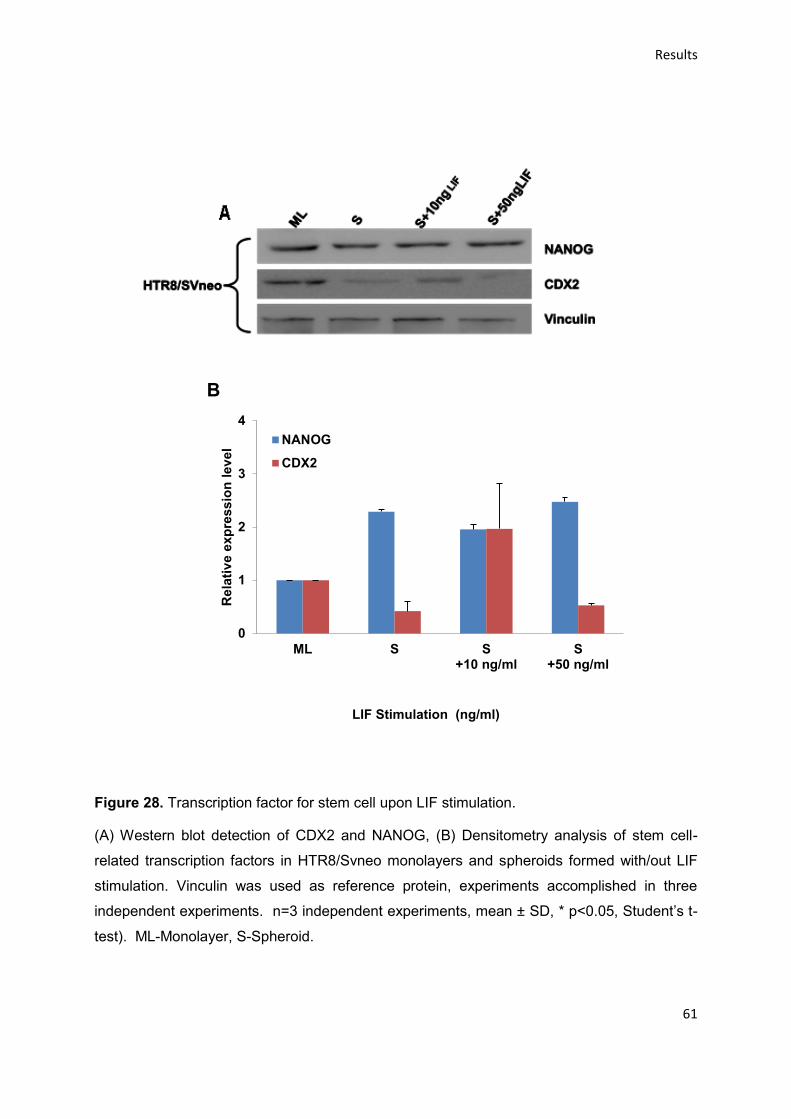
Results
61
0
1
2
3
4
ML S S+10 ng/ml
S+50 ng/ml
Rela
tiv
e e
xp
ressio
n l
ev
el
LIF Stimulation (ng/ml)
NANOG
CDX2
B
Figure 28. Transcription factor for stem cell upon LIF stimulation.
(A) Western blot detection of CDX2 and NANOG, (B) Densitometry analysis of stem cell-
related transcription factors in HTR8/Svneo monolayers and spheroids formed with/out LIF
stimulation. Vinculin was used as reference protein, experiments accomplished in three
independent experiments. n=3 independent experiments, mean ± SD, * p<0.05, Student’s t-
test). ML-Monolayer, S-Spheroid.

Results
62
Upon OSM stimulation, the expression of transcription factors was altered. NANOG
and CDX2 expression was increased (Fig. 28.A) significantly in spheroids with 50
ng/ml OSM stimulation compared with control monolayer cultures. Alpha tubulin
served as housekeeping reference. SOX2 and OCT4A were not expressed, (data not
shown).
0
1
2
3
4
ML S S
+10 ng/ml
S
+50 ng/ml
OSM Stimulation (ng/ml)
Re
lati
ve e
xp
ress
ion
lev
el
NANOG
CDX2
**
B
** *
*
Figure 29. Transcription factor for stem cell upon OSM stimulation
(A) Representative Western blots for detection of CDX2 and NANOG in HTR8/SVneo cells
grown in monolayers or spheroids stimulated with different concentrations of OSM, (B)
densitometry analysis of respective Western blots. Alpha tubulin was used as reference
protein, experiments accomplished in three independent experiments.. Error bars indicate
standard deviation. ML-Monolayer, S-Spheroid.

Results
63
4.4.4 Flow cytometer analysis
Flow cytometry analysis of HTR8/SVneo after LIF and OSM stimulation with different
concentrations (10ng/ml and 50ng/ml) revealed alteration of surface molecules
CD24, CD34 and CD44. In LIF treated spheroids cells there is significant decrease in
the expression of CD24 at 10 ng/ml, upon LIF stimulation but rather the untreated
spheroids showed significant increase in the expression of CD34 and CD44 showed
interestingly low expression in spheroid but with no significant difference in LIF
treatment (Fig 30. A).
In OSM treated cells there was no significant difference observed in the surface
molecules by flow cytometry analysis (Fig 31. A).

Results
64
CD34
0
0.5
1
1.5
2
ML S
- LIF
S
+10 ng/ml
S
+50 ng/ml
LIF Stimulation (ng/ml)
Rela
tive e
xp
ressio
n l
evel
*CD24
0
0.5
1
1.5
2
ML S
- LIF
S
+10 ng/ml
S
+50 ng/ml
LIF Stimulation (ng/ml)
Rela
tive e
xp
ressio
n l
evel
*
B
CD44
0
0.5
1
1.5
2
ML S
- LIF
S
+10 ng/ml
S
+50 ng/ml
LIF Stimulation (ng/ml)
Rela
tive e
xp
ressio
n l
evel
ML
S
- LIFS
+10 ng/mlS
+50 ng/ml
*
Figure 30. Flow cytometry analysis for stem cell property upon LIF stimulation.
Upper panel (A) Histograms from flow cytometric analysis of stem cell surface marker
expression on HTR8/SVneo spheroids formed with or without LIF stimulation for 72 h. M1
indicates negative cells as defined by application of isotype control antibodies; M2 indicates
positive cells. Lower panel (B) Spheroids was generated from HTR8/SVneo cells stimulated
with two different concentrations of LIF or without LIF. Expression of stemness-related
surface markers was assessed by flow cytometry n=3 independent experiments, mean ± SD,
* p<0.05, Student’s t-test). ML-Monolayer, S-Spheroid.

Results
65
Figure 31. Flow cytometry analysis for stem cell property upon OSM stimulation.
Upper panel (A) Histograms from flow cytometric analysis of stemness-related cell surface
marker expression on HTR8/SVneo monolayers (ML) and spheroids (S) formed with or
without OSM stimulation for 72 h. M1 indicates negative cells as defined by application of
isotype control antibodies; M2 indicates positive cells. Lower panel (B) Quantification of flow
cytometry results. Expression of stemness-related surface molecules in monolayers was
defined as 1 and that in spheroids was calculated, respectively (n=3; error bars indicate
standard deviation).
CD44
0
1
2
3
4
ML -OSM S -OSM S
+10 ng
S
+50 ng
OSM Stimulation (ng/ml)
Rela
tive e
xp
ressio
n l
evel
CD34
0
1
2
3
4
ML
-OSM
S -OSM S
+10 ng
S
+50 ng
OSM Stimulation (ng/ml)
Rela
tive e
xp
ressio
n l
evel
CD24
0
1
2
3
4
ML -OSM S -OSM S
+10 ng
S
+50 ng
OSM Stimulationt (ng/ml)
Rela
tive e
xp
ressio
n l
evel
B

Discussion
66
CHAPTER 5 DISCUSSION
PIM kinase where reported first in late 1980s in murine leukemia virus (MuLv) that
was related to transcriptional activation of Pim-1 gene with enhanced expression
(Cuypers et al. 1984) (Selten et al. 1984). So far, its expression has been reported in
almost all kind of human cancer (marking its presence to be important in cell survival,
cell progression, cell migration, cell proliferation and apoptosis (Breuer et al. 1989).
There is evidence that its overexpression leads to complications and is responsible
for tumor progression. PIM kinases have three isoforms and all of them are very
similar to each other which may lead to functional interference impairing growth and
survival of cancer (Cuypers et al. 1984). Aberrant expression of PIM kinases is
observed in pancreatic cancer and plays pivotal roles in the regulation of cell cycle,
apoptosis, and properties of stem cells, metabolism, autophagy, drug resistance and
targeted therapy. Blocking the activities of PIM kinases could prevent pancreatic
cancer development (Xu et al. 2014b). PIM kinases are not only involved in cancer
progression but it has been demonstrated that PIM kinases play an important role
during embryonic development (Aksoy et al. 2007, Eichmann et al. 2000). These
findings opened the path to study the role of PIM kinases during pregnancy,
especially on trophoblast cell functions. The role of PIM kinase in trophoblast cells is
unknown so far. The present study analyzes their expression and potential
involvement in LIF-induced intracellular signaling. The current study demonstrates
that LIF increases PIM kinase protein expression in trophoblastic cell lines. The
increase in PIM1 and PIM3 in HTR8/SVneo cells upon LIF stimulation appeared to
be consistent with the finding by another group (Aksoy et al. 2007) where PIM1 and
PIM3 was unregulated by LIF via activation of the STAT3 pathway.
PIM1 expression can be induced by several external stimuli in particularly by
cytokines relevant in the immune system, which led to coining PIM1 kinase as a
“booster” for the immune response (Bachmann und Moroy 2005). There are no
comparisons so far related to PIM kinase functions between human trophoblast
choriocarcinoma. Hence, in this study we have analyzed and compared the mRNA
expression of PIM kinases in normal primary term trophoblast cells, the immortalized
cell line HTR8/SVneo and the choriocarcinoma cell line JEG-3.

Discussion
67
The results obtained from this study provide information about the expression of all
three isoforms. PIM1 and PIM3 is evidently increased upon LIF stimulation in
trophoblast cells, similar to the finding in inducing endothelial differentiation of cardiac
stem cell via PIM1 up regulation (Iwakura et al. 2011). PIM3 was found to be highly
enhanced in pre-malignant tissues in human hepatocellular carcinoma (Fujii et al.
2005).
PIM1 and PIM2 have been reported to be highly expressed in murine cells of
hematopoietic origin and PIM kinases regulate the stability of SOCS-1 (Chen et al.
2002). SOCS have been found to be regulated by cytokines in trophoblast cells
(Fitzgerald et al. 2009). STAT3 mediates trophoblast invasion by LIF induction and
are involved in the fine regulation of immunological and cellular responses (Fitzgerald
et al. 2009) (Poehlmann et al. 2005b). PIM1 kinase is expressed in human myeloid
cells, which was induced by IL-3, G-CSF, GM-CSF and IL-6, which is supporting our
study, results where LIF is a pleotropic function cytokine belonging to the IL-6 family
(Lilly et al. 1992). This cytokine family is responsible for many biological responses
that include immune response, inflammation, hematopoiesis and tumorigenesis by
regulating the cell growth, survival and differentiation. All members use the common
subunit receptor gp130 which activates the JAK/STAT pathway, where STAT3 plays
a vital role in transmitting the signal from the cell membrane to the nucleus (Hirano et
al. 2000). PIM1 kinase is associated esophageal squamous cell carcinoma. Its
overexpression is related with poor prognosis (Liu et al. 2010). PIM1 promotes
tumorigenicity in human prostate cancer cell lines by c-MYC driven transcription
activity (Kim et al. 2010). PIM1 protein expression is regulated by its 5'-untranslated
region and Eukaryotic translation initiation factor 4E (elF-4E) (Hoover et al. 1997).
PIM1 mRNA expression in prostate cancer serves as a diagnostic marker (He et al.
2007). Due to high frequency of PIM1 expression in head and neck squamous cell
cancer of different grades and stages in conjunction with its absence in non-
neoplastic head and neck squamous cell epithelium underlines the functional role of
PIM1 in malign molecular processes (Beier et al. 2007). Frequent down-regulation of
PIM1 mRNA expression in non-small cell lung cancer has been found in association
with lymph node metastases (Warnecke-Eberz et al. 2008). PIM1 is a direct
transcriptional target of HOXA9 and a mediator of its anti-apoptotic and pro-
proliferative effects in early cells.

Discussion
68
HOXA9 is frequently up-regulated in acute myeloid leukemia (Hu et al. 2007). It is
also involved in endometrial receptivity which suggests a connection with PIM1 in
early pregnancy (Xu et al. 2014a). PIM2 kinase plays a key role in ovarian cancer
cells (Musiani et al. 2014). Survival under hypoxic conditions in cancer cells takes
place as they remodel glucose metabolism to support tumor progression. HIF
transcription factor is essential for cellular response to hypoxia. A regulatory
feedback loop between HIF-1α and PIM2 in hepatocellular carcinoma (HepG2) cells
was observed where PIM2 expression was induced upon hypoxia in a HIF-1α-
mediated manner. HIF-1α induced PIM2 expression, a regulatory mode which may
be important for the adaptive responses and antagonizing hypoxia during tumor
progression (Yu et al. 2014). Compared to benign, inflammatory and pre-malignant
conditions, expression of PIM1 mRNA and protein increased significantly in
pancreatic malignancies and the hypoxic cells displayed higher PIM1 mRNA and
protein levels. So, the presence of PIM1 in tumor has a positive prognostic impact
(Reiser-Erkan et al. 2008). PIM3 kinase is expressed in endothelial cells, promoting
vascular tube formation (Zhang et al. 2009) (Yang et al. 2011). The work presented
here demonstrates that all three isoforms of PIM kinases are constitutively expressed
in trophoblast cells. Upon LIF stimulation the expression increases in both cell lines
which are chosen for this study. PIM1 kinase bound to Hsp70 or Hsp90 remains
active, emphasizing the importance of its overall cellular levels. PIM1 levels can be
modulated in cells through degradation and stabilization. On protein level, the
stability of PIM1 is regulated by Hsp90, Hsp70, and the ubiquitin-proteasome
pathway (Shay et al. 2005). Upon LIF stimulation PIM1 expression in our trophoblast
and choriocarcinoma cells was found to be localized in nuclei and cytoplasm as
assessed by immunocytochemistry (ICC) and immunofluorescence (IF) staining.
These observations coincide with findings of PIM1 expression in nuclei in normal
gastric epithelial cells, but more pronounced in cytoplasm of human gastric tumors
(Yan et al. 2012). PIM1 kinase expression in adipocytic neoplasms was localized to
the cytoplasm (Nga et al. 2010) (Telerman et al. 1988). These findings are consistent
with our current findings where immunostaining showed the expression of PIM1,
PIM2 and PIM3 in both HTR8/SVneo and JEG-3 cell lines. PIM1 and PIM3
expression was higher than PIM2 expression in HTR8/SVneo cells whereas in JEG-3
cells, PIM2 and PIM3 were more expressed than PIM1.

Discussion
69
Our investigation could demonstrate that PIM kinases play role in trophoblast cells
during pregnancy. We have proven that LIF regulates this molecule which makes us
to interpret, that LIF is the central mediator of both PIM induction and JAK/STAT
pathway activation.
In our study, the inhibition of PIM kinases resulted in induction of apoptosis and
decrease in cell viability and cell proliferation. PIM kinase signaling is involved in
many pathways, and thus the biological effects of its inhibitor SGI-1776 in trophoblast
in comparison to choriocarcinoma cells might be multifaceted. SGI-1776 is a specific
inhibitor for all three isoforms of PIM kinase activity. Significant transcription inhibition
was observed in an acute myeloid leukemia (AML) cell line and in primary cells,
which is similar to our findings that c-MYC driven transcription is disrupted by PIM
kinase inhibition due to the decrease c-MYC (Ser62) phosphorylation (Fig 11.A)
which is needed for c-MYC stability (Chen et al. 2011) (Kim et al. 2013). SGI-1776
treatment in 4 Mantel cell lymphoma (MCL) cell lines resulted in apoptosis induction
and Phosphorylation of transcription (c-MYC) (Yang et al. 2012). On cell viability nad
proliferation extensive biochemical characterization of SGI-1776 confirmed its
specificity for the three isoforms of the PIM family. Treatment of prostate cancer cells
with SGI-1776 resulted in a dose-dependent reduction in phosphorylation of PIM
kinase substrates that are involved in cell cycle progression and apoptosis. SGI-1776
was able to reduce cell viability in a multidrug resistant prostate cancer cell line
(Mumenthaler et al. 2009). Inhibition of PIM3 kinase causes growth inhibition of
cancer cells by down regulating the expression of pSTAT3 (tyr705) (Chang et al.
2010). Targeting PIM2 kinase by biochemical inhibitors impaired cell growth,
decreased cisplatin-triggered BAD phosphorylation, and sensitized ovarian cancer
cells to drug-induced apoptosis (Musiani et al. 2014). PIM2 kinase is an important
target of treatment for tumor progression and bone loss in myeloma (Hiasa et al.
2015). Chronic lymphocytic leukemia (CLL) cells when treated with SGI-1776
resulted in a dose-dependent induction of apoptosis. Levels of the ant apoptotic
protein BCL-XL were unchanged. However, levels of total c-MYC as well as
phospho-c-MYC (Ser62), a PIM1 target, were decreased after SGI-1776 treatment
(Chen et al. 2009b).

Discussion
70
In murine hematopoietic cells PIM2 kinase phosphorylates BAD (ser112) and
prevents BAD-induced cell death (Yan et al. 2003). PIM1 kinase promotes
inactivation of the pro-apoptotic BAD protein by phosphorylating it at the ser112
gatekeeper site (Aho et al. 2004). The c-myc gene is induced in response to the
proliferative signals elicited by extracellular stimuli, including IL-6. The non-receptor
tyrosine kinases c-src (Barone und Courtneidge 1995) and PIM1 induce BCL-2
expression and inhibits c-MYC-induced apoptosis in a manner that is dependent on
gp130-induced signals. PIM1 kinase acts as activator of the cell cycle pathway in
neuronal death induced by DNA damage (Zhang et al. 2010).
Further, stem cell-like features in three-dimensional (3D) in vitro cultures are used in
cancer research as intermediate models between in vitro cell line cultures and in vivo
tumor models. Spheroid (3D) cancer cell models have gained popularity in stem cell
research. Spheroids and spheroid-like structures are characterized by their well-
rounded shape, the presence of cancer stem cells, and their capacity to be
maintained as free-floating cultures. A multicellular tumor spheroid model was first
described in the early 70s and obtained by culture of cancer cell lines under non-
adherent conditions (Weiswald et al. 2015). In addition, we describe here
applications of spheroid cultures in trophoblast research to investigate the potential
role of LIF which not only supports self-renewal of ESCs but also has a function in
extra-embryonic development, where it promotes trophoblast proliferation,
differentiation, and invasion (Poehlmann et al. 2005a) (Prakash et al. 2011)
(Takahashi et al. 2003). Upon LIF withdrawal, ESC differentiate but not to neural
lineages (Ying et al. 2003). LIF supported the expansion of ESC but did not induce
NANOG expression. LIF supports a totipotent state comparable to early embryonic
cells that co-express embryonic and extra-embryonic determinants (Morgani et al.
2013). There are reports suggesting suitable surface markers to characterize the
stem cell-like features, which are CD44, CD34, CD24 and CD133.
CD44, a hyaluronic acid receptor, is one of the most commonly studied surface
markers, which is expressed by almost every tumor cell. CD24, a heat stable antigen,
is another surface marker expressed in many tumor types (Jaggupilli und Elkord
2012) (Ghosh et al. 2012). From the adenocarcinoma cell line generated spheroids
express CD44 and CD133 as analyzed by flow cytometry (Liu et al. 2015).

Discussion
71
In our study, we have characterized stem cell-like properties in HTR8/SVneo
trophoblast cell models, by analyzing the surface molecules CD44, 34, 24 and
CD133, and the transcription factors NANOG and CDX2. STAT3 signaling regulates
embryonic stem cell fate in a dose-dependent manner (Tai et al. 2014). CD44 and
CD24 were used as CSC markers alone or in combination to identify cancer stem
cells in tumors of the human female reproductive system (Lopez et al. 2013).
Tumorigenic pancreatic cancer cells have been identified using the cell surface
antigens CD44, CD24, and CD133 (Rasheed und Matsui 2012). Human primary
colorectal cancer expresses specific phenotypic profiles, including CD133, CD24,
and CD44 (Muraro et al. 2012) (Wang et al. 2012). Liver CSCs can be identified by
several cell surface antigens, including CD133, CD90, CD44, Epithelial cell adhesion
molecule (EpCAM) and CD133 (Liu et al. 2011) Breast cancer stem cells express the
cell surface phenotype CD44+CD24-/low (Ginestier et al. 2007). High levels of CD44
expression in breast cancer can be used as stem cell marker (Gong et al. 2015). In
breast cancer stem cells, CD44 is involved in regulation of Notch 4 receptor signaling
(Harrison et al. 2010). CD44 positive cells are characteristic markers for
mesenchymal stem cells (NguyenThai et al. 2015). CD44 is expressed in
hepatocellular carcinoma (Feng et al. 2014) and in lung cancer (Alamgeer et al.
2013). A highly tumorigenic subpopulation of pancreatic cancer cells expresses the
cell surface markers CD44, CD24, and epithelial-specific antigen (ESA) (Li et al.
2007). Also head and neck squamous cell carcinomas express CD44 surface antigen
(Sterz et al. 2010).
Non-small cell lung cancer cells expressing CD44 have increased stem cell-like
features (Leung et al. 2010). Therapeutic targeting of stem-like cancer cells via
STAT3 modulation using a nanomedicine approach selectively reduces the CD44+
stem cell population in melanoma (Misra et al. 2015). CD34 is expressed in
peripheral blood stem cells. It functions as adhesion molecule important for cell
migration and regulation in hematopoiesis (Dercksen et al. 1995). Trans membrane
CD34 glycoprotein is the most important marker for identification, isolation and
enumeration of hematopoietic stem cells (HSCs) (Shafaghat et al. 2015).Hence the
above mentioned studies, supports our finding of HTR8/SVneo cells expressing
CD44,CD34 and CD24, which might be potential surface markers for characterizing
stem cell-like features.

Discussion
72
Transcription factors responsible for stem cells are many out of which we analysed
the expression of NANOG and CDX2, these factors in human pluripotent stem cells
is found to be highly expressed in colonies spontaneously differentiated in multiple
lineages, including trophoblast cell lines. Cell lines exhibit totipotent potential and
these properties may have implications for regulation of lineage decisions in the early
embryo (Yang et al. 2015). NANOG stabilizes embryonic stem cells in culture by
resisting or reversing alternative gene expression states (Chambers et al. 2007).
Overexpression of NANOG reduces heterogeneity during embryonic stem cell
maintenance. Interestingly, NANOG heterogeneity does not correlate with the
heterogeneous expression of stage-specific embryonic antigen-1, suggesting that
multiple but overlapping levels of heterogeneity may exist in embryonic stem cells
(Singh et al. 2007). FACS analyses show that multipotent cytotrophoblast cells from
human first trimester chorionic villi cells express markers typical for human stem cells
such as SSEA4, OCT-4, ALP, and CD117. These are present within the
cytotrophoblastic tissue of human fetal chorionic villus samples (CVSs) as also OCT-
4, NANOG, and SOX2 transcripts (Spitalieri et al. 2009). The differentiation of human
embryonic stem cells down regulate the trophoblast lineage, the stemness markers
POU5F1 (OCT4) and NANOG were markedly down-regulated, followed temporally
by up-regulation of the CDX2, KRT7, HLA-G, ID2, CGA, and CGB trophoblast
markers in presence of BMP4 (Marchand et al. 2011). Isolated and re-aggregated
trophectoderm (TE) cells from full human blastocysts are able to develop into
blastocysts with inner cell mass (ICM) cells expressing the pluripotency marker
NANOG. In our hands, HTR8/SVneo cells expressed NANOG in monolayer culture
and spheroids. Upon LIF stimulation, expression of NANOG at higher concentration
(50 ng/ml) in spheroid culture was increased, whereas CDX2 expression was
decreased at higher concentration, this might be due to the properties of LIF, as it is
involved in feedback mechanism
Moreover, the majority of the isolated TE cells which were repositioned in the center
of the embryo do not sort back to their original position but integrate within the ICM
and start to express NANOG (De Paepe et al. 2013). Human trophoblast stem cells
express gene markers of both the trophectoderm and the inner cell mass. They
exhibited genetic and biological characteristics similar to those of human embryonic
stem cells, yet genetically distinct from placenta-derived mesenchymal stem cells.
Discussion
73
Overexpression of transcription factor NANOG was possibly achieved through a
retinoic acid (RA)-induced non-genomic c-Src/Stat3/Nanog signaling pathway
mediated by the subcellular c-Src mRNA localization for the maintenance of
pluripotency in trophoblast neural stem cells (tNSCs) in rats (Lee et al. 2012).
Developmental expression of a number of genes was similar to that in murine
embryos (OCT3B/4, CDX2, and NANOG). However, GATA6 is expressed throughout
pre-implantation development in the human when cultured in Heparin-binding
epidermal growth factor (HBEGF). LIF appears to facilitate human embryo
expression of a number of genes. CDX2 expression is regulated by LIF, removal of
LIF, stimulated CDX2 expression and induced formation of trophoblast stem cells
(TSC) which then were able to differentiate into cells spongiotrophoblast and
trophoblast giant cells (He et al. 2008). This result is consistent to our finding where
CDX2 expression is decreased upon addition of LIF. When MBD3 knockdown cells
were cultured in ES medium without LIF or in trophoblast stem (TS) cell medium,
these cells differentiate into TE cells, which express CDX2 in mouse ES cells (Zhu et
al. 2009) (Suwinska et al. 2010). Trophoblast stem cells under defined culture
conditions express CDX2 in mice (Ohinata und Tsukiyama 2014). Cell growth was
accelerated in an undifferentiated state sustained by LIF in ES cells (Iha et al. 2012).
CD44 interaction activates stem cell marker NANOG, STAT3-mediated multi drug
resistant gene (MDR1) gene expression in breast and ovarian tumor cells
(Bourguignon et al. 2008). NANOG and STAT3 signaling promote microRNA-21
expression and chemoresistance in hyaluronan/CD44-activated head and neck
squamous cell carcinoma cells (Bourguignon et al. 2012).
Our model showed an increase expression of NANOG and CDX2 in the spheroids
with OSM treatment, whereas there was no change in surface markers CD44, CD34
and CD24. OSM shares structure similarities and receptor with LIF (Rose und Bruce
1991). It has been reported in one of the study that OSM and LIF reveal some similar
biological functions in trophoblastic cells (Chaiwangyen et al. 2014). Our studies
exhibit that OSM and LIF (partially) induces the stem cell-like properties in
trophoblast cell model HTR8/SVneo. To our knowledge, this is the first report that
human OSM play a key role in maintaining stem cell-like properties.

Conclusion
74
CHAPTER 6 CONCLUSION
In conclusion, there have been studies done on investigating many molecules that
are involved in several ways contributing its role in regulating to achieve a successful
pregnancy. LIF being very important molecule during pregnancy was taken in the
current study to elucidate the functions of PIM kinases in trophoblast. We
characterized the expression of PIM kinases upon LIF stimulation and inhibiting their
activities by using PIM-Kinase inhibitor IX, SGI-1776 (chemical inhibitor). It was
found that all the three PIM kinases (PIM1, PIM2 and PIM3) were expressed in both
cell lines. The gene and protein expression level were shown to be increased upon
LIF stimulation. Immunostianing data showed the localization and distribution of PIM
kinases in both cells lines, respectively. The functional role of PIM kinase was
elucidated in trophoblast cells where they play a vital role in cell survival and
apoptosis. Further the trophoblast cell model has been characterized for stem cell
like property by staining with surface antigen for studying the phenotype expression
of the markers responsible for stem cell which are CD44, CD34, CD24 and CD133.
The result demonstrated that cells were CD44+ve, CD34+ve, CD24+ and CD133-ve,
proving the self-renewal property of HTR8/SVneo cell, and also expressed stem cell
transcription factors NANOG, CDX2. These expressions were well studied as they
were compared with monolayer culture 2D culture with 3D spheroid culture system,
which provided the information regarding the cells ability to form spheroid that
resembles stem cell-like features. Adding further, upon LIF stimulation, current study
shows the decreased expression of surface markers, increased transcription factors
at higher concentration, fulfilling another function of LIF to be having negative
feedback loop mechanism. Hence these all above data provides a better
understanding of the role of PIM kinases and stem cell-like features in trophoblast
cells for successful pregnancy.
Future Investigations
To elucidate the PIM kinases expression in pregnancy pathology tissue samples and
studies the functional analysis like migration, invasion in trophoblast cell models.

References
viii
CHAPTER 7 REFERENCES
Aaronson DS, Horvath CM. 2002. A road map for those who don't know JAK-STAT. Science, 296 (5573):1653-1655.
Aghajanova L. 2004. Leukemia inhibitory factor and human embryo implantation. Ann N Y Acad Sci, 1034:176-183.
Aho TL, Sandholm J, Peltola KJ, Mankonen HP, Lilly M, Koskinen PJ. 2004. Pim-1 kinase promotes inactivation of the pro-apoptotic Bad protein by phosphorylating it on the Ser112 gatekeeper site. FEBS Lett, 571 (1-3):43-49.
Aksoy I, Sakabedoyan C, Bourillot PY, Malashicheva AB, Mancip J, Knoblauch K, Afanassieff M, Savatier P. 2007. Self-renewal of murine embryonic stem cells is supported by the serine/threonine kinases Pim-1 and Pim-3. Stem Cells, 25 (12):2996-3004.
Alamgeer M, Peacock CD, Matsui W, Ganju V, Watkins DN. 2013. Cancer stem cells in lung cancer: Evidence and controversies. Respirology, 18 (5):757-764.
Anteby EY, Natanson-Yaron S, Greenfield C, Goldman-Wohl D, Haimov-Kochman R, Holzer H, Yagel S. 2005. Human placental Hofbauer cells express sprouty proteins: a possible modulating mechanism of villous branching. Placenta, 26 (6):476-483.
Bachmann M, Moroy T. 2005. The serine/threonine kinase Pim-1. Int J Biochem Cell Biol, 37 (4):726-730.
Bachmann M, Kosan C, Xing PX, Montenarh M, Hoffmann I, Moroy T. 2006. The oncogenic serine/threonine kinase Pim-1 directly phosphorylates and activates the G2/M specific phosphatase Cdc25C. Int J Biochem Cell Biol, 38 (3):430-443.
Barone MV, Courtneidge SA. 1995. Myc but not Fos rescue of PDGF signalling block caused by kinase-inactive Src. Nature, 378 (6556):509-512.
Beharry Z, Mahajan S, Zemskova M, Lin YW, Tholanikunnel BG, Xia Z, Smith CD, Kraft AS. 2011. The Pim protein kinases regulate energy metabolism and cell growth. Proc Natl Acad Sci U S A, 108 (2):528-533.
Beier UH, Weise JB, Laudien M, Sauerwein H, Gorogh T. 2007. Overexpression of Pim-1 in head and neck squamous cell carcinomas. Int J Oncol, 30 (6):1381-1387.
Billington WD. 2003. The immunological problem of pregnancy: 50 years with the hope of progress. A tribute to Peter Medawar. J Reprod Immunol, 60 (1):1-11.
Bischof P, Irminger-Finger I. 2005. The human cytotrophoblastic cell, a mononuclear chameleon. Int J Biochem Cell Biol, 37 (1):1-16.
Blanco-Aparicio C, Carnero A. 2013. Pim kinases in cancer: diagnostic, prognostic and treatment opportunities. Biochem Pharmacol, 85 (5):629-643.
Bourguignon LY, Peyrollier K, Xia W, Gilad E. 2008. Hyaluronan-CD44 interaction activates stem cell marker Nanog, Stat-3-mediated MDR1 gene expression, and ankyrin-regulated multidrug efflux in breast and ovarian tumor cells. J Biol Chem, 283 (25):17635-17651.
Bourguignon LY, Earle C, Wong G, Spevak CC, Krueger K. 2012. Stem cell marker (Nanog) and Stat-3 signaling promote MicroRNA-21 expression and chemoresistance in hyaluronan/CD44-activated head and neck squamous cell carcinoma cells. Oncogene, 31 (2):149-160.

References
ix
Breuer ML, Cuypers HT, Berns A. 1989. Evidence for the involvement of pim-2, a new common proviral insertion site, in progression of lymphomas. EMBO J, 8 (3):743-748.
Brosens JJ, Pijnenborg R, Brosens IA. 2002. The myometrial junctional zone spiral arteries in normal and abnormal pregnancies: a review of the literature. Am J Obstet Gynecol, 187 (5):1416-1423.
Busch S, Renaud SJ, Schleussner E, Graham CH, Markert UR. 2009. mTOR mediates human trophoblast invasion through regulation of matrix-remodeling enzymes and is associated with serine phosphorylation of STAT3. Exp Cell Res, 315 (10):1724-1733.
Carter AM, Enders AC, Pijnenborg R. 2015. The role of invasive trophoblast in implantation and placentation of primates. Philos Trans R Soc Lond B Biol Sci, 370 (1663):20140070.
Chaiwangyen W, Ospina-Prieto S, Morales-Prieto DM, Pereira de Sousa FL, Pastuschek J, Fitzgerald JS, Schleussner E, Markert UR. 2014. Oncostatin M and leukaemia inhibitory factor trigger signal transducer and activator of transcription 3 and extracellular signal-regulated kinase 1/2 pathways but result in heterogeneous cellular responses in trophoblast cells. Reprod Fertil Dev.
Chambers I, Silva J, Colby D, Nichols J, Nijmeijer B, Robertson M, Vrana J, Jones K, Grotewold L, Smith A. 2007. Nanog safeguards pluripotency and mediates germline development. Nature, 450 (7173):1230-1234.
Chang M, Kanwar N, Feng E, Siu A, Liu X, Ma D, Jongstra J. 2010. PIM kinase inhibitors downregulate STAT3(Tyr705) phosphorylation. Mol Cancer Ther, 9 (9):2478-2487.
Chen J, Kobayashi M, Darmanin S, Qiao Y, Gully C, Zhao R, Kondo S, Wang H, Wang H, Yeung SC, Lee MH. 2009a. Hypoxia-mediated up-regulation of Pim-1 contributes to solid tumor formation. Am J Pathol, 175 (1):400-411.
Chen LS, Redkar S, Bearss D, Wierda WG, Gandhi V. 2009b. Pim kinase inhibitor, SGI-1776, induces apoptosis in chronic lymphocytic leukemia cells. Blood, 114 (19):4150-4157.
Chen LS, Redkar S, Taverna P, Cortes JE, Gandhi V. 2011. Mechanisms of cytotoxicity to Pim kinase inhibitor, SGI-1776, in acute myeloid leukemia. Blood, 118 (3):693-702.
Chen XP, Losman JA, Cowan S, Donahue E, Fay S, Vuong BQ, Nawijn MC, Capece D, Cohan VL, Rothman P. 2002. Pim serine/threonine kinases regulate the stability of Socs-1 protein. Proc Natl Acad Sci U S A, 99 (4):2175-2180.
Cohen AM, Grinblat B, Bessler H, Kristt D, Kremer A, Schwartz A, Halperin M, Shalom S, Merkel D, Don J. 2004. Increased expression of the hPim-2 gene in human chronic lymphocytic leukemia and non-Hodgkin lymphoma. Leuk Lymphoma, 45 (5):951-955.
Corvinus FM, Fitzgerald JS, Friedrich K, Markert UR. 2003. Evidence for a correlation between trophoblast invasiveness and STAT3 activity. Am J Reprod Immunol, 50 (4):316-321.
Cottage CT, Neidig L, Sundararaman B, Din S, Joyo AY, Bailey B, Gude N, Hariharan N, Sussman MA. 2012. Increased mitotic rate coincident with transient telomere lengthening resulting from pim-1 overexpression in cardiac progenitor cells. Stem Cells, 30 (11):2512-2522.

References
x
Cottage CT, Bailey B, Fischer KM, Avitable D, Collins B, Tuck S, Quijada P, Gude N, Alvarez R, Muraski J, Sussman MA. 2010. Cardiac progenitor cell cycling stimulated by pim-1 kinase. Circ Res, 106 (5):891-901.
Cuypers HT, Selten G, Quint W, Zijlstra M, Maandag ER, Boelens W, van Wezenbeek P, Melief C, Berns A. 1984. Murine leukemia virus-induced T-cell lymphomagenesis: integration of proviruses in a distinct chromosomal region. Cell, 37 (1):141-150.
Dallagi A, Girouard J, Hamelin-Morrissette J, Dadzie R, Laurent L, Vaillancourt C, Lafond J, Carrier C, Reyes-Moreno C. 2015. The activating effect of IFN-gamma on monocytes/macrophages is regulated by the LIF-trophoblast-IL-10 axis via Stat1 inhibition and Stat3 activation. Cell Mol Immunol, 12 (3):326-341.
Damjanov I. 2014. Decidua and implantation of the embryo from a historical perspective. Int J Dev Biol, 58 (2-4):75-78.
Darnell JE, Jr. 1997. STATs and gene regulation. Science, 277 (5332):1630-1635. Darnell JE, Jr., Kerr IM, Stark GR. 1994. Jak-STAT pathways and transcriptional
activation in response to IFNs and other extracellular signaling proteins. Science, 264 (5164):1415-1421.
De Paepe C, Cauffman G, Verloes A, Sterckx J, Devroey P, Tournaye H, Liebaers I, Van de Velde H. 2013. Human trophectoderm cells are not yet committed. Hum Reprod, 28 (3):740-749.
Dercksen MW, Gerritsen WR, Rodenhuis S, Dirkson MK, Slaper-Cortenbach IC, Schaasberg WP, Pinedo HM, von dem Borne AE, van der Schoot CE. 1995. Expression of adhesion molecules on CD34+ cells: CD34+ L-selectin+ cells predict a rapid platelet recovery after peripheral blood stem cell transplantation. Blood, 85 (11):3313-3319.
Duc-Goiran P, Mignot TM, Bourgeois C, Ferre F. 1999. Embryo-maternal interactions at the implantation site: a delicate equilibrium. Eur J Obstet Gynecol Reprod Biol, 83 (1):85-100.
Eichmann A, Yuan L, Breant C, Alitalo K, Koskinen PJ. 2000. Developmental expression of pim kinases suggests functions also outside of the hematopoietic system. Oncogene, 19 (9):1215-1224.
Emin L, Izard A, Schiavone S, Kermanach P, Deramecourt M, Duclusaud A, Gertych W, Girard S. 2015. [Fetomaternal transfusion and diagnosis of gestational choriocarcinoma]. Gynecol Obstet Fertil, 43 (3):250-252.
Endo Y, Marusawa H, Kinoshita K, Morisawa T, Sakurai T, Okazaki IM, Watashi K, Shimotohno K, Honjo T, Chiba T. 2007. Expression of activation-induced cytidine deaminase in human hepatocytes via NF-kappaB signaling. Oncogene, 26 (38):5587-5595.
Evain-Brion D, Malassine A. 2003. Human placenta as an endocrine organ. Growth Horm IGF Res, 13 Suppl A:S34-37.
Faas MM, Spaans F, De Vos P. 2014. Monocytes and macrophages in pregnancy and pre-eclampsia. Front Immunol, 5:298.
Feist H, Caliebe A, Oates J, Sarioglu N, Hussein K. 2015. Partial hydatidiform mole with extensive angiomatoid vessel configuration in a first trimester miscarriage. Int J Gynecol Pathol, 34 (3):253-256.
Feldman JD, Vician L, Crispino M, Tocco G, Marcheselli VL, Bazan NG, Baudry M, Herschman HR. 1998. KID-1, a protein kinase induced by depolarization in brain. J Biol Chem, 273 (26):16535-16543.

References
xi
Feng D, Wang N, Hu J, Li W. 2014. Surface markers of hepatocellular cancer stem cells and their clinical potential. Neoplasma, 61 (5):505-513.
Fischer KM, Cottage CT, Konstandin MH, Volkers M, Khan M, Sussman MA. 2011. Pim-1 kinase inhibits pathological injury by promoting cardioprotective signaling. J Mol Cell Cardiol, 51 (4):554-558.
Fisher SJ, Cui TY, Zhang L, Hartman L, Grahl K, Zhang GY, Tarpey J, Damsky CH. 1989. Adhesive and degradative properties of human placental cytotrophoblast cells in vitro. J Cell Biol, 109 (2):891-902.
Fitzgerald JS, Toth B, Jeschke U, Schleussner E, Markert UR. 2009. Knocking off the suppressors of cytokine signaling (SOCS): their roles in mammalian pregnancy. J Reprod Immunol, 83 (1-2):117-123.
Friedrich J, Seidel C, Ebner R, Kunz-Schughart LA. 2009. Spheroid-based drug screen: considerations and practical approach. Nat Protoc, 4 (3):309-324.
Froeling FE, Seckl MJ. 2014. Gestational trophoblastic tumours: an update for 2014. Curr Oncol Rep, 16 (11):408.
Frost JM, Moore GE. 2010. The importance of imprinting in the human placenta. PLoS Genet, 6 (7):e1001015.
Fujii C, Nakamoto Y, Lu P, Tsuneyama K, Popivanova BK, Kaneko S, Mukaida N. 2005. Aberrant expression of serine/threonine kinase Pim-3 in hepatocellular carcinoma development and its role in the proliferation of human hepatoma cell lines. Int J Cancer, 114 (2):209-218.
Gammill HS, Stephenson MD, Aydelotte TM, Nelson JL. 2015. Microchimerism in women with recurrent miscarriage. Chimerism:1-3.
Gapter LA, Magnuson NS, Ng KY, Hosick HL. 2006. Pim-1 kinase expression during murine mammary development. Biochem Biophys Res Commun, 345 (3):989-997.
Ghosh SC, Neslihan Alpay S, Klostergaard J. 2012. CD44: a validated target for improved delivery of cancer therapeutics. Expert Opin Ther Targets, 16 (7):635-650.
Gibson DA, Greaves E, Critchley HO, Saunders PT. 2015. Estrogen-dependent regulation of human uterine natural killer cells promotes vascular remodelling via secretion of CCL2. Hum Reprod, 30 (6):1290-1301.
Ginestier C, Korkaya H, Dontu G, Birnbaum D, Wicha MS, Charafe-Jauffret E. 2007. [The cancer stem cell: the breast cancer driver]. Med Sci (Paris), 23 (12):1133-1139.
Gong J, Weng D, Eguchi T, Murshid A, Sherman MY, Song B, Calderwood SK. 2015. Targeting the hsp70 gene delays mammary tumor initiation and inhibits tumor cell metastasis. Oncogene.
Gourvas V, Dalpa E, Konstantinidou A, Vrachnis N, Spandidos DA, Sifakis S. 2012. Angiogenic factors in placentas from pregnancies complicated by fetal growth restriction (review). Mol Med Rep, 6 (1):23-27.
Gundogan F, Bedoya A, Gilligan J, Lau E, Mark P, De Paepe ME, de la Monte SM. 2011. siRNA inhibition of aspartyl-asparaginyl beta-hydroxylase expression impairs cell motility, Notch signaling, and fetal growth. Pathol Res Pract, 207 (9):545-553.
Haig D. 1993. Genetic conflicts in human pregnancy. Q Rev Biol, 68 (4):495-532. Handwerger S. 2010. New insights into the regulation of human cytotrophoblast cell
differentiation. Mol Cell Endocrinol, 323 (1):94-104.

References
xii
Handwerger S, Freemark M. 2000. The roles of placental growth hormone and placental lactogen in the regulation of human fetal growth and development. J Pediatr Endocrinol Metab, 13 (4):343-356.
Harrison H, Farnie G, Howell SJ, Rock RE, Stylianou S, Brennan KR, Bundred NJ, Clarke RB. 2010. Regulation of breast cancer stem cell activity by signaling through the Notch4 receptor. Cancer Res, 70 (2):709-718.
He HC, Bi XC, Dai QS, Wang SS, Wei HA, Zhong WD, Liu WH, Jiang FN, Liu LS. 2007. Detection of pim-1 mRNA in prostate cancer diagnosis. Chin Med J (Engl), 120 (17):1491-1493.
He S, Pant D, Schiffmacher A, Meece A, Keefer CL. 2008. Lymphoid enhancer factor 1-mediated Wnt signaling promotes the initiation of trophoblast lineage differentiation in mouse embryonic stem cells. Stem Cells, 26 (4):842-849.
Hess AP, Hamilton AE, Talbi S, Dosiou C, Nyegaard M, Nayak N, Genbecev-Krtolica O, Mavrogianis P, Ferrer K, Kruessel J, Fazleabas AT, Fisher SJ, Giudice LC. 2007. Decidual stromal cell response to paracrine signals from the trophoblast: amplification of immune and angiogenic modulators. Biol Reprod, 76 (1):102-117.
Hiasa M, Teramachi J, Oda A, Amachi R, Harada T, Nakamura S, Miki H, Fujii S, Kagawa K, Watanabe K, Endo I, Kuroda Y, Yoneda T, Tsuji D, Nakao M, Tanaka E, Hamada K, Sano S, Itoh K, Matsumoto T, Abe M. 2015. Pim-2 kinase is an important target of treatment for tumor progression and bone loss in myeloma. Leukemia, 29 (1):207-217.
Hirano T, Ishihara K, Hibi M. 2000. Roles of STAT3 in mediating the cell growth, differentiation and survival signals relayed through the IL-6 family of cytokine receptors. Oncogene, 19 (21):2548-2556.
Hoesli I, Danek M, Lin D, Li Y, Hahn S, Holzgreve W. 2002. Circulating erythroblasts in maternal blood are not elevated before onset of preterm labor. Obstet Gynecol, 100 (5 Pt 1):992-996.
Hogan C, Hutchison C, Marcar L, Milne D, Saville M, Goodlad J, Kernohan N, Meek D. 2008. Elevated levels of oncogenic protein kinase Pim-1 induce the p53 pathway in cultured cells and correlate with increased Mdm2 in mantle cell lymphoma. J Biol Chem, 283 (26):18012-18023.
Hohn HP, Denker HW. 2002. Experimental modulation of cell-cell adhesion, invasiveness and differentiation in trophoblast cells. Cells Tissues Organs, 172 (3):218-236.
Hoover DS, Wingett DG, Zhang J, Reeves R, Magnuson NS. 1997. Pim-1 protein expression is regulated by its 5'-untranslated region and translation initiation factor elF-4E. Cell Growth Differ, 8 (12):1371-1380.
Hu YL, Passegue E, Fong S, Largman C, Lawrence HJ. 2007. Evidence that the Pim1 kinase gene is a direct target of HOXA9. Blood, 109 (11):4732-4738.
Hunkapiller NM, Fisher SJ. 2008. Chapter 12. Placental remodeling of the uterine vasculature. Methods Enzymol, 445:281-302.
Iha M, Watanabe M, Kihara Y, Sugawara S, Saito K, Soma M, Sato S, Mori Y, Kasuga K, Kojima I, Sasamura R, Murata J, Kobayashi M. 2012. Effect of ectopic expression of homeoprotein EGAM1C on the cell morphology, growth, and differentiation in a mouse embryonic stem cell line, MG1.19 cells. Reproduction, 143 (4):477-489.
Iruela-Arispe ML. 1997. Normal placentation: a tale that requires an epithelial-to-endothelial conversion. J Clin Invest, 99 (9):2057-2058.

References
xiii
Iwakura T, Mohri T, Hamatani T, Obana M, Yamashita T, Maeda M, Katakami N, Kaneto H, Oka T, Komuro I, Azuma J, Nakayama H, Fujio Y. 2011. STAT3/Pim-1 signaling pathway plays a crucial role in endothelial differentiation of cardiac resident Sca-1+ cells both in vitro and in vivo. J Mol Cell Cardiol, 51 (2):207-214.
Jaggupilli A, Elkord E. 2012. Significance of CD44 and CD24 as cancer stem cell markers: an enduring ambiguity. Clin Dev Immunol, 2012:708036.
Jatiani SS, Baker SJ, Silverman LR, Reddy EP. 2010. Jak/STAT pathways in cytokine signaling and myeloproliferative disorders: approaches for targeted therapies. Genes Cancer, 1 (10):979-993.
Jovanovic M, Stefanoska I, Radojcic L, Vicovac L. 2010. Interleukin-8 (CXCL8) stimulates trophoblast cell migration and invasion by increasing levels of matrix metalloproteinase (MMP)2 and MMP9 and integrins alpha5 and beta1. Reproduction, 139 (4):789-798.
Khoo SK. 2003. Clinical aspects of gestational trophoblastic disease: a review based partly on 25-year experience of a statewide registry. Aust N Z J Obstet Gynaecol, 43 (4):280-289.
Kim J, Roh M, Abdulkadir SA. 2010. Pim1 promotes human prostate cancer cell tumorigenicity and c-MYC transcriptional activity. BMC Cancer, 10:248.
Kim KT, Baird K, Ahn JY, Meltzer P, Lilly M, Levis M, Small D. 2005. Pim-1 is up-regulated by constitutively activated FLT3 and plays a role in FLT3-mediated cell survival. Blood, 105 (4):1759-1767.
Kim W, Youn H, Kwon T, Kang J, Kim E, Son B, Yang HJ, Jung Y, Youn B. 2013. PIM1 kinase inhibitors induce radiosensitization in non-small cell lung cancer cells. Pharmacol Res, 70 (1):90-101.
Kliman HJ, Nestler JE, Sermasi E, Sanger JM, Strauss JF, 3rd. 1986. Purification, characterization, and in vitro differentiation of cytotrophoblasts from human term placentae. Endocrinology, 118 (4):1567-1582.
Knofler M. 2010. Critical growth factors and signalling pathways controlling human trophoblast invasion. Int J Dev Biol, 54 (2-3):269-280.
Koldovsky U. 1999. [Combined aspects of pregnancy and tumor immunology]. Zentralbl Gynakol, 121 (4):185-189.
Landry DW, Zucker HA. 2004. Embryonic death and the creation of human embryonic stem cells. J Clin Invest, 114 (9):1184-1186.
Lansdown A, Rees DA. 2011. Endocrine oncology in pregnancy. Best Pract Res Clin Endocrinol Metab, 25 (6):911-926.
Lapidot T, Sirard C, Vormoor J, Murdoch B, Hoang T, Caceres-Cortes J, Minden M, Paterson B, Caligiuri MA, Dick JE. 1994. A cell initiating human acute myeloid leukaemia after transplantation into SCID mice. Nature, 367 (6464):645-648.
Lash GE, Ernerudh J. 2015. Decidual cytokines and pregnancy complications: focus on spontaneous miscarriage. J Reprod Immunol, 108:83-89.
Lee JH, Ulrich B, Cho J, Park J, Kim CH. 2011a. Progesterone promotes differentiation of human cord blood fetal T cells into T regulatory cells but suppresses their differentiation into Th17 cells. J Immunol, 187 (4):1778-1787.
Lee JY, Lee M, Lee SK. 2011b. Role of endometrial immune cells in implantation. Clin Exp Reprod Med, 38 (3):119-125.
Lee TT, Tsai CF, Hsieh TH, Chen JJ, Wang YC, Kao MC, Wu RM, Singh S, Tsai EM, Lee JN. 2012. Ectopic pregnancy-derived human trophoblastic stem cells regenerate dopaminergic nigrostriatal pathway to treat parkinsonian rats. PLoS One, 7 (12):e52491.

References
xiv
Leung CO, Wong CC, Fan DN, Kai AK, Tung EK, Xu IM, Ng IO, Lo RC. 2015. PIM1 regulates glycolysis and promotes tumor progression in hepatocellular carcinoma. Oncotarget, 6 (13):10880-10892.
Leung EL, Fiscus RR, Tung JW, Tin VP, Cheng LC, Sihoe AD, Fink LM, Ma Y, Wong MP. 2010. Non-small cell lung cancer cells expressing CD44 are enriched for stem cell-like properties. PLoS One, 5 (11):e14062.
Li C, Heidt DG, Dalerba P, Burant CF, Zhang L, Adsay V, Wicha M, Clarke MF, Simeone DM. 2007. Identification of pancreatic cancer stem cells. Cancer Res, 67 (3):1030-1037.
Li YY, Mukaida N. 2014. Pathophysiological roles of Pim-3 kinase in pancreatic cancer development and progression. World J Gastroenterol, 20 (28):9392-9404.
Lilly M, Le T, Holland P, Hendrickson SL. 1992. Sustained expression of the pim-1 kinase is specifically induced in myeloid cells by cytokines whose receptors are structurally related. Oncogene, 7 (4):727-732.
Lin JX, Mietz J, Modi WS, John S, Leonard WJ. 1996. Cloning of human Stat5B. Reconstitution of interleukin-2-induced Stat5A and Stat5B DNA binding activity in COS-7 cells. J Biol Chem, 271 (18):10738-10744.
Liu HT, Wang N, Wang X, Li SL. 2010. Overexpression of Pim-1 is associated with poor prognosis in patients with esophageal squamous cell carcinoma. J Surg Oncol, 102 (6):683-688.
Liu LL, Fu D, Ma Y, Shen XZ. 2011. The power and the promise of liver cancer stem cell markers. Stem Cells Dev, 20 (12):2023-2030.
Liu W, Moulay M, Willenbrock S, Roolf C, Junghanss C, Ngenazahayo A, Nolte I, Murua Escobar H. 2015. Comparative characterization of stem cell marker expression, metabolic activity and resistance to doxorubicin in adherent and spheroid cells derived from the canine prostate adenocarcinoma cell line CT1258. Anticancer Res, 35 (4):1917-1927.
Lopez J, Valdez-Morales FJ, Benitez-Bribiesca L, Cerbon M, Carranca AG. 2013. Normal and cancer stem cells of the human female reproductive system. Reprod Biol Endocrinol, 11:53.
Lunghi L, Ferretti ME, Medici S, Biondi C, Vesce F. 2007. Control of human trophoblast function. Reprod Biol Endocrinol, 5:6.
Mahalingam D, Espitia CM, Medina EC, Esquivel JA, 2nd, Kelly KR, Bearss D, Choy G, Taverna P, Carew JS, Giles FJ, Nawrocki ST. 2011. Targeting PIM kinase enhances the activity of sunitinib in renal cell carcinoma. Br J Cancer, 105 (10):1563-1573.
Marchand M, Horcajadas JA, Esteban FJ, McElroy SL, Fisher SJ, Giudice LC. 2011. Transcriptomic signature of trophoblast differentiation in a human embryonic stem cell model. Biol Reprod, 84 (6):1258-1271.
Massuto DA, Kneese EC, Johnson GA, Burghardt RC, Hooper RN, Ing NH, Jaeger LA. 2010. Transforming growth factor beta (TGFB) signaling is activated during porcine implantation: proposed role for latency-associated peptide interactions with integrins at the conceptus-maternal interface. Reproduction, 139 (2):465-478.
Mathieu ME, Saucourt C, Mournetas V, Gauthereau X, Theze N, Praloran V, Thiebaud P, Boeuf H. 2012. LIF-dependent signaling: new pieces in the Lego. Stem Cell Rev, 8 (1):1-15.
Matthiesen L, Berg G, Ernerudh J, Ekerfelt C, Jonsson Y, Sharma S. 2005. Immunology of preeclampsia. Chem Immunol Allergy, 89:49-61.
References
xv
Mi S, Lee X, Li X, Veldman GM, Finnerty H, Racie L, LaVallie E, Tang XY, Edouard P, Howes S, Keith JC, Jr., McCoy JM. 2000. Syncytin is a captive retroviral envelope protein involved in human placental morphogenesis. Nature, 403 (6771):785-789.
Misra SK, Jensen TW, Pan D. 2015. Enriched inhibition of cancer and stem-like cancer cells via STAT-3 modulating niclocelles. Nanoscale, 7 (16):7127-7132.
Mizuno K, Shirogane T, Shinohara A, Iwamatsu A, Hibi M, Hirano T. 2001. Regulation of Pim-1 by Hsp90. Biochem Biophys Res Commun, 281 (3):663-669.
Mohsin S, Khan M, Nguyen J, Alkatib M, Siddiqi S, Hariharan N, Wallach K, Monsanto M, Gude N, Dembitsky W, Sussman MA. 2013. Rejuvenation of human cardiac progenitor cells with Pim-1 kinase. Circ Res, 113 (10):1169-1179.
Moore JM, Nahlen B, Ofulla AV, Caba J, Ayisi J, Oloo A, Misore A, Nahmias AJ, Lal AA, Udhayakumar V. 1997. A simple perfusion technique for isolation of maternal intervillous blood mononuclear cells from human placentae. J Immunol Methods, 209 (1):93-104.
Morgani SM, Canham MA, Nichols J, Sharov AA, Migueles RP, Ko MS, Brickman JM. 2013. Totipotent embryonic stem cells arise in ground-state culture conditions. Cell Rep, 3 (6):1945-1957.
Mumenthaler SM, Ng PY, Hodge A, Bearss D, Berk G, Kanekal S, Redkar S, Taverna P, Agus DB, Jain A. 2009. Pharmacologic inhibition of Pim kinases alters prostate cancer cell growth and resensitizes chemoresistant cells to taxanes. Mol Cancer Ther, 8 (10):2882-2893.
Muraro MG, Mele V, Daster S, Han J, Heberer M, Cesare Spagnoli G, Iezzi G. 2012. CD133+, CD166+CD44+, and CD24+CD44+ phenotypes fail to reliably identify cell populations with cancer stem cell functional features in established human colorectal cancer cell lines. Stem Cells Transl Med, 1 (8):592-603.
Murray PJ. 2007. The JAK-STAT signaling pathway: input and output integration. J Immunol, 178 (5):2623-2629.
Musiani D, Hammond DE, Cirillo L, Erriquez J, Olivero M, Clague MJ, Di Renzo MF. 2014. PIM2 kinase is induced by cisplatin in ovarian cancer cells and limits drug efficacy. J Proteome Res, 13 (11):4970-4982.
Myllynen P, Pasanen M, Pelkonen O. 2005. Human placenta: a human organ for developmental toxicology research and biomonitoring. Placenta, 26 (5):361-371.
Narlik-Grassow M, Blanco-Aparicio C, Carnero A. 2014. The PIM family of serine/threonine kinases in cancer. Med Res Rev, 34 (1):136-159.
Narlik-Grassow M, Blanco-Aparicio C, Cecilia Y, Peregrina S, Garcia-Serelde B, Munoz-Galvan S, Canamero M, Carnero A. 2012. The essential role of PIM kinases in sarcoma growth and bone invasion. Carcinogenesis, 33 (8):1479-1486.
Natarajan K, Xie Y, Burcu M, Linn DE, Qiu Y, Baer MR. 2013. Pim-1 kinase phosphorylates and stabilizes 130 kDa FLT3 and promotes aberrant STAT5 signaling in acute myeloid leukemia with FLT3 internal tandem duplication. PLoS One, 8 (9):e74653.
Nawijn MC, Alendar A, Berns A. 2011. For better or for worse: the role of Pim oncogenes in tumorigenesis. Nat Rev Cancer, 11 (1):23-34.

References
xvi
Nga ME, Swe NN, Chen KT, Shen L, Lilly MB, Chan SP, Salto-Tellez M, Das K. 2010. PIM-1 kinase expression in adipocytic neoplasms: diagnostic and biological implications. Int J Exp Pathol, 91 (1):34-43.
NguyenThai QA, Sharma N, Luong do H, Sodhi SS, Kim JH, Kim N, Oh SJ, Jeong DK. 2015. Targeted inhibition of osteosarcoma tumor growth by bone marrow-derived mesenchymal stem cells expressing cytosine deaminase/5-fluorocytosine in tumor-bearing mice. J Gene Med, 17 (3-5):87-99.
Norwitz ER. 2006. Defective implantation and placentation: laying the blueprint for pregnancy complications. Reprod Biomed Online, 13 (4):591-599.
Ohinata Y, Tsukiyama T. 2014. Establishment of trophoblast stem cells under defined culture conditions in mice. PLoS One, 9 (9):e107308.
Orsi NM. 2008. Cytokine networks in the establishment and maintenance of pregnancy. Hum Fertil (Camb), 11 (4):222-230.
Peltola KJ, Paukku K, Aho TL, Ruuska M, Silvennoinen O, Koskinen PJ. 2004. Pim-1 kinase inhibits STAT5-dependent transcription via its interactions with SOCS1 and SOCS3. Blood, 103 (10):3744-3750.
Peng YH, Li JJ, Xie FW, Chen JF, Yu YH, Ouyang XN, Liang HJ. 2013. Expression of pim-1 in tumors, tumor stroma and tumor-adjacent mucosa co-determines the prognosis of colon cancer patients. PLoS One, 8 (10):e76693.
Perrier d'Hauterive S, Charlet-Renard C, Berndt S, Dubois M, Munaut C, Goffin F, Hagelstein MT, Noel A, Hazout A, Foidart JM, Geenen V. 2004. Human chorionic gonadotropin and growth factors at the embryonic-endometrial interface control leukemia inhibitory factor (LIF) and interleukin 6 (IL-6) secretion by human endometrial epithelium. Hum Reprod, 19 (11):2633-2643.
Pijnenborg R, Bland JM, Robertson WB, Brosens I. 1983. Uteroplacental arterial changes related to interstitial trophoblast migration in early human pregnancy. Placenta, 4 (4):397-413.
Poehlmann TG, Fitzgerald JS, Meissner A, Wengenmayer T, Schleussner E, Friedrich K, Markert UR. 2005a. Trophoblast invasion: tuning through LIF, signalling via Stat3. Placenta, 26 Suppl A:S37-41.
Poehlmann TG, Busch S, Mussil B, Winzer H, Weinert J, Mebes I, Schaumann A, Fitzgerald JS, Markert UR. 2005b. The possible role of the Jak/STAT pathway in lymphocytes at the fetomaternal interface. Chem Immunol Allergy, 89:26-35.
Pollheimer J, Knofler M. 2005. Signalling pathways regulating the invasive differentiation of human trophoblasts: a review. Placenta, 26 Suppl A:S21-30.
Prakash GJ, Suman P, Morales Prieto DM, Markert UR, Gupta SK. 2011. Leukaemia inhibitory factor mediated proliferation of HTR-8/SVneo trophoblast cells is dependent on activation of extracellular signal-regulated kinase 1/2. Reprod Fertil Dev, 23 (5):714-724.
Prins JR, Gomez-Lopez N, Robertson SA. 2012. Interleukin-6 in pregnancy and gestational disorders. J Reprod Immunol, 95 (1-2):1-14.
Prutsch N, Fock V, Haslinger P, Haider S, Fiala C, Pollheimer J, Knofler M. 2012. The role of interleukin-1beta in human trophoblast motility. Placenta, 33 (9):696-703.
Quenby S, Brosens JJ. 2013. Human implantation: a tale of mutual maternal and fetal attraction. Biol Reprod, 88 (3):81.
Rasheed ZA, Matsui W. 2012. Biological and clinical relevance of stem cells in pancreatic adenocarcinoma. J Gastroenterol Hepatol, 27 Suppl 2:15-18.

References
xvii
Red-Horse K, Zhou Y, Genbacev O, Prakobphol A, Foulk R, McMaster M, Fisher SJ. 2004. Trophoblast differentiation during embryo implantation and formation of the maternal-fetal interface. J Clin Invest, 114 (6):744-754.
Reiser-Erkan C, Erkan M, Pan Z, Bekasi S, Giese NA, Streit S, Michalski CW, Friess H, Kleeff J. 2008. Hypoxia-inducible proto-oncogene Pim-1 is a prognostic marker in pancreatic ductal adenocarcinoma. Cancer Biol Ther, 7 (9):1352-1359.
Resch ZT, Chen BK, Bale LK, Oxvig C, Overgaard MT, Conover CA. 2004. Pregnancy-associated plasma protein a gene expression as a target of inflammatory cytokines. Endocrinology, 145 (3):1124-1129.
Reya T, Morrison SJ, Clarke MF, Weissman IL. 2001. Stem cells, cancer, and cancer stem cells. Nature, 414 (6859):105-111.
Rose TM, Bruce AG. 1991. Oncostatin M is a member of a cytokine family that includes leukemia-inhibitory factor, granulocyte colony-stimulating factor, and interleukin 6. Proc Natl Acad Sci U S A, 88 (19):8641-8645.
Saito S. 2000. Cytokine network at the feto-maternal interface. J Reprod Immunol, 47 (2):87-103.
Salamonsen LA, Dimitriadis E, Jones RL, Nie G. 2003. Complex regulation of decidualization: a role for cytokines and proteases--a review. Placenta, 24 Suppl A:S76-85.
Salleh N, Giribabu N. 2014. Leukemia inhibitory factor: roles in embryo implantation and in nonhormonal contraception. ScientificWorldJournal, 2014:201514.
Santoro N, Goldsmith LT, Heller D, Illsley N, McGovern P, Molina C, Peters S, Skurnick JH, Forst C, Weiss G. 2000. Luteal progesterone relates to histological endometrial maturation in fertile women. J Clin Endocrinol Metab, 85 (11):4207-4211.
Saris CJ, Domen J, Berns A. 1991. The pim-1 oncogene encodes two related protein-serine/threonine kinases by alternative initiation at AUG and CUG. EMBO J, 10 (3):655-664.
Schaefer TS, Sanders LK, Nathans D. 1995. Cooperative transcriptional activity of Jun and Stat3 beta, a short form of Stat3. Proc Natl Acad Sci U S A, 92 (20):9097-9101.
Scioscia M, Karumanchi SA, Goldman-Wohl D, Robillard PY. 2015. Endothelial dysfunction and metabolic syndrome in preeclampsia: an alternative viewpoint. J Reprod Immunol, 108:42-47.
Selten G, Cuypers HT, Zijlstra M, Melief C, Berns A. 1984. Involvement of c-myc in MuLV-induced T cell lymphomas in mice: frequency and mechanisms of activation. EMBO J, 3 (13):3215-3222.
Sengupta S, Peterson TR, Sabatini DM. 2010. Regulation of the mTOR complex 1 pathway by nutrients, growth factors, and stress. Mol Cell, 40 (2):310-322.
Shafaghat F, Abbasi-Kenarsari H, Majidi J, Movassaghpour AA, Shanehbandi D, Kazemi T. 2015. Preparation of Proper Immunogen by Cloning and Stable Expression of cDNA coding for Human Hematopoietic Stem Cell Marker CD34 in NIH-3T3 Mouse Fibroblast Cell Line. Adv Pharm Bull, 5 (1):69-75.
Shahine L, Lathi R. 2015. Recurrent pregnancy loss: evaluation and treatment. Obstet Gynecol Clin North Am, 42 (1):117-134.
Sharma A, Kumar P. 2012. Understanding implantation window, a crucial phenomenon. J Hum Reprod Sci, 5 (1):2-6.

References
xviii
Shay KP, Wang Z, Xing PX, McKenzie IF, Magnuson NS. 2005. Pim-1 kinase stability is regulated by heat shock proteins and the ubiquitin-proteasome pathway. Mol Cancer Res, 3 (3):170-181.
Sherwin JR, Freeman TC, Stephens RJ, Kimber S, Smith AG, Chambers I, Smith SK, Sharkey AM. 2004. Identification of genes regulated by leukemia-inhibitory factor in the mouse uterus at the time of implantation. Mol Endocrinol, 18 (9):2185-2195.
Shih Ie M. 2011. Trophoblastic vasculogenic mimicry in gestational choriocarcinoma. Mod Pathol, 24 (5):646-652.
Sifakis S, Koukou Z, Spandidos DA. 2015. Cell-free fetal DNA and pregnancy-related complications (review). Mol Med Rep, 11 (4):2367-2372.
Simons FE, Schatz M. 2012. Anaphylaxis during pregnancy. J Allergy Clin Immunol, 130 (3):597-606.
Singh AM, Hamazaki T, Hankowski KE, Terada N. 2007. A heterogeneous expression pattern for Nanog in embryonic stem cells. Stem Cells, 25 (10):2534-2542.
Sivasubramaiyan K, Totey S, Bhat V, Totey SM, Deb K. 2009. Y-27632 enhances differentiation of blastocyst like cystic human embryoid bodies to endocrinologically active trophoblast cells on a biomimetic platform. J Biomed Sci, 16:88.
Soares MJ, Chakraborty D, Karim Rumi MA, Konno T, Renaud SJ. 2012. Rat placentation: an experimental model for investigating the hemochorial maternal-fetal interface. Placenta, 33 (4):233-243.
Soncin F, Natale D, Parast MM. 2015. Signaling pathways in mouse and human trophoblast differentiation: a comparative review. Cell Mol Life Sci, 72 (7):1291-1302.
Song H, Lim H, Das SK, Paria BC, Dey SK. 2000. Dysregulation of EGF family of growth factors and COX-2 in the uterus during the preattachment and attachment reactions of the blastocyst with the luminal epithelium correlates with implantation failure in LIF-deficient mice. Mol Endocrinol, 14 (8):1147-1161.
Spitalieri P, Cortese G, Pietropolli A, Filareto A, Dolci S, Klinger FG, Giardina E, Di Cesare S, Bernardini L, Lauro D, Scaldaferri ML, Citro G, Novelli G, De Felici M, Sangiuolo F. 2009. Identification of multipotent cytotrophoblast cells from human first trimester chorionic villi. Cloning Stem Cells, 11 (4):535-556.
Srivastava A, Sengupta J, Kriplani A, Roy KK, Ghosh D. 2013. Profiles of cytokines secreted by isolated human endometrial cells under the influence of chorionic gonadotropin during the window of embryo implantation. Reprod Biol Endocrinol, 11:116.
Starkey PM, Sargent IL, Redman CW. 1988. Cell populations in human early pregnancy decidua: characterization and isolation of large granular lymphocytes by flow cytometry. Immunology, 65 (1):129-134.
Sterz CM, Kulle C, Dakic B, Makarova G, Bottcher MC, Bette M, Werner JA, Mandic R. 2010. A basal-cell-like compartment in head and neck squamous cell carcinomas represents the invasive front of the tumor and is expressing MMP-9. Oral Oncol, 46 (2):116-122.
Su RW, Jia B, Ni H, Lei W, Yue SL, Feng XH, Deng WB, Liu JL, Zhao ZA, Wang TS, Yang ZM. 2012. Junctional adhesion molecule 2 mediates the interaction between hatched blastocyst and luminal epithelium: induction by progesterone and LIF. PLoS One, 7 (4):e34325.

References
xix
Suman P, Poehlmann TG, Prakash GJ, Markert UR, Gupta SK. 2009. Interleukin-11 increases invasiveness of JEG-3 choriocarcinoma cells by modulating STAT3 expression. J Reprod Immunol, 82 (1):1-11.
Suwinska A, Tarkowski AK, Ciemerych MA. 2010. Pluripotency of bank vole embryonic cells depends on FGF2 and activin A signaling pathways. Int J Dev Biol, 54 (1):113-124.
Szekeres-Bartho J, Halasz M, Palkovics T. 2009. Progesterone in pregnancy; receptor-ligand interaction and signaling pathways. J Reprod Immunol, 83 (1-2):60-64.
Tai CI, Schulze EN, Ying QL. 2014. Stat3 signaling regulates embryonic stem cell fate in a dose-dependent manner. Biol Open, 3 (10):958-965.
Takahashi Y, Carpino N, Cross JC, Torres M, Parganas E, Ihle JN. 2003. SOCS3: an essential regulator of LIF receptor signaling in trophoblast giant cell differentiation. EMBO J, 22 (3):372-384.
Tanaka S, Nakanishi MO, Shiota K. 2014. DNA methylation and its role in the trophoblast cell lineage. Int J Dev Biol, 58 (2-4):231-238.
Telerman A, Amson R, Zakut-Houri R, Givol D. 1988. Identification of the human pim-1 gene product as a 33-kilodalton cytoplasmic protein with tyrosine kinase activity. Mol Cell Biol, 8 (4):1498-1503.
Thomson JA, Marshall VS. 1998. Primate embryonic stem cells. Curr Top Dev Biol, 38:133-165.
Thomson JA, Kalishman J, Golos TG, Durning M, Harris CP, Becker RA, Hearn JP. 1995. Isolation of a primate embryonic stem cell line. Proc Natl Acad Sci U S A, 92 (17):7844-7848.
Thomson JA, Itskovitz-Eldor J, Shapiro SS, Waknitz MA, Swiergiel JJ, Marshall VS, Jones JM. 1998. Embryonic stem cell lines derived from human blastocysts. Science, 282 (5391):1145-1147.
Toder V, Fein A, Carp H, Torchinsky A. 2003. TNF-alpha in pregnancy loss and embryo maldevelopment: a mediator of detrimental stimuli or a protector of the fetoplacental unit? J Assist Reprod Genet, 20 (2):73-81.
Trundley A, Moffett A. 2004. Human uterine leukocytes and pregnancy. Tissue Antigens, 63 (1):1-12.
Tuch BE. 2006. Stem cells--a clinical update. Aust Fam Physician, 35 (9):719-721. Tuckey RC. 2005. Progesterone synthesis by the human placenta. Placenta, 26
(4):273-281. VanWijk MJ, Kublickiene K, Boer K, VanBavel E. 2000. Vascular function in
preeclampsia. Cardiovasc Res, 47 (1):38-48. Wang C, Xie J, Guo J, Manning HC, Gore JC, Guo N. 2012. Evaluation of CD44 and
CD133 as cancer stem cell markers for colorectal cancer. Oncol Rep, 28 (4):1301-1308.
Wang J, Lao L, Zhao H, Huang Y. 2014. Serine threonine kinase Pim-3 regulates STAT3 pathway to inhibit proliferation of human liver cancers. Int J Clin Exp Med, 7 (2):348-355.
Wang X, Wang H, Matsumoto H, Roy SK, Das SK, Paria BC. 2002a. Dual source and target of heparin-binding EGF-like growth factor during the onset of implantation in the hamster. Development, 129 (17):4125-4134.
Wang Z, Bhattacharya N, Mixter PF, Wei W, Sedivy J, Magnuson NS. 2002b. Phosphorylation of the cell cycle inhibitor p21Cip1/WAF1 by Pim-1 kinase. Biochim Biophys Acta, 1593 (1):45-55.

References
xx
Warfel NA, Kraft AS. 2015. PIM kinase (and Akt) biology and signaling in tumors. Pharmacol Ther.
Warnecke-Eberz U, Bollschweiler E, Drebber U, Pohl A, Baldus SE, Hoelscher AH, Metzger R. 2008. Frequent down-regulation of pim-1 mRNA expression in non-small cell lung cancer is associated with lymph node metastases. Oncol Rep, 20 (3):619-624.
Weiswald LB, Bellet D, Dangles-Marie V. 2015. Spherical cancer models in tumor biology. Neoplasia, 17 (1):1-15.
Wernig G, Kharas MG, Okabe R, Moore SA, Leeman DS, Cullen DE, Gozo M, McDowell EP, Levine RL, Doukas J, Mak CC, Noronha G, Martin M, Ko YD, Lee BH, Soll RM, Tefferi A, Hood JD, Gilliland DG. 2008. Efficacy of TG101348, a selective JAK2 inhibitor, in treatment of a murine model of JAK2V617F-induced polycythemia vera. Cancer Cell, 13 (4):311-320.
Xie Y, Xu K, Dai B, Guo Z, Jiang T, Chen H, Qiu Y. 2006. The 44 kDa Pim-1 kinase directly interacts with tyrosine kinase Etk/BMX and protects human prostate cancer cells from apoptosis induced by chemotherapeutic drugs. Oncogene, 25 (1):70-78.
Xu B, Geerts D, Bu Z, Ai J, Jin L, Li Y, Zhang H, Zhu G. 2014a. Regulation of endometrial receptivity by the highly expressed HOXA9, HOXA11 and HOXD10 HOX-class homeobox genes. Hum Reprod, 29 (4):781-790.
Xu J, Zhang T, Wang T, You L, Zhao Y. 2014b. PIM kinases: an overview in tumors and recent advances in pancreatic cancer. Future Oncol, 10 (5):865-876.
Yan B, Zemskova M, Holder S, Chin V, Kraft A, Koskinen PJ, Lilly M. 2003. The PIM-2 kinase phosphorylates BAD on serine 112 and reverses BAD-induced cell death. J Biol Chem, 278 (46):45358-45367.
Yan B, Yau EX, Samanta S, Ong CW, Yong KJ, Ng LK, Bhattacharya B, Lim KH, Soong R, Yeoh KG, Deng N, Tan P, Lam Y, Salto-Tellez M, Singapore Gastric Cancer C. 2012. Clinical and therapeutic relevance of PIM1 kinase in gastric cancer. Gastric Cancer, 15 (2):188-197.
Yang H, Wang Y, Qian H, Zhang P, Huang C. 2011. Pim protein kinase-3 is regulated by TNF-alpha and promotes endothelial cell sprouting. Mol Cells, 32 (3):235-241.
Yang Q, Chen LS, Neelapu SS, Miranda RN, Medeiros LJ, Gandhi V. 2012. Transcription and translation are primary targets of Pim kinase inhibitor SGI-1776 in mantle cell lymphoma. Blood, 120 (17):3491-3500.
Yang Y, Adachi K, Sheridan MA, Alexenko AP, Schust DJ, Schulz LC, Ezashi T, Roberts RM. 2015. Heightened potency of human pluripotent stem cell lines created by transient BMP4 exposure. Proc Natl Acad Sci U S A, 112 (18):E2337-2346.
Yessoufou A, Moutairou K. 2011. Maternal diabetes in pregnancy: early and long-term outcomes on the offspring and the concept of "metabolic memory". Exp Diabetes Res, 2011:218598.
Ying QL, Nichols J, Chambers I, Smith A. 2003. BMP induction of Id proteins suppresses differentiation and sustains embryonic stem cell self-renewal in collaboration with STAT3. Cell, 115 (3):281-292.
Yu Z, Zhao X, Ge Y, Zhang T, Huang L, Zhou X, Xie L, Liu J, Huang G. 2014. A regulatory feedback loop between HIF-1alpha and PIM2 in HepG2 cells. PLoS One, 9 (2):e88301.
References
xxi
Zhang P, Wang H, Min X, Wang Y, Tang J, Cheng J, Li D, Chen X, Cheng F, Wang N, Yang H. 2009. Pim-3 is expressed in endothelial cells and promotes vascular tube formation. J Cell Physiol, 220 (1):82-90.
Zhang Y, Wang Z, Magnuson NS. 2007. Pim-1 kinase-dependent phosphorylation of p21Cip1/WAF1 regulates its stability and cellular localization in H1299 cells. Mol Cancer Res, 5 (9):909-922.
Zhang Y, Parsanejad M, Huang E, Qu D, Aleyasin H, Rousseaux MW, Gonzalez YR, Cregan SP, Slack RS, Park DS. 2010. Pim-1 kinase as activator of the cell cycle pathway in neuronal death induced by DNA damage. J Neurochem, 112 (2):497-510.
Zhao Y, Hu J, Buckingham B, Pittenger MF, Wu ZJ, Griffith BP. 2014. Pim-1 kinase cooperates with serum signals supporting mesenchymal stem cell propagation. Cells Tissues Organs, 199 (2-3):140-149.
Zhou Y, Fisher SJ, Janatpour M, Genbacev O, Dejana E, Wheelock M, Damsky CH. 1997. Human cytotrophoblasts adopt a vascular phenotype as they differentiate. A strategy for successful endovascular invasion? J Clin Invest, 99 (9):2139-2151.
Zhu D, Fang J, Li Y, Zhang J. 2009. Mbd3, a component of NuRD/Mi-2 complex, helps maintain pluripotency of mouse embryonic stem cells by repressing trophectoderm differentiation. PLoS One, 4 (11):e7684.
Zhu N, Ramirez LM, Lee RL, Magnuson NS, Bishop GA, Gold MR. 2002. CD40 signaling in B cells regulates the expression of the Pim-1 kinase via the NF-kappa B pathway. J Immunol, 168 (2):744-754.

Appendix
xxii
APPENDIX
LIST OF FIGURES
Figure 1. Ovulation and implantation. ......................................................................... 4
Figure 2. The human placenta. ................................................................................... 5
Figure 3. Placental chronic villi ................................................................................... 7
Figure 4. Spiral artery remodeling .............................................................................. 8
Figure 5. Hemochorial Placentation ............................................................................ 9
Figure 6. Cytokines, Hormones and Growth factors. ................................................ 12
Figure 7. Summary of the known roles of LIF in embryo implantation. ..................... 14
Figure 8. Pathology during pregnancy ...................................................................... 17
Figure 9. Structure of PIM Kinases ........................................................................... 18
Figure 10. Regulation of PIM Kinases ...................................................................... 20
Figure 11. Schematic representation of PIM kinases in cell survival and apoptosis. 22
Figure 12. Schematic representation of blastocyst derived stem cells ..................... 23
Figure 13. Schematic representation of the cell heterogeneity in stem cells ............ 24
Figure 14. PCR gel electrophoresis PIM kinase expression ..................................... 40
Figure 15. Fold change in the expression of PIM Kinases ........................................ 42
Figure 16. Protein expression in HTR8/SVneo cells. ................................................ 44
Figure 17. Protein expression in JEG-3 cells. ........................................................... 46
Figure 18. Immune staining in HTR8/SVneo cells. ................................................... 47
Figure 19. Immune staining in JEG-3 cells ............................................................... 48
Figure 20. Cell Viability assay ................................................................................... 50
Figure 21. Cell Proliferation assay ............................................................................ 51
Figure 22. Immunoblot analysis of pro-apoptosic protein. ........................................ 53
Figure 23. Immunoblot analysis of anti-apoptotic proteins. ....................................... 54
Figure 24. Protein analysis of Potential targets of PIM kinases ................................ 55

Appendix
xxiii
Figure 25. Apoptosis assay by annexin V showing the cell death in HTR8/SVneo
cells. ......................................................................................................................... 57
Figure 26. Apoptosis assay by annexin V showing the cell death in JEG-3 cells ..... 58
Figure 27. Spheroid formation in the HTR8/SVneo cell line ..................................... 60
Figure 28. Transcription factor for stem cell upon LIF stimulation. ........................... 61
Figure 29. Transcription factor for stem cell upon OSM stimulation ......................... 62
Figure 30. Flow cytometry analysis for stem cell property upon LIF stimulation. ...... 64
Figure 31. Flow cytometry analysis for stem cell property upon OSM stimulation. .... 65
LIST OF TABLES
Table 1. Summary of some assorted cytokine profiles during pregnancy ................................. 11
Table 2. Summary of signaling pathways in human...................................................................... 15
Table 3. Culture conditions and Cell line conservation ................................................................. 29
Table 4. Primer Details ...................................................................................................................... 31
Table 5. Conventional PCR program ............................................................................................... 32
Table 6. Real-time PCR program ..................................................................................................... 32

Acknowledegment
xxiv
ACKNOWLEDGMENT
“For I know the plans I have for you plan to prosper you and not to harm you, plans to
give you hope and a future.” Jeremiah 29:11
I would like to express my special heartfelt appreciation and gratitude to my
thesis supervisor, Prof. Dr. med. Udo Markert, you have been not only a tremendous
mentor but also very good human soul who has been patience, genuinely caring,
kind and kept faith in me during the whole PhD. He has been motivating,
encouraging and enlightening, never judged or pushed as he knew that I needed to
juggle priorities. My PhD time would be incomplete without his humor and friendly
talk which always gave me laugh and lightened my perspective. His excellent
guidance, suggestions, always supported me to attend at many different conferences
and provided me with an excellent atmosphere for carrying out my research studies. I
am very much thankful and grateful for the Ph.D. student position in the Placenta
Lab. Without you I could not be Ph.D. “You are my bestest supervisor”. Words are
less to convey how thankful I am to you.
I thank all the lovely people in the Placenta lab, beginning with Justine (Chin-
up mentor), Jana (my sunshine guide), Claudia (encouraging soul), Wittaya (Calm
and patient), Stephanie (always smiling girl), Christin (my german speaking girl),
Maja ( Caring and my Immunostaining teacher), Diana (helping), Boodor (caring,
loving), Julia Hager (caring), Julia baby (fun), Ann-katrin (kind and helping), Anna
weichold (sweet friend), Anna kreuder (my café girl), Andre (supportive) , Lazaro,
Barbara, Rudolfo, Susana ( Spanish speaking friends). I am also thankful to my
friends in India Vidhya, Srini, Jagdish (best friend) who are there always with me, no
matter what happens in our lives. I want to thank all people whom I might have
forgotten to mention here.
This PhD journey would be incomplete without my beloved parents, beautiful
sisters without their eternal prayers, love, support and sacrifices. I would not have
made it this far without them. I want to thank all the people form church for the love
and prayers. Finally, I would like to thank God for creating me, wisdom, knowledge,
strength to complete this work successfully and without you, everything is impossible.
You always be with me.

Curriculum vitae
xxv
CURRICULUM VITAE
Personal Information
Name: STELLA MARY
Office address: Bachstrasse. 18
Universitätsklinikum Jena Placenta Labor 07743 Jena, Germany
Private address: Gartenstrasse. 5
07743 Jena
Telephone: Office phone: +493641 934678 Mobile Phone: +4917682539836 Email: [email protected]
Date of Birth: 12.04.1985
Place of Birth: Port Blair, Andaman and Nicobar Islands, India
Nationality: Indian
Resident in Germany
Marital Status: Single

Curriculum vitae
xxvi
DUCATION AND QUALIFICATIONS
10/ 2011- present Ph.D. (Molecular medicine), university hospital
Friedrich Schiller University, Jena, Germany.
Ph.D. thesis: “Characterization of PIM kinase and
cancer stem cell property in trophoblast
02/ 2011- 05/ 2011 Boehringer Ingelheim Fonds(BI Fonds) –Travel
Grant Travel
Placenta Lab University hospital Jena Germany.
09/ 2009- 10/ 2010 M.Res. Cancer Biology (Biomedical Science),
Nottingham Trent University, Nottingham, UK.
Master Thesis: “Invasive potentials of transformed
placental cells and gestational trophoblastic tumor cells
–A comparative analysis of placental versus tumor
invasion”.
Rank: First Class with Commendation (70%)
07/ 2006- 07/ 2008 M.Sc. Medical Laboratory Technology (MLT)
Loyola College, University of Madras, India
Master Thesis: “Isolation and identification of
different fungi causing keratitis-An Eye Opener”.
Rank: First Class with Distinction College II Rank (78%)
07/ 2003- 05/ 2006 B.Sc. Microbiology,
Prof. Dhanapalan College for Women,
University of Madras, India.
Rank: First Class. (75%)
07/ 2001- 05/ 2003 High School -Govt. Model Senior Secondary School,
Port Blair, Andaman and Nicobar Islands, India.
Rank: First class (70%)

Curriculum vitae
xxvii
AWARDS AND ACHIEVEMENTS
04/ 2015-09/ 2015 Short term grant DAAD University of Jena
10/ 2011 -03/ 2015 PhD Scholarship SIEMENS DAAD
03/ 2011-05/ 2011 Travel Grant Travel-Boehringer IngelheimFonds (BI fonds)
09/ 2009-10/ 2010 Scholarship for Bioscience, Nottingham Trent University.
INTERNSHIP (work experience)
11/ 2010-02/ 2011 Practical Training Internship
John van Geest Cancer Research Centre
Nottingham Trent University.
Topic:” Characterization of sub population of prostate
cancer cell lines.
04/ 2008- 05/ 2008 Participated in the Quality Control Program
Loyola, college. Chennai, India.
Topic: Microscopy techniques: Sputum Analysis form
tuberculosis
02/ 2008- 03/ 2008 Volunteer trainee lab technician (clinical laboratory)
Loyola Health Centre, Chennai, India.
08/ 2007- 12/ 2007 Student assistant
Department of Advanced Zoology and Biotechnology,
School of Genomics, Loyola College Chennai, India.
Topic: Trained on molecular Technique.
04/ 2007-05/ 2007 Summer Practical training
Madras diabetic Research foundation, Chennai, India
Topic: Biomedical instrumentation and molecular
techniques.
Curriculum vitae
xxviii
TECHNICAL EXPERIENCE
Molecular Biology: Genomic DNA and RNA isolation; sub cloning; generation; qPCR, MicroRNA transfection and analysis. Designing and standardizing primers.
Immunology: Antisera generation and monoclonal antibody isolation; isotopic, fluorescent, and biotin labeling of cellular proteins and antibodies; immunoprecipitation; radioimmunoassay; ELISA; FACS analysis; Immunostaining ; IHC; ICC; IF; TUNEL assay; Western blotting and troubleshooting.
Biochemistry: Spectrophotometric enzyme assays; protein quantitation; SDS PAGE.
Microscopic techniques: fluorescence microscopy; Laser scanning microscopy (work with software package)
Tissue Culture: Isolation of primary cells; mesenchyme stem cell, spheroid generation (3D culture) with different techniques, Micro vesicles (exosomes, micro particles) Mammalian adherent and non-adherent cell culture (2D culture); cell separation, including Percoll density gradient, microbiological techniques.
CONGRESS AND MEETINGS
03/2015 International congress on embryo implantation and pregnancy. New Delhi, India, Poster presentation. 09/ 2014 International federation of Placenta Association (IFPA) Congress Paris, France Poster presentation.
04/ 2014 11th Congress of the European Society for Reproductive Immunology (ESRI), Poster presentation 03.2014 International training in reproductive sciences and Technologies, 4th Jena InTreST-DGRM, Jena, Germany. Oral presentation
10/ 2013 European Society for Reproductive Immunology (ESRI), Kos Island, Greece. Summer school participation. 09/ 2013 International Federation of Placenta Association (IFPA) Whistler British Columbia, Canada. Poster presentation.

Curriculum vitae
xxix
06/ 2013 12th Congress of the International Society for Immunology
Reproduction (ISIR) hosted by the American Society for Reproductive Immunology (ASRI), Boston, Massachusetts, USA.
Poster presentation. 06/ 2012 Joint International Congress of the American Society for
Reproductive Immunology (ASRI) and the European Society for Reproductive Immunology (ESRI), Hamburg, Germany.
Poster presentation. 06/ 2012 International training in reproductive sciences and technologies,
3rd Jena InTreST-DGRM, Jena, Germany.
10/ 2011 Reproductive biology and Immunology, autumn school,October 2011, Magdeburg, Germany.
PUBLICATION
Chaiwangyen W, Ospina-Prieto S, Photini Mary S, Schleussner E, Markert
UR, Morales Prieto DM. Dissimilar microRNA-21 functions and targets in
trophoblastic cell lines of different origin. The International Journal of
Biochemistry & Cell Biology (under revision).
Stanimir Kyurkchiev, Fulvio Gandolfi, Soren Hayrabedyan, Tiziana A. L.
Brevini, Roumen Dimitrov,Justine S. Fitzgerald, Asma Jabeen, Milena
Mourdjeva, Photini Mary S, Patrick Spencer, Nelson Fernandez, Udo R.
Markert Stem Cells in the Reproductive System American Journal of
Reproductive Immunology 67 (2012) 445-462 (Review article).
CONTRIBUTIONS
(2015) Mary Stella, Wittaya Chaiwangyen, Justine S. Fitzgerald, Ekkehard
Schleussner, Udo R. Markert .The role of PIM1 in trophoblast cells. ASRI.
Ontario, Canada.

Curriculum vitae
xxx
(2015) Mary Stella, Wittaya Chaiwangyen, JS Fitzgerald, Schleussner E, UR
Markert, HTR8/SVNEO spheriods stemness is altered by OSM. International
congress on Embryo Implantation and Pregnancy. P34.
(2014) Mary Stella, Justine S. Fitzgerald, Ekkehard Schleussner, Udo R.
Markert, Identification of PIM1 in Trophoblastic cells. PLACENTA Volume: 35
Issues: 9 Pages: A105-A105 Meeting Abstract: P2.143-N Published: SEP
2014.
(2014) Mary Stella, Justine S. Fitzgerald, Ekkehard Schleussner, Udo R.
Markert, OSM effect on HTR8/Svneo spheroids. PLACENTA Volume: 35
Issues: 9 Pages: A94-A95 Meeting Abstract: P2.108-N Published: SEP
2014.
(2014) Mary Stella, JS Fitzgerald, Schleussner E, UR Markert, HTR8/SVNEO
spheriods stemness is altered by LIF. ESRI, Budapest, Hungary.
(2013) Mary Stella, JS Fitzgerald, UR Markert, Identification of PIM kinases
upon LIF stimulation in transformed trophoblast cells and choriocarcinoma
cells, American journal of Reproductive immunology volume 69, Issue s2, April
2013, Pages 157 P-178, poster presentation.
(2013) Mary. Photini*, Stella Wittaya Chaiwangyen, Udo R. Markert The
possible role of PIM kinases upon LIF stimulation in transformed trophoblast
cells and choriocarcinoma cells” Placenta, Volume 34, Issue 2, February
2013, Pages A1-A94 Poster Presentation.
(2012) Mary Stella, Wittaya Chaiwangyen, Sebastian Hoelters, Justine S
Fitzgerald, Udo R Markert The possible role of PIM kinases (Pim1, Pim2 and
Pim3) upon LIF stimulation in transformed trophoblast cells and
choriocarcinoma cells Placenta, Volume 33, Issue 9, September 2012, Pages
A1-A137 Poster Presentation.

Curriculum vitae
xxxi
(2012) Mary Photini Stella, Göhner C, Chaiwangyen W, Pastuschek J,
Hoelters S, Fitzgerald J S, Markert UR. Characterization of sphere formation
in trophoblast cell (HTR8/SV-neo) to explain their stem cell property. Journal
of Reproductive Immunology, Volume 94, Issue 1, May 2012, Page 73.Poster
Presentation.
(2010) Mary Stella, Shiva Sivasubramaniam. “Invasive potentials of
transformed placental cells and gestational trophoblastic tumor cells –A
Comparative analysis of placental versus tumor invasion”. Division of
Molecular Biosciences, School of Biomedical and Natural Sciences,
Nottingham Trent University, Clifton Lane, Nottingham NG11 8NS, UK.
(2008) Mary Stella, Diagnosis for life style disease –Diabetes Type-II. Loyola
College Contributed an article to the Regional Symposium on newer
challenges in laboratory.
(2008) Mary Stella, Fungal keratitis-Epidemiology, risk factor & diagnosis,
University of Madras paper presentation: Souvenir Silver Jubilee celebration
organized by Department of Microbiology, University Of Madras.
LANGUAGES
ENGLISH: Fluent
HINDI : Fluent
TAMIL : First Language
GERMAN: B-level
Ehrenwörtliche Erklärung
xxxii
EHRENWÖRTLICHE ERKLÄRUNG
Hiermit erkläre ich, dass mir die Promotionsordnung der Medizinischen Fakultät der
Friedrich-Schiller-Universität bekannt ist,
ich die Dissertation selbst angefertigt habe und alle von mir benutzten Hilfsmittel,
persönlichen Mitteilungen und Quellen in meiner Arbeit angegeben sind,
mich folgende Personen bei der Auswahl und Auswertung des Materials sowie bei
der Herstellung des Manuskripts unterstützt haben: Prof. Dr. med. Udo Markert und
Dr. Wittaya Chaiwangyen, Dr. Diana Morales Prieto.
die Hilfe eines Promotionsberaters nicht in Anspruch genommen wurde und dass
Dritte weder unmittelbar noch mittelbar geldwerte Leistungen von mir für Arbeiten
erhalten haben, die im Zusammenhang mit dem Inhalt der vorgelegten Dissertation
stehen,
dass ich die Dissertation noch nicht als Prüfungsarbeit für eine staatliche oder
andere wissenschaftliche Prüfung eingereicht habe und
dass ich die gleiche, eine in wesentlichen Teilen ähnliche oder eine andere
Abhandlung nicht bei einer anderen Hochschule als Dissertation eingereicht habe.
Jena 03.07.2015 Stella Mary


![Receptor-Like Kinases Sustain Symbiotic Scrutiny1[OPEN]...Update on Receptor-Like Kinases in Symbiosis Receptor-Like Kinases Sustain Symbiotic Scrutiny1[OPEN] Chai Hao Chiu,2 and Uta](https://img.pdfslide.net/doc/110x75/60aa214268722c0ce00ae5e7/receptor-like-kinases-sustain-symbiotic-scrutiny1open-update-on-receptor-like.jpg)

![Research Paper Pim-3 Regulates Stemness of Pancreatic ... · Pim-3 in glioblastoma stem cells has been observed when compared with neural stem cells [19]. However, till now there](https://img.pdfslide.net/doc/110x75/5e2f0d4412e65b1c205034d3/research-paper-pim-3-regulates-stemness-of-pancreatic-pim-3-in-glioblastoma.jpg)