Embed Size (px)
Citation preview
Romanian Reports in Physics XX, XYZ (2017)
CHARACTERIZATION OF PRECIPITATION IN 2000 SERIES
ALUMINIUM ALLOYS USING NEUTRON DIFFRACTION, SANS
AND SEM METHODS
GIZO BOKUCHAVA1,*, YULIA GORSHKOVA1, RICARDO FERNÁNDEZ2,
GASPAR GONZÁLEZ-DONCEL2, GIOVANNI BRUNO3
1 Frank Laboratory of Neutron Physics, Joint Institute for Nuclear Research, Joliot-Curie Str. 6,
141980 Dubna, Russia * Corresponding author, E-mail: [email protected]; E-mail: [email protected]
2 Department of Physical Metallurgy, Centro Nacional de Investigaciones Metalúrgicas (CENIM),
C.S.I.C., Av. de Gregorio del Amo 8, E-28040 Madrid, Spain
E-mails: [email protected], [email protected] 3 Federal Institute of Materials Research – BAM, Unter den Eichen 87, 12205 Berlin, Germany
E-mail: [email protected]
Received
Abstract. Combination of high-resolution time-of-flight (TOF) neutron diffraction,
scanning electron microscopy (SEM) and small angle neutron scattering (SANS) have
been used to study hardening precipitation in 2014Al and 2124Al alloys. Neutron
diffraction experiment revealed presence of tetragonal CuAl2 phase (θ/θ´ precipitates)
in 2014Al alloy and orthorhombic CuMgAl2 phase (S-precipitates) in 2124Al alloy.
SEM image analysis revealed that the θ/θ´-precipitates have platelet morphology while
the S-precipitates exhibit rod-like shapes. From SANS data analysis the characteristic
dimensions of precipitate particles and their polydisperse ditributions were estimated.
Key words: neutron diffraction, small angle neutron scattering, scanning electron
microscopy, precipitation hardening
1. INTRODUCTION
Aluminum alloys of 2xxx series are widely used in aerospace industry at
room temperature for their high mechanical strength. However, in the range of
temperatures above 400 K, their mechanical performance decrease due to
overaging precipitation processes. The creep behavior of aluminum and its Al-Cu
alloys processed by ingot metallurgy has been extensively investigated [1-14]. In
the range of high temperatures, the creep activation energy of the process for pure
aluminum was identified to the aluminum self-diffusion energy = 142 kJ / mol [15,
16]. This reveals that vacancy diffusion is a key factor in the creep phenomenon as
the rate controlling process of dislocation motion through a dislocation-climb
mechanism. However, for age-hardenable alloys, a universally accepted value of
the activation energy for the creep process is not available. Moreover, very
Article no. *** G.D. Bokuchava et al. 2
different stress exponents (n) in the power law creep are found. This is due, in part,
to the facts that creep tests are commonly carried out at temperatures at which
precipitation in age-hardenable alloys evolves depending on the test conditions
[17]. Dislocation dynamics is also influenced by alloying elements involved in the
precipitation process [18]. Precipitation plays a crucial role in the creep behavior of
these alloys [19, 20]. It is clear that the influence of precipitation during the creep
test must be characterized for a rigorous analysis of the creep data at different
temperatures. However, solid-state precipitation is barely considered in the
literature [11]. In fact, little agreement is found in the literature on the mechanisms
that governs the creep of Al-Cu alloys [12-14]. On the contrary, the precipitation
sequence in Al-Cu-Mg-Si-Mn alloys is well established [21-23] and its dependence
on the phenomenon dependence on testing conditions (temperature and stress)
among others has been extensively studied. The precipitation process occurring in
2xxx aluminum series alloys are related to Cu, Mg and Si elements. The chemical
composition of the alloy greatly influences the evolution of precipitates
composition during ageing at moderated temperatures (< 550K). In particular, two
main precipitation sequences have been described depending on the Mg content of
the alloy. Alloys with low Mg content present CuAl2 precipitates meanwhile alloys
with high Mg content present CuMgAl2 precipitates (see, for example, [21, 23]).
Then, it has been determined that the kinetics of this precipitation sequence
is strongly dependent on temperature and stress among other factors has been
extensively studied [24]. For example, an over-aged condition, θ-precipitates, is
achieved at three hours of thermal treatment at 453 K. With further annealing time,
precipitates coarsening (Ostwald ripening), occurs. Even in this over-aged
condition, alloying elements produce a strengthening effect with respect to pure
aluminum in creep conditions [1]. The two main strengthening contributions come
from the solid solution and coherent precipitates present in the alloys. The
strengthening effect is strongly dependent on the heat treatment suffered by the
alloys. In the present research, we study the effect of exposure to creep conditions
on the precipitation sequence in 2014 and 2124Al alloys by means of TOF neutron
diffraction, SEM and SANS. Thereby, the lattice parameter under different
exposure times at 473K is determined, and both precipitate and coherent
precipitates size distributions are calculated under the same conditions.
2. MATERIALS AND EXPERIMENTS
In this research, two series of 2014Al and 2124Al aluminum alloy powders,
which respective chemical compositions are shown in Table 1, were investigated.
As it can be seen from this table, Si and Mg are the elements whose contents are
significantly different from one alloy to the other. The samples were subjected to
Article no. *** Characterization of precipitation in 2000 series 3
different heat treatment durations (t = 0, 0.3, 1, 3, 10 and 100 hours) at temperature
T = 200 °C.
Table 1. Chemical composition of 2014Al and 2124Al alloys.
Element
Alloy
Si Fe Cu Mn Mg Cr Zn Ti
2014Al 0.72±0.01 0.083±0.002 4.40±0.10 0.012 0.52±0.01 <0.002 <0.005 <0.05
2124Al 0.113±0.005 0.104±0.002 4.17±0.05 0.59±0.01 1.50±0.01 <0.002 0.011 <0.05
For evaluation of main structural parameters of crystalline phases in Al
alloys high-resolution time-of-flight (TOF) neutron diffraction have been used.
SEM method allowed to detect the presence of precipitate particles and to
characterize their morphology. SANS method have been used to estimate typical
dimensions of coherent precipitates and their variation with heat treatment
duration.
The neutron TOF diffraction experiments have been performed on Fourier stress diffractometer FSD at the IBR -2 fast pulsed reactor in FLNP JINR (Dubna, Russia) [25, 26]. The FSD diffractometer was specially designed for residual stress studies in bulk industrial components and new advanced materials [27]. On FSD, a special purpose correlation technique is used to achieve high resolution level of the diffractometer - a combination of the fast Fourier chopper for the primary neutron beam intensity modulation and the reverse TOF method for data acquisition [28, 29]. This makes it possible to obtain high-resolution neutron diffraction spectra Δd/d ≈ 2·10-3 for backscattering detector (2θ = 140°) and Δd/d ≈ 4·10-3 for ±90°-detectors at d = 2 Å with the fairly short flight distance (~6.6 m) between Fourier chopper and neutron detectors.
SANS experiments have been performed on the YuMO neutron small-angle
spectrometer at the IBR-2 reactor in FLNP JINR (Dubna, Russia) [30]. The
instrument is designed to study materials structure in nanoscale range. YuMO is
characterized by a high neutron flux (2 × 10⁷ n/cm2/s) and a wide range of
transmitted momentum Q = 0.007 ÷ 0.5 Å-1.
3. NEUTRON DIFFRACTION ANALYSIS
As a rule, TOF diffractometers exhibit a rather wide range of interplanar
spacing and, consequently, possess a large number of simultaneously observed
diffraction peaks with the almost similar contribution of the resolution function to
their widths. In addition, the functional dependence between the diffraction peak
width and the interplanar spacing enables one to estimate microstrain and the size
of coherently scattering domains (crystallites) in a rather simple way [31, 32]. In
scale of interplanar spacing dhkl the resolution function of the neutron TOF
diffractometer is defined by the expression
Article no. *** G.D. Bokuchava et al. 4
R = d/d = [(t0/t)2 + (/tg)2 + (L/L)2]1/2, (1)
where t0 is the neutron pulse width, t = 252.778·L·λ is the total time of flight (in
microseconds), L is the total flight distance from a neutron source to detector (in
meters), λ is the neutron wavelength (in Å). The first term is the time component of
the resolution function, i.e., a TOF uncertainty; the second is the geometric
component of the resolution function, which characterizes all geometric
uncertainties during scattering at different angles; and the third is a flight path
uncertainty.
From Eq. (1) it follows that the width of the individual diffraction peak as a
function of the interplanar spacing dhkl can be written in the following form
d 2 = C1 + C2·d 2, (2)
where C1 and C2 are some constants related with t0 and Δθ, respectively, i.e. the
time and geometric components of the diffractometer resolution function. A routine
method for determining these values is a diffraction experiment with standard
specimen, which assumes no microstrain and rather large crystallites.
According to Williamson–Hall analysis for real crystals the diffraction peak
broadening effect due to the presence of microstrain ε and finite crystallite size ⟨D⟩ is expressed by the formula
β2 = (2εd)2 + (kd 2/⟨D⟩)2, (3)
where a Gaussian approximation for distribution functions is assumed, = Δa/a is
the variance of the unit cell parameter (microstrain), ⟨D⟩ is the average size of
crystallites, k is a dimensionless coefficient close to unity which takes into account
the shape of crystallites. Combining the expressions for d 2 and β2 the diffraction
peak width at half maxima as a function of interplanar spacing d can be obtained as
d 2 = C1 + C2d 2 + С3d 2 + C4d 4, (4)
where С3 ≈ (2ε)2 and C4 ≈ (k/⟨D⟩)2 are contributions to the diffraction peak
broadening due to microstrain and finite crystallite size, correspondingly. The
dependences d 2(d 2) will be linear with higher slope as compared to standard
specimen if the peak broadening is caused by the presence of microstrain only and
finite crystallite size effect is negligible (large crystallites). In case of small
crystallites, the peak broadening due to size effect is well pronounced and gives
characteristic parabolic dependence. Accordingly, plotting these dependences in a
sufficiently large range of dhkl, one can easily separate contributions to diffraction
Article no. *** Characterization of precipitation in 2000 series 5
peak broadening due to microstrain ε and finite crystallite size ⟨D⟩ and determine
these microstructural parameters independently [33].
Additionally, the average lattice microstrain can be estimated from
diffraction peak width parameter W1 obtained from Rietveld fit [34] of TOF
neutron diffraction data. In this case, the general formula for width of diffraction
peaks measured with Fourier diffractometer is:
W2 = WTOF2 + W12d2 + W22d4 = WTOF
2 + (Wang2 + Wstrain
2)d2, (5)
where WTOF 1/Vmax is the time contribution to the resolution function defined by
maximal Fourier chopper speed Vmax during measurement, Wang /tg is
geometrical contribution to resolution function and Wstrain is peak broadening
contribution due to microstrain.
4. RESULTS AND DISCUSSION
4.1. Neutron diffraction
During the experiment on the FSD diffraction spectra from Al alloy powder
samples of the both series are measured at room temperature in standard Ø8 mm
vanadium containers. All main diffraction peaks from Al phase are indexed in the
frame of the cubic FCC structure (sp. gr. Fm3m) with lattice constant a ≈ 4.047 Å.
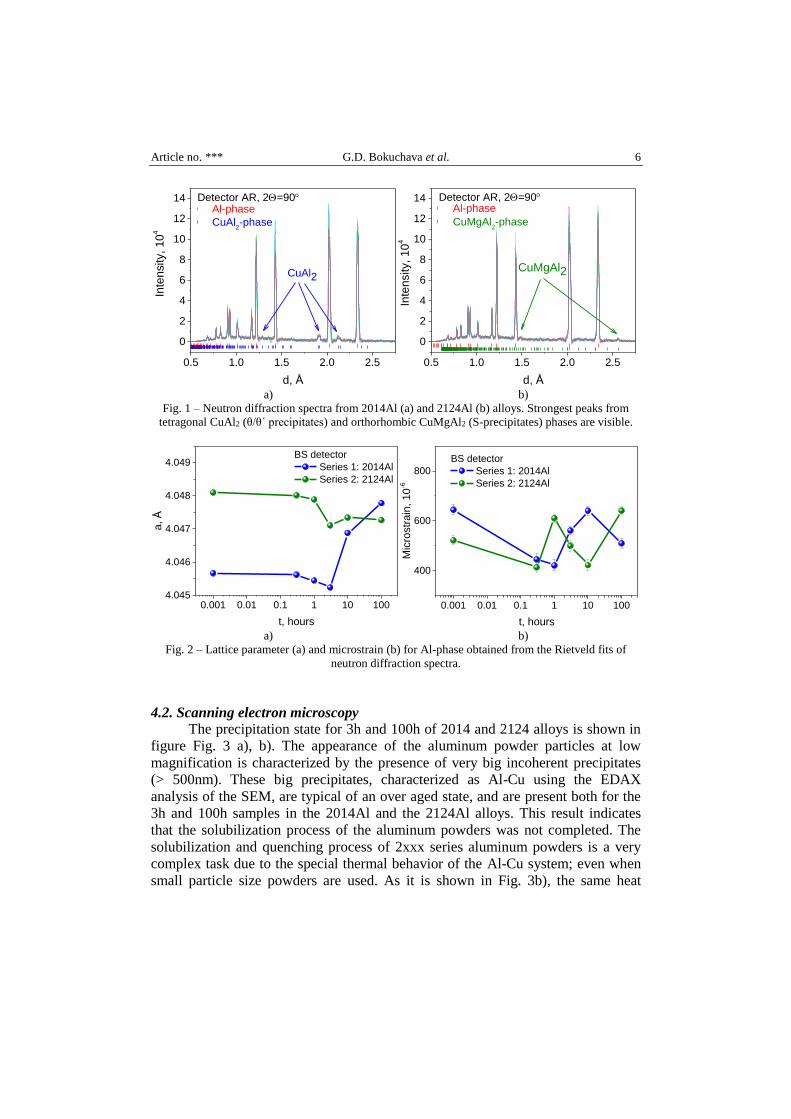
In addition to the main Al phase, the measured TOF spectra also exhibited weak
peaks from the precipitate phases with roughly constant peak intensities, which
indicate an almost constant volume content of these phases during heat treatment.
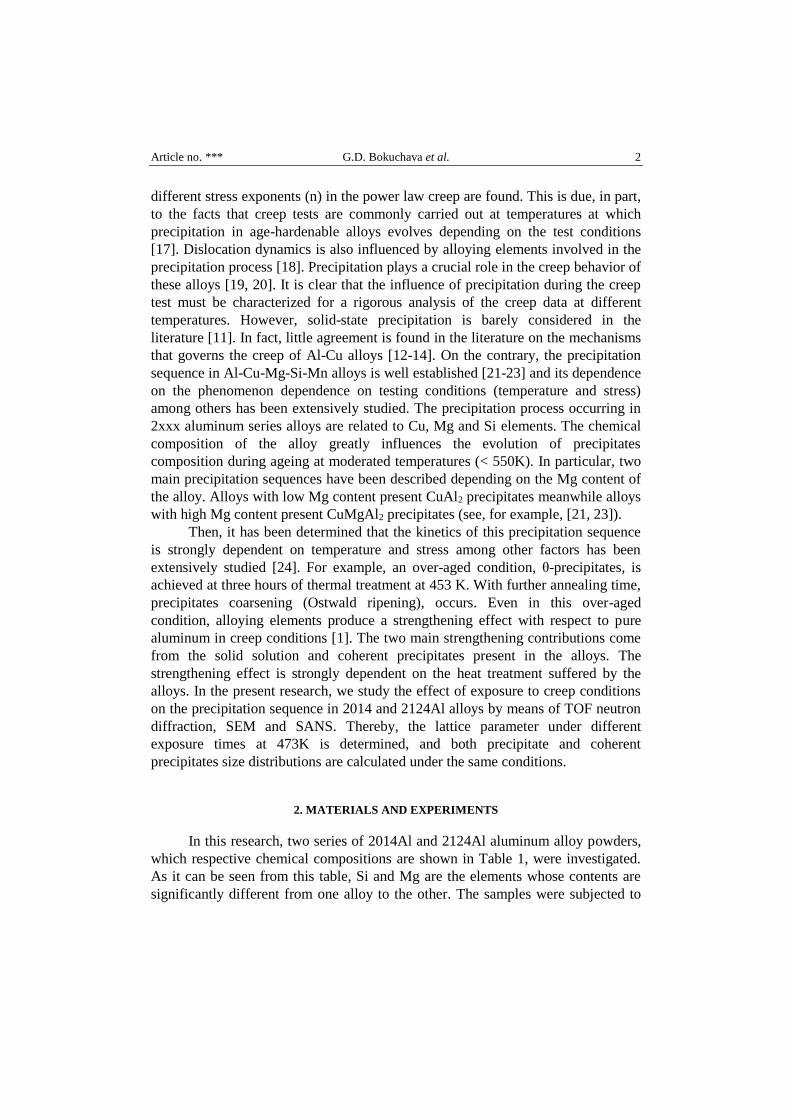
The precipitate phases present even in T4 (initial) samples for both alloy series. For
2014Al alloy the additional phase was identified as θ/θ´ precipitates of the
tetragonal CuAl2 phase (sp. gr. I4/mcm) with lattice constants a ≈ 6.0748 Å,
c ≈ 4.8831 Å. In 2124Al alloy S-precipitates of the orthorhombic CuMgAl2 phase
(sp. gr. Cmcm) with lattice constants a ≈ 4.011 Å, b ≈ 9.251 Å, c ≈ = 7.152 Å are
observed (Fig. 1). These results are in good agreement with previously observed
phase compositions [35].
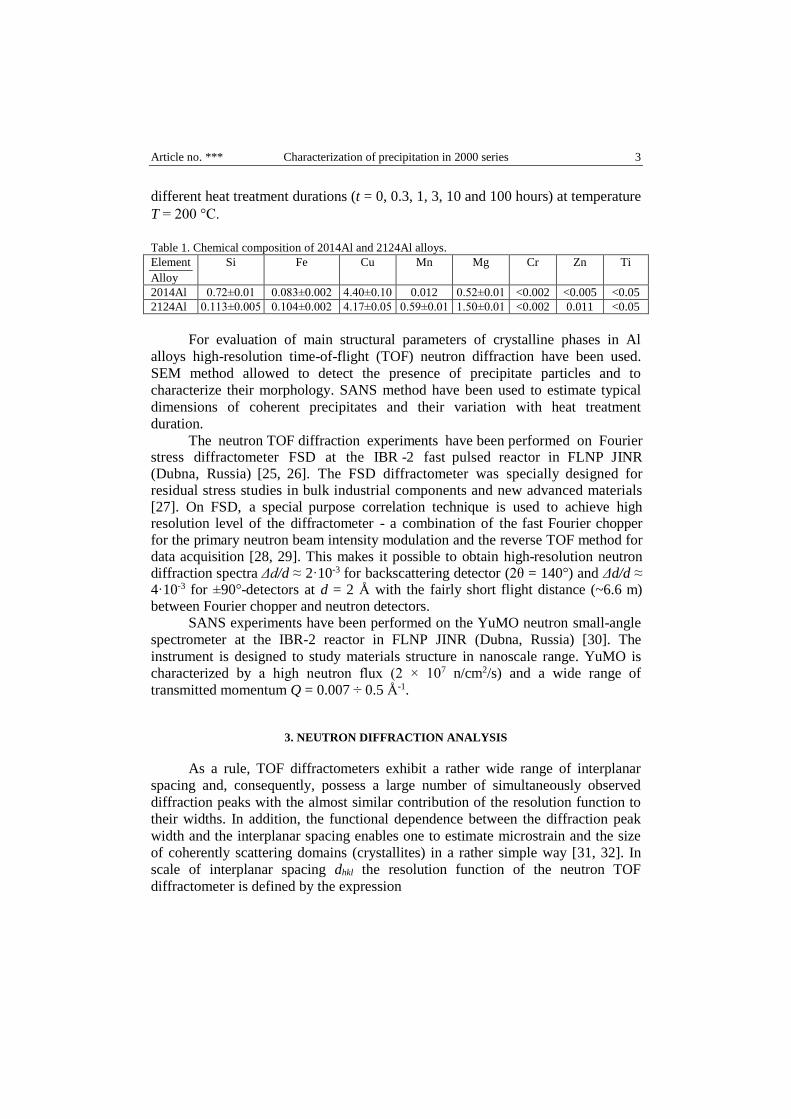
The measured diffraction spectra were processed using full profile analysis
based on the Rietveld method and main structural parameters for Al phase are
obtained. It was found that, depending on the heat treatment duration t, there is a
noticeable variation in the lattice constants and the peak width parameters, which is
apparently due to the formation of precipitates in the material (Fig. 2). The study of
diffraction peak broadening demonstrated that crystallite sizes contribute negligibly
to the peak broadening. On the contrary, microstrains make the main contribution
to the above phenomenon.
Article no. *** G.D. Bokuchava et al. 6
0.5 1.0 1.5 2.0 2.5
0
2
4
6
8
10
12
14 Detector AR, 2=90
CuAl2
Inte
nsity, 1
04
d, Å
Al-phase
CuAl2-phase
0.5 1.0 1.5 2.0 2.5
0
2
4
6
8
10
12
14 Detector AR, 2=90
CuMgAl2
Inte
nsity, 1
04
d, Å
Al-phase
CuMgAl2-phase
a) b)
Fig. 1 – Neutron diffraction spectra from 2014Al (a) and 2124Al (b) alloys. Strongest peaks from
tetragonal CuAl2 (θ/θ´ precipitates) and orthorhombic CuMgAl2 (S-precipitates) phases are visible.
0.001 0.01 0.1 1 10 1004.045
4.046
4.047
4.048
4.049
a, Å
t, hours
BS detector
Series 1: 2014Al
Series 2: 2124Al
0.001 0.01 0.1 1 10 100
400
600
800
Mic
rostr
ain
, 10
-6
t, hours
BS detector
Series 1: 2014Al
Series 2: 2124Al
a) b)
Fig. 2 – Lattice parameter (a) and microstrain (b) for Al-phase obtained from the Rietveld fits of
neutron diffraction spectra.
4.2. Scanning electron microscopy
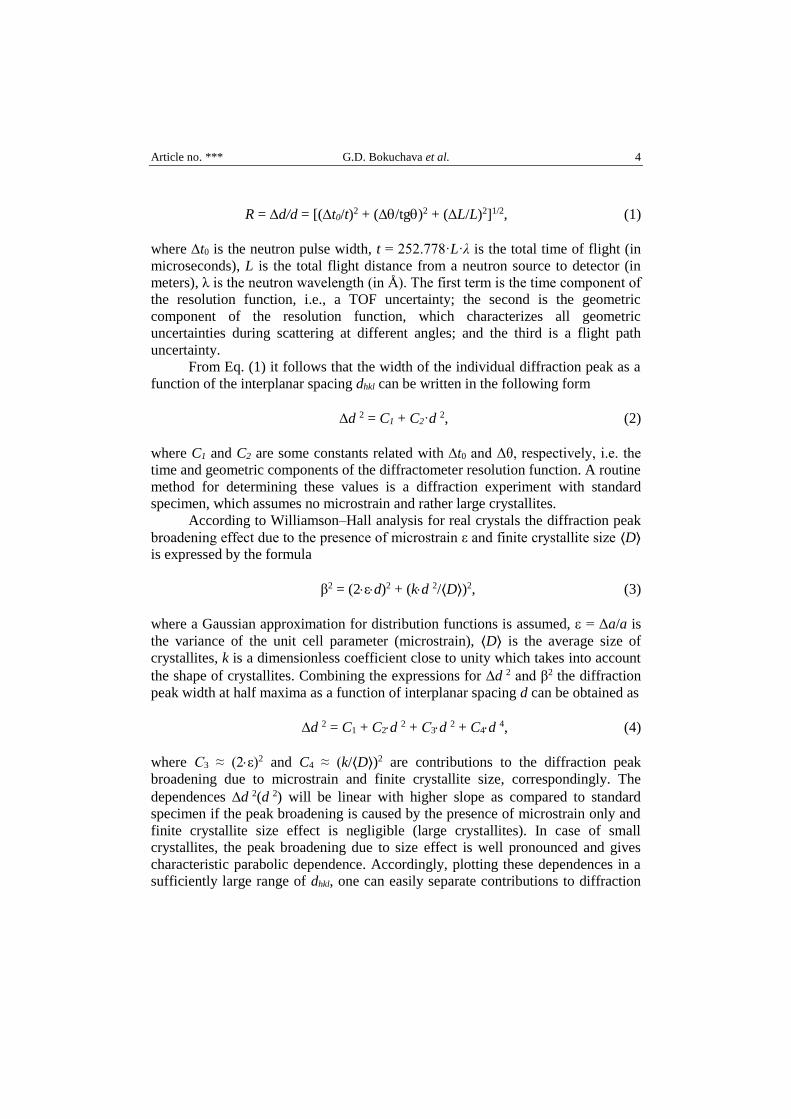
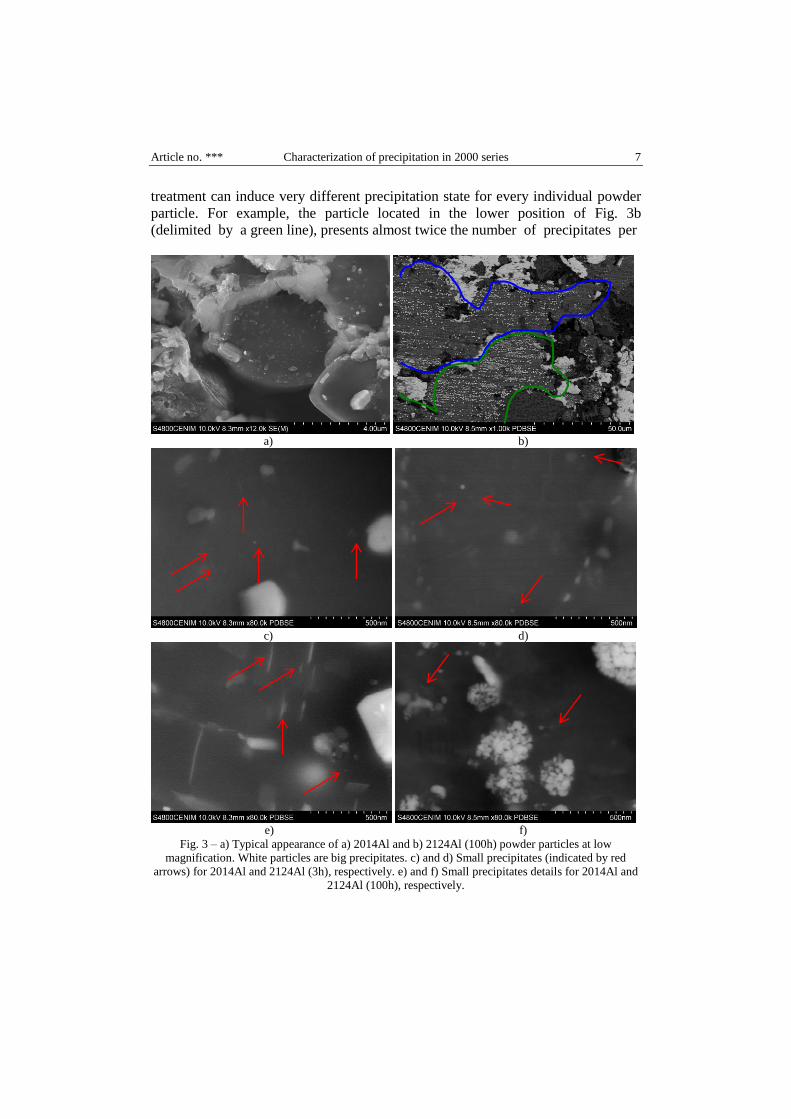
The precipitation state for 3h and 100h of 2014 and 2124 alloys is shown in
figure Fig. 3 a), b). The appearance of the aluminum powder particles at low
magnification is characterized by the presence of very big incoherent precipitates
(> 500nm). These big precipitates, characterized as Al-Cu using the EDAX
analysis of the SEM, are typical of an over aged state, and are present both for the
3h and 100h samples in the 2014Al and the 2124Al alloys. This result indicates
that the solubilization process of the aluminum powders was not completed. The
solubilization and quenching process of 2xxx series aluminum powders is a very
complex task due to the special thermal behavior of the Al-Cu system; even when
small particle size powders are used. As it is shown in Fig. 3b), the same heat
Article no. *** Characterization of precipitation in 2000 series 7
treatment can induce very different precipitation state for every individual powder
particle. For example, the particle located in the lower position of Fig. 3b
(delimited by a green line), presents almost twice the number of precipitates per
a) b)
c) d)
e) f)
Fig. 3 – a) Typical appearance of a) 2014Al and b) 2124Al (100h) powder particles at low
magnification. White particles are big precipitates. c) and d) Small precipitates (indicated by red
arrows) for 2014Al and 2124Al (3h), respectively. e) and f) Small precipitates details for 2014Al and
2124Al (100h), respectively.
Article no. *** G.D. Bokuchava et al. 8
unit area (white dots) than the particle located in the upper position (delimited by
the blue line). This effect can’t be related to either the solubilization+quenching
step or to the ageing treatment. These differences must be mainly related with the
aluminum powder particle localization into the container used for the
solubilization+quenching step. Those particles that were located close to the
container wall during the solubilization+quenching step will present a more
pronounced precipitation state. Apart from the big (> 500nm) precipitates, a small
population of small size precipitates are present in the all the samples studied.
The SEM analysis confirmed high-aspect-ratio platelet morphology for θ/θ´-
precipitates in 2014Al alloy while S-precipitates in 2124Al alloy exhibit rod-like
morphology. The main difference between small precipitate populations of 3h and
100h samples is that 100h samples present an increased precipitates density. On the
other hand, there is a very important difference between 100h samples of the
2014Al and 2124Al alloys. In the 2014Al alloy the small precipitates are dispersed
into the aluminum matrix. However, in the 2124Al alloy, a high degree of
precipitates agglomeration can be observed at high magnification. In fact these
agglomerates of precipitates resemble big precipitates at low magnification.
In addition, the SEM data indicate that the both type precipitates are not
monodisperse. For this reason, polydispersity in precipitate dimensions distribution
should be considered in SANS data analysis.
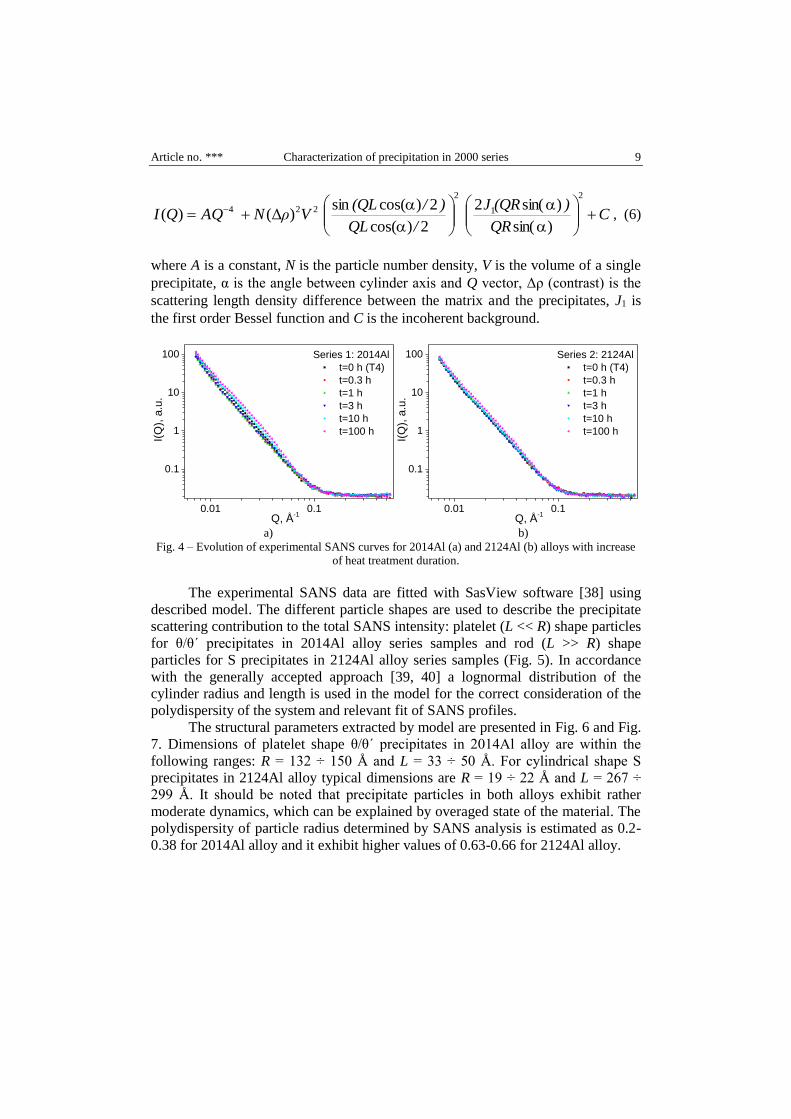
4.3. Small-angle neutron scattering
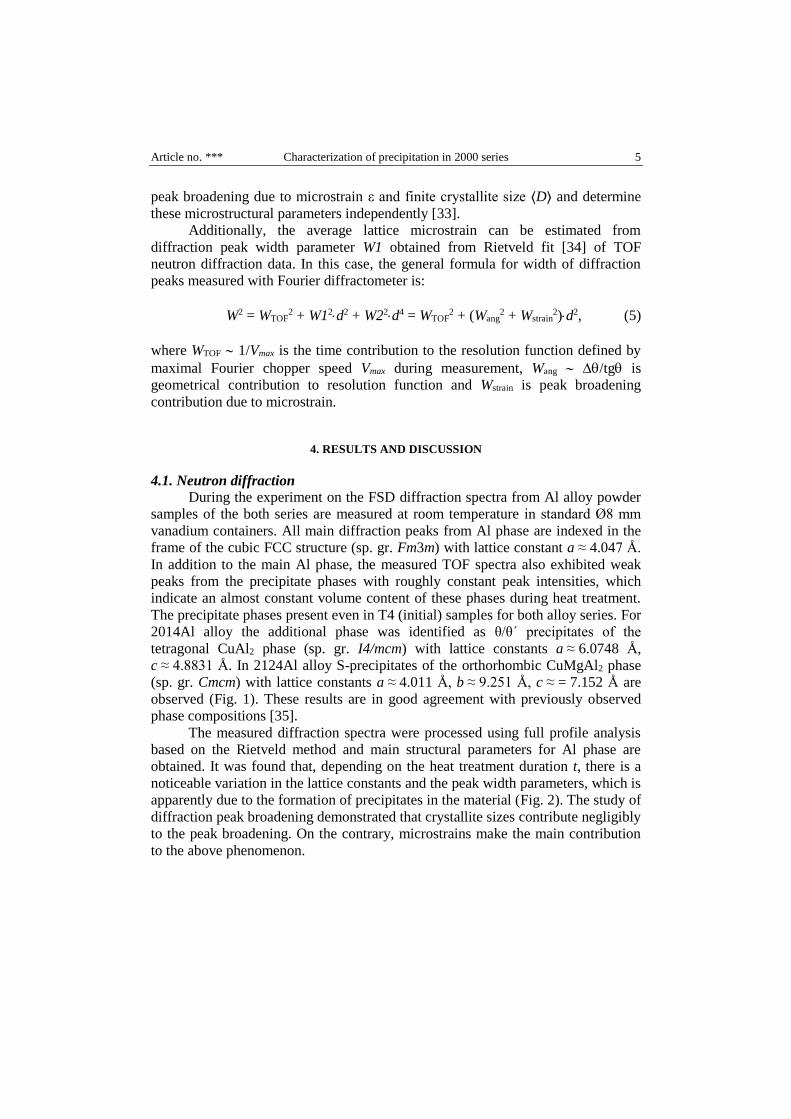
During SANS experiments Al alloy powder samples of the both studied
series were placed into a 1 mm thick quartz cuvette. All measurements are
performed at room temperature. Two ring wire He3-detectors at distances of 4 m
and 13 m from the sample position were used in our experiment. The scattered
intensity (differential cross section per sample volume) is registered as a function
of the momentum transfer modulus Q = (4π/λ) sin(θ/2), where θ is the scattering
angle and λ is the incident neutron wavelength. An incident neutron beam
distribution provides an available wavelength range of 0.5 ÷ 8 Å, which
corresponds to momentum transfer range Q of 0.0068 ÷ 0.54 Å-1. The measured
SANS spectra are converted to the absolute scale by normalization to the
incoherent scattering cross section of standard vanadium sample (Fig. 4) and
corrected for scattering from the setup and empty cuvette.
The SANS curves are fitted by function consisting of two terms. The first
term is a Porod-type contribution in the low-Q region corresponding to power-law
scattering from sharp boundaries of large-scale objects (coarse precipitates, grain
boundaries, dislocations, etc.). The second one corresponds to scattering from
precipitate particles, which can be described by the form factor of a cylinder with
radius R, and length L [36, 37]:
Article no. *** Characterization of precipitation in 2000 series 9
CQR
)(QRJ
/QL
)/(QL VρN AQQI
)sin(
)sin(2
2)cos(
2)cos(sin)Δ()(
2
1
2
224, (6)
where A is a constant, N is the particle number density, V is the volume of a single
precipitate, α is the angle between cylinder axis and Q vector, Δρ (contrast) is the
scattering length density difference between the matrix and the precipitates, J1 is
the first order Bessel function and C is the incoherent background.
0.01 0.1
0.1
1
10
100
Series 1: 2014Al
t=0 h (T4)
t=0.3 h
t=1 h
t=3 h
t=10 h
t=100 h
I(Q
), a
.u.
Q, Å-1
0.01 0.1
0.1
1
10
100
Series 2: 2124Al
t=0 h (T4)
t=0.3 h
t=1 h
t=3 h
t=10 h
t=100 h
I(Q
), a
.u.
Q, Å-1
a) b)
Fig. 4 – Evolution of experimental SANS curves for 2014Al (a) and 2124Al (b) alloys with increase
of heat treatment duration.
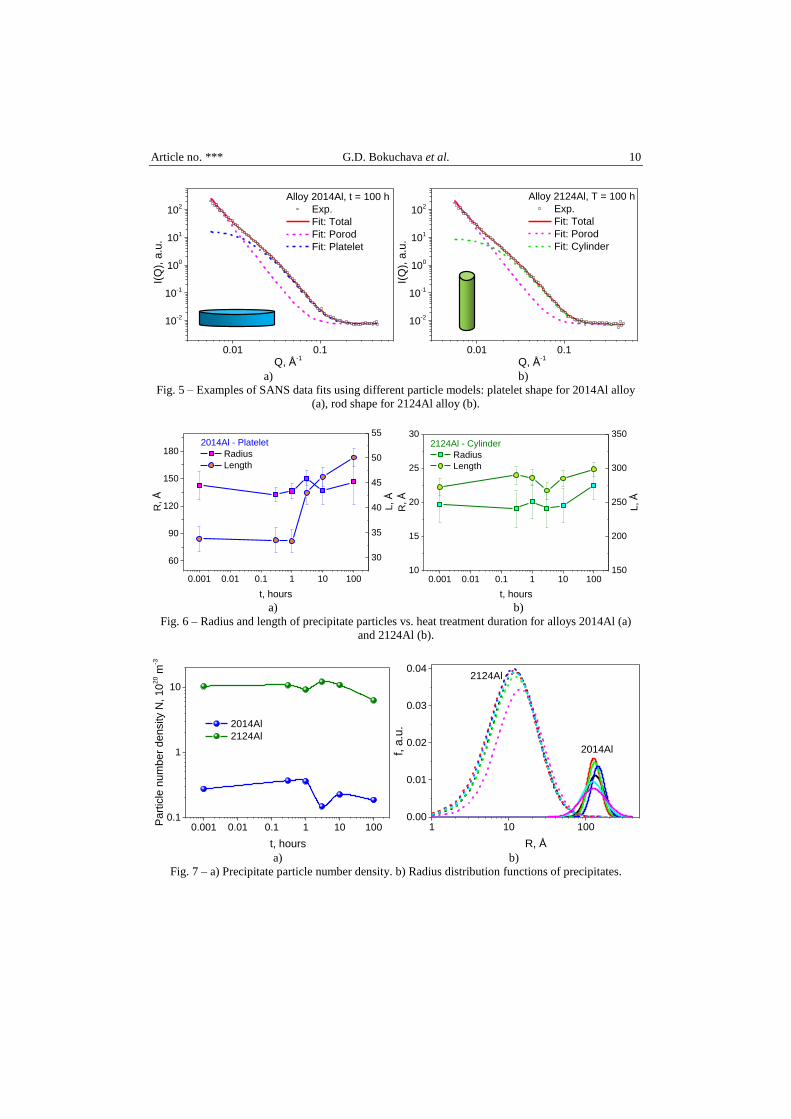
The experimental SANS data are fitted with SasView software [38] using
described model. The different particle shapes are used to describe the precipitate
scattering contribution to the total SANS intensity: platelet (L << R) shape particles
for θ/θ´ precipitates in 2014Al alloy series samples and rod (L >> R) shape
particles for S precipitates in 2124Al alloy series samples (Fig. 5). In accordance
with the generally accepted approach [39, 40] a lognormal distribution of the
cylinder radius and length is used in the model for the correct consideration of the
polydispersity of the system and relevant fit of SANS profiles.
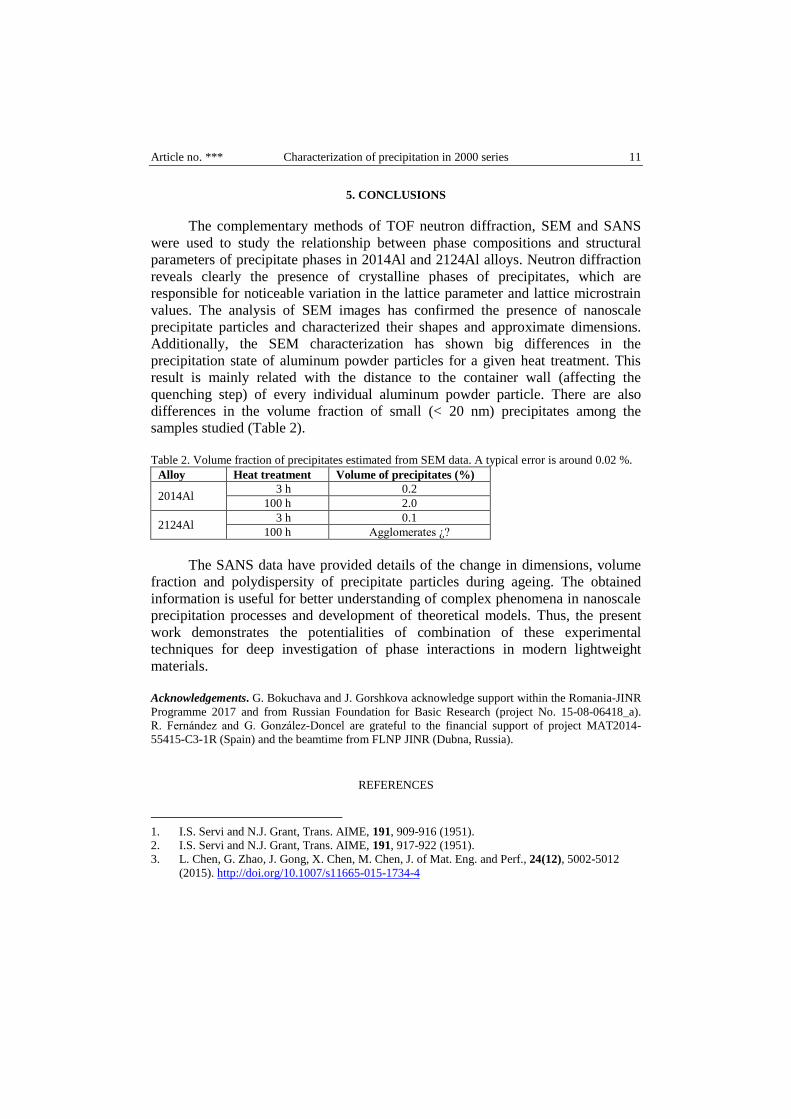
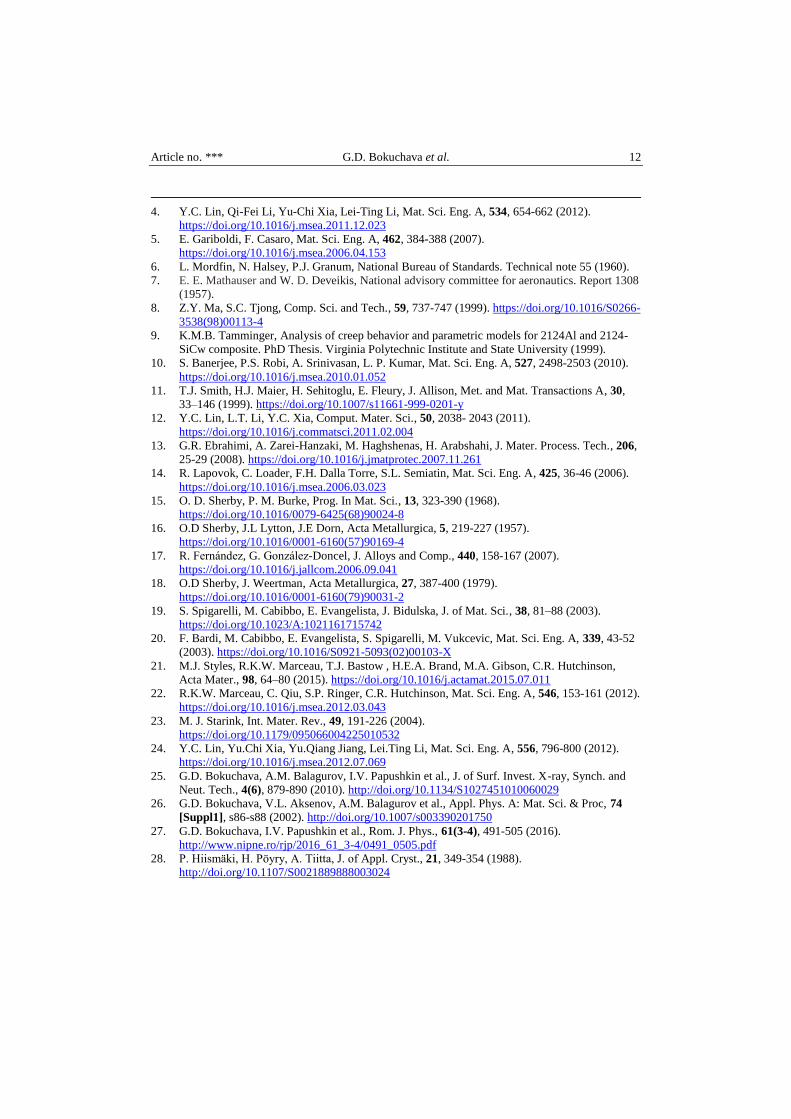
The structural parameters extracted by model are presented in Fig. 6 and Fig.
7. Dimensions of platelet shape θ/θ´ precipitates in 2014Al alloy are within the
following ranges: R = 132 ÷ 150 Å and L = 33 ÷ 50 Å. For cylindrical shape S
precipitates in 2124Al alloy typical dimensions are R = 19 ÷ 22 Å and L = 267 ÷
299 Å. It should be noted that precipitate particles in both alloys exhibit rather
moderate dynamics, which can be explained by overaged state of the material. The
polydispersity of particle radius determined by SANS analysis is estimated as 0.2-
0.38 for 2014Al alloy and it exhibit higher values of 0.63-0.66 for 2124Al alloy.
Article no. *** G.D. Bokuchava et al. 10
0.01 0.1
10-2
10-1
100
101
102
I(Q
), a
.u.
Q, Å-1
Alloy 2014Al, t = 100 h
Exp.
Fit: Total
Fit: Porod
Fit: Platelet
0.01 0.1
10-2
10-1
100
101
102
I(Q
), a
.u.
Q, Å-1
Alloy 2124Al, T = 100 h
Exp.
Fit: Total
Fit: Porod
Fit: Cylinder
a) b)
Fig. 5 – Examples of SANS data fits using different particle models: platelet shape for 2014Al alloy
(a), rod shape for 2124Al alloy (b).
0.001 0.01 0.1 1 10 100
60
90
120
150
180
R, Å
t, hours
2014Al - Platelet
Radius
Length
30
35
40
45
50
55
L, Å
0.001 0.01 0.1 1 10 10010
15
20
25
302124Al - Cylinder
Radius
Length
R, Å
t, hours
150
200
250
300
350
L, Å
a) b)
Fig. 6 – Radius and length of precipitate particles vs. heat treatment duration for alloys 2014Al (a)
and 2124Al (b).
0.001 0.01 0.1 1 10 1000.1
1
10
Part
icle
num
ber
density N
, 10
20 m
-3
t, hours
2014Al
2124Al
1 10 1000.00
0.01
0.02
0.03
0.04
2014Al
2124Al
f, a
.u.
R, Å a) b)
Fig. 7 – a) Precipitate particle number density. b) Radius distribution functions of precipitates.
Article no. *** Characterization of precipitation in 2000 series 11
5. CONCLUSIONS
The complementary methods of TOF neutron diffraction, SEM and SANS
were used to study the relationship between phase compositions and structural
parameters of precipitate phases in 2014Al and 2124Al alloys. Neutron diffraction
reveals clearly the presence of crystalline phases of precipitates, which are
responsible for noticeable variation in the lattice parameter and lattice microstrain
values. The analysis of SEM images has confirmed the presence of nanoscale
precipitate particles and characterized their shapes and approximate dimensions.
Additionally, the SEM characterization has shown big differences in the
precipitation state of aluminum powder particles for a given heat treatment. This
result is mainly related with the distance to the container wall (affecting the
quenching step) of every individual aluminum powder particle. There are also
differences in the volume fraction of small (< 20 nm) precipitates among the
samples studied (Table 2).
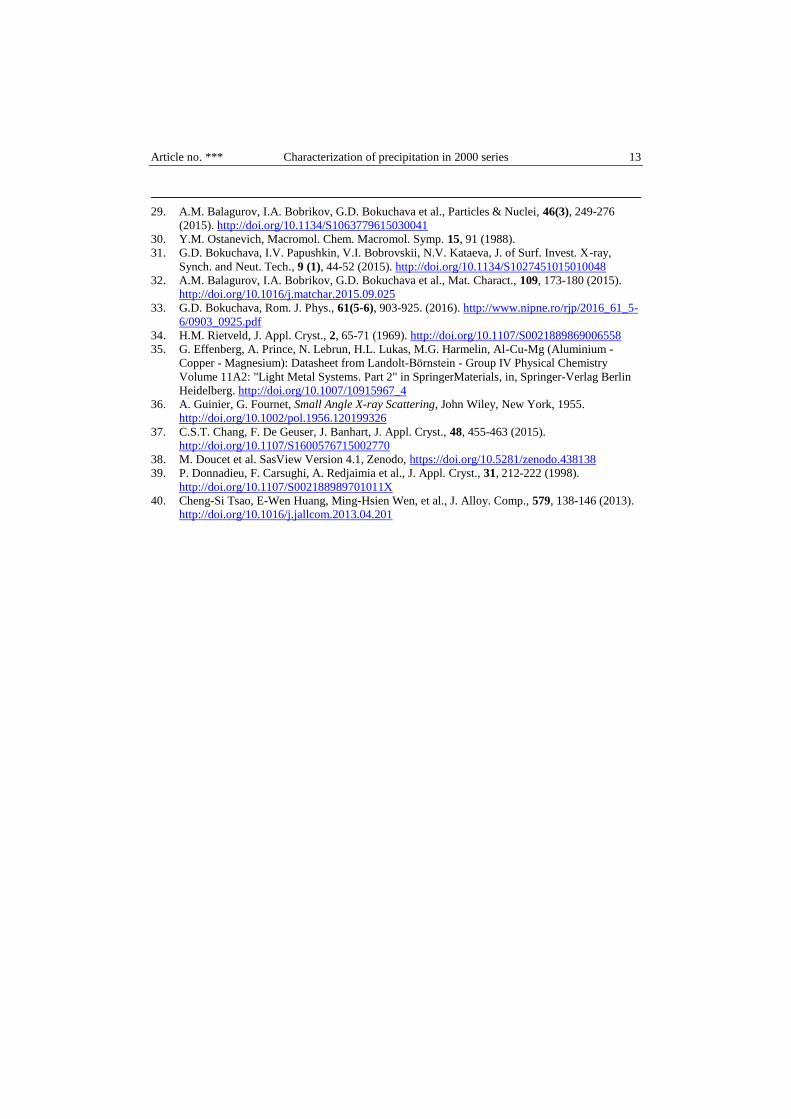
Table 2. Volume fraction of precipitates estimated from SEM data. A typical error is around 0.02 %.
Alloy Heat treatment Volume of precipitates (%)
2014Al 3 h 0.2
100 h 2.0
2124Al 3 h 0.1
100 h Agglomerates ¿?
The SANS data have provided details of the change in dimensions, volume
fraction and polydispersity of precipitate particles during ageing. The obtained
information is useful for better understanding of complex phenomena in nanoscale
precipitation processes and development of theoretical models. Thus, the present
work demonstrates the potentialities of combination of these experimental
techniques for deep investigation of phase interactions in modern lightweight
materials.
Acknowledgements. G. Bokuchava and J. Gorshkova acknowledge support within the Romania-JINR
Programme 2017 and from Russian Foundation for Basic Research (project No. 15-08-06418_a).
R. Fernández and G. González-Doncel are grateful to the financial support of project MAT2014-
55415-C3-1R (Spain) and the beamtime from FLNP JINR (Dubna, Russia).
REFERENCES
1. I.S. Servi and N.J. Grant, Trans. AIME, 191, 909-916 (1951).
2. I.S. Servi and N.J. Grant, Trans. AIME, 191, 917-922 (1951).
3. L. Chen, G. Zhao, J. Gong, X. Chen, M. Chen, J. of Mat. Eng. and Perf., 24(12), 5002-5012
(2015). http://doi.org/10.1007/s11665-015-1734-4
Article no. *** G.D. Bokuchava et al. 12
4. Y.C. Lin, Qi-Fei Li, Yu-Chi Xia, Lei-Ting Li, Mat. Sci. Eng. A, 534, 654-662 (2012).
https://doi.org/10.1016/j.msea.2011.12.023
5. E. Gariboldi, F. Casaro, Mat. Sci. Eng. A, 462, 384-388 (2007). https://doi.org/10.1016/j.msea.2006.04.153
6. L. Mordfin, N. Halsey, P.J. Granum, National Bureau of Standards. Technical note 55 (1960).
7. E. E. Mathauser and W. D. Deveikis, National advisory committee for aeronautics. Report 1308
(1957).
8. Z.Y. Ma, S.C. Tjong, Comp. Sci. and Tech., 59, 737-747 (1999). https://doi.org/10.1016/S0266-
3538(98)00113-4
9. K.M.B. Tamminger, Analysis of creep behavior and parametric models for 2124Al and 2124-
SiCw composite. PhD Thesis. Virginia Polytechnic Institute and State University (1999).
10. S. Banerjee, P.S. Robi, A. Srinivasan, L. P. Kumar, Mat. Sci. Eng. A, 527, 2498-2503 (2010).
https://doi.org/10.1016/j.msea.2010.01.052
11. T.J. Smith, H.J. Maier, H. Sehitoglu, E. Fleury, J. Allison, Met. and Mat. Transactions A, 30,
33–146 (1999). https://doi.org/10.1007/s11661-999-0201-y
12. Y.C. Lin, L.T. Li, Y.C. Xia, Comput. Mater. Sci., 50, 2038- 2043 (2011).
https://doi.org/10.1016/j.commatsci.2011.02.004
13. G.R. Ebrahimi, A. Zarei-Hanzaki, M. Haghshenas, H. Arabshahi, J. Mater. Process. Tech., 206,
25-29 (2008). https://doi.org/10.1016/j.jmatprotec.2007.11.261
14. R. Lapovok, C. Loader, F.H. Dalla Torre, S.L. Semiatin, Mat. Sci. Eng. A, 425, 36-46 (2006). https://doi.org/10.1016/j.msea.2006.03.023
15. O. D. Sherby, P. M. Burke, Prog. In Mat. Sci., 13, 323-390 (1968).
https://doi.org/10.1016/0079-6425(68)90024-8
16. O.D Sherby, J.L Lytton, J.E Dorn, Acta Metallurgica, 5, 219-227 (1957).
https://doi.org/10.1016/0001-6160(57)90169-4
17. R. Fernández, G. González-Doncel, J. Alloys and Comp., 440, 158-167 (2007).
https://doi.org/10.1016/j.jallcom.2006.09.041
18. O.D Sherby, J. Weertman, Acta Metallurgica, 27, 387-400 (1979).
https://doi.org/10.1016/0001-6160(79)90031-2
19. S. Spigarelli, M. Cabibbo, E. Evangelista, J. Bidulska, J. of Mat. Sci., 38, 81–88 (2003).
https://doi.org/10.1023/A:1021161715742
20. F. Bardi, M. Cabibbo, E. Evangelista, S. Spigarelli, M. Vukcevic, Mat. Sci. Eng. A, 339, 43-52
(2003). https://doi.org/10.1016/S0921-5093(02)00103-X
21. M.J. Styles, R.K.W. Marceau, T.J. Bastow , H.E.A. Brand, M.A. Gibson, C.R. Hutchinson,
Acta Mater., 98, 64–80 (2015). https://doi.org/10.1016/j.actamat.2015.07.011
22. R.K.W. Marceau, C. Qiu, S.P. Ringer, C.R. Hutchinson, Mat. Sci. Eng. A, 546, 153-161 (2012). https://doi.org/10.1016/j.msea.2012.03.043
23. M. J. Starink, Int. Mater. Rev., 49, 191-226 (2004).
https://doi.org/10.1179/095066004225010532
24. Y.C. Lin, Yu.Chi Xia, Yu.Qiang Jiang, Lei.Ting Li, Mat. Sci. Eng. A, 556, 796-800 (2012).
https://doi.org/10.1016/j.msea.2012.07.069
25. G.D. Bokuchava, A.M. Balagurov, I.V. Papushkin et al., J. of Surf. Invest. X-ray, Synch. and
Neut. Tech., 4(6), 879-890 (2010). http://doi.org/10.1134/S1027451010060029
26. G.D. Bokuchava, V.L. Aksenov, A.M. Balagurov et al., Appl. Phys. A: Mat. Sci. & Proc, 74
[Suppl1], s86-s88 (2002). http://doi.org/10.1007/s003390201750
27. G.D. Bokuchava, I.V. Papushkin et al., Rom. J. Phys., 61(3-4), 491-505 (2016).
http://www.nipne.ro/rjp/2016_61_3-4/0491_0505.pdf
28. P. Hiismäki, H. Pöyry, A. Tiitta, J. of Appl. Cryst., 21, 349-354 (1988).
http://doi.org/10.1107/S0021889888003024
Article no. *** Characterization of precipitation in 2000 series 13
29. A.M. Balagurov, I.A. Bobrikov, G.D. Bokuchava et al., Particles & Nuclei, 46(3), 249-276
(2015). http://doi.org/10.1134/S1063779615030041
30. Y.M. Ostanevich, Macromol. Chem. Macromol. Symp. 15, 91 (1988).
31. G.D. Bokuchava, I.V. Papushkin, V.I. Bobrovskii, N.V. Kataeva, J. of Surf. Invest. X-ray,
Synch. and Neut. Tech., 9 (1), 44-52 (2015). http://doi.org/10.1134/S1027451015010048
32. A.M. Balagurov, I.A. Bobrikov, G.D. Bokuchava et al., Mat. Charact., 109, 173-180 (2015).
http://doi.org/10.1016/j.matchar.2015.09.025
33. G.D. Bokuchava, Rom. J. Phys., 61(5-6), 903-925. (2016). http://www.nipne.ro/rjp/2016_61_5-
6/0903_0925.pdf
34. H.M. Rietveld, J. Appl. Cryst., 2, 65-71 (1969). http://doi.org/10.1107/S0021889869006558
35. G. Effenberg, A. Prince, N. Lebrun, H.L. Lukas, M.G. Harmelin, Al-Cu-Mg (Aluminium -
Copper - Magnesium): Datasheet from Landolt-Börnstein - Group IV Physical Chemistry
Volume 11A2: "Light Metal Systems. Part 2" in SpringerMaterials, in, Springer-Verlag Berlin
Heidelberg. http://doi.org/10.1007/10915967_4
36. A. Guinier, G. Fournet, Small Angle X-ray Scattering, John Wiley, New York, 1955.
http://doi.org/10.1002/pol.1956.120199326
37. C.S.T. Chang, F. De Geuser, J. Banhart, J. Appl. Cryst., 48, 455-463 (2015).
http://doi.org/10.1107/S1600576715002770
38. M. Doucet et al. SasView Version 4.1, Zenodo, https://doi.org/10.5281/zenodo.438138
39. P. Donnadieu, F. Carsughi, A. Redjaimia et al., J. Appl. Cryst., 31, 212-222 (1998).
http://doi.org/10.1107/S002188989701011X
40. Cheng-Si Tsao, E-Wen Huang, Ming-Hsien Wen, et al., J. Alloy. Comp., 579, 138-146 (2013).
http://doi.org/10.1016/j.jallcom.2013.04.201