Embed Size (px)
Citation preview
Characterization of Prepreg-Based DiscontinuousCarbon Fiber/Epoxy Systems
PAOLO FERABOLI,* ELOF PEITSO, FRANCESCO DELEO AND TYLER CLEVELAND
Aeronautics and Astronautics, University of WashingtonBox 352400, Seattle, WA 98195-2400, USA
PATRICK B. STICKLER
787 Technology Integration, Boeing Commercial Airplanes
ABSTRACT: This paper quantifies the elastic behavior and failure response of discontinuous carbonfiber/ epoxy laminates produced by compression molding of randomly oriented preimpregnatedunidirectional tape. Flat plates have been successfully molded using manually prepared prepregcharges, and showed a satisfactory degree of randomization. Complex relationships betweenreinforcement aspect ratio and tensile, compressive, and flexural moduli and strengths are observed.For this particular material system, failure is a matrix-dominated event, with little or no fiber breakage,and it promotes relatively high variation in the measured properties. The high-volume carbon fibercontent, combined with an aerospace-qualified epoxy resin, opens up opportunities for more aircraftparts to be made of composite materials, particularly for stiffness-critical components wherediscontinuous fibers offer performance similar to the continuous quasi-isotropic value.
KEY WORDS: short fiber, discontinuous fiber, carbon fibers.
INTRODUCTION
AIRFRAME COMPONENTS FABRICATED from composite materials have traditionally beena costly alternative to aluminum construction. The primary challenge that the aerospace
industry faced leading up to the 787 was to fully obtain the performance benefits ofcomposite materials while dramatically lowering production costs [1,2]. Recent compositetechnology research and development efforts have focused on new low-cost material productforms, and automated processes that can markedly increase production efficiencies. Forexample, efficient automated tape laying techniques have been developed in the last fiveyears for manufacturing the integrally stiffened fuselage sections, such as the one developedby Boeing during the NASA-funded ATCAS Program [3]. Other examples of non-autoclavematerial forms used in that effort were the circumferential frames and the window frames,manufactured via resin infusion of textile preforms, a technique that enables themanufacturing of high-volume components at rapid rates and low recurring costs [3].
In components exhibiting fully three-dimensional geometry, where the state of stress is noteasily predicted or is known to be approximately equal in all directions, such as structural
*Author to whom correspondence should be addressed. E-mail: [email protected] 1–8, 10–13, 15–23, 25 and 28–33 appear in color online: http://jrp.sagepub.com
Journal of REINFORCED PLASTICS AND COMPOSITES, Vol. 28, No. 10/2009 1191
0731-6844/09/10 1191–24 $10.00/0 DOI: 10.1177/0731684408088883� SAGE Publications 2009
Los Angeles, London, New Delhi and Singapore
at UNIV WASHINGTON LIBRARIES on May 23, 2009 http://jrp.sagepub.comDownloaded from
fittings, significant cost and weight savings can be achieved with the use of discontinuousfiber molding compounds for medium or large volume production. For such applications,unidirectional composite prepreg cannot be employed in an economically advantageous waydue to its labor-intensive nature and poor ability to be draped over complex contours.Machined aluminum parts can be economically viable to produce, but are not compatiblewith carbon-fiber intensive airframes and lead to heavier designs. With rare exceptions,titanium castings cannot be used competitively because of the high casting factors, whiletitanium forgings rarely offer an economic advantage due to material waste and machiningcosts. The interest of the aerospace community for short fiber composites dates back to the1960s and the pioneering work of Halpin, Pagano, and Kardos [4–8]. Furthermore, sheetmolding compounds (SMC), secondary and tertiary airframe structures for non-interiorapplications have been in service for several years. SMC are typically used in conjunctionwith traditional compression molding, which we can identify as high-flow molding due tothe large amount of resin flow and associated fiber orientation. SMC commonly feature1.0 in. (25.4mm) long glass fiber reinforcements and less 30–50% fibers by volume.Although their lower mechanical properties has traditionally limited their airframe applica-tions, relatively large structures such as engine strut fairings have been in service for severalyears. In order to become attractive for more significant secondary as well as primarystructures, higher performance fiber, resins and manufacturing methods are required.
This study investigates the behavior of a high-performance system that usesdiscontinuous carbon fiber/epoxy obtained from high-grade prepreg. Prepreg-baseddiscontinuous systems are appealing for primary structural applications as they can beused in low-flow molding conditions, whereby minimal flow and reinforcementredistribution occurs upon molding. Commercial applications for this type of materialform already exist, although using different resin systems and fiber types and lengths,under various manufacturers and denominations (e.g., Quantum Lytex 4149 and HexcelHexMC [9,10]). Hexcel HexMC is used on the Boeing 787 Dreamliner for manufacturingthe first composite structural window frame for a commercial airliner application [13]. Thecompression-molded composite window frames allow for significant weight saving andsuperior damage tolerance compared to a traditional aluminum frame.
MATERIAL FABRICATION AND TEST SET-UP
Material Fabrication
Discontinuous carbon/epoxy panels are manufactured in the laboratory starting from aTORAYCA T700/2510 unidirectional (UD) prepreg. The system is a 2708F cure (1328C),designated for vacuum oven cure of General Aviation airframe primary structures, andhas a resin content of 36%.
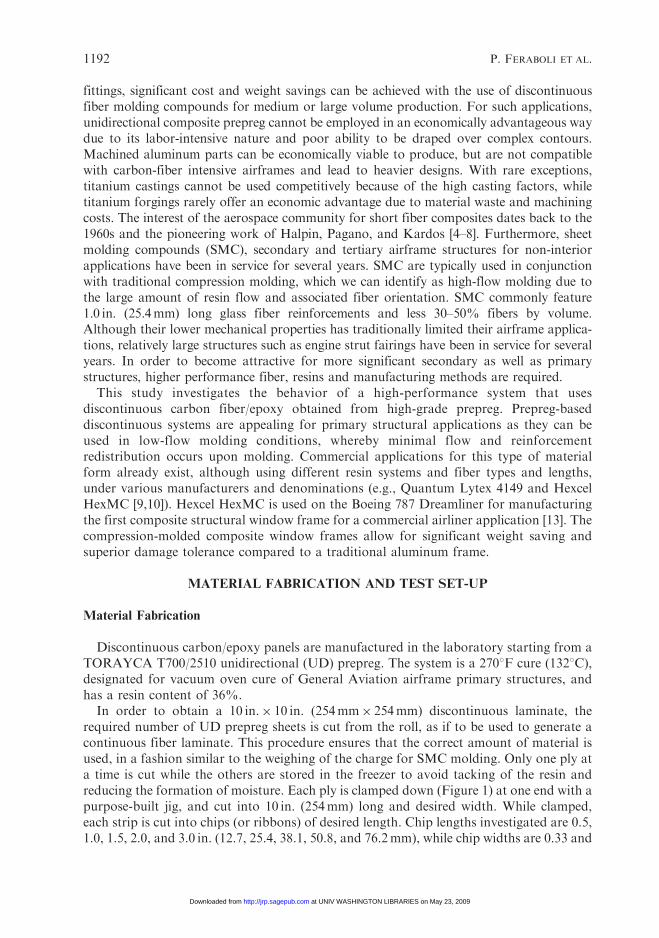
In order to obtain a 10 in.� 10 in. (254mm� 254mm) discontinuous laminate, therequired number of UD prepreg sheets is cut from the roll, as if to be used to generate acontinuous fiber laminate. This procedure ensures that the correct amount of material isused, in a fashion similar to the weighing of the charge for SMC molding. Only one ply ata time is cut while the others are stored in the freezer to avoid tacking of the resin andreducing the formation of moisture. Each ply is clamped down (Figure 1) at one end with apurpose-built jig, and cut into 10 in. (254mm) long and desired width. While clamped,each strip is cut into chips (or ribbons) of desired length. Chip lengths investigated are 0.5,1.0, 1.5, 2.0, and 3.0 in. (12.7, 25.4, 38.1, 50.8, and 76.2mm), while chip widths are 0.33 and
1192 P. FERABOLI ET AL.
at UNIV WASHINGTON LIBRARIES on May 23, 2009 http://jrp.sagepub.comDownloaded from
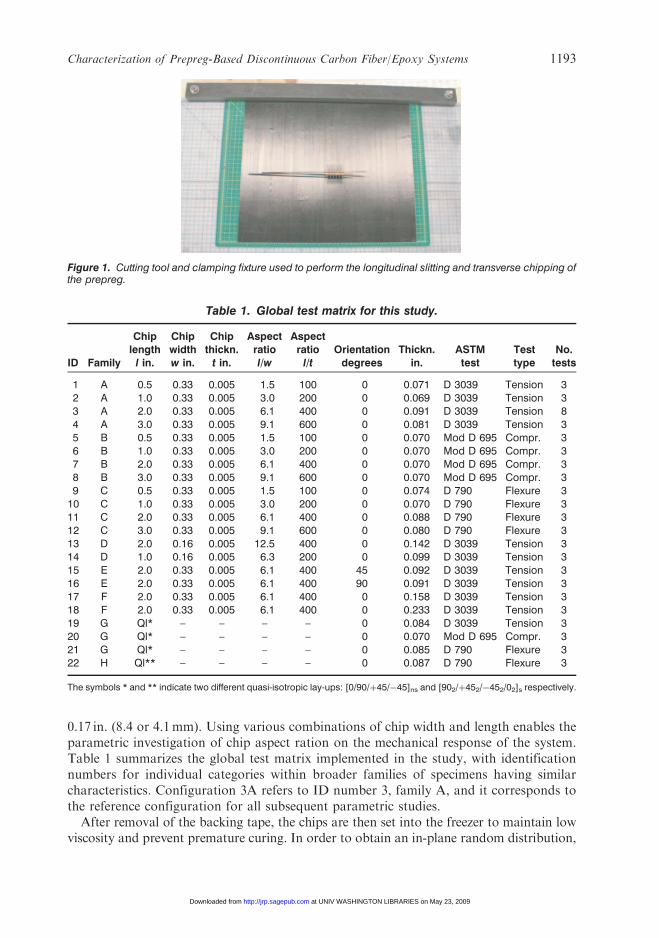
0.17 in. (8.4 or 4.1mm). Using various combinations of chip width and length enables theparametric investigation of chip aspect ration on the mechanical response of the system.Table 1 summarizes the global test matrix implemented in the study, with identificationnumbers for individual categories within broader families of specimens having similarcharacteristics. Configuration 3A refers to ID number 3, family A, and it corresponds tothe reference configuration for all subsequent parametric studies.
After removal of the backing tape, the chips are then set into the freezer to maintain lowviscosity and prevent premature curing. In order to obtain an in-plane random distribution,
Table 1. Global test matrix for this study.
ID Family
Chiplength
l in.
Chipwidthw in.
Chipthickn.
t in.
Aspectratiol/w
Aspectratio
l/tOrientation
degreesThickn.
in.ASTMtest
Testtype
No.tests
1 A 0.5 0.33 0.005 1.5 100 0 0.071 D 3039 Tension 32 A 1.0 0.33 0.005 3.0 200 0 0.069 D 3039 Tension 33 A 2.0 0.33 0.005 6.1 400 0 0.091 D 3039 Tension 84 A 3.0 0.33 0.005 9.1 600 0 0.081 D 3039 Tension 35 B 0.5 0.33 0.005 1.5 100 0 0.070 Mod D 695 Compr. 36 B 1.0 0.33 0.005 3.0 200 0 0.070 Mod D 695 Compr. 37 B 2.0 0.33 0.005 6.1 400 0 0.070 Mod D 695 Compr. 38 B 3.0 0.33 0.005 9.1 600 0 0.070 Mod D 695 Compr. 39 C 0.5 0.33 0.005 1.5 100 0 0.074 D 790 Flexure 3
10 C 1.0 0.33 0.005 3.0 200 0 0.070 D 790 Flexure 311 C 2.0 0.33 0.005 6.1 400 0 0.088 D 790 Flexure 312 C 3.0 0.33 0.005 9.1 600 0 0.080 D 790 Flexure 313 D 2.0 0.16 0.005 12.5 400 0 0.142 D 3039 Tension 314 D 1.0 0.16 0.005 6.3 200 0 0.099 D 3039 Tension 315 E 2.0 0.33 0.005 6.1 400 45 0.092 D 3039 Tension 316 E 2.0 0.33 0.005 6.1 400 90 0.091 D 3039 Tension 317 F 2.0 0.33 0.005 6.1 400 0 0.158 D 3039 Tension 318 F 2.0 0.33 0.005 6.1 400 0 0.233 D 3039 Tension 319 G Ql* – – – – 0 0.084 D 3039 Tension 320 G Ql* – – – – 0 0.070 Mod D 695 Compr. 321 G Ql* – – – – 0 0.085 D 790 Flexure 322 H Ql** – – – – 0 0.087 D 790 Flexure 3
The symbols * and ** indicate two different quasi-isotropic lay-ups: [0/90/þ45/�45]ns and [902/þ452/�452/02]s respectively.
Figure 1. Cutting tool and clamping fixture used to perform the longitudinal slitting and transverse chipping ofthe prepreg.
Characterization of Prepreg-Based Discontinuous Carbon Fiber/Epoxy Systems 1193
at UNIV WASHINGTON LIBRARIES on May 23, 2009 http://jrp.sagepub.comDownloaded from
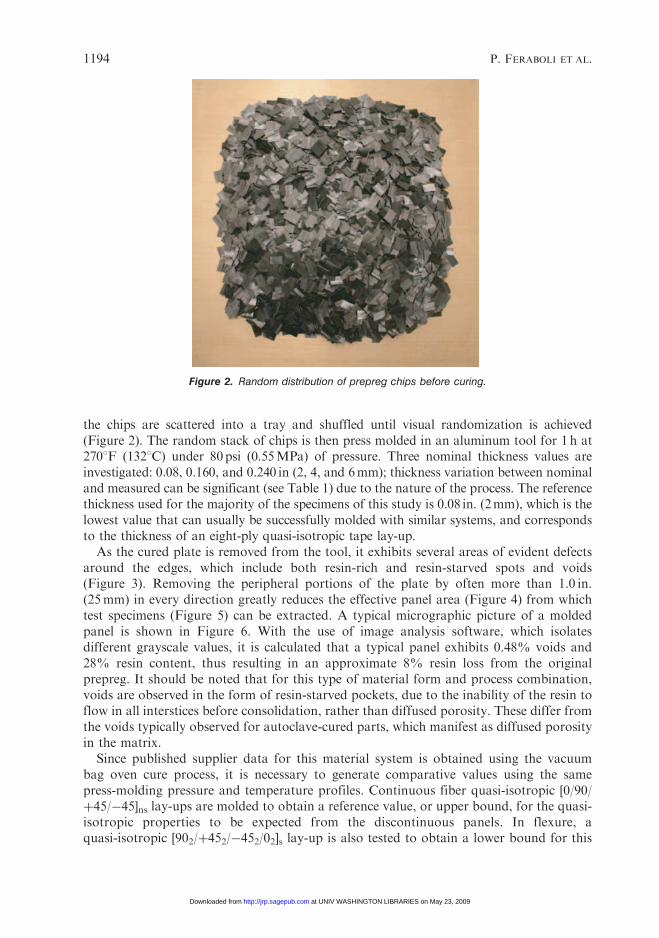
the chips are scattered into a tray and shuffled until visual randomization is achieved(Figure 2). The random stack of chips is then press molded in an aluminum tool for 1 h at2708F (1328C) under 80psi (0.55MPa) of pressure. Three nominal thickness values areinvestigated: 0.08, 0.160, and 0.240 in (2, 4, and 6mm); thickness variation between nominaland measured can be significant (see Table 1) due to the nature of the process. The referencethickness used for the majority of the specimens of this study is 0.08 in. (2mm), which is thelowest value that can usually be successfully molded with similar systems, and correspondsto the thickness of an eight-ply quasi-isotropic tape lay-up.
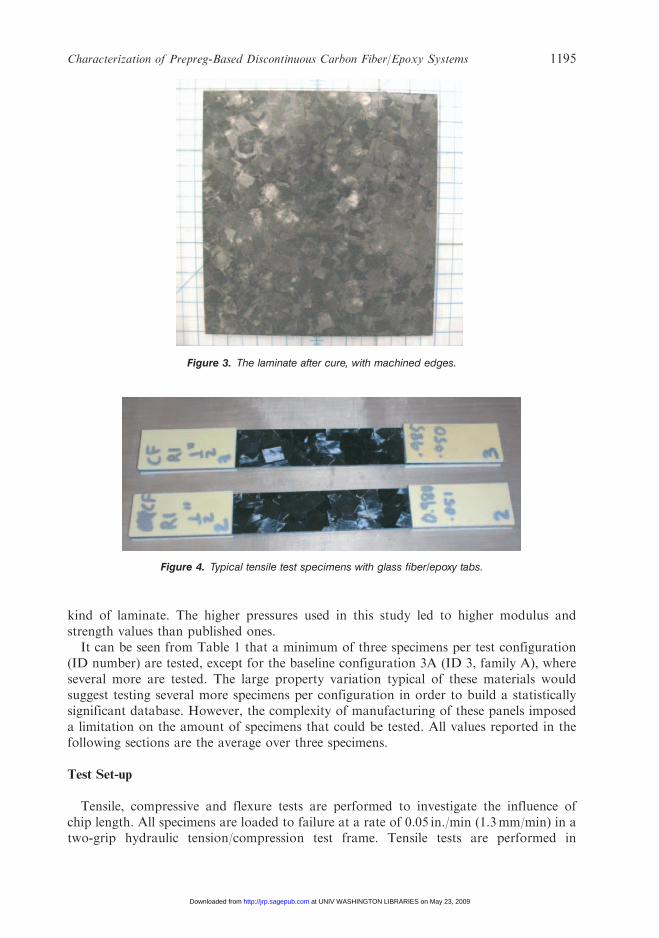
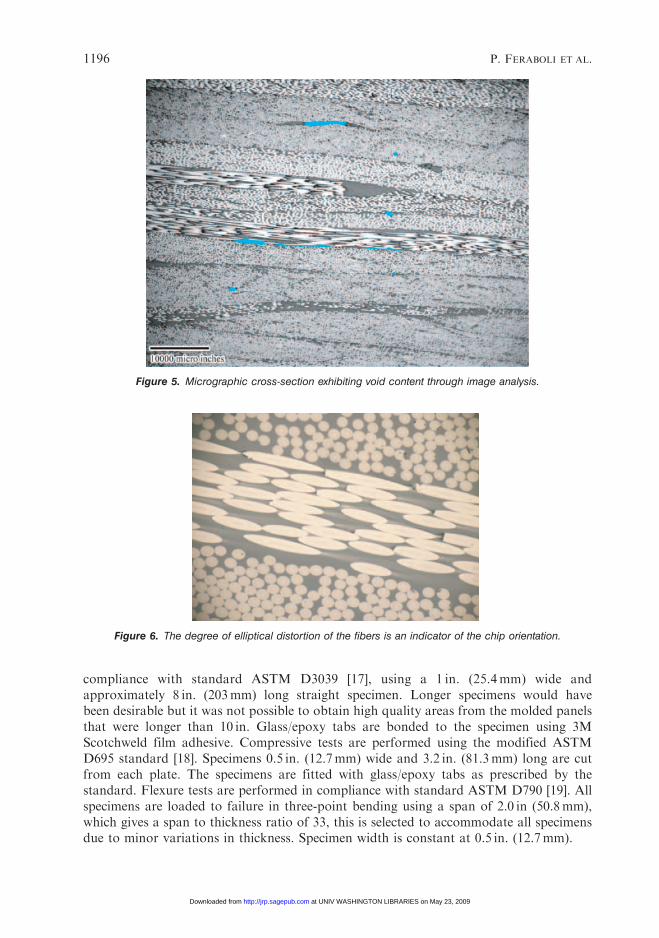
As the cured plate is removed from the tool, it exhibits several areas of evident defectsaround the edges, which include both resin-rich and resin-starved spots and voids(Figure 3). Removing the peripheral portions of the plate by often more than 1.0 in.(25mm) in every direction greatly reduces the effective panel area (Figure 4) from whichtest specimens (Figure 5) can be extracted. A typical micrographic picture of a moldedpanel is shown in Figure 6. With the use of image analysis software, which isolatesdifferent grayscale values, it is calculated that a typical panel exhibits 0.48% voids and28% resin content, thus resulting in an approximate 8% resin loss from the originalprepreg. It should be noted that for this type of material form and process combination,voids are observed in the form of resin-starved pockets, due to the inability of the resin toflow in all interstices before consolidation, rather than diffused porosity. These differ fromthe voids typically observed for autoclave-cured parts, which manifest as diffused porosityin the matrix.
Since published supplier data for this material system is obtained using the vacuumbag oven cure process, it is necessary to generate comparative values using the samepress-molding pressure and temperature profiles. Continuous fiber quasi-isotropic [0/90/þ45/�45]ns lay-ups are molded to obtain a reference value, or upper bound, for the quasi-isotropic properties to be expected from the discontinuous panels. In flexure, aquasi-isotropic [902/þ452/�452/02]s lay-up is also tested to obtain a lower bound for this
Figure 2. Random distribution of prepreg chips before curing.
1194 P. FERABOLI ET AL.
at UNIV WASHINGTON LIBRARIES on May 23, 2009 http://jrp.sagepub.comDownloaded from
kind of laminate. The higher pressures used in this study led to higher modulus andstrength values than published ones.
It can be seen from Table 1 that a minimum of three specimens per test configuration(ID number) are tested, except for the baseline configuration 3A (ID 3, family A), whereseveral more are tested. The large property variation typical of these materials wouldsuggest testing several more specimens per configuration in order to build a statisticallysignificant database. However, the complexity of manufacturing of these panels imposeda limitation on the amount of specimens that could be tested. All values reported in thefollowing sections are the average over three specimens.
Test Set-up
Tensile, compressive and flexure tests are performed to investigate the influence ofchip length. All specimens are loaded to failure at a rate of 0.05 in./min (1.3mm/min) in atwo-grip hydraulic tension/compression test frame. Tensile tests are performed in
Figure 3. The laminate after cure, with machined edges.
Figure 4. Typical tensile test specimens with glass fiber/epoxy tabs.
Characterization of Prepreg-Based Discontinuous Carbon Fiber/Epoxy Systems 1195
at UNIV WASHINGTON LIBRARIES on May 23, 2009 http://jrp.sagepub.comDownloaded from
compliance with standard ASTM D3039 [17], using a 1 in. (25.4mm) wide andapproximately 8 in. (203mm) long straight specimen. Longer specimens would havebeen desirable but it was not possible to obtain high quality areas from the molded panelsthat were longer than 10 in. Glass/epoxy tabs are bonded to the specimen using 3MScotchweld film adhesive. Compressive tests are performed using the modified ASTMD695 standard [18]. Specimens 0.5 in. (12.7mm) wide and 3.2 in. (81.3mm) long are cutfrom each plate. The specimens are fitted with glass/epoxy tabs as prescribed by thestandard. Flexure tests are performed in compliance with standard ASTM D790 [19]. Allspecimens are loaded to failure in three-point bending using a span of 2.0 in (50.8mm),which gives a span to thickness ratio of 33, this is selected to accommodate all specimensdue to minor variations in thickness. Specimen width is constant at 0.5 in. (12.7mm).
Figure 5. Micrographic cross-section exhibiting void content through image analysis.
Figure 6. The degree of elliptical distortion of the fibers is an indicator of the chip orientation.
1196 P. FERABOLI ET AL.
at UNIV WASHINGTON LIBRARIES on May 23, 2009 http://jrp.sagepub.comDownloaded from
For the present study, all strength data reported in the following sections refers toultimate strength, calculated as the strength corresponding to ultimate load. Ultimate loadis determined as the highest value of load reached in the load–displacement curve before alarge drop, usually to values of half the previous ones.
For tensile and compressive tests, modulus is measured with an extensometer, while forflexure tests the modulus is calculated according to ASTM directions, as it cannot be easilymeasured.
Specimens are inspected post-mortem by cross-sectioning, polishing, and opticalmicroscopy to characterize failure modes and morphology. A limited set of specimens,representative of A1–3 categories are machined and subject to resin burn-off andde-plying, to enable further inspection of the failure modes. Burn-off temperature(8508F or 4548C) and duration (3 h) are calibrated carefully in order to allow for partialresin burn-off (average weight loss is 25% per specimen, which leaves around 3% of resincontent) while retaining sufficient chip integrity for subsequent de-plying.
RESULTS
Assessment of Random Distribution
Although the chips are randomized in the mold prior to curing, it is necessary to ensurethat the process employed yields effectively in-plane isotropic distribution. Three methodsare employed to estimate chip distribution, and to verify the effective random nature of the‘laminate’:. Image analysis of the cross-section to determine individual chip orientation through the
thickness (destructive).. Image analysis of the outer (top and bottom) surfaces of the panel (non-destructive).. Testing of tensile specimens cut at 0, 45, and 90 degrees from the longitudinal axis
(destructive).
All three methods successfully demonstrate the panels’ two-dimensional (in-plane)isotropic characteristic, yet each method however poses individual limitations to itsapplicability.
Image analysis of individual chips through the thickness is a destructive approach andrequires careful analysis of the cross-section. Orientation of the chip is estimated based onthe shape of the individual fibers: fiber aligned in the 0 direction exhibit a pseudo-circularsection geometry, while fibers at 90 degrees appear as straight parallel bands (or areinfinite ellipsoids, Figure 6). The degree of deviation from circular to elliptic geometry is agood indication of fiber orientation [14,15]. For small fiber angles, less than 20 degrees, itbecomes very difficult to uniquely determine the effective orientation. Fibers at 0 and 20degrees have nearly the same cross-sectional shape as the amount of elliptical distortionfrom the pseudo-circular shape is very small. To establish the direction of the orientation,as þ and � fibers show the same elliptical shape, it is necessary to investigate theinterference patterns associated to the carbon fiber underneath the thin layer of epoxymatrix. Focusing the lens in the neat resin surrounding the fiber at progressively increasingdepths it is possible to detect the reflection of the shiny fiber below the opaque matrix [14].In bright field analysis this phenomenon is partially visible (Figure 7, left), while in darkfield the presence of the fiber becomes more apparent (Figure 7, right). While this methodidentifies uniquely the fiber orientation for fiber angles greater than 20–30 degrees, for
Characterization of Prepreg-Based Discontinuous Carbon Fiber/Epoxy Systems 1197
at UNIV WASHINGTON LIBRARIES on May 23, 2009 http://jrp.sagepub.comDownloaded from
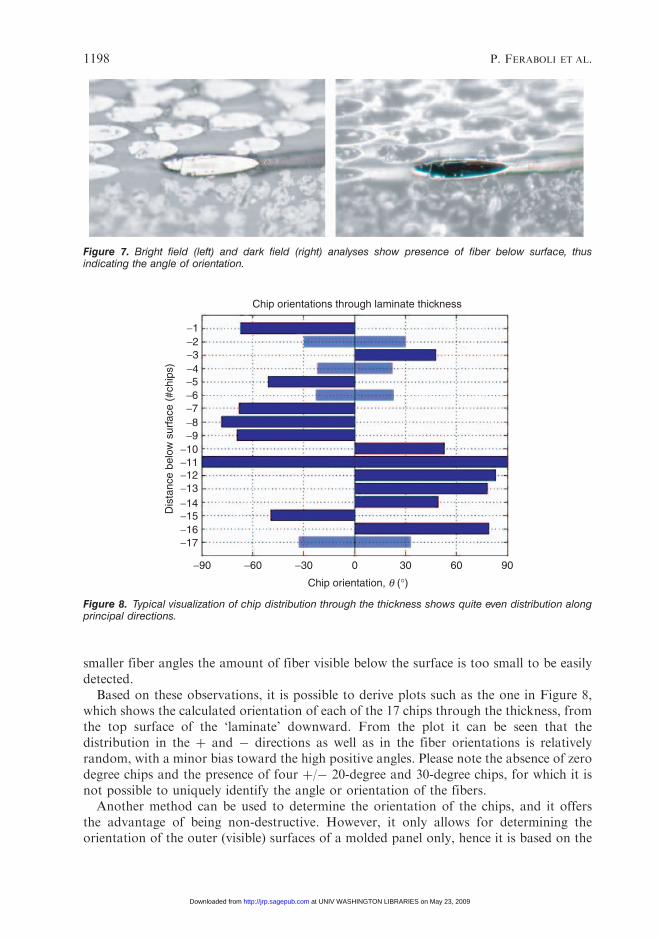
smaller fiber angles the amount of fiber visible below the surface is too small to be easilydetected.
Based on these observations, it is possible to derive plots such as the one in Figure 8,which shows the calculated orientation of each of the 17 chips through the thickness, fromthe top surface of the ‘laminate’ downward. From the plot it can be seen that thedistribution in the þ and � directions as well as in the fiber orientations is relativelyrandom, with a minor bias toward the high positive angles. Please note the absence of zerodegree chips and the presence of four þ/� 20-degree and 30-degree chips, for which it isnot possible to uniquely identify the angle or orientation of the fibers.
Another method can be used to determine the orientation of the chips, and it offersthe advantage of being non-destructive. However, it only allows for determining theorientation of the outer (visible) surfaces of a molded panel only, hence it is based on the
Chip orientation, q (°)
Chip orientations through laminate thickness
0
Dis
tanc
e be
low
sur
face
(#c
hips
)
30−30
−1−2−3−4−5−6−7−8−9
−10−11−12−13−14−15−16−17
60−60 90−90
Figure 8. Typical visualization of chip distribution through the thickness shows quite even distribution alongprincipal directions.
Figure 7. Bright field (left) and dark field (right) analyses show presence of fiber below surface, thusindicating the angle of orientation.
1198 P. FERABOLI ET AL.
at UNIV WASHINGTON LIBRARIES on May 23, 2009 http://jrp.sagepub.comDownloaded from
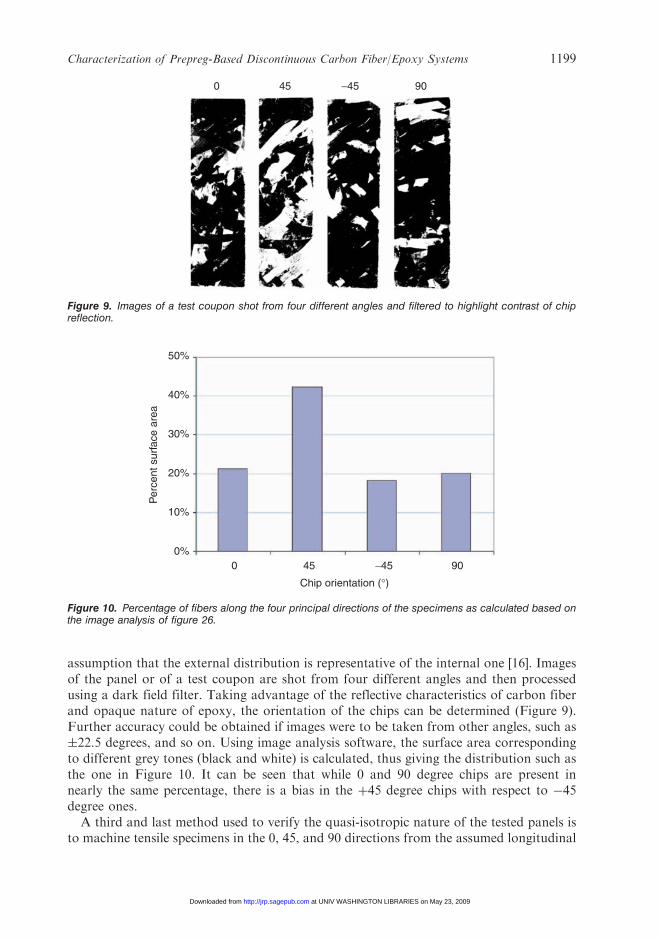
assumption that the external distribution is representative of the internal one [16]. Imagesof the panel or of a test coupon are shot from four different angles and then processedusing a dark field filter. Taking advantage of the reflective characteristics of carbon fiberand opaque nature of epoxy, the orientation of the chips can be determined (Figure 9).Further accuracy could be obtained if images were to be taken from other angles, such as�22.5 degrees, and so on. Using image analysis software, the surface area correspondingto different grey tones (black and white) is calculated, thus giving the distribution such asthe one in Figure 10. It can be seen that while 0 and 90 degree chips are present innearly the same percentage, there is a bias in the þ45 degree chips with respect to �45degree ones.
A third and last method used to verify the quasi-isotropic nature of the tested panels isto machine tensile specimens in the 0, 45, and 90 directions from the assumed longitudinal
50%
40%
30%
20%
10%
0%0 45
Chip orientation (°)
Per
cent
sur
face
are
a
−45 90
Figure 10. Percentage of fibers along the four principal directions of the specimens as calculated based onthe image analysis of figure 26.
0 45 90−45
Figure 9. Images of a test coupon shot from four different angles and filtered to highlight contrast of chipreflection.
Characterization of Prepreg-Based Discontinuous Carbon Fiber/Epoxy Systems 1199
at UNIV WASHINGTON LIBRARIES on May 23, 2009 http://jrp.sagepub.comDownloaded from
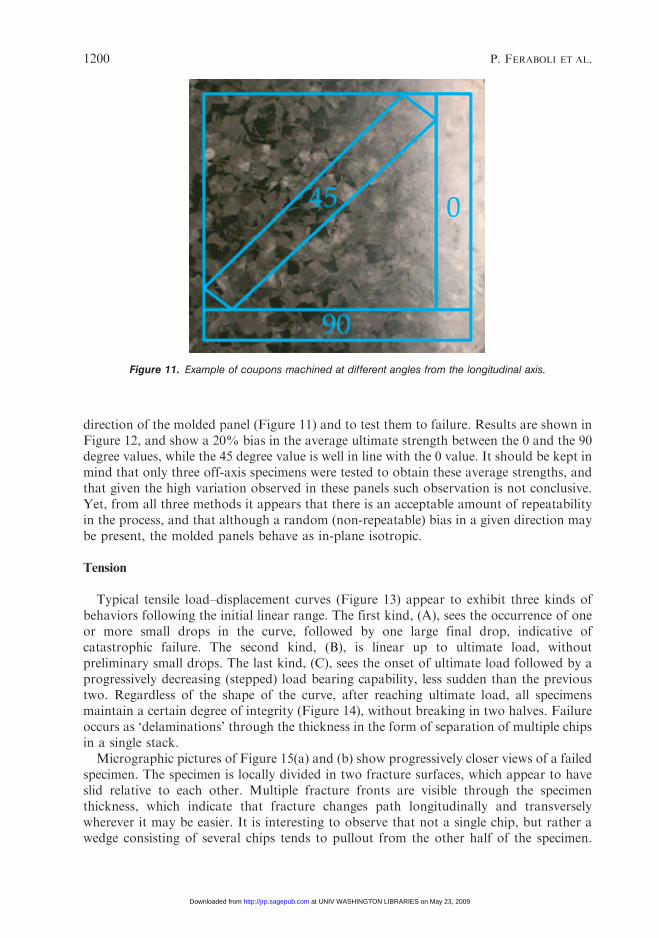
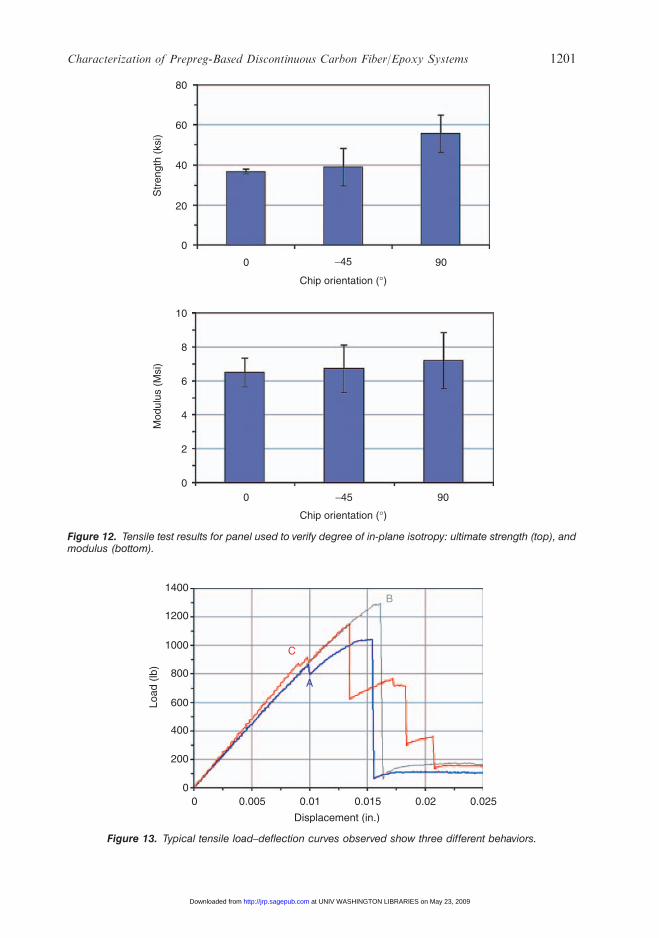
direction of the molded panel (Figure 11) and to test them to failure. Results are shown inFigure 12, and show a 20% bias in the average ultimate strength between the 0 and the 90degree values, while the 45 degree value is well in line with the 0 value. It should be kept inmind that only three off-axis specimens were tested to obtain these average strengths, andthat given the high variation observed in these panels such observation is not conclusive.Yet, from all three methods it appears that there is an acceptable amount of repeatabilityin the process, and that although a random (non-repeatable) bias in a given direction maybe present, the molded panels behave as in-plane isotropic.
Tension
Typical tensile load–displacement curves (Figure 13) appear to exhibit three kinds ofbehaviors following the initial linear range. The first kind, (A), sees the occurrence of oneor more small drops in the curve, followed by one large final drop, indicative ofcatastrophic failure. The second kind, (B), is linear up to ultimate load, withoutpreliminary small drops. The last kind, (C), sees the onset of ultimate load followed by aprogressively decreasing (stepped) load bearing capability, less sudden than the previoustwo. Regardless of the shape of the curve, after reaching ultimate load, all specimensmaintain a certain degree of integrity (Figure 14), without breaking in two halves. Failureoccurs as ‘delaminations’ through the thickness in the form of separation of multiple chipsin a single stack.
Micrographic pictures of Figure 15(a) and (b) show progressively closer views of a failedspecimen. The specimen is locally divided in two fracture surfaces, which appear to haveslid relative to each other. Multiple fracture fronts are visible through the specimenthickness, which indicate that fracture changes path longitudinally and transverselywherever it may be easier. It is interesting to observe that not a single chip, but rather awedge consisting of several chips tends to pullout from the other half of the specimen.
Figure 11. Example of coupons machined at different angles from the longitudinal axis.
1200 P. FERABOLI ET AL.
at UNIV WASHINGTON LIBRARIES on May 23, 2009 http://jrp.sagepub.comDownloaded from
80
60
40
20
10
Mod
ulus
(M
si)
Str
engt
h (k
si)
8
6
2
4
0
0
0
0
90
90−45
−45
Chip orientation (°)
Chip orientation (°)
Figure 12. Tensile test results for panel used to verify degree of in-plane isotropy: ultimate strength (top), andmodulus (bottom).
1400
1200
1000
800
Load
(lb
)
600
0
200
400
0 0.005 0.01 0.015 0.02 0.025
Displacement (in.)
C
A
B
Figure 13. Typical tensile load–deflection curves observed show three different behaviors.
Characterization of Prepreg-Based Discontinuous Carbon Fiber/Epoxy Systems 1201
at UNIV WASHINGTON LIBRARIES on May 23, 2009 http://jrp.sagepub.comDownloaded from
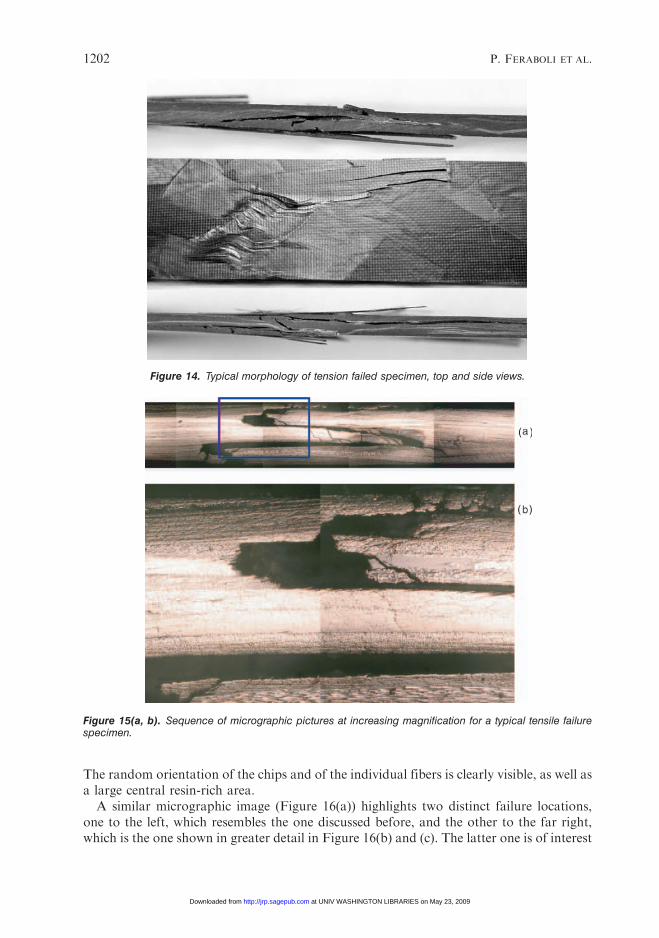
The random orientation of the chips and of the individual fibers is clearly visible, as well asa large central resin-rich area.
A similar micrographic image (Figure 16(a)) highlights two distinct failure locations,one to the left, which resembles the one discussed before, and the other to the far right,which is the one shown in greater detail in Figure 16(b) and (c). The latter one is of interest
( )
( )
Figure 15(a, b). Sequence of micrographic pictures at increasing magnification for a typical tensile failurespecimen.
Figure 14. Typical morphology of tension failed specimen, top and side views.
1202 P. FERABOLI ET AL.
at UNIV WASHINGTON LIBRARIES on May 23, 2009 http://jrp.sagepub.comDownloaded from
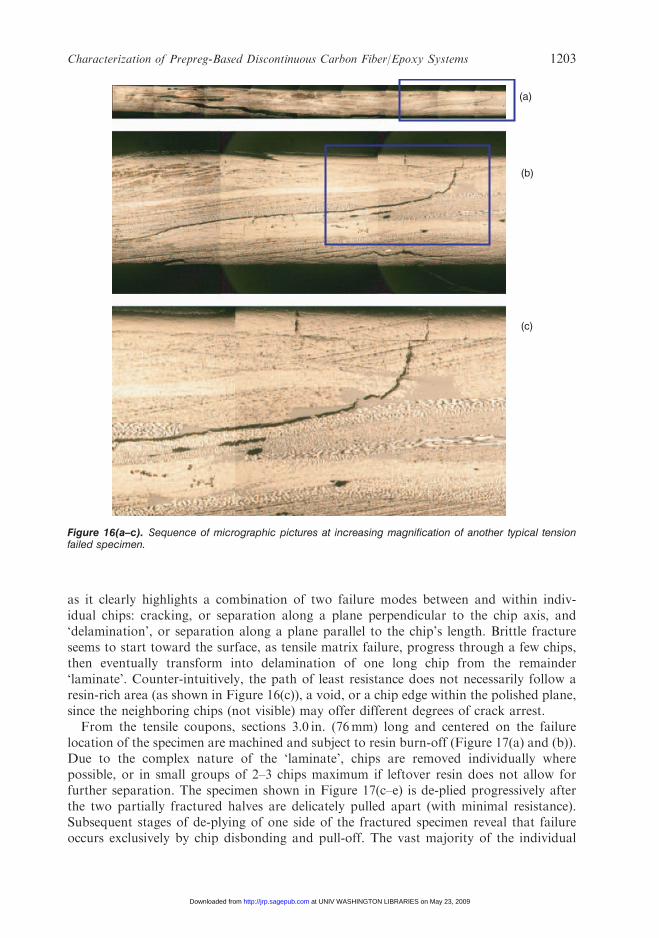
as it clearly highlights a combination of two failure modes between and within indiv-idual chips: cracking, or separation along a plane perpendicular to the chip axis, and‘delamination’, or separation along a plane parallel to the chip’s length. Brittle fractureseems to start toward the surface, as tensile matrix failure, progress through a few chips,then eventually transform into delamination of one long chip from the remainder‘laminate’. Counter-intuitively, the path of least resistance does not necessarily follow aresin-rich area (as shown in Figure 16(c)), a void, or a chip edge within the polished plane,since the neighboring chips (not visible) may offer different degrees of crack arrest.
From the tensile coupons, sections 3.0 in. (76mm) long and centered on the failurelocation of the specimen are machined and subject to resin burn-off (Figure 17(a) and (b)).Due to the complex nature of the ‘laminate’, chips are removed individually wherepossible, or in small groups of 2–3 chips maximum if leftover resin does not allow forfurther separation. The specimen shown in Figure 17(c–e) is de-plied progressively afterthe two partially fractured halves are delicately pulled apart (with minimal resistance).Subsequent stages of de-plying of one side of the fractured specimen reveal that failureoccurs exclusively by chip disbonding and pull-off. The vast majority of the individual
(a)
(b)
(c)
Figure 16(a–c). Sequence of micrographic pictures at increasing magnification of another typical tensionfailed specimen.
Characterization of Prepreg-Based Discontinuous Carbon Fiber/Epoxy Systems 1203
at UNIV WASHINGTON LIBRARIES on May 23, 2009 http://jrp.sagepub.comDownloaded from
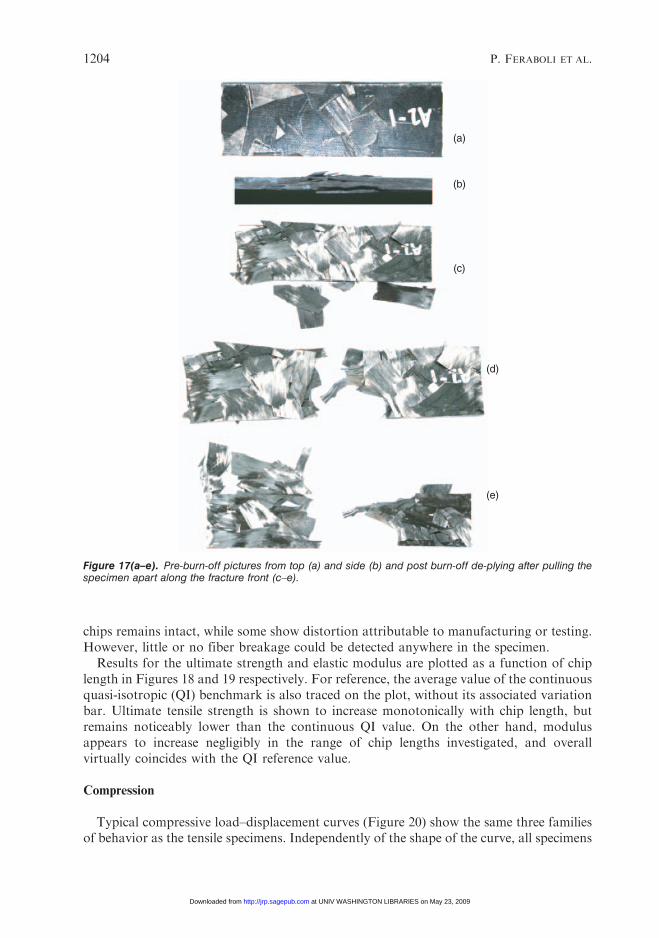
chips remains intact, while some show distortion attributable to manufacturing or testing.However, little or no fiber breakage could be detected anywhere in the specimen.
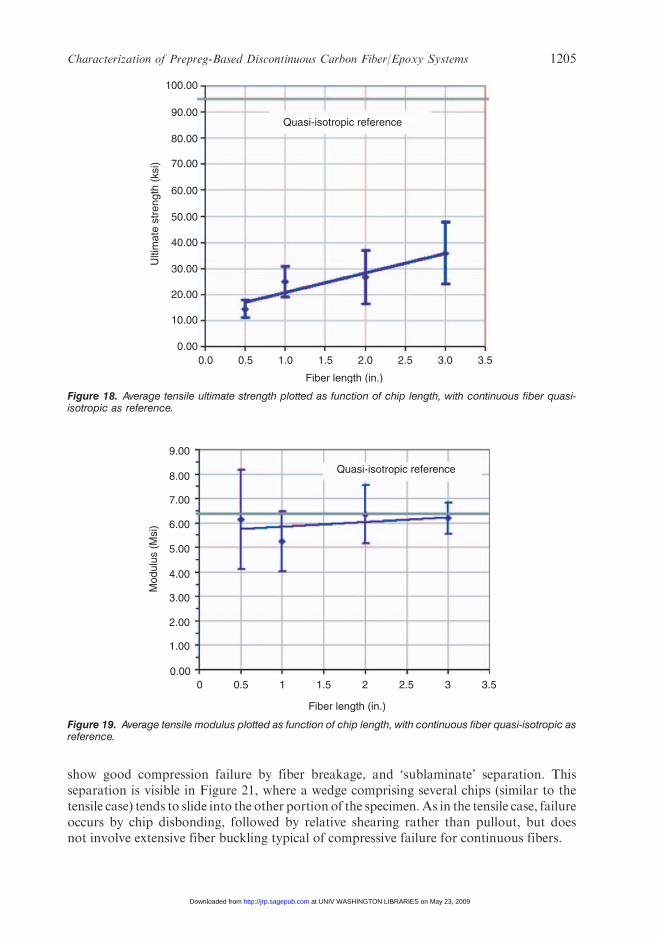
Results for the ultimate strength and elastic modulus are plotted as a function of chiplength in Figures 18 and 19 respectively. For reference, the average value of the continuousquasi-isotropic (QI) benchmark is also traced on the plot, without its associated variationbar. Ultimate tensile strength is shown to increase monotonically with chip length, butremains noticeably lower than the continuous QI value. On the other hand, modulusappears to increase negligibly in the range of chip lengths investigated, and overallvirtually coincides with the QI reference value.
Compression
Typical compressive load–displacement curves (Figure 20) show the same three familiesof behavior as the tensile specimens. Independently of the shape of the curve, all specimens
(a)
(b)
(c)
(d)
(e)
Figure 17(a–e). Pre-burn-off pictures from top (a) and side (b) and post burn-off de-plying after pulling thespecimen apart along the fracture front (c–e).
1204 P. FERABOLI ET AL.
at UNIV WASHINGTON LIBRARIES on May 23, 2009 http://jrp.sagepub.comDownloaded from
show good compression failure by fiber breakage, and ‘sublaminate’ separation. Thisseparation is visible in Figure 21, where a wedge comprising several chips (similar to thetensile case) tends to slide into the other portion of the specimen.As in the tensile case, failureoccurs by chip disbonding, followed by relative shearing rather than pullout, but doesnot involve extensive fiber buckling typical of compressive failure for continuous fibers.
Quasi-isotropic reference
Fiber length (in.)
0.0 0.5 1.0
100.00
90.00
80.00
70.00
60.00
40.00
30.00
20.00
10.00
Ulti
mat
e st
reng
th (
ksi)
0.00
50.00
1.5 2.0 3.02.5 3.5
Figure 18. Average tensile ultimate strength plotted as function of chip length, with continuous fiber quasi-isotropic as reference.
Quasi-isotropic reference
Fiber length (in.)
0 0.5 1
1.00
2.00
3.00
Mod
ulus
(M
si)
4.00
5.00
6.00
7.00
8.00
9.00
0.001.5 2 32.5 3.5
Figure 19. Average tensile modulus plotted as function of chip length, with continuous fiber quasi-isotropic asreference.
Characterization of Prepreg-Based Discontinuous Carbon Fiber/Epoxy Systems 1205
at UNIV WASHINGTON LIBRARIES on May 23, 2009 http://jrp.sagepub.comDownloaded from
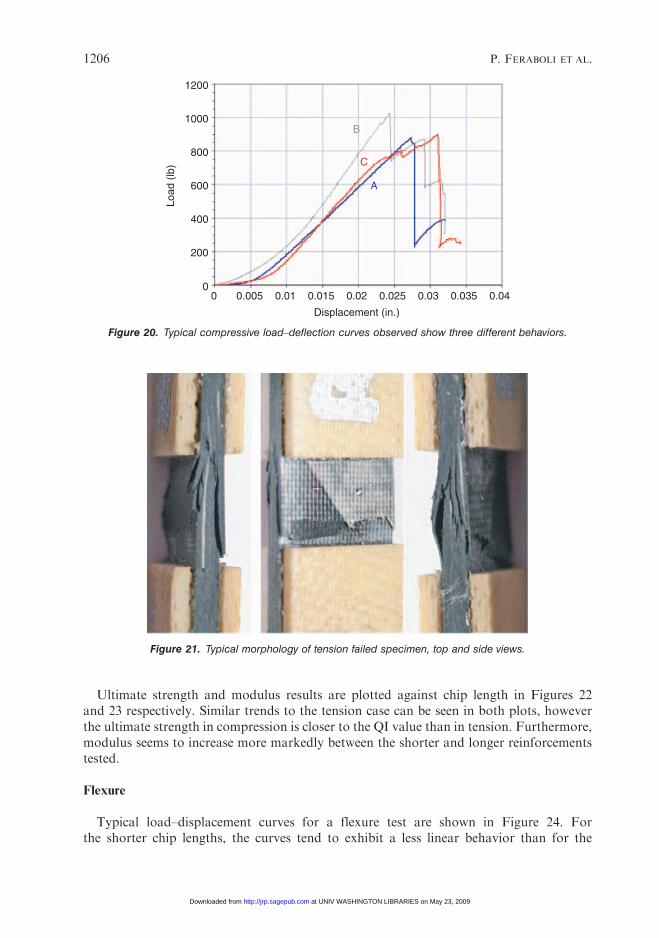
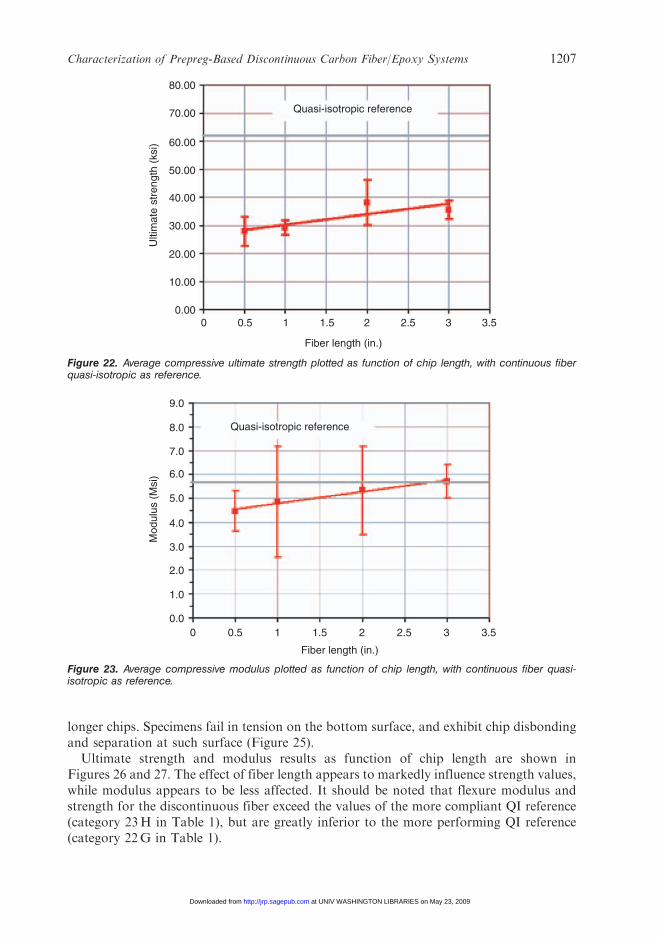
Ultimate strength and modulus results are plotted against chip length in Figures 22and 23 respectively. Similar trends to the tension case can be seen in both plots, howeverthe ultimate strength in compression is closer to the QI value than in tension. Furthermore,modulus seems to increase more markedly between the shorter and longer reinforcementstested.
Flexure
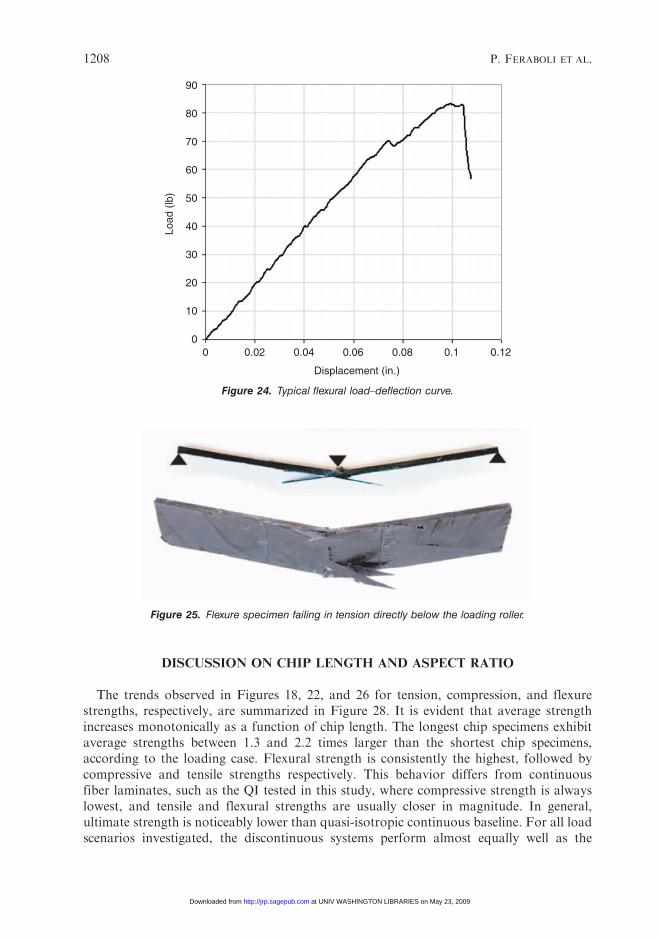
Typical load–displacement curves for a flexure test are shown in Figure 24. Forthe shorter chip lengths, the curves tend to exhibit a less linear behavior than for the
Figure 21. Typical morphology of tension failed specimen, top and side views.
B
A
C
00
200
400
600
800
1000
Load
(lb
)
1200
0.005 0.01 0.015 0.02
Displacement (in.)
0.03 0.040.025 0.035
Figure 20. Typical compressive load–deflection curves observed show three different behaviors.
1206 P. FERABOLI ET AL.
at UNIV WASHINGTON LIBRARIES on May 23, 2009 http://jrp.sagepub.comDownloaded from
longer chips. Specimens fail in tension on the bottom surface, and exhibit chip disbondingand separation at such surface (Figure 25).
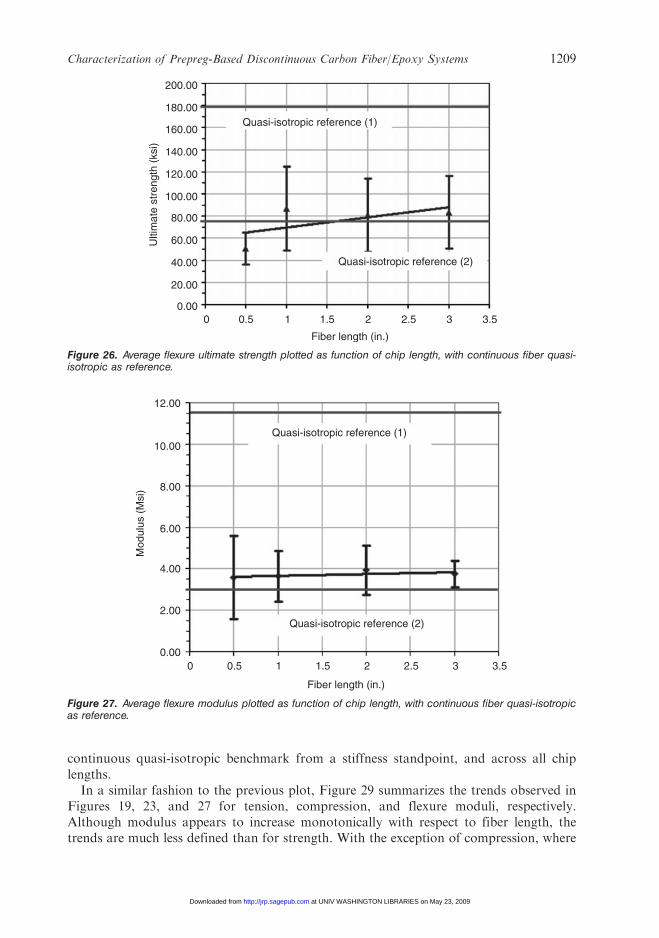
Ultimate strength and modulus results as function of chip length are shown inFigures 26 and 27. The effect of fiber length appears to markedly influence strength values,while modulus appears to be less affected. It should be noted that flexure modulus andstrength for the discontinuous fiber exceed the values of the more compliant QI reference(category 23H in Table 1), but are greatly inferior to the more performing QI reference(category 22G in Table 1).
Quasi-isotropic reference
Ulti
mat
e st
reng
th (
ksi)
80.00
60.00
50.00
40.00
30.00
20.00
10.00
0.000 1 2 30.5 2.5 3.51.5
Fiber length (in.)
70.00
Figure 22. Average compressive ultimate strength plotted as function of chip length, with continuous fiberquasi-isotropic as reference.
Quasi-isotropic reference
Mod
ulus
(M
si)
9.0
8.0
7.0
6.0
5.0
4.0
3.0
2.0
1.0
0.00 1 2 30.5 2.5 3.51.5
Fiber length (in.)
Figure 23. Average compressive modulus plotted as function of chip length, with continuous fiber quasi-isotropic as reference.
Characterization of Prepreg-Based Discontinuous Carbon Fiber/Epoxy Systems 1207
at UNIV WASHINGTON LIBRARIES on May 23, 2009 http://jrp.sagepub.comDownloaded from
DISCUSSION ON CHIP LENGTH AND ASPECT RATIO
The trends observed in Figures 18, 22, and 26 for tension, compression, and flexurestrengths, respectively, are summarized in Figure 28. It is evident that average strengthincreases monotonically as a function of chip length. The longest chip specimens exhibitaverage strengths between 1.3 and 2.2 times larger than the shortest chip specimens,according to the loading case. Flexural strength is consistently the highest, followed bycompressive and tensile strengths respectively. This behavior differs from continuousfiber laminates, such as the QI tested in this study, where compressive strength is alwayslowest, and tensile and flexural strengths are usually closer in magnitude. In general,ultimate strength is noticeably lower than quasi-isotropic continuous baseline. For all loadscenarios investigated, the discontinuous systems perform almost equally well as the
Load
(lb
)
90
70
50
30
20
10
00 0.02 0.04 0.06
Displacement (in.)
0.08 0.1 0.12
40
80
60
Figure 24. Typical flexural load–deflection curve.
Figure 25. Flexure specimen failing in tension directly below the loading roller.
1208 P. FERABOLI ET AL.
at UNIV WASHINGTON LIBRARIES on May 23, 2009 http://jrp.sagepub.comDownloaded from
continuous quasi-isotropic benchmark from a stiffness standpoint, and across all chiplengths.
In a similar fashion to the previous plot, Figure 29 summarizes the trends observed inFigures 19, 23, and 27 for tension, compression, and flexure moduli, respectively.Although modulus appears to increase monotonically with respect to fiber length, thetrends are much less defined than for strength. With the exception of compression, where
Quasi-isotropic reference (1)
Quasi-isotropic reference (2)
Mod
ulus
(M
si)
Fiber length (in.)
00.00
2.00
4.00
6.00
8.00
10.00
12.00
1 2 32.5 3.51.50.5
Figure 27. Average flexure modulus plotted as function of chip length, with continuous fiber quasi-isotropicas reference.
Quasi-isotropic reference (1)
Quasi-isotropic reference (2)
Ulti
mat
e st
reng
th (
ksi)
Fiber length (in.)
00.00
20.00
40.00
60.00
80.00
100.00
120.00
140.00
160.00
180.00
200.00
1 2 32.5 3.51.50.5
Figure 26. Average flexure ultimate strength plotted as function of chip length, with continuous fiber quasi-isotropic as reference.
Characterization of Prepreg-Based Discontinuous Carbon Fiber/Epoxy Systems 1209
at UNIV WASHINGTON LIBRARIES on May 23, 2009 http://jrp.sagepub.comDownloaded from
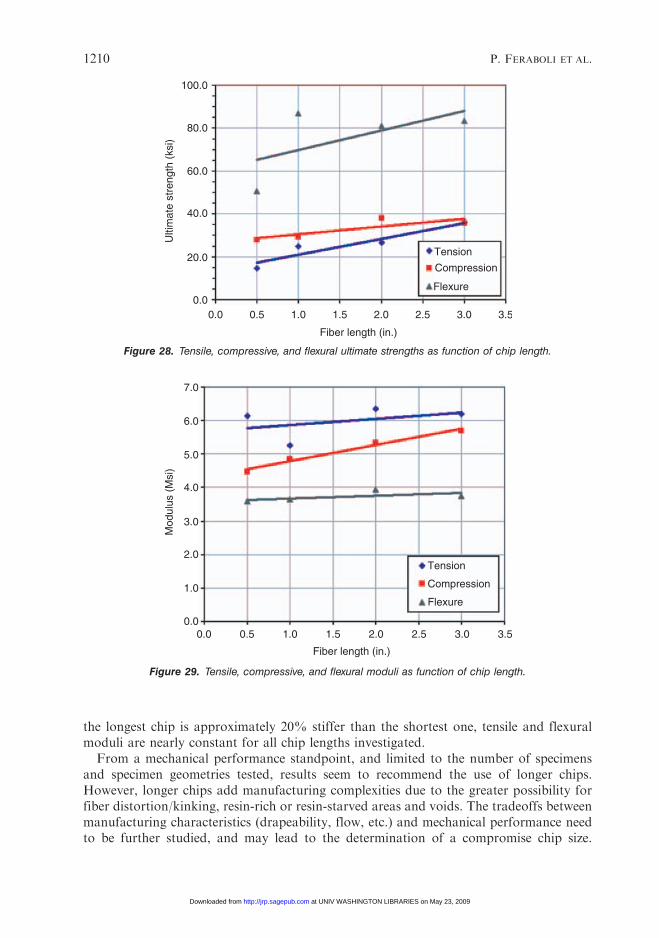
the longest chip is approximately 20% stiffer than the shortest one, tensile and flexuralmoduli are nearly constant for all chip lengths investigated.
From a mechanical performance standpoint, and limited to the number of specimensand specimen geometries tested, results seem to recommend the use of longer chips.However, longer chips add manufacturing complexities due to the greater possibility forfiber distortion/kinking, resin-rich or resin-starved areas and voids. The tradeoffs betweenmanufacturing characteristics (drapeability, flow, etc.) and mechanical performance needto be further studied, and may lead to the determination of a compromise chip size.
7.0
6.0
5.0
4.0
3.0
Tension
Compression
Flexure
2.0
1.0
0.00.0 0.5 1.0 2.0 3.01.5 3.52.5
Fiber length (in.)
Mod
ulus
(M
si)
Figure 29. Tensile, compressive, and flexural moduli as function of chip length.
Tension
100.0
80.0
60.0
40.0
20.0
0.00.0 0.5 1.0 2.0 3.01.5 3.52.5
Compression
Fiber length (in.)
Ulti
mat
e st
reng
th (
ksi)
Flexure
Figure 28. Tensile, compressive, and flexural ultimate strengths as function of chip length.
1210 P. FERABOLI ET AL.
at UNIV WASHINGTON LIBRARIES on May 23, 2009 http://jrp.sagepub.comDownloaded from
Noticeable variation in the data was observed, ranging from 8% to 43% according to theloading conditions and specific property measured. However, it should be considered thatthe manufacturing process used in this study was not industrialized and that existing orfuture commercial systems will inevitably show reduced variation in the mechanicalproperties. Automated chip randomization and stacking will lead to improved moldcoverage and reduced material waste, as well as less possibilities for contamination andmoisture formation during the lengthy process of slitting and chipping. The use of moresuitable resin systems, with ad hoc developed cure temperature, pressure and time, will alsogenerate more flow in the matrix and thus lead to improved mold coverage and reducedvoid content.
Traditional discontinuous fiber theories [4–6], used in conjunction with SMC and P4material forms, have made use of the fiber aspect ratio as the ratio of fiber length to fiberdiameter (l/d). Since the load transfer between the fiber and the matrix occurs by shear, thecritical aspect ratio [4] defines the transition between failure by fiber pullout (matrixfailure) and failure by fiber breakage (fiber failure). For ribbon (flake) reinforceddiscontinuous systems, where the reinforcement has the form of a chip rather than anindividual fiber, it has been suggested to use a modified aspect ratio that employs the chipthickness [7] or tow width [11,12].
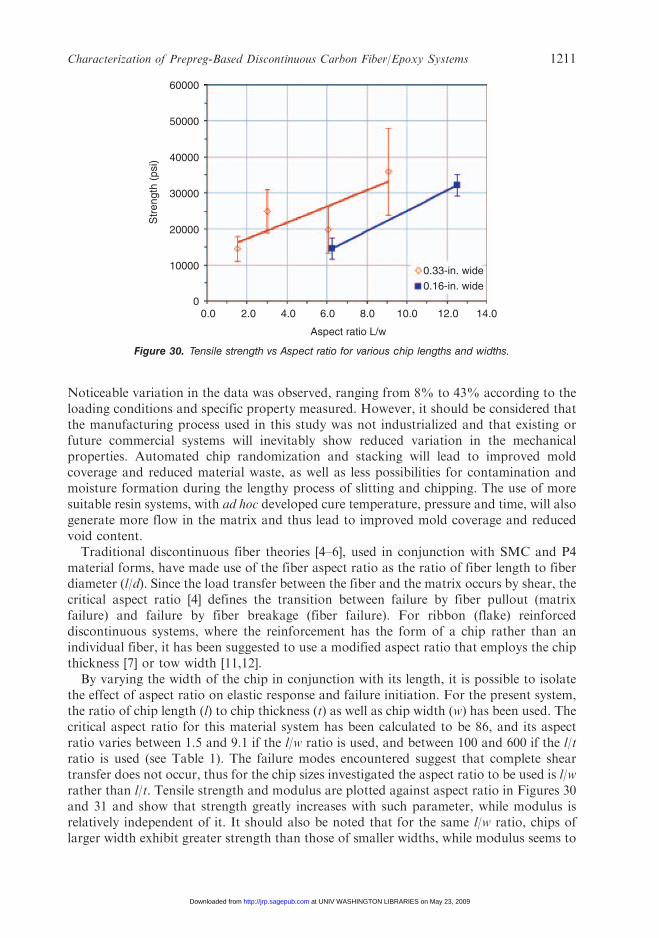
By varying the width of the chip in conjunction with its length, it is possible to isolatethe effect of aspect ratio on elastic response and failure initiation. For the present system,the ratio of chip length (l) to chip thickness (t) as well as chip width (w) has been used. Thecritical aspect ratio for this material system has been calculated to be 86, and its aspectratio varies between 1.5 and 9.1 if the l/w ratio is used, and between 100 and 600 if the l/tratio is used (see Table 1). The failure modes encountered suggest that complete sheartransfer does not occur, thus for the chip sizes investigated the aspect ratio to be used is l/wrather than l/t. Tensile strength and modulus are plotted against aspect ratio in Figures 30and 31 and show that strength greatly increases with such parameter, while modulus isrelatively independent of it. It should also be noted that for the same l/w ratio, chips oflarger width exhibit greater strength than those of smaller widths, while modulus seems to
60000
50000
40000
30000
20000
10000
Str
engt
h (p
si)
00.0 2.0 4.0 6.0 8.0
Aspect ratio L/w
0.33-in. wide
0.16-in. wide
10.0 12.0 14.0
Figure 30. Tensile strength vs Aspect ratio for various chip lengths and widths.
Characterization of Prepreg-Based Discontinuous Carbon Fiber/Epoxy Systems 1211
at UNIV WASHINGTON LIBRARIES on May 23, 2009 http://jrp.sagepub.comDownloaded from
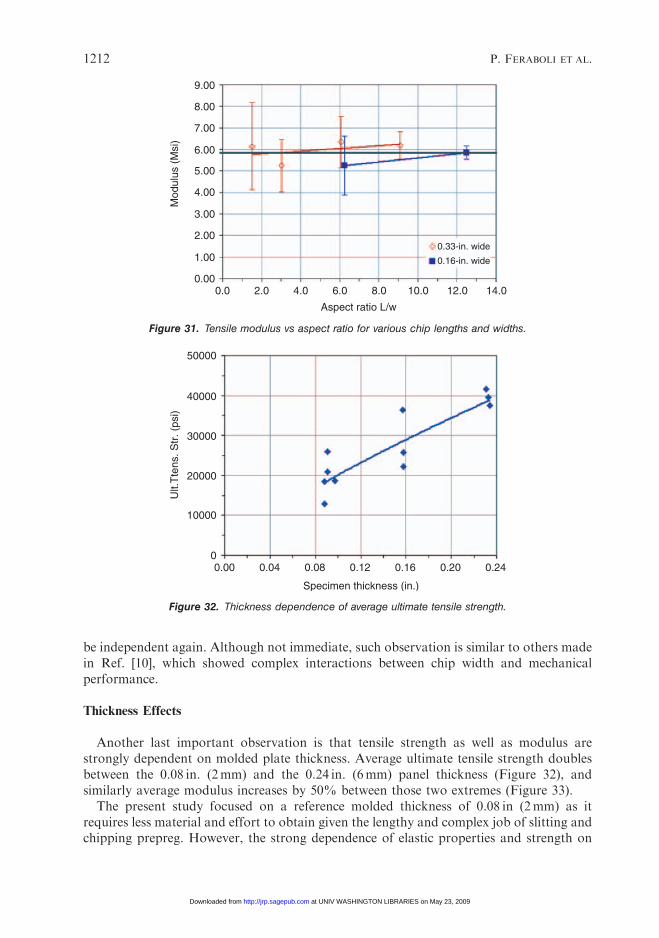
be independent again. Although not immediate, such observation is similar to others madein Ref. [10], which showed complex interactions between chip width and mechanicalperformance.
Thickness Effects
Another last important observation is that tensile strength as well as modulus arestrongly dependent on molded plate thickness. Average ultimate tensile strength doublesbetween the 0.08 in. (2mm) and the 0.24 in. (6mm) panel thickness (Figure 32), andsimilarly average modulus increases by 50% between those two extremes (Figure 33).
The present study focused on a reference molded thickness of 0.08 in (2mm) as itrequires less material and effort to obtain given the lengthy and complex job of slitting andchipping prepreg. However, the strong dependence of elastic properties and strength on
0.00 0.04
10000
20000
30000
40000
50000
0
Ult.
Tte
ns. S
tr. (
psi)
0.08 0.12
Specimen thickness (in.)
0.16 0.20 0.24
Figure 32. Thickness dependence of average ultimate tensile strength.
9.00
8.00
7.00
6.00
4.00
5.00
3.00
2.00
1.00
0.000.0
Mod
ulus
(M
si)
Aspect ratio L/w
2.0 4.0 6.0 8.0 10.0 12.0
0.33-in. wide
0.16-in. wide
14.0
Figure 31. Tensile modulus vs aspect ratio for various chip lengths and widths.
1212 P. FERABOLI ET AL.
at UNIV WASHINGTON LIBRARIES on May 23, 2009 http://jrp.sagepub.comDownloaded from
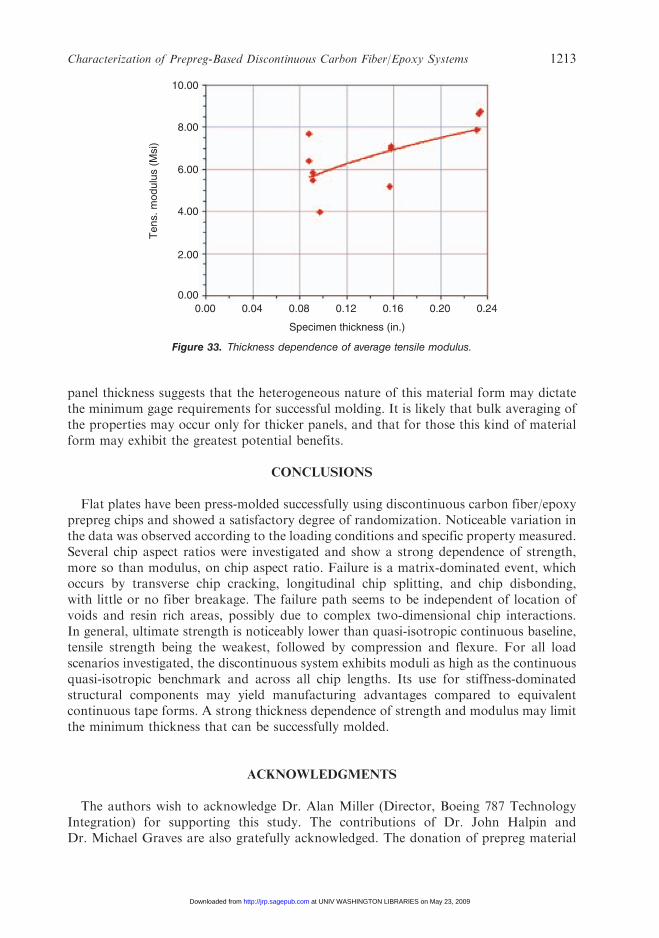
panel thickness suggests that the heterogeneous nature of this material form may dictatethe minimum gage requirements for successful molding. It is likely that bulk averaging ofthe properties may occur only for thicker panels, and that for those this kind of materialform may exhibit the greatest potential benefits.
CONCLUSIONS
Flat plates have been press-molded successfully using discontinuous carbon fiber/epoxyprepreg chips and showed a satisfactory degree of randomization. Noticeable variation inthe data was observed according to the loading conditions and specific property measured.Several chip aspect ratios were investigated and show a strong dependence of strength,more so than modulus, on chip aspect ratio. Failure is a matrix-dominated event, whichoccurs by transverse chip cracking, longitudinal chip splitting, and chip disbonding,with little or no fiber breakage. The failure path seems to be independent of location ofvoids and resin rich areas, possibly due to complex two-dimensional chip interactions.In general, ultimate strength is noticeably lower than quasi-isotropic continuous baseline,tensile strength being the weakest, followed by compression and flexure. For all loadscenarios investigated, the discontinuous system exhibits moduli as high as the continuousquasi-isotropic benchmark and across all chip lengths. Its use for stiffness-dominatedstructural components may yield manufacturing advantages compared to equivalentcontinuous tape forms. A strong thickness dependence of strength and modulus may limitthe minimum thickness that can be successfully molded.
ACKNOWLEDGMENTS
The authors wish to acknowledge Dr. Alan Miller (Director, Boeing 787 TechnologyIntegration) for supporting this study. The contributions of Dr. John Halpin andDr. Michael Graves are also gratefully acknowledged. The donation of prepreg material
10.00
8.00
6.00
4.00
2.00
Ten
s. m
odul
us (
Msi
)
0.00
Specimen thickness (in.)
0.00 0.04 0.08 0.12 0.16 0.20 0.24
Figure 33. Thickness dependence of average tensile modulus.
Characterization of Prepreg-Based Discontinuous Carbon Fiber/Epoxy Systems 1213
at UNIV WASHINGTON LIBRARIES on May 23, 2009 http://jrp.sagepub.comDownloaded from
by Andrea Dorr (Toray Composites of America) was fundamental for performingthe study.
REFERENCES
1. Miller, A. G. (2007). The Boeing 787 Dreamliner, Keynote Address, 48th AIAA/ASME/ASCE/AHS/ASCStructures, Structural Dynamics, and Materials Conference, Waikiki, HI, USA.
2. Stickler, P. B. (2002). Composite Materials for Commercial Transport – Issues and Future ResearchDirections, In: Proceedings of the ASC, 17th Annual Technical Conference, West Lafayette, IN, USA.
3. Ilcewicz, L. B., Smith, P. J., Hanson, C. T., Walker, T. H., Metschan, T. L., Mabson, G. E., Willden, K. S.,Flynn, B. W., Scholz, D. B., Polland, D. R., Fredrikson, H. G., Olson, J. T. and Backman, B. F. (1997).Advanced Technology Composite Fuselage – Program Overview, NASA CR4734, April 1997.
4. Halpin, J. C. (1969). Stiffness and Expansion Estimates for Oriented Short Fiber Composites, PolymerEngineering and Science, 3: 732.
5. Halpin, J. C. and Pagano, N. J. (1969). The Laminate Approx. for Randomly Oriented Short FiberComposites, Polymer Engineering and Science, 3: 720.
6. Halpin, J. C. and Kardos, J. L. (1978). Strength of Discontinuous Reinforced Composites, PolymerEngineering and Science, 18(6): 496.
7. Kardos, J. L., Michno, M. J. and Duffy, T. A. (1974). Investigation of High Performance Short FiberReinforced Plastics, Final Report, Naval Air Systems Command, No. N00019-73-C-0358.
8. Giurgiutiu, V. and Reifsnider, K. L. (1994). Development of Strength Theories for Random FiberComposites, Journal of Composites Technology and Research, 16(2): 103–114.
9. Porter, J. (2004). Moving Closer to the Goal of Cost Effective Complex Geometry Carbon CompositeParts, HPC4HPC Special Session, Proceedings of the 19th ASC Technical Conference, Atlanta, GA, USA,Sept. 2004.
10. Starbuck, J. M., Jacob, G. C. and Simunovic, S. (2004). Energy Absorption in Chopped Carbon FiberCompression Molded Composites, Proceedings of the 16th ASC Technical Conference, 2001, Also inAutomotive Light-weighing Materials, Department of Energy, FY 2004 Progress Report. Chapters 4 and 5.
11. Harper, L. T., Turner, T. A., Warrior, N. A. and Rudd, C. D. (2006). Characterization of Random CarbonFibre Composites from a Directed Fibre Preforming Process: The Effect of Fibre Length, Composite Part A,37(11): 1863–1878.
12. Harper, L. T., Turner, T. A., Warrior, N. A., Dahl, J. S. and Rudd, C. D. (2006). Characterisation ofRandom Carbon Fibre Composites from a Directed Fibre Preforming Process: Analysis of MicrostructuralParameters, Composite Part A, 37(11): 2136–2147.
13. Boeing 787 Features Composite Window Frames, Reinforced Plastics, Application News, Vol. 51, Issue 3,March 2007, Page 4.
14. Kawamura, M., Ikeda, S., Morita, S. and Sanomura, Y. (2005). Unambiguous Determination of 3D FiberOrientation Distribution in Thermoplastic Composites using SAM Image of Elliptical Mark and InterferenceFringe, Journal of Composite Materials, 39(4): 287–299.
15. Zak, G., Park, C. B. and Benhaib, B. (2004). Estimation of Three-dimensional Fibre OrientationDistribution in Short-fibre Composites by a Two-section Method, Journal of Composite Materials, 35(4):316–339.
16. Nishimura, T., Ansell, M. P. and Ando, N. (2001). The Relationship Between the Arrangement of WoodStrands at the Surface of OSB and the Modulus of Rupture Determined by Mage Analysis, Wood Scienceand Technology, 35: 555–562.
17. ASTM D3039/D3039M-00, Standard Test Method for Tensile Properties of Polymer Matrix CompositeMaterials, Volume 15.03, 2006.
18. ASTM D695-02a, Standard Test Method for Compressive Properties of Rigid Plastics, Volume 08.01, 2002.
19. ASTM D790-03, Standard Test Methods for Flexural Properties of Unreinforced and Reinforced Plasticsand Electrical Insulating Materials, Volume 08.01, 2003.
1214 P. FERABOLI ET AL.
at UNIV WASHINGTON LIBRARIES on May 23, 2009 http://jrp.sagepub.comDownloaded from


![Prepreg technology[1]](https://img.pdfslide.net/doc/110x75/5550156eb4c90535638b4d56/prepreg-technology1.jpg)