Embed Size (px)
Citation preview

7th International Symposium on NDT in Aerospace – Tu.1.A.2
1 License: http://creativecommons.org/licenses/by-nd/3.0/
CHARACTERIZATION OF PRODUCTION-INDUCED DEFECTS IN CARBON FIBER
REINFORCED THERMOPLASTIC TECHNOLOGY
Frederic J.C. FISCHER1*, Yannick MEZAKEU TONGNAN 1, Matthias BEYRLE 1,
Tobias GERNGROSS 1, Michael KUPKE 1 1 Deutsches Zentrum für Luft- und Raumfahrt (DLR) e.V., Zentrum für Leichtbauproduktionstechnologie (ZLP), Am Technologiezentrum 4,
86159 Augsburg, Germany *[email protected]
Abstract. Advanced thermoplastic composites such as carbon fibre reinforced polyetheretherketone (CF-PEEK) have a great potential for efficient processing. Along the production chain certain manufacturing steps may cause slight, superficial flaws or mere optical effects without greater impact on performance whereas others may lead to severe changes of the final part properties. These production–induced defects can arise already in the early stages of the production chain and may hence cause significant downstream effects. Ultrasonic spot welding is a well-established manufacturing step in aerospace industries. As such, it is applied in preforming to locally melt the matrix of advanced thermoplastic prepregs, to bond stacked layers to one another and later produce a tailored organic sheet or part, e.g. via vacuum consolidation. Depending on the process parameters ultrasonic spot welding may, however, cause detrimental overheating of the laminate, penetration of the horn into the part and disruption of fibres.
In this work the influence of production-induced defects on the properties of fully consolidated specimen is investigated and correlated with methods of non-destructive testing. The experimental analysis focusses on the impact of the respective welding and processing parameters on the mechanical performance and the detectability by non-destructive testing, e.g. optical lock-in thermography.
The aim is to improve the robustness of the process by detecting, defining and dimishing production-induced defects. In this context, non-destructive testing (NDT) is employed to detect quality issues in an early stage of production.
Mor
e In
fo a
t Ope
n A
cces
s D
atab
ase
ww
w.n
dt.n
et/?
id=
1893
3

2
1. Introduction
At the DLR Center for Lightweight Production Technology (ZLP) in Augsburg research is focused on the smart automation of the carbon fibre reinforced thermoplastic (CFRTP) production. The increased employment of thermoplastic composite materials in aerospace industries requires enhanced and yet flexible processes in order to ensure the capability to react to change incorporations. Consequently, sophisticated non-destructive inspection techniques and monitoring strategies are indispensable tools to assess the robustness of the process chain and meet high quality standards.
Water coupled ultrasonic testing is the most common test method for final inspection especially among suppliers and original equipment manufacturers in aircraft industry. Other techniques such as fibre-angle detection, air coupled ultrasonic inspection and active thermography, to date, are often limited to special tasks. At the Institute for Structures and Design the aforementioned non-destructive testing (NDT) methods are refined toward automated in-line quality assurance. Beside, these defect sensitive NDT methods are employed in order to validate and secure the robustness of the manufacturing procedure.
In this work the influence of production-induced defects on the properties of fully consolidated carbon fibre reinforced thermoplastic samples is investigated and compared to results by methods of non-destructive testing. Such defects may arise already in the early stages of the production chain, for instance during ultrasonic spot welding of composite laminates. Non-destructive testing serves to determine small initial flaws which may have larger downstream effects. In this context, NDT may support the detection and correction of quality issues already during production setup (pre-production) as well as in an early stage of production.
2. State of the Art
2.1 Ultrasonic Spot Welding in Thermoplastic Preforming
At ZLP tailored organic sheets and curved preforms are produced in an automated manufacturing cell by stacking and ultrasonic welding of thermoplastic prepregs. The respective weld parameters have been established in a preliminary study [1].
Figure 1: Thermoplastic production cell at ZLP
Figure 2: Ultrasonic horn integrated in an end effector for the spot welding of laminate stacks
Benatar and Gutowski pioneered ultrasonic welding of advanced thermoplastic composites, specifically of CF-PEEK [2–4]. As such, ultrasonic welding is a well-established manufacturing step and is frequently applied in preforming. The layup of the

3
A380 J-nose skins at Fokker Aerostructures for example is realized by ultrasonic spot welding [5]. The matrix is locally melted to easily bond several layers to one another.
Ultrasonic welding of thermoplastic composites requires a static pressure whilst high frequency vibrations are transferred. The heat is generated at the contact point of the horn on the laminate stack and the so-called heat-affected zone (HAZ) is comparably small. However, the higher thermal conductivity along the carbon fibres leads to energy dissipation in the reinforcement direction which results in a lengthening of the welding time. This in turn may cause detrimental overheating of the laminate below the horn and a penetration of the horn into the part [6]. Hence, it is advisable to use a horn with a rather large surface and to apply lower contact pressures during ultrasonic welding to avoid disruption of fibres [7], [8].
2.2 Production-induced Defects
Following the definition of Potter [9] we will consider anything a “defect” that causes a local deviation from an ideal and uniform composite structure. Production-induced defects may arise at any given stage of the entire manufacturing procedure. They are caused by processing variabilities and errors in the way the process is carried out. Resulting deviations may or may not be of interest for the resulting component properties. Either way, this paper is aiming to support an appropriate assessment.
By contrast, design-related defects originate from unsuitable part design which does not respect the nature of the selected matrix and reinforcement. These defects as well as deviations to pre-defined tolerances of design guidelines such as specified fibre angles and boundary curve positions for textile cut-pieces or tape lay-ups are not treated within this work.
For a starting point the main focus is laid upon the influence of ultrasonic welding on the mechanical performance of test plate specimen. The goal is the improvement of the overall process regarding efficiency and robustness.
The sources of variabilities, especially in vacuum bag processes such as vacuum consolidation are manifold beginning with (as-purchased) auxiliary material and prepregs up to cure cycle variations (see Appendix). However, as manufacturing conditions from cutting to final heat treatment are kept constant – within the boundaries of the general production environment – merely the welding parameters are expected to influence the mechanical outcome. In addition, batch variabilities may be identified given that the mechanical values are based on specimen with and without weld spots from the same test plate (see Figure 8) and the respective reference samples should hence exhibit equal values.
Figure 3 illustrates a horn spot welding a laminate stack. Depending on the welding parameters an imprint remains on the upper side of the stack with noticeable out-of-plane fibre undulation. As the high potential of composite properties is best exploited with as little undulations as possible these welding imprints require a closer inspection. Given that the matrix is locally molten during welding the weld spots could merely constitute a pre-consolidated area which, after vacuum consolidation, dissolves once the entire sample is properly consolidated. Should these local areas of fibre misalignment, however, persist even after consolidation they may have significant influence on the mechanical properties, especially on compressive strength.

4
Figure 3: Illustration of a horn locally welding the laminate stack
Compressive failure in carbon fibre-reinforced composites has been discussed
profoundly. Shultheisz and Waas have gathered the main aspects in their review [10] and [11]. There is consensus that compressive collapse is usually due to micro-buckling even though the actual initiation of the failure mechanisms are still a matter of ongoing research [12].
In any case, fibre misalignment and ply waviness is known to promote failure. We thus monitor regions of potentially higher fibre misalignment and follow them through the test.
3. Experimental Setup and Practice
3.1 Sample Preparation
In this work 12 by 12 inch cross-ply laminate stacks of 18 UD-prepreg layers (TenCate TC1200 PEEK AS-4 [13]) were welded with a titanium stepped horns of 5 mm diameter and a smooth surface. The weld parameters were varied (top row and bottom row) concerning the applied contact pressure (see Table 1). A Branson low power ultrasonic welder of type 2000 LPe: 40:0.50.4T (40 kHz & 500 W) was used. Amplitudes of 23 µm were found to deliver suitable spot welding results when stacking carbon fibre-reinforced PEEK.
Preliminary findings suggest the use of lower contact pressures, hence larger horn diameters. However, the 5 mm horn is known to cause less displacement of top layer during initial intromission of sound and is thus more user-friendly.
Each ply was welded at the same 14 spots according to a specific pattern to probe the maximum impact of ultrasonic welding (see Figure 4).

5
Figure 4: Top view of the weld pattern on the laminate stack
Table 1. Set of weld parameters of each sample batch
Set of parameters
A (left row)
B (right row)
Force N 108 132 Area mm² 19.6 19.6 Pressure MPa 5.5 6.7 On Time sec 0.5 0.5 Hold Time sec 2 2 Amplitude µm 23 23
The spot welded laminate stacks were subsequently embedded in a vacuum bag
setup before undergoing the final heating cycle at about 400 °C. A transportable tooling plate (outer dimensions: 880 mm x 880 mm x 420 mm) has been designed and produced for this purpose (see [14]). Vacuum consolidation as a flexible production technique is especially suitable for small lot sizes.
Figure 5: Transportable tooling with vacuum piping system for the vacuum consolidation
The configuration of a typical vacuum bag is illustrated in Figure 6. The composite stacks were placed between two layers of polyimide separation foils of UPILEX-125S

6
grade coated with a form release agent. Desized glass filament fabric is used all about the entire laminate stack to guarantee evacuation during the process. A caul sheet atop the laminate provides uniform surface finish. The entire assembly was then covered by a thin polyimide film (Kapton 200HN) which is fixed to the tooling plate with a high temperature sealant tape (AIRTECH A300-3G). Vacuum is introduced by connecting the tooling to a rotary vane pump.
Figure 6. Vacuum bag configuration for consolidation
The laminates were then heat treated in a N1500/45HA circulating air oven from
Nabertherm with an inner volume of 1500 dm³ and a maximum temperature of 450 °C. The class 1 furnace with type A instrumentation fulfils AMS 2750E requirements.
The sample temperature was measured with thermocouple type K within the upper, middle and lower layers of the laminate stack. The temperature profile is illustrated in the following image.
Figure 7: Temperature profile of a typical heating cycle for the vacuum consolidation in the furnace: set
temperature (blue), actual temperature (red), sample temperature (green)
3.2 Non-destructive Test Methods
3.1.1 Optical Microscopy
Optical Microscopy was carried out with a KEYENCE VHX-5000 digital microscope. The depth and diameter of the weld spots was evaluated prior to consolidation. The
7
microscope allows the compilation of images at different focal planes to fully-focused 3D models. 3.1.2 Optical Lock-in Thermography
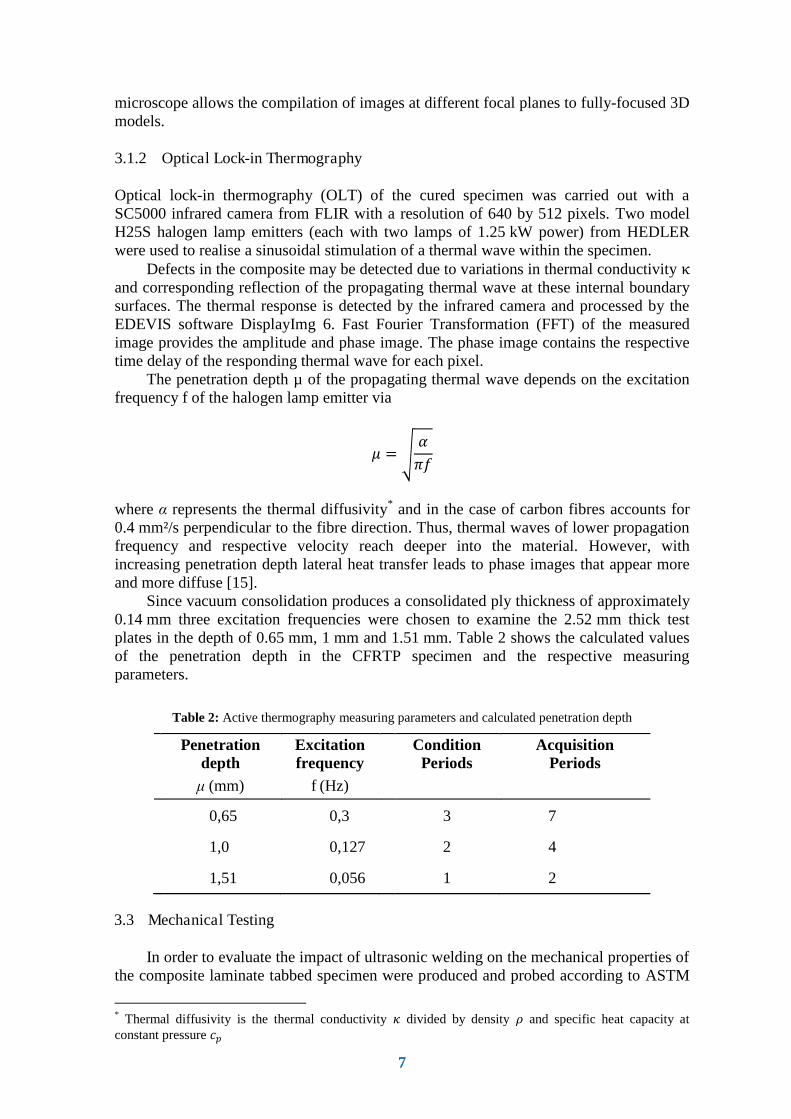
Optical lock-in thermography (OLT) of the cured specimen was carried out with a SC5000 infrared camera from FLIR with a resolution of 640 by 512 pixels. Two model H25S halogen lamp emitters (each with two lamps of 1.25 kW power) from HEDLER were used to realise a sinusoidal stimulation of a thermal wave within the specimen.
Defects in the composite may be detected due to variations in thermal conductivity κ and corresponding reflection of the propagating thermal wave at these internal boundary surfaces. The thermal response is detected by the infrared camera and processed by the EDEVIS software DisplayImg 6. Fast Fourier Transformation (FFT) of the measured image provides the amplitude and phase image. The phase image contains the respective time delay of the responding thermal wave for each pixel.
The penetration depth µ of the propagating thermal wave depends on the excitation frequency f of the halogen lamp emitter via � = √ �講�
where α represents the thermal diffusivity* and in the case of carbon fibres accounts for 0.4 mm²/s perpendicular to the fibre direction. Thus, thermal waves of lower propagation frequency and respective velocity reach deeper into the material. However, with increasing penetration depth lateral heat transfer leads to phase images that appear more and more diffuse [15].
Since vacuum consolidation produces a consolidated ply thickness of approximately 0.14 mm three excitation frequencies were chosen to examine the 2.52 mm thick test plates in the depth of 0.65 mm, 1 mm and 1.51 mm. Table 2 shows the calculated values of the penetration depth in the CFRTP specimen and the respective measuring parameters.
Table 2: Active thermography measuring parameters and calculated penetration depth
Penetration depth
Excitation frequency
Condition Periods
Acquisition Periods
μ (mm) f (Hz)
0,65 0,3 3 7
1,0 0,127 2 4
1,51 0,056 1 2
3.3 Mechanical Testing
In order to evaluate the impact of ultrasonic welding on the mechanical properties of the composite laminate tabbed specimen were produced and probed according to ASTM
* Thermal diffusivity is the thermal conductivity � divided by density 貢 and specific heat capacity at constant pressure ��

8
D 6641/D 6641M (Procedure B). The rectangular glass fibre reinforced polymer (GFRP) tabs were 1.5 mm in thickness with ±45°-orientation.
The individual test specimens (140 mm x 12 mm) were cut out of the original consolidated test plates according to the following cut profile (see Figure 8).
Figure 8: Cut profile with marked position of weld spots on every other specimen
A ZWICK KAPPA 050 DS testing machine was employed with a combined
loading compression test fixture along with the GOM Aramis 12M system. The latter allows the non-contact measurement of 3D displacement and strain during compressive loading.
Before testing a speckle pattern is sprayed on the samples. Two CCD cameras record the sample during testing. The measuring software compares the change of the pattern with reference images and calculates the deformation of the sample. The sample is illuminated during the test and the recording frequency of the cameras is 2 Hz.
The sample is mounted between four jaws and fixed with a hydraulic clamping device. The tests are performed with a test speed of 1.3 mm/s. Figure 9 shows the experimental setup and six test specimen with speckle pattern.
.
Figure 9: Compressive loading setup and Aramis 12M measuring system (left);
Test specimen with speckle pattern (right)

9
4. Results
The following image shows the consolidated sample (see Figure 10). The weld spots are apparent and mark a clear indent on the otherwise smooth surface. The weld spots in the left row appear more distinct even though the weld pressure was lower than in the right row. The striped appearance is caused by the scanner unit.
Figure 10: Image of a vacuum consolidated sample plate
4.1 Non-destructive Testing
4.1.1 Optical Microscopy
Depth and diameter of each weld spot was measured prior to consolidation (see Figure 13). The 5 mm horn leaves a clearly visible imprint on the laminate stack surface, at times even with noticeable fibre fracture. For the laminate stacks welded at contact pressures of 5.5 MPa and 6.7 MPa the imprints are about 4.6 mm ± 0.3 mm in diameter and roughly 210 µm ± 70 µm deep. The depth measurements are subject to variations as the uncompacted stack shows waviness at the weld spots (see Figure 13).
Figure 11: Image of an imprint after ultrasonic
welding with a 5 mm horn at 0.5 seconds On time and 5.5 MPa contact pressure
Figure 12: Image of the very same weld spot after vacuum consolidation

10
After consolidation during which fibre wetting and sample compaction takes place the measurements were repeated. The imprints remain distinct atop the compacted sample, the previously disrupted fibres are clearly recognizable and dry areas without proper wetting remain. The surface, however, is more reflective due to the homogenous distribution of the matrix. Quantitative measurement of the depth of the imprints after consolidation is not feasible.
Figure 13: 3D-model and profile measurement of the very same weld spot

11
4.1.2 Optical Lock-in Thermography
The following compilation shows the thermograms acquired at three excitation frequencies of the consolidated samples with weld spot parameters as described above. Thermograms were taken both from the front and the back of each 2.5 mm thick specimen plate to generate an overview over the entire depth. IV f = 0.3 Hz f = 0.127 Hz f = 0.056 Hz
Fro
nt
Bac
k
µ = 0.65 mm µ = 1 mm µ = 1.5 mm
Figure 14: Compilation of thermograms of a sample plate measured from front and back at three excitation frequencies
V f = 0.3 Hz f = 0.127 Hz f = 0.056 Hz
Fro
nt
Bac
k
µ = 0.65 mm µ = 1 mm µ = 1.5 mm
Figure 15: Compilation of thermograms of a similarly produced sample plate measured from front and back at three excitation frequencies
During data analysis a rectangular region of interest (ROI) of approximately
235 px x 260 px was place at the centre of the thermograms. The scale was adjusted so that the middle of the scale equals the average phase angle of the defined ROI. The scale width was chosen to cover the minimum and maximum values within the ROI. The phase angle at the weld spots account for the maximum value. The differences in phase angle between the mean value and the minimum is lower†.
† �min ≅ �̅ − 2°

12
In general the images appear rather irregular with variations in phase angle. The 0/90 fibre orientation of the cross ply laminate is clearly visible. The weld spots can be detected, though the appearance and detectability appears to be quite random. Since the sample is probed both from front and back at different frequencies one can state that the effect of the spot welding is not merely superficial but does reach within the sample.
4.1.3 Computed Tomography
Computed tomography (CT) measurements were carried out at the Institute of Structures and Design in Stuttgart. The following x-ray scans show the weld spot section with the set of parameters A (see Table 1) at various depth of the specimen plate.
Figure 16 shows the first seven of overall 36 CT-scans beginning from the top of the sample toward the centre. The seven weld spots are clearly visible as dark dots at the top and successively vanish toward the sample centre, though not uniformly.
Figure 16: Compilation of the first seven CT-scans from the top of the sample (left) toward the centre
(right) Figure 17 shows every fifth of the overall 36 CT-scans beginning from the top of
the sample toward the centre and then to the back. A dark grey 0/90 pattern gradually appears and becomes more pronounced toward the centre. The dark weld spots are found both at the top and at the bottom.
Figure 17: Compilation of every fifth CT-scan of the specimen plate from top (left) to bottom (right)

13
Figure 18 depicts the overlay of all scans at the weld spot in the very middle of all seven imprints. The surrounding is largely homogenously light grey and the dark grey areas are limited. The cross-sectional image to the left indicates how deep the imprints at top and bottom reach toward the centre.
Figure 18: Detailed scan and cross-sectional image of the weld spot in the middle of all seven
4.2 Mechanical Testing
Specimen with and without weld spots were tested according to ASTM D 6641/D 6641M (Procedure B). After compressive failure all of the samples showed an acceptable failure mode (see Figure 19). The experimental results are thus valid.
Figure 19: Example of four successfully tested specimens with acceptable failure modes and areas
according to ASTM 6641
The obtained mechanical moduli are compiled in a bar chart and show rather small statistical variation (see Figure 20). The compressive moduli of the spot-welded samples are significantly lower than those of the reference samples for both sets of tested welding parameters (compare Table 1). Buckling sets in at lower stress levels and leads to an earlier failure. The differences between the differently welded specimens are within the range of the measurement error. The same is true for the differences of the reference samples.
14
Figure 20: Compressive modulus of the samples with weld spots of a 5 mm horn and their respective
reference samples without weld spot
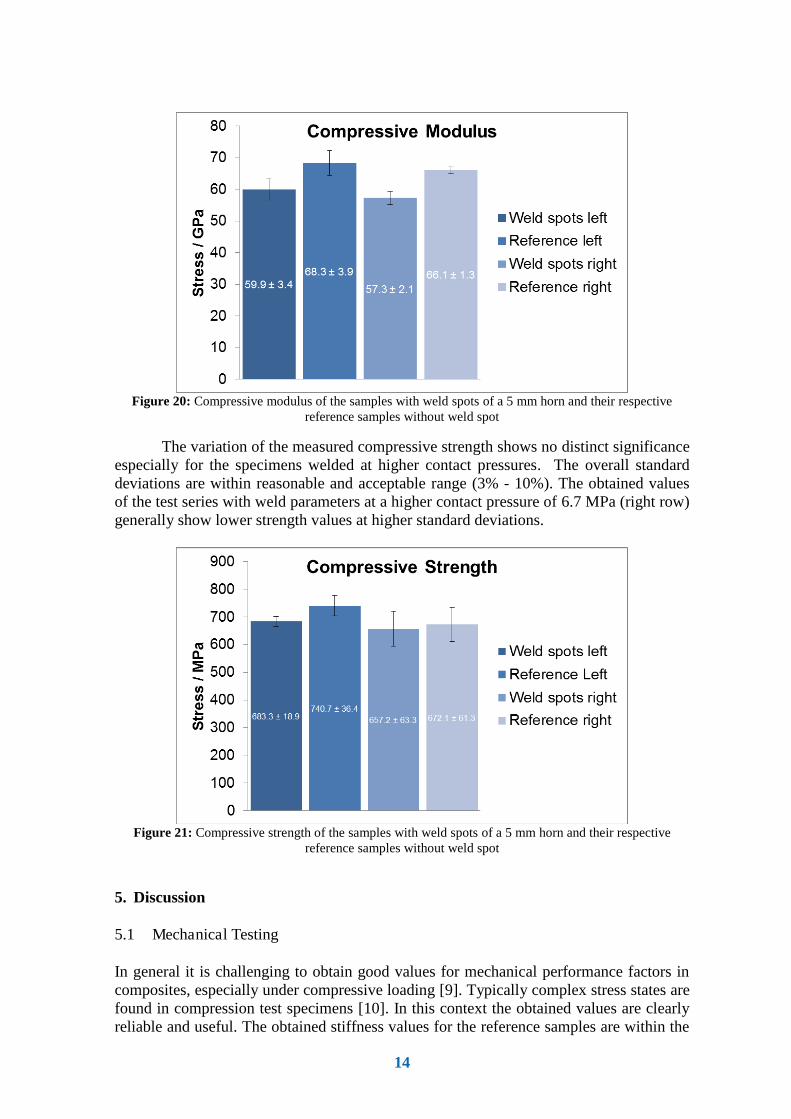
The variation of the measured compressive strength shows no distinct significance especially for the specimens welded at higher contact pressures. The overall standard deviations are within reasonable and acceptable range (3% - 10%). The obtained values of the test series with weld parameters at a higher contact pressure of 6.7 MPa (right row) generally show lower strength values at higher standard deviations.
Figure 21: Compressive strength of the samples with weld spots of a 5 mm horn and their respective
reference samples without weld spot
5. Discussion
5.1 Mechanical Testing
In general it is challenging to obtain good values for mechanical performance factors in composites, especially under compressive loading [9]. Typically complex stress states are found in compression test specimens [10]. In this context the obtained values are clearly reliable and useful. The obtained stiffness values for the reference samples are within the

15
expectable limits and significantly higher than those with weld spots. Carpet plots allow a quick estimate of the expectable elastic constants of
0°/±45°/90°-laminates (see [16]). For the undamaged cross ply specimen this yields a maximum compressive modulus of 67.5 GPa. The mechanical values under compressive loading are based on the materials data sheet.
0 10 20 30 40 50 60 70 80 90 100
0,0
20,0k
40,0k
60,0k
80,0k
100,0k
120,0k
Percentage of 0°
90%
80%
70%
60%
50%
40%
30%
20%
0%
Co
mpre
ssiv
e M
odu
lus / M
Pa
+/-45° / %
10%
Figure 22: Carpet Plot of the compressive modulus of TC 1200 laminate stacks
Ultrasonic welding with a 5 mm horn with established weld parameters (see Table 1) leads to noticeable imprints on the consolidated sample and to significantly lower mechanical stiffness under compressive loading.
5.2 Non-destructive Evaluation
The results obtained by NDT are more diverse than the mechanical results. OLT allows the detection of defects caused by ultrasonic welding within the depth
of carbon fibre reinforced thermoplastic composite specimen. The acquired thermograms showed variations in phase angle across the sample at each excitation frequency. These differences suggest a certain inhomogeneity in the micro-structure of the specimen plate as the thermal wave propagation is obviously non-uniform. CT also shows an inhomogeneous and irregular inner of the sample marked as dark grey areas within the light grey background. Typically a composite sample without flaws would appear homogenously (light grey). The source of the inhomogeneity is not yet conclusively established.
The detectability of the weld spot with OLT is largely not uniform even though the respective weld parameters should allow a comparison. As the CT-scans show the imprints of the weld spots of the respective welding sets are not quite similar. The random appearance of the weld spots on the thermograms and CT-scans could possibly arise from varying weld energies transmitted by the ultrasonic generator and its auto-tune function.

16
6. Conclusion and Outlook
Ultrasonic welding is typically considered a gentle material processing technique used to locally weld carbon fiber reinforced thermoplastic laminate stacks in automated composite preforming. The impact of ultrasonic welding on the mechanical properties was investigated by compression testing according to ASTM D 6641. The mechanical values showed a significant decrease due to the imprints and disruption of the fiber architecture caused by the ultrasonic welding with a rather small horn (diameter of 5 mm). Most recent findings suggest that ultrasonic welding with a comparably larger horn (diameter of 12 mm) and hence lower contact pressure leads to no significant reduction in mechanical performance.
It was found, that active thermography is a defect sensitive NDT-method able to identify and locate defects arising from ultrasonic welding. For a deeper analysis of the measurements we intend to apply image processing techniques as discussed by Lopez et al. [17].
Since the appearance of equally produced samples in thermography was hardly comparable we are currently screening our production process considering variabilities (compare Appendix). Water coupled ultrasound inspection performed at the Institute of Structures and Design in Stuttgart hint at volume porosity within the samples due to a widespread attenuation of the amplitude so that the sample is best described as sub-standard. However, the inhomogeneity seems to have limited detrimental effect since the mechanical performance of the undamaged reference samples fulfils the expectation.
In future studies we plan to record and monitor the weld parameters in a robotic
test bench with fully automated analysis capabilities. To exclude raw material issues and to probe the overall suitability of the material
concerning vacuum consolidation we will produce comparable test samples with prepregs from other manufacturers.
Should the inhomogeneity prove true to be volume porosity we may also assess the porosity by thermography as discussed by Mayr et al. [18]. The porosity content may be correlated to computed tomography measurements.
The systematic inspection of the process chain to detect and diminish production-
induced defects with methods of non-destructive testing has already proven to be helpful in establishing a robust process.
Acknoledgements
Acknowledgements are gratefully attributed to Raouf Jemmali who performed the computed thermography measurements at the Institute of Structures and Design of the German Aerospace Center (DLR) in Stuttgart. We would also like to express our gratitude to Arthur-Hans Thellmann who kindly probed the specimen via water-coupled ultrasonic testing.

17
References
[1] J. Dorsch, M. Kühnel, and F. Fischer, “Experimentelle Ermittlung der Prozessparameter zum automatisierten Ultraschall-Heften von Carbonfaserverstärkten Thermoplast-Lagen,” Deutsches Zentrum für Luft- und Raumfahrt (DLR), 435-2013/32, Sep. 2013.
[2] A. Benatar, “Ultrasonic Welding of Advanced Thermoplastic Composites,” Department of Mechanical Engineering, Massachusetts Institute of Technology, Cambridge, 1987.
[3] A. Benatar and T. G. Gutowski, “Methods for fusion bonding thermoplastic composites,” in Composites, 1986, vol. 18, no. 1, pp. 35–42.
[4] A. Benatar and T. G. Gutowski, “Ultrasonic welding of PEEK graphite APC-2 composites,” Polymer Engineering and Science, vol. 29, no. 23, pp. 1705–1721, 1989.
[5] A. Offringa, “New thermoplastic composite design concepts and their automated manufacture,” JEC Composites Magazine, no. 58, pp. 45–49, Jun. 2010.
[6] C. Ageorges and L. Ye, Fusion Bonding of Polymer Composites: from basic mechanisms to process optimisation, 1st ed. Springer-Verlag London, 2002.
[7] S. S. Volkov and Y. V. Kholopov, “Technology and equipment for ultrasonic welding of polymer based composite structures,” Russian Ultrasonics, vol. 28, pp. 145–155, 1998.
[8] S. S. Volkov and Y. V. Kholopov, “Technology and equipment for ultrasound welding structures made of polymer-based composite materials,” Welding International, vol. 12, no. 5, pp. 400–403, 1998.
[9] K. Potter, “Manufacturing defects as a cause of failure in polymer matrix composites,” in Failure Mechanisms in Polymer Matrix Composites, P. Robinson, E. Greenhalgh, and S. Pinho, Eds. Woodhead Publishing, 2012, pp. 26–52.
[10] C. R. Schultheisz and A. M. Waas, “Compressive failure of composites, part I: Testing and micromechanical theories,” Progress in Aerospace Sciences, vol. 32, no. 1, pp. 1–42, 1996.
[11] A. M. Waas and C. R. Schultheisz, “Compressive failure of composites, part II: Experimental studies,” Progress in Aerospace Sciences, vol. 32, no. 1, pp. 43–78, 1996.
[12] D. Liu, N. A. Fleck, and M. P. F. Sutcliffe, “Compressive strength of fibre composites with random fibre waviness,” Journal of the Mechanics and Physics of Solids, vol. 52, no. 7, pp. 1481–1505, 2004.
[13] TenCate, “Technical Data TenCate Cetex TC1200 PEEK Resin System, 2014.” Jul-2015.
[14] T. Stefani, “Untersuchung und Auslegung eines Plattenwerkzeugs zur Herstellung von CFK-Organoblechen mittels Vakuumkonsolidierung,” Deutsches Zentrum für Luft- und Raumfahrt (DLR), 435-2015/26, Mar. 2015.
[15] T. Ullmann, Y. Shi, and R. Aoki, “Capabilities of Lock-in Thermography for Non-destructive Inspection of Fibre,” in 11th International Conference on Quantitative InfraRed Thermography, 2012, no. QIRT-2012–384.
[16] Kröber, “Elastizitätskonstanten und Festigkeiten von 0/±45°/90° - Laminaten,” in Luftfahrttechnisches Handbuch - Faserverbund-Leichtbau, 1980.
[17] F. Lopez, X. Maldague, and C. Ibarra-Castanedo, “Enhanced image processing for infrared non-destructive testing,” in Opto-Electronics Review, vol. 22, no. 4, 2014, pp. 245–251.

18
[18] G. Mayr, B. Plank, J. Sekelja, and G. Hendorfer, “Active thermography as a quantitative method for non-destructive evaluation of porous carbon fiber reinforced polymers,” {NDT} & E International, vol. 44, no. 7, pp. 537–543, 2011.

19
Appendix
Sources of variabilities in materials [9] that may be of importance for this work: mass/unit area reinforcement – global and local degree of consolidation in as-purchased reinforcement consolidation response to applied pressure trapped air in prepreg surface porosity prepreg surface smoothness prepreg level of tack in prepreg quality of fibre alignment – global and local resin content resin viscosity and temperature/cure effects on viscosity variability of resin composition variability in cure kinetics degree of cure in resin […] Sources of variability in moulding processes [9] that may be of importance for this work: Order of lay-up Operator and supervision skills Lay-up aids and tools provided Mould release issues type of bagging materials (e.g. tacky-tape) bagging methodologies used vacuum level in bag cure cycle variations in temperature and pressure temperature variations across part resin flows interactions between tooling and reinforcement due to differences in
coefficient of thermal expansion (CTE) […]