Embed Size (px)
Citation preview
University of Nebraska - Lincoln University of Nebraska - Lincoln
DigitalCommons@University of Nebraska - Lincoln DigitalCommons@University of Nebraska - Lincoln
Dissertations, Theses, & Student Research in Food Science and Technology Food Science and Technology Department
12-2012
Characterization of Starch by Vibrational Spectroscopy Characterization of Starch by Vibrational Spectroscopy
Brandon H. Holder University of Nebraska–Lincoln, [email protected]
Follow this and additional works at: https://digitalcommons.unl.edu/foodscidiss
Part of the Food Science Commons
Holder, Brandon H., "Characterization of Starch by Vibrational Spectroscopy" (2012). Dissertations, Theses, & Student Research in Food Science and Technology. 27. https://digitalcommons.unl.edu/foodscidiss/27
This Article is brought to you for free and open access by the Food Science and Technology Department at DigitalCommons@University of Nebraska - Lincoln. It has been accepted for inclusion in Dissertations, Theses, & Student Research in Food Science and Technology by an authorized administrator of DigitalCommons@University of Nebraska - Lincoln.
CHARACTERIZATION OF STARCH
BY VIBRATIONAL SPECTROSCOPY
by
Brandon H. Holder
A THESIS
Presented to the Faculty of
The Graduate College at the University of Nebraska
In Partial Fulfillment of Requirements
For the Degree of Master of Science
Major: Food Science & Technology
Under the Supervision of Professor Randy L. Wehling
Lincoln, Nebraska
December, 2012
CHARACTERIZATION OF STARCH BY VIBRATIONAL SPECTROSCOPY
Brandon Holder, M.S.
University of Nebraska, 2012
Advisor: Randy Wehling
To develop a dispersive Raman spectroscopic method for measuring amylose-
amylopectin ratios of corn starch mixtures, 67 mixtures were prepared by randomly
mixing waxy and normal corn starches. Amylose contents were measured using a dual
wavelength iodine binding colorimetric method. Raman data were collected from 250 to
3200 cm-1
using optimized instrument parameters. Partial least-squares (PLS) and
principal components regression (PCR) were used to prepare multivariate calibration
models; however, PLS commonly outperformed PCR. Truncating the spectra to 250 to
2000 cm-1
improved the results (r2 of validation = 0.831, SEP = 2.90%). Removal of a
cold water swelling starch from the data also offered a slight improvement in results (r2
of validation = 0.860, SEP = 2.70%). Dispersive Raman spectroscopy may not be well
suited for quantifying amylose content of starch mixtures; however, the method was
easily capable of discriminating between waxy and normal starches. This may allow the
method to be used for confirming the identity of starch shipments.
A dispersive Raman spectroscopic method for measuring retrogradation in corn
starch gels was investigated. Thirty-six gels were prepared, stored at 4° C and measured
at regular time intervals (0 h, 24 h, 48 h, 72 h, 120 h, 168 h after preparation). After each
measurement, the gels were freeze-dried, then each resultant dried gel was ground into a
powder and measured using X-ray diffraction. Relative crystallinity was determined, and
intensity changes in the Raman band at 480 cm-1
were measured. No correlation was
ii
found between changes in the 480 cm-1
band and the relative crystallinity of the gels (r2 <
.1). The low starch concentration used may have caused the poor Raman signal strength
and the unpredictable changes in the X-ray diffraction data. The experiment found that
measuring retrogradation in very dilute starch gels could be problematic, and that more
development is needed in order to apply Raman spectroscopy to in a food system like
white pan bread.
iii
DEDICATION I would like to dedicate this thesis to my wife, Erin, and my mother, Mary, who
have been enormous pillars of support throughout my graduate school experience. I
would also like to extend this dedication to my grandmother and grandfather, Mary and
Tyrone, who taught me the unwavering value of education.

iv
ACKNOWLEDGEMENT I would like to thank Dr. Randy Wehling for offering me the tremendous
opportunity of coming to University of Nebraska and studying under him. In addition, I
would like to thank him for all of his advice and support with regard to the experiments
and problems that arose during the study. Also, I would like to thank my committee
members, Dr. Jeyamkondan Subbiah and Dr. Susan Cuppett, who offered guidance and
advice as well over the course of the studies.
I would like to thank Dr. Devin Rose and Mr. Steve Weir of UNL’s Food
Processing Center, who provided starch samples for use in all of the experiments. I would
also like to further thank Dr. Devin Rose and Dr. Wajira Ratnayake for allowing me the
use of their equipment.
I would like to recognize the contributions of Dr. Wajira Ratnayake for his advice
and guidance in how best to approach the starch retrogradation experiment and for his
assistance in troubleshooting procedural problems with the iodine binding reference
method. I would also like to extend thanks to Dr. Shah Valloppilly from the Physics &
Astronomy Department at UNL for his assistance and training in collecting the X-ray
diffraction data for the starch retrogradation experiment.
Finally, I would like to extend my appreciation to my friends – Sely Prajitna,
Nyambe Mkandawire, Michelle Hoffman, Tara Stiles, Malcond Valladares and several
others – who have been enormously helpful with their advice and care through my time at
UNL.
v
TABLE OF CONTENTS
ABSTRACT ......................................................................................................................... i
DEDICATION ................................................................................................................... iii
ACKNOWLEDGEMENT ................................................................................................. iv
LIST OF TABLES ............................................................................................................ vii
LIST OF FIGURES ......................................................................................................... viii
INTRODUCTION .............................................................................................................. 1
CHAPTER I: Literature Review
Starch, Its Functional Properties and Quality Parameters .................................................. 5
Methods for Measuring Amylose-Amylopectin Ratios ...................................................... 9
Overview of Vibrational and Raman Spectroscopy .......................................................... 12
Raman Spectrum of Starch and Band Assignments ......................................................... 14
Use of Raman Spectroscopy to Measure Amylose-Amylopectin Ratios ......................... 17
Methods for Measuring Retrogradation in Starch ............................................................ 19
Use of Raman Spectroscopy to Measure Retrogradation ................................................. 23
References ......................................................................................................................... 27
CHAPTER II: Development of a Raman spectroscopic method for measuring
amylose-amylopectin ratios of corn starch
Abstract ............................................................................................................................. 34
Introduction ....................................................................................................................... 35
Materials & Methods ........................................................................................................ 37
Corn starch mixture preparation .................................................................................... 37
Sample preparation for Raman spectroscopy ................................................................ 38
Raman spectroscopy ...................................................................................................... 38
Spectral collection optimization .................................................................................... 39
Reference analysis ......................................................................................................... 40
Data preprocessing and chemometrics .......................................................................... 41
Results & Discussion ........................................................................................................ 43
vi
Conclusions ....................................................................................................................... 53
References ......................................................................................................................... 55
CHAPTER III: Development of a Raman spectroscopic method for measuring
retrogradation in corn starch gels
Abstract ............................................................................................................................. 58
Introduction ....................................................................................................................... 59
Materials and Methods ...................................................................................................... 62
Sample preparation ........................................................................................................ 62
Preparation of amorphous phase standards ................................................................... 63
Raman spectroscopy ...................................................................................................... 64
Sample preparation for X-ray diffraction ...................................................................... 65
X-ray diffraction ............................................................................................................ 65
Spectral preprocessing and data analysis ...................................................................... 67
Results and Discussion ..................................................................................................... 67
Conclusions ....................................................................................................................... 77
References ......................................................................................................................... 78
SUMMARY ...................................................................................................................... 80
APPENDIX ....................................................................................................................... 82
vii
LIST OF TABLES CHAPTER I
Table 1.1. Examples of starch uses in various food industry products…………………....7
Table 1.2. Raman bands seen in starch and their vibrational mode assignments as
reported in the literature………………………………………………………….16
CHAPTER II
Table 2.1. Summary statistics of the calibration and validation datasets including all 67
samples that met precision standards………………………………………….....46
Table 2.2. Calibration model results of the calibration set detailed in Table 2.1………..47
Table 2.3. Validation results of the PLS calibration models from Table 2.2…..……......48
Table 2.4. Summary statistics of the calibration and validation datasets excluding the cold
water swelling starch, NOVATION 4600…………………………………….....52
Table 2.5. Calibration model results of the validation set detailed in Table 2.4………...53
Table 2.6. Best validation results for calibration models detailed in Table 2.5…...….….53
APPENDIX
Table A.1. Mixing protocol for preparation of corn starch mixtures…………………….82
Table A.2. Summary of blend codes used for preparation of normal and waxy corn starch
mixtures…………………………………………………………………………..84
Table A.3. Classifications and suggested analytical applications of a model based on the
ratio of the standard error of prediction to the standard deviation of the validation
data……………………………………………………………………………….84
viii
LIST OF FIGURES CHAPTER I
Figure 1.1. General structure of amylose………………………………………………….5
Figure 1.2. General structure of amylopectin……………………………………………..6
Figure 1.3. Example FT-Raman spectra of corn starch (A) and cassava starch (B)
collected using 1064 nm excitation………………………………………………15
CHAPTER II
Figure 2.1. Example of the typical Raman spectrum of Argo normal corn starch collected
using 785 nm (near-infrared) excitation…………………………………………44
Figure 2.2. Plot of the instrument-predicted amylose content (2000 to 250 cm-1
) vs. the
reference amylose content determined by iodine binding colorimetry…………..49
Figure 2.3. Plot of the instrument-predicted amylose content (1500 to 250 cm-1
) vs. the
reference amylose content determined by iodine binding colorimetry…………..49
CHAPTER III
Figure 3.1. Raman spectrum between 3200 and 250 cm-1
of gelatinized Argo corn starch
cooled for 45 min (t = 0 h) after cooking for 90 min………………………….....70
Figure 3.2. Plot comparing relative crystallinity with storage time in hours for one gel
series prepared from Argo corn starch…………………………………………...72
Figure 3.3. Plot comparing estimated relative crystallinity with storage time in hours for
one gel series prepared from Argo corn starch………………………………......72
Figure 3.4. Diffractogram comparison of data from one gel series to the amorphous
standard sample that was prepared…………………………………………........73
Figure 3.5. Comparison of Raman spectral data from a gel series prepared from Argo
corn starch………………………………………………………………………..76
1
INTRODUCTION Starch plays a crucial role in the food industry as a food ingredient. For example,
more than 250 million bushels of corn were used in starch production in 2010, and an
estimated 20 billion pounds of bread are produced yearly, a product in which wheat
starch is a principal constituent (Zobel and Kulp 1996; USDA Economic Research
Service 2010). In spite of the considerable market share that starches represent, quality
measures for key attributes of starch and starch-containing products are often inefficient,
imprecise and costly for food manufacturers. Vibrational spectroscopic techniques like
Raman spectroscopy could offer an alternative to traditional quality measurements.
Amylose-amylopectin ratios of starches, a key quality consideration, appear to
play a role in determining expansion properties of extruded products, can impact multiple
quality characteristics of baked breads, and greatly influence important functional
properties of starch like the ability to form pastes or gels (Chinnaswamy and Hanna 1988;
Jane et al 1999; Johnson et al 1999; Lee et al 2001). Traditionally, amylose is quantified
by wet chemical techniques like colorimetric determination using iodine. However,
many of these early wet chemical techniques suffered from potential inaccuracies
inherent to the methodology (Wang et al 1998; Zhu et al 2008). Additionally, both older
and newer wet chemical techniques are often uneconomical, while some may require
well-trained technicians to yield reproducible results (Zhu et al 2008). Bearing in mind
these considerations, manufacturers have some incentive to explore other routes to obtain
the same information. And yet, despite fairly extensive research examining related
techniques like near-infrared reflectance spectroscopy, using Raman spectroscopy for this
2
purpose has never been particularly well researched. With increased emphasis by food
manufacturers on both rapid and non-destructive quality testing, Raman spectroscopic
determination of amylose-amylopectin ratios could present a valuable tool for starch
producers, as the method would meet both criteria. Raman spectroscopy may also be
helpful in overcoming another difficult challenge in quality testing: predicting quality
changes related to retrogradation in starch-containing products.
Retrogradation is a primary cause of quality deterioration in starch-based food
products and is generally implicated as the principal mechanism involved in staling of
cereal products. Starch retrogradation is the process by which gelatinized starch, when
cooled and aged, regains a degree of crystalline order by the re-association of starch’s
component polymers, first amylose and eventually amylopectin (Zobel and Kulp 1996).
Resulting effects of this process are both an increase in firmness and a loss of moisture,
quality changes that are in part associated with the return of about 600 million pounds of
bread each year (Zobel and Kulp 1996). Although numerous techniques are available for
monitoring starch retrogradation, few methods are available which offer the portability
and rapid, non-destructive analysis of which Raman spectroscopy is capable (Viereck et
al 2009). With an increased industry emphasis on such technologies, Raman
spectroscopy may offer a practical approach to tackling the issue of monitoring
retrogradation in starch-containing products. Furthermore, little research is available on
using Raman spectroscopy to monitor starch retrogradation in gels, and few or no studies
have been published on using Raman spectroscopy to monitor retrogradation in a model
food product like white pan bread.
3
This research investigates the feasibility of alternative methods for monitoring
important quality characteristics of starches and starch-containing products, an area of the
food industry that is hugely important but lacks efficient and cost-effective quality
measures. Furthermore, Raman spectroscopic techniques for monitoring these quality
attributes offer a greener alternative to wet chemical methods, more portability in setting
up quality testing with the possibility for on-line analysis applications, and potentially
lower operating expense associated with purchasing and handling of costly chemical
reagents for use in wet chemical testing.
The objective of this research was to develop and, when applicable, validate two
analytical methods that use Raman spectroscopy to monitor quality traits of cereal
starches and starch-containing products. The two major project-specific objectives of this
research were:
To develop, optimize, validate and evaluate the efficacy of an inexpensive Raman
spectroscopic method for quantifying amylose-amylopectin ratios in corn starch.
To develop and assess the usefulness of an inexpensive Raman spectroscopic
method for continuous measurement of retrogradation in corn starch gels.

4
Chapter I: LITERATURE REVIEW
5
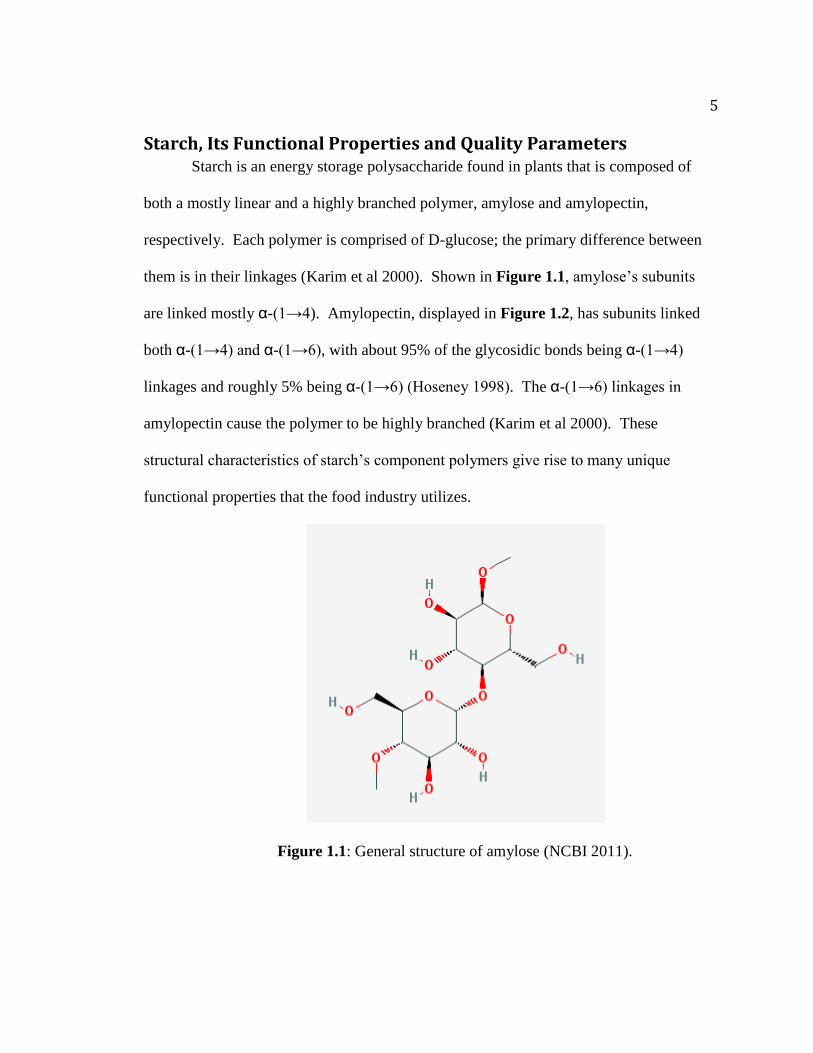
Starch, Its Functional Properties and Quality Parameters Starch is an energy storage polysaccharide found in plants that is composed of
both a mostly linear and a highly branched polymer, amylose and amylopectin,
respectively. Each polymer is comprised of D-glucose; the primary difference between
them is in their linkages (Karim et al 2000). Shown in Figure 1.1, amylose’s subunits
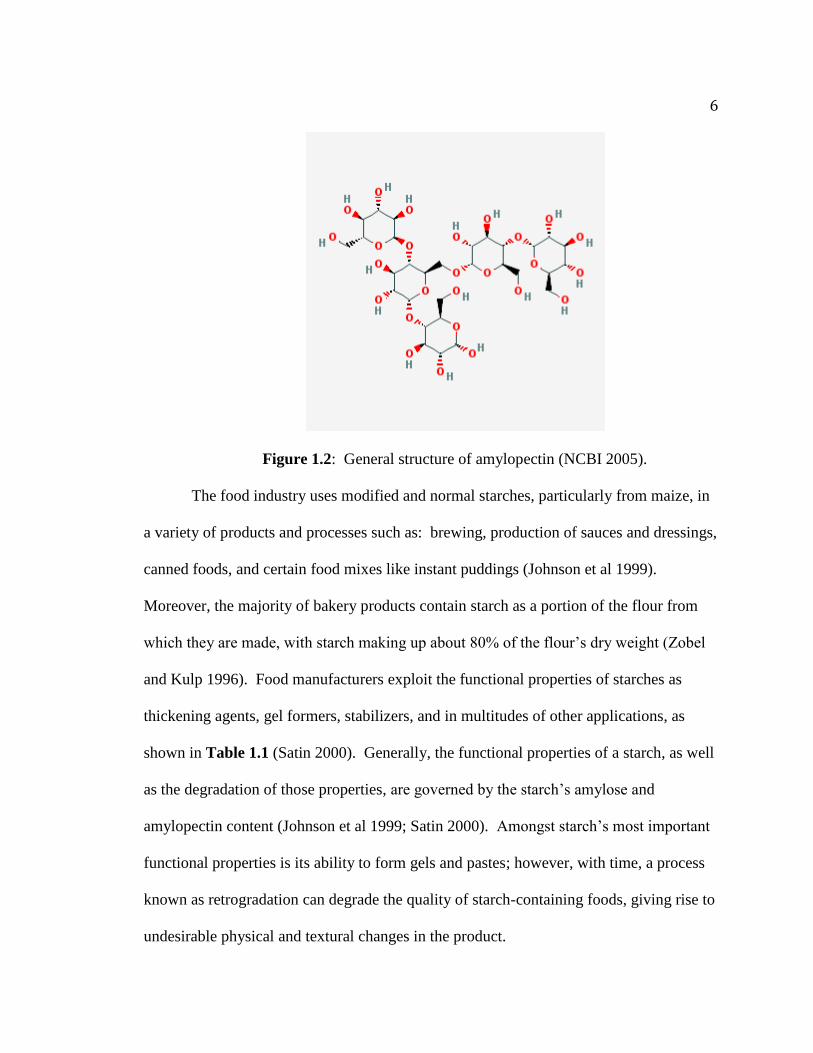
are linked mostly ɑ-(1→4). Amylopectin, displayed in Figure 1.2, has subunits linked
both ɑ-(1→4) and ɑ-(1→6), with about 95% of the glycosidic bonds being ɑ-(1→4)
linkages and roughly 5% being ɑ-(1→6) (Hoseney 1998). The ɑ-(1→6) linkages in
amylopectin cause the polymer to be highly branched (Karim et al 2000). These
structural characteristics of starch’s component polymers give rise to many unique
functional properties that the food industry utilizes.
Figure 1.1: General structure of amylose (NCBI 2011).
6
Figure 1.2: General structure of amylopectin (NCBI 2005).
The food industry uses modified and normal starches, particularly from maize, in
a variety of products and processes such as: brewing, production of sauces and dressings,
canned foods, and certain food mixes like instant puddings (Johnson et al 1999).
Moreover, the majority of bakery products contain starch as a portion of the flour from
which they are made, with starch making up about 80% of the flour’s dry weight (Zobel
and Kulp 1996). Food manufacturers exploit the functional properties of starches as
thickening agents, gel formers, stabilizers, and in multitudes of other applications, as
shown in Table 1.1 (Satin 2000). Generally, the functional properties of a starch, as well
as the degradation of those properties, are governed by the starch’s amylose and
amylopectin content (Johnson et al 1999; Satin 2000). Amongst starch’s most important
functional properties is its ability to form gels and pastes; however, with time, a process
known as retrogradation can degrade the quality of starch-containing foods, giving rise to
undesirable physical and textural changes in the product.

7
Product or process Examples
Canning body or texture agent for soups, sauces, puddings
and gravies
aseptically canned products
beverages such as coffee, teas or chocolate
Cereals and snacks hot extruded snacks
chips, pretzels, etc.
extruded and fried foods
ready-to-eat cereals
Bakery pies, tarts
fillings, glazes
custards and icings
cakes, donuts, danish
icing sugar
Batters and breadings coated fried foods
frozen battered vegetables, fish and meat
dry mix coatings
Dressings, soups and sauces mayonnaise-type
pourable salad dressings (high shear)
spoonable dressings
instant dry salad dressing mixes
low-fat dressing
canned gravies and sauces
frozen gravies and sauces
soups and chowders
Cooked meat binder water binder for formed meat
smoked meats, low-fat meats
pet foods (dried and canned)
Frozen foods fruit fillings
meat pies
Oriental foods
soups, sauces
entrees
cream-based products
Flavours and beverage clouds vitamins, spices, clouding agents
spray dried flavours for dry beverage
mixes, bartender mixes
beverage emulsions
liquid and powdered non-dairy creamers
Confectionery dusting powder
licorice
jelly gums
hard gums
panned candies
confectioners sugar
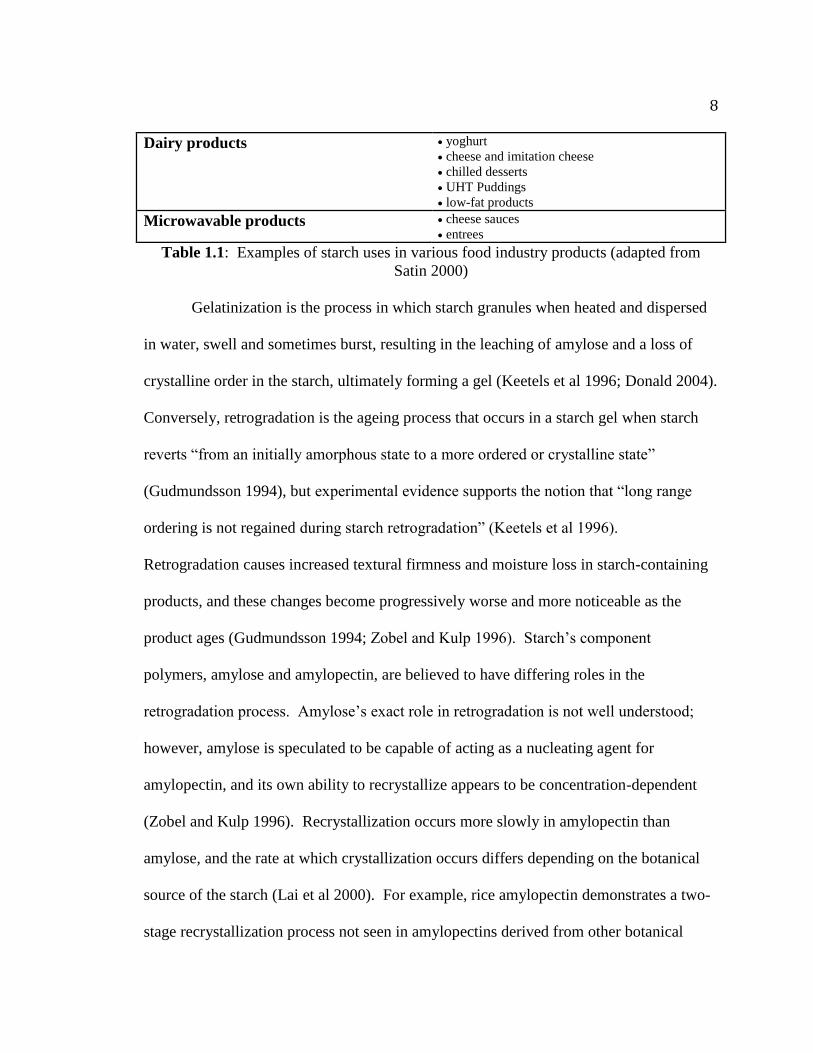
8
Dairy products yoghurt
cheese and imitation cheese
chilled desserts
UHT Puddings
low-fat products
Microwavable products cheese sauces
entrees
Table 1.1: Examples of starch uses in various food industry products (adapted from
Satin 2000)
Gelatinization is the process in which starch granules when heated and dispersed
in water, swell and sometimes burst, resulting in the leaching of amylose and a loss of
crystalline order in the starch, ultimately forming a gel (Keetels et al 1996; Donald 2004).
Conversely, retrogradation is the ageing process that occurs in a starch gel when starch
reverts “from an initially amorphous state to a more ordered or crystalline state”
(Gudmundsson 1994), but experimental evidence supports the notion that “long range
ordering is not regained during starch retrogradation” (Keetels et al 1996).
Retrogradation causes increased textural firmness and moisture loss in starch-containing
products, and these changes become progressively worse and more noticeable as the
product ages (Gudmundsson 1994; Zobel and Kulp 1996). Starch’s component
polymers, amylose and amylopectin, are believed to have differing roles in the
retrogradation process. Amylose’s exact role in retrogradation is not well understood;
however, amylose is speculated to be capable of acting as a nucleating agent for
amylopectin, and its own ability to recrystallize appears to be concentration-dependent
(Zobel and Kulp 1996). Recrystallization occurs more slowly in amylopectin than
amylose, and the rate at which crystallization occurs differs depending on the botanical
source of the starch (Lai et al 2000). For example, rice amylopectin demonstrates a two-
stage recrystallization process not seen in amylopectins derived from other botanical
9
sources, and the rate of retrogradation can differ between cultivars of the same cereal (Lai
et al 2000). Although chemically-modified starches address some of these issues, the
textural and sensory changes caused by retrogradation represent a considerable quality
concern for the food industry where normal or unprocessed starches are utilized,
particularly in the baked goods sector.
Methods for Measuring Amylose-Amylopectin Ratios Numerous procedures are available for quantifying amylose content in starch and
cereal grains, wherein the most commonly used methods involve measuring the
complexation of iodine with amylose. In general, methods for measuring amylose
content can be broken down into two categories: techniques that approximate apparent
amylose content and methods that measure absolute amylose content (Johnson et al
1999). The term “apparent” amylose is often used to describe the measurements made
using less sophisticated techniques such as iodine binding procedures, because many of
these methods are regarded as somewhat inaccurate for various reasons (Johnson et al
1999). Furthermore, methods measuring “apparent” amylose content are regarded as less
accurate than many newer methods (Johnson et al 1999). Many variations and
enhancements of McCready and Hassid’s (1943) original iodine binding technique have
been developed. However, these modifications have resulted in great difficulty in
attaining widespread acceptance of a standard method for measuring amylose. A recent
study provided 17 samples of rice flour to each of 27 different labs located around the
world, and tasked the researchers with determining the amylose content of the samples
(Fitzgerald et al 2009). Five different variations of the colorimetric iodine binding
10
procedure were utilized, resulting in low reproducibility between the various labs
(Fitzgerald et al 2009). The lack of a broadly adopted standard method for measuring
amylose has encouraged research efforts to explore alternatives to the traditional iodine
binding technique.
Iodine binding techniques are rooted in the fact that amylose generally has a
stronger affinity for complexation with iodine than amylopectin, giving rise to different
colorations in solution (Wang et al 1998). As such, colorimetry is a simple way for
measuring the binding action of iodine with amylose; however, because iodine binding to
starch’s components is chain-length dependent, amylopectin can sometimes also complex
with iodine, introducing inaccuracy into the method (Wang et al 1998; Bertoft 2004; Zhu
et al 2008). Techniques utilizing amperometry and potentiometry have also been
developed, but these analyses take longer to complete (Bates et al 1943; Larson et al
1953; Zhu et al 2008). All of the aforementioned methods involve the generation of a
standard curve based on measurements of pure amylose (Zhu et al 2008). Megazyme
International’s amylose/amylopectin assay kit eliminates some of the inaccuracy
associated with iodine binding techniques by specific precipitation of amylopectin via
complexation with concanavalin A (Megazyme International Ireland 2011). This kit has
seen increased use for a number of reasons: Megazyme International Ireland states that
the method “is applicable to all pure starch samples and to cereal flours,” analyses can be
carried out without the need to generate a standard curve, and the method can be used for
simultaneous determination of total starch content (Zhu et al 2008; Megazyme
International Ireland 2011). But, due to the complexity and length of this approach, some
11
training may be required to obtain reproducible results (Zhu et al 2008). A
thermogravimetric method (Stawski 2008) for determining amylose content has been
developed, which also requires generation of a standard curve using pure amylose. This
procedure was demonstrated to have comparable accuracy to other commonly used
methods for potato and rice starches, but was incapable of reproducibly measuring
amylose content of wheat starch (Stawski 2008). High performance size-exclusion
chromatography has been demonstrated as being an effective tool for measuring amylose
content (Grant et al 2002; Chen and Bergman 2007). Still, while these chromatographic
methods offer high precision, they have relatively low throughput compared to the
previously described methods (Grant et al 2002). Zhu et al (2008) conducted an
extensive study comparing several of the methods already mentioned for quantifying
amylose content in addition to developing a new dual-wavelength iodine binding
procedure. By adding a measurement at a second wavelength to the typical colorimetric
iodine binding procedure, the new method was demonstrated to have greater precision
and accuracy than a single wavelength method (Zhu et al 2008). Zhu et al (2008) noted
that this method still suffers from the drawbacks of a majority of other amylose
determination methods: analysis times are fairly long, and the procedure lacks simplicity.
Other multi-wavelength iodine binding colorimetric methods exist, like Wang’s triple-
wavelength method and Jarvis and Walker’s sextuple-wavelength method, which are
capable of providing additional information such as total starch content; however, the
data analysis and procedures become more complex with the addition of more
measurement wavelengths (Jarvis and Walker 1993; Wang et al 2010). However, Raman
12
spectroscopy combined with multivariate regression techniques may be able to overcome
some of the shortfalls of other amylose determination methods.
Overview of Vibrational and Raman Spectroscopy Vibrational spectroscopy involves the use of an assortment of instruments that
impinge light on a material that then absorbs and scatters the light, in hopes of studying
the vibrational and rotational actions of the substance’s molecules (Kizil and Irudayaraj
2008). Raman spectroscopy, a type of vibrational spectroscopy, focuses on the detection
of inelastically scattered light by Raman-active compounds. Complementary in nature to
infrared spectroscopy, Raman spectroscopy can be used to observe vibrational modes that
are typically of weak intensity in the IR spectrum; meanwhile, Raman spectroscopy has a
weak signal for some vibrational modes that are more easily observable using IR
spectroscopy. In particular, Raman spectroscopy has been demonstrated to be effective
in the characterization of compounds with the following chemical characteristics: a ring
structure, nonpolar character, and double or triple bonds (Kizil and Irudayaraj 2008).
Extensive research efforts have been devoted to studying the industrial value and
implementation of infrared and Raman spectroscopies as tools for food analysis. While
infrared spectroscopy has been effectively adapted to industry use, Raman spectroscopy
has never seen widespread use. Until the introduction of near-infrared excitation in the
mid-1980s, Raman spectroscopy was viewed as something of an exotic technique that
was unsuitable for food analysis, because food products are rarely free of impurities
(Keller et al 1993). As such, instruments that used visible light excitation would be prone
to introduce interference in Raman spectra in the form of fluorescence, limiting the
13
technique’s appeal (Keller et al 1993). As an analytical tool, Raman spectroscopy offers
the food industry several benefits over wet chemical techniques. The method is capable
of both rapid and nondestructive testing, requires little or no sample pretreatment, and
provides a tremendous amount of information about samples, which allows for the
development of full-spectrum calibrations (Kizil and Irudayaraj 2008; Viereck et al
2009). Additionally, the tool has a great deal of portability, and the device’s output could
be coupled with infrared spectroscopy for further analysis, due to the ability of the two
techniques to provide complementary information for the same sample (Viereck et al
2009). Due to the ubiquitous nature of water in food products, industry usage of mid-
infrared and near-infrared spectroscopy for quantitative analysis often necessitates the
employment of intricate chemometric procedures, because water absorbs strongly in the
wavelength region used by these instruments (Viereck et al 2009). However, water has
an inherently weak Raman signal, making the technique ideally suited for some areas of
the food industry (Viereck et al 2009). Notable disadvantages of Raman spectroscopy
include: considerable difficulty in producing a signal that is distinguishable from noise,
and difficulty in analyzing fluorescent materials due to interferences (Viereck et al 2009).
However, the advent of near-infrared laser excitation has nearly eliminated the worry of
fluorescence interference with the Raman effect (Keller et al 1993). Additionally, a
Raman spectroscopic method is only as accurate and precise as the wet chemical or
instrumental method from which the calibration is developed, and tasks like optimization
of the spectroscopic method and performance of regular instrument maintenance are
necessary to maintain the multivariate calibration (Scotter 2001). Some past research has

14
offered hope in implementing Raman spectroscopy as an analytical tool for quality
analysis of starches.
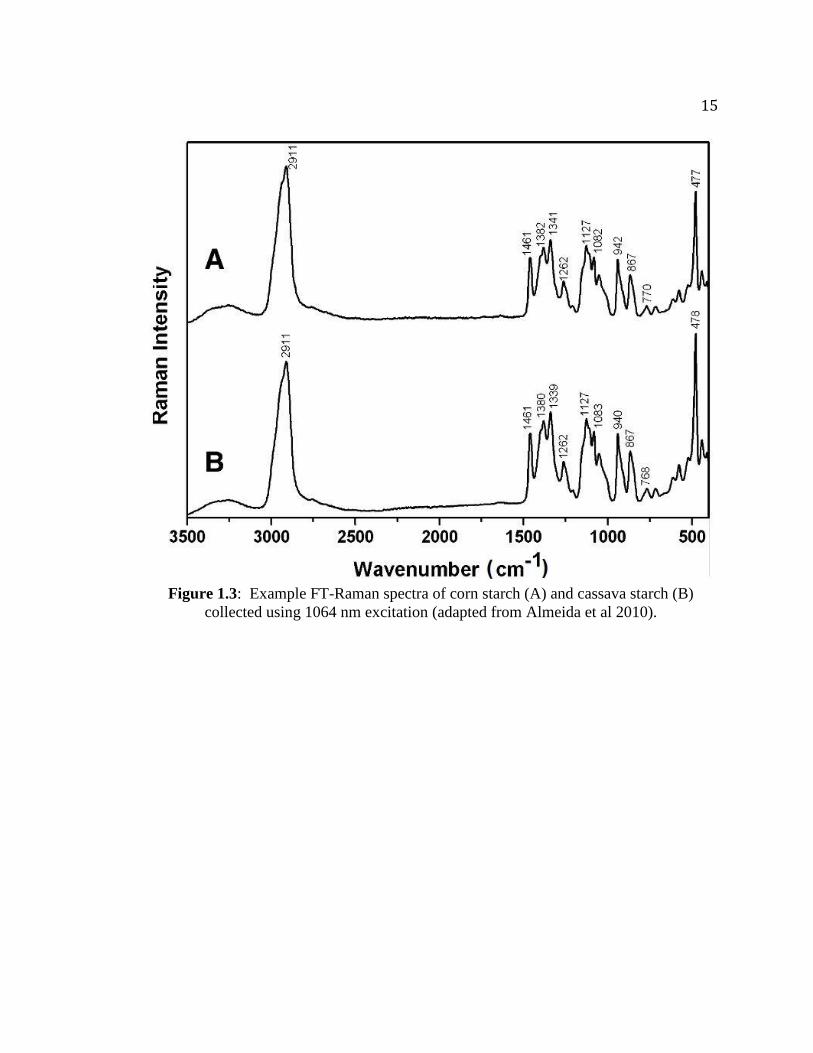
Raman Spectrum of Starch and Band Assignments Past research has shown that most starches have a feature-rich Raman spectrum.
Sample spectra of corn starch and cassava starch are shown in Figure 1.3 (Almeida et al
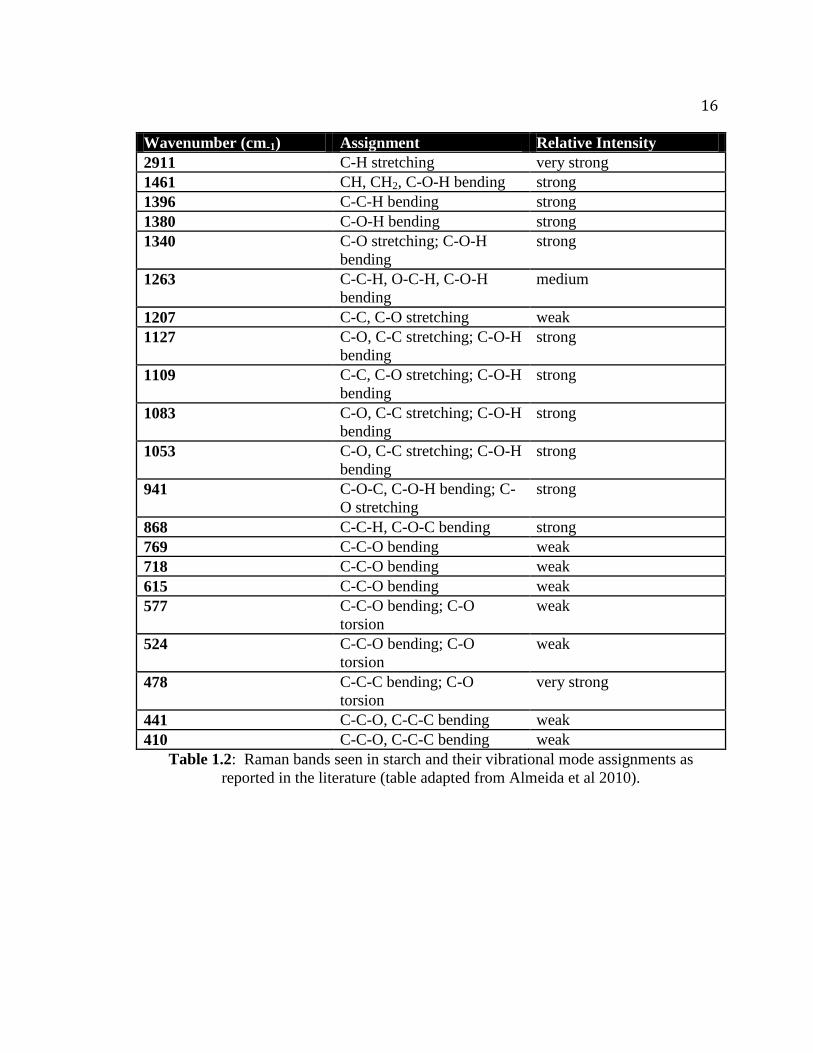
2010). Researchers have elucidated many of the vibrational modes responsible for the
Raman bands seen in starches. Table 1.2 summarizes many of the spectral features
shown in Figure 1.3 (Almeida et al 2010). These band assignments can provide
researchers with a basis for explaining the spectral changes that occur as a result of the
physical or chemical changes being studied in an experiment.
15
Figure 1.3: Example FT-Raman spectra of corn starch (A) and cassava starch (B)
collected using 1064 nm excitation (adapted from Almeida et al 2010).
16
Wavenumber (cm-1) Assignment Relative Intensity
2911 C-H stretching very strong
1461 CH, CH2, C-O-H bending strong
1396 C-C-H bending strong
1380 C-O-H bending strong
1340 C-O stretching; C-O-H
bending
strong
1263 C-C-H, O-C-H, C-O-H
bending
medium
1207 C-C, C-O stretching weak
1127 C-O, C-C stretching; C-O-H
bending
strong
1109 C-C, C-O stretching; C-O-H
bending
strong
1083 C-O, C-C stretching; C-O-H
bending
strong
1053 C-O, C-C stretching; C-O-H
bending
strong
941 C-O-C, C-O-H bending; C-
O stretching
strong
868 C-C-H, C-O-C bending strong
769 C-C-O bending weak
718 C-C-O bending weak
615 C-C-O bending weak
577 C-C-O bending; C-O
torsion
weak
524 C-C-O bending; C-O
torsion
weak
478 C-C-C bending; C-O
torsion
very strong
441 C-C-O, C-C-C bending weak
410 C-C-O, C-C-C bending weak
Table 1.2: Raman bands seen in starch and their vibrational mode assignments as
reported in the literature (table adapted from Almeida et al 2010).
17
Use of Raman Spectroscopy to Measure Amylose-Amylopectin
Ratios The use of Raman spectroscopy to quantify amylose content in starches has not
been well researched. In particular, past research has not demonstrated whether
dispersive Raman spectroscopic instruments are capable of accurately measuring amylose
content in starch. Each of the following studies utilized 1064-nm excitation lasers as part
of an FT-Raman spectrometer to collect the spectral data, and the most commonly used
detector in these studies was a germanium detector cooled using liquid nitrogen (Phillips
et al 1999; Barton et al 2000; Himmelsbach et al 2001; Sohn et al 2004; Almeida et al
2010). Phillips et al (1999) presented a Raman spectroscopic method for quantifying
amylose content in corn starches. This method correlated the amylose content
determined by Megazyme’s amylose-amylopectin kit with the Raman spectra obtained
using a FT-Raman spectrometer. Unlike many Raman and near-infrared spectroscopic
methods, a simple linear regression was prepared to model the data, plotting the ratio of
the integrated areas of two spectral regions of interest against measured amylose content
(Phillips et al 1999). Although the method proved successful, reporting a high coefficient
of determination (r2 = 0.997) for the linear relationship between the bands studied and the
measured amylose content, the study’s scope was very limited, using only 4 total samples
to demonstrate the relationship, serving as little more than a proof-of-concept (Phillips et
al 1999). Barton et al (2000) developed an FT-Raman method for measuring several
quality characteristics of milled rice including amylose content, which was measured
using a single wavelength iodine binding colorimetric assay. The use of a multivariate
calibration developed using partial least squares regression demonstrated the potential for
18
full-spectrum calibrations based on Raman spectral data (Barton et al 2000). An
extensive follow-up study was conducted to develop an FT-Raman method for measuring
amylose content of milled rice flours, this time using an autoanalyzer to perform the
colorimetric iodine binding analyses (Himmelsbach et al 2001). The method was shown
to be highly capable of predicting apparent amylose content of milled rice flour (8-factor
PLS model, r2 = 0.985, SEP = 1.05%) and reported that Raman spectroscopy could be
better suited for this type of analysis than near-infrared reflectance spectroscopy, given
that the proper data preprocessing steps were taken (Himmelsbach et al 2001). Raman
spectroscopic methods have the potential to offer a nondestructive and rapid alternative to
traditional chemical and instrumental techniques for measuring amylose content, while
offering the additional benefit of being less impactful on the environment (Himmelsbach
et al 2001). In another study, Sohn et al (2004) compared the abilities of NIR and FT-
Raman spectroscopy to measure protein and amylose content of samples of rice flour
from different crop years. Using colorimetry to generate the reference data, the
researchers demonstrated that FT-Raman spectroscopy could be used to produce very
reliable models (7-factor PLS model, r2 = 0.991, SECV = 0.70%) for measuring amylose
content (Sohn et al 2004). Additionally, FT-Raman spectroscopy was reported as being
capable of producing better performing models than NIR spectroscopy, requiring fewer
factors to model the data, and yielding a comparable standard error of cross-validation.
Sohn et al (2004) attributed the “high precision of the models" to the use of sophisticated
data preprocessing techniques, particularly orthogonal signal correction. Most recently,
Almeida et al (2010) detailed a FT-Raman spectroscopic procedure for measuring the
19
amylose content of native corn and cassava starches, using a single-wavelength
colorimetric iodine binding technique to generate reference amylose data. The
researchers concluded that Raman spectroscopy could be successfully applied to the
measurement of amylose content in native starches (Almeida et al 2010). However, for
the corn starch model, this study used only 15 samples for the training set and 8 samples
for the validation set, limiting the study’s value for industrial application, where using a
large number of samples (> 50) for the training set would be advisable (Almeida et al
2010).
Methods for Measuring Retrogradation in Starch Numerous methods are available for studying retrogradation of starch and starch-
containing products. Retrogradation can be monitored using a number of techniques
which can be broken down into two categories: macroscopic and molecular techniques
(Karim et al 2000). Macroscopic methods, chiefly rheological tests, detect physical
changes that occur in a product or gel as a result of retrogradation, such as changes in
viscosity. Molecular techniques aim to study molecular changes such as shifts in
crystallinity (Karim et al 2000). Included in the category of macroscopic methods is
instrumental texture analysis (Karim et al 2000). Though texture analysis methods
encompass a variety of instruments, generally speaking, they provide researchers with
quantitative information about a sample by compressing the sample in a uniform manner
(Karim et al 2000). The force applied to compress the sample and the distance by which
the sample was compressed can be recorded to give quantitative information about
sensory attributes, like firmness, that are otherwise difficult to quantify (Karim et al
20
2000). Due to the sensory changes associated with the retrogradation of starch, texture
analysis has been applied to study the phenomenon, particularly as a reference method for
spectroscopic techniques (Xie et al 2003; Piccinini et al 2012). In industry, sensory
testing remains an important tool in determining if a product is unsuitable for market;
however, other macroscopic techniques such as thermal analysis have their own appeal to
food manufacturers, as well.
Generally speaking, thermal analysis to monitor starch retrogradation primarily
encompasses two techniques that are most widely used: differential thermal analysis
(DTA) and differential scanning calorimetry (DSC) (Karim et al 2000). Using DTA,
investigators can subject a starch sample and a reference material to identical thermal
treatments and record the temperature difference between the two materials over a time
or temperature profile, providing a means for better understanding the “physical and
chemical transformations” of interest (Morita 1956; Tian et al 2011). Morita (1956)
conducted one of the earliest experiments using DTA to investigate the properties of
starch; however, DTA has been used somewhat sparingly in regards to specifically
studying the retrogradation of starch (Karim et al 2000; Tian et al 2011). Recently, Tian
et al (2011) demonstrated that DTA could be used to monitor retrogradation in rice starch
gels, concluding that the coupling of DTA with differential scanning calorimetry (DSC)
could give investigators a more complete understanding of starch retrogradation in
cereals than either technique alone. DSC differs from DTA in a few ways in spite of the
fact that similar information can be obtained using either technique. For example,
equipped with a single heat source, DTA instruments allow for research applications that
21
may require extreme or a broad range of temperature treatments to observe and can
reliably be used to ascertain transition temperature and indirect determination of
enthalpies of transition for a physical or chemical phenomena of interest (Schenz 2003).
Conversely, DSC, equipped with an individual heat source for the reference and sample
cells, is better suited for operation at more evenly controlled heating rates and enables
both the temperature and enthalpy of transition of a particular physical or chemical
change to “be directly measured” (Schenz 2003). Due to its efficiency and simplicity,
DSC remains a popular tool for quantifying retrogradation by the detection of melting
endotherms (Karim et al 2000). Researchers can use DSC to obtain detailed information
about phase transitions in foods, such as the melting of amylopectin and its associated
enthalpy (Karim et al 2000). The ease of the generalized DSC procedure for monitoring
retrogradation may make it appealing to food manufacturers (Karim et al 2000).
Additionally, DSC can be used to measure retrogradation in multiple food matrices such
as bread and waxy starch gels, to name a few (Ribotta et al 2004; Liu et al 2010; Tian et
al 2011). Karim et al (2000) noted that studying starch gels with DSC require a
commonly reported minimum starch concentration of 20%. Though macroscopic
techniques are normally more accessible to food manufacturers, molecular techniques
such as X-ray diffraction have remained a staple of academic research for many decades.
X-ray diffraction has offered academia a potent tool for elucidating molecular
structures of crystalline or semi-crystalline materials; however, its use as an analytical
tool in the food industry is likely limited somewhat due to the expense associated with
the instrumentation. Nevertheless, research has developed methods for measuring the
22
relative percentages of the crystalline and amorphous phases in starches (Nara et al
1978), allowing investigators to study retrogradation at the molecular level, and
providing researchers with information on specific phenomena relating to retrogradation
like the staling of bread (Karim et al 2000; Ribotta et al 2004). Such experiments have
been conducted on starch, starch gels and solutions, and recently on model food products
like baked bread (Karim et al 2000; Ribotta et al 2004). However, the method may have
disadvantages when compared to some other available procedures. Kim et al (1997)
performed a study comparing three different methods for measuring the “degree of
retrogradation” in rice starch gels: DSC, X-ray diffraction and the ɑ-amylase-iodine
method. Kim et al (1997) remarked that X-ray diffraction was the least sensitive of the
three methods. This sentiment was echoed by Karim et al (2000), who noted that past
experimental evidence indicated that spectroscopic techniques like FT-infrared and
nuclear magnetic resonance spectroscopy had the potential to be more sensitive.
Another broad group of molecular techniques are spectroscopic methods, which
include a variety of procedures and instruments that can be used to study starch
retrogradation. Several spectroscopic techniques have been developed for studying the
chemical process and kinetics of retrogradation using Raman spectroscopy (Bulkin et al
1987), FT-infrared spectroscopy (Goodfellow and Wilson 1990) and nuclear magnetic
resonance spectroscopy (Yao and Ding 2002).
Some of the aforementioned methods, with the exception of thermal analysis,
texture analysis and sensory testing, are economically impractical for industry application
or have not been demonstrated as having such applicability. Although its applications
23
have only begun to be researched, Raman spectroscopy remains a possibility for
monitoring starch retrogradation in industry.
Use of Raman Spectroscopy to Measure Retrogradation Some of the earliest work using Raman spectroscopy to monitor retrogradation of
starch was performed by Bulkin et al (1987). By monitoring changes in the full width
half-height (FWHH) of a band around 480 cm-1
, and another in the region of 2800 cm
-1 to
3000 cm-1
, Bulkin et al (1987) demonstrated that molecular changes could be monitored
in a waxy corn starch/water slurry over a 20-hour period using rapid Raman scanning.
Going further, the band around 480 cm-1
was shown as being effective at observing
spectral changes relating to retrogradation over a time period of two weeks (Bulkin et al
1987). These data were used to put forward a 4-step mechanism by which retrogradation
occurred in the observed starch gels, and by which small angle X-ray scattering and wide
angle X-ray diffraction were used to support the proposed kinetics of the mechanism
(Bulkin et al 1987). Utilizing the findings of Bulkin et al (1987) and applying them to the
study of starches from other botanical sources, Fechner et al (2005) explored the utility of
monitoring the FWHHs as well as shifts in the wavenumber position of the Raman bands
identified in Bulkin’s study, demonstrating that a very small but measurable change was
occurring in many of the of the starches studied. Neither study attempted to statistically
correlate their findings with an existing method for measuring starch retrogradation. Kim
et al (1989) performed a study using Raman spectroscopy with visible light excitation to
monitor the gelatinization of waxy corn starch. Kim et al (1989) compared the Raman
spectra of raw starch and starch that had just been gelatinized, noting major changes in
24
the intensity and position of many bands. Kim et al (1989) noted that the band at 475 to
480 cm-1
exhibited a shift from being of very strong intensity before gelatinization to
being very weak immediately after. Additionally, the researchers noted that most Raman
bands exhibited a decreased intensity immediately following gelatinization, while some
bands also shifted from their original position in the spectrum of raw starch, with some
bands shifting by 10 cm-1
or more (Kim et al 1989). The researchers proposed a model
for what was happening at the molecular level and suggested using a ratio of
wavenumbers as “indices of the degree of gelatinization” (Kim et al 1989). Since the
researchers were only interested in studying gelatinization kinetics, the experiment was
not extended further to look at the potential of monitoring retrogradation; however, their
research gives insight into what the immediate impact of gelatinization might be on the
Raman spectra of starch gels (Kim et al 1989). Piccinini et al (2012) explored the
application of FT-Raman spectroscopy to the monitoring of starch retrogradation in
semolina bread. The researchers prepared loaves of bread using semolina flour and
stored them under controlled conditions, collecting both Raman spectra and firmness
measurements from a texture analyzer at selected intervals over a period of 20 days
(Piccinini et al 2012). Synchronous 2-D correlation analysis was applied to determine
which bands in selected regions of interest underwent the most significant changes during
the course of the experiment (Piccinini et al 2012). Supported by past evidence, but also
noting that other spectral regions exhibited changes, the researchers chose to focus
primarily on the Raman band at 480 cm-1
(Piccinini et al 2012). Piccinini et al (2012)
reported a strong correlation between bread firmness measurements and the change in the
25
FWHH of the 480 cm-1
band (Piccinini et al 2012). Piccinini et al (2012) also noted that
the frequency of the 480 cm-1
band shifted roughly 1 cm-1
while the FWWH of the band
at 480 cm-1
also decreased by less than 1 cm-1
over the 20-day duration of the experiment.
Of additional note, the researchers reported that over the course of the study a band
appeared at about 765 cm-1
that would merit additional study (Piccinini et al 2012).
Flores-Morales et al (2012) performed another study using Raman spectroscopy to look
at the chemical changes that occur as a result of nixtamalization and the retrogradation of
starch isolated from both freshly-baked tortillas and tortillas that had been stored for 10
days at refrigeration temperatures. However, as with several of the previously mentioned
studies, the researchers did not attempt to correlate their findings with any other existing
methods for studying starch retrogradation, choosing instead to comment on relative
changes in the spectra before and after storage (Flores-Morales et al 2012). Flores-
Morales et al (2012) noted that the bands at 480 and 2900 cm-1
appeared to show changes
as a result of retrogradation. Additionally, bands at 856, 1127 and 1459 cm-1
were
reported to show a general decrease in intensity as a result of the process (Flores-Morales
et al 2012). Outside of these studies, little work has been performed using Raman
spectroscopy to monitor retrogradation in starch gels and in food models. Of ancillary
importance due to the complementary nature of infrared spectroscopy, Xie et al (2003)
demonstrated that near-infrared reflectance spectroscopy could more effectively measure
staling in white pan breads than texture analysis could. The spectroscopic technique was
shown to have a high correlation with firmness values measured by texture analysis (Xie
et al 2003). Ultimately, the method was demonstrated as being more exact at measuring
26
bread storage time than texture analysis, because the near-infrared method was able to
monitor more of the changes that occured during staling such as moisture loss (Xie et al
2003). The work done by Xie et al (2003) highlights a potential but likely insignificant
drawback to using Raman spectroscopy: Raman spectroscopy traditionally has a very
weak signal for water.
27
References
Almeida, M. R., Alves, R. S., Nascimbem, L. B. L. R., Stephani, R., Poppi, R. J., and de
Oliveira, L. F. C. 2010. Determination of amylose content in starch using Raman
spectroscopy and multivariate calibration analysis. Anal. Bioanal. Chem.
397:2693-2701.
Barton, F. E., Himmelsbach, D. S., McClung, A. M., and Champagne, E. T. 2000. Rice
quality by spectroscopic analysis: precision of three spectral regions. Cereal
Chem. 77:669-672.
Bates, F. L, French, D., and Rundel, R. E. 1943. Amylose and amylopectin content of
starches determined by their iodine complex formation. J. Am. Chem. Soc. 65:
142-148.
Bertoft, E. 2004. Analysing Starch Structure. Pages 57-96 in: Starch in food: Structure,
function and applications. A.-C. Eliasson, ed. CRC Press: Boca Raton.
Bulkin, B. J., Kwak, Y., and Dea, I. C. M. 1987. Retrogradation kinetics of waxy-corn
and potato starches; a rapid, Raman-spectroscopic study. Carbohydr. Res.
160:95-112.
Chen, M.-H., and Bergman, C. J. 2007. Method for determining the amylose content,
molecular weights, and weight- and molar-based distributions of degree of
polymerization of amylose and fine-structure of amylopectin. Carbohydr. Polym.
69:562-578.
Chinnaswamy, R., and Hanna, M. A. 1988. Relationship between amylose content and
extrusion-expansion properties of corn starches. Cereal Chem. 65:138-143.
Donald, A. M. Understanding Starch Structure and Functionality. Pages 156-184 in:
Starch in food: Structure, function and applications. A-C. Eliasson, ed. CRC
Press: Boca Raton.
Fechner, P. M., Wartewig, S., Kleinebudde, P., and Neubert, R. H. H. 2005. Studies of
the retrogradation process for various starch gels using Raman spectroscopy.
Carbohydr. Res. 340:2563-2568.
28
Fitzgerald, M. A., Bergman, C. J., Ressurreccion, A. P., Moller, J., Jimenez, R., Reinke,
R. F., Martin, M., Blanco, P., Molina, F., Chen, M., Kuri, V., Romero, M. V.,
Habibi, F., Umemoto, T., Jongdee, S., Graterol, E., Reddy, K. R., Bassinello, P.
Z., Sivakami, R., Rani, N. S., Das, S., Wang, Y., Indrasari, S. D., Ramli, A.,
Ahmad, R., Dipti, S. S., Xie, L., Lang, N. T., Singh, P., Toro, D. C., Tavasoli, F.
and Mestres C. 2009. Addressing the dilemmas of measuring amylose in rice.
Cereal Chem. 86:492-498.
Flores-Morales, A., Jiménez-Estrada, M., and Mora-Escobedo, R. 2012. Determination
of the structural changes by FT-IR, Raman, and CP/MAS 13
C NMR spectroscopy
on retrograded starch of maize tortillas. Carbohydr. Polym. 87:61-68.
Goodfellow, B. J., and Wilson, R. H. 1990. A Fourier transform IR study of the gelation
of amylose and amylopectin. Biopolymers 30:1183-1189.
Grant, L. A., Ostenson, A. M., and Rayas-Duarte, P. 2002. Determination of amylose
and amylopectin of wheat starch using high performance size-exclusion
chromatography. Cereal Chem. 79:771-773.
Gudmundsson, M. 1994. Retrogradation of starch and the role of its components.
Thermochim. Acta 246:329-341.
Himmelsbach, D. S., Barton, F. E., McClung, M. A., and Champagne, E. T. 2001.
Protein and apparent amylose contents of milled rice by NIR-FT/Raman
spectroscopy. Cereal Chem. 78:488-492.
Hoseney, C. R. 1998. Starch. Pages 29-64 in: Principles of Cereal Science and
Technology. American Association of Cereal Chemists, Inc.: St. Paul.
Jane, J., Chen, Y. Y., Lee, L. F., McPherson, A. E., Wong, K. S., Radosavljevic, M., and
Kasemsuwan, T. 1999. Effects of amylopectin branch chain length and amylose
content on the gelatinization and pasting properties of starch. Cereal Chem.
76:629-637.
Jarvis, C. E., and Walker, J. R. L. 1993. Simultaneous, rapid, spectrophotometric
determination of total starch, amylose and amylopectin. J. Sci. Food Agric.
63:53-57.
29
Johnson, L. A., Baumel, C. P., Hardy, C. L., and White, P. J. 1999. Identifying Valuable
Corn Quality Traits for Starch Production. Iowa State University Extension:
Ames. Available online at:
http://www.extension.iastate.edu/Publications/EDC194.pdf.
Karim, A. A., Norziah, M. H., and Seow, C. C. 2000. Methods for the study of starch
retrogradation. Food Chem. 71:9-36.
Keetels, C. J. A. M., Oostergetel, G. T., and van Vliet, T. 1996. Recrystallization of
amylopectin in concentrated starch gels. Carbohydr. Polym. 30: 61-64.
Keller, S., Löchte, T., Dippel, B., and Schrader, B. 1993. Quality control of food with
near-infrared-excited Raman spectroscopy. Fresenius’ J. Anal. Chem. 346:863-
867.
Kim, I.-H., Yeh, A., Zhao, B. L., and Wang, S. S. 1989. Gelatinization kinetics of starch
by using Raman spectroscopy. Biotechnol. Prog. 5:172-174.
Kim, J.-O., Kim, W.-S., and Shin, M.-S. 1997. A comparative study on retrogradation of
rice starch gels by DSC, X-ray and alpha-amylase methods. Starch/Starke 49:71-
75.
Kizil, R., and Irudayaraj, J. 2008. Applications of Raman Spectroscopy for Food Quality
Measurement. Pages 143-163 in: Nondestructive Testing of Food Quality. J.
Irudayaraj and C. Reh, eds. Blackwell Publishing: Ames.
Lai, V. M-.F., Lu, S., and Lii, C.-Y. 2000. Molecular characteristics influencing
retrogradation of rice amylopectins. Cereal Chem. 77:272-278.
Larson, B. L., Gilles, K. A., and Jenness, R. 1953. Amperometric method for
determining the sorption of iodine by starch. Anal. Chem. 25:802-804.
Lee, M.-R., Swanson, B. G., and Baik, B.-K. 2001. Influence of amylose content on
properties of wheat starch and breadmaking quality of starch and gluten blends.
Cereal Chem. 78:701-706.
Liu, H., Yu, L., Tong, Z., and Chen, L. 2010. Retrogradation of waxy cornstarch studied
by DSC. Starch/Starke 62:524-529.
30
McCready, R. M., and Hassid, W. Z. 1943. The separation and quantitative estimation
of amylose and amylopectin in potato starch. J. Am. Chem. Soc. 65:1154-1157.
Megazyme International Ireland. 2011. Amylose/amylopectin assay procedure for the
measurement of the amylose and amylopectin contents of starch. Megazyme
International Ireland: Bray. Available online at:
http://www.megazyme.com/downloads/en/data/K-AMYL.pdf
Morita, H. 1956. Characterization of starch and related polysaccharides by differential
thermal analysis. Anal. Chem. 28:64-67.
National Center for Biotechnology Information. 2005. Image of the 2-D structure of
amylopectin. National Center for Biotechnology Information: Bethesda.
Available online at:
http://pubchem.ncbi.nlm.nih.gov/summary/summary.cgi?cid=439207&loc=ec_rcs
#x281
National Center for Biotechnology Information. 2011. Image of the 2-D structure of
amylose. National Center for Biotechnology Information: Bethesda. Available
online at:
http://pubchem.ncbi.nlm.nih.gov/summary/summary.cgi?cid=53477771&loc=ec_
rcs
Nara, S., Mori, A., and Komiya, T. 1978. Study on relative crystallinity of moist potato
starch. Starch/Starke 30:111-114.
Phillips, D. L., Xing, J., Liu, H., Pan, D.-H., and Corke, H. 1999. Potential use of
Raman spectroscopy for determination of amylose content in maize starch.
Cereal Chem. 76:821-823.
Piccinini, M., Simonetta, F., Secchi, N., Sanna, M., Roggio, T., and Catzeddu, P. 2012.
The application of NIR FT-Raman spectroscopy to monitor starch retrogradation
and crumb firmness in semolina bread. Available online only. doi:
10.1007/s12161-011-9360-8. Springer-Verlag, Berlin, Germany.
Ribotta, P. D., Cuffini, S., León, A. E., and Añón, M. C. 2004. The staling of bread: an
X-ray diffraction study. Eur. Food. Res. Technol. 218:219-223.
31
Satin, M. 2000. Functional Properties of Starches. FAO Agriculture and Consumer
Protection Department: Rome. Available online at:
http://www.fao.org/ag/magazine/pdf/starches.pdf
Schenz, T. 2003. Thermal Analysis. Pages 517-528 in: Food Analysis. S. S. Nielsen,
ed. Springer Science+Business Media LLC: New York.
Scotter, C. N. G. 2001. NIR Techniques in Cereals Analysis. Pages 90-99 in: Cereals
and Cereal Products: Chemistry and Technology. D. A. V. Dendy and B. J.
Dobraszczyk, eds. Aspen Publishing: Gaithersburg.
Sohn, M., Himmelsbach, D. S., and Barton, F. E. 2004. A comparative study of Fourier
transform Raman and NIR spectroscopic methods for assessment of protein and
apparent amylose in rice. Cereal Chem. 81: 429-433.
Stawski, D. 2008. New determination method of amylose content in potato starch. Food
Chem. 110:777-781.
Tian, Y., Xu, X., Xie, Z., Zhao, J., and Jin, Z. 2011. Starch retrogradation determined by
differential thermal analysis (DTA). Food Hydrocolloids 25:1637-1639.
USDA Economic Research Service. 2011. Feed Grains Data Yearbook Tables – Corn:
Food, seed, and industrial use. USDA: Washington. Available online at:
http://www.ers.usda.gov/Data/FeedGrains/Table.asp?t=31.
Viereck, N., Salomonsen, T., van den Berg, F., and Engelsen, S. B. 2009. Raman
Applications in Food Analysis. Pages 199-223 in: Raman Spectroscopy for Soft
Matter Applications. M. S. Amer, ed. John Wiley & Sons: Hoboken.
Wang, J. P., Li, Y., Tian, Y. Q., Xu, X. M., Ji, X. X., Cao, X., and Jin, Z. Y. 2010. A
novel triple-wavelength colorimetric method for measuring amylose and
amylopectin contents. Starch/Starke 62:508-516.
Wang, T. L., Bogracheva, T. Y., and Hedley, C. L. 1998. Starch: as simple as A, B, C?.
J. Exp. Bot. 49:481-502.
Xie, F., Dowell, F. E., and Sun, X. S. 2003. Comparison of near-infrared reflectance
spectroscopy and texture analyzer for measuring wheat bread changes in storage.
Cereal Chem. 80:25-29.
32
Yao, Y., and Ding, X. 2002. Pulsed nuclear magnetic resonance study of rice starch
retrogradation. Cereal Chem. 79:751-756.
Zhu, T., Jackson, D. S., Wehling, R. L., and Geera, B. 2008. Comparison of amylose
determination methods and the development of a dual wavelength iodine binding
technique. Cereal Chem. 85:51-58.
Zobel, H. F., and Kulp, K. 1996. The Staling Mechanism. Pages 1-64 in: Baked Goods
Freshness: Technology, Evaluation, and Inhibition of Staling. R. E. Hebeda and
H. F. Zobel, eds. Marcel Dekker: New York.
33
CHAPTER II: DEVELOPMENT OF A RAMAN SPECTROSCOPIC METHOD FOR MEASURING AMYLOSE-AMYLOPECTIN RATIOS OF CORN STARCH
34
Abstract An investigation utilizing Raman spectroscopy to measure the amylose-
amylopectin ratio of corn starch was conducted. Amylose-amylopectin ratios impact
quality and functional properties of starch and starch-containing food systems. However,
the food industry lacks rapid non-destructive methods for measuring these quality
parameters. Raman spectroscopy may be able to offer a rapid alternative to traditional
wet-chemical methods. Sixty-seven samples of corn starch ranging from -1.4% to 23.2%
amylose were prepared by randomly mixing selected starches from 2 sources of normal
starch and 3 sources of waxy (high amylopectin) starch. Samples were placed in 1.8-ml
glass vials and sealed with screw caps prior to being measured. Raman spectra were
collected over the region of 250 cm-1
to 3200 cm-1
using a Raman spectrometer with an
excitation wavelength of 785 nm. Scanning parameters were optimized, with a 60 second
integration time and averaging of duplicate scans provided satisfactory results. Reference
amylose content values for each sample were determined by colorimetry using a dual-
wavelength iodine binding method. Multivariate models were prepared. Samples were
subdivided into a calibration set (n=45) and a validation set (n=22). Partial least squares
regression and principal component regression algorithms were used to prepare
calibration models. Eliminating the spectral region above 2000 cm-1
improved the
performance of the calibration models. PLS regression yielded the best model
performance (r2 of validation = 0.832 for a 7-factor model, SEP = 2.90%). Excluding
samples made with cold water swelling starch offered minor improvement in model
performance. Other preprocessing treatments and data manipulation methods including
differentiation of spectra using the Savitzky-Golay method and truncation of the
35
calibration sample set based on reference amylose content were explored but did not
yield improved results.
Introduction Starch is a key and versatile food ingredient which can be used to serve a variety
of needs in manufacturing due to its numerous functional properties. A few of these
include its ability to form pastes and gels, thicken sauces as well as other mixtures and
stabilize emulsions (Satin 2000). Many of the important functional properties of starch,
and their impact and usage in foods, are controlled by the relative proportions of the two
polymers that comprise starch, amylose and amylopectin (Johnson et al 1999; Satin
2000). As such, amylose content of starches and starch-containing products is a key
quality parameter. Although various methods are available to measure amylose content,
measuring this attribute rapidly can be difficult.
Two broad categories of techniques are available: those that measure “apparent
amylose” and those that measure “absolute amylose” (Johnson et al 1999). The term
“apparent amylose” is often used to describe the result of older techniques, because the
result is called into question due to inherent inaccuracy associated with the method
(Johnson et al 1999; Himmelsbach et al 2001). As an example, measuring iodine’s
complexation with amylose is one of the principal ways of determining “apparent
amylose,” encompassing several techniques such as potentiometry, amperometry and
colorimetry (Bates et al 1943; Larson et al 1953; Himmelsbach et al 2001; Zhu et al
2008). However, the iodine binding capacity of amylose and amylopectin exhibits chain-
length dependence, meaning that amylopectin is also capable of forming inclusion
36
complexes with iodine (Wang et al 1998; Bertoft 2004). Colorimetric determination
procedures for amylose content may be the most commonly used techniques due to their
relative ease when compared to older methods (Zhu et al 2008). Though relatively
inexpensive to perform, the desirability of these methods for routine industry use or use
by crop improvement initiatives may be diminished somewhat due to the fact that these
techniques are destructive, complicated and are observed as not being very precise. A
survey found that the imprecision of these techniques may be in part related to variations
in how standard curves are generated between laboratories; furthermore, the lack of an
accepted standard method for measuring amylose content could have contributed,
resulting in a wide variety of procedures being used worldwide (Fitzgerald et al 2009).
Spectroscopic methods, which are capable of overcoming some of the limitations
of iodine binding procedures, have been researched more intensely in recent years, with
researchers contributing both near-infrared (NIR) and Fourier transform (FT) Raman
spectroscopic methods to the knowledge base. FT-Raman spectroscopy has been
demonstrated as a possible alternative to NIR spectroscopy for measuring amylose
content of maize and cassava starches, but only in a very limited scope (Phillips et al
1999; Almeida et al 2010). FT-Raman spectroscopic techniques for measuring multiple
quality attributes of milled rice and rice flour, including amylose content, have been
developed with great success (Barton et al 2000; Himmelsbach et al 2001; Sohn et al
2004). In fact, when compared with NIR spectroscopy, experimental evidence supported
the notion that FT-Raman spectroscopy may be superior or equally capable for
quantifying amylose content when spectral data was treated with sophisticated data
37
preprocessing algorithms (Sohn et al 2004). Though several methods have been
developed using FT-Raman spectroscopy to measure amylose content of starch and
starch-based products, the authors are unaware of any methods using a relatively
inexpensive and portable dispersive Raman spectroscopic instruments. Moreover, many
existing methods are based on reference data collected using single wavelength iodine
binding colorimetric techniques, which may be less precise and provide less information
than dual-wavelength or multi-wavelength colorimetric procedures (Jarvis and Walker
1993; Zhu et al 2008; Wang et al 2010). As such, the objective of this study was to
develop, optimize, validate and evaluate the efficacy of an inexpensive Raman
spectroscopic method for quantifying amylose-amylopectin ratios in corn starch.
Materials & Methods
Corn starch mixture preparation Blended samples of normal and waxy corn starches were prepared. The following
corn starches were utilized for sample preparation: National Starch AMIOCA (waxy),
National Starch NOVATION 4600 (waxy), National Starch NOVATION 2600 (waxy),
National Starch MELOJEL (normal) and Argo Corn Starch (normal). National Starch
AMIOCA (Bridgewater, NJ) and National Starch MELOJEL samples were obtained from
the University of Nebraska – Lincoln’s Food Processing Center. Dr. Devin Rose (UNL –
Food Science & Technology Dept.) provided National Starch NOVATION 4600 and
National Starch NOVATION 2600 samples. Argo Corn Starch (ACH Food Companies,
Memphis, TN) was purchased from a local grocery store (HyVee). Eighty-one samples
were prepared using a random design and by mixing one waxy starch with one normal
38
starch on the basis of waxy starch content (w/w), and their concentrations ranged from
0% to 100% waxy starch, with concentrations spaced in 5% increments. Each sample
weighed 50 ± 0.02 g total. Each unique combination of the available normal and waxy
starches was given a code ranging from 1-6, which was used in combination with a
random number generator (RANDOM.org) to assign which normal and waxy starches
were blended to prepare each sample. Using this method, a mixing protocol was
prepared (Table A-1 and A-2 in the appendix). Samples were weighed into a weigh boat
using a top-loading balance and then stirred for 1 minute with a spatula and shaken in a
glass jar for 1 minute to ensure thorough mixing, and samples were then transferred to
glass sample containers with screw-cap lids for storage.
Sample preparation for Raman spectroscopy Using a spatula, starch samples were transferred to 1.8-ml short-form style glass
vials with phenolic screw caps (VWR, Radnor, PA). The vials were filled no less than
half full. Vials were sealed using the provided screw caps and stored in a drawer at
ambient temperature until the scans were made. Vials were prepared in duplicate for
each sample to account for potential spectral differences that may arise from how
samples were packed or differences in the sample vials.
Raman spectroscopy All Raman spectral data were collected using an Enwave Optronics EZRaman-M
series Raman spectrometer (Irvine, CA) connected to a laptop. The EZRaman Reader
software provided with the Raman analyzer was used to handle the data collection.
Sample spectra were measured in the region of 250 cm-1
to 3200 cm-1
with a optical
39
resolution of 6 cm-1
. The excitation wavelength of the laser was 785 nm, while the power
of the laser was set at approximately 300 to 400 mW. The EZRaman Reader software’s
Auto Baseline correction function was used in the collection of all spectral data. Before
scanning, sample vials were cleaned with a KimWipe to remove any fingerprints or
residues that may interfere with data collection. Each sample vial was measured in
duplicate by rotating the vial 90° between scans.
Spectral collection optimization To determine the optimal spectral collection parameters for use in the method, a
small preliminary experiment was carried out by scanning starch samples of varying
amylose contents. One normal corn starch (Penford Food Ingredients, Centennial, CO),
one high amylose corn starch (Cargill, Wayzata, MN) and one waxy corn starch (Staley)
were each measured using the Raman spectrometer, and the spectral collection
parameters were varied to assess their impact on spectral quality. The EZRaman Reader
software’s “Quick Scan” function was used to establish initial scanning parameters.
Afterwards, the following spectral collection parameters were varied: the integration
time, the number of scans to collect and average, and the smoothing level. Each sample
was scanned in triplicate, and replicate scans were achieved by rotating the sample 90°
between scans. Optimal parameters were determined to be an integration time of 60 s,
the collection of an average of 2 scans, and a smoothing level of 1. These parameters
were used for the collection of all spectral data for the experiment.
40
Reference analysis A modified version of the dual wavelength iodine binding colorimetric method
described by Zhu et al (2008) was used to determine the amylose-amylopectin ratio of
each sample. All reagents were prepared in the manner described by Zhu et al (2008).
Each sample was prepared and measured in triplicate. Starch (100.0 ± 0.5 mg) was
weighed on an as is basis using an analytical balance and transferred to a plastic 50-ml
centrifuge tube. Using a micropipetter (Gilson, Middleton, WI), 1 ml of reagent alcohol
was added to the tube. The tube was then vortexed at max speed for about 20 s. A
volumetric pipet was used to transfer 10 ml of 1 N sodium hydroxide (NaOH) to the tube.
The tube was vortexed at max speed for about 20 s, allowed to stand for about 10 s and
then vortexed at max speed for another 20 s to ensure thorough mixing. Each tube was
capped with the provided screw cap and allowed to sit for 1 h until the solution became
clear. After the time elapsed, the solution was transferred to a 100-ml volumetric flask.
The centrifuge tube was then washed with about 20 ml of distilled water and vortexed at
max speed for about 20 s, and the contents were then transferred to the volumetric flask
as well. This process was repeated twice for each sample. Each flask containing a
sample was then diluted to volume with distilled water. Two ml of each diluted sample
were then transferred to a new 100-ml volumetric flask. Approximately 50 ml of distilled
water and 2 drops of phenolphthalein indicator were added to each flask. The resultant
mixture was carefully titrated with 0.1 N hydrochloric acid (HCl) to a colorless endpoint.
Two ml of 0.2% iodine solution were added to each flask, and each flask was then diluted
to volume with distilled water. Flasks were stored in a dark cabinet for about 30 min to
fully develop color. Samples were measured from 400 to 700 nm using a Beckman DU-
41
520 UV-Vis spectrophotometer (Beckman-Coulter, Brea, CA), and the absorbance values
at 510 and 620 nm were recorded. Distilled water was used as a blank; samples were
measured in glass cuvettes. Each sample was scanned in duplicate, and the absorbance
readings at each wavelength were averaged. Amylose content was calculated using
Equation 2.1 described by Zhu et al (2008) for determining the amylose content of
starches from cereal sources using the dual wavelength iodine binding technique.
Equation 2.1:
,
where Diff ABS = Abs @ 620 nm – Abs @ 510 nm
Replicate reference results were averaged, and the relative standard deviation and
standard deviation were used to assess the precision of the data. Reference data were
accepted or rejected using one of two limitations: replicates must have a relative standard
deviation (RSD) equal to or less than 5% for samples estimated to be above 5% amylose
content, or samples must have an absolute standard deviation less than or equal to 0.3%
amylose content for samples estimated to be at or below 5% amylose content. Reference
data that did not meet the limits for precision were not included in the calibration or
validation data sets. The described calculations were performed using Microsoft Excel
2007.
Data preprocessing and chemometrics Data preprocessing of spectra was performed in GRAMS/AI 8.0 (Thermo
Scientific, Woburn, MA). Specific procedures that were used for each spectral
measurement are spectral linearization (XY2Even.AB) and spectral averaging of replicate
spectra (Average.AB). The complementary PLSplus/IQ software module was used for
42
development of calibration models. For the development and validation of the calibration
models, the samples were split into subsets: a training set and a validation set. The
subsets were prepared by putting the samples in numerical order, and every third sample
was put in the validation dataset. Furthermore, additional data preprocessing steps such
as mean centering and spectral region restrictions were assessed and utilized based on
their ability to improve the calibration model. Calibrations were prepared using the PLS-
1 and PCR algorithms made available through the PLSplus/IQ software, and a cross-
validation was performed for each model using the software’s built-in leave-one-out
method. Each model was prepared with mean centering, and any truncations of the
spectral region of interest were set using the software. The number of factors used in a
calibration model was determined by selecting the number of factors that minimizes the
prediction residual error sum of squares without overfitting the data. Preparing a plot of
the prediction residual error sum of squares vs. the number of factors was used to achieve
that goal. Initial assessments of model performance were based on the r2
value of the line
of best fit for the instrument-predicted value vs. the experimental value of the calibration
sample set, the standard error of cross-validation (SECV) and trends of overestimation or
underestimation of calibration samples predicted by the model. Samples in the validation
set were predicted using the PLSplus/IQ software add-on available through GRAMS/AI
8.0. The performance of each multivariate calibration was evaluated based upon
assessment of the r2
value of the line of best fit for the instrument-predicted value vs. the
experimental value of an independent validation sample set, the standard error of
prediction (SEP), the ratio of the standard error of prediction to the sample standard
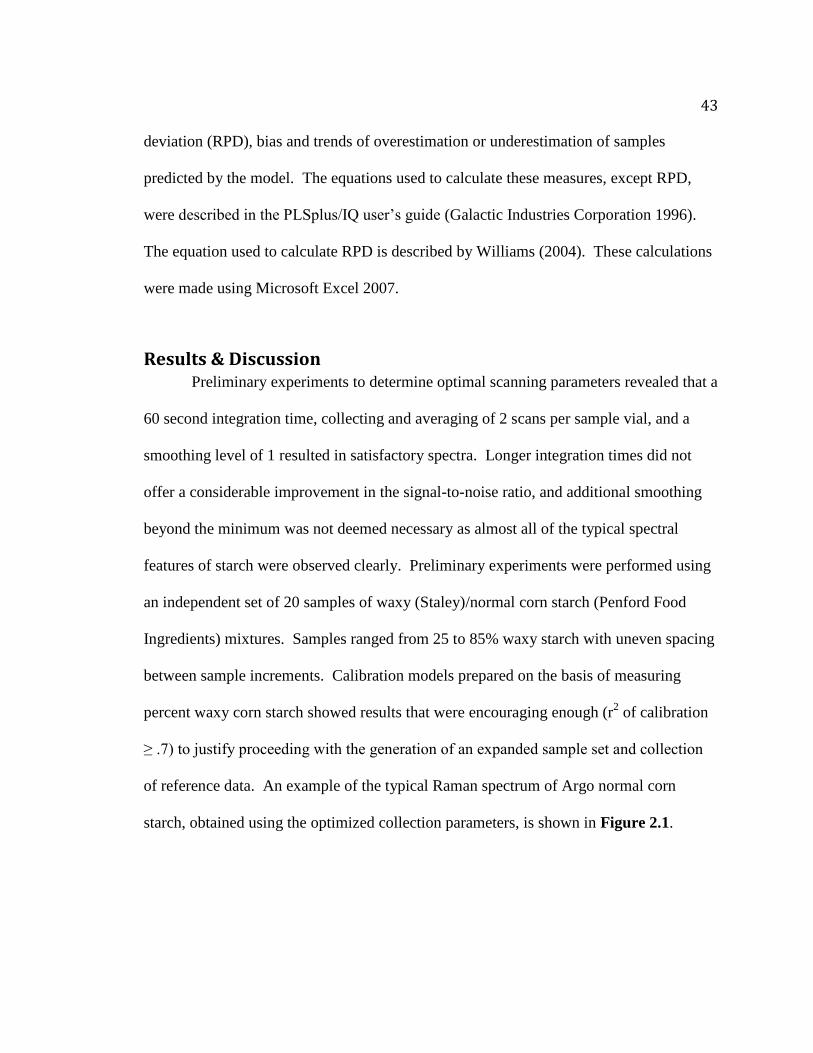
43
deviation (RPD), bias and trends of overestimation or underestimation of samples
predicted by the model. The equations used to calculate these measures, except RPD,
were described in the PLSplus/IQ user’s guide (Galactic Industries Corporation 1996).
The equation used to calculate RPD is described by Williams (2004). These calculations
were made using Microsoft Excel 2007.
Results & Discussion Preliminary experiments to determine optimal scanning parameters revealed that a
60 second integration time, collecting and averaging of 2 scans per sample vial, and a
smoothing level of 1 resulted in satisfactory spectra. Longer integration times did not
offer a considerable improvement in the signal-to-noise ratio, and additional smoothing
beyond the minimum was not deemed necessary as almost all of the typical spectral
features of starch were observed clearly. Preliminary experiments were performed using
an independent set of 20 samples of waxy (Staley)/normal corn starch (Penford Food
Ingredients) mixtures. Samples ranged from 25 to 85% waxy starch with uneven spacing
between sample increments. Calibration models prepared on the basis of measuring
percent waxy corn starch showed results that were encouraging enough (r2 of calibration
≥ .7) to justify proceeding with the generation of an expanded sample set and collection
of reference data. An example of the typical Raman spectrum of Argo normal corn
starch, obtained using the optimized collection parameters, is shown in Figure 2.1.
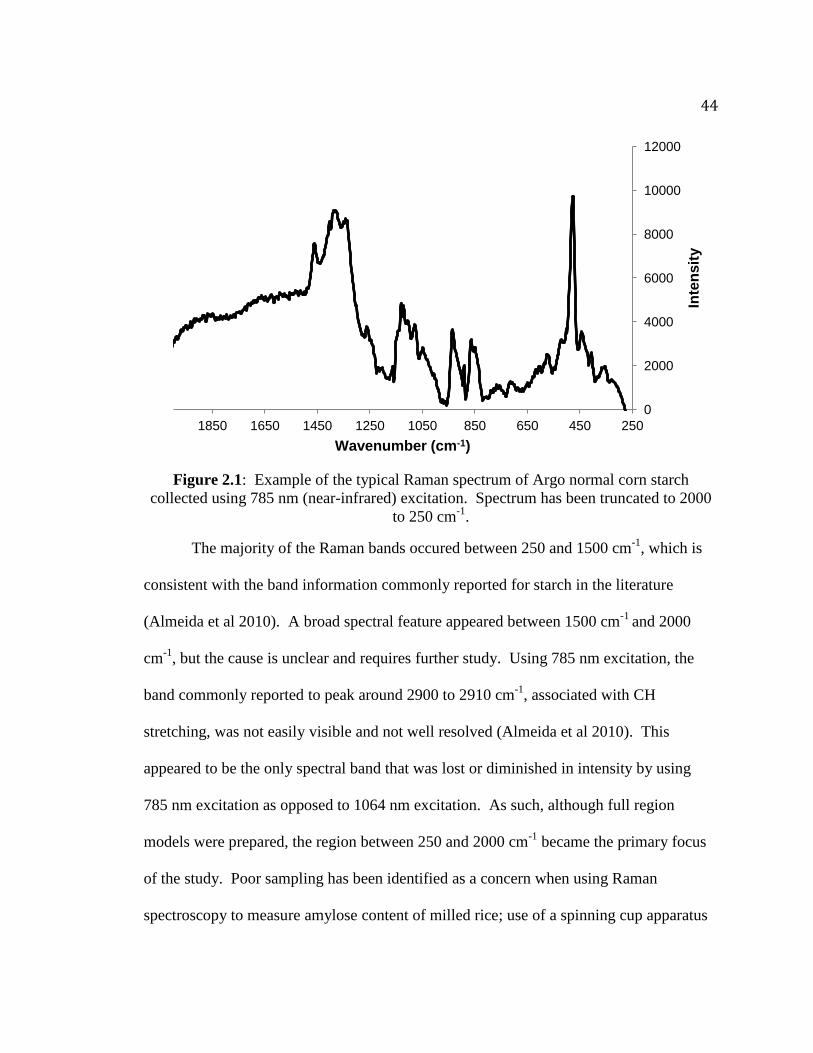
44
Figure 2.1: Example of the typical Raman spectrum of Argo normal corn starch
collected using 785 nm (near-infrared) excitation. Spectrum has been truncated to 2000
to 250 cm-1
.
The majority of the Raman bands occured between 250 and 1500 cm-1
, which is
consistent with the band information commonly reported for starch in the literature
(Almeida et al 2010). A broad spectral feature appeared between 1500 cm-1
and 2000
cm-1
, but the cause is unclear and requires further study. Using 785 nm excitation, the
band commonly reported to peak around 2900 to 2910 cm-1
, associated with CH
stretching, was not easily visible and not well resolved (Almeida et al 2010). This
appeared to be the only spectral band that was lost or diminished in intensity by using
785 nm excitation as opposed to 1064 nm excitation. As such, although full region
models were prepared, the region between 250 and 2000 cm-1
became the primary focus
of the study. Poor sampling has been identified as a concern when using Raman
spectroscopy to measure amylose content of milled rice; use of a spinning cup apparatus
0
2000
4000
6000
8000
10000
12000
250 450 650 850 1050 1250 1450 1650 1850
Inte
nsit
y
Wavenumber (cm-1)
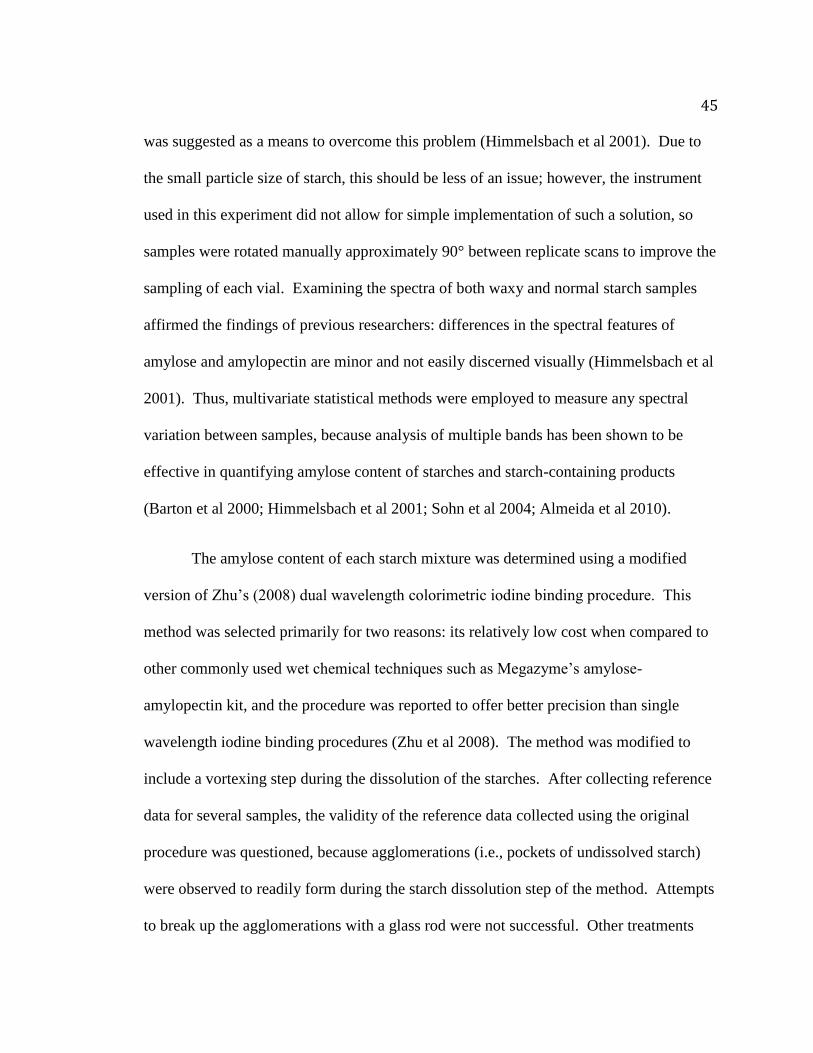
45
was suggested as a means to overcome this problem (Himmelsbach et al 2001). Due to
the small particle size of starch, this should be less of an issue; however, the instrument
used in this experiment did not allow for simple implementation of such a solution, so
samples were rotated manually approximately 90° between replicate scans to improve the
sampling of each vial. Examining the spectra of both waxy and normal starch samples
affirmed the findings of previous researchers: differences in the spectral features of
amylose and amylopectin are minor and not easily discerned visually (Himmelsbach et al
2001). Thus, multivariate statistical methods were employed to measure any spectral
variation between samples, because analysis of multiple bands has been shown to be
effective in quantifying amylose content of starches and starch-containing products
(Barton et al 2000; Himmelsbach et al 2001; Sohn et al 2004; Almeida et al 2010).
The amylose content of each starch mixture was determined using a modified
version of Zhu’s (2008) dual wavelength colorimetric iodine binding procedure. This
method was selected primarily for two reasons: its relatively low cost when compared to
other commonly used wet chemical techniques such as Megazyme’s amylose-
amylopectin kit, and the procedure was reported to offer better precision than single
wavelength iodine binding procedures (Zhu et al 2008). The method was modified to
include a vortexing step during the dissolution of the starches. After collecting reference
data for several samples, the validity of the reference data collected using the original
procedure was questioned, because agglomerations (i.e., pockets of undissolved starch)
were observed to readily form during the starch dissolution step of the method. Attempts
to break up the agglomerations with a glass rod were not successful. Other treatments

46
such as sonication of sample flasks in an ultrasonic water bath did not resolve the issue
either. The addition of vortexing during the starch dissolution step appeared to solve this
issue. The measured amylose content of the 81 starch mixtures ranged from 0% to
23.2%. Negative values were obtained for the two pure waxy starches; however, these
values were regarded as 0% amylose content, which had a negligible impact on the model
results. All samples were measured at least twice. 57 samples met the stated limits of
precision for inclusion in the calibration data. For selected samples that did not meet the
stated limits for inclusion in the calibration data, the results from multiple runs of the
same sample were pooled. The mean and standard deviation of the pooled data for a
given sample were calculated, and values that were outside of 1 standard deviation were
regarded as outliers. This was done because the data points for several samples appeared
to have 1 or 2 outlying data points from the pooled data for a given sample. The
remaining data points were averaged to find the mean amylose content of the sample.
Taking these steps allowed another 10 samples to be included; 67 samples were available
for use in the calibration and validation datasets. A summary of the datasets is shown in
Table 2.1. By looking at the mean and standard deviation for the two datasets, the
validation dataset appeared to be well representative of the calibration data.
Dataset Amylose
Range (%) No. of Samples
Mean Amylose
(%)
Standard
Deviation (%)
Calibration 0.0 to 23.2 45 12.8 7.2
Validation 0.0 to 22.6 22 12.6 7.1
Table 2.1: Summary statistics of the calibration and validation datasets including all 67
samples that met precision standards.
Both partial least squares regression (PLS) and principal components regression
(PCR) algorithms were used to model the data. A summary of the model results for the
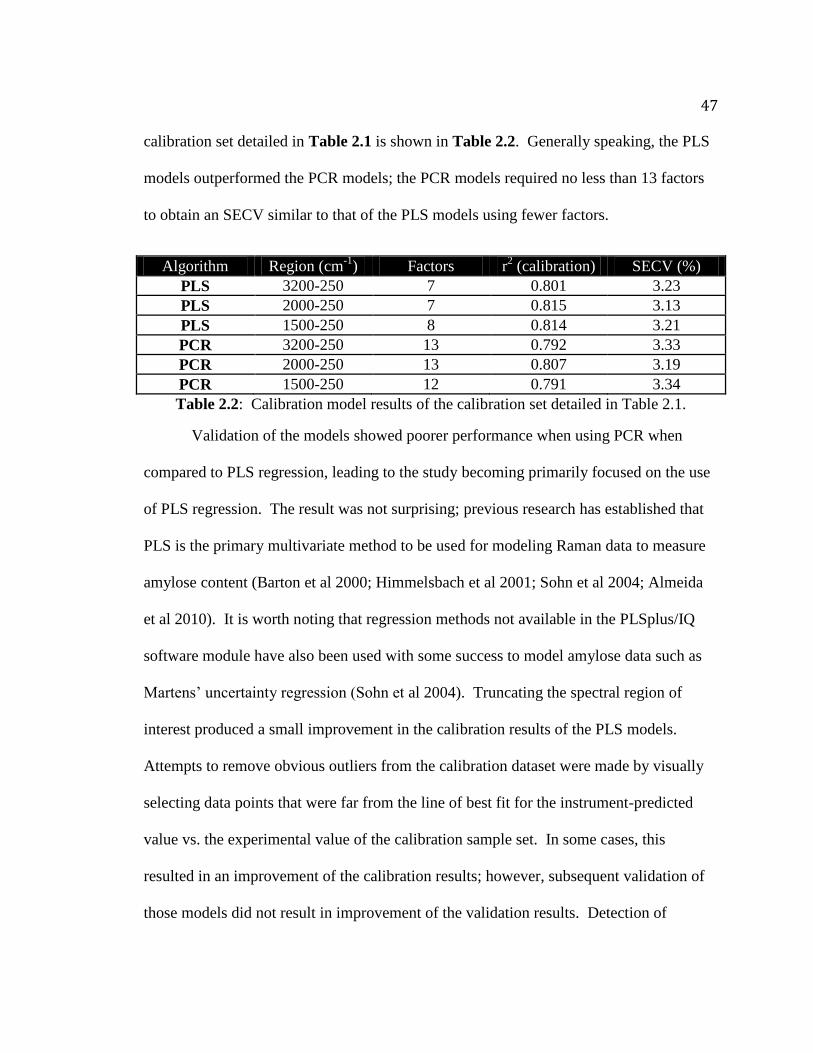
47
calibration set detailed in Table 2.1 is shown in Table 2.2. Generally speaking, the PLS
models outperformed the PCR models; the PCR models required no less than 13 factors
to obtain an SECV similar to that of the PLS models using fewer factors.
Algorithm Region (cm-1
) Factors r2 (calibration) SECV (%)
PLS 3200-250 7 0.801 3.23
PLS 2000-250 7 0.815 3.13
PLS 1500-250 8 0.814 3.21
PCR 3200-250 13 0.792 3.33
PCR 2000-250 13 0.807 3.19
PCR 1500-250 12 0.791 3.34
Table 2.2: Calibration model results of the calibration set detailed in Table 2.1.
Validation of the models showed poorer performance when using PCR when
compared to PLS regression, leading to the study becoming primarily focused on the use
of PLS regression. The result was not surprising; previous research has established that
PLS is the primary multivariate method to be used for modeling Raman data to measure
amylose content (Barton et al 2000; Himmelsbach et al 2001; Sohn et al 2004; Almeida
et al 2010). It is worth noting that regression methods not available in the PLSplus/IQ
software module have also been used with some success to model amylose data such as
Martens’ uncertainty regression (Sohn et al 2004). Truncating the spectral region of
interest produced a small improvement in the calibration results of the PLS models.
Attempts to remove obvious outliers from the calibration dataset were made by visually
selecting data points that were far from the line of best fit for the instrument-predicted
value vs. the experimental value of the calibration sample set. In some cases, this
resulted in an improvement of the calibration results; however, subsequent validation of
those models did not result in improvement of the validation results. Detection of
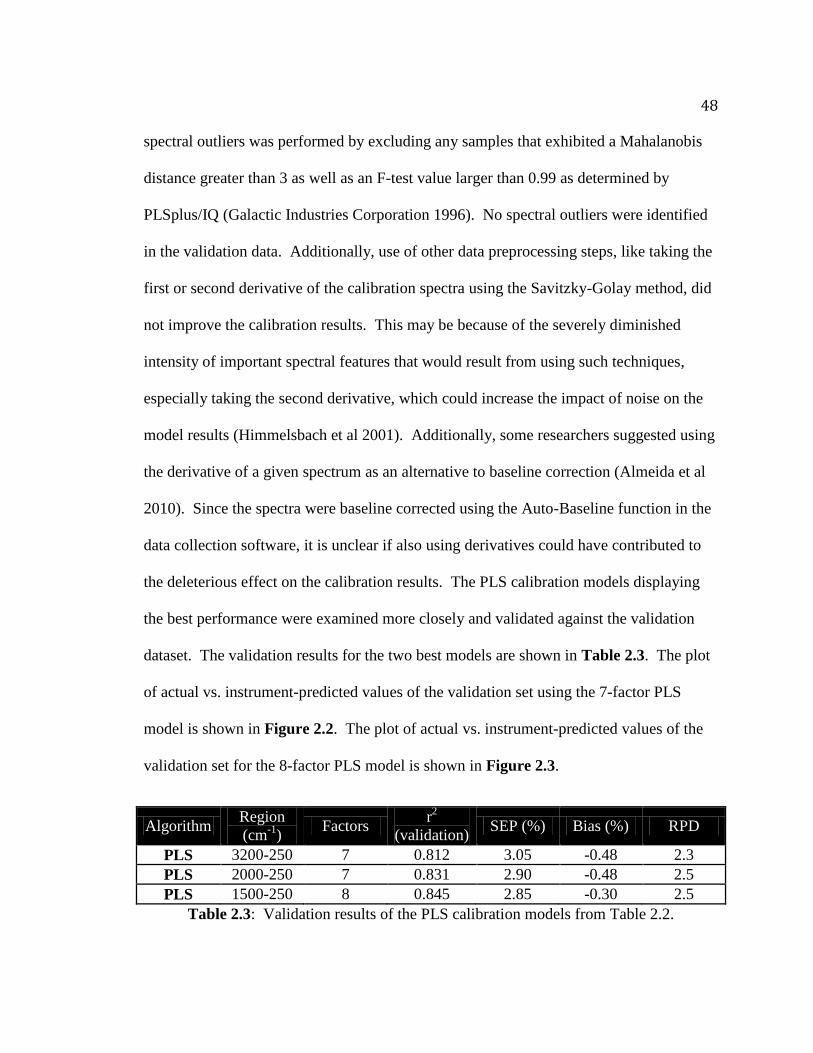
48
spectral outliers was performed by excluding any samples that exhibited a Mahalanobis
distance greater than 3 as well as an F-test value larger than 0.99 as determined by
PLSplus/IQ (Galactic Industries Corporation 1996). No spectral outliers were identified
in the validation data. Additionally, use of other data preprocessing steps, like taking the
first or second derivative of the calibration spectra using the Savitzky-Golay method, did
not improve the calibration results. This may be because of the severely diminished
intensity of important spectral features that would result from using such techniques,
especially taking the second derivative, which could increase the impact of noise on the
model results (Himmelsbach et al 2001). Additionally, some researchers suggested using
the derivative of a given spectrum as an alternative to baseline correction (Almeida et al
2010). Since the spectra were baseline corrected using the Auto-Baseline function in the
data collection software, it is unclear if also using derivatives could have contributed to
the deleterious effect on the calibration results. The PLS calibration models displaying
the best performance were examined more closely and validated against the validation
dataset. The validation results for the two best models are shown in Table 2.3. The plot
of actual vs. instrument-predicted values of the validation set using the 7-factor PLS
model is shown in Figure 2.2. The plot of actual vs. instrument-predicted values of the
validation set for the 8-factor PLS model is shown in Figure 2.3.
Algorithm Region
(cm-1
) Factors
r2
(validation) SEP (%) Bias (%) RPD
PLS 3200-250 7 0.812 3.05 -0.48 2.3
PLS 2000-250 7 0.831 2.90 -0.48 2.5
PLS 1500-250 8 0.845 2.85 -0.30 2.5
Table 2.3: Validation results of the PLS calibration models from Table 2.2.
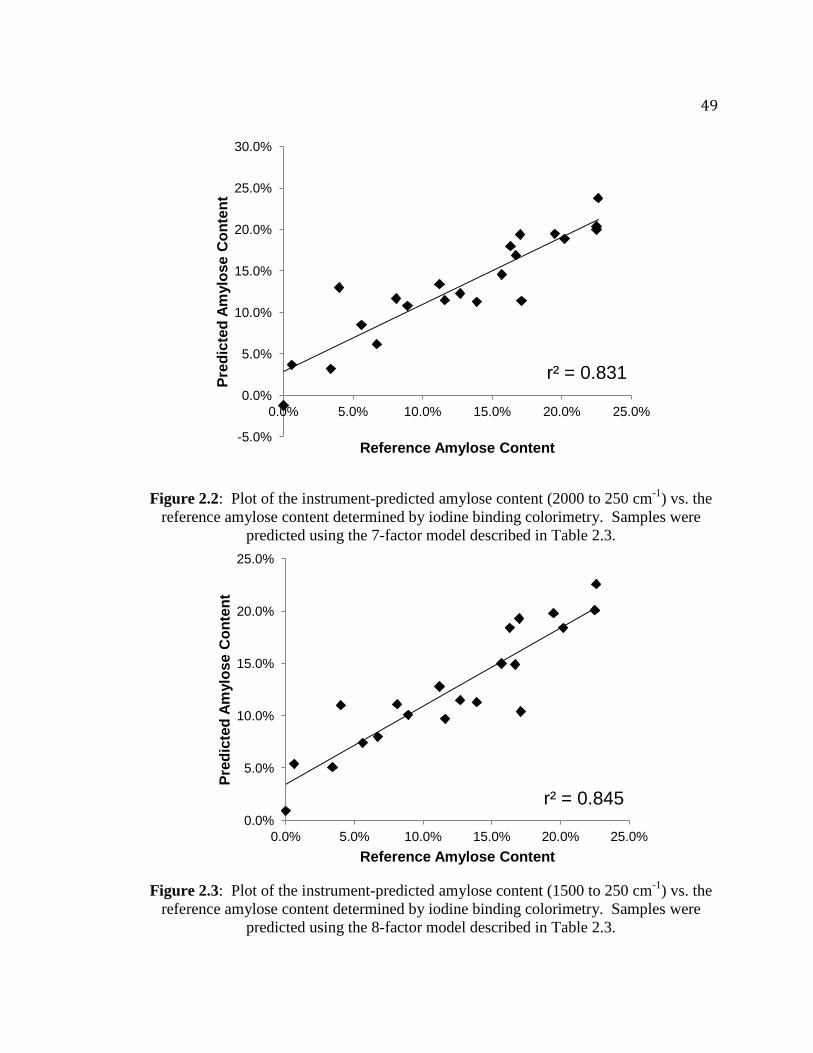
49
Figure 2.2: Plot of the instrument-predicted amylose content (2000 to 250 cm-1
) vs. the
reference amylose content determined by iodine binding colorimetry. Samples were
predicted using the 7-factor model described in Table 2.3.
Figure 2.3: Plot of the instrument-predicted amylose content (1500 to 250 cm
-1) vs. the
reference amylose content determined by iodine binding colorimetry. Samples were
predicted using the 8-factor model described in Table 2.3.
r² = 0.831
-5.0%
0.0%
5.0%
10.0%
15.0%
20.0%
25.0%
30.0%
0.0% 5.0% 10.0% 15.0% 20.0% 25.0%
Pre
dic
ted
Am
ylo
se
Co
nte
nt
Reference Amylose Content
r² = 0.845 0.0%
5.0%
10.0%
15.0%
20.0%
25.0%
0.0% 5.0% 10.0% 15.0% 20.0% 25.0%
Pre
dic
ted
Am
ylo
se
Co
nte
nt
Reference Amylose Content
50
Looking at the model results in Table 2.3, the most notable result is that the SEP
is lower for both validated models than the SECV from the calibration models detailed in
Table 2.2, indicating that the models perform reasonably well when measuring samples
from the independent validation set. The model truncated to 1500-250 cm-1
had a slightly
better r2 of validation, SEP and bias than the model truncated to 2000-250 cm
-1, but not
considerably so. Though a couple of data points from the validation set appeared to be
outliers and were poorly predicted by both models, their sample spectra did not appear to
be anomalous and thus were not excluded. Past researchers have obtained better model
results when measuring amylose content of milled rice using FT-Raman spectroscopy
with 1064 nm excitation, reporting SEP values as low as 1.05% (Himmelsbach et al
2001). Almeida et al (2010) reported that the band at 480 cm-1
is regarded as one of the
most important in being able to measure amylose content; however, the researchers
indicated that the band around 2900 cm-1
was also notable. As such, the poor signal for
the band at 2900 cm-1
when using 785-nm excitation may have detracted from the overall
ability of the models to measure amylose content. Another potential source of error in
the samples is the relative precision and accuracy of methods that measure apparent
amylose and the complexity of many of those techniques. In general, a spectroscopic
method is regarded as only being as good as the reference data on which it is based. The
bias for each of the two models was negative and would be regarded as large in some
cases; however, the bias was relatively small compared to the SEP. By inspecting
Figures 2.2 and 2.3, the sample measurements are observed to have a relatively even
distribution above and below the line of best fit. Consideration of the RPD gives some
51
guidance on the potential implementation or use of the model for analytical purposes.
Williams (2004) reported the scale shown in Table A.3 in the appendix. These values
were developed in reference to NIR methods, but the complementary nature of Raman
and NIR spectroscopy would suggest that they have value when interpreting model
performance results for Raman spectroscopy as well. An RPD value of 2.5 corresponds
to a method recommended for “very rough screening” (Williams 2004).
The presence of NOVATION 4600, a waxy cold water swelling starch, in the
validation and calibration datasets was also identified as a potential detractor to the
overall performance of the models. The spectrum of this sample, as well as many of the
spectra of samples containing this starch, was noisier in general but especially so in the
region between 2000 and 250 cm-1
. Because this starch is not described as a modified
starch, it is most likely a pregelatinized starch. Kim et al (1989) reported that
gelatinizing starch resulted in a considerable decrease in intensity of most, if not all,
Raman bands, especially the band at 480 cm-1
. This may be a possible cause of the
spectral differences observed in this starch as compared to the other native starches that
were studied. As such, samples containing NOVATION 4600 were removed from the
dataset described in Table 2.1, and another dataset was constructed, shown in Table 2.4.
Removing the samples containing the cold water swelling starch required removal of 17
samples from the original dataset, but the mean and standard deviation of the new dataset
were quite similar to the original, only differing by a few tenths of a percent. Again, both
PLS and PCR algorithms were used to model the data. The calibration results are shown
in Table 2.5. All models detailed in Table 2.5 were validated; the best validation results
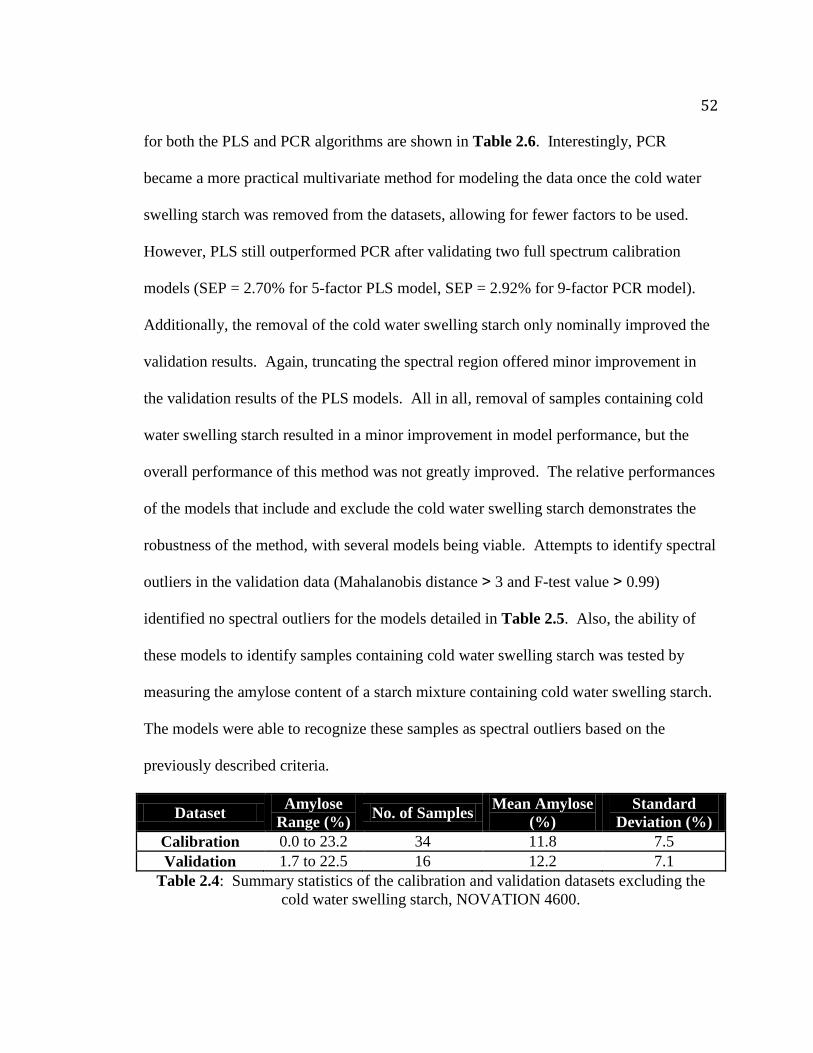
52
for both the PLS and PCR algorithms are shown in Table 2.6. Interestingly, PCR
became a more practical multivariate method for modeling the data once the cold water
swelling starch was removed from the datasets, allowing for fewer factors to be used.
However, PLS still outperformed PCR after validating two full spectrum calibration
models (SEP = 2.70% for 5-factor PLS model, SEP = 2.92% for 9-factor PCR model).
Additionally, the removal of the cold water swelling starch only nominally improved the
validation results. Again, truncating the spectral region offered minor improvement in
the validation results of the PLS models. All in all, removal of samples containing cold
water swelling starch resulted in a minor improvement in model performance, but the
overall performance of this method was not greatly improved. The relative performances
of the models that include and exclude the cold water swelling starch demonstrates the
robustness of the method, with several models being viable. Attempts to identify spectral
outliers in the validation data (Mahalanobis distance ˃ 3 and F-test value ˃ 0.99)
identified no spectral outliers for the models detailed in Table 2.5. Also, the ability of
these models to identify samples containing cold water swelling starch was tested by
measuring the amylose content of a starch mixture containing cold water swelling starch.
The models were able to recognize these samples as spectral outliers based on the
previously described criteria.
Dataset Amylose
Range (%) No. of Samples
Mean Amylose
(%)
Standard
Deviation (%)
Calibration 0.0 to 23.2 34 11.8 7.5
Validation 1.7 to 22.5 16 12.2 7.1
Table 2.4: Summary statistics of the calibration and validation datasets excluding the
cold water swelling starch, NOVATION 4600.
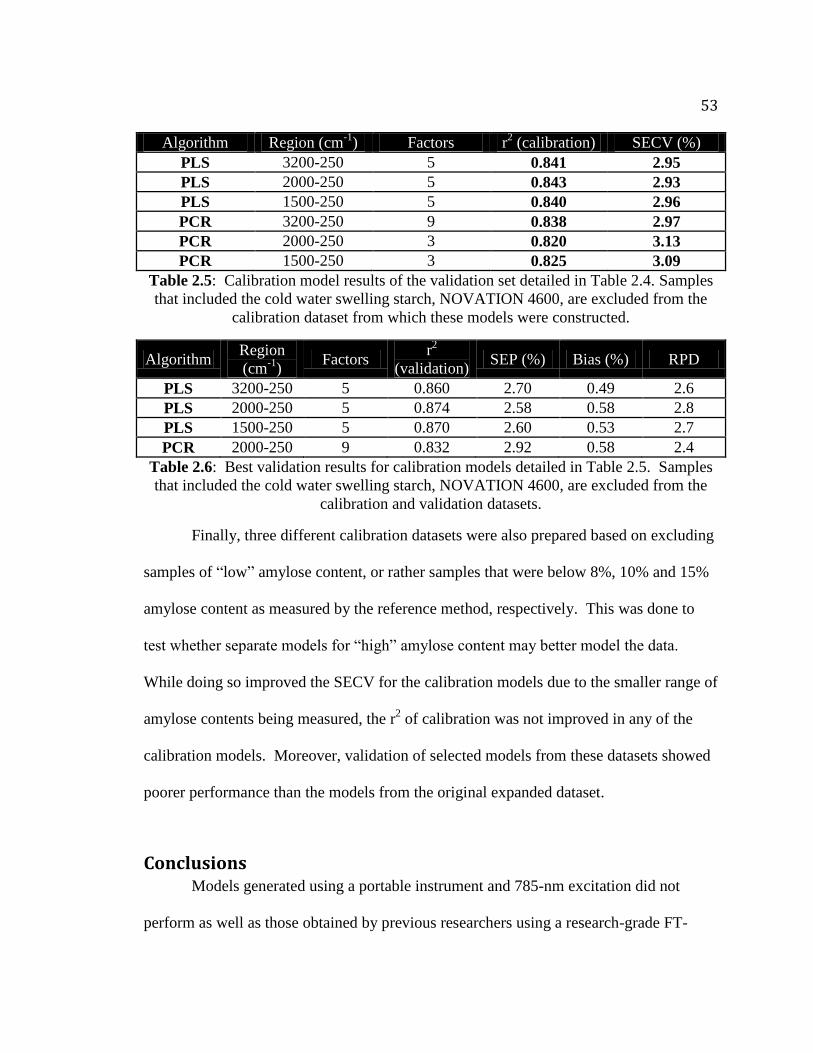
53
Algorithm Region (cm-1
) Factors r2 (calibration) SECV (%)
PLS 3200-250 5 0.841 2.95
PLS 2000-250 5 0.843 2.93
PLS 1500-250 5 0.840 2.96
PCR 3200-250 9 0.838 2.97
PCR 2000-250 3 0.820 3.13
PCR 1500-250 3 0.825 3.09
Table 2.5: Calibration model results of the validation set detailed in Table 2.4. Samples
that included the cold water swelling starch, NOVATION 4600, are excluded from the
calibration dataset from which these models were constructed.
Algorithm Region
(cm-1
) Factors
r2
(validation) SEP (%) Bias (%) RPD
PLS 3200-250 5 0.860 2.70 0.49 2.6
PLS 2000-250 5 0.874 2.58 0.58 2.8
PLS 1500-250 5 0.870 2.60 0.53 2.7
PCR 2000-250 9 0.832 2.92 0.58 2.4
Table 2.6: Best validation results for calibration models detailed in Table 2.5. Samples
that included the cold water swelling starch, NOVATION 4600, are excluded from the
calibration and validation datasets.
Finally, three different calibration datasets were also prepared based on excluding
samples of “low” amylose content, or rather samples that were below 8%, 10% and 15%
amylose content as measured by the reference method, respectively. This was done to
test whether separate models for “high” amylose content may better model the data.
While doing so improved the SECV for the calibration models due to the smaller range of
amylose contents being measured, the r2 of calibration was not improved in any of the
calibration models. Moreover, validation of selected models from these datasets showed
poorer performance than the models from the original expanded dataset.
Conclusions Models generated using a portable instrument and 785-nm excitation did not
perform as well as those obtained by previous researchers using a research-grade FT-
54
Raman instrument with 1064-nm excitation. While the results for quantifying amylose
content were not as good, this method is easily capable of discriminating between waxy
and normal starches. This offers the potential for the development of this technique to be
utilized in other ways than measuring percent amylose content. For example, this method
could have potential as a screening tool to identify starch shipments as waxy and normal.
Moreover, Sohn et al (2004) reported drastically improved calibration results after
applying orthogonal signal correction (OSC) as a preprocessing step for an FT-Raman
spectroscopic method for measuring amylose content of rice flour. Sophisticated data
preprocessing such as OSC may be able to be used to similar effect with the more
portable and inexpensive dispersive Raman spectroscopic instruments. Moreover,
preprocessing steps not available in the software package used in this study may also
offer some improvement in model performance and should be explored. The model
results demonstrated that the method is robust, with several models showing relatively
similar performance in spite of model parameters being varied. Inexpensive
instrumentation such as dispersive Raman spectrometers may have potential as an
alternative to wet chemical techniques for measuring amylose content of starches. Future
work should include examining the performance of the models after application of other
preprocessing steps and possibly repeating the experiment with NIR spectroscopy to
determine how the two techniques compare.
55
References
Almeida, M. R., Alves, R. S., Nascimbem, L. B. L. R., Stephani, R., Poppi, R. J., and de
Oliveira, L. F. C. 2010. Determination of amylose content in starch using Raman
spectroscopy and multivariate calibration analysis. Anal. Bioanal. Chem.
397:2693-2701.
Barton, F. E., Himmelsbach, D. S., McClung, A. M., and Champagne, E. T. 2000. Rice
quality by spectroscopic analysis: precision of three spectral regions. Cereal
Chem. 77:669-672.
Bates, F. L, French, D., and Rundel, R. E. 1943. Amylose and amylopectin content of
starches determined by their iodine complex formation. J. Am. Chem. Soc. 65:
142-148.
Bertoft, E. 2004. Analysing Starch Structure. Pages 57-96 in: Starch in food: Structure,
function and applications. A.-C. Eliasson, ed. CRC Press: Boca Raton.
Fitzgerald, M. A., Bergman, C. J., Ressurreccion, A. P., Moller, J., Jimenez, R., Reinke,
R. F., Martin, M., Blanco, P., Molina, F., Chen, M., Kuri, V., Romero, M. V.,
Habibi, F., Umemoto, T., Jongdee, S., Graterol, E., Reddy, K. R., Bassinello, P.
Z., Sivakami, R., Rani, N. S., Das, S., Wang, Y., Indrasari, S. D., Ramli, A.,
Ahmad, R., Dipti, S. S., Xie, L., Lang, N. T., Singh, P., Toro, D. C., Tavasoli, F.
and Mestres C. 2009. Addressing the dilemmas of measuring amylose in rice.
Cereal Chem. 86:492-498.
Galactic Industries Corporation. 1996. Appendix B. Pages 180-181 in: PLSplus/IQ
User’s Guide. Galactic Industries Corporation: Salem.
Himmelsbach, D. S., Barton, F. E., McClung, M. A., and Champagne, E. T. 2001.
Protein and apparent amylose contents of milled rice by NIR-FT/Raman
spectroscopy. Cereal Chem. 78:488-492.
Jarvis, C. E., and Walker, J. R. L. 1993. Simultaneous, rapid, spectrophotometric
determination of total starch, amylose and amylopectin. J. Sci. Food Agric.
63:53-57.
56
Johnson, L. A., Baumel, C. P., Hardy, C. L., and White, P. J. 1999. Identifying Valuable
Corn Quality Traits for Starch Production. Iowa State University Extension:
Ames. Available online at:
http://www.extension.iastate.edu/Publications/EDC194.pdf.
Kim, I.-H., Yeh, A., Zhao, B. L., and Wang, S. S. 1989. Gelatinization kinetics of starch
by using Raman spectroscopy. Biotechnol. Prog. 5:172-174.
Larson, B. L., Gilles, K. A., and Jenness, R. 1953. Amperometric method for
determining the sorption of iodine by starch. Anal. Chem. 25:802-804.
Phillips, D. L., Xing, J., Liu, H., Pan, D.-H., and Corke, H. 1999. Potential use of
Raman spectroscopy for determination of amylose content in maize starch.
Cereal Chem. 76:821-823.
Satin, M. 2000. Functional Properties of Starches. FAO Agriculture and Consumer
Protection Department: Rome. Available online at:
http://www.fao.org/ag/magazine/pdf/starches.pdf
Sohn, M., Himmelsbach, D. S., and Barton, F. E. 2004. A comparative study of Fourier
transform Raman and NIR spectroscopic methods for assessment of protein and
apparent amylose in rice. Cereal Chem. 81: 429-433.
Wang, J. P., Li, Y., Tian, Y. Q., Xu, X. M., Ji, X. X., Cao, X., and Jin, Z. Y. 2010. A
novel triple-wavelength colorimetric method for measuring amylose and
amylopectin contents. Starch/Starke 62:508-516.
Wang, T. L., Bogracheva, T. Y., and Hedley, C. L. 1998. Starch: as simple as A, B, C?.
J. Exp. Bot. 49:481-502.
Williams, P. C. 2004. Implementation of Near-Infrared Technology. Pages 145-169 in:
Near-Infrared Technology in the Agricultural and Food Industries. P. Williams
and K. Norris, eds. American Association of Cereal Chemists, Inc.: St. Paul.
Zhu, T., Jackson, D. S., Wehling, R. L., and Geera, B. 2008. Comparison of amylose
determination methods and the development of a dual wavelength iodine binding
technique. Cereal Chem. 85:51-58.
57
Chapter III: DEVELOPMENT OF A RAMAN SPECTROSCOPIC METHOD FOR MEASURING RETROGRADATION IN CORN STARCH GELS
58
Abstract A study utilizing Raman spectroscopy to monitor starch retrogradation in corn
starch gels was performed. Starch retrogradation is the process by which gelatinized
starch will undergo a series of physical and chemical changes as it ages, resulting in often
undesirable qualities in starch-based foods. As such, retrogradation is a primary source
of quality degradation in starch-based food products in the food industry. Many existing
methods are available for measuring retrogradation in starch-containing foods; however,
much of the existing methodology is destructive to the sample or requires expensive
instrumentation. Raman spectroscopy may be able to offer a rapid, portable and non-
destructive alternative to the existing techniques. Six series of starch gels (10% w/v)
were prepared from three sources of normal corn starch (2 series of gels per source, 6
gels per series) by heating starch slurries in capped 35-ml centrifuge tubes in a hot water
bath at about 90° C for 90 min, resulting in 36 total gels. Each gel was stored at 4° C and
measured at regular intervals (0 h, 24 h, 48 h, 72 h, 120 h, 168 h after preparation) over
the region of 250 cm-1
to 3200 cm-1
using an Enwave Optronics EZRaman-M series
Raman spectrometer with an excitation wavelength of 785 nm. Scanning parameters were
optimized, with a 30 second integration time and collection of a single scan found to give
suitable results. Duplicate scans were made by rotating the vials 90° between scans.
Gels were frozen, freeze-dried, equilibrated to approximately equal moisture levels and
measured using X-ray diffraction. The relative crystallinity of each freeze-dried gel was
determined using two different methods and correlated with intensity changes in the
Raman band at 480 cm-1
measured using three different methods. No correlation was
59
found between the reference data and the intensity changes of the band at 480 cm-1
using
any of the methods (r2 < .1). The ultimate goal of this research is to develop a Raman
spectroscopic method for measuring retrogradation in a model food product like white
pan bread; however, more development is needed.
Introduction Starch, a widely used food ingredient, has many functional properties, and its
ability to form gels and thicken mixtures is commonly exploited in the food industry. For
example, starch gelling makes the production of puddings, pie fillings and many sauces
possible (Satin 2000). Additionally, starch, as a component of flour, undergoes
gelatinization during bread making, with an estimated 20 billion pounds of bread being
produced annually (Zobel and Kulp 1996). As a physicochemical process, gelatinization
involves the heating and dispersion of starch in water, during which starch granules swell
and may burst. The result of this process is leaching of amylose from starch granules and
a loss of crystallinity, forming a gel (Keetels et al 1996; Donald 2004). With time, a
process known as retrogradation also occurs, and this progression is commonly
implicated as a primary cause of quality deterioration in starch-based products,
particularly in the staling of bread and other baked goods, which can occur prior to other
types of degradation like fungal or bacterial growth. During retrogradation, starch chains
begin to partially recrystallize, allowing for incomplete restoration of crystalline order at
the molecular level and causing increased textural firmness and moisture loss in starch-
based products (Gudmundsson 1994; Keetels et al 1996; Zobel and Kulp 1996). This
kind of quality degradation in starch-containing products is known to become more
60
severe and increasingly detectable as the products continue to age (Gudmundsson 1994;
Zobel and Kulp 1996).
Numerous methods are available to measure retrogradation in starch-based
products. Generally speaking, two categories of methods exist: macroscopic and
molecular (Karim et al 2000). Macroscopic methods can be used to measure physical
changes such as textural firming, while molecular methods are utilized to directly
measure changes at the molecular level like variations in the relative crystallinity of a
product (Karim et al 2000). X-ray diffraction, a molecular technique, has long been used
by academia to research crystal structures; methods have also been developed that allow
for the estimation of the relative proportions of crystalline and amorphous phases of a
powdered starch sample (Nara et al 1978; Karim et al 2000). Such methods allow
investigators to monitor processes like retrogradation in starch gels and its impact on
crystallinity in starch-based food products, like bread (Kim et al 1997; Karim et al 2000;
Ribotta et al 2004). Generally speaking, the high cost of instrumentation and
maintenance associated with many molecular methods may limit their widespread use in
the food industry, where macroscopic methods like differential scanning calorimetry,
texture analysis and sensory evaluation may be more commonly used to detect quality
degradation caused by retrogradation. However, molecular methods may grow in
popularity with time and more research, as some of these methods, like Raman
spectroscopy, have the potential to offer inexpensive, rapid and non-destructive
alternatives to macroscopic methods.
61
Very little research has been done on using Raman spectroscopy to measure
retrogradation in starch gels, and a similarly small body of research has been conducted
on using Raman spectroscopy to measure retrogradation in a model food product.
Researchers have demonstrated that small yet measurable changes occur in the
wavenumber position and full-width at half height of the Raman bands at 480 cm-1
and
about 2900 cm-1
(Bulkin et al 1987; Fechner et al 2005). Each of these studies looked at
the retrogradation kinetics of starches from various sources but did not correlate the
spectral data with any accepted reference method. Some work has been done using
Raman spectroscopy to monitor retrogradation in finished food products such as
semolina-based sourdough bread (Piccinini et al 2012) and tortillas (Flores-Morales et al
2012). Only one of these studies correlated their findings with measurements from a
commonly used reference method (Piccinini et al 2012). The researchers observed a
strong linear association (r2 > .9) between the full width measured at half height of the
Raman band at 480 cm-1
and bread crumb hardness each measured over a period of 20
days (Piccinini et al 2012). Thus, little research has looked at correlating the results of a
reference method with peak changes in Raman data. To address this gap in the literature,
the objective of this study was to develop and assess the usefulness of an inexpensive
Raman spectroscopic method for continuous measurement of retrogradation in corn
starch gels over time.
62
Materials and Methods
Sample preparation Preliminary experiments revealed that a 10% (w/v) starch gel was optimal for
sample handling for both the Raman spectroscopic data collection and the reference data
collection; therefore, 10% starch gels were prepared. Three sources of normal corn
starch were used: a local store brand (HyVee), Argo (ACH Food Companies, Memphis,
TN) and National Starch (Bridgewater, NJ) MELOJEL. Three gel series were prepared
and duplicated so that measurements could be made at 6 time intervals (immediately after
the gels had cooled to ambient temperature (0 h) or 24 h, 48 h, 72 h, 120 h and 168 h after
gels were prepared). Using two separate centrifuge tubes for each individual starch
source at each time interval, 12 total gels were prepared from each starch source for a
total of 36 samples. Each gel was measured at only one predetermined time interval, and
all gels in a series were prepared simultaneously. Distilled water (500 ml) was added to a
600-ml beaker, and the beaker was placed on a stir plate after which a magnetic stir bar
was added to the water. The stir plate’s speed was set to 50% of maximum. A top-
loading balance was used to weigh 50 g of starch into a weigh boat, and then the starch
was carefully and slowly added to the stirring water on the stir plate to allow thorough
dispersal. Once all of the starch was dispersed, the stir plate’s speed was increased to
about 75% of maximum to facilitate constant suspension of the starch. A 25-ml
volumetric pipette was used to transfer 25 ml of the starch slurry to a 35-ml KIMAX
(Kimble-Chase, Vineland, NJ) centrifuge tube. The tubes were labeled according to their
starch source, duplicate number, and the number of days the tube was to be stored, and
then sealed with the provided screw-caps. A hot water bath (90 °C) was used to heat the
63
samples. Before placing the starch slurries into the hot water bath, each tube was
vortexed at maximum speed for several seconds to suspend any starch that had settled.
The tubes were heated for 90 min to ensure full gelatinization. Every 10 min, each tube
was removed and inverted several times to resuspend any settled starch and then placed
back in the water bath. After the heating time had elapsed, the tubes were removed from
the bath and allowed to cool for 45 min at ambient temperature. Gels were monitored
using Raman spectroscopy over a period of 7 days following their preparation. Spectral
measurements were made immediately after preparation as well as 24 h, 48 h, 72 h, 120 h
and 168 h after preparation. Gels were stored at refrigeration temperature (4 °C) until
scans were made at each time interval. Amorphous standard samples were prepared for
use in the X-ray diffraction measurements using a similar protocol, as described in the
following paragraph.
Preparation of amorphous phase standards Amorphous phase standards were prepared using a modified version of the
procedure described by Ratnayake and Jackson (2008) for preparing starch gel samples.
Two 10% starch gels were prepared by slurrying 10 g of Argo corn starch in 100 ml of
distilled water in a 250-ml beaker on a stir plate, then using a 25-ml volumetric pipette to
fill KIMAX 35-ml centrifuge tubes with starch slurry, and heating samples in a 400-ml
beaker of hot water (95 °C) for 90 min. Sample tubes were removed every 10 min and
inverted several times to resuspend any starch that had settled and then placed back in the
beaker of hot water. Next, excess water was removed from each starch paste by draining
through Whatman No. 1 filter paper using gravity, and the gels were then transferred to
64
individual 50-ml plastic centrifuge tubes and placed in a freezer at -80 °C. A meat
thermometer was used to measure the internal temperature of one gel. After 30 min, the
gel being monitored reached 0 °C or lower. Then, the samples were freeze-dried for 48 h
(-52 °C at 0.051 Torr).
Raman spectroscopy All Raman spectral data were collected using an Enwave Optronics (Irvine, CA)
EZRaman-M series Raman spectrometer connected to a laptop computer. The EZRaman
Reader software provided with the Raman analyzer was used to handle the data
collection. Sample spectra were measured over the region of 250 cm-1
to 3200 cm-1
with
an optical resolution of 6 cm-1
using the instrument’s remote probe attachment. The
excitation wavelength of the laser was 785 nm, while the power of the laser was set at
approximately 300 to 400 mW. Preliminary experiments showed that a measurement
distance of about 3 mm provided the best quality spectrum. A 3.175-mm thick rubber
washer purchased from a local hardware store was used as a spacer so that the distance
between the sample tube and the remote probe lens was kept constant. Before scanning,
sample tubes were cleaned with a KimWipe to remove any fingerprints or residues that
may interfere with data collection. Preliminary experiments revealed that the optimal
scanning parameters were an integration time of 30 s, collection of a single scan, and a
smoothing level of 1. Duplicate scans were achieved by rotating each centrifuge tube 90°
between scans.
65
Sample preparation for X-ray diffraction After spectral measurements were made, samples from each time interval were
immediately placed in a freezer and held overnight at about -20 °C for 19 h to ensure
samples were completely frozen. Because some retrogradation may have occurred while
samples were freezing, Raman spectral measurements were also made on gels in the
frozen state after removal from the freezer using the previously described parameters.
Samples were lyophilized at -52 °C and 0.051 Torr for 48 h using a LABCONCO
(Kansas City, MO) FreeZone freeze-dryer. The dried gels were broken up using a spatula
and ground into a powder using a mortar and pestle. Dried gels were transferred to
labeled septum-fitted vials and stored in a desiccator until all samples were ready for
moisture equilibration. Once all samples were prepared, the moisture contents of all
samples were equilibrated by storing the samples in a sealed chamber. Three 600-ml
beakers were filled with distilled water and placed on the bottom shelf of a vacuum oven.
Each sample was transferred to a disposable Petri dish, and the powder was spread in a
thin layer along the bottom of the plate. The vacuum oven was sealed, and the samples
were stored in this manner for 48 h. A digital hygrometer was used to determine the
relative humidity inside the oven. Preliminary experiments revealed that storing samples
like this for 48 h resulted in an end moisture content of about 20% (wet basis). After 48
h, the Petri plates were removed from the oven, and the samples were transferred back to
labeled septum-fitted vials and stored at approximately -20 °C in a freezer until X-ray
measurements were made.
X-ray diffraction
66
X-ray measurements were made using a procedure described by Ratnayake and
Jackson (2008) with minor modifications to the scan and integration conditions. Samples
were mounted on aluminum sample plates by using a Pasteur pipette to place a couple of
drops of ethanol into each sample well, followed by the freeze-dried and ground starch
samples, and then compaction with a glass slide to provide a smooth surface for
measurement (Ratnayake and Jackson 2008). The X-ray diffractometer used for this
study was a Bruker-AXS D8 Discover system (Bruker AXS GmbH, Karlsruhe, Germany)
with a general area detector diffraction system (GADDS). A copper target X-ray tube
was used to make the X-ray measurements. The instrument was equipped with a Göbel
mirror and a HI-STAR area detector. The X-ray tube was set to 40 kV and 40 mA. The
scan conditions were omega = 4°, detector swing angle = 18°, sample to detector distance
= 10.1 cm and an exposure time of 180 s (Ratnayake and Jackson 2008). Frame data
were integrated over 2 theta = 3 to 35° and chi = -130 to -50° using the GADDS data
collection software provided with the instrument (Ratnayake and Jackson 2008).
Because of the high frequency of samples falling out of the sample mount before or while
scans were being made, each sample was only measured once. Percent relative
crystallinity (see Equation 3.1) and estimated relative crystallinity were calculated
according to the methods described by Ratnayake and Jackson (2008) and Kim et al
(1997), respectively. Estimated relative crystallinity was calculated by finding the ratio
of the area of the crystalline peaks to the area of the entire diffractogram between 2-theta
= 7 to 35° (Kim et al 1997). When calculating estimated relative crystallinity, the peak
67
between 2-theta = 3 to 7° in the diffractograms was excluded from the calculations due to
its low intensity and poor resolution.
Spectral preprocessing and data analysis
Spectral preprocessing such as linearization, baseline correction, and averaging of
replicate scans was performed in GRAMS/AI 8.0 (Thermo Scientific, Woburn, MA). For
all Raman spectra, a 4-point baseline was created using the baseline correction function
in GRAMS/AI 8.0. Baseline correction of diffractograms and crystalline peaks in the
diffractograms, additional smoothing of Raman spectral data, integration of spectral and
diffractogram peaks, and calculation of the absolute difference between X-ray
diffractograms, according to Equation 3.1, was performed in Origin Pro v8.6 (OriginLab
Corporation, Northampton, MA). All other calculations, including percent relative
crystallinity and estimated relative crystallinity, were made using Microsoft Excel 2007.
Equation 3.1: ,
where is the absolute difference between the sample [Is] and amorphous [Ia]
intensities and is the absolute difference between the crystalline [Ic] and
amorphous [Ia] intensities (Ratnayake and Jackson 2008).
Results and Discussion Several procedures were tested to determine the optimal techniques for preparing
and measuring starch gels. Preliminary experiments revealed that a 10% (w/v) starch gel
was optimal for sample handling and preparation and was regarded as satisfactory for the
Raman method and the X-ray diffraction reference method. Past experiments looking at
retrogradation of starch gels prepared from various cereal and root sources suggested that
high concentrations of starch (≥ 45% w/w) allowed for a sufficiently strong Raman signal
68
and the researchers’ desired closely-packed system to monitor the phenomenon’s kinetics
(Bulkin et al 1987; Fechner et al 2005). Additionally, past research that used Raman
spectroscopy with visible light excitation to examine gelatinization kinetics of starch
showed that gelatinized starch had greatly diminished signal strength at most of the
commonly reported Raman bands following gelatinization (Kim et al 1989). Due to this,
the feasibility of using more concentrated (>10% w/v) starch gels was examined in
preliminary experiments, but higher concentrations proved to be excessively difficult to
use with the selected reference data collection method, with starch gels being very firm in
texture after freeze-drying and thus problematic to grind into a powder with a mortar and
pestle.
Preliminary experiments revealed that the optimal Raman scanning parameters
were an integration time of 30 s, collecting 1 scan per tube, and a smoothing level of 1.
Using longer integration times and averaging of additional scans per tube did not offer
considerable improvement in the noise level of the sample spectra. In fact, increases in
these two scanning parameters appeared to increase the noise level of the sample spectra.
Rather than using the option included in the data collection software, any additional
smoothing of sample spectra was applied during data analysis, allowing for better control
of this parameter. Several types of sample containers were tested including VWR short-
form style 1.8-ml sample vials, KIMAX 35-ml centrifuge tubes and beakers of varying
volume. The Raman signal was expected to be somewhat degraded due to the
gelatinization of the starch (Kim et al 1989); however, the commonly reported Raman
bands were of weak intensity and not well resolved with any of these containers.
69
Although, two bands were more noticeable when using the centrifuge tubes. As shown in
Figure 3.1, the only Raman bands typically associated with starch that were visible in the
gelatinized samples were the C-H stretching band at about 2910 cm-1
and the band at 480
cm-1
, a band associated with “skeletal mode” vibrations (Almeida et al 2010; Piccinini et
al 2012). Neither of these bands were of strong intensity or well resolved. The exact
cause of the broad spectral feature between 1000 and 2700 cm-1
is unknown. Raman
scans of an empty KIMAX centrifuge tube using the scanning parameters previously
described revealed a similar broad spectral feature in this region but of much weaker
intensity, and it remains unclear if the sample container contributed to this. The sharp
peak around 890 cm-1
appeared to be a contribution from noise, as it does not appear in
all of the spectra from a given gel series.
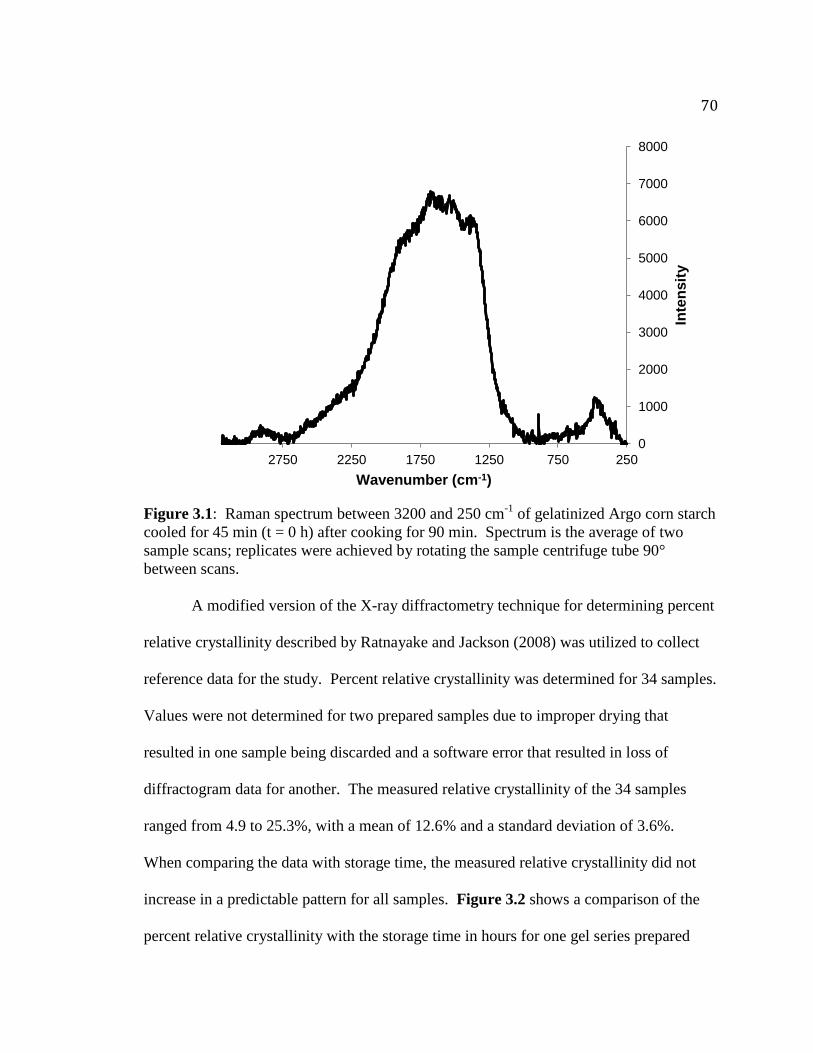
70
Figure 3.1: Raman spectrum between 3200 and 250 cm-1
of gelatinized Argo corn starch
cooled for 45 min (t = 0 h) after cooking for 90 min. Spectrum is the average of two
sample scans; replicates were achieved by rotating the sample centrifuge tube 90°
between scans.
A modified version of the X-ray diffractometry technique for determining percent
relative crystallinity described by Ratnayake and Jackson (2008) was utilized to collect
reference data for the study. Percent relative crystallinity was determined for 34 samples.
Values were not determined for two prepared samples due to improper drying that
resulted in one sample being discarded and a software error that resulted in loss of
diffractogram data for another. The measured relative crystallinity of the 34 samples
ranged from 4.9 to 25.3%, with a mean of 12.6% and a standard deviation of 3.6%.
When comparing the data with storage time, the measured relative crystallinity did not
increase in a predictable pattern for all samples. Figure 3.2 shows a comparison of the
percent relative crystallinity with the storage time in hours for one gel series prepared
0
1000
2000
3000
4000
5000
6000
7000
8000
250 750 1250 1750 2250 2750
Inte
nsit
y
Wavenumber (cm-1)
71
from Argo corn starch. As retrogradation occurs, starch chains recrystallize, resulting in
an increase in the relative proportion of the crystalline phase to the amorphous phase over
time. However, this relationship was not observed consistently in any of the reference
data generated for the starch gels when calculating percent relative crystallinity using the
method described by Ratnayake and Jackson (2008). Repeating the calculations but
excluding the poorly resolved peak between 2-theta = 3 to 7° from each diffractogram did
not have any impact on the relationship between the storage time and the relative
crystallinity. As such, another method for calculating relative crystallinity was examined.
The method described by Kim et al (1997) was employed, which involved integrating the
area under the crystalline peaks in the diffractogram and determining the ratio of that area
to the area of the entire diffractogram. Using this method, diffractograms were only
analyzed from 2-theta = 7 to 35° because the peak between 3 and 7° did not appear to be
well resolved. Using this method, the estimated relative crystallinity for the gels ranged
from 3.4 to 5.8%, with a mean of 4.2% and a standard deviation of 0.6%. Figure 3.3
shows a comparison of the estimated relative crystallinity (%) the storage time in hours
for the same gel series depicted in Figure 3.2.
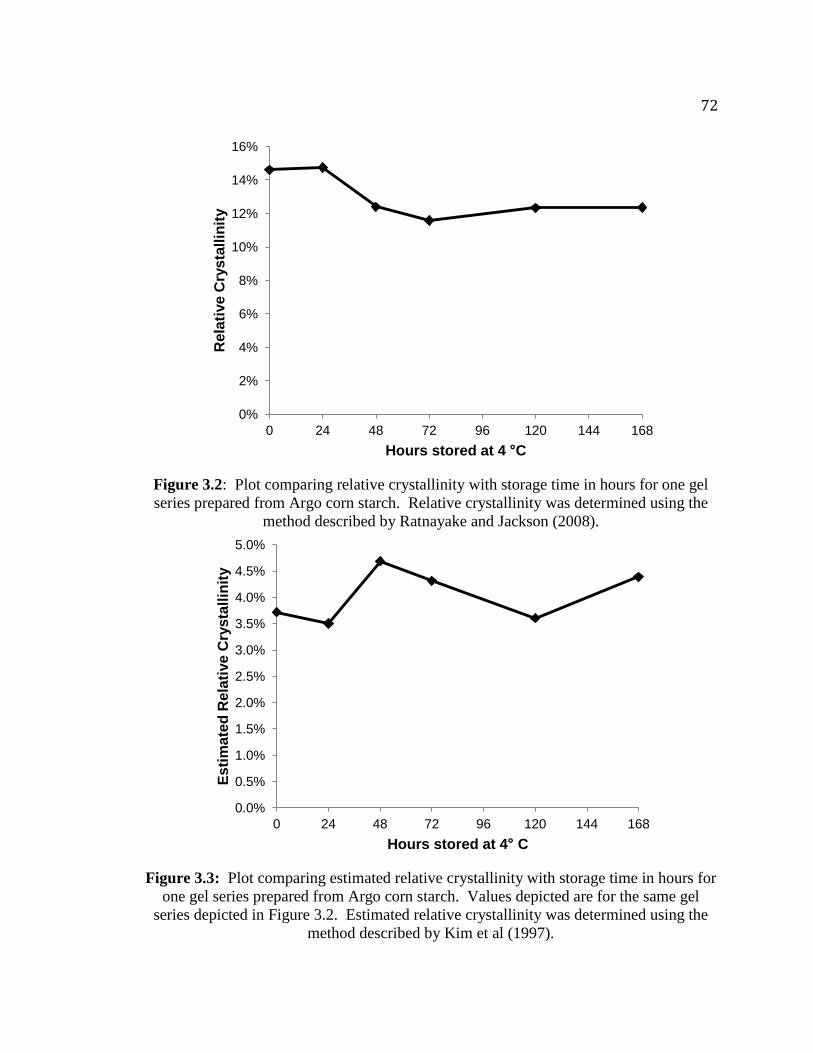
72
Figure 3.2: Plot comparing relative crystallinity with storage time in hours for one gel
series prepared from Argo corn starch. Relative crystallinity was determined using the
method described by Ratnayake and Jackson (2008).
Figure 3.3: Plot comparing estimated relative crystallinity with storage time in hours for
one gel series prepared from Argo corn starch. Values depicted are for the same gel
series depicted in Figure 3.2. Estimated relative crystallinity was determined using the
method described by Kim et al (1997).
0%
2%
4%
6%
8%
10%
12%
14%
16%
0 24 48 72 96 120 144 168
Re
lati
ve
Cry
sta
llin
ity
Hours stored at 4 °C
0.0%
0.5%
1.0%
1.5%
2.0%
2.5%
3.0%
3.5%
4.0%
4.5%
5.0%
0 24 48 72 96 120 144 168
Es
tim
ate
d R
ela
tive
Cry
sta
llin
ity
Hours stored at 4° C
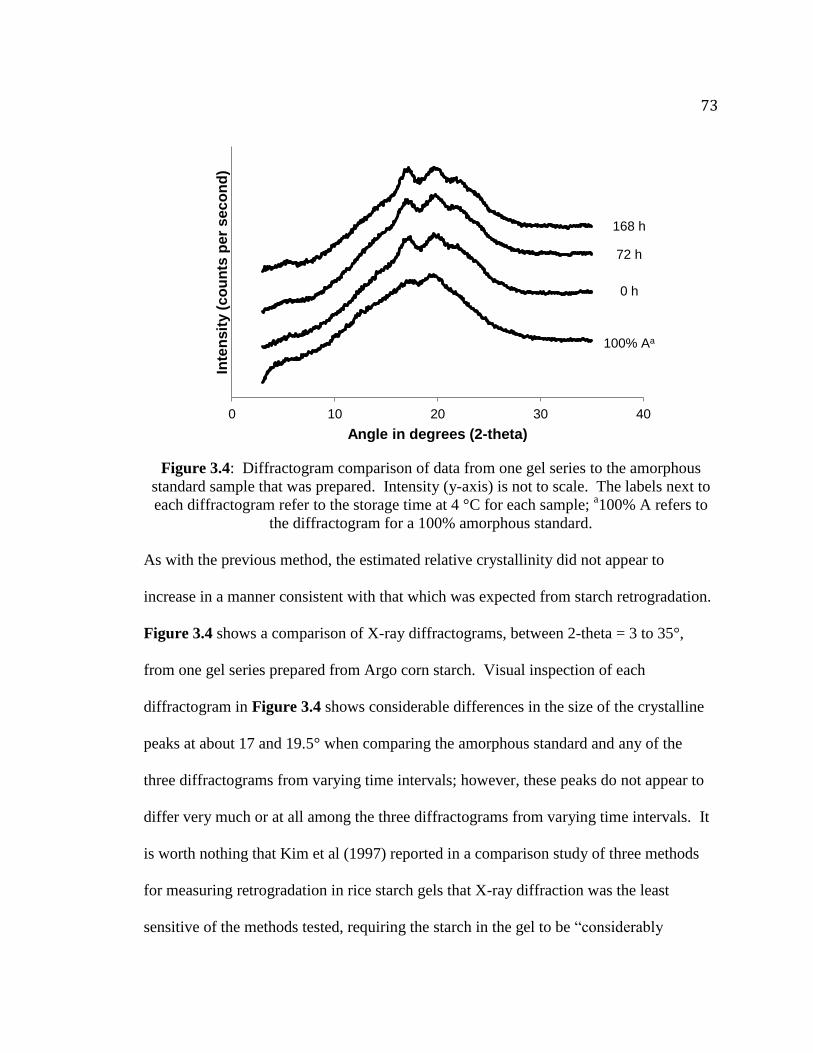
73
Figure 3.4: Diffractogram comparison of data from one gel series to the amorphous
standard sample that was prepared. Intensity (y-axis) is not to scale. The labels next to
each diffractogram refer to the storage time at 4 °C for each sample; a100% A refers to
the diffractogram for a 100% amorphous standard.
As with the previous method, the estimated relative crystallinity did not appear to
increase in a manner consistent with that which was expected from starch retrogradation.
Figure 3.4 shows a comparison of X-ray diffractograms, between 2-theta = 3 to 35°,
from one gel series prepared from Argo corn starch. Visual inspection of each
diffractogram in Figure 3.4 shows considerable differences in the size of the crystalline
peaks at about 17 and 19.5° when comparing the amorphous standard and any of the
three diffractograms from varying time intervals; however, these peaks do not appear to
differ very much or at all among the three diffractograms from varying time intervals. It
is worth nothing that Kim et al (1997) reported in a comparison study of three methods
for measuring retrogradation in rice starch gels that X-ray diffraction was the least
sensitive of the methods tested, requiring the starch in the gel to be “considerably
0 10 20 30 40
Inte
nsit
y (
co
un
ts p
er
sec
on
d)
Angle in degrees (2-theta)
100% Aa
0 h
72 h
168 h
74
recrystallized” to observe peaks. As such, the low amount of retrogradation that occurred
may not be accurately detectable by the chosen reference method. The lack of substantial
peak differences in the diffractograms shown in Figure 3.4 could have a couple of
explanations. Amylose has been reported to recrystallize more rapidly than amylopectin
(Lai et al 2000). As such, the crystalline peaks observed in the diffractograms may have
been caused by the rapid recrystallization of amylose upon cooling of the starch gels.
Additionally, the slower recrystallization of amylopectin over time may have been
hindered by the dilute starch concentration used in the study (Zeleznak and Hosney
1986). As such, crystalline peaks were observed, but the relationship with storage time
was not linear.
The relatively poor signal-to-noise ratio of the spectral data mostly precluded the
use of multivariate data analysis methods. Due to this and the poor resolution and signal
strength of the peak around 2910 cm-1
, monitoring intensity changes of the peak at 480
cm-1
became the focus of the study. Previous research has indicated that the intensity of
this band is greatly diminished after gelatinization (Kim et al 1989); however, other
studies looking at retrogradation have indicated that this band will show small changes in
the full-width at half-height of the band and begin to sharpen as the starch recrystallizes
(Bulkin et al 1987; Fechner et al 2005; Piccinini et al 2012). Preliminary experiments
showed that this peak appeared to increase in intensity or become sharper relative to other
persistent features in the spectrum (i.e., valleys or other peaks of weak intensity) as the
gels aged. Figure 3.5 shows the Raman spectra of a series of gels prepared from Argo
corn starch and measured at varying time intervals. Visually inspecting the region around
75
480 cm-1
appeared to show an increase in intensity or sharpening of the band with time
relative to the surrounding features. This change was not observed in each gel series,
though. Because of the tiny degree of change reported in the literature at the band at 480
cm-1
over longer time studies than the time period used in this study, the method reported
by previous researchers of tracking the full-width at half-height of the 480 cm-1
band was
not investigated (Bulkin et al 1987; Fechner et al 2005; Piccinini et al 2012). Instead,
three methods were employed to measure the intensity changes in the band at
approximately 480 cm-1
. First, the difference between the intensity of the band around
480 cm-1
and the intensity of a valley at its lowest point between 499 and 503 cm-1
was
calculated. As with the diffractogram data, the results were inconsistent with the
expected result; the band differences did not increase in a predictable fashion. Because
the noise level was considerable, using Origin Pro v8.6., the spectral data was smoothed
using the software’s Savitzky-Golay filtering (20 points of window), and additional
parameters were left as their default options. Then, a baseline was drawn between 460.6
and 507.4 cm-1
. These wavenumbers were selected because they correspond to two
valleys in the spectrum whose wavenumber positions shifted very little between samples.
The area under the peak, the peak height at maximum intensity and the wavenumber
value at maximum intensity were determined. Using this method, the results were again
unpredictable; within a given gel series, some samples at earlier time intervals (24 or 48
h) had a higher intensity or peak area than samples held for longer time intervals.
Finally, to normalize the peak area of the band at 480 cm-1
, the ratio of the integrated
peak area between 460.6 and 507.4 cm-1
and the integrated peak area between
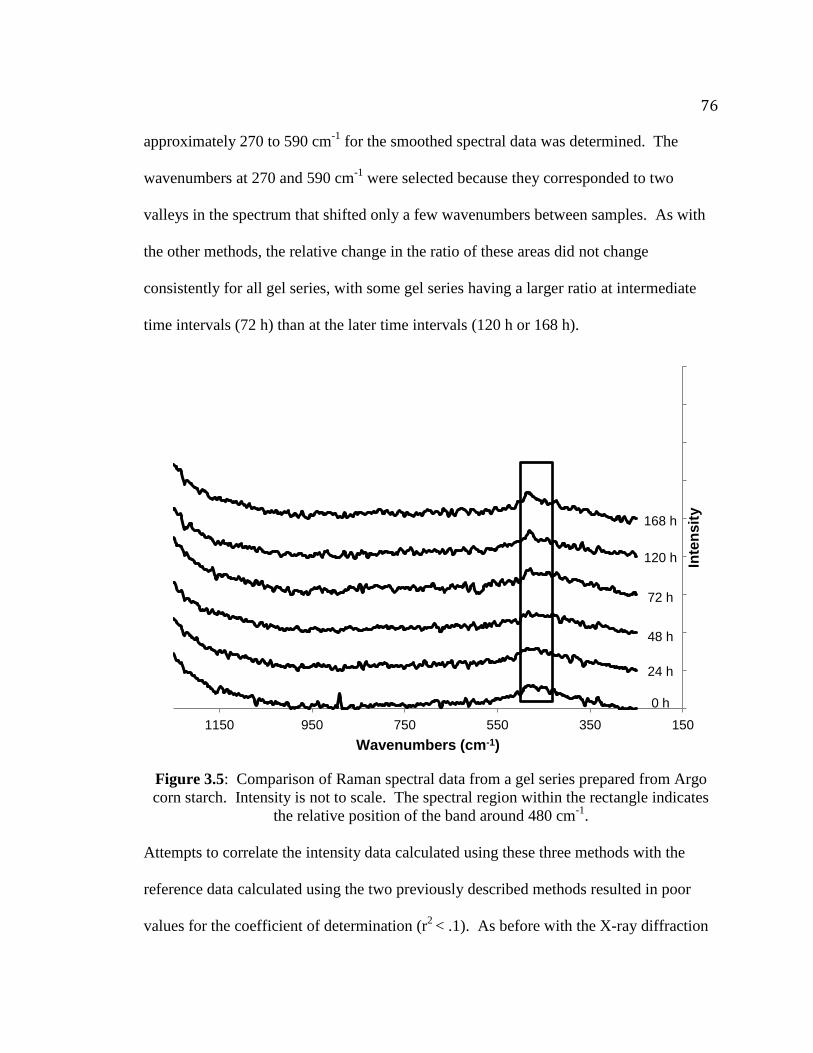
76
approximately 270 to 590 cm-1
for the smoothed spectral data was determined. The
wavenumbers at 270 and 590 cm-1
were selected because they corresponded to two
valleys in the spectrum that shifted only a few wavenumbers between samples. As with
the other methods, the relative change in the ratio of these areas did not change
consistently for all gel series, with some gel series having a larger ratio at intermediate
time intervals (72 h) than at the later time intervals (120 h or 168 h).
Figure 3.5: Comparison of Raman spectral data from a gel series prepared from Argo
corn starch. Intensity is not to scale. The spectral region within the rectangle indicates
the relative position of the band around 480 cm-1
.
Attempts to correlate the intensity data calculated using these three methods with the
reference data calculated using the two previously described methods resulted in poor
values for the coefficient of determination (r2
< .1). As before with the X-ray diffraction
150 350 550 750 950 1150
Inte
nsit
y
Wavenumbers (cm-1)
0 h
24 h
48 h
72 h
120 h
168 h
77
data, the Raman instrument may not be sensitive enough to measure retrogradation in
gels that are very dilute. Past studies looking at retrogradation kinetics were done on gels
of concentrations no less than 40% (Bulkin et al 1987; Fechner et al 2005). The
concentration dependence of retrogradation reported by Zeleznak and Hoseney (1986)
may have contributed as well, in which the authors noted that little crystallinity was
present in 20% (w/w) wheat starch gels measured by DSC.
Conclusions The applicability of Raman spectroscopy to measuring retrogradation in starch
gels may be problematic at dilute concentrations. The X-ray diffraction and Raman
spectral data exhibited a poor coefficient of determination when attempts were made to
correlate the data, showing there was essentially no correlation between the data. Use of
a higher starch gel concentration may be necessary to better observe starch retrogradation
with Raman spectroscopy. Holding gels for a longer time period than 7 days may also be
necessary, as some of the previous research has indicated that the Raman spectral
changes are very small in nature and become more perceptible with time (Bulkin et al
1987; Fechner et al 2005; Piccinini et al 2012). Additionally, this experiment was based
on the assumption that each gel would retrograde at a relatively uniform rate. This
assumption should be tested in future work. Furthermore, application of this method to a
model food system should also be examined. The long-term goal of this research is to
develop a Raman spectroscopic method for measuring retrogradation in a model food
product like white pan bread, but more development is needed.
78
References
Almeida, M. R., Alves, R. S., Nascimbem, L. B. L. R., Stephani, R., Poppi, R. J., and de
Oliveira, L. F. C. 2010. Determination of amylose content in starch using Raman
spectroscopy and multivariate calibration analysis. Anal. Bioanal. Chem.
397:2693-2701.
Bulkin, B. J., Kwak, Y., and Dea, I. C. M. 1987. Retrogradation kinetics of waxy-corn
and potato starches; a rapid, Raman-spectroscopic study. Carbohydr. Res.
160:95-112.
Donald, A. M. Understanding Starch Structure and Functionality. Pages 156-184 in:
Starch in food: Structure, function and applications. A-C. Eliasson, ed. CRC
Press: Boca Raton.
Eliasson, A.-C., Larsson, K., Andersson, S., Hyde, S. T., Nesper, R. and von Schnering,
H.-G. 1987. On the structure of native starch: an analogue to quartz structure.
Starch/Starke 39:147-152.
Fechner, P. M., Wartewig, S., Kleinebudde, P., and Neubert, R. H. H. 2005. Studies of
the retrogradation process for various starch gels using Raman spectroscopy.
Carbohydr. Res. 340:2563-2568.
Flores-Morales, A., Jiménez-Estrada, M., and Mora-Escobedo, R. 2012. Determination
of the structural changes by FT-IR, Raman, and CP/MAS 13
C NMR spectroscopy
on retrograded starch of maize tortillas. Carbohydr. Polym. 87:61-68.
Gudmundsson, M. 1994. Retrogradation of starch and the role of its components.
Thermochim. Acta 246:329-341.
Karim, A. A., Norziah, M. H., and Seow, C. C. 2000. Methods for the study of starch
retrogradation. Food Chem. 71:9-36.
Keetels, C. J. A. M., Oostergetel, G. T., and van Vliet, T. 1996. Recrystallization of
amylopectin in concentrated starch gels. Carbohydr. Polym. 30: 61-64.
Kim, I.-H., Yeh, A., Zhao, B. L., and Wang, S. S. 1989. Gelatinization kinetics of starch
by using Raman spectroscopy. Biotechnol. Prog. 5:172-174.
79
Kim, J.-O., Kim, W.-S., and Shin, M.-S. 1997. A comparative study on retrogradation of
rice starch gels by DSC, X-ray and alpha-amylase methods. Starch/Starke 49:71-
75.
Lai, V. M-.F., Lu, S., and Lii, C.-Y. 2000. Molecular characteristics influencing
retrogradation of rice amylopectins. Cereal Chem. 77:272-278.
Nara, S., Mori, A., and Komiya, T. 1978. Study on relative crystallinity of moist potato
starch. Starch/Starke 30:111-114.
Ratnayke, W. S., and Jackson, D. S. 2008. Thermal behavior of resistant starches RS 2,
RS 3, and RS 4. J. Food Sci. 73:C356-C366.
Ribotta, P. D., Cuffini, S., León, A. E., and Añón, M. C. 2004. The staling of bread: an
X-ray diffraction study. Eur. Food. Res. Technol. 218:219-223.
Satin, M. 2000. Functional Properties of Starches. FAO Agriculture and Consumer
Protection Department: Rome. Available online at:
http://www.fao.org/ag/magazine/pdf/starches.pdf
Zeleznak, K. J. and Hoseney, R. C. 1986. The role of water in the retrogradation of
wheat starch gels and bread crumb. Cereal Chem. 63:407-411.
Zobel, H. F., and Kulp, K. 1996. The Staling Mechanism. Pages 1-64 in: Baked Goods
Freshness: Technology, Evaluation, and Inhibition of Staling. R. E. Hebeda and
H. F. Zobel, eds. Marcel Dekker: New York.
80
SUMMARY Raman spectroscopy may able to offer an avenue of rapid, non-destructive testing
for determining certain quality attributes of starch like amylose-amylopectin ratios of
starch. The amylose content of normal/waxy corn starch mixtures was determined using
a dual wavelength colorimetric iodine binding method. Partial least-squares regression
was used to develop calibration models for measuring amylose content based on the
reference data and using Raman spectroscopy. Truncating the spectral region to 2000 to
250 cm-1
improved the model results (r2 of validation = 0.831 for a 7-factor PLS model,
SEP = 2.90%). Excluding a cold water swelling starch from the calibration data
improved the model results marginally (r2 of validation = 0.860 for a 5-factor full region
PLS model, SEP = 2.70%). The study found that dispersive Raman spectroscopy may
not be suited for all purposes of estimating amylose-amylopectin ratios of corn starches;
however, the method was easily capable of discriminating between waxy and normal
starches, giving it the potential to be used in applications like screening to confirm the
identity of starch shipments. Raman spectroscopy’s ability to monitor starch
retrogradation was also examined.
Though many methods exist for measuring starch retrogradation in food products,
few methods could offer the portability and non-destructive capabilities of which Raman
spectroscopy is capable. Starch gels were prepared and measured using dispersive
Raman spectroscopy. Also, the relative crystallinity of starch gels was measured using
X-ray diffraction and calculated using two different methods, and the results were
correlated with intensity changes of the Raman band at 480 cm-1
calculated using three
81
different methods. But, no correlation was observed (r2 < .1). The overall noise level of
the spectral data and the low concentration of starch used per gel (10% w/v) were
implicated as possible causes of the unpredictability of the results seen in both the
reference data and the Raman spectral data. Future work should include monitoring
starch gels with higher concentration over a longer time period, testing the assumption
that starch gels held under similar conditions will retrograde at a relatively uniform rate,
followed by extension of any successful method for measuring retrogradation in starch
gels to measuring retrogradation in a model food system like white pan bread. The study
concluded that applying Raman spectroscopy to measuring starch retrogradation in low
concentration starch gels could be problematic.
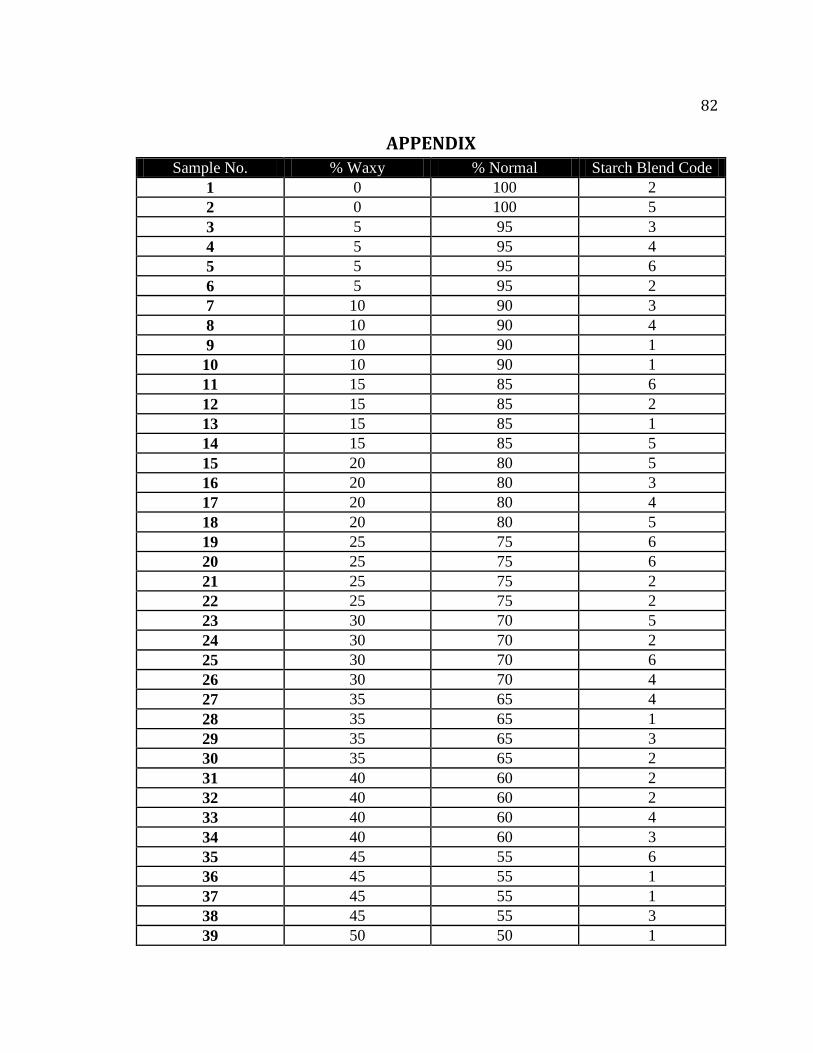
82
APPENDIX
Sample No. % Waxy % Normal Starch Blend Code
1 0 100 2
2 0 100 5
3 5 95 3
4 5 95 4
5 5 95 6
6 5 95 2
7 10 90 3
8 10 90 4
9 10 90 1
10 10 90 1
11 15 85 6
12 15 85 2
13 15 85 1
14 15 85 5
15 20 80 5
16 20 80 3
17 20 80 4
18 20 80 5
19 25 75 6
20 25 75 6
21 25 75 2
22 25 75 2
23 30 70 5
24 30 70 2
25 30 70 6
26 30 70 4
27 35 65 4
28 35 65 1
29 35 65 3
30 35 65 2
31 40 60 2
32 40 60 2
33 40 60 4
34 40 60 3
35 45 55 6
36 45 55 1
37 45 55 1
38 45 55 3
39 50 50 1
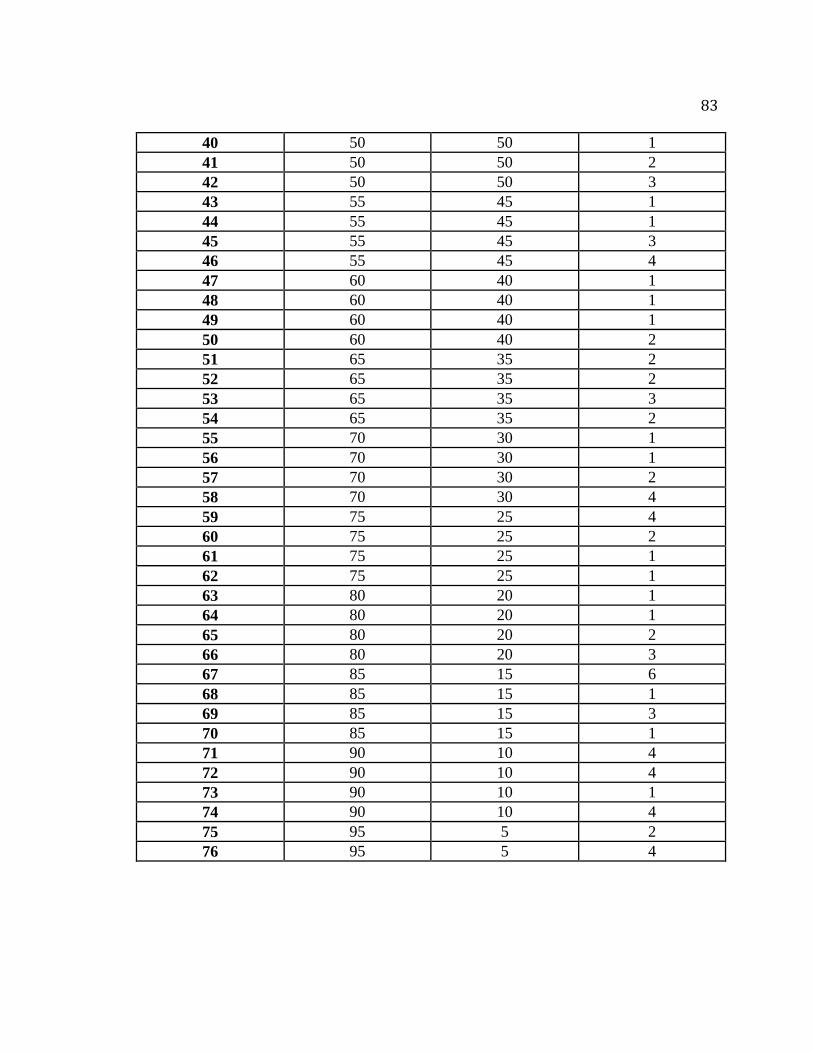
83
40 50 50 1
41 50 50 2
42 50 50 3
43 55 45 1
44 55 45 1
45 55 45 3
46 55 45 4
47 60 40 1
48 60 40 1
49 60 40 1
50 60 40 2
51 65 35 2
52 65 35 2
53 65 35 3
54 65 35 2
55 70 30 1
56 70 30 1
57 70 30 2
58 70 30 4
59 75 25 4
60 75 25 2
61 75 25 1
62 75 25 1
63 80 20 1
64 80 20 1
65 80 20 2
66 80 20 3
67 85 15 6
68 85 15 1
69 85 15 3
70 85 15 1
71 90 10 4
72 90 10 4
73 90 10 1
74 90 10 4
75 95 5 2
76 95 5 4
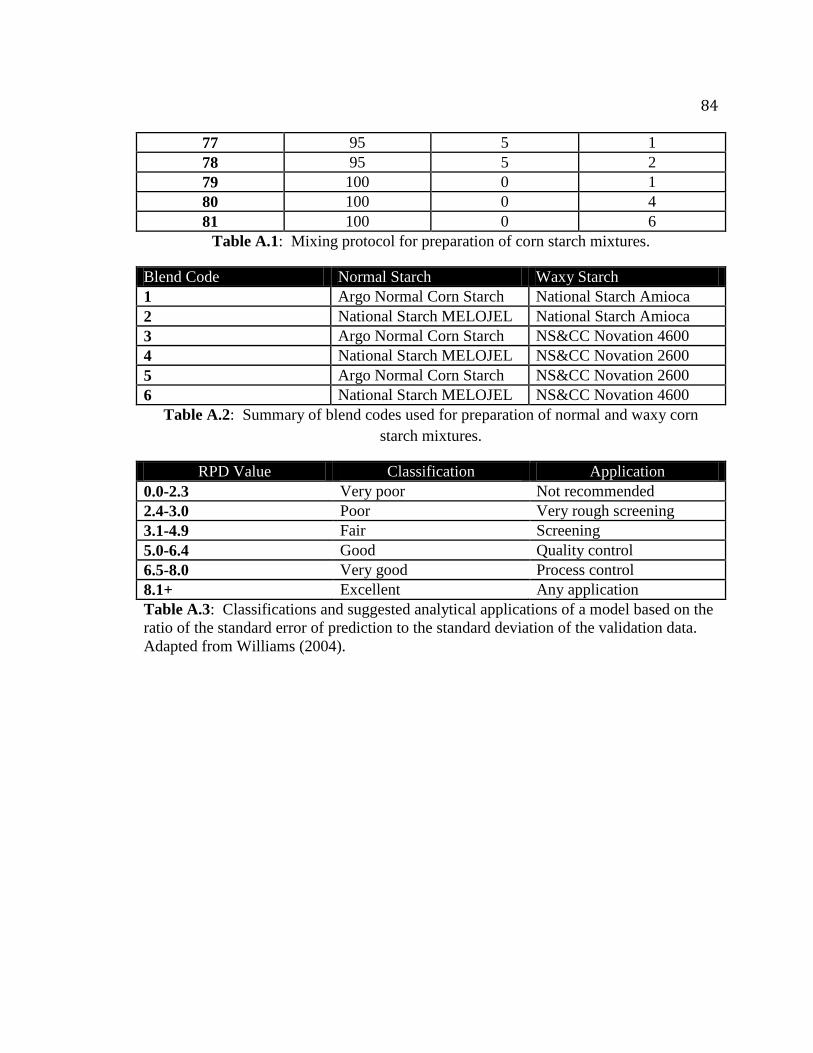
84
77 95 5 1
78 95 5 2
79 100 0 1
80 100 0 4
81 100 0 6
Table A.1: Mixing protocol for preparation of corn starch mixtures.
Blend Code Normal Starch Waxy Starch
1 Argo Normal Corn Starch National Starch Amioca
2 National Starch MELOJEL National Starch Amioca
3 Argo Normal Corn Starch NS&CC Novation 4600
4 National Starch MELOJEL NS&CC Novation 2600
5 Argo Normal Corn Starch NS&CC Novation 2600
6 National Starch MELOJEL NS&CC Novation 4600
Table A.2: Summary of blend codes used for preparation of normal and waxy corn
starch mixtures.
RPD Value Classification Application
0.0-2.3 Very poor Not recommended
2.4-3.0 Poor Very rough screening
3.1-4.9 Fair Screening
5.0-6.4 Good Quality control
6.5-8.0 Very good Process control
8.1+ Excellent Any application
Table A.3: Classifications and suggested analytical applications of a model based on the
ratio of the standard error of prediction to the standard deviation of the validation data.
Adapted from Williams (2004).