Embed Size (px)
Citation preview

Prepared in cooperation with FALLON PAIUTE-SHOSHONE TRIBE
Characterization of Surface-Water Quality in the S-Line Canal and Potential Geochemical Reactions from Storage of Surface Water in the Basalt Aquifer near Fallon, Nevada
U.S. Department of the InteriorU.S. Geological Survey
Scientific Investigations Report 2005–5102

COVER: View looking north of the top of Rattlesnake Hill. Photograph taken by Douglas K. Maurer, 2001.

Characterization of Surface-Water Quality in the S-Line Canal and Potential Geochemical Reactions from Storage of Surface Water in the Basalt Aquifer near Fallon, Nevada
By Alan H. Welch, Douglas K. Maurer, Michael S. Lico, and John K. McCormack
Prepared in cooperation with the FALLON PAIUTE-SHOSHONE TRIBE
Scientific Investigations Report 2005–5102
U.S. Department of the InteriorU.S. Geological Survey

U.S. Department of the InteriorGale A. Norton, Secretary
U.S. Geological SurveyP. Patrick Leahy, Acting Director
U.S. Geological Survey, Carson City, Nevada: 2005
For sale by U.S. Geological Survey, Information Services Box 25286, Denver Federal Center Denver, CO 80225
For more information about the USGS and its products: Telephone: 1-888-ASK-USGS World Wide Web: http://www.usgs.gov/
Any use of trade, product, or firm names in this publication is for descriptive purposes only and does not imply endorsement by the U.S. Government.
Although this report is in the public domain, permission must be secured from the individual copyright owners to reproduce any copyrighted materials contained within this report.
For additional information contact:
DirectorUSGS, Nevada Water Science Center333 W. Nye Lane, Room 203Carson City, NV 89706-0866
email: [email protected]
http://nevada. usgs.gov

iii
Contents
Abstract .......................................................................................................................................................... 1
Introduction ................................................................................................................................................... 1
Purpose and Scope ............................................................................................................................. 5
Acknowledgments ............................................................................................................................... 5
Methods Used ............................................................................................................................................... 5
Water Sampling Methods................................................................................................................... 5
Geochemical and Mineralogic Analytical Methods ...................................................................... 5
Physical Setting ............................................................................................................................................ 6
Hydrogeologic Setting ........................................................................................................................ 6
Recent Geologic History ............................................................................................................ 6
Description of Aquifers .............................................................................................................. 7
Chemistry and Mineralogy of the Basalt Aquifer ......................................................................... 12
Characterization of Surface Water in the S-Line Canal ....................................................................... 15
Geochemical Modeling of Recharge....................................................................................................... 18
Modeling Approach........................................................................................................................... 18
Model Scenarios and Limitations ................................................................................................... 20
Model Results..................................................................................................................................... 22
Summary and Conclusions........................................................................................................................ 25
References Cited ........................................................................................................................................ 25
Appendixes .................................................................................................................................................. 29
Figures
Figure 1. Map showing geographic features of Carson Desert hydrographic area and Carson River basin....................................................................................................................... 2
Figure 2. Map showing geographic features of Lahontan Valley and location of irrigated land, phreatophytes, and discharging playas. ........................................................................ 3
Figure 3. Map showing lateral extent of basalt aquifer and location of wells drilled into basalt aquifer................................................................................................................................ 4
Figure 4. Oblique view of basalt aquifer, looking toward northeast. .................................................... 8
Figure 5. Photograph showing scoriaceous cinders near the top of Rattlesnake Hill. .................... 9
Figure 6. Photograph showing vesicular basalt flows on the southern flank of Rattlesnake Hill .......................................................................................................................... 10
Figure 7. Photograph showing fractured, vesicular basalt from well DB-1 recovered froma depth of 441–442 ft below land surface. ............................................................................ 11
Figure 8. Optical microscope micrograph of Type 1 basalt from well DB-1 at 545 ft with crossed polarizers and uncrossed polarizers....................................................................... 13
Figure 9. Optical microscope micrograph of Type 2 basalt from well DB-1 at 441 ft withcrossed polarizers and uncrossed polarizers....................................................................... 14
Figure 10. Scanning electron microscope micrograph of vug-filling material from well DB-1 at a depth of 625 ft showing phillipsite........................................................................ 15

iv
TablesTable 1. Bulk chemical composition of the basalt aquifer encountered at test hole DB-1 ........ 12Table 2. Concentration of elements released from basalt rock samples following:
A. Cation exchange using ammonium chloride ................................................................. 17 B. Anion exchange using potassium nitrate ...................................................................... 17
C. Extraction of carbonate minerals by sodium acetate and acetic acid. .................... 17 D. Extraction of iron and manganese oxides by hydroxylamine hydrochloride and
acetic acid 17Table 3. Mean bulk density and porosity of basalt samples ............................................................ 19Table 4. Surface complexation constants for carbonate adsorption on ferrihydrite .................. 19Table 5. Initial conditions and reactions used for geochemical modeling of injection
and infiltration of surface water and its subsequent recovery. ....................................... 21
Figure 11. Scanning electron microscope micrograph of vug-filling material from well B-7 at a depth of 72 ft showing dolomite rhomboids above phillipsite rhomboids and phillipsite prisms on surface of adularia ........................................................................ 16
Figure 12. Graph showing arsenic and dissolved organic carbon concentrations in S-Line Canal and mean daily flow in the Carson River below Lahontan Reservoir ................... 19
Figure 13. Graphs showing results of geochemical simulation of injection well model of recharge into the basalt aquifer ............................................................................................ 23
Figure 14. Graphs showing results of geochemical simulation of basin-infiltration model of recharge into the basalt aquifer ........................................................................................... 24

v
Conversion Factors and Datums
Multiply By To obtain
Lengthinch (in.) 2.54 centimeter (cm)
foot (ft) 0.3048 meter (m)mile (mi)
liter
square foot per pound (ft2/lb)
1.609
33.82
0.00278
kilometer (km)
ounce
square meters per gram (cm2/g)Flow rate
acre-foot per year (acre-ft/yr) 1,233 cubic meter per year (m3/yr)foot per year (ft/yr) 0.3048 meter per year (m/yr)
cubic foot per second (ft3/s) 0.02832 cubic meter per second (m3/s)
Water quality and other units used in this report: g/µg gram per microgram mg/kg milligram per kilogram g/cm3 gram per cubic centimeter mg/L milligram per liter g/mol gram per mol mol/mol mole per mole
g/L gram per liter mol/L mole per liter µm micrometer mm millimeter
µg/L microgram per liter nm nanometer µS/cm microsiemens per centimeter at 25°C pCi/L picocuries per liter mg/g milligram per gram
Temperature in degrees Celsius (°C) may be converted to degrees Fahrenheit (°F) as follows:
°F=(1.8×°C)+32
Temperature in degrees Fahrenheit (°F) may be converted to degrees Celsius (°C) as follows:
°C=(°F-32)/1.8
In this report, “sea level” refers to the National Geodetic Vertical Datum of 1929 (NGVD of 1929, formerly called “Sea-Level Datum of 1929”), which is derived from a general adjustment of the first-order leveling networks of the United States and Canada.

vi

AbstractThe Fallon basalt aquifer serves as the sole source of
municipal water supply for the Lahontan Valley in west- central Nevada. Principal users include the City of Fallon, Naval Air Station Fallon, and the Fallon Paiute-Shoshone Tribe. Pumpage from the aquifer increased from about 1,700 acre-feet per year in the early 1970’s to more than 3,000 acre-feet per year in the late 1990’s, and has been accompanied by declines in water levels and changes in water quality. Storage of surface water in the basalt may mitigate the effects of pumpage, but may cause undesirable changes in water chemistry. In May 2001, the U.S. Geological Survey began a study, in cooperation with the Fallon Paiute-Shoshone Tribe, to characterize the surface-water quality of the S-Line Canal, a likely source of water for augmenting recharge. Because arsenic concentrations in ground water of the basalt aquifer exceed drinking water standards, the potential for arsenic release to artificial recharge was explored by using geochemical modeling. Model results suggest that arsenic release may increase concentrations to levels that could limit the use of artificial recharge. Field-based experiments are needed to evaluate the underlying model assumptions.
IntroductionA basalt aquifer near Fallon, Nevada, in the Carson
Desert Hydrographic Area, is the sole source of water for municipal supply to the City of Fallon, Naval Air Station Fallon, and the Fallon Paiute-Shoshone Tribe (fig. 1). The Carson Desert is the terminus of the Carson River and also receives surface-water flow from the Truckee River through the Truckee Canal (fig. 1). The basalt that forms the basalt aquifer crops out at Rattlesnake Hill, an eroded volcanic cone, about a mile northeast of Fallon. The water-producing part of the basalt is buried beneath sediments deposited by the Carson River and ancient Lake Lahontan to depths of 600 feet near its
edges (figs. 2 and 3). In three dimensions, the basalt is a mush-room-shaped body of highly permeable volcanic rock. Viewed from above the aquifer is oval-shaped, about 4 miles wide and 10 miles long (fig. 3).
Pumpage from the basalt aquifer increased from about 1,700 acre-ft/yr in the early 1970’s to over 3,000 acre-ft/yr in the late 1990’s, causing water levels in the aquifer to decline as much as 12 ft over the same time period (Maurer and Welch, 2001, p. 30). Increased pumpage also is thought to have caused changes in water quality; Maurer and Welch (2001) reported the concentration of dissolved chloride in water pumped from the basalt by Navy and City of Fallon wells has increased from the 1970’s to the late 1990’s. Although chlo-ride concentrations are still below the drinking-water standard of 250 mg/L, these changes have caused concern over the continued viability of the basalt aquifer as a source of water as development in the area continues. Concentrations of arsenic in the aquifer are about 0.1 mg/L, exceeding the drinking-water standard of 0.01 mg/L (Federal Register, 2001). Arsenic concentrations apparently did not change between the early 1970’s and the late 1990’s, although changes in analytical and sampling methods could mask actual changes (Maurer and Welch, 2001, p. 10 and 48).
Declining water levels and changing water quality might be mitigated by storing treated surface water in the basalt aquifer for subsequent use. Treated surface water could be injected directly into the basalt aquifer or infiltrated through surface ponds on Rattlesnake Hill. The combined use of ground-water and surface-water resources often is called conjunctive use, and potentially could slow ground-water level declines and decrease chloride and arsenic concentrations. However, study is needed to evaluate the potential for arsenic release from the basaltic rock to the recharged water.
With this objective in mind, in April 2001, the U.S. Geological Survey (USGS), in cooperation with the Fallon Paiute-Shoshone Tribe, began a study to characterize the water quality of the S-Line Canal near Rattlesnake Hill (fig. 3), a likely source for surface water, and to determine the potential for this water to cause arsenic release from the basalt.
Characterization of Surface-Water Quality in the S-Line Canal and Potential Geochemical Reactions from Storage of Surface Water in the Basalt Aquifer near Fallon, Nevada
By Alan H. Welch, Douglas K. Maurer, Michael S. Lico, and John K. McCormack

���������������
���������
����������
������������
������
������������
����������
����
������
���
��������
���
����
������
����������
�������������
������
����
��
�����
�����������
�����������������
�������������
���
���
����������
�
���
�
����
����
����
��������������������
�������������
����������������������������������
�������
�����������������
���������
����
������������
����������
����������
������
�����������������
�� �
� � ��
��
��
�
� ��������
� �������������
�����������
�������
�����
���
����
�
���
��
���
���
����
��
����
��
���
�
����
�����
�����
���
��
������������������������������
������������������������������
�����������
��
��
��
��
����
��
��
���������������������������
���������������
���������
����������
������
�����
�����������
�������������
����������
���������������
��������������
Figure 1. Geographic features of Carson Desert hydrographic area and Carson River basin.
2 Characterization of Surface-Water Quality and Potential Geochemical Reactions from Storage of Surface Water
NASFallon
4,000
4,000
4,000
4,000
4,000
5,000
5,000
5,000
4,000
4,000
5,000
4,200
4,200
4,200
Roads and hydrology from U.S. Geological Survey digital data,1:100,000, 1979-80. Hypsography and water bodies fromU.S. Geological Survey digital data, 1:250,000, 1971Universal Transverse Mercator Projection, Zone 11
0 10 MILES5
0 10 KILOMETERS5
STILLWATER
RANGE
5,000
5,000
STILLWATERWILDLIFE
MANAGEMENTAREA
CarsonLake
Stillwater
HOTSPRINGSMOUNTAINS
LAHONTAN
MOUNTAINS
BUNEJUGMOUNTAINS
L A H ON T A N
UPSALHOGBACK
RATTLESNAKEHILL
SodaLake
StillwaterPoint
Reservoir
River
MARSH
STIL
LWATE
RS ALT
WELLS
BASIN
WH ITE THRONEMOUNTA INS
Salt WellsSalt Wells
Fallon
Stillwater
HOTSPRINGSMOUNTAINS
LAHONTAN
MOUNTAINS
BUNEJUGMOUNTAINS
L A H ON T A N
UPSALHOGBACK
RATTLESNAKEHILL
SodaLake
Carson
River
StillwaterPoint
Reservoir
River
MARSH
STIL
LWATE
RS ALT
WELLS
BASIN
WH ITE THRONEMOUNTA INS
CarsonLake
Salt Wells
CARSON SINKCARSON SINK
Lyon Co
119°00' 118°45' 118°30'
39°45'
39°30'
39°15'
R. 27 E. R. 28 E. R. 29 E. R. 30 E. R. 31 E. R. 32 E.
T.22N.
T.21N.
T.20N.
T.19N.
T.18N.
T.17N.
T.16N.
Fallon
Carson
River
NASFallon
STILLWATERWILDLIFE
MANAGEMENTAREA
EXPLANATION
Discharging playa—From Glancy and Katzer (1975, pl. 1)
Phreatophytes—From Glancy and Katzer (1975, pl. 1)
Irrigated land, 1984-90—From Bureau of Reclamationdigital data (Charles Johnson, Bureau of Reclamation,1993)
Hydrographic-area boundary—From Rush (1968)
Topographic contour—Shows altitude of land surface.Contour interval, 1,000 feet, with supplemental contourat 4,200 feet. Datum is sea level
Wetlands
4,200
5,000
4,000
Churchill CoChurchill CoChurchill Co
4,0004,00042
95
50
50
50
95
SouthBranch
V A LL EY
V A LL EY
Carso
n
Carso
n
SouthBranch
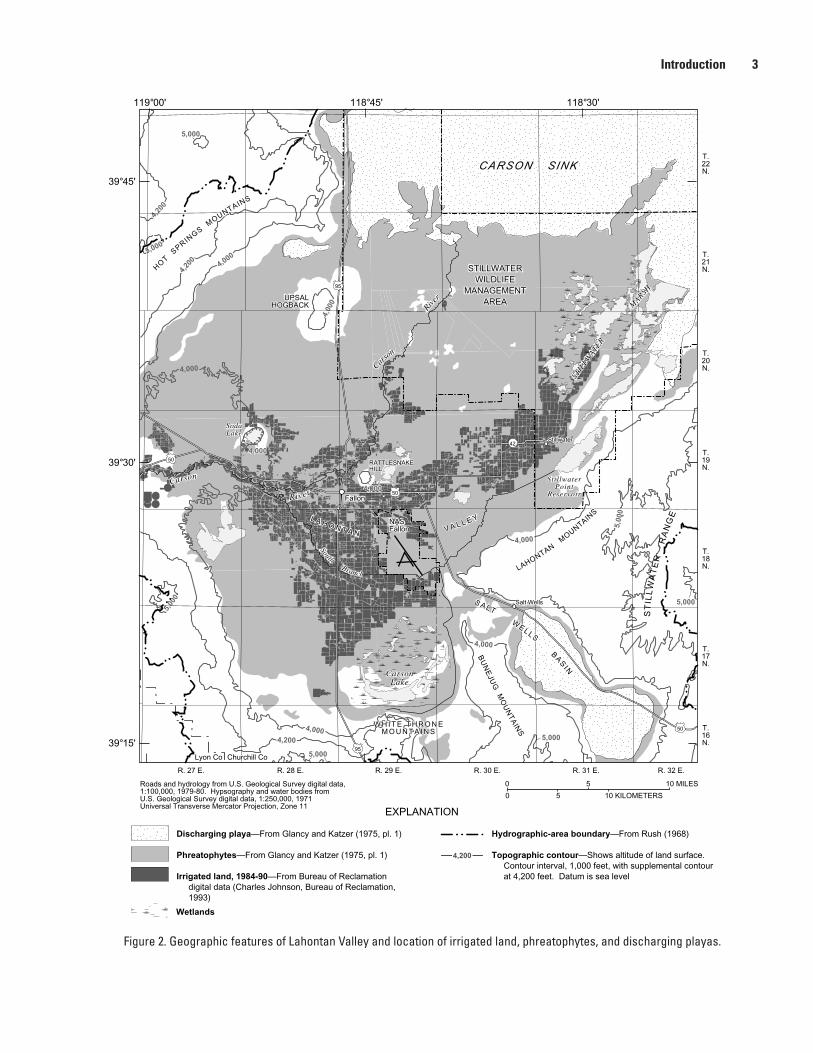
Figure 2. Geographic features of Lahontan Valley and location of irrigated land, phreatophytes, and discharging playas.
Introduction 3

NAS, Fallon
A-Line
Canal
HarmonReservoir
Harmon Drain
OlesPond
Fallon
L A H ON T A N V A LL E
Y
RATTLESNAKEHILL
Car
son
Indi
anLa
kes
Dia
gona
l Can
al
50
50
95
95
Fallon
L A H ON T A N V A LL E
Y
RATTLESNAKEHILL
S-LineReservoirS-LineReservoir
OlesPond
S-Line Canal
Schottner
Dra
in
Indi
anLa
kes
Dia
gona
l Can
al
Naval Air StationFallon
S-5
Can
alWade Dra
in
S-Line Canal
L-LineCanal
Carson
Riv
er
3 KILOMETERS0
3 MILES0
EXPLANATION
Roads and hydrology from U.S. Geological Survey digital data, 1:100,000, 1979-80Universal Transverse Mercator Projection, Zone 11Water bodies from U.S. Geological Survey digital data, 1:250,000, 1971Political boundaries and canal names from U.S. Geological Survey, 1:24,000, 1969-87;1:100,000, 1979-80
B-3Well location and well number
Sampling site on S-Line Canal
Approximate extent of basalt at depth of 600 feetbelow land surface—From Glancy (1986)
R28E R29E R30E
T19N
T18N
T20N
118°50'
39°34'
39°30'
39°26'
118°45' 118°40'
B-3B-3
DB-2
DB-3
DB-1
Figure 3. Lateral extent of basalt aquifer and location of wells drilled into basalt aquifer.
4 Characterization of Surface-Water Quality and Potential Geochemical Reactions from Storage of Surface Water
Purpose and Scope
The purpose of this report is to present results of water-quality analyses of surface water in the S-Line Canal near Rattlesnake Hill and geochemical analyses of samples of basaltic rock and associated coatings. Results of modeling potential geochemical reactions within the basalt aquifer dur-ing recharge also are presented. Nine samples of surface water were obtained from the S-Line Canal from May 2001 through October 2002 and analyzed for major ions, trace metals, nutrients, radioactive constituents, dissolved and total organic carbon, pesticides and polychlorinated biphenyls, dissolved and total mercury, and selected wastewater indicators. Five samples of basaltic rock collected from surface outcrops on Rattlesnake Hill and from cores taken during drilling of the basalt were analyzed for the chemical composition of minerals making up the basalt, and of coatings on fractures and within vesicles of the basalt. Basalt samples also were subjected to chemical extractions to evaluate the cation and anion exchange capacity and the composition of carbonate and iron oxide. Results of the water-quality and rock analyses were used to simulate geochemical reactions that could affect arsenic con-centrations using the computer program PHREEQC (Parkhurst and Appelo, 1999).
AcknowledgmentsThe authors thank Blair Jones and Daniel Webster,
USGS, Reston, Virginia, for their X-ray diffraction work; Paul Lechler, University of Nevada, Reno, for whole-rock analyses; Rikkert Vos, BC Research Inc., Vancouver, British Columbia, Canada, for chemical extractions; and Lawrence Feinson, USGS, for simulations using PHREEQC. Richard Sanzalone, USGS, provided valuable insight into the use and interpreta-tion of chemical extractions. Keith Halford, USGS, provided spreadsheet assistance.
Methods Used
Water Sampling Methods
Water samples were collected from S-Line Canal (fig. 3) during 2000–2002 (site 1031221902 in Berris and others, 2003). Samples were collected monthly or bimonthly when the canal was flowing, typically from April-May to about Octo-ber (see Appendix 1). Water samples were obtained using the equal-width-increment method described by Wilde and Radtke (1998). A DH-81 handheld sampler fitted with a Teflon nozzle and a 1-L bottle was used to obtain water at each vertical in the cross section and these samples were composited into 3-L Teflon bottles. The samples were split into subsamples using an all-Teflon cone splitter described by Capel and Larson (1996). Each subsample was treated with the appropriate preservation method as outlined by Wilde and Radtke (1998). Sample processing was done using techniques described by
Wilde and Radtke (1998). Specific conductance and pH were measured on a split of the raw sample. Alkalinity was deter-mined in the field using incremental titration with sulfuric acid on an aliquot of filtered water. Dissolved oxygen and tempera-ture were measured directly in the canal.
Ground-water samples were collected from well B-3 (fig. 3; Appendix 1) located near a potential recharge basin on the eastern flank of Rattlesnake Hill. Well B-3 is a 71-ft deep, 2-in. PVC, monitoring well. The well is screened just below the water table. The basalt aquifer is encountered at 32 ft below land surface at the well, and accordingly, the water quality at well B-3 is believed to be representative of the water beneath the site of a potential recharge basin.
Ground-water samples were collected and processed following protocols described by Wilde and Radtke (1998). Before water samples were collected, the water level in the well was measured, the well was purged of at least three well-bore volumes of water, and field parameters (pH, specific con-ductance, temperature, and dissolved oxygen) were measured in a flow-through chamber until they were stable (Wilde and Radtke, 1998). An all stainless steel and Teflon pump system was used to obtain water samples from wells. Water samples that required filtration were filtered with in-line 0.45-µm pore-size capsule filters. Whole-water samples were filled directly from the discharge line of the pump. Water samples were preserved following methods outlined in Wilde and Radtke (1998). Alkalinity was determined in the field using incremen-tal titration with sulfuric acid on an aliquot of filtered sample.
Geochemical and Mineralogic Analytical Methods
Water samples were analyzed at the USGS National Water Quality Laboratory in Lakewood, Colorado and the USGS Stable Isotope Laboratory in Reston, Virginia. Major cations and most trace elements were analyzed using induc-tively coupled plasma mass spectrometry (Fishman, 1993; Fishman and Friedman, 1989; Garbarino, 1999; Struzeski and others, 1996). Arsenic and selenium were analyzed by graphite furnace atomic absorption spectrometry as described by Jones and Garbarino (1999). Nutrient species were analyzed by the methods described in Fishman (1993), Fishman and Friedman (1989), and Patton and Truitt (2000). Pesticides were extracted from the water samples with C-18 solid-phase extraction and analyzed using capillary-column gas chromatography with mass spectrometry (Madsen and others, 2003; Zaugg and others, 1995). Wastewater indicators were analyzed by poly-styrene-divinylbenzene solid-phase extraction and capillary-column gas chromatography with mass spectrometry (Zaugg and others, 2002). The stable isotopes of water were deter-mined using methods described by Coplen and others (1991) for hydrogen and those described by Epstein and Mayeda (1953) for oxygen. Gross alpha and beta radioactivity were determined using alpha and beta counting methods described in Thatcher and others (1977).
Methods Used 5
The mineralogy of the basalt and coatings were deter-mined by X-ray diffraction by Daniel Webster, USGS, Reston, Virginia, and by optical microscopy. Basalt samples and vug-filling material were examined by SEM/EDS (scanning electron microscopy/energy dispersive spectrometry) using a JEOL model 840A with KEVEX EDS/imaging programming. The EDS is capable of qualitative identification of elements having an atomic weight of 12 or greater. Samples were air-dried, mounted on metal tabs, and coated with a thin layer of gold. Images can be taken simultaneously with EDS analyses. Whole rock analyses of cuttings retrieved during drilling of test hole DB-3 (fig. 3) were made under the supervision of Paul Lechler, Nevada Bureau of Mines and Geology, using X-ray fluorescence. Results of the mineralogical examination expand on the work of Lico and Seiler (1994), who provide a description of the mineralogy of cuttings from a well owned by the Fallon Paiute-Shoshone Tribe on the west side of Rattlesnake Hill (fig. 3).
Chemical extraction methods, which also are known as partial solution techniques, have been developed to obtain information about the chemistry of heterogeneous earth mate-rials, such as rocks and soils. Under ideal conditions, sequen-tial extractions can provide information on the association of elements with various minerals within a rock or soil. Reac-tions involving exchangeable ions, carbonate minerals, and iron oxide are of particular concern in the Fallon area because of potential release of arsenic from rocks and soils into the ground water. Commonly, extraction solutions are applied in order from the least to most chemically aggressive. For instance, a sequence of extractions could attempt to determine solutes that are progressively released by exchange, followed by dissolution of carbonate minerals, organic material, and sulfide minerals. Extractions for organic material and sulfide minerals were not used in this study.
Basalt obtained by drilling and the surface samples taken from rock outcrops were selected for sequential extrac-tion using the methods of Sumner and Miller (1996) and Tessier and others (1979). The extractions were performed in duplicate on samples weighing about 50 g. The samples were approximately ¾-in. by ¾-in. pieces of drill core or outcrop and were not crushed prior to extraction. This size was selected to approximate the actual rock surface area of vesicular and fractured basalt within the aquifer. Details of the analytical steps are presented in Appendix 3.
Physical SettingCarson River water and diversions from the Truckee
River are stored in Lahontan Reservoir and used to irrigate about 56,000 acres of land in Lahontan Valley, the name com-monly applied to the irrigated part of the Carson Desert (fig. 2; Maurer and Welch, 1996, p. 4). Irrigated lands form the Car-son Division of the Newlands Project, constructed from 1902 to 1915. Canals provide water to agricultural land, including
the S-Line and L-Line Canals that flow south and east of Rattlesnake Hill (fig. 3). Surface water not used for irrigation drains north to the Carson Sink, northeast to wetlands of the Stillwater Marsh, and south to the Carson Lake wetlands (fig. 2).
Alfalfa is the main irrigated crop in the valley along with pasture, other forage crops, and some cereal and vegetable crops. Cottonwood is abundant near homes and ranches in the irrigated part of the valley, willows line many of the canals, and cattails are present in many drains. Except for the Carson Sink, which is largely barren, non-irrigated areas are sparsely vegetated with greasewood, rabbitbrush, saltgrass, and marsh grasses.
The city of Fallon is the major and growing population center in the area. The population of Fallon has increased from about 3,000 in the early 1970’s (Glancy, 1986, p. 27) to 8,800 in 2000 with about 15,000 additional people living in the sur-rounding unincorporated parts of the county (http://factfinder.census.gov). Agriculture is a major economic base in the area, along with employment at the Naval Air Station Fallon.
The floor of Lahontan Valley is a relatively flat plain, sloping from about 3,960 ft above sea level near Fallon to about 3,870 ft near the Carson Sink (fig. 2). Several low-lying mountain ranges rising to about 5,500 ft in altitude surround the valley on the north, south, and west. The Stillwater Range, rising to 8,800 ft in altitude, bounds the valley on the east. Lahontan Valley is in the rain shadow of the Sierra Nevada and received an average 5.3 in. of annual precipitation from 1960 to 1991 (Owenby and Ezell, 1992, p. 15). Summer tem-peratures reach an average maximum of about 90oF in July and August, and average minimum temperatures are about 18oF in December and January (Owenby and Ezell, 1992, p. 11). Open-water evaporation is about 5 ft/yr (Bureau of Reclama-tion, 1987, p. 1–7).
Hydrogeologic Setting
Recent Geologic History
During the Pleistocene Epoch [about two million years before present (Ma) to ten thousand years before present (ka)], lakes formed in the Carson Desert, expanded, and shrank to complete dryness several times under the influence of chang-ing glacial climates (Axelrod, 1956; Morrison, 1964). During high stands, the lakes coalesced to form ancient Lake Lahon-tan having a depth of more than 500 ft near Fallon (Davis, 1978, p. 2; Morrison, 1991, p. 288). High stands of Lake Lahontan were from 1.2 Ma to 850 ka, 650 to 600 ka, 400 to 130 ka, and 25 to 10 ka (Benson, 1991; Benson and others, 1990, p. 241). During high stands of Lake Lahontan, thick clay beds were deposited in the deeper parts of Lake Lahontan, deltas were formed on the western side of the valley where the Carson River entered the lake, and sand and gravel beaches
6 Characterization of Surface-Water Quality and Potential Geochemical Reactions from Storage of Surface Water
and bars were formed by wave action along the shorelines (Morrison, 1964, p. 28–71). During interglacial periods when Lake Lahontan was dry, large sand-dune and sand-sheet complexes covered much of the valley floor and the Carson River meandered across the valley floor forming river channels which are now buried. As lake levels rose and fell, these depo-sitional environments moved back and forth across the valley floor, creating a complex mixture of Quaternary sediments, locally reaching a thickness greater than 2,500 ft (Maurer and Welch, 1996, p. 11).
Also during the Pleistocene Epoch, isolated volcanic activity produced Rattlesnake Hill, an eroded volcanic cone about 1 mi in diameter and about 200 ft high with a shal-low crater at the center (Morrison, 1964, p. 23). The cone was formed by repeated basalt flows, issuing radially from Rattlesnake Hill for 2 to 7 mi. (fig. 2) to produce the mush-room-shape basalt aquifer described by Glancy (1986, p. 14). A sample of the basalt from the high point of Rattlesnake Hill was dated by whole-rock potassium-argon analysis to be 1.03 ± 0.05 Ma (Evans, 1980, p. 20), and argon-argon dates from the upper surface of the basalt near its western and southern extent range from 2.5 ± 0.3 Ma to 1.3 ± 0.2 Ma (Maurer and Welch, 2001, p. 16). Stratigraphic evidence shows that the basalt is older than the early high stands of Lake Lahontan (Morrison, 1964, p. 23) which indicates that the basalt was present during the entire history of Lake Lahontan.
Holocene Epoch deposits in the Carson Desert (less than 10 ka) are eolian, alluvial, fluvial, deltaic, and shallow-lake sediments deposited after the last high stand of Lake Lahon-tan. An extremely dry, windy period followed the last high lake stand from 7 to 4 ka, and shallow lakes were formed in the Carson Desert during the last 5 to 4 ka (Davis, 1978; Mor-rison, 1964, p. 8). The last of the shallow lakes dried up just before non-native Americans entered the area in the 1800’s (Davis, 1978, p. 8).
Description of Aquifers
The basalt aquifer was first described in detail by Glancy (1986), who also defined three basin-fill aquifers that enve-lope the basalt. Glancy (1986, p. 41) defined a shallow aquifer extending from the water table, generally 5 to 10 ft below land surface, to a depth of 50 ft below land surface. Below the shallow aquifer, an intermediate aquifer extends to depths of 500 to 1,000 ft, the approximate range of sediments bearing fresh water near the basalt aquifer (Glancy, 1986, p. 51). The intermediate aquifer contains fresh water beneath much of the southern Carson Desert. A deep aquifer extends beneath the intermediate aquifer to depths of several thousand feet, and is thought to be mainly non-potable because of a high dissolved-solids content (Glancy, 1986, p. 51 and 60).
Glancy (1986) delineated the extent of the basalt aquifer using lithologic descriptions from driller’s logs and surface electrical resistivity soundings. He described it as an asymmet-rical, mushroom-shaped body of basalt exposed at Rattlesnake Hill with the bulk of the basalt enveloped by the sedimentary aquifers (Glancy, 1986, p. 13–14). Drillers' logs show the basalt is 400–600 ft below land surface near its southwestern extent about 2 mi southwest of Rattlesnake Hill, and about 200–300 ft below land surface near its northeastern extent 5–7 mi northeast of Rattlesnake Hill (fig. 4). Electrical resistivity data indicates that at depths greater than 1,000 ft below land surface, the basalt narrows to a thin neck approxi-mately centered beneath Rattlesnake Hill. Seismic-reflection profiles presented by Maurer and Welch (2001, pgs.16 and 19) largely confirm the lateral extent of the basalt described by Glancy (1986). The seismic profiles indicate the presence of a secondary vent in the northern part of the basalt that is not exposed at land surface (fig. 4).
Exposed basalt consists of loosely consolidated scoriaceous cinders near the top of Rattlesnake Hill (fig. 5) and vesicular flows along the flanks of Rattlesnake Hill (fig. 6). Recent drilling at test hole DB-1, near the southern extent of the aquifer (fig. 3), penetrated about 300 ft of very porous and fractured basalt alternating with more massive zones (Maurer, 2002). Core material from test hole DB-1 (fig. 7) is similar in appearance to cuttings from other test wells drilled near the southern half of basalt aquifer and to the vesicular flows along the flanks of Rattlesnake Hill. To the north, test hole DB-2 penetrated about 340 ft of low permeability, brecci-ated and massive basalt (Maurer, 2002).
Water quality in the basalt aquifer generally is uniform over its lateral extent and is suspected to be a blend of fresh water and water with a higher dissolved solids content. The observed increase in dissolved chloride over the past 30 years indicates that more saline water may be migrating into the basalt aquifer. Maurer and Welch (2001, p. 48) suggest the source of the more saline water may be near the southern edge of the basalt from depths greater than 300 ft below land surface. Recent drilling (Maurer, 2002) shows that water qual-ity within the basalt, near its southern extent, is fairly uniform through its entire thickness of about 290 ft, and that ground water in the underlying intermediate aquifer contains chloride concentrations of nearly 2,000 mg/L. Thus, the underlying aquifer could be a source for the increasing chloride concen-trations. Maurer and Welch (2001, p. 42 and 43) suggest the basalt is recharged by a mixture of water from the shallow aquifer near Rattlesnake Hill, water from the intermediate aquifer on the southwest, west, and northwest side of the basalt, and more saline water from depths greater than 300 ft
below land surface.
Physical Setting 7

Figure 4. Oblique view of basalt aquifer, looking toward northeast. Modified from figure 8B in Maurer and Welch (2001).
MILES MILES
0
2
12
42
4
6
8
10
6
8
10
�����������
����������������������������������������� Vertical exaggeration approximately 8X300
8 Characterization of Surface-Water Quality and Potential Geochemical Reactions from Storage of Surface Water

Figure 5. Scoriaceous cinders near the top of Rattlesnake Hill. Bottle is 10-inches high, used for scale.
Physical Setting 9
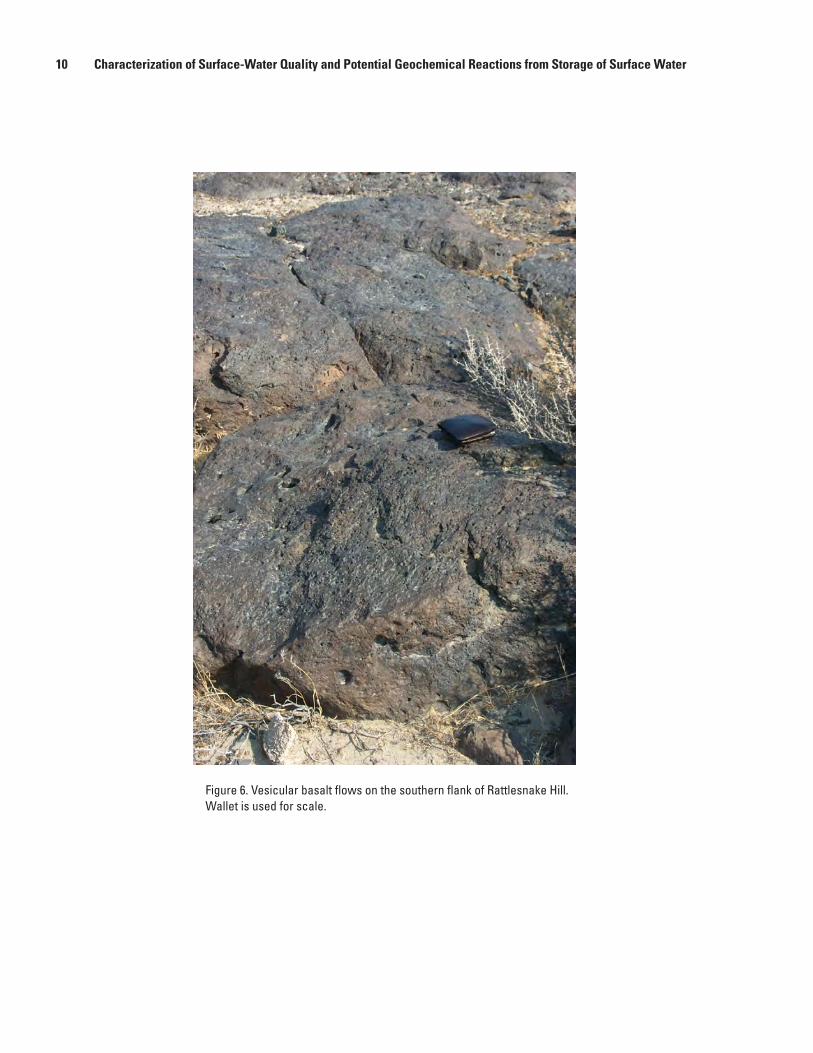
Figure 6. Vesicular basalt flows on the southern flank of Rattlesnake Hill. Wallet is used for scale.
10 Characterization of Surface-Water Quality and Potential Geochemical Reactions from Storage of Surface Water

Figure 7. Fractured, vesicular basalt from well DB-1 recovered from a depth of 441–442 ft below land surface.
Physical Setting 11

Chemistry and Mineralogy of the Basalt Aquifer
The mineralogy of unweathered basalt is dominated by fine-grained plagioclase and augite, as determined by X-ray diffraction. The plagioclase and augite are partially altered to illite and chlorite. Optical microscopy reveal a classic olivine basalt: plagioclase, clinopyroxene, olivine, and opaque miner-als in a fine-grained groundmass. Olivine and iron-bearing minerals (ilmenite or magnetite) are present in minor amounts (Lico and Seiler, 1994). Plagioclase occurs as finer ground-mass and as somewhat larger phenocrysts. The plagioclase composition varies over the relatively narrow range of An50-55 (labradorite to andesine-labradorite). Plagioclase exhibits both normal concentric zoning (more calcic cores) and oscil-latory zoning. Clinopyroxenes are smaller and are typically subhedral groundmass materials, with few coarse phenocrysts. EDS analyses of the clinopyroxenes indicate that they are diopsidic because they contain very low aluminum and iron and abundant calcium and magnesium. Olivine typically forms larger grains, is subhedral, and colorless. EDS analyses of the olivine indicates a forsteritic composition because the olivine contains relatively small amounts of iron. EDS analyses of the opaque minerals indicate that most are ilmenitic (Fe-rich titanium oxides), but some contain significant chromium. The opaque minerals are not significantly magnetic.
Even though mineralogy of the basalts is consistent throughout the sections, they fall into two subtypes based on relative plagioclase and opaque mineral contents. Type 1 is defined here as containing significantly less plagioclase and more opaque minerals than type 2. Typical images of both types are shown in figures 8 and 9. Comparison of these figures demonstrates the higher plagioclase and lower opaque mineral content of type 2 compared to type 1 basalt.
Despite a difference in plagioclase and opaque mineral concentrations between the two basalt types, plagioclase com-position is very similar in both types, indicating they origi-nated from similar, if not the same, parent magma. Several samples of both basalts are visibly argillized and chloritic. The high Loss-On-Ignition (LOI; table 1) indicates that these samples were weathered and altered, and probably include zeolite and clay materials. This alteration also may explain why the aluminum and potassium content of these samples is significantly higher than in most basalts. Conversely, the mag-nesium content is significantly lower than in most basalts. The low titanium values compared to typical basalts (table 1), and the olivine character of these samples indicates that they are a mid-ocean ridge type basalt. Arsenic concentrations for four basalt samples recovered from depths of 399–730 ft below land surface ranged from 0.66 to 1.2 mg/kg (table 1).
Table 1. Bulk chemical composition of the basalt aquifer encountered at test hole DB-1.
[Symbol: --, not available]
Parameter, in weight percent except
as noted
Sample depth, in feet Typical basalt1
390 to
399433 482 730 Mean
Standard deviation
SiO2
49.5 49.2 50.4 51.2 50.06 3.65
TiO2
1.92 1.54 1.87 1.66 1.86 1.1
Al2O
316.9 17.4 18 17.4 15.99 2.58
Fe, as Fe2O
38.93 7.01 8.79 8.15 11.38 --2
MnO .17 .11 .14 .017 -- --
MgO 5.42 3.05 3.28 4.69 6.96 2.97
CaO 8.53 9.78 7.93 8.55 9.66 1.91
Na2O 3.33 3.68 3.94 3.27 2.97 0.91
K2O 2.17 2.62 2.13 2.19 1.12 0.75
P2O
5.78 .7 .065 0.71 -- --
Loss On Ignition 2.26 4.38 2.26 2.26 -- --
Total 100.57 99.47 98.805 100.097 100 --
As3 .66 1.00 .8 1.17 -- --
1 Values are based on 3,594 analyses (Le Maitre, 1976).
2 Le Maitre (1976) presents standard deviations for Fe2O
3 and FeO ( 2.17 and 2.5, respectively) indi-
vidually rather than for total iron.
3 Concentrations in mg/kg.
12 Characterization of Surface-Water Quality and Potential Geochemical Reactions from Storage of Surface Water

Figure 8. Optical microscope micrograph of Type 1 basalt from well DB-1 at 545 ft with (A) crossed polarizers and (B) uncrossed polar-izers. Field of view is 6 mm. These images show the bimodal size distribution of plagioclase, and typical size and form of olivine and clinopyroxene grains. The uncrossed view plainly shows the opaque mineral content.
A
B
OlivineOlivine
ClinopyroxeneClinopyroxene
PlagioclasePlagioclase
Opaque minerals(black areas)
Opaque minerals(black areas)
Physical Setting 13

Figure 9. Optical microscope micrograph of Type 2 basalt from well DB-1 at 441 ft with (A) crossed polarizers and (B) uncrossed polarizers. Field of view is 6 mm. These photographs are taken at the same magnification of those in figure 8 and clearly show the higher plagioclase and lower opaque mineral content of Type 2 basalt relative to Type 1.
A
B
OlivineOlivineClinopyroxeneClinopyroxene
PlagioclasePlagioclase
Opaque minerals(black areas)
Opaque minerals(black areas)
14 Characterization of Surface-Water Quality and Potential Geochemical Reactions from Storage of Surface Water

X-ray diffraction and SEM/EDS analysis of material from sites DB-1 and B-7 (fig. 10 and 11) show that fracture surfaces and vesicles (vugs) in the basalt contain coatings that include phillipsite, dolomite, calcite, clay minerals, and iron oxide. These minerals are important from the standpoint of water chemistry because they can dissolve or have easily exchangeable ions, which can alter the chemical quality of the injected water. For example, phillipsite is a zeolite with cation-exchange sites that can react with injected water. Vug-filling materials in samples from other sites were very similar to the materials shown in figure 10 and no other mineral phases were identified.
Sequential chemical extractions of basalt aquifer mate-rial indicates the presence of exchangeable cations and anions, calcite, and iron oxide (table 2). The presence of calcite and exchangeable cations is important because calcite dissolu-tion and cation exchange can alter the water chemistry. The presence of iron oxide is particularly important because it can adsorb or release arsenic. The results of the chemical extractions can be used in geochemical models to predict the behavior of arsenic during recharge and withdrawal of water from the basalt aquifer.
Characterization of Surface Water in the S-Line Canal
Analytical results for surface-water samples from the S-Line Canal are presented in Appendixes 1 and 2. Water used for irrigation and maintenance of wildlife areas in Lahontan Valley originates as runoff from the Sierra Nevada. Water from the Carson River and water imported from the Truckee River via the Truckee Canal are stored in Lahontan Reservoir. The S-Line Canal is one of the principal delivery canals in the extensive network of canals that transports water through Lahontan Valley. During a typical year, water released from Lahontan Reservoir maintains flow in the S-Line Canal from April to October.
Water in the S-Line Canal (Appendix 1) is a Na-Ca-HCO
3 type water, with pH ranging from 7.7 to 8.2, and total-
dissolved solids concentrations of about 195 mg/L. Sulfate concentrations have a narrow range of about 30–48 mg/L. Nitrogen and phosphorus concentrations generally are low, none exceeding 0.45 mg/L as N or 0.2 mg/L as P.
Figure 10. Scanning electron microscope micrograph of vug-filling material from well DB-1 at a depth of 625 ft show-ing phillipsite. Phillipsite was identified by the occurrence, morphology, and EDS compositional analyses which identified abundant silica, aluminum, potassium, and sodium with no other cations present.
Characterization of Surface Water in the S-Line Canal 15
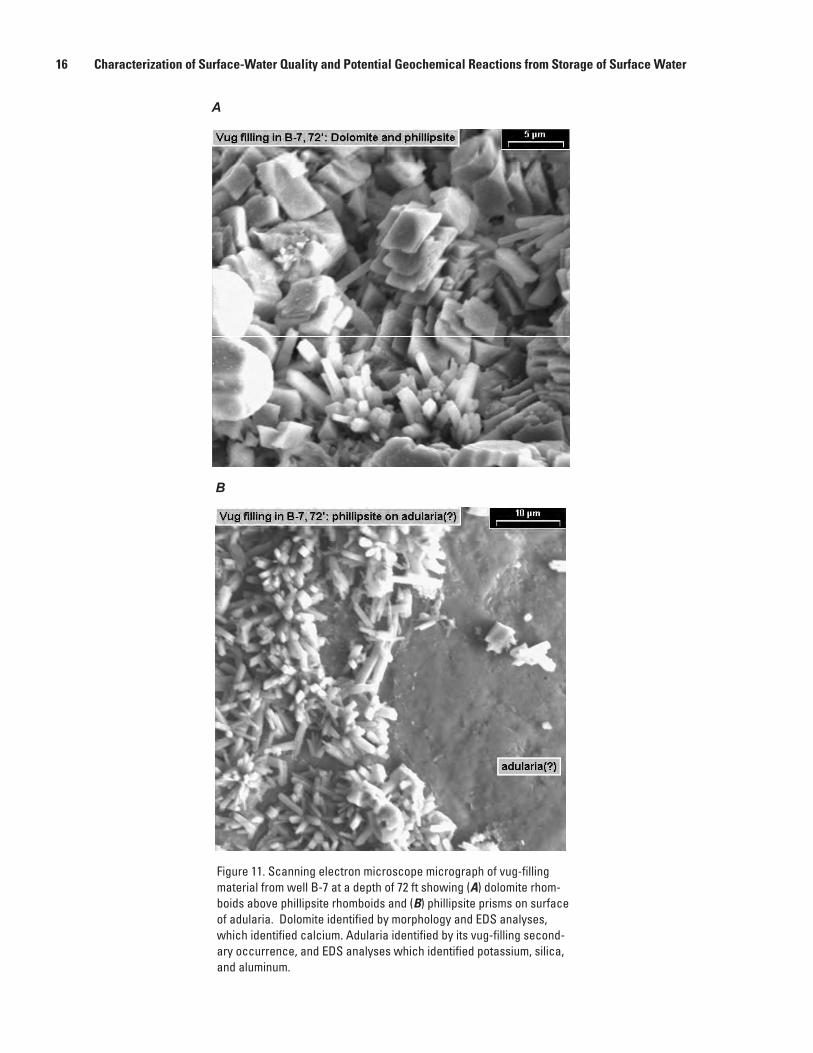
Figure 11. Scanning electron microscope micrograph of vug-filling material from well B-7 at a depth of 72 ft showing (A) dolomite rhom-boids above phillipsite rhomboids and (B) phillipsite prisms on surface of adularia. Dolomite identified by morphology and EDS analyses, which identified calcium. Adularia identified by its vug-filling second-ary occurrence, and EDS analyses which identified potassium, silica, and aluminum.
A
B
16 Characterization of Surface-Water Quality and Potential Geochemical Reactions from Storage of Surface Water

Table 2A. Concentration of elements released from basalt rock samples following cation exchange using ammonium chloride.
[Concentrations are in mg/kg, milligram per kilogram]
Sample identifier Calcium Potassium Magnesium
DB-1 442A 184 135 37
DB-1 442B 393 155 46
RSHCA 1,580 303 78
RSHCB 2,190 227 124
RSHO 173 16.5 4.1
Table 2B. Concentration of elements released from basalt rock samples following anion exchange using potassium nitrate.
[Concentrations are in mg/kg, milligrams per kilogram]
Sample identifier Chloride Phosphorus Arsenic
DB-1 442A 11.4 36 0.08
DB-1 442B 6.7 37.1 0.08
RSHCA 35.3 33.9 0.08
RSHCB 15.4 36.6 0.04
RSHO 7.4 36.2 0.04
Table 2C. Concentrations of elements released from basalt rock samples following extraction of carbonate minerals by sodium acetate and acetic acid.
[Concentrations are in mg/kg, milligram per kilogram. Symbol: <, less than]
Sample identifier
Alu- minum
Arsenic Calcium IronPotas- sium
Mag- nesium
Man- ganese
Phos- phorus
Lead Silica Sulfate
DB-1 442A <4 4 992 35.9 1,620 81.6 2.4 11 0.69 153 2,280
DB-1 442B <4 3.2 4,620 28 2,150 167 16.7 20.1 11.2 187 3,930
RSHCA 42.7 2.3 1,770 26.4 5,160 89.3 5 286 1.8 241 3,570
RSHCB 34.3 2.7 4,780 20.2 4,780 373 12 236 32.2 343 3,990
RSHO <4 1.8 742 26.4 618 8.2 0.41 27.2 <.4 154 3,170
Table 2D. Concentration of elements released from basalt rock samples following extraction of iron and manga-nese oxides by hydroxylamine hydrochloride and acetic acid.
[Concentrations are in mg/kg, milligram per kilogram]
Sample identifier1
Alu- minum Arsenic Calcium Iron
Potas- sium
Mag- nesium
Man- ganese
Phos- phorus Silica Sulfate
DB-1 442A 71.4 0.2 1,070 103 163 153 29.6 144 223 20.4
DB-1 442B 157 0.42 3,060 167 209 251 50.2 162 403 20.9
RSHCA 544 1.7 2,170 112 272 214 88.3 816 482 214
RSHCB 311 0.97 2,200 91.2 96.6 708 103 616 622 193
RSHO 72.1 0.82 1,100 99.9 61.8 61.8 18.5 547 220 61.8
1 Sample identifiers: RSHCA, RSHCB, RSHO represent Rattlesnake Hill cinder sample A, B, and vesicular outcrop sample, respec-tively. DB-1 442A and 442B are basalt core samples from a depth of 442 feet below land surface from well DB-1.
Characterization of Surface Water in the S-Line Canal 17
1
1 1

Trace-element concentrations and radionuclide activities generally were low and, except for arsenic, did not exceed drinking-water standards. For arsenic, all but one sample exceeded the 10 µg/L Nevada drinking-water standard. The one sample with a low arsenic concentration (1.5 µg/L) was collected in May 2001 (fig. 12) when the flow in the Carson River below Lahontan Reservoir was 790 ft3/s. These limited data indicate that diverting flow from the S-Line Canal during high flow could minimize the arsenic concentrations in water from the basalt aquifer. Chloride concentrations in the canal were less than 22 mg/L in all the samples collected during this study (Appendix 1), compared with average chloride concen-trations in the basalt aquifer that exceed 100 mg/L (Appendix 1 in Maurer and Welch, 2001). Dissolved organic carbon (DOC) concentrations ranged from 2.5 to 5.8 mg/L in the six water samples analyzed for carbon. DOC concentrations in water used for artificial recharge are important because DOC reacts with chlorine to form carcinogenic disinfection-by-products and because metabolism of DOC by bacteria can indirectly mobilize arsenic in an aquifer. DOC concentrations are lowest during spring runoff (Appendix 1), indicating that artificial recharge using water during high flow in the Carson River would have the additional benefit of minimizing the DOC content.
Analyses of water samples for pesticides and other anthropogenic organic compounds show very little contami-nation of S-Line Canal water with these chemicals. A few pesticides (Atrazine, EPTC, Prometon, and Simizine) were detected at very low levels (<0.01 µg/L) in the water samples but were not common (Appendix 2). Several consumer chemi-cals, including Bisphenol A, caffeine, cholesterol, and DEET, were detected at very low concentrations, indicating the pres-ence of wastewater in the canal water.
Geochemical Modeling of Recharge
Modeling Approach
Artificial recharge of the basalt aquifer with surface water could mitigate declining water levels and increasing chloride concentrations. However, the chemistry of the surface water could change following recharge, which raises the concern that arsenic may exceed standards in recovered ground water. Ground water in the basalt aquifer has a high pH (Appendix 1), which is characteristic of high-arsenic ground water else-where in the United States (Welch and others, 2000). Because high pH values can promote arsenic desorption (Stollenwerk, 2003), reactions that increase the pH of recharged water could increase the arsenic concentrations. An overall reaction that could increase the pH involves cation exchange and calcite dissolution as indicated by the following reaction:
CaCO3 + Na
2-X + H
2O ↔ 2 Na+ + HCO
3− + Ca-X + OH− (1)
Where -X represents exchange sites.
The relatively low calcium and magnesium concentra-tions compared to the sodium concentration in the basalt aquifer are consistent with this exchange reaction.
Calcite containing phosphorus and arsenic has been identified in the basalt aquifer (as indicated by the chemi-cal extraction data in table 2C). Dissolution of calcite in the basalt could directly lead to higher arsenic concentrations by freeing adsorbed arsenic. Welch and others (2003), suggest that dissolution of calcite present in the basalt aquifer results in an increase in aqueous phosphorus. Because phosphate and arsenic compete for adsorption sites on a variety of adsorbants (Stollenwerk, 2003), phosphate released from the calcite may result in higher arsenic concentrations by competitively inhib-iting adsorption of the arsenic.
Geochemical reactions that may result from recharge of water from S-Line Canal were simulated using the computer program PHREEQC (Parkhurst and Appelo, 1999), which has been widely used for modeling chemical reactions. Of particu-lar importance for the recharge simulations is the capability of PHREEQC to include adsorption, precipitation, and dissolu-tion reactions along with transport of the water. Modeling adsorption of arsenic requires knowledge of the amount and chemical character of the adsorbent in the aquifer. One com-mon and important adsorbent in aquifers is iron oxide, particu-larly in ground water containing dissolved oxygen (Welch and others, 2000). The modeling presented below only includes iron oxide because it is present in the basalt aquifer and an internally consistent set of adsorption constants is available for arsenic and other potentially competing ions. The exclusion of other phases that could contribute arsenic to recharged water could lead to an underestimate of the potential for arsenic release.
Surface complexation modeling requires that the site den-sity, the specific area of the surface, and the mass of the adsor-bant be specified. Following the approach of Dzombak and Morel (1990), a site density of 0.2 mol/mol and a surface area of 600 m2/g were used in the adsorption model for iron oxide. These values are applicable for hydrous ferric oxide (HFO), which may overestimate the surface area and site density for a system like the basalt aquifer. Extracted arsenic and iron con-centrations, along with values for porosity and density (table 3), were used to estimate the iron oxide content and adsorbed arsenic associated with sampled ground water. Following the approach of Welch and Lico (1998), the laboratory values for extracted arsenic and iron were converted to mol/L of water by using the following general equations:
18 Characterization of Surface-Water Quality and Potential Geochemical Reactions from Storage of Surface Water

DOC, in milligrams per liter
Arsenic, in micrograms per liter
Discharge
DATE
CO
NC
EN
TRAT
ION
DA
ILY
ME
AN
DIS
CH
AR
GE
, IN
CU
BIC
FE
ET
PE
R S
EC
ON
D
NO
V
DE
C
FEB
AP
R
JUN
E
AU
G
DE
C
FEB
AP
R
JUN
E
AU
G
OC
T
OC
T
JAN
MA
R
MAY
JULY
SE
P
NO
V
JAN
MA
R
MAY
JULY
SE
P
2000 2001 2002
0
200
400
600
800
1,000
0
5
10
15
20
Figure 12. Graph showing arsenic and dissolved organic carbon (DOC) concentrations in S-Line Canal and daily mean flow in the Carson River below Lahontan Reservoir.
G = M x D x (1-Φ) x (1000 cm3/L) x (10-6 g/µg) / (Φ)
and C = G/W
Where G = concentration, in g/L
M = mass of arsenic or iron extracted, in µg/g of aquifer material
D = aquifer material density, in g/cm3
Φ = porosity, dimensionless
C = concentration, in mol/L
W = gram-formula weight of arsenic (74.92 g/mol) or iron (55.85 g/mol)
Competitive adsorption in the simulations uses the ‘best fit’ models for iron oxide from Dzombak and Morel (1990). More recently, the adsorption of carbonate on iron oxide, both HFO (Appelo and others, 2002) and goethite (Van Geen and others, 1994), has been discussed. The effect of carbon-ate adsorption on arsenic concentrations was included in the modeling using the adsorption parameters in table 4.
Table 3. Mean bulk density and porosity of basalt samples (Brian Andraski, USGS, 2003, written commun.)
[Abbreviation: g/cm3, grams per cubic centimeter]
Sample type
Number of
samples
Average bulk density (g/cm3)
Average porosity
Surface outcrop, cinders 2 1.14 0.48
Surface outcrop, flow 2 2.52 .09
Vesicular basalt 4 2.25 .16
Table 4. Surface complexation constants for carbonate adsorption on ferrihydrite. Data from Appelo and others (2002)..
Reaction Log K
Hfo_wOH + CO32- + H+ = Hfo_wOCO
2- + H
2O 12.78 ± 0.48
Hfo_wOH + CO32- + 2H+ = Hfo_wOCO
2- H + H
2O 20.37 ± 0.20
Geochemical Modeling of Recharge 19
Model Scenarios and Limitations
Surface water can be injected directly into ground water through wells or recharged through the unsaturated zone beneath infiltration basins. Simulation of chemical reactions during direct injection and basin spreading are termed ‘well-injection’ and ‘basin-infiltration’ models, respectively. Both models considered only advective, or plug flow; that is, disper-sion and mixing were not considered. Chemical equilibrium was assumed during each reaction step. The well-injection model consists of reacting water with the basalt aquifer as summarized in table 5. The basalt aquifer was discretized into 10 reaction cells in the saturated zone. The surfaces of the aquifer material prior to injection was assumed to be in chemi-cal equilibrium with basalt-aquifer water. The surfaces were subsequently equilibrated with the recharge water. Withdrawal then was simulated by changing the flow direction and the invading basalt-aquifer water was equilibrated with the chemi-cally altered surfaces of the aquifer material.
The basin-infiltration model added two reaction cells to the well-injection model to simulate initial reactions in the unsaturated zone prior to reactions in the saturated zone (table 5). The first reaction cell simulated reactions with the surface cinder and the second simulated reactions with the vesicular basalt. Simulation of chemical reactions during injection and withdrawal in the saturated zone used the same approach as described for the well-injection model.
The ability of any numerical model to accurately simulate the outcome of a process such as the chemistry resulting from artificial recharge is limited for a variety of reasons. These limitations fall into three broad categories. The first involves formulation of the underlying mathematical approaches for simulation of chemical and physical processes. The second involves the adequacy and applicability of the information required to perform a simulation. The third involves how closely a modeled scenario and the actual recharge approach correspond. These limitations are discussed in turn.
The PHREEQC computer code includes an aqueous model that calculates the chemical activities of the aqueous species. The underlying mathematical approach and thermo-dynamic data used for the aqueous model are considered fully adequate for the simulations. Ground water with high iron and organic carbon concentrations could be important if organic-rich water were recharged and produced because interaction between arsenic (V) and organic matter can affect aqueous arsenic activities (Redman and others, 2002). The PHREEQC database does not account for this phenomenon. This interac-tion only appears to be important in water with high iron con-centrations (>600 mg/L); thus, this interaction is not expected to be important for the simulations discussed here.
Adsorption of arsenic was simulated using a surface-complexation model (Dzombak and Morel, 1990; Parkhurst and Appelo, 1999). This approach allows the simulation of arsenic adsorption in complex natural environments (Grossl and Sparks, 1995). Laboratory experiments and field studies (Jain and Loeppert, 2000; Swedlund and Webster, 1999) demonstrate that arsenic adsorption by iron oxide is affected
by other anions, including phosphate and silica, at concen-trations found in many ground-water systems. Competitive adsorption between arsenic and other anions for the same adsorption sites on a solid also was simulated using the surface-complexation model in PHREEQC. Competitive adsorption is more complex than is represented by the surface-complexation model of Dzombak and Morel (1990). Recent laboratory investigation into the adsorption of As(V) and phosphate on goethite (α-FeOOH) produced results that are incompatible with a surface-complexation model (Hongshao and Stanforth, 2001). Of particular importance is the observa-tion that goethite contains a non-exchangeable fraction for As(V) and phosphate, which means that sequential addition of the adsorbents results in a different aqueous composition than is obtained when the adsorbents are introduced concurrently. Consequently, the mathematical approach used in the simu-lations may result in higher aqueous arsenic concentrations being predicted than would be expected on the basis of the laboratory studies (see Hongshao and Stanforth, 2001; Man-ning and Goldberg, 1996).
Data used to simulate the water quality during recharge include temperature, chemistry of the recharge water, mineral-ogy and chemistry of the aquifer materials, and aquifer poros-ity. The chemical information on the aquifer material is limited to analyses of a few samples.
If all the oxygen in the recharge is consumed by oxida-tion of DOC, then iron and manganese oxides can dissolve. The reaction of dissolved oxygen with organic carbon com-monly is written as:
CH2O + O
2 → CO
2 + H
2O (2)
The stoichiometry of this reaction indicates that ground water with 8 mg/L of dissolved oxygen can oxidize about 3 mg/L of organic carbon. Although not all of the DOC will necessarily react with oxygen, the amount of DOC in some samples collected from the S-Line Canal is large enough (Appendix 1) that it could consume all of the dissolved oxygen and then react with iron and manganese oxides. The reaction of DOC with these oxides could produce undesirable concen-trations of iron and manganese in addition to releasing other trace inorganic constituents that commonly are contained within and on the surface of these oxides. The simulations assume that the recharge contains enough dissolved oxygen that iron and manganese oxides will not dissolve. Most of the S-Line Canal water sampled has sufficient dissolved oxygen to oxidize all the particulate and dissolved organic carbon, which makes this assumption reasonable for most of the samples.
Changes in water chemistry resulting from an actual project to artificially recharge the basalt likely will differ to some degree from the results of simulations made here. Although the basalt is largely homogenous, the mineralogy and chemistry of the basalt at an actual project location may differ from what was used in the simulations. Similarly, the chemical composition of the S-Line Canal changes during the year and the chemical composition of water used during actual artificial recharge may be different from what was used in the simulations.
20 Characterization of Surface-Water Quality and Potential Geochemical Reactions from Storage of Surface Water

Table 5. Initial conditions and reactions used for geochemical modeling of injection and infiltration of surface water and its subse-quent recovery.
Description of simulation Influent water compositionAquifer material
composition Reactions
Well injection
W1. Equilibrate aquifer material with native ground water to set initial conditions.
Native ground water from site B-3 (sampled 06-30-99; Appendix 1).
Total number of cation exchange sites and iron-oxide surface from extraction of basalt core samples DB-1 442A and B.
Equilibrate native ground water with the aquifer material in reaction cells.
W2. Injection of surface water. S-Line Canal water (sampled 05-14-01; Appendix 1).
Composition produced in simu-lation W1.
Inject surface water into reaction cells. Equilibrate with calcite, cation exchange, and iron oxide (closed with respect to CO
2).
W3. Withdrawal of injected water.
Native ground water from site B-3 (sampled 6-30-99; Appendix 1).
Composition produced in simu-lation W1.
Withdraw injected water from reaction cells and replace with native ground water. Equili-brate with calcite, cation ex-change, and iron oxide (closed with respect to CO
2).
Basin infiltration
B1. Cell one, equilibrate re-charge with cinder.
S-Line Canal water (sampled 05-14-01; Appendix 1).
Total number of cation exchange sites and iron-oxide surface from extraction of cinder outcrop samples RSHCA and RSHCB (table 2D).
Equilibration with atmospheric CO
2 (pCO
2 = -3.5 atmo-
spheres) to simulate exposure to the atmosphere. React water with cinder.
B2. Cell two, equilibrate with water reacted with basalt cinder.
Water from previous reaction in cell one.
Cation exchange sites and iron-oxide surface from extraction results of vesicular outcrop sample RSHO (table 2D).
Equilibrate water from cell one with vesicular outcrop. Equili-bration with atmospheric CO
2
(pCO2 = -3.5 atmospheres)
to simulate exposure to the atmosphere.
B3. Cells three through ten, initial aquifer and recharge composition.
Ground water from site B-3 (sampled 06-30-99; Appendix 1).
Total number of cation exchange sites and iron-oxide surface from extraction of basalt core samples DB-1 442A and B.
Equilibrate water with the basalt composition in reaction cells.
B4. Cells three through ten, infiltration into the basalt aquifer.
Composition after reaction in cell two.
Total number of cation exchange sites and iron-oxide surface from extraction of basalt core samples DB-1 442A and B.
Inject surface water into reaction cells. Equilibrate with calcite, cation exchange and iron oxide (closed with respect to CO
2).
B5. Cells three through ten, withdrawal.
Ground water from site B-3 (sampled 06-30-99; Appendix 1).
Composition produced in B3. Withdraw injected water with inflow of B-3 water into reac-tion cells three through ten. Equilibration with calcite, cat-ion exchange and iron oxide (closed with respect to CO
2).
Geochemical Modeling of Recharge 21

Another way actual results may differ from simulated results is that the modeling approach assumes that lateral flow does not affect the ground-water quality of recovered water. Lateral flow would move the injected/infiltrated water away from the recharge site, replacing it with native ground water. This would decrease the removal of arsenic because of re-equilibration of arsenic in the ground water with the exchange sites. Factors which increase the amount of lateral flow, such as higher lateral-flow rates and longer times between recharge and withdrawal can lead to less efficient removal of arsenic.
Model Results
The chemical modeling involved reaction cells to simu-late water chemistry during recharge and withdrawal. During the recharge phase in the well-injection model, surface water is injected into the first cell, displacing the native ground water from cell one to cell two. Following equilibration with the aquifer material, additional surface water is injected into cell one, displacing the now modified surface water from cell one to cell two. This sequence was repeated for 10 reaction steps until all 10 cells contained injected surface water. Dur-ing the withdrawal phase, the process is reversed and water is removed from cell one and sequentially replaced by water from cells two through ten. Withdrawal continues until native ground water has replaced injected surface water in the 10 cells.
The results shown in figure 13 are the simulations for the first cell of the well-injection model, with the first cell repre-senting a single well that both injects and withdraws water. Simulated pH, and arsenic and chloride concentrations during a single cycle of injection and withdrawal are shown in figure 13A and following multiple cycles are shown in figure 13B.
Modeling injection of water with a chemical composition similar to that of the S-Line Canal into the basalt aquifer and then withdrawing the water suggests that arsenic concentra-tions in the withdrawn water will be higher than in the injected water (fig. 13A). The results in cell one shown on figure 13A represent the composition of the water that moves into the next cell as outlined in table 5. The results for cell one represent the composition of the recovered water during the withdrawal cycle. The injection and withdrawal can be discussed in terms of three periods. During the first period, as water is being injected into the aquifer, chloride concentrations drop and pH increases to nearly 10 during the first reaction step. During reaction steps 2–10, arsenic concentrations jump as arsenic desorbs from the basalt and then decreases as the arsenic is transported out of the reaction cells. During the second period, as the injected water is withdrawn for the following 10 reac-tion steps, arsenic concentrations increase as injected water that had moved away from the well head now returns. In the third period, starting at reaction step 20, chloride concentra-tions jump sharply, indicating the return of native basalt-aquifer water. The pH in the withdrawn water returns to that
normally found in the basalt aquifer after a few reaction steps during this last period. The lower pH causes an abrupt arsenic decrease, followed by a gradual increase to a value close to that normally found in the basalt aquifer over the next 30 reac-tion steps.
A second model consisted of simulating a series of injection and withdrawal cycles. An important difference between this model and that described above is that more water is injected than withdrawn, with withdrawal being limited to retrieval to the point where native basalt-aquifer water reaches cell two, but not cell one. Accordingly, the chloride concentrations in cell one always remain equal to the concentration in the injected water (fig. 13B). The pH and arsenic values during the first injection-withdrawal cycle are the same as described for the first two periods described above. During subsequent injection-withdrawal cycles, the arsenic and pH values show the same patterns with a progres-sive decrease with each succeeding cycle. The decreasing pH, which causes the lower arsenic concentrations, is a result of progressively less calcite dissolution. The decreasing calcite dissolution is a result of reduced exchange of calcium for sodium, which promotes calcite dissolution, as shown by reaction (1).
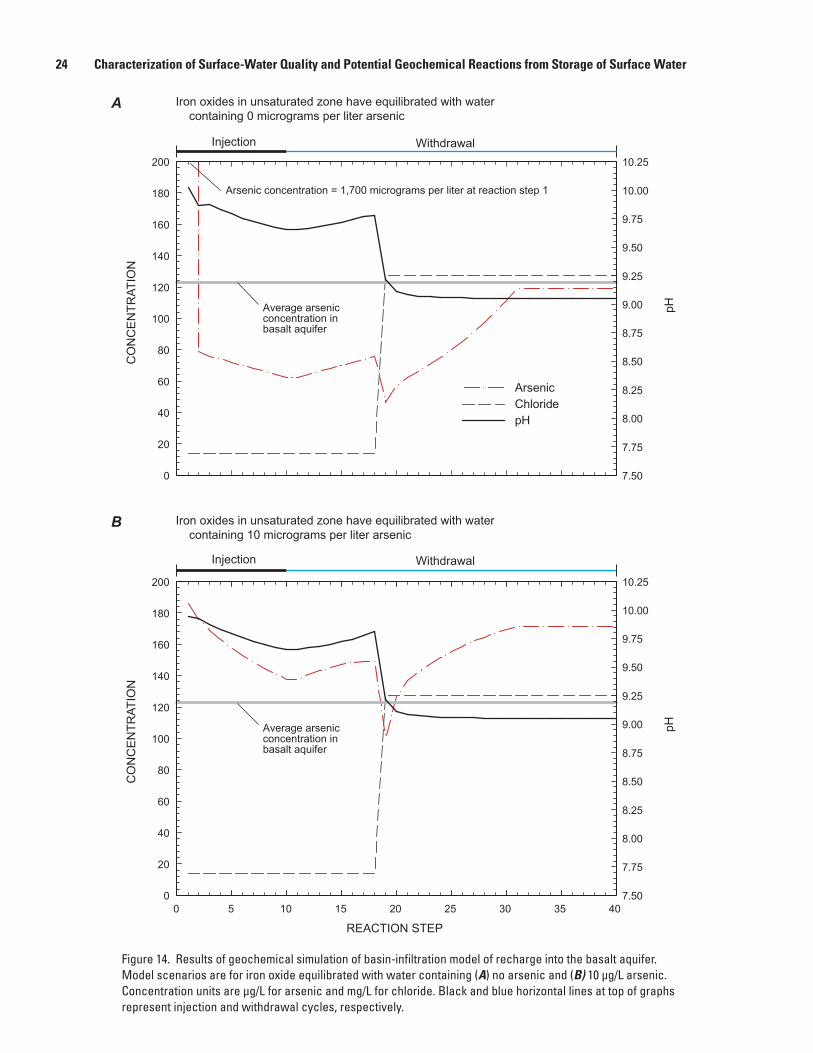
The basin-infiltration model differs from the well- injection model in that it includes two additional cells that represent the cinder and vesicular basalt in the unsaturated zone above the water table. The third cell represents the saturated zone below the infiltration basin. Results for this third cell are shown in figure 14 and describe the water quality at a withdrawal well tapping ground water below the basin. Simulations of water infiltrating through the unsaturated zone indicate potential for high arsenic concentrations in withdrawn ground water (fig. 14). Two scenarios are represented in figure 14 and differ in the amount of arsenic present in the iron oxide in the unsaturated zone. The first model represents iron oxide with no initial arsenic (fig. 14A). The second model assumes the iron oxide has equilibrated with a water composition like that of the infiltrating water except containing 10 µg/L of arsenic (fig. 14B). The results show similar patterns, although the arsenic concentrations in the recovered water are higher for the model represented in figure 14B because of the greater amount of arsenic in the unsaturated zone, particularly during the first scenario.
Because the amount of carbon dioxide in the unsaturated zone affects carbonate solubility, it also could affect arsenic concentrations. The simulation results shown in figures 13–14 used atmospheric concentrations of carbon dioxide (pCO
2 of
10-3.5). However, similar arsenic and pH results were obtained using a higher pCO
2 of 10-2.5, which is similar to observed
pressures in the soil zone (data not shown). The model results indicate the potential for unaccept-
ably high arsenic concentrations in recovered ground water; however, simulated arsenic concentrations in the recovered water may overestimate concentrations during real recharge operations. First, the models do not consider the effect of
22 Characterization of Surface-Water Quality and Potential Geochemical Reactions from Storage of Surface Water

Average arsenic concentration in basalt aquifer
Average arsenic concentration in basalt aquifer
ArsenicChloridepH
WithdrawalInjection
pH
7.50
7.75
8.00
8.25
8.50
8.75
9.00
9.25
9.50
9.75
10.00
10.25
pH
7.50
7.75
8.00
8.25
8.50
8.75
9.00
9.25
9.50
9.75
10.00
10.25
0
20
40
60
80
100
120
140
160
180
200
0
20
40
60
80
100
120
140
160
180
200
CO
NC
EN
TRAT
ION
CO
NC
EN
TRAT
ION
REACTION STEP
0 10 20 30 40 50 60 70 80 90 100 110 120 130 140 150 160 170 180
0 10 15 20 25 30 35 40 45 505
A
B
Figure 13. Results of geochemical simulation of injection well model of recharge into the basalt aquifer. Model scenarios are for a (A) single cycle and (B) multiple cycles. Concentration units are µg/L for arsenic and mg/L for chloride. Black and blue horizontal lines at top of graphs represent injection and withdrawal cycles.
Geochemical Modeling of Recharge 23
Average arsenic concentration in basalt aquifer
Arsenic concentration = 1,700 micrograms per liter at reaction step 1
ArsenicChloridepH
Average arsenic concentration in basalt aquifer
WithdrawalInjection
WithdrawalInjection
pH
CO
NC
EN
TRAT
ION
pH
CO
NC
EN
TRAT
ION
REACTION STEP0 10 15 20 25 30 35 40
7.50
7.75
8.00
8.25
8.50
8.75
9.00
9.25
9.50
9.75
10.00
10.25
0
20
40
60
80
100
120
140
160
180
200
7.50
7.75
8.00
8.25
8.50
8.75
9.00
9.25
9.50
9.75
10.00
10.25
0
20
40
60
80
100
120
140
160
180
200
Iron oxides in unsaturated zone have equilibrated with water containing 10 micrograms per liter arsenic
B
A Iron oxides in unsaturated zone have equilibrated with water containing 0 micrograms per liter arsenic
5
Figure 14. Results of geochemical simulation of basin-infiltration model of recharge into the basalt aquifer. Model scenarios are for iron oxide equilibrated with water containing (A) no arsenic and (B) 10 µg/L arsenic. Concentration units are µg/L for arsenic and mg/L for chloride. Black and blue horizontal lines at top of graphs represent injection and withdrawal cycles, respectively.
24 Characterization of Surface-Water Quality and Potential Geochemical Reactions from Storage of Surface Water

lateral flow of ground water between injection and recovery. Second, released arsenic may be less because the model uses adsorption parameters for HFO that may overestimate the amount of arsenic released to ground water. The retention of arsenic in iron oxide is an important factor when considering a long-term recharge effort. The transformation of freshly pre-cipitated iron oxide into a more crystalline form needs to be considered. Field (Mettler, 2002) and laboratory (Ford, 2002) studies suggest that this process may occur at a rate that can be important for long-term recharge projects. Laboratory aging of HFO coprecipitated with As(V) shows a half-life for transfor-mation into goethite of about 300 days at 25oC in the presence of dissolved oxygen (Ford, 2002). The transformation was not accompanied by a release of arsenic into solution. The applica-bility of these laboratory experiments to field settings has not been well studied.
The effects of flushing of constituents such as chlo-ride and sulfate that may be present in the unsaturated zone beneath Rattlesnake Hill were not considered in the basin-infiltration model. These and other soluble salts may have been added to the basalt exposed at Rattlesnake Hill during the dessication of Lake Lahontan and subsequently by rainfall and dust. Flushing of these solutes may be important during the early phase of a recharge effort and could decrease as they are leached out of the unsaturated zone.
Summary and ConclusionsThe Fallon basalt aquifer serves as the sole source of
municipal water for Lahontan Valley in west-central Nevada. The principal users include the City of Fallon, Naval Air Sta-tion Fallon, and the Fallon Paiute-Shoshone Tribe. Increased pumpage from the aquifer has been accompanied by declines in water levels and changes in water quality. Storage of sur-face water in the basalt may mitigate the effects of increased pumpage, but may cause undesirable changes in water chemis-try. Water-quality samples of the S-Line Canal, a likely source of water for augmentation of recharge, indicates that with the exception of arsenic, the water is acceptable for water sup-ply. Because the arsenic in ground water of the basalt aquifer exceeds drinking water standards, the potential for arsenic release to artificial recharge was explored by using geochemi-cal modeling. Model results inidcate that arsenic release from the basalt may increase its concentrations in ground water to levels that could limit the use of artificial recharge. Model results for well injection indicate that arsenic concentrations may initially increase following artificial recharge, but decline with repeated cycles of injection and withdrawal. Field based experiments are needed to evaluate the underlying model assumptions.
Arsenic concentrations in withdrawn water following artificial recharge could be limited by increasing adsorption onto the basalt aquifer. Field and laboratory experiments show that a combination of increasing the iron oxide content of the basalt aquifer and lowering the pH of the ground water could
decrease arsenic concentrations (Welch and others, 2003). The short- and long-term effects of artificial recharge on arsenic concentrations could be evaluated through similar experimen-tal approaches described by these authors.
Surface infiltration has several advantages over well injection and the high permeability of scoriaceous cinders near the top of Rattlesnake Hill could make this a good location from the standpoint of allowing rapid infiltration. Clay and larger size particles in recharge water that often reduce the infiltration and injection rates can be mechanically removed from the surface of an infiltration basin. In contrast, rehabili-tating a well clogged by the clay particles in recharge water may be very expensive or impossible. Nonetheless, the cinders have a large reactive surface area that could lead to undesirable geochemical reactions. In such a case, surface infiltration may not be a desirable approach. Additional field-based experi-ments are needed to evaluate which approach is the best.
References Cited
Appelo, C.A.J., Van Der Weiden, M.J.J., Tournassat, C., and Charlet, L., 2002, Surface complexation of ferrous iron and carbonate on ferrihydrite and the mobilization of arsenic: Environmental Science & Technology, v. 36, p. 3096–3103.
Axelrod, D.I., 1956, Mid-Pliocene floras from west-central Nevada: University of California—Publications in Geologi-cal Sciences, v. 33, p. 322.
Benson, L.V., 1991, Timing of the last high stand of Lake Lahontan: Journal of Paleolimnology, v. 5, p. 115–126.
Benson, L.V., Currey, D.R., Dorn, R.I., Lajoie, K.R., Oviatt, C.G., Robinson, S.W., Smith, G.I., and Stine, S., 1990, Chronology of expansion and contraction of four Great Basin lake systems during the past 35,000 years: Paleogeo-graphy, Paleoclimatology, and Paleoecology, v. 78, p. 241–286.
Berris, S.N., Crompton, E.J., Joyner, J.D., and Ryan, Rosalyn, 2003, Water resources data—Nevada, Water Year 2002: U.S. Geological Survey Water-Data Report NV-02-1, 600 p.
Bureau of Reclamation, 1987, Final environmental impact statement for the Newlands Project proposed operating criteria and procedures: Washington D.C., p. 332.
Capel, P.D., and Larson, S.J., 1996, Evaluation of selected information on splitting devices for water samples: U.S. Geological Survey Water-Resources Investigations Report 95–4141, 103 p.
Coplen, T.B., Wildman, J.D., and Chen, J., 1991, Improve-ments in the gaseous hydrogen-water equilibration tech-nique for hydrogen isotope ratio analysis: Analytical Chemistry, v. 63, no. 9, p. 910–912.
References Cited 25
Davis, J.O., 1978, Quaternary tephrochronology of the Lake Lahontan area, Nevada and California: University of Nevada, Reno, Nevada Archeological Survey Research Paper 7, 137 p.
Dzombak, D.A., and Morel, F.M.M., 1990, Surface complex-ation modeling: Hydrous Ferric Oxide, New York, Wiley, 393 p.
Epstein, S., and Meyeda, T., 1953, Variation of O-18 content of water from natural sources: Geochimica at Cosmochi-mica Acta, v. 4, p. 213–224.
Evans, S.H.J., 1980, Summary of potassium/argon age dat-ing—1979: University of Utah, Department of Geology and Geophysics Topical Report, 23 p.
Federal Register, 2001, National primary drinking water regu-lations: Arsenic and clarifications to compliance and new source contaminants monitoring—Final rule: Office of the Federal Register, v. 66, no. 14, p. 6975–7066.
Fishman, M.J., ed., 1993, Methods of analysis by the U.S. Geological Survey National Water Quality Laboratory—Determination of inorganic and organic constituents in water and fluvial sediments: U.S. Geological Survey Open-File Report 93–125, 217 p.
Fishman, M.J., and Friedman, L.C., 1989, Methods for the determination of inorganic substances in water and fluvial sediments: U.S. Geological Survey Techniques of Water-Resources Investigations, Book 5, Chapter A1, 545 p.
Ford, R.G., 2002, Rates of hydrous ferric oxide crystallization and the influence on coprecipitated arsenate: Environmental Science & Technology, v. 36, p. 2459–2463.
Garbarino, J.R., 1999, Methods of analysis by the U.S. Geo-logical Survey National Water Quality Laboratory—Deter-mination of dissolved arsenic, boron, lithium, selenium, strontium, thallium, and vanadium using inductively coupled plasma-mass spectrometry: U.S. Geological Survey Open-File Report 99–093, 31 p.
Glancy, P.A., 1986, Geohydrology of the basalt and uncon-solidated sedimentary aquifers in the Fallon area, Churchill County, Nevada: U.S. Geological Survey Water-Supply Paper 2263, 62 p.
Grossl, P.R., and Sparks, D.L., 1995, Evaluation of contami-nant ion adsorption/desorption on goethite using pressure-jump relaxation kinetics: Geoderma, v. 67, p. 87–101.
Hongshao, Z., and Stanforth, R., 2001, Competitive adsorption of phosphate and arsenate on goethite: Environmental Sci-ence & Technology, v. 35, p. 4753–4757.
Jain, A., and Loeppert, R.H., 2000, Effect of competing anions on the adsorption of arsenate and arsenite by ferrihydrite: Journal of Environmental Quality, v. 29, p. 1422–1430.
Jones, S.R., and Garbarino, J.R., 1999, Methods of analysis by the U.S. Geological Survey National Water Quality Labora-tory—Determination of arsenic and selenium in water and sediment by graphite furnace-atomic absorption spectrome-try: U.S. Geological Survey Open-File Report 98–639, 39 p.
Le Maitre, R.W., 1976, The chemical variability of some com-mon igneous rocks: Journal of Petrology, v. 17, p. 589–637.
Lico, M.S., and Seiler, R.L., 1994, Ground-water quality and geochemistry, Carson Desert, western Nevada: U.S. Geo-logical Survey Open-File Report 94–31, 91 p.
Madsen, J.E., Sandstrom, M.W., and Zaugg, S.D., 2003, Methods of analysis by the U.S. Geological Survey National Water Quality Laboratory—A method supplement for the determination of Fipronil and degradates in water by gas chromatography/mass spectrometry: U.S. Geological Sur-vey Open-File Report 02–462, 11 p.
Manning, B.A., and Goldberg, S., 1996, Modeling arsenate competitive adsorption on kaolinite, montmorillonite and illite: Clays and Clay Minerals, v. 44, p. 609–623.
Maurer, D.K., 2002, Results of test drilling in the basalt aqui-fer near Fallon, Nevada: U.S. Geological Survey Fact Sheet, FS–048–02, 4 p.
Maurer, D.K., and Welch, A.H., 1996, Hydrogeology and potential effects of changes in water use, Carson Desert agricultural area, Churchill County, Nevada: U.S. Geologi-cal Survey Water Supply Paper 2436, 106 p.
Maurer, D.K., and Welch, A.H., 2001, Hydrogeology and geochemistry of the Fallon basalt and adjacent aquifers in Churchill County, Nevada, and potential sources of basalt recharge: U.S. Geological Survey Water-Resources Investi-gations Report 01–4130, 72 p.
Mettler, S., 2002, In situ iron removal from ground water—Fe(II) oxygenation, and precipitation products in a calcare-ous aquifer: Zurich, Swiss Federal Institute of Technology, Ph.D. Dissertation, 146 p.
Morrison, R.B., 1964, Lake Lahontan—Geology of southern Carson Desert, Nevada: U.S.: Geological Survey Profes-sional Paper 401, 156 p.
Morrison, R.B., 1991, Quaternary stratigraphic, hydrologic, and climatic history of the Great Basin, with emphasis on Lakes Lahontan, Bonneville, and Tecopa, in Morrison, R.B., ed., The Geology of North America, Quaternary Nongla-cial Geology—Conterminous U.S. Geological Society of America, p. 283–320.
Owenby, J.R., and Ezell, D.S., 1992, Monthly station nor-mals of temperature, precipitation, and heating and cooling degree days, 1961–1990, Nevada: National Climatic Data Center Report 81, 20 p.
26 Characterization of Surface-Water Quality and Potential Geochemical Reactions from Storage of Surface Water

Parkhurst, D.L., and Appelo, C.A.J., 1999, User’s guide to PHREEQC (version 2): U.S. Geological Survey Water-Resources Investigations Report 99–4259, 312 p.
Patton, C.J., and Truitt, E.P., 2000, Methods of analysis by the U.S. Geological Survey National Water Quality Labora-tory—Determination of ammonium plus organic nitrogen by a Kjeldahl digestion method and an automated photomet-ric finish that includes digest cleanup by gas diffusion: U.S. Geological Survey Open-File Report 00–170, 31 p.
Redman, A.D., Macalady, D.L., and Ahmann, D., 2002, Natu-ral organic matter affects arsenic speciation and sorption onto hematite: Environmental Science & Technology, v. 36, p. 2889–2896.
Stollenwerk, K.G., 2003, Geochemical processes controlling transport of arsenic in groundwater—A review of adsorp-tion, in Welch, A.H., and Stollenwerk, K.G., eds., Arsenic in ground water: Geochemistry and Occurrence, Boston, Mass., Kluwer Academic Publishers, p. 67–100.
Struzeski, T.M., DeGiacomo, W.J., and Zayhowski, E.J., 1996, Methods of analysis by the U.S. Geological Survey National Water Quality Laboratory—Determination of dissolved alu-minum and boron in water by inductively coupled plasma-atomic emission spectrometry: U.S. Geological Survey Open-File Report 96–149, 17 p.
Sumner, M.E., and Miller, W.P., 1996, Cation exchange capac-ity and exchange coefficients, methods of soil analysis—Part 3. chemical methods: Soil Science Society of America, p. 1218–1220.
Swedlund, P.J., and Webster, J.G., 1999, Adsorption and poly-merisation of silicic acid on ferrihydrite, and its effect on arsenic adsorption: Water Research, v. 33, p. 3413–3422.
Tessier, A., Campbell, P.G.C., and Bisson, M., 1979, Sequen-tial extraction procedure for the speciation of particulate trace metals: Analytical Chemistry, v. 51, p. 844–851.
Thatcher, L.L., Janzer, V.J., and Edwards, K.W., 1977, Meth-ods for determination of radioactive substances in water and fluvial sediments: U.S. Geological Survey Techniques of Water-Resources Investigations, Book 5, Chapter A5, 95 p.
Van Geen, A., Robertson, A.P., and Leckie, J.O., 1994, Complexation of carbonate species at the goethite surface—implications for adsorption of metal ions in natural waters: Geochimica et Cosmochimica Acta, v. 58, p. 2073–2086.
Welch, A.H., and Lico, M.S., 1998, Factors controlling As and U in shallow ground water, southern Carson Desert, Nevada: Applied Geochemistry, v. 13, no. 4, p. 521–539.
Welch, A.H., Stollenwerk, K.G., Maurer, D.K., and Feinson, L.S., 2003, In situ arsenic remediation in a fractured, alka-line aquifer, in Welch, A.H., and Stollenwerk, K.G., eds., Arsenic in Ground Water, Geochemistry and Occurrence: Boston, Mass., Kluwer Academic Publishers, p. 403–419.
Welch, A.H., Westjohn, D.B., Helsel, D.R., and Wanty, R.B., 2000, Arsenic in ground water of the United States—Occur-rence and geochemistry: Ground Water, v. 38, no. 4, p. 589–604.
Wilde, F.D., and Radtke, D.B., eds., 1998, National Field Manual for the collection of water-quality data: U.S. Geo-logical Survey Techniques of Water-Resources Investiga-tions, Book 9, Chapter A6, 128 p.
Zaugg, S.D., Sandstrom, M.W., Smith, S.G., and Fehlberg, K.M., 1995, Methods of analysis by the U.S. Geological Survey National Water Quality Laboratory—Determination of pesticides in water by C-18 solid-phase extraction and capillary-column gas chromatography/mass spectrometry with selected-ion monitoring: U.S. Geological Survey Water-Resources Investigations Report 95–181, 49 p.
Zaugg, S.D., Smith, S.G., Schroeder, M.P., Barber, L.B., and Burkhardt, M.R., 2002, Methods of analysis by the U.S. Geological Survey National Water Quality Laboratory—Determination of wastewater compounds by polystyrene-divinylbenzene solid-phase extraction and capillary-column gas chromatography/mass spectrometry: U.S. Geological Survey Water-Resources Investigations Report 01–4186, 37 p.
References Cited 27


APPENDIXES
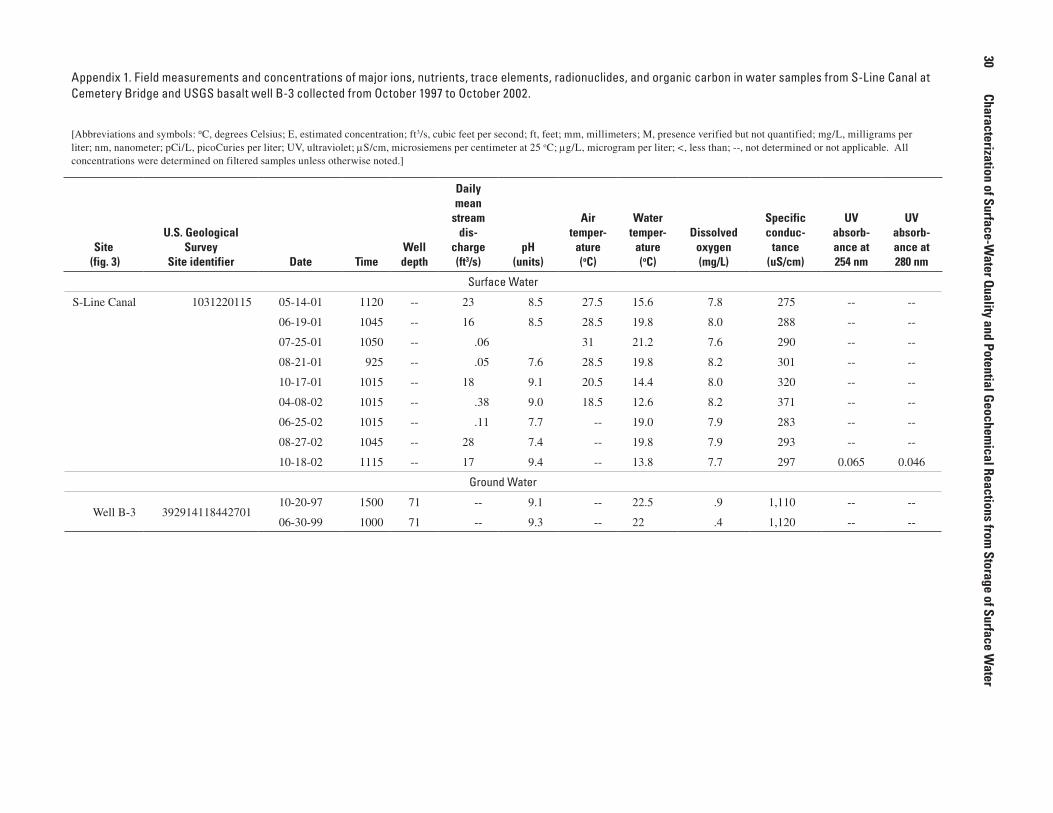
Appendix 1. Field measurements and concentrations of major ions, nutrients, trace elements, radionuclides, and organic carbon in water samples from S-Line Canal at Cemetery Bridge and USGS basalt well B-3 collected from October 1997 to October 2002.
[Abbreviations and symbols: oC, degrees Celsius; E, estimated concentration; ft3/s, cubic feet per second; ft, feet; mm, millimeters; M, presence verified but not quantified; mg/L, milligrams per liter; nm, nanometer; pCi/L, picoCuries per liter; UV, ultraviolet; µS/cm, microsiemens per centimeter at 25 oC; µg/L, microgram per liter; <, less than; --, not determined or not applicable. All concentrations were determined on filtered samples unless otherwise noted.]
Site (fig. 3)
U.S. Geological Survey
Site identifier Date TimeWell depth
Daily mean
stream dis-
charge(ft3/s)
pH (units)
Air temper-
ature(oC)
Water temper-
ature (oC)
Dissolved oxygen(mg/L)
Specific conduc-
tance(uS/cm)
UV absorb-ance at 254 nm
UV absorb-ance at 280 nm
Surface Water
S-Line Canal 1031220115 05-14-01 1120 -- 23 8.5 27.5 15.6 7.8 275 -- --
06-19-01 1045 -- 16 8.5 28.5 19.8 8.0 288 -- --
07-25-01 1050 -- .06 31 21.2 7.6 290 -- --
08-21-01 925 -- .05 7.6 28.5 19.8 8.2 301 -- --
10-17-01 1015 -- 18 9.1 20.5 14.4 8.0 320 -- --
04-08-02 1015 -- .38 9.0 18.5 12.6 8.2 371 -- --
06-25-02 1015 -- .11 7.7 -- 19.0 7.9 283 -- --
08-27-02 1045 -- 28 7.4 -- 19.8 7.9 293 -- --
10-18-02 1115 -- 17 9.4 -- 13.8 7.7 297 0.065 0.046
Ground Water
Well B-3 39291411844270110-20-97 1500 71 -- 9.1 -- 22.5 .9 1,110 -- --
06-30-99 1000 71 -- 9.3 -- 22 .4 1,120 -- --
30 Characterization
ofSurface-WaterQuality
andPotentialGeochem
icalReactionsfrom
StorageofSurface
Water
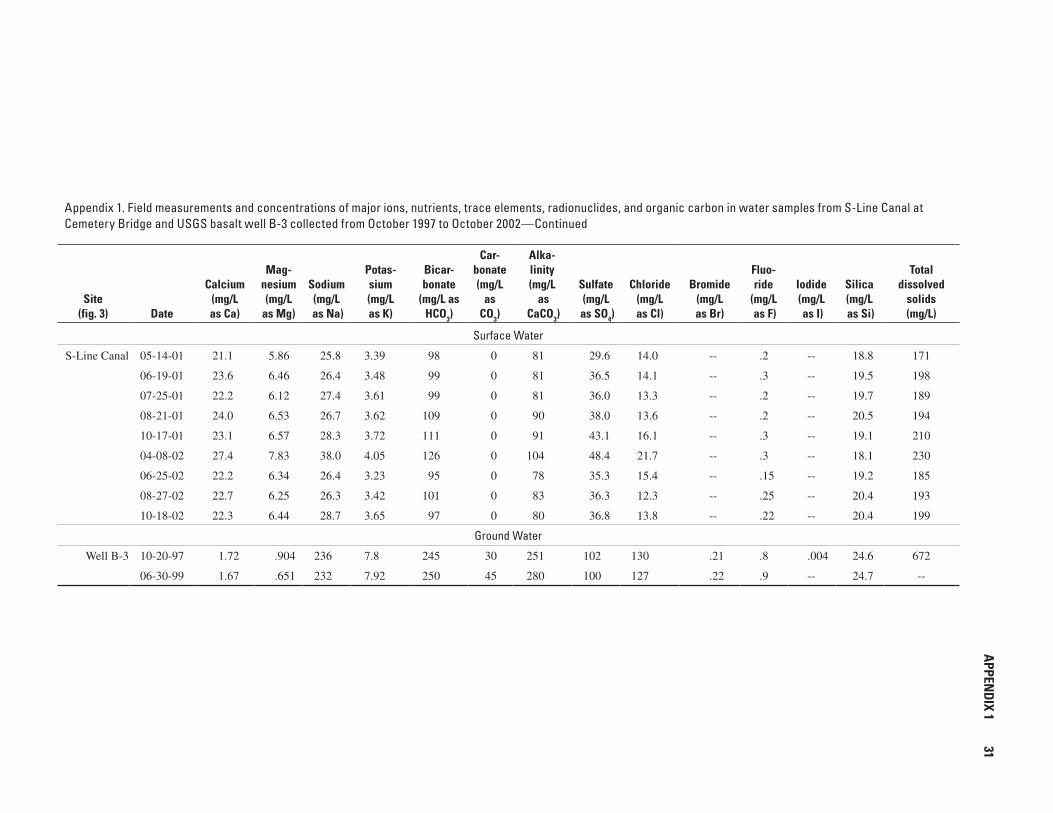
Appendix 1. Field measurements and concentrations of major ions, nutrients, trace elements, radionuclides, and organic carbon in water samples from S-Line Canal at Cemetery Bridge and USGS basalt well B-3 collected from October 1997 to October 2002—Continued
Site (fig. 3) Date
Calcium(mg/L as Ca)
Mag-nesium(mg/L
as Mg)
Sodium(mg/L
as Na)
Potas-sium(mg/L as K)
Bicar-bonate
(mg/L as HCO3)
Car-bonate(mg/L
as CO3)
Alka- linity(mg/L
as CaCO3)
Sulfate(mg/L
as SO4)
Chloride(mg/L as Cl)
Bromide(mg/L as Br)
Fluo-ride
(mg/L as F)
Iodide(mg/L as I)
Silica(mg/L as Si)
Totaldissolved
solids(mg/L)
Surface Water
S-Line Canal 05-14-01 21.1 5.86 25.8 3.39 98 0 81 29.6 14.0 -- .2 -- 18.8 171
06-19-01 23.6 6.46 26.4 3.48 99 0 81 36.5 14.1 -- .3 -- 19.5 198
07-25-01 22.2 6.12 27.4 3.61 99 0 81 36.0 13.3 -- .2 -- 19.7 189
08-21-01 24.0 6.53 26.7 3.62 109 0 90 38.0 13.6 -- .2 -- 20.5 194
10-17-01 23.1 6.57 28.3 3.72 111 0 91 43.1 16.1 -- .3 -- 19.1 210
04-08-02 27.4 7.83 38.0 4.05 126 0 104 48.4 21.7 -- .3 -- 18.1 230
06-25-02 22.2 6.34 26.4 3.23 95 0 78 35.3 15.4 -- .15 -- 19.2 185
08-27-02 22.7 6.25 26.3 3.42 101 0 83 36.3 12.3 -- .25 -- 20.4 193
10-18-02 22.3 6.44 28.7 3.65 97 0 80 36.8 13.8 -- .22 -- 20.4 199
Ground Water
Well B-3 10-20-97 1.72 .904 236 7.8 245 30 251 102 130 .21 .8 .004 24.6 672
06-30-99 1.67 .651 232 7.92 250 45 280 100 127 .22 .9 -- 24.7 --
APPENDIX 1
31

Appendix 1. Field measurements and concentrations of major ions, nutrients, trace elements, radionuclides, and organic carbon in water samples from S-Line Canal at Cemetery Bridge and USGS basalt well B-3 collected from October 1997 to October 2002—Continued
Site (fig. 3) Date
Nitrateplus
nitrite(mg/L as
N)
Nitrite(mg/L as
N)
Ammonia(mg/L as N)
Ammoniaplus
organicnitrogen
(mg/L as N)
Ammoniaplus
organicnitrogen,
total(mg/L as N)
Nitrogen,particulate
(mg/L as N)
Totalphosphorus
whole water(mg/L as P)
Totalphosphorus
filtered(mg/L as P)
Ortho-phosphate
filtered(mg/L as P)
Carbon,inorganic
plusorganic,
total(mg/L as C)
Carbon,inorganic
plusorganic,
particulate(mg/L as C)
Surface Water
S-Line Canal 05-14-01 0.17 0.015 0.05 0.27 0.45 0.09 0.131 0.073 0.06 0.7 M
06-19-01 .15 .007 <.04 .20 .40 .16 .131 .079 .07 1.3 <.1
07-25-01 .14 E.003 <.04 .20 .39 .32 .190 .094 .08 2.0 <.1
08-21-01 .12 <.006 <.04 .22 .43 .16 .164 .109 .09 1.3 <.1
10-17-01 .09 <.008 <.04 .21 .39 .19 .196 .113 .09 1.4 <.1
04-08-02 <.05 <.008 <.04 .21 .34 .12 .105 .081 .05 0.6
06-25-02 E.03 <.008 <.04 .14 .34 .18 .139 .085 .07 1.2 <.1
08-27-02 .05 <.008 <.04 .19 .31 .11 .141 .097 .09 0.7 <.1
10-18-02 <.06 <.008 <.04 .19 .33 .10 .162 .111 .08 0.7 <.1
Ground Water
Well B-3 10-20-97 -- -- -- -- -- -- -- -- .27 -- --
06-30-99 -- -- -- -- -- -- -- -- -- -- --
32 Characterization
ofSurface-WaterQuality
andPotentialGeochem
icalReactionsfrom
StorageofSurface
Water
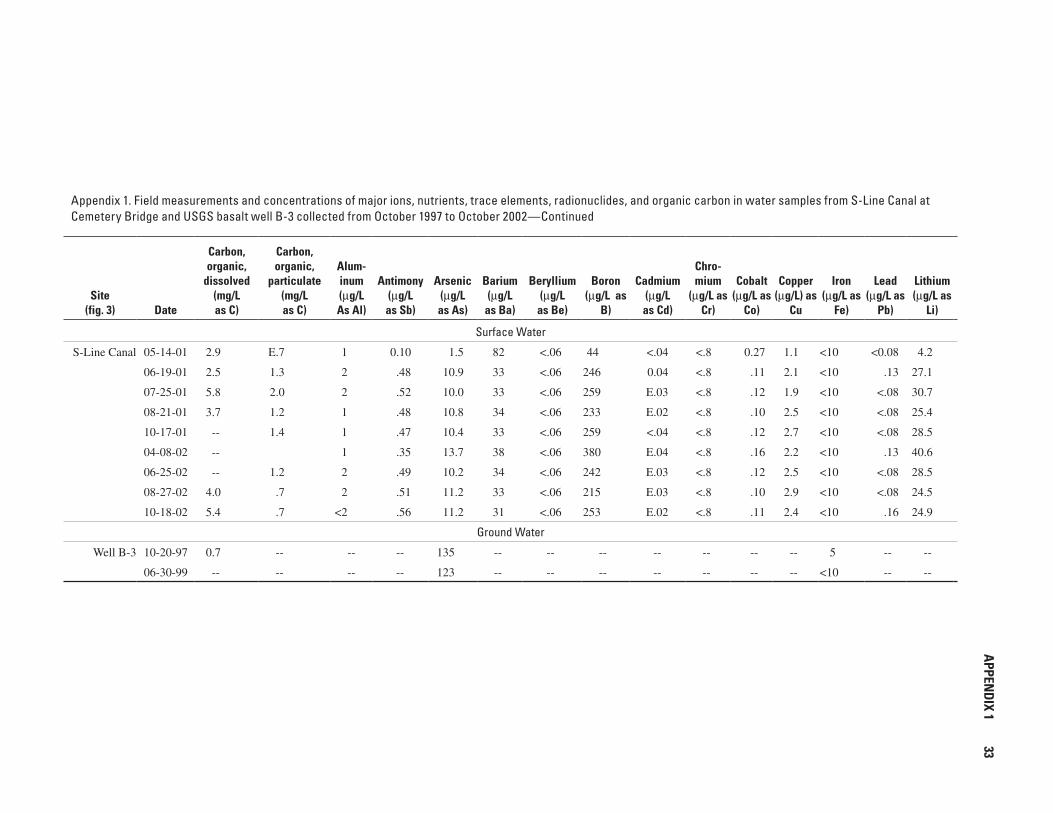
Appendix 1. Field measurements and concentrations of major ions, nutrients, trace elements, radionuclides, and organic carbon in water samples from S-Line Canal at Cemetery Bridge and USGS basalt well B-3 collected from October 1997 to October 2002—Continued
Site (fig. 3) Date
Carbon,organic,
dissolved(mg/Las C)
Carbon,organic,
particulate(mg/Las C)
Alum-inum(µg/L As Al)
Antimony(µg/L as Sb)
Arsenic(µg/L as As)
Barium(µg/L
as Ba)
Beryllium(µg/L
as Be)
Boron(µg/L as
B)
Cadmium(µg/Las Cd)
Chro-mium
(µg/L as Cr)
Cobalt(µg/L as
Co)
Copper(µg/L) as
Cu
Iron(µg/L as
Fe)
Lead(µg/L as
Pb)
Lithium(µg/L as
Li)
Surface Water
S-Line Canal 05-14-01 2.9 E.7 1 0.10 1.5 82 <.06 44 <.04 <.8 0.27 1.1 <10 <0.08 4.2
06-19-01 2.5 1.3 2 .48 10.9 33 <.06 246 0.04 <.8 .11 2.1 <10 .13 27.1
07-25-01 5.8 2.0 2 .52 10.0 33 <.06 259 E.03 <.8 .12 1.9 <10 <.08 30.7
08-21-01 3.7 1.2 1 .48 10.8 34 <.06 233 E.02 <.8 .10 2.5 <10 <.08 25.4
10-17-01 -- 1.4 1 .47 10.4 33 <.06 259 <.04 <.8 .12 2.7 <10 <.08 28.5
04-08-02 -- 1 .35 13.7 38 <.06 380 E.04 <.8 .16 2.2 <10 .13 40.6
06-25-02 -- 1.2 2 .49 10.2 34 <.06 242 E.03 <.8 .12 2.5 <10 <.08 28.5
08-27-02 4.0 .7 2 .51 11.2 33 <.06 215 E.03 <.8 .10 2.9 <10 <.08 24.5
10-18-02 5.4 .7 <2 .56 11.2 31 <.06 253 E.02 <.8 .11 2.4 <10 .16 24.9
Ground Water
Well B-3 10-20-97 0.7 -- -- -- 135 -- -- -- -- -- -- -- 5 -- --
06-30-99 -- -- -- -- 123 -- -- -- -- -- -- -- <10 -- --
APPENDIX 1
33

Appendix 1. Field measurements and concentrations of major ions, nutrients, trace elements, radionuclides, and organic carbon in water samples from S-Line Canal at Cemetery Bridge and USGS basalt well B-3 collected from October 1997 to October 2002—Continued
Site (fig. 3) Date
Manganese(µg/L
as Mn)
Mercury(µg/L
as Hg)
Mercury,Total(µg/L
as Hg)
Molyb-denum(µg/L
as Mo)
Nickel(µg/L as
Ni)
Selenium(µg/Las Se)
Silver(µg/L as
Ag)
Strontium(µg/Las Sr)
Thallium(µg/Las Tl)
Vanadium(µg/Las V)
Zinc(µg/L as
Zn)
Surface Water
S-Line Canal 05-14-01 5.5 -- 0.24 1.5 0.5 0.4 <1 357 E0.04 3.6 2
06-19-01 4.2 -- -- 5.6 .29 <.3 <1 246 .07 6.6 <1
07-25-01 3.9 -- .45 5.8 .29 <.3 <1 255 <.04 5.1 <1
08-21-01 2.1 -- .34 6.3 <.06 E.2 <1 263 <.04 5.5 2
10-17-01 1.9 -- .42 6.3 .65 E.3 <1 256 <.04 5.3 2
04-08-02 9.4 0.01 .18 7.6 .61 <.3 <1 284 <.04 5.3 1
06-25-02 7.5 -- .19 5.0 .36 E.2 <1 228 .16 5.2 1
08-27-02 3.1 E.01 -- 5.5 1.69 <.3 <1 242 <.04 5.7 1
10-18-02 3.0 <.02 -- 5.2 1.02 <.5 <.20 229 E.03 5.0 M
Ground Water
Well B-3 10-20-97 <1.0 -- -- -- -- -- -- -- -- -- --
06-30-99 <3.0 -- -- -- -- -- -- -- -- -- --
34 Characterization
ofSurface-WaterQuality
andPotentialGeochem
icalReactionsfrom
StorageofSurface
Water

Appendix 1. Field measurements and concentrations of major ions, nutrients, trace elements, radionuclides, and organic carbon in water samples from S-Line Canal at Cem-etery Bridge and USGS basalt well B-3 collected from October 1997 to October 2002—Continued
Site (fig. 3) Date
Deltadeuterium(per mil)
Deltaoxygen-18(per mil)
Alpharadioactivity
(pCi/Las Th-230)
Alpharadioactivity,
2-sigmaprecisionestimate
(pCi/Las Th-230)
Grossbeta
radioactivity(pCi/L
as Cs-137)
Betaradioactivity,
2-sigmaprecisionestimate
(pCi/Las Cs-137)
Radium-226(pCi/L)
Radium-226,2-sigma
precisionestimate(pCi/L)
Uranium,natural(µg/L)
Surface Water
S-Line Canal 05-14-01 -85.7 -10.35 <3 1.3 5 1.6 0.04 0.02 2.59
06-19-01 -89.1 -10.48 3 1.4 6 1.7 .05 .02 3.88
07-25-01 -88.2 -10.36 3 1.2 8 2.0 .06 .02 3.68
08-21-01 -84.5 -9.92 3 1.1 6 1.8 .04 .02 3.76
10-17-01 -81.0 -9.23 3 1.2 7 1.9 .05 .01 4.12
04-08-02 -84.2 -10.00 5 1.8 9 2.2 .23 .05 5.62
06-25-02 -90.1 -10.90 3 1.4 5 1.5 .03 .01 3.24
08-27-02 -86.7 -10.32 2 1.2 7 2.0 .06 .02 3.42
10-18-02 -86.5 -10.00 3 1.3 7 1.9 .04 .02 3.08
Ground Water
Well B-3 10-20-97 -110 -13.89 -- -- -- -- -- -- --
06-30-99 -- -- -- -- -- -- -- -- --
APPENDIX 1
35

Appendix 1. Field measurements and concentrations of major ions, nutrients, trace elements, radionuclides, and organic car-bon in water samples from S-Line Canal at Cemetery Bridge and USGS basalt well B-3 collected from October 1997 to October 2002— Continued
Site (fig. 3) Date
Carbon,inorganic plusorganic, total
(mg/L as C)
Carbon,inorganic plus
organic,particulate(mg/L as C)
Carbon,organic,
dissolved(mg/L as C)
Carbon,organic,
particulate(mg/L as C)
Surface Water
S-Line Canal 05-14-01 0.7 M 2.9 E.7
06-19-01 1.3 <.1 2.5 1.3
07-25-01 2.0 <.1 5.8 2.0
08-21-01 1.3 <.1 3.7 1.2
10-17-01 1.4 <.1 -- 1.4
04-08-02 .6 -- -- --
06-25-02 1.2 <.1 -- 1.2
08-27-02 .7 <.1 4.0 .7
10-18-02 .7 <.1 5.4 .7
Ground Water
Well B-3 10-20-97 -- -- .7 --
06-30-99 -- -- -- --
36 Characterization
ofSurface-WaterQuality
andPotentialGeochem
icalReactionsfrom
StorageofSurface
Water

Appendix 2. Concentrations of organic compounds in water samples from S-Line Canal collected from Cemetery Bridge, May 2001 to October 2002
[All samples were filtered unless otherwise noted by “Total”. Abbreviations and symbols: E, estimated value; M, presence verified, not quantified; --, not analyzed; <, less than]
Date Time
1,4-Di-chloro-
benzene(µg/L)
1-Methyl-
naphthalene(µg/L)
2,6-Diethyl-aniline(µg/L)
2,6-Dimethyl-
naphthalene(µg/L)
2-Methyl-
naphthalene(µg/L)
3-BetaCopro-stanol(µg/L)
3-Methyl-
1(H)-indole(µg/L)
3-tert-butyl-
4-hydroxy-anisole(µg/L)
4-Cumyl-phenol(µg/L)
4-Octyl-phenol(µg/L)
4-tert-octyl-
phenol(µg/L)
5-Methyl-1H-benzo-
triazole(µg/L)
05-14-01 1120 -- -- <0.002 -- -- -- -- -- -- -- -- --
06-19-01 1045 -- -- <.002 -- -- -- -- -- -- -- -- --
08-21-01 925 -- -- <.002 -- -- -- -- -- -- -- -- --
10-17-01 1015 <.5 <.5 <.002 <.5 <.5 <2 <1 <5 <1 <1 <1 <2
04-08-02 1015 <.5 <.5 <.006 <.5 <.5 <2 <1 <5 <1 <1 <1 <2
08-27-02 1045 <.5 <.5 <.006 <.5 <.5 M <1 <5 <1 <1 <1 <2
10-18-02 1115 -- -- <.006 -- -- -- -- -- -- -- -- --
Date
Aceto-chlor(µg/L)
Aceto-phenone
(µg/L)
Acetylhexamethyl-tetrahydro-
naphthalene(µg/L)
Alachlor(µg/L)
Aldrin,Total(µg/L)
AlphaBHC
(µg/L)
Anthra-cene(µg/L)
Anthra-quinone
(µg/L)Atrazine
(µg/L)
Ben-fluralin(µg/L)
Benzo(a)-pyrene(µg/L)
Benzo-phenone
(µg/L)
Beta-sitosterol
(µg/L)
Bis-phenol A
(µg/L)Bromacil
(µg/L)
05-14-01 <.004 -- -- <.002 -- <.005 -- -- E.002 <.010 -- -- -- -- --
06-19-01 <.004 -- -- <.002 -- <.005 -- -- E.002 <.010 -- -- -- -- --
08-21-01 <.004 -- -- <.002 <.01 <.005 -- -- <.007 <.010 -- -- -- -- --
10-17-01 <.004 E.1 M <.002 -- <.005 <.5 <.5 <.007 <.010 <.5 <.5 <2 3 <.5
04-08-02 <.006 <.5 <.5 <.004 -- <.005 <.5 <.5 <.007 <.010 <.5 <.5 <2 <1 E.2
08-27-02 <.006 E.1 <.5 <.004 <.01 <.005 <.5 <.5 <.007 <.010 <.5 <.5 <2 <1 <.5
10-18-02 <.006 -- -- <.007 -- <.005 -- -- <.007 <.010 -- -- -- -- --
APPENDIX 2
37
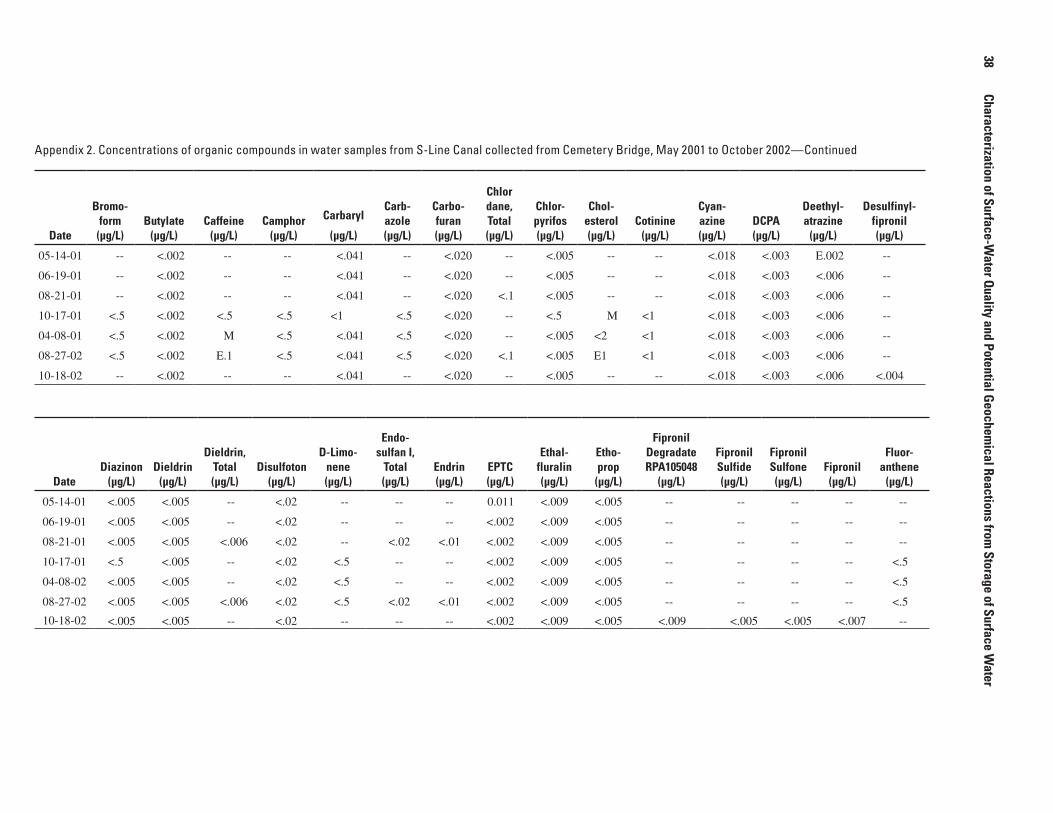
Appendix 2. Concentrations of organic compounds in water samples from S-Line Canal collected from Cemetery Bridge, May 2001 to October 2002—Continued
Date
Bromo-form
(µg/L)Butylate
(µg/L)Caffeine
(µg/L)Camphor
(µg/L)
CarbarylCarb-azole(µg/L)
Carbo-furan(µg/L)
Chlordane,Total(µg/L)
Chlor-pyrifos(µg/L)
Chol-esterol(µg/L)
Cotinine(µg/L)
Cyan-azine(µg/L)
DCPA(µg/L)
Deethyl-atrazine
(µg/L)
Desulfinyl-fipronil(µg/L)(µg/L)
05-14-01 -- <.002 -- -- <.041 -- <.020 -- <.005 -- -- <.018 <.003 E.002 --
06-19-01 -- <.002 -- -- <.041 -- <.020 -- <.005 -- -- <.018 <.003 <.006 --
08-21-01 -- <.002 -- -- <.041 -- <.020 <.1 <.005 -- -- <.018 <.003 <.006 --
10-17-01 <.5 <.002 <.5 <.5 <1 <.5 <.020 -- <.5 M <1 <.018 <.003 <.006 --
04-08-01 <.5 <.002 M <.5 <.041 <.5 <.020 -- <.005 <2 <1 <.018 <.003 <.006 --
08-27-02 <.5 <.002 E.1 <.5 <.041 <.5 <.020 <.1 <.005 E1 <1 <.018 <.003 <.006 --
10-18-02 -- <.002 -- -- <.041 -- <.020 -- <.005 -- -- <.018 <.003 <.006 <.004
DateDiazinon
(µg/L)Dieldrin
(µg/L)
Dieldrin,Total(µg/L)
Disulfoton(µg/L)
D-Limo-nene(µg/L)
Endo-sulfan I,
Total(µg/L)
Endrin(µg/L)
EPTC(µg/L)
Ethal-fluralin(µg/L)
Etho-prop
(µg/L)
FipronilDegradateRPA105048
(µg/L)
FipronilSulfide(µg/L)
FipronilSulfone(µg/L)
Fipronil(µg/L)
Fluor-anthene
(µg/L)
05-14-01 <.005 <.005 -- <.02 -- -- -- 0.011 <.009 <.005 -- -- -- -- --
06-19-01 <.005 <.005 -- <.02 -- -- -- <.002 <.009 <.005 -- -- -- -- --
08-21-01 <.005 <.005 <.006 <.02 -- <.02 <.01 <.002 <.009 <.005 -- -- -- -- --
10-17-01 <.5 <.005 -- <.02 <.5 -- -- <.002 <.009 <.005 -- -- -- -- <.5
04-08-02 <.005 <.005 -- <.02 <.5 -- -- <.002 <.009 <.005 -- -- -- -- <.5
08-27-02 <.005 <.005 <.006 <.02 <.5 <.02 <.01 <.002 <.009 <.005 -- -- -- -- <.5
10-18-02 <.005 <.005 -- <.02 -- -- -- <.002 <.009 <.005 <.009 <.005 <.005 <.007 --
38 Characterization
ofSurface-WaterQuality
andPotentialGeochem
icalReactionsfrom
StorageofSurface
Water

Appendix 2. Concentrations of organic compounds in water samples from S-Line Canal collected from Cemetery Bridge, May 2001 to October 2002—Continued
DateFonofos(µg/L)
Hepta-chlor-
epoxide,Total(µg/L)
Hepta-chlor,Total(µg/L)
Hexahydro-hexamethyl-cyclopenta-benzopyran
(µg/L)Indole(µg/L)
Iso-borneol(µg/L)
Iso-phorone
(µg/L)
Isopropyl-benzene
(Cumene)(µg/L)
Iso-quinoline
(µg/L)Lindane
(µg/L)
Lindane,Total(µg/L)
Linuron(µg/L)
Malathion(µg/L)
Menthol(µg/L)
05-14-01 <.003 -- -- -- -- -- -- -- -- <.004 -- <.035 <.027 --
06-19-01 <.003 -- -- -- -- -- -- -- -- <.004 -- <.035 <.027 --
08-21-01 <.003 <.009 <.01 -- -- -- -- -- -- <.004 <.006 <.035 <.027 --
10-17-01 <.003 -- -- M <.5 <.5 E.3 <.5 <.5 <.004 -- <.035 <.027 <.5
04-08-02 <.003 -- -- <.5 <.5 <.5 <.5 M <.5 <.004 -- <.035 <.027 <.5
08-27-02 <.003 <.009 <.01 <.5 <.5 <.5 1.8 <.5 <.5 <.004 <.006 <.035 <.027 <.5
10-18-02 <.003 -- -- -- -- -- -- -- -- <.004 -- <.035 <.027 --
Date
Meta-laxyl(µg/L)
Meth-oxychlor,
Total(µg/L)
Methyl-azinphos
(µg/L)
Methyl-parathion
(µg/L)
Methyl-salicylate
(µg/L)
Meto-lachlor(µg/L)
Metri-buzin,
(Sencor)(µg/L)
MirexTotal(µg/L)
Molinate(µg/L)
N,N,-Diethyl-meta- Diethyl-
toluamide(DEET)(µg/L)
Naph-thalene(µg/L)
Naprop-amide(µg/L)
Diethoxy-nonyl-phenol(µg/L)
Diethoxy-octyl-
phenol(µg/L)
05-14-01 -- -- <.050 <.006 -- <.013 <.006 -- <.002 -- -- <.007 -- --
06-19-01 -- -- <.050 <.006 -- <.013 <.006 -- <.002 -- -- <.007 -- --
08-21-01 -- <.020 <.050 <.006 -- <.013 <.006 <.006 <.002 -- -- <.007 -- --
10-17-01 <.5 -- <.050 <.006 <.5 <.5 <.006 -- <.002 M <.5 <.007 <5 <1
04-08-02 <.5 -- <.050 <.006 <.5 <.013 <.006 -- <.002 E.1 <.5 <.007 <5 <1
08-27-02 <.5 <.020 <.050 <.006 <.5 <.013 <.006 <.006 <.002 E.1 <.5 <.007 <5 <1
10-18-02 -- -- <.050 <.006 -- <.013 <.006 -- <.002 -- -- <.007 -- -- APPENDIX 2
39

Appendix 2. Concentrations of organic compounds in water samples from S-Line Canal collected from Cemetery Bridge, May 2001 to October 2002—Continued
Date
Mono- ethoxy-octyl-
phenol(µg/L)
p,p’-DDETotal(µg/L)
p,p’-DDD,Total(µg/L)
p,p’-DDE,Total(µg/L)
p,p’-DDT,Total(µg/L)
Para-cresol(µg/L)
Para-nonyl-phenol(µg/L)
Para-thion(µg/L)
PCBTotal(µg/L)
Peb-ulate(µg/L)
Pendi-methalin
(µg/L)
Penta-chloro-phenol(µg/L)
Cis-perm-ethrin(µg/L)
05-14-01 -- <.003 -- -- -- -- -- <.007 <.002 <.010 -- <.006
06-19-01 -- <.003 -- -- -- -- -- <.007 <.002 <.010 -- <.006
08-21-01 -- <.003 <.007 <.006 <.009 -- -- <.007 <.1 <.002 <.010 -- <.006
10-17-01 <1 <.003 -- -- -- <1 <5 <.007 <.002 <.010 <2 <.006
04-08-02 <1 <.003 -- -- -- <1 <5 <.010 <.004 <.022 <2 <.006
08-27-02 <1 <.003 <.007 <.006 <.009 <1 <5 <.010 <.1 <.004 <.022 <2 <.006
10-18-02 -- <.003 -- -- -- -- -- <.010 <.004 <.022 -- <.006
Date
Phen-anthrene
(µg/L)Phenol(µg/L)
Phorate(µg/L)
Prometon(µg/L)
Pron-amide(µg/L)
Propachlor(µg/L)
Propanil(µg/L)
Propargite(µg/L)
Pyrene(µg/L)
Simazine(µg/L)
Stig-mastanol
(µg/L)
Tebu-thiuron(µg/L)
Terbacil(µg/L)
Terbufos(µg/L)
05-14-01 -- -- <.011 M <.004 <.010 <.011 <.02 -- <.011 -- <.02 <.034 <.02
06-19-01 -- -- <.011 <.01 <.004 <.010 <.011 <.02 -- E.002 -- <.02 <.034 <.02
08-21-01 -- -- <.011 <.01 <.004 <.010 <.011 <.02 -- <.011 -- <.02 <.034 <.02
10-17-01 <.5 E.3 <.011 <.5 <.004 <.010 <.011 <.02 <.5 <.011 <2 <.02 <.034 <.02
04-08-02 <.5 <.5 <.011 <.01 <.004 <.010 <.011 <.02 <.5 <.005 <2 <.02 <.034 <.02
08-27-02 <.5 E.4 <.011 <.01 <.004 <.010 <.011 <.02 <.5 <.005 <2 <.02 <.034 <.02
10-18-02 -- -- <.011 <.01 <.007 <.010 <.011 <.02 -- <.005 -- <.02 <.050 <.02
40 Characterization
ofSurface-WaterQuality
andPotentialGeochem
icalReactionsfrom
StorageofSurface
Water

Appendix 2. Concentrations of organic compounds in water samples from S-Line Canal collected from Cemetery Bridge, May 2001 to October 2002—Continued
Date
Tetra-chloro-
ethylene(µg/L)
Thio-bencarb
(µg/L)
Toxa-phene,Total(µg/L)
Tri-(2-chloro-
ethyl)phosphate
(µg/L)
Tri- (dichlor-
isopropyl)-phosphate
(µg/L)
Tri-allate(µg/L)
Tributyl-phosphate
(µg/L)Triclosan
(µg/L)
Triethyl-citrate(µg/L)
Trifluralin(µg/L)
Triphenyl-phosphate
(µg/L)
Tris-(2-butoxy-
ethyl)-phosphate
(µg/L)
Dichlor-vos
(µg/L)
05-14-01 -- <.005 -- -- -- <.002 -- -- -- <.009 -- -- --
06-19-01 -- <.005 -- -- -- <.002 -- -- -- <.009 -- -- --
08-21-01 -- <.005 <1 -- -- <.002 -- -- -- <.009 -- -- --
10-17-01 <.5 <.005 -- <.5 E.1 <.002 <.5 <1 <.5 <.009 M E.2 <1.00
04-08-02 <.5 <.005 -- E.1 E.1 <.002 <.5 <1 <.5 <.009 <.5 E.2 <1.00
08-27-02 <.5 <.005 <1 M M <.002 <.5 <1 <.5 <.009 <.5 E.1 <1.00
10-18-02 -- <.005 -- -- -- <.002 -- -- -- <.009 -- -- --
APPENDIX 2
41

Appendix 3. Reagents and analytical methods used for partial solution extractions
Water soluble and cation exchange capacity
Reagents, analytical steps, and analytes Reference
0.2 M NH4Cl: Dissolve 107 g of NH
4Cl and make up to 10 L with deionized water.
1. Weigh each rock sample and record. Take the entire amount for the analysis.
2. Add the rock to a 1,000 mL beaker or erlenmeyer flask and add 300 mL of 0.2 M NH4Cl.
3. Shake gently on a gyaratory shaker for 1 hour. Slow the shaker speed so there is no attrition grinding.
4. Decant the supernatant into a 2,000 mL volumetric flask.
5. Add another 300 mL of 0.2 M NH4Cl and shake for 1 hour as before.
6. Decant the supernatant into the same 2,000 mL volumetric flask.
7. Repeat steps 5 and 6 three more times for a total of five cycles.
8. Make the final volume up to 2,000 mL. Filter an aliquot and analyze by ICP-ES (Na, K, Ca, Mg, Al, SiO
2 and As).
9. Save the rock samples for anion exchange capacity.
Sumner and Miller (1996)
Anion exchange capacity
Reagents, analytical steps, and analytes Reference
0.2 M potassium nitrate 0.2 M KNO3: Dissolve 202 g of KNO
3 and make up to 10 L with deionized
water.
1. Wash the rock with 300 mL of DI water. Shake gently on the gyratory shaker for 1 hour and discard the wash water by decanting off.
2. Repeat step 1 two more times discarding the wash water each time.
3. Weigh the rock to determine the quantity of entrained liquid. Record.
4. Add 300 mL of 0.2 M KNO3 and shake for 1 hour. Decant the supernatant into a 2,000 mL
volumetric flask.
5. Repeat Step 4 four more times for a total of 5 cycles.
6. Make up the final volume to 2,000 mL and submit a filtered aliquot to chemistry for ammonia, total P, chloride and arsenic analysis.
7. Save the rock samples for determination of the carbonate minerals.
Sumner and Miller (1996)
42 Characterization of Surface-Water Quality and Potential Geochemical Reactions from Storage of Surface Water
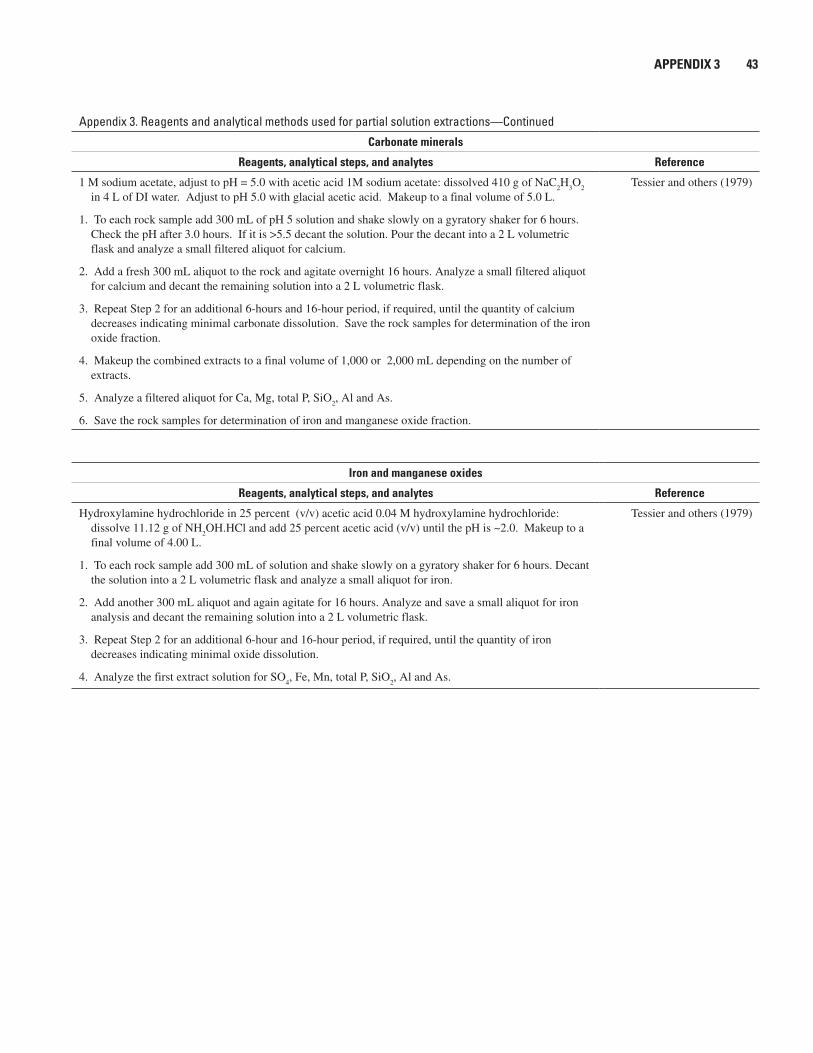
Appendix 3. Reagents and analytical methods used for partial solution extractions—Continued
Carbonate minerals
Reagents, analytical steps, and analytes Reference
1 M sodium acetate, adjust to pH = 5.0 with acetic acid 1M sodium acetate: dissolved 410 g of NaC2H
3O
2
in 4 L of DI water. Adjust to pH 5.0 with glacial acetic acid. Makeup to a final volume of 5.0 L.
1. To each rock sample add 300 mL of pH 5 solution and shake slowly on a gyratory shaker for 6 hours. Check the pH after 3.0 hours. If it is >5.5 decant the solution. Pour the decant into a 2 L volumetric flask and analyze a small filtered aliquot for calcium.
2. Add a fresh 300 mL aliquot to the rock and agitate overnight 16 hours. Analyze a small filtered aliquot for calcium and decant the remaining solution into a 2 L volumetric flask.
3. Repeat Step 2 for an additional 6-hours and 16-hour period, if required, until the quantity of calcium decreases indicating minimal carbonate dissolution. Save the rock samples for determination of the iron oxide fraction.
4. Makeup the combined extracts to a final volume of 1,000 or 2,000 mL depending on the number of extracts.
5. Analyze a filtered aliquot for Ca, Mg, total P, SiO2, Al and As.
6. Save the rock samples for determination of iron and manganese oxide fraction.
Tessier and others (1979)
Iron and manganese oxides
Reagents, analytical steps, and analytes Reference
Hydroxylamine hydrochloride in 25 percent (v/v) acetic acid 0.04 M hydroxylamine hydrochloride: dissolve 11.12 g of NH
2OH.HCl and add 25 percent acetic acid (v/v) until the pH is ~2.0. Makeup to a
final volume of 4.00 L.
1. To each rock sample add 300 mL of solution and shake slowly on a gyratory shaker for 6 hours. Decant the solution into a 2 L volumetric flask and analyze a small aliquot for iron.
2. Add another 300 mL aliquot and again agitate for 16 hours. Analyze and save a small aliquot for iron analysis and decant the remaining solution into a 2 L volumetric flask.
3. Repeat Step 2 for an additional 6-hour and 16-hour period, if required, until the quantity of iron decreases indicating minimal oxide dissolution.
4. Analyze the first extract solution for SO4, Fe, Mn, total P, SiO
2, Al and As.
Tessier and others (1979)
APPENDIX 3 43

Welch—
Characterization of Surface-Water Q
uality in the S-Line Canal, Basalt A
quifer near Fallon, Nevada —
Scientific Investigations Report 2005–5102