Embed Size (px)
Citation preview
Characterization of the amyloid precursor α-synuclein
by NMR spectroscopy
Dissertation
zur Erlangung des Doktorgrades
der Mathematisch-Naturwissenschaftlichen Fakultäten
der Georg-August-Universität zu Göttingen
vorgelegt von
Hai-Young Kim
aus Pusan, Süd Korea
Göttingen 2008

D7
Referent: Prof. Dr. Ulf Diederichsen
Korreferent: Prof. Dr. Christian Griesinger
Tag der mündlichen Prüfung:
i
A number of human neurodegenerative diseases, including Alzheimer's and
Parkinson's diseases (PD), are associated with the deposition of proteinaceous
aggregates known as amyloid fibrils. Surprisingly, proteins with very different amino
acid sequences and three-dimensional structures aggregate into amyloid fibrils that
share common characteristics, such as a similar morphology and a specific β-sheet-
based molecular architecture. This suggests that the ability to fibrillate is an intrinsic
property of a polypeptide chain and that the native structure is not necessarily the only
ordered structure that each protein can assume. An additional common property of
aggregation into amyloid fibrils is the presence of partially or fully unfolded states of
the misfolding proteins. Whereas there is increasing knowledge about the factors that
drive aggregation, the structural characteristics of intermediates and the molecular
details that determine the arrangement of misfolded proteins in amyloid fibrils are still
only understood in outline. Here in Chapter 3, it is demonstrated, by a combination of
solution-state and solid-state NMR spectroscopy, that the structure of amyloid fibrils of
α-synuclein (αS) is directly correlated to the conformational properties of the unfolded
state and monomeric state of misfolding proteins.
Amyloid fibrils have very high stability placing them among the strongest
known biological materials. It can be dissociated by high concentrations of chemical
denaturants or by high pressure. In Chapter 4, it is showed that amyloid fibrils formed
by the protein αS, which constitute the insoluble aggregates found in brains of patients
suffering from PD, are highly sensitive to low temperature. Despite their remarkable
Abstract
ii
stability to high temperature, mature amyloid fibrils of αS are rapidly dissociated into
monomers and small aggregates in supercooled water at −15 °C, without freezing.
Finally, Chapter 5 sheds light on understanding the mechanisms that govern αS
aggregation and toxicity in PD and related α-synucleinopathies by NMR in combination
with other spectroscopic methods. It is demonstrated that the phosphorylation at S129
and S87 expands the structure of αS, increases the conformational flexibility of wt αS
and inhibits its fibrillogenesis in vitro. In addition, the phosphorylation mimics (S129E
and S129D) do not reproduce the effect of phosphorylation on the structural and
aggregation properties of αS in vitro. However, the phosphorylation mimic S87E is able
to mimic the effect of phosphorylation on the aggregation properties of αS in vitro.
iii
사랑을 입은자는 그 곁에 안전히 거하리로다 여호와께서 그를 날이 맞도록 보호하시고
그로 자기 어깨 사이에 처하게 하시리로다 (신명기 33:12)
In an acknowledgement section such as this it is impossible to cover all persons who have directly or indirectly
contributed to my years in Göttingen. However, there are some people that I wish to mention in particular.
I am deeply grateful to the director of the department Prof. Dr. Christian Griesinger and my direct supervisor Prof.
Dr. Markus Zweckstetter for providing the opportunity to do my doctoral studies in an excellent scientific
environment with outstanding equipments, encouragement and for their guidance in NMR, stimulating suggestions,
support and immense faith in me.
I would also like to thank Prof. Dr. Ulf Diederichsen for accepting me as an external Ph.D. student in the Chemistry
Faculty of the Georg-August Göttingen University and Prof. Dr. Jörg Schroeder, Prof. Dr. Uwe Klingebiel, Prof.
Dr. Franc Meyer and Prof. Dr. Michael Buback for agreeing to be members of my external Ph.D. thesis committee.
I thank my collaborators with other laboratories, some of them presented on this thesis:
Prof. Dr. Marc Baldus and Prof Dr. Henrike Heise for solid sate NMR experiments and useful suggestions.
Dr. Stefan Becker and Karin Giller for their help in the bio-lab and outstanding guidance in α-synuclein
purification.
Dr. Rezaei-Ghaleh Nasrollah (Hessam), Pinar Karpinar and Min-Kyu Cho for their corporation, support and
stimulating discussion in trouble-shooting tricky synuclein problems.
Dr. Dietmar Riedel for his electron microscopy images and his professional suggestion for the same.
Dr. Volker klauken and Gerhard Wolf for the training in peptide synthesis and HPLC and Mass spectroscopy
analyzed.
Prof. Dr. Hilal Lashuel and Katrina E. Paleologou (at Brain Mind Institute in Lausanne, Switzerland) for their help
in the aggregation study of phosphorylated αS.
Claudio O. Fernandez, Gonzalo R. Lamberto, at Instituto de Biología Molecular y Celular in Rosario, Argentina
for their scientific discussion and support in αS phosphorylation.
Prof. Dr. Roland Benz and Elke Maier at Würtzburg universität in Germany, for lipid bilayer membrane
experiment and useful comments while analyzing synucline conductance data
I am grateful to all the present and former members of our group, who have contributed in every way to make my
stay a very memorable one:
Monika, Marco, Nils, Sergey, Lukasz, Fernando, ShengQi, Julian, Laura, Dirk, Stefan, Stefen, Jörg, Peter,
Mate, Melanie, Uwe, Valerie, Francesca, Ulrich, Anni, Gabi, Sebastian, Edith, Fabian, Edward, Sigrun, Adam,
Carlos, Donghan, Nicolas, Tea, Irene, Raghavendran, Jürgen, and Carsten for their cordiality and the rest of my
department for a delightful working atmosphere.
Acknowledgements
iv
I would like to express my sincere gratitude to:
Dr. Shyamala Thirunavukkuarasu for unofficially but always very useful discussion for synuclein project and the
thorough proofreading while still recovering from the baby birth and I wish all the best for ‘Vishwaved Vinesh’ who
will be the great scientist.
Dr. Vinesh Vijayan who is my trusted friend who made my Göttingen pleasant and memorable and I sincerely thank
his ‘Superman’ help when I had difficulties in spectrometer.
Dr. Young-Sang Jung for his faith in me, cheering me with simple, short meaningful conversations and his help in
developing backbone assignment program (MARS).
Dr. Pierre Montaville for being my counsellor, more like a brotherly figure and giving me a chance to learn how to
set ‘logics’ in science and life during ‘coffee break’.
Dr. Jegannath Korukottu for his happy greetings every morning, sharing emotions during my Ph.D. period and help
in different computational aspects.
Mrs. Silberer Siegrid, secretary to Prof. Griesinger, for her helping attitude in dealing with bureaucratic and other
paper works.
Prof. Dr. Wontae Lee for his constant support and advice from Korea.
Prof. Dr. K.Hun Mok for his scientific suggestion and his patient hearing to all my difficulties.
Pastor Jae-Jung An and the group of Goettingen Korean church people especially, Eun-Jung Kim, Yong Shin,
Yuna Park and Song-i Know for their endless helping and cheering whenever I need.
Kyu-Young Han for useful discussions, teaching tennis and for his delicious Korean dinner.
Dr. Jung-Sup Rhee and Sun-hae Park for their kind supports and warm advice in my Göttingen life.
My deep and warm thanks go my two brothers Hye-woong and Jin-woong for their encouragement and affection,
my aunt ‘imong’ for her care through mailing, prayers and visits to Goettingen, Min-Kyu for his love and helping
from the first and till the end of my PhD journey. Last but not the least, I want to express all my thanks and love to
My parents for their continuous love and prayers which gave me the strength to finish this thesis.
v
This thesis is based on the following publications:
(1) Kim H-Y, Heise H, Fernandez C.O, Baldus M and Zweckstetter M: Correlation of
Amyloid Fibril beta-Structure with the Unfolded State of alpha-synuclein.
Chembiochem. 2007, Sep; 8(14):1671-1674. (Chapter 3)
(2) Kim H-Y, Cho M-K, Riedel D, Fernandez C.O and Zweckstetter M: Dissociation
of amyloid fibrils of α-synuclein in supercooled water. Angew Chem Int Ed Engl.
2008, Jun; 47(27):5046-5048. (Chapter 4)
(3) Kim H-Y, Cho M-K, Ashotosh K, Riedel D, Benz R, Fernandez C.O, Lashuel HA,
Kügler S, Lange A, Griesinger C and Zweckstetter M: High-resolution
characterization of the structure of toxic α-synuclein oligomers. (In preparation).
(Chapter 4)
(4) Paleologou KE, Schmid AW, Rospigliosi CC, Kim H-Y, Lamberto GR,
Fredenburg RA, Lansbury, Jr. PT, Fernandez CO, Eliezer D, Zweckstetter M and
Lashuel HA: Phosphorylation at 129, but not the phosphomimic S129E/D inhibits
the fibrillization of alpha-synuclein. J Biol Chem. 2008, Jun; 283(24):16895-
16905. (Chapter 5)
(5) Paleologou KE, Shakked G, Rospigliosi CC, Kim H-Y, Lamberto GR, Schmid A,
Chiappe D, Moniate M, Eliezer D, Zweckstetter M, Masliah E and Lashuel HA:
Potential physiological and pathological roles of α-synuclein phosphorylation at
Serine 87. (Submitted). (Chapter 6)
(6) Montaville P, Kim H-Y, Vijayan V, Becker S, Zweckstetter M. 1H, 15N, and 13C
resonance assignment of the C2A domain of rabphilin-3A. J Biomol NMR. 2006;
36 Suppl 1:20 (Appendix)
Publication list
vi
Other publications:
(7) Cho M-K, Kim H-Y, Bernado P, Fernandez C.O, Blackledge M, and Zweckstetter
M: Amino Acid Bulkiness Defines the Local Conformations and Dynamics of
Natively Unfolded α-synuclein and Tau. J. Am. Chem. Soc. 2007, Mar;
129(11):3032-3033.
(8) Skora L, Cho M-K, Kim H-Y, Becker S, Fernandez CO, Blackledge M and
Zweckstetter M: Charge-Induced Molecular Alignment of Intrinsically Disordered
Proteins. Angew Chem Int Ed Engl. 2006, Oct; 45(42):7012-7015.
(9) Cho M-K, Kim H-Y, Fernandez C.O, and Zweckstetter M: Secondary structure
arrangements in amyloid fibrils of wild-type and A30P α-synuclein. (in
preparation).
vii
ABBREVIATIONS...................................................................................................................XI
1. INTRODUCTION ............................................................................................................... 14
1.1. Protein folding, misfolding and amyloid disease .......................................................... 14
1.1.1. Fibrillization and structure of amyloid fibrils ............................................................... 19
1.1.2. α-synuclein aggregation related to Parkinson’s disease (PD) ...................................... 20
1.2. Cold dissociation ............................................................................................................... 22
1.3. NMR spectroscopy ............................................................................................................ 26
1.3.1. J-couplings.................................................................................................................... 26
1.3.2. Chemical shift ............................................................................................................... 27
1.3.3. Nuclear Overhauser effect (NOE) ................................................................................ 27
1.3.4. Paramagnetic relaxation enhancement (PRE)............................................................... 28
1.3.5. Diffusion ordered spectroscopy (DOSY)...................................................................... 29
2. MATERIALS AND METHODS ......................................................................................... 33
2.1. Materials ............................................................................................................................. 33
2.1.1. Chemical reagents and enzymes ................................................................................... 33
2.1.2. Bacterial strains............................................................................................................. 34
2.1.3. Oligonucleotide primers for mutagenesis of α-synuclein............................................. 34
2.1.4. Equipments ................................................................................................................... 35
2.2. Methods.............................................................................................................................. 36
2.2.1. Molecular biology methods .......................................................................................... 36
2.2.1.1. Isolation of DNA ................................................................................................... 36
2.2.1.2. Site-directed mutagenesis of α-synuclein.............................................................. 37
2.2.1.3. DNA sequencing ................................................................................................... 37
2.2.1.4. Transformation of E. coli....................................................................................... 37
2.2.2. Methods for protein biochemistry................................................................................. 38
2.2.2.1. Expression and purification of α-synuclein........................................................... 38
2.2.2.2. Site-directed spin-labelling of proteins.................................................................. 40
2.2.2.3. Phosphorylation of α-synuclein in vitro ................................................................ 41
2.2.2.4. Synthesis of random coil peptides ......................................................................... 41
2.2.2.5. Reversed phase-high performance liquid chromatography (RP-HPLC) ............... 42
Table of contents
viii
2.2.2.6. Sample preparation for supercooled water. ........................................................... 42
2.2.2.7. Protein aggregation assay ...................................................................................... 43
2.2.2.8. Immunoblotting (dot blotting) ............................................................................... 44
2.2.3. NMR spectroscopy ....................................................................................................... 46
2.2.3.1. 1H-15N HSQC......................................................................................................... 46
2.2.3.2. Paramagnetic relaxation enhancement (PRE) ....................................................... 48
2.3.3.3. Diffusion coefficient and hydrodynamic radius .................................................... 49
2.2.3.4. Relaxation properties and motion.......................................................................... 50
2.2.3.5. Secondary structure determination ........................................................................ 51
2.2.3.6. Mapping of long-range interactions by chemical shift differences ....................... 51
2.2.4. Other spectroscopic methods ........................................................................................ 52
2.2.4.1. UV absorbance ...................................................................................................... 52
2.2.4.2. Electrospray Quadrupole Mass spectrometry........................................................ 53
2.2.4.3. Circular dichroism (CD) spectroscopy .................................................................. 53
2.2.4.4. Electron microscopy (EM) .................................................................................... 53
3. CORRELATION OF AMYLOID FIBRIL β-STRUCTURE WITH THE UNFOLDED
STATE OF α-SYNUCLEIN..................................................................................................... 55
3.1. Introduction ....................................................................................................................... 55
3.2. Experimental procedure ................................................................................................... 57
3.3. Results and discussion ..................................................................................................... 57
3.3.1. Backbone assignment of α-synuclein at −15 °C........................................................... 57
3.3.2. Comparison of secondary chemical shifts and NOE intensity at +15 °C and −15 °C .. 60
3.3.3. Attenuation of transient long-range interactions in α-synuclein at −15 °C .................. 62
3.3.4. Correlation of amyloid β-structure with the unfolded state of α-synuclein.................. 64
3.4. Conclusion .......................................................................................................................... 69
4. DISSOCIATION OF AMYLOID FIBRILS OF α-SYNUCLEIN IN SUPERCOOLED
WATER. ..................................................................................................................................... 71
4.1. Introduction ....................................................................................................................... 71
4.2. Experimental procedure ................................................................................................... 73
4.3. Results and discussion ..................................................................................................... 74
4.3.1. Dissociation of α-synuclein fibrils in supercooled water ............................................. 74
4.3.1.1. Dissociation followed by real-time 2D 1H-15N HSQC NMR ................................ 76
ix
4.3.1.2. Comparisons of biophysical properties: dissociated and native monomer of α-
synuclein............................................................................................................................. 77
4.3.1.3. Which interactions hold α-synuclein fibrils together? .......................................... 80
4.3.2. Characterization of α-synuclein oligomers derived from amyloid fibrils through
supercooled water ................................................................................................................... 84
4.3.2.1. Quantification of oligomers................................................................................... 84
4.3.2.2. Morphology of the oligomers ................................................................................ 86
4.3.2.3. α-synuclein oligomers are on-pathway to fibril formation.................................... 87
4.3.2.4. Toxicity induced by membrane pore formation .................................................... 91
4.4. Conclusion .......................................................................................................................... 93
4.5. Outlook ............................................................................................................................... 94
5. BIOPHYSICAL STUDIES OF α-SYNUCLEIN PHOSPHORYLATION AND ITS
AGGREGATION ...................................................................................................................... 95
5.1. Introduction ....................................................................................................................... 95
5.2. Experimental procedure ................................................................................................... 97
5.3. Results and discussion ..................................................................................................... 99
5.3.1. α-synuclein phosphorylation at S129 ........................................................................... 99
5.3.1.1. α-synuclein is disordered independent of phosphorylation................................. 100
5.3.1.2. Phosphorylation expands the ensemble of conformations populated by wt α-
synuclein........................................................................................................................... 102
5.3.1.3. S129E/D do not reproduce the structural consequences of phosphorylation ...... 103
5.3.1.4. Phosphorylation disrupts transient intramolecular long-range interactions......... 104
5.3.1.5. S129E exhibits similar in vitro aggregation properties as wt α-synuclein .......... 106
5.3.1.6. Phosphorylation at S129 is sufficient to inhibit the aggregation of wt α-synuclein
.......................................................................................................................................... 107
5.3.2. α-synuclein phosphorylation at S87 ........................................................................... 111
5.3.2.1. Phosphorylation at S87 is sufficient to block α-synuclein fibrillization and
phosphomimic S87E aggregates slower than wt and S87A ............................................. 111
5.3.2.2. α-synuclein S→A and S→E mutations can mimic S87, but not S129,
phosphorylation ................................................................................................................ 113
5.3.2.3. α-synuclein is disordered independent of phosphorylation at S87...................... 115
5.3.2.4. Kinetics of wt and mutants α-synuclein phosphorylation ................................... 117
x
5.3.2.5. Neither S87 nor S129 phosphorylation is required for LBs formation................ 120
5.4. Conclusion ........................................................................................................................ 122
6. BIBLIOGRAPHY .............................................................................................................. 124
7. APPENDIX......................................................................................................................... 140
7.1. Backbone assignment of wt α-synuclein at −15 °C ................................................... 140
7.2. Backbone assignment of the C2A domain of Rabphilin-3A using the automatic
assignment program MARS ................................................................................................... 143
7.3. Protocol of the automatic assignment program MARS.............................................. 148
7.4. Pulse programs of PG-SLED and (HA)CANNH ............................................................ 156
CURRICULUM VITAE.......................................................................................................... 168
xi
Αβ Amyloid-β peptide
AD Alzheimer’s disease
APP Amyloid precursor protein
αS α-Synuclein
Asp Aspartate
ATP Adenosine -5’-Triphosphate
B0 External magnetic field
CD Circular dichroism
CK1 Casein Kinase1
DLB Dementia with Lewy bodies
DLS Dynamic light scattering
DNA Deoxyribonucleic acid
DTT Dithiothreitol
E.coli Escherichia coli
EDTA Ethylenediamine tetraacetic acid
TEM Transmission electron microscopy
Glu Glutamate
HEPES 2-(4-(2-hydroxyethyl)1-1 piperazinyl) ethansulfonic
HMQC Heteronuclear multiple quantum coherence
HPLC High performance liquid chromatography
HSQC Heteronuclear single quantum coherence
im-HSQC Intensity modulated HSQC
Abbreviations
xii
INEPT Insensitive nuclei enhanced by polarization transfer
IPAP In-Phase-Anti-Phase
IPTG Isopropyl-β-D-thiogalactopyranoside
3JHNHα Three bond HN-Hα scalar coupling
kDa kilo-Dalton (=103 g/mol)
LB Luria Bertani
LBs Lewy bodies
ml Milliliter
ms Milliseconds
μl Microliter
μs Microseconds
MS Mass spectrometry
MTSL (1-oxy-2,2,5,5-tetramethyl-D-pyrroline-3-methyl)
methanethiosulfonate
MWCO molecular weight cutoff
NAC Non-Aβ Component of Alzheimer’s disease amyloid plaques
NMR Nuclear magnetic resonance
NOE Nuclear Overhauser effect
NOESY Nuclear Overhauser effect spectroscopy
ns Nanoseconds
OD Optical density
PCR Polymerase chain reaction
PDB Protein data bank
PD Parkinson’s disease
xiii
PFG-NMR Pulse field gradient-NMR
PG-SLED Pulse gradient stimulated echo longitudinal encode-decode
PMSF Phenylmethylsulfonyl fluoride
PRE Paramagnetic relaxation enhancement
PrP Prion protein
ps Picoseconds
R1 Longitudinal or spin-lattice relaxation rate
R1ρ Longitudinal relaxation rate in rotating frame
R2 Transversal or spin-spin relaxation rate
RH Hydrodynamic radius
SAXS Small angle X-ray scattering
Ser Serine
SDS Sodium Dodecyl Sulfate
SDS-PAGE SDS-polyacrylamide gel electrophoresis
T1 Longitudinal or spin-lattice relaxation time
T1ρ Longitudinal relaxation time in rotating frame
T2 Transversal or spin-spin relaxation time
TEMED N,N,N′,N′-tetramethylethylenediamine
TFA Trifluoroacetic acid
Thr Threonine
ThT Thioflavin-T
Tris Tris (hydroxymethyl)-amino-methane
τ Correlation time for the electron-nuclear interaction
wt Wild type
1. Introduction
14
1. Introduction
1.1. Protein folding, misfolding and amyloid disease
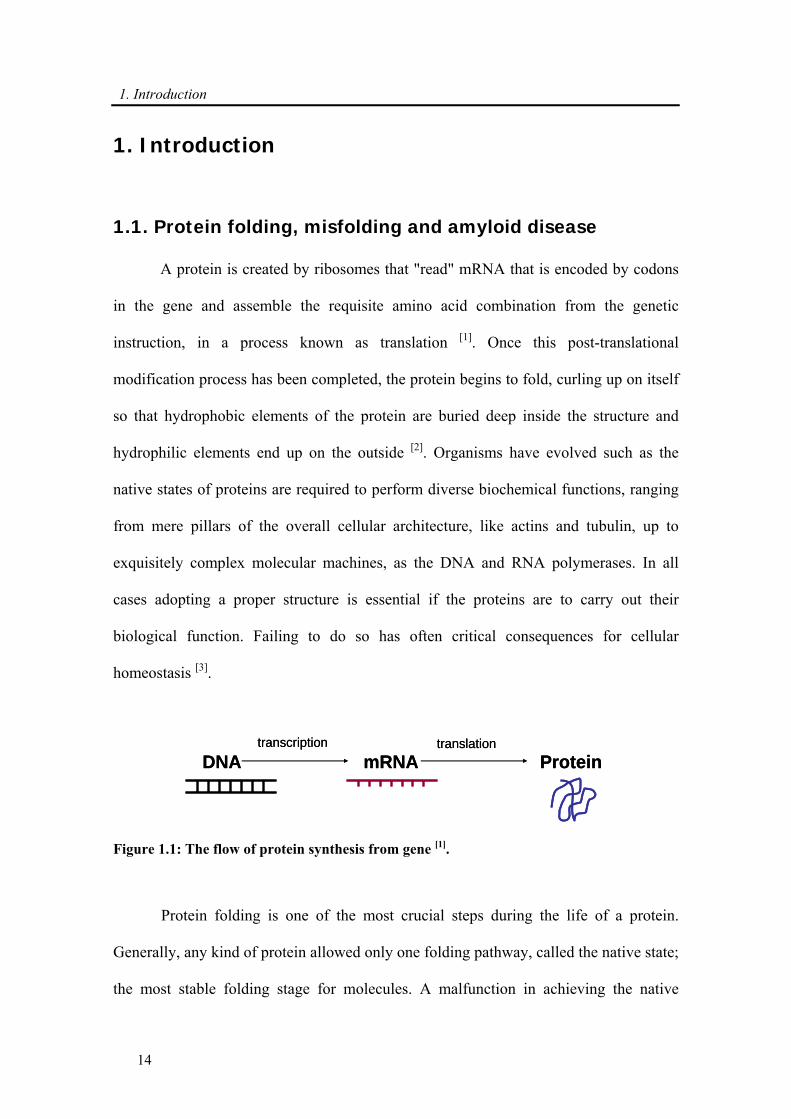
A protein is created by ribosomes that "read" mRNA that is encoded by codons
in the gene and assemble the requisite amino acid combination from the genetic
instruction, in a process known as translation [1]. Once this post-translational
modification process has been completed, the protein begins to fold, curling up on itself
so that hydrophobic elements of the protein are buried deep inside the structure and
hydrophilic elements end up on the outside [2]. Organisms have evolved such as the
native states of proteins are required to perform diverse biochemical functions, ranging
from mere pillars of the overall cellular architecture, like actins and tubulin, up to
exquisitely complex molecular machines, as the DNA and RNA polymerases. In all
cases adopting a proper structure is essential if the proteins are to carry out their
biological function. Failing to do so has often critical consequences for cellular
homeostasis [3].
DNA mRNA Proteintranscription translation
DNA mRNA Proteintranscription translation
Figure 1.1: The flow of protein synthesis from gene [1].
Protein folding is one of the most crucial steps during the life of a protein.
Generally, any kind of protein allowed only one folding pathway, called the native state;
the most stable folding stage for molecules. A malfunction in achieving the native
1. Introduction
15
conformation, render the polypeptide totally inactive, or worse, it can produce a
misfolded molecule that can interfere with or block components of the cellular
machinery to the point of causing cell malfunction or death [3]. Nevertheless the fold of
a protein appears to be solely encoded in the primary amino acid sequence, in as much
as polypeptide chains fold in vitro in the absence of any auxiliary factors [4, 5]. Indeed,
the self assembling capability of proteins has allowed the occurrence of the early
biologically-driven chemical processes, and the stability of such catalytically competent
polypeptide-based systems is believed to have been crucial for evolution to take place.
Transport in
Transport out
Ubiquitin proteasom system
Protein degradation
assembly
retention
misfolding
modification & folding
correct folding
Golgi
Vesicles
Ribosomes
Transport in
Transport out
Ubiquitin proteasom system
Protein degradation
assembly
retention
misfolding
modification & folding
correct folding
Golgi
Vesicles
Ribosomes
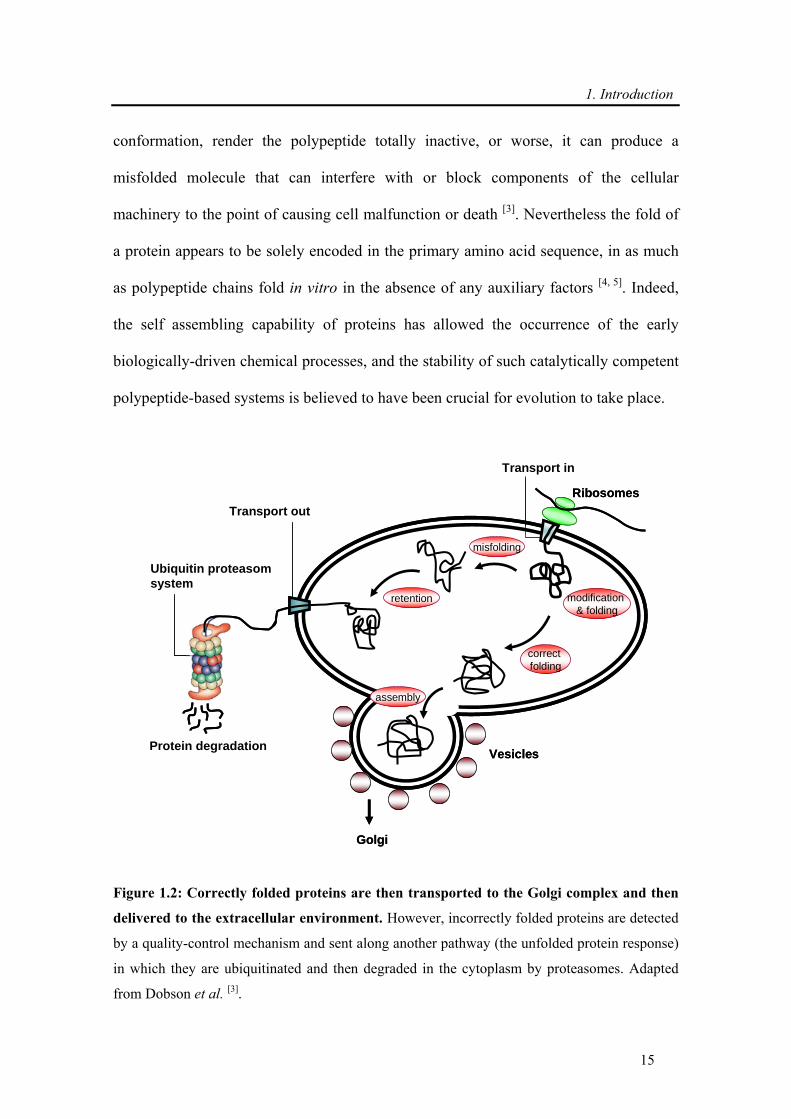
Figure 1.2: Correctly folded proteins are then transported to the Golgi complex and then
delivered to the extracellular environment. However, incorrectly folded proteins are detected
by a quality-control mechanism and sent along another pathway (the unfolded protein response)
in which they are ubiquitinated and then degraded in the cytoplasm by proteasomes. Adapted
from Dobson et al. [3].
1. Introduction
16
An unbiased search for the most stable structure of a protein would demand the
population of all possible conformations that the polypeptide chain could adopt, until
the state with the lowest energy is attained. Several models have emerged to explain the
existence of folding pathways, from the framework model according to which
secondary structure forms locally by collision of the folded segments, to the nucleation
model in which folding is initiated locally and propagated through the chain. A third
model is the hydrophobic collapse model that the polypeptide would collapse rapidly
around its hydrophobic side chains and rearrange from the restricted conformational
space [6]. The fact that three models are reasonable and fit experimental data, suggest
that a single generic mechanism for protein folding may not exist in nature. The
population of a defined secondary structure requires that many residues concomitantly
adopt concerted backbone conformations capable of forming hydrogen bonds between
amide and carbonyl groups of the main chain, which further reduced the degree of
freedom of the system. In many cases, depending on the mechanism by which the
protein folds, a relatively stable transition state is populated, which adopts an overall
three-dimensional shape that closely resembles one of the native state of the protein [7].
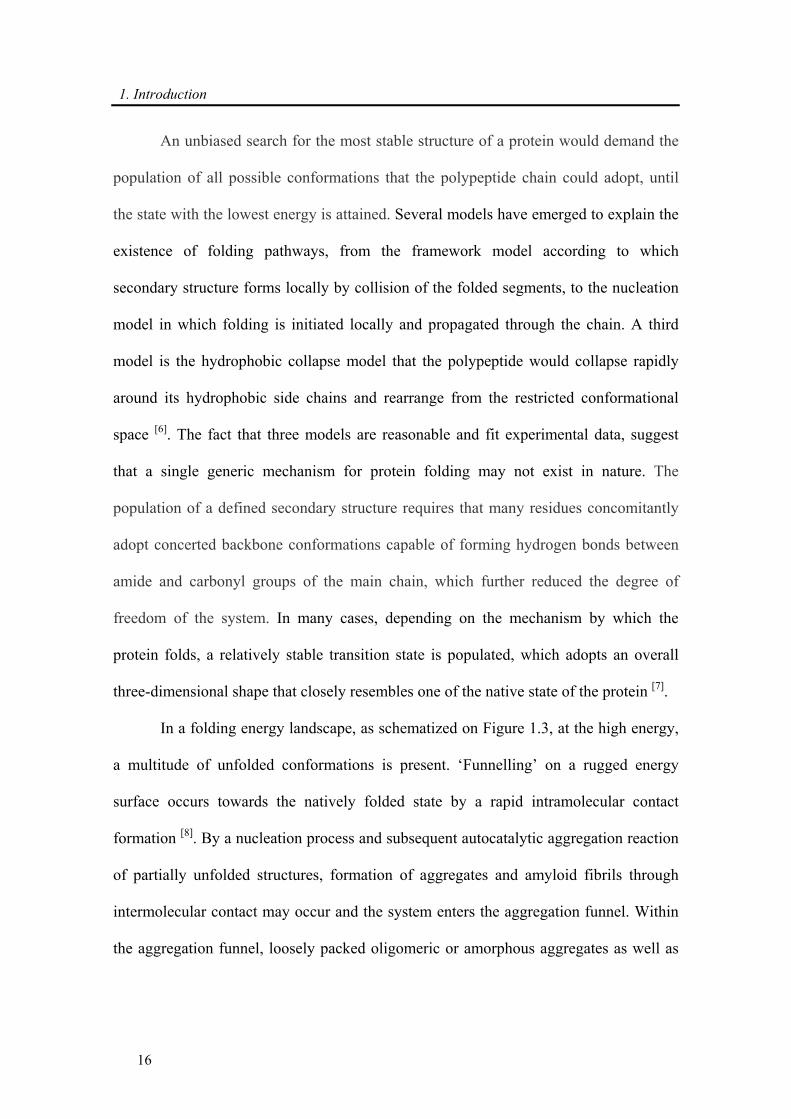
In a folding energy landscape, as schematized on Figure 1.3, at the high energy,
a multitude of unfolded conformations is present. ‘Funnelling’ on a rugged energy
surface occurs towards the natively folded state by a rapid intramolecular contact
formation [8]. By a nucleation process and subsequent autocatalytic aggregation reaction
of partially unfolded structures, formation of aggregates and amyloid fibrils through
intermolecular contact may occur and the system enters the aggregation funnel. Within
the aggregation funnel, loosely packed oligomeric or amorphous aggregates as well as
1. Introduction
17
different amyloid fibrillar states with different packing properties and with deep energy
minima may form, thus exhibiting conformational polymorphism.
unfolded conformations
oligomers
partiallyfolded state
folding intermediates
native state
Ener
gy
Intramolecular contacts Intermolecular contacts
cold & pressure perturbation
nucleation & growth
Folding funnel
Aggregation funnelamyloid fibrils
unfolded conformations
oligomers
partiallyfolded state
folding intermediates
native state
Ener
gy
Intramolecular contacts Intermolecular contacts
cold & pressure perturbation
nucleation & growth
Folding funnel
Aggregation funnelamyloid fibrils
Figure 1.3: Schematic energy landscape for protein folding and aggregation funnel. While
the protein attains the native conformation at its global energy minimum under normal
physiological conditions, the amyloidgenic stacking of many protein molecules may lead to
lower energies beyond this level in the aggregation funnel [8, 9]. At low temperature and high
pressure, dissociation of less densely packed protein aggregates and fibrils is possible. Figure
adapted from Mishra et al. [10].
In recent years, it has become evident that a wide range of human diseases are
associated with aberrations in the folding process [3, 11]. The transient formation of
protofibrils has been observed during the in vitro fibrillization of all amyloid-forming
proteins studied so far, irrespective of whether these proteins are linked to human
disease. These diseases include Alzheimer’s disease (AD, responsible protein: Aβ and
1. Introduction
18
tau), Parkinson’s disease (PD, α-synuclein), prion protein related encephalopathies and
type II diabetes mellitus (islet amyloid polypeptide). A sub-set of these pathologies,
including AD, PD, Prion diseases (PrP) and late-onset diabetes, among others, are
associated with the deposition of structurally defined protein aggregates in the tissue
known as amyloid fibrils [12, 13]. Amyloid in disease is generally defined to be
extracellular, although intracellular structures sharing the same core structures are
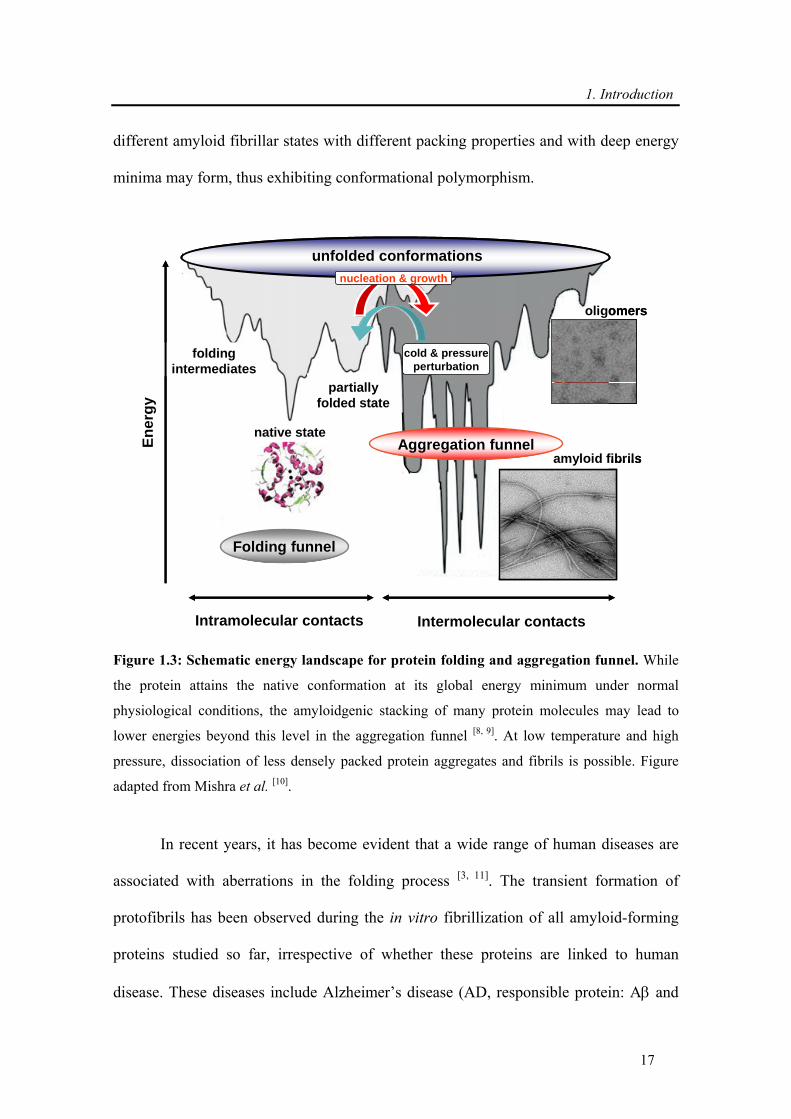
described in PD [12]. Indeed, a huge variety of previously unrelated diseases share the
feature of misfolded and aggregated protein deposits (Fig.1.4). These disease-causing
proteins have various three dimensional folds with nothing in common in terms of
sequences, but instead converge in a unique fibrillar structure called “amyloids” [14].
Disease Protein site of folding Pathology
Alzheimer’s disease Amyloid β-peptide/ ERTau
Parkinson’s disease α-synuclein Cytosol
Huntingston’s disease Huntingtin Cytosol
Creutzfeldt-Jakob disease Prion protein ER
Amyot. Lateral sclerosis Cu, Zn, superoxide dismutase Cytosol
Disease Protein site of folding Pathology
Alzheimer’s disease Amyloid β-peptide/ ERTau
Parkinson’s disease α-synuclein Cytosol
Huntingston’s disease Huntingtin Cytosol
Creutzfeldt-Jakob disease Prion protein ER
Amyot. Lateral sclerosis Cu, Zn, superoxide dismutase Cytosol
Figure 1.4: Representative protein folding disease. Human diseases characterized by
progressive misfolding and aggregation of proteins (Figures reproduced from internet pathology
laboratory for medical education, Florida state university college of medicine, USA).
1. Introduction
19
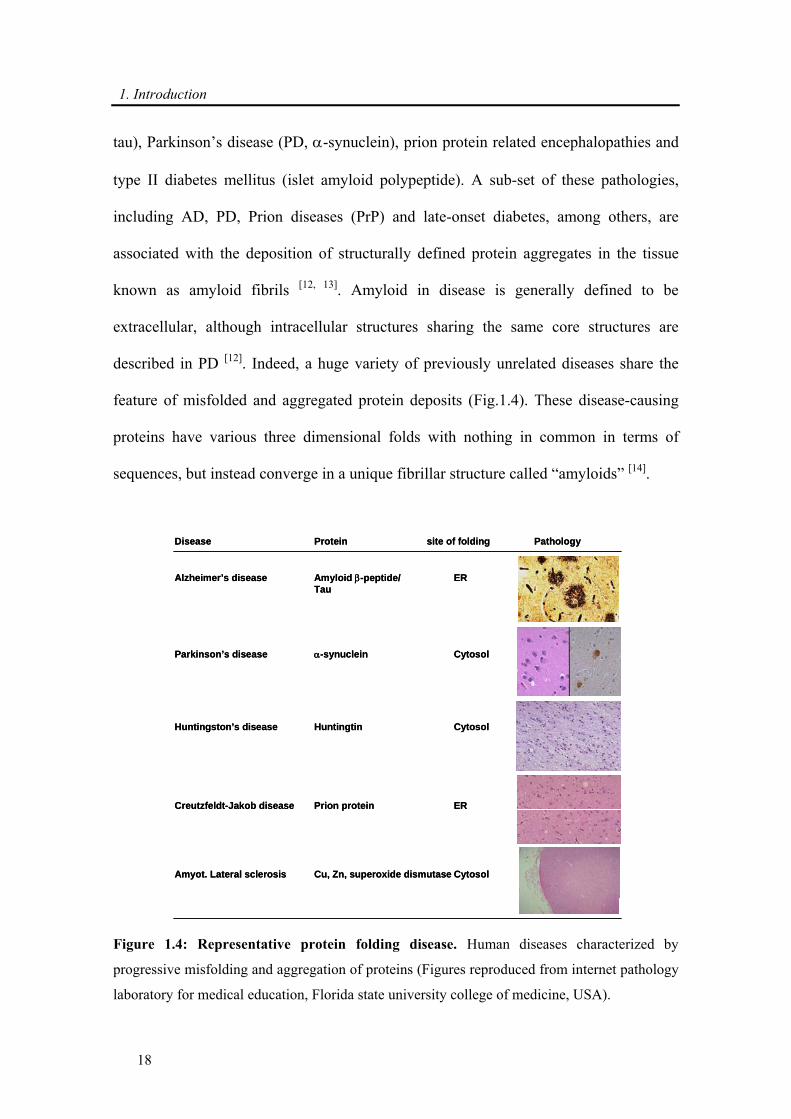
1.1.1. Fibrillization and structure of amyloid fibrils
Amyloid formation is a complex process and proceeds through a series of
discrete β-sheet-rich oligomeric intermediates that appear before formation of fibrils
and disappear upon fibril formation in vitro.
Figure 1.5: Computer generated molecular model of α-synuclein fibrils.
Fibrillization of many proteins is controlled by two kinetic parameters: the
nucleation rate and the elongation rate. A kinetic theory of fibrillogenesis was
established which relates the concentration of the amyloidogenic protein and the rate of
fibrillogenesis [15]. The time gap before the seed formation and beginning of rapid
aggregation called the lag time is very dependent on sample conditions and may range
from minutes to days [16, 17]. All amyloid fibrils are ordered in secondary structures,
including a core cross β-sheet structure, in which continuous β sheets are formed with
beta strands running perpendicular to the fibril axis [11]. And these amyloid fibrils
consist of two to six unbranched protofilaments associated laterally or twisted together
to form fibrils that are approximately 10 nm diameter (Fig.1.5). Once formed the rigid
structure of amyloid fibrils, and the deep energy minima acquired to form those
structures are extremely stable and hard to solubilize [18].
The first phase in amyloid formation seems to involve the formation of soluble
oligomers. The earliest species visible by electron microscopy generally resemble small,
bead-like structures. These early preformed aggregates then transform into species with
1. Introduction
20
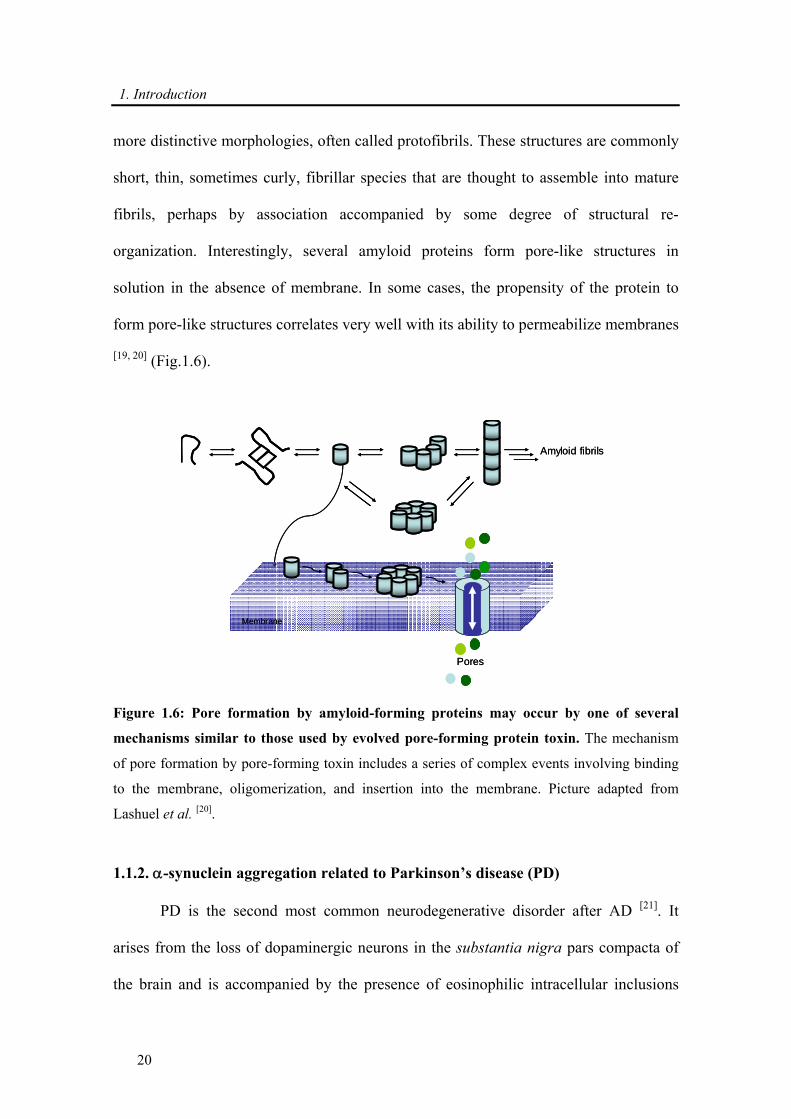
more distinctive morphologies, often called protofibrils. These structures are commonly
short, thin, sometimes curly, fibrillar species that are thought to assemble into mature
fibrils, perhaps by association accompanied by some degree of structural re-
organization. Interestingly, several amyloid proteins form pore-like structures in
solution in the absence of membrane. In some cases, the propensity of the protein to
form pore-like structures correlates very well with its ability to permeabilize membranes
[19, 20] (Fig.1.6).
Amyloid fibrils
Membrane
Pores
Amyloid fibrils
Membrane
Pores
Figure 1.6: Pore formation by amyloid-forming proteins may occur by one of several
mechanisms similar to those used by evolved pore-forming protein toxin. The mechanism
of pore formation by pore-forming toxin includes a series of complex events involving binding
to the membrane, oligomerization, and insertion into the membrane. Picture adapted from
Lashuel et al. [20].
1.1.2. α-synuclein aggregation related to Parkinson’s disease (PD)
PD is the second most common neurodegenerative disorder after AD [21]. It
arises from the loss of dopaminergic neurons in the substantia nigra pars compacta of
the brain and is accompanied by the presence of eosinophilic intracellular inclusions
1. Introduction
21
known as Lewy bodies (LBs) and Lewy neurites, which are confined largely to nerve
cells [22]. Ultrastructurally, LBs are protein rich depositions in the form of long amyloid-
like fibrils, the major component of which is the pre-synaptic protein αS [23]. LBs are
also found in other major neurodegenerative disorders that occur increasingly with
aging, including dementia with LBs and AD [24].
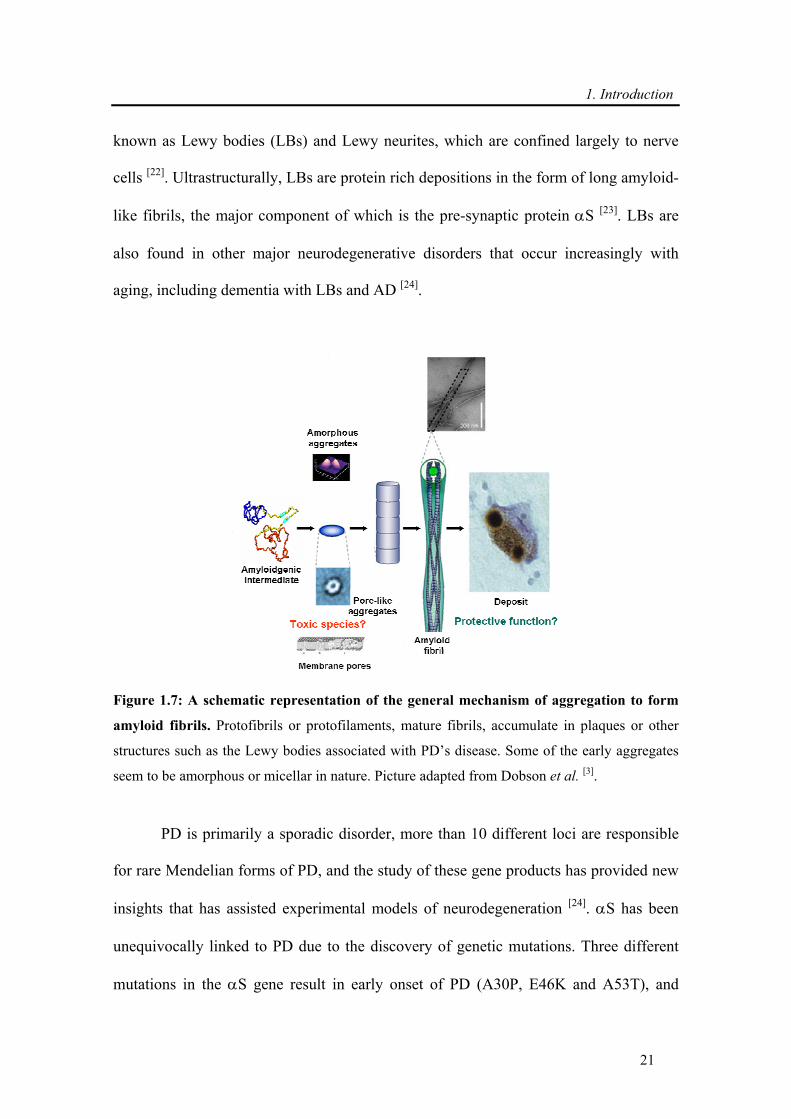
Figure 1.7: A schematic representation of the general mechanism of aggregation to form
amyloid fibrils. Protofibrils or protofilaments, mature fibrils, accumulate in plaques or other
structures such as the Lewy bodies associated with PD’s disease. Some of the early aggregates
seem to be amorphous or micellar in nature. Picture adapted from Dobson et al. [3].
PD is primarily a sporadic disorder, more than 10 different loci are responsible
for rare Mendelian forms of PD, and the study of these gene products has provided new
insights that has assisted experimental models of neurodegeneration [24]. αS has been
unequivocally linked to PD due to the discovery of genetic mutations. Three different
mutations in the αS gene result in early onset of PD (A30P, E46K and A53T), and
1. Introduction
22
additionally, a locus triplication causing an increased dosage of the wild type (wt) αS
gene potentiates the disease [25-28]. The role of αS in the formation of LBs and the
pathogenesis of PD has been compared to the role of Aβ peptide and amyloid plaques in
Alzheimer’s disease. The appealing hypothesis for LBs formation is that αS monomers
combine to form oligomers (or protofibrils), which coalesce into fibrils and then co-
aggregate with other proteins into Lewy body inclusions [29, 30]. While the monomers
and oligomers of αS are soluble, the fibrils and LBs are insoluble in the neuronal
cytoplasm. However, the roles of the various physical forms of αS in PD pathogenesis
are controversial. LBs have been proposed to be both neurotoxic [31, 32], and protective
[33, 34]. Other hypotheses state that the protofibrillar intermediates, made of αS oligomers,
are the main species toxic to dopaminergic neurons [29].
1.2. Cold dissociation
Denaturation of protein results in a loss of secondary and tertiary structure,
although the peptide bonds between the amino acids are left intact. In contrast to
intrinsically unstructured proteins, which are unfolded in their native state, but still
functionally active, denatured proteins lose their ability to function. Denatured proteins
can exhibit a wide range of characteristics, from loss of solubility to communal
aggregation. In practice, the stability of a protein will depend strongly on solution
conditions such as pH, the presence of chemical denaturants or co-solutes. Chemical
denaturants interfere with stabilizing intra-molecular interactions mediated by non-
covalent forces such as hydrogen bonds, Van der Waals forces, and hydrophobic effects.
The addition of co-solutes or cosolvents can have a large effect on the volume change,
1. Introduction
23
and Scharnagl et al. have recently given a comprehensive thermodynamic description of
the effect of co-solutes and co-solvents on the stability of the protein [35].
T / °C
P / k
bar
pressure denaturation
heat denaturation
cold denaturation 0 50
ice
liquidwater
2.0
(aggregation)
denatured
native
T / °C
P / k
bar
pressure denaturation
heat denaturation
cold denaturation 0 50
ice
liquidwater
2.0
(aggregation)
denatured
native
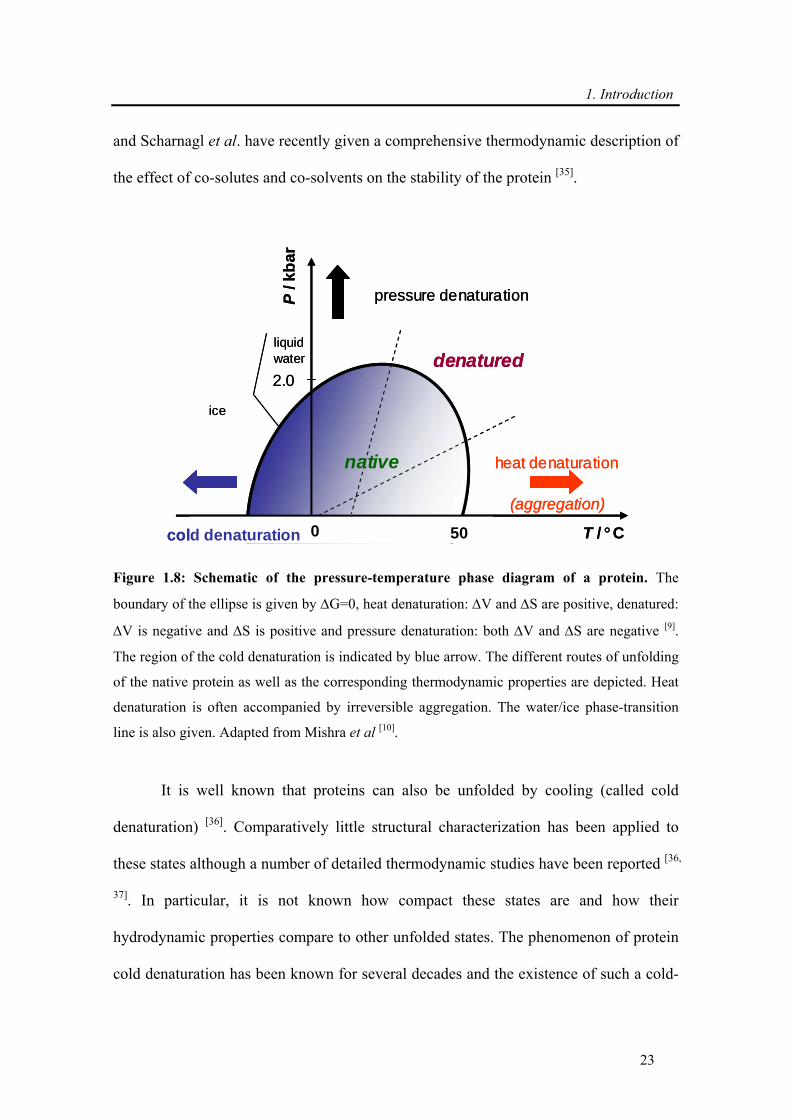
Figure 1.8: Schematic of the pressure-temperature phase diagram of a protein. The
boundary of the ellipse is given by ΔG=0, heat denaturation: ΔV and ΔS are positive, denatured:
ΔV is negative and ΔS is positive and pressure denaturation: both ΔV and ΔS are negative [9].
The region of the cold denaturation is indicated by blue arrow. The different routes of unfolding
of the native protein as well as the corresponding thermodynamic properties are depicted. Heat
denaturation is often accompanied by irreversible aggregation. The water/ice phase-transition
line is also given. Adapted from Mishra et al [10].
It is well known that proteins can also be unfolded by cooling (called cold
denaturation) [36]. Comparatively little structural characterization has been applied to
these states although a number of detailed thermodynamic studies have been reported [36,
37]. In particular, it is not known how compact these states are and how their
hydrodynamic properties compare to other unfolded states. The phenomenon of protein
cold denaturation has been known for several decades and the existence of such a cold-
1. Introduction
24
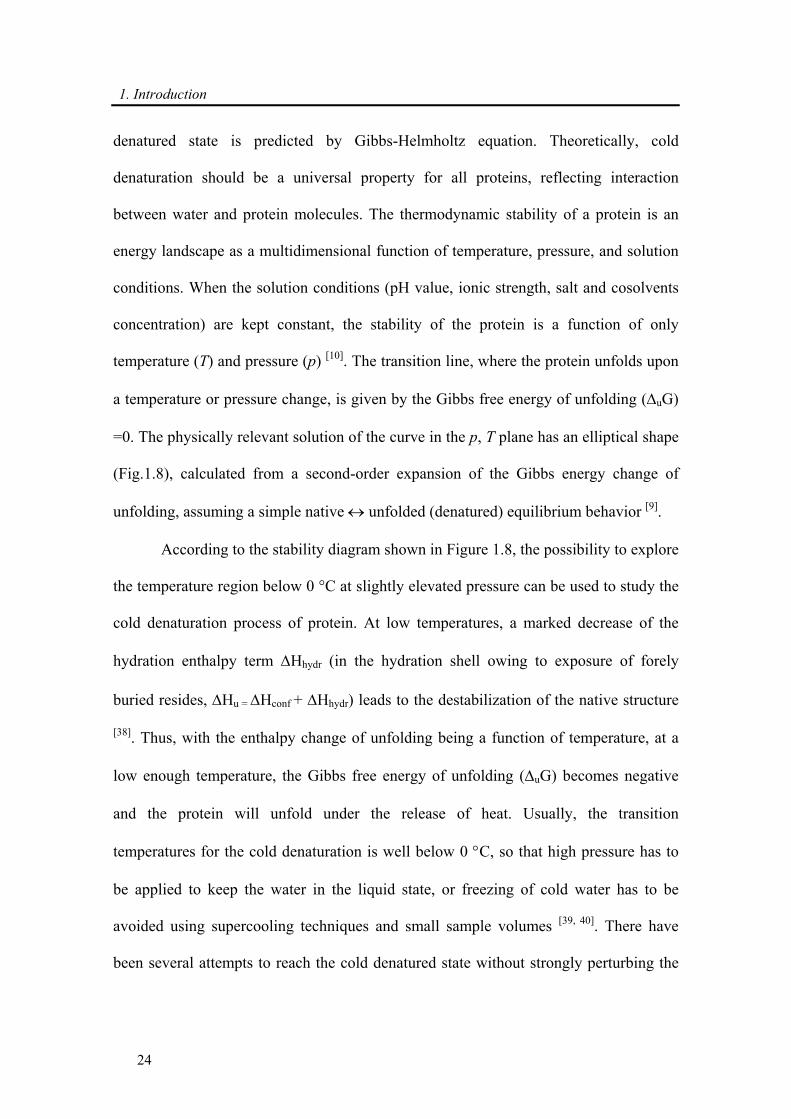
denatured state is predicted by Gibbs-Helmholtz equation. Theoretically, cold
denaturation should be a universal property for all proteins, reflecting interaction
between water and protein molecules. The thermodynamic stability of a protein is an
energy landscape as a multidimensional function of temperature, pressure, and solution
conditions. When the solution conditions (pH value, ionic strength, salt and cosolvents
concentration) are kept constant, the stability of the protein is a function of only
temperature (T) and pressure (p) [10]. The transition line, where the protein unfolds upon
a temperature or pressure change, is given by the Gibbs free energy of unfolding (ΔuG)
=0. The physically relevant solution of the curve in the p, T plane has an elliptical shape
(Fig.1.8), calculated from a second-order expansion of the Gibbs energy change of
unfolding, assuming a simple native ↔ unfolded (denatured) equilibrium behavior [9].
According to the stability diagram shown in Figure 1.8, the possibility to explore
the temperature region below 0 °C at slightly elevated pressure can be used to study the
cold denaturation process of protein. At low temperatures, a marked decrease of the
hydration enthalpy term ΔHhydr (in the hydration shell owing to exposure of forely
buried resides, ΔHu = ΔHconf + ΔHhydr) leads to the destabilization of the native structure
[38]. Thus, with the enthalpy change of unfolding being a function of temperature, at a
low enough temperature, the Gibbs free energy of unfolding (ΔuG) becomes negative
and the protein will unfold under the release of heat. Usually, the transition
temperatures for the cold denaturation is well below 0 °C, so that high pressure has to
be applied to keep the water in the liquid state, or freezing of cold water has to be
avoided using supercooling techniques and small sample volumes [39, 40]. There have
been several attempts to reach the cold denatured state without strongly perturbing the
1. Introduction
25
environment, in the presence of denaturants [36], mutations [41] , supercooled proteins
encapsulated in micelles [42] and supercooling with very thin capillaries [39]. In this thesis,
it is proved that the transition temperatures for the cold denaturation lie well below 0 °C,
freezing of cold water be avoided using supercooling techniques and small sample
volumes [40].
1. Introduction
26
1.3. NMR spectroscopy
NMR is a widely used spectroscopic method today for purposes ranging from
geological measurements to medical imaging and bimolecular dynamics. In 1946 two
groups independent of each other performed both solid-state and solution-state NMR
experiments [43, 44]. Today the magnetic fields are significantly higher than in 1946 and
800-900 MHz magnets are not uncommon. The methods used to study biological
molecules have an increasing complexity and have developed from continuous wave 1D
methods to Fourier transformed pulsed heteronuclear multidimensional experiments.
One important application of biological NMR is structure determination, but also
dynamical properties, such as local mobility and hydrodynamics are within reach of
NMR. In this thesis NMR has been used to obtain a detailed insight to understand the
mechanism of amyloid precursor αS using diffusion measurements to clarify the size of
various ensemble, relaxation measurements, paramagnetic relaxation enhancement
(PRE) for the intermolecular distance information and chemical shifts for the backbone
secondary structure information. Some structural properties of the protein are also
studied using measurements of J-coupling. A brief introduction to NMR parameters
used for biomolecules is given below.
1.3.1. J-couplings
J-couplings, or indirect couplings, arise through the coupling of two neighboring
spins through covalent bonds. The indirect spin-spin coupling gives rise to a splitting of
the signal due to polarization of the spins and altered orbital motion of the valence
electrons. One and two-bond scalar coupling (1J, 2J) are heavily used in heteronuclear
solution-state NMR to transfer the magnetization in multidimensional experiments [45].
1. Introduction
27
The J-coupling is most often measurable up to 3-bonds separation, and is not dependent
on the magnetic field. The 3-bond, 3J, couplings carry information on the structure of
the molecule and are dependent on the dihedral angle between the spins. This relation
can be parameterized and this was done by Karplus [46] using the empirical relation (1).
Here A, B and C are constants that are dependent on the molecular system and φ is the
dihedral angle.
2( ) cos cosJ A B Cφ φ φ= + + (1)
The protein secondary structure can be predicted directly from the 3J(HNHα)
coupling constant by calculating the difference between the experimental coupling
constant and the random coil value [47].
1.3.2. Chemical shift
NMR chemical shifts, especially of 13Cα and 13C' atoms, are very sensitive
probes of secondary structure in proteins [48]. Relative to random coil chemical shifts 13Cα and 13C' resonances tend to shift upfield in β-strands and extended sheets and
downfield in helices. Therefore, secondary structure elements can be identified by
subtracting random coil values (δCcoil) from the experimental chemical shifts (δCexp).
The secondary chemical shift (ΔδC) is defined as the difference between δCexp and
δCcoil are used for the secondary structure determination on a given sequence. In this
notation, negative secondary chemical shifts indicate β-strand and positive values
indicate α-helix.
exp . coilC C Cδ δ δΔ = − (2)
1.3.3. Nuclear Overhauser effect (NOE)
NOE is a through-space spin-spin (inter-nuclear) interaction and is dependant on
1. Introduction
28
an inter-nuclear distance (r), as well as on the rotational correlation time τc (describing
the Brownian tumbling motion of the protein in solution), and inversely proportional to
the sixth power of the distance between the dipoles under solution condition. Using a
first-order approximation, the NOE cross-peak intensities or volume V is proportional
to the relaxation rates and may be expressed as [49]:
6 ( )cV r f τ−= (3)
NOE is detectable when the two spins are close (~5 Å) in space, and this makes
NOE exceptionally useful for spatial proximity. By measuring cross-peak intensities V,
distance restraints can be derived. It can be estimated in the 2D and 3D NOESY spectra.
Proton-proton NOEs are the most widely used parameter for the structure determination
by NMR [50] .
1.3.4. Paramagnetic relaxation enhancement (PRE)
Distance restraints between residues in the denatured state of proteins can be
obtained by covalently attaching a probe containing a free radical to a unique cysteine
residue introduced by mutagenesis. The magnetic interaction between the unpaired
electron in the spin label and a proton in the same molecule is similar to the Nuclear
Overhauser Effect (NOE) between pairs of protons. Broadening effects of the unpaired
electron in spin label can be observed up to 20-25 Å [51]. The enhanced relaxation rate
2PR is inversely proportional to the distance between the electron and the nuclear spins
r [51]:
2 6 2 2
341
cP c
c
KRr
ττω τ
⎛ ⎞= +⎜ ⎟+⎝ ⎠
(4)
1. Introduction
29
where τc is the correlation time for this electron-nuclear interaction, ω is the
Lamor frequency of the nuclear spin (proton). K is composed of the physical constants:
( ) 2 2 21 115
K S S gγ β= + (5)
in which γ is the nuclear gyromagnetic ratio, g is the electronic g factor and β is the
Bohr magneton. Overall K is 1.23 x 10⁻³²cm6s-2 [52].
The peak intensity ratio (Ipara/Idia) of the corresponding 15N-1H crosspeak can be
converted in the paramagnetic transverse relaxation rate enhancement ( 2PR ) [51] by
estimating the additional relaxation needed to reduce the peak intensity in the
diamagnetic case to the intensity observed in the paramagnetic case:
22
2 2
P ineptR tpara
dia P
I R eI R R
−
=+
(6)
where R2 is the transverse relaxation rate of the amide proton without spin label, R2P is
the transverse relaxation rate of the amide proton with spin label. Ipara / Idia is the
intensity ratio for an amide cross peak between with spin label and without spin label, t
is the duration of INEPT delays (~ 10 ms) in HSQC pulse sequence. The distance (r)
can be extracted from above two equations and has been used for the generation of the
αS structural ensemble [53].
1.3.5. Diffusion ordered spectroscopy (DOSY)
Translational diffusion and relaxation are the two important parameters in
dealing with dynamic systems like protein-protein interactions and protein movements
in various time scales. Translational diffusion is defined as translational motion in the
1. Introduction
30
absence of a concentration gradient. Stejskal et al. showed that the diffusion coefficient
of molecules in solution can be measured using pulse field gradient (PFG) NMR
methods [54]. PFG techniques are used extensively to measure translational diffusion in
solution [55]. Due to diffusion, molecules will change their spatial localization between
the application of the first and second gradient, and thus they will experience an
inhomogeneous total field, causing an attenuation of the measured signal. For
unrestricted diffusion of a molecule in an isotropic liquid, the PFG NMR signal
amplitude, A, normalized to the signal obtained in the absence of gradient pulses, is
related to the diffusion coefficient D by
2 2 2( (r D gA e δ δ− Δ− /3)×= (7)
here γ is the gyromagnetic ratio of the observed nucleus, g and δ are the
magnitude and duration of the magnetic field pulses, and Δ is the time between the
gradient pulses [54]. The determination of D is achieved by acquiring a series of 16 one-
dimensional PFG spectra at different gradient strengths and fitting the decay of the
signal intensity to a Gaussian function with the form
2
( )Dd g
gI a e− ×= × (8)
where I(g) is the ratio between the intensity of the signal measured at gradient
strength g and in the absence of gradient, and a is the pre-exponential factor (~1). The
Stokes-Einstein equation relates D to the hydrodynamic radius, RH, as follows:
6 H
kTDRπη
= (9)
1. Introduction
31
where k is the Boltzmann constant, T is the temperature of the sample and η is
the viscosity of the solution. Thus determination of the RH of a polypeptide chain
requires the determination of the viscosity of the solution. In order to overcome this, a
viscosity probe of known size is included in the determination, usually dioxane [56, 57],
providing the relationship:
refprot refH H
protDD
R R= (10)
The intensities decay as a function of gradient strength was fitted with a single
Gaussian curve with decay rate. The observed decay rate, for protein dprot, and for
reference dref, is proportional to the diffusion coefficient (D) of each molecule.
Combined with the known hydrodynamic radius of the reference (RHref), the
hydrodynamic radius of the protein (RHprot) can be calculated as follows:
ref
prot refDH Hprot
D
dR Rd
= (11)

2. Materials and methods
33
2. Materials and methods
2.1. Materials
2.1.1. Chemical reagents and enzymes
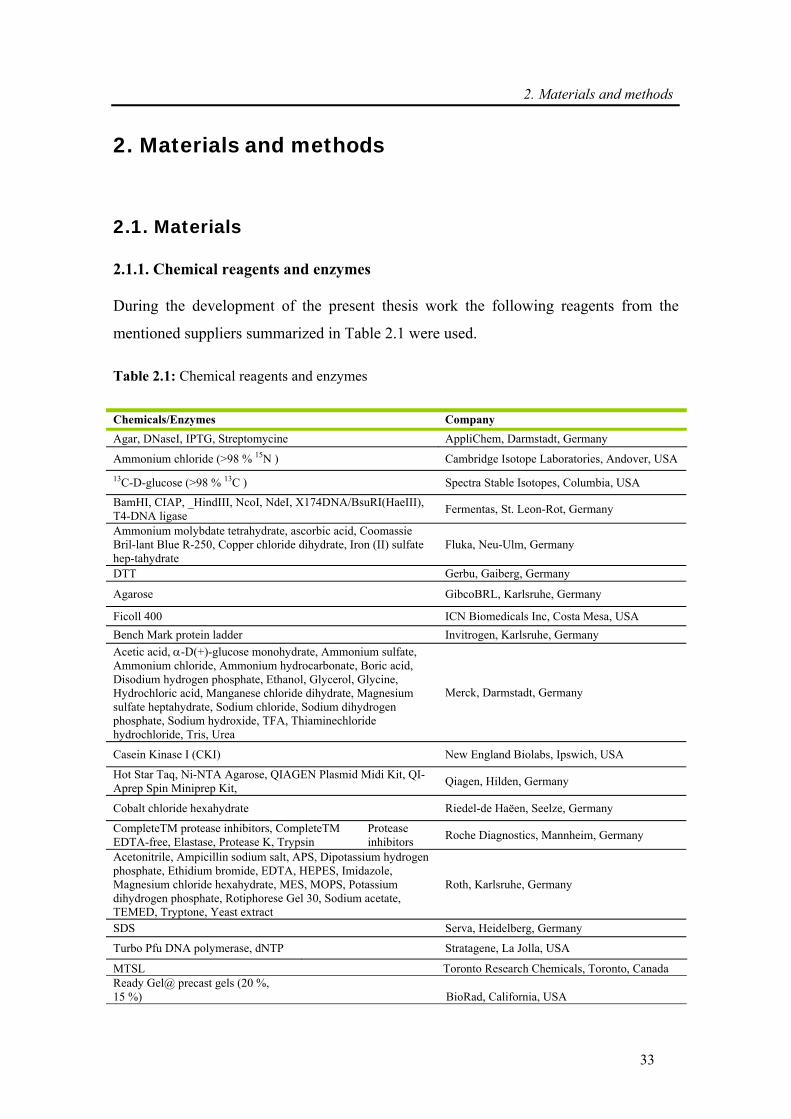
During the development of the present thesis work the following reagents from the
mentioned suppliers summarized in Table 2.1 were used.
Table 2.1: Chemical reagents and enzymes
Chemicals/Enzymes Company Agar, DNaseI, IPTG, Streptomycine AppliChem, Darmstadt, Germany
Ammonium chloride (>98 % 15N ) Cambridge Isotope Laboratories, Andover, USA 13C-D-glucose (>98 % 13C ) Spectra Stable Isotopes, Columbia, USA BamHI, CIAP, _HindIII, NcoI, NdeI, X174DNA/BsuRI(HaeIII), T4-DNA ligase Fermentas, St. Leon-Rot, Germany
Ammonium molybdate tetrahydrate, ascorbic acid, Coomassie Bril-lant Blue R-250, Copper chloride dihydrate, Iron (II) sulfate hep-tahydrate
Fluka, Neu-Ulm, Germany
DTT Gerbu, Gaiberg, Germany
Agarose GibcoBRL, Karlsruhe, Germany
Ficoll 400 ICN Biomedicals Inc, Costa Mesa, USA Bench Mark protein ladder Invitrogen, Karlsruhe, Germany Acetic acid, α-D(+)-glucose monohydrate, Ammonium sulfate, Ammonium chloride, Ammonium hydrocarbonate, Boric acid, Disodium hydrogen phosphate, Ethanol, Glycerol, Glycine, Hydrochloric acid, Manganese chloride dihydrate, Magnesium sulfate heptahydrate, Sodium chloride, Sodium dihydrogen phosphate, Sodium hydroxide, TFA, Thiaminechloride hydrochloride, Tris, Urea
Merck, Darmstadt, Germany
Casein Kinase I (CKI) New England Biolabs, Ipswich, USA
Hot Star Taq, Ni-NTA Agarose, QIAGEN Plasmid Midi Kit, QI-Aprep Spin Miniprep Kit, Qiagen, Hilden, Germany
Cobalt chloride hexahydrate Riedel-de Haëen, Seelze, Germany
CompleteTM protease inhibitors, CompleteTM EDTA-free, Elastase, Protease K, Trypsin
Protease inhibitors Roche Diagnostics, Mannheim, Germany
Acetonitrile, Ampicillin sodium salt, APS, Dipotassium hydrogen phosphate, Ethidium bromide, EDTA, HEPES, Imidazole, Magnesium chloride hexahydrate, MES, MOPS, Potassium dihydrogen phosphate, Rotiphorese Gel 30, Sodium acetate, TEMED, Tryptone, Yeast extract
Roth, Karlsruhe, Germany
SDS Serva, Heidelberg, Germany
Turbo Pfu DNA polymerase, dNTP Stratagene, La Jolla, USA
MTSL Toronto Research Chemicals, Toronto, Canada Ready Gel@ precast gels (20 %, 15 %) BioRad, California, USA
2. Materials and methods
34
Purified Mouse Anti-α-synuclein (BD) BD Biosciences, Heidelberg, Germany Rabbit anti-amyloid oligomer polyclonal antibody (A11) Invitrogen, Biosource, Europe, S.A
2.1.2. Bacterial strains
-Escherichia coli BL21 (DE 3). F-, ompT, hsdSβ(rβ-mβ-), dcm, gal, (DE3) tonA.
-Escherichia coli XL1-Blue. recA1 endA1 gyrA96 thi-1 hsdR17 supE44 relA1 lac
[F’proAB lacIqZ M15Tn10 (Tetr)] (Stratagene).
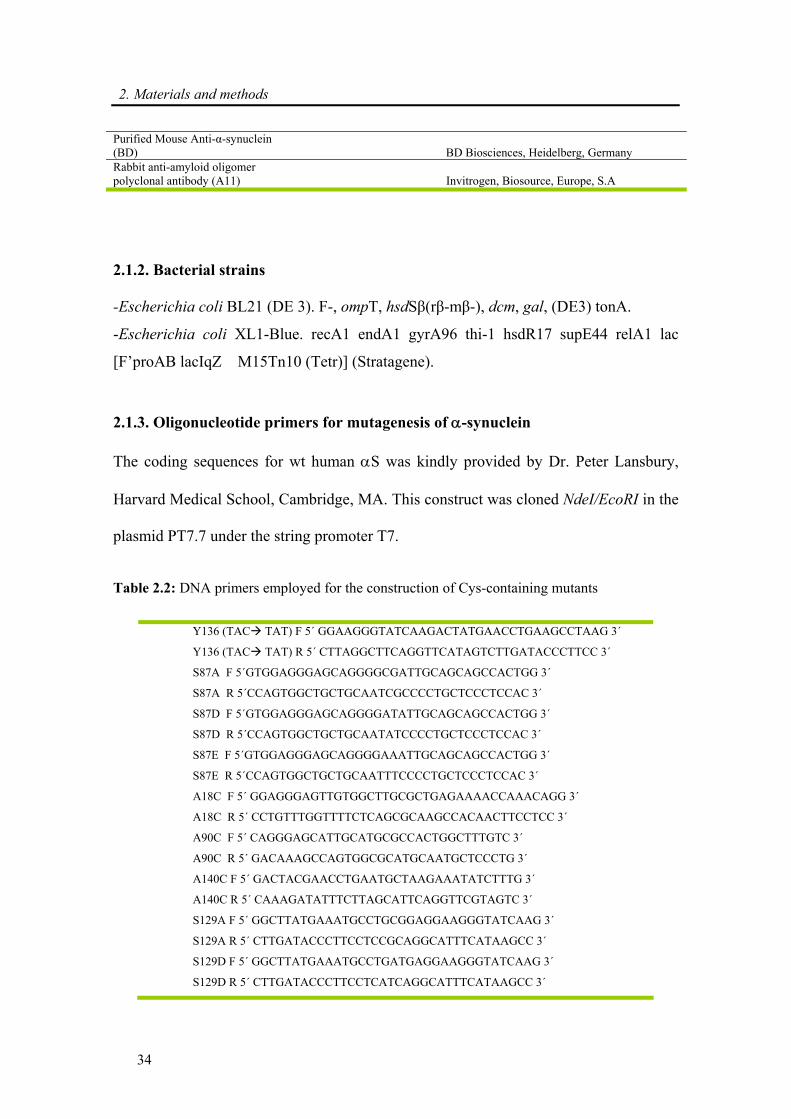
2.1.3. Oligonucleotide primers for mutagenesis of α-synuclein
The coding sequences for wt human αS was kindly provided by Dr. Peter Lansbury,
Harvard Medical School, Cambridge, MA. This construct was cloned NdeI/EcoRI in the
plasmid PT7.7 under the string promoter T7.
Table 2.2: DNA primers employed for the construction of Cys-containing mutants
Y136 (TAC TAT) F 5´ GGAAGGGTATCAAGACTATGAACCTGAAGCCTAAG 3´
Y136 (TAC TAT) R 5´ CTTAGGCTTCAGGTTCATAGTCTTGATACCCTTCC 3´
S87A F 5´GTGGAGGGAGCAGGGGCGATTGCAGCAGCCACTGG 3´
S87A R 5´CCAGTGGCTGCTGCAATCGCCCCTGCTCCCTCCAC 3´
S87D F 5´GTGGAGGGAGCAGGGGATATTGCAGCAGCCACTGG 3´
S87D R 5´CCAGTGGCTGCTGCAATATCCCCTGCTCCCTCCAC 3´
S87E F 5´GTGGAGGGAGCAGGGGAAATTGCAGCAGCCACTGG 3´
S87E R 5´CCAGTGGCTGCTGCAATTTCCCCTGCTCCCTCCAC 3´
A18C F 5´ GGAGGGAGTTGTGGCTTGCGCTGAGAAAACCAAACAGG 3´
A18C R 5´ CCTGTTTGGTTTTCTCAGCGCAAGCCACAACTTCCTCC 3´
A90C F 5´ CAGGGAGCATTGCATGCGCCACTGGCTTTGTC 3´
A90C R 5´ GACAAAGCCAGTGGCGCATGCAATGCTCCCTG 3´
A140C F 5´ GACTACGAACCTGAATGCTAAGAAATATCTTTG 3´
A140C R 5´ CAAAGATATTTCTTAGCATTCAGGTTCGTAGTC 3´
S129A F 5´ GGCTTATGAAATGCCTGCGGAGGAAGGGTATCAAG 3´
S129A R 5´ CTTGATACCCTTCCTCCGCAGGCATTTCATAAGCC 3´
S129D F 5´ GGCTTATGAAATGCCTGATGAGGAAGGGTATCAAG 3´
S129D R 5´ CTTGATACCCTTCCTCATCAGGCATTTCATAAGCC 3´
2. Materials and methods
35
The protein αS mutants were cloned by Pinar Karpinar. Sequence of DNA
primers forward (F) and reverse (R) employed for the construction of the Cys-
containing mutants in Y136 codon mutated αS shown in Table 2.2. The ‘TAC’ codon in
Y136 in wt αS was mutated into ‘TAT’ to prevent the misreading of cysteine [58]. In
order to provide an attachment site for the nitroxide spin label employed in PRE studies,
three different αS cysteine containing mutants A18C, A90C and A140C were
constructed on the Y136 (TAT) mutated wt protein. To study the phosphorylation
effect of wt αS four different mutants S87A, S87D, S129A and S129E were constructed
using the Quick Change site directed mutagenesis kit.
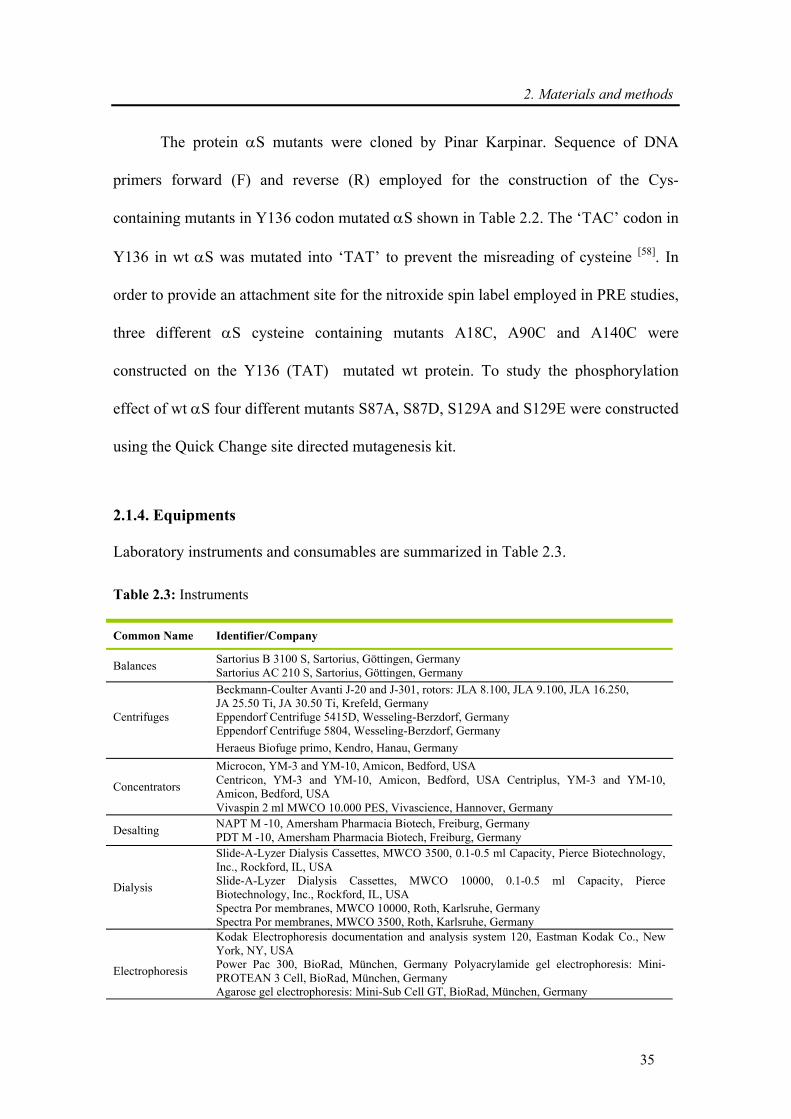
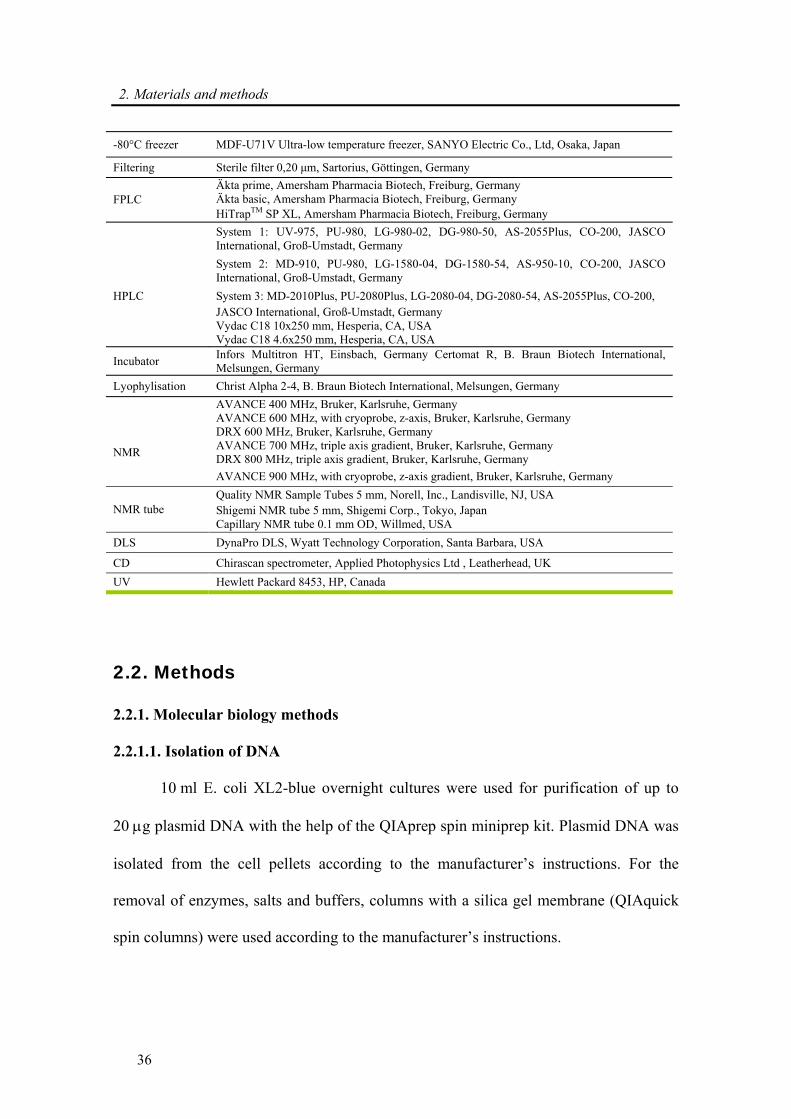
2.1.4. Equipments
Laboratory instruments and consumables are summarized in Table 2.3.
Table 2.3: Instruments
Common Name Identifier/Company
Balances Sartorius B 3100 S, Sartorius, Göttingen, Germany Sartorius AC 210 S, Sartorius, Göttingen, Germany
Beckmann-Coulter Avanti J-20 and J-301, rotors: JLA 8.100, JLA 9.100, JLA 16.250, JA 25.50 Ti, JA 30.50 Ti, Krefeld, Germany Centrifuges Eppendorf Centrifuge 5415D, Wesseling-Berzdorf, Germany Eppendorf Centrifuge 5804, Wesseling-Berzdorf, Germany Heraeus Biofuge primo, Kendro, Hanau, Germany Microcon, YM-3 and YM-10, Amicon, Bedford, USA
Concentrators Centricon, YM-3 and YM-10, Amicon, Bedford, USA Centriplus, YM-3 and YM-10, Amicon, Bedford, USA
Vivaspin 2 ml MWCO 10.000 PES, Vivascience, Hannover, Germany
Desalting NAPT M -10, Amersham Pharmacia Biotech, Freiburg, Germany PDT M -10, Amersham Pharmacia Biotech, Freiburg, Germany
Slide-A-Lyzer Dialysis Cassettes, MWCO 3500, 0.1-0.5 ml Capacity, Pierce Biotechnology, Inc., Rockford, IL, USA
Dialysis Slide-A-Lyzer Dialysis Cassettes, MWCO 10000, 0.1-0.5 ml Capacity, Pierce Biotechnology, Inc., Rockford, IL, USA
Spectra Por membranes, MWCO 10000, Roth, Karlsruhe, Germany Spectra Por membranes, MWCO 3500, Roth, Karlsruhe, Germany
Kodak Electrophoresis documentation and analysis system 120, Eastman Kodak Co., New York, NY, USA
Electrophoresis Power Pac 300, BioRad, München, Germany Polyacrylamide gel electrophoresis: Mini-PROTEAN 3 Cell, BioRad, München, Germany
Agarose gel electrophoresis: Mini-Sub Cell GT, BioRad, München, Germany
2. Materials and methods
36
-80°C freezer MDF-U71V Ultra-low temperature freezer, SANYO Electric Co., Ltd, Osaka, Japan
Filtering Sterile filter 0,20 μm, Sartorius, Göttingen, Germany Äkta prime, Amersham Pharmacia Biotech, Freiburg, Germany Äkta basic, Amersham Pharmacia Biotech, Freiburg, Germany FPLC HiTrapTM SP XL, Amersham Pharmacia Biotech, Freiburg, Germany
System 1: UV-975, PU-980, LG-980-02, DG-980-50, AS-2055Plus, CO-200, JASCO International, Groß-Umstadt, Germany
System 2: MD-910, PU-980, LG-1580-04, DG-1580-54, AS-950-10, CO-200, JASCO International, Groß-Umstadt, Germany
HPLC System 3: MD-2010Plus, PU-2080Plus, LG-2080-04, DG-2080-54, AS-2055Plus, CO-200, JASCO International, Groß-Umstadt, Germany Vydac C18 10x250 mm, Hesperia, CA, USA Vydac C18 4.6x250 mm, Hesperia, CA, USA
Incubator Infors Multitron HT, Einsbach, Germany Certomat R, B. Braun Biotech International, Melsungen, Germany
Lyophylisation Christ Alpha 2-4, B. Braun Biotech International, Melsungen, Germany AVANCE 400 MHz, Bruker, Karlsruhe, Germany AVANCE 600 MHz, with cryoprobe, z-axis, Bruker, Karlsruhe, Germany DRX 600 MHz, Bruker, Karlsruhe, Germany
NMR AVANCE 700 MHz, triple axis gradient, Bruker, Karlsruhe, Germany DRX 800 MHz, triple axis gradient, Bruker, Karlsruhe, Germany
AVANCE 900 MHz, with cryoprobe, z-axis gradient, Bruker, Karlsruhe, Germany Quality NMR Sample Tubes 5 mm, Norell, Inc., Landisville, NJ, USA
NMR tube Shigemi NMR tube 5 mm, Shigemi Corp., Tokyo, Japan Capillary NMR tube 0.1 mm OD, Willmed, USA
DLS DynaPro DLS, Wyatt Technology Corporation, Santa Barbara, USA
CD Chirascan spectrometer, Applied Photophysics Ltd , Leatherhead, UK UV Hewlett Packard 8453, HP, Canada
2.2. Methods
2.2.1. Molecular biology methods
2.2.1.1. Isolation of DNA
10 ml E. coli XL2-blue overnight cultures were used for purification of up to
20 μg plasmid DNA with the help of the QIAprep spin miniprep kit. Plasmid DNA was
isolated from the cell pellets according to the manufacturer’s instructions. For the
removal of enzymes, salts and buffers, columns with a silica gel membrane (QIAquick
spin columns) were used according to the manufacturer’s instructions.
2. Materials and methods
37
2.2.1.2. Site-directed mutagenesis of α-synuclein
Single site amino acid changes were generated using the QuikChange® site-
directed mutagenesis kit (Stratagene). The 50 μl PCR reaction mixtures contained
125 ng of each primer, 10 ng plasmid DNA template, 6.25 μmol dNTPs and 2.5 units
Turbo Pfu DNA polymerase in cloned Pfu buffer.
The cycling after an initial step at 95 °C for 30 s was performed as follows: I)
denaturing for 30 s at 95 °C, II) annealing for 1 min at 60 °C and III) elongation for
5 min per kb of plasmid length at 68 °C. For creating single nucleotide changes and for
creating double or triple nucleotide changes the number of cycles was 16. Following
temperature cycling, 10 units of Dpn I restriction enzyme were directly added to each
PCR reaction mixture and incubated for 1 h at 37 °C. 1 μl of the reaction mix was
transformed into E. coli XL1-blue for single site. The plasmid DNA was isolated and
the desired mutation was confirmed by DNA sequencing.
2.2.1.3. DNA sequencing
Sequencing of purified plasmid DNA was performed via the extended Hot Shot
DNA sequencing service of Seqlab (Göttingen, Germany) 200 μl PCR tubes with a flat
lid were loaded with a total volume of 7 μl containing 20 pmol of primer and 0.6-0.7 μg
plasmid DNA.
2.2.1.4. Transformation of E. coli
1 μl plasmid DNA was added to 50 μl competent cells and incubated for 30 min
on ice. Cells were subjected to a heat shock of 42 °C for 45 s and subsequently cooled
for 2 min on ice. Afterwards, the cells were supplemented with 0.5 ml of 2 x YT
2. Materials and methods
38
medium and incubated for 1 h at 37 °C. Finally, the cells were plated onto LB-agar
plates containing ampicillin and incubated overnight at 37 °C.
2.2.2. Methods for protein biochemistry
2.2.2.1. Expression and purification of α-synuclein
The same protocol was applied [53] for purification of all the αS variants
production. Following transformation, E. coli BL 21 cells were grown overnight in 10
ml of LB medium containing 100 μg/ml ampicillin. The pre-culture was diluted (10 ml
in 1 l LB containing 100 μg/ml ampicillin) and allowed to grow at 37 °C until an optical
density (OD) of 0.6-0.8. Expression of the desired gene construct was then induced with
1 mM IPTG. Cells were then harvested, after 3-4 hours of incubation at 37 ºC, by
centrifugation at 3000 x g for 10 minutes.
The bacterial pellet was resuspended in 10 ml of 10 mM Tris, pH 8.0, 1 mM
EDTA and 1 mM PMSF, and lysed by multiple freeze-thaw cycles and sonication. The
cell lysate was boiled for 20 minutes and centrifuged at 20000 x g (30 minutes at 4 °C),
in order to precipitate the heat-sensitive proteins (synuclein remain soluble).
Streptomycin-sulfate (Sigma) was added to the supernatant from the previous step (final
concentration 10 mg/ml) for precipitation of DNA. The mixture was stirred at 4 °C for
15 minutes, followed by centrifugation at 20,000 g (30 minutes at 4 °C).
The synuclein protein was then precipitated by addition of ammonium sulfate
(Merck, Darmstadt, Germany) (361 mg/ml) to the supernatant from previous
centrifugation. The solution was stirred at 4 °C for 15 minutes and centrifuged once
again at 20000 x g (30 minutes at 4 °C). The protein pellet was resuspended in 20 ml of
25 mM Tris, pH 7.7, and loaded onto a POROS8 anion exchange column in in ÄKTA
2. Materials and methods
39
Basic system equilibrated with 25 mM Tris-HCl, pH 7.7. Full length αS and mutated
proteins were eluted with a salt gradient at ~300 mM NaCl. The fractions containing
protein (determined UV spectrophotometer) were pooled together and concentrated
using Centriprep YM-10 filter devices (10 kDa molecular weight cut off) (Amicon,
Bedford, MA) to a final concentration of 300 μM. Concentrated proteins were dialyzed
overnight against the desired buffer (50 mM Na-phosphate, pH 7.4, 100 mM NaCl).
Purity of the protein was assessed by SDS-PAGE and the concentration was determined
with absorbance at 275 nm using an extinction coefficient of 5600 M-1cm-1, Proteins
were aliquoted, flash freezed in liquid N2 and stored at −80 °C.
Purification of Cys-containing mutants was performed similarly to wt protein
but 5 mM dithiothreitol (DTT) was included throughout the different purification steps
in order to avoid Cys oxidation and disulfide-linked dimer formation. Preparation of
15N- and 13C/15N labeled proteins were carried out exactly as for the non-labeled
proteins with the only difference that LB medium was replaced by M9 minimal medium
supplemented with 15NH4Cl or 15NH4Cl and 13C-D-glucose. A 5x stock solution of M9
salts, with the absence of NH4Cl, was prepared adding 64 g of Na2HPO4-7H2O (Sigma),
15 g KH2PO4 (Sigma), 2.5 g NaCl (Sigma) and adding water to a final volume of 1 l
followed by autoclaving. For 500 ml of final culture media, 100 ml of M9 5x stock
solution was mixed with 1 ml of 1M MgSO4, 50 μl of 1 M CaCl2, 0.5 g of 15NH4Cl, 10
ml of 20 % D-glucose (13C-D-glucose for double labeled proteins) and autoclaved after
making up to a final volume of 500 ml with ddH2O. The pH of the solution was
adjusted to 7.3 and the media was filter-sterilized (0.2 μm filter). Prior to the start of
incubation, 100 μg/ml of ampicillin was added.
2. Materials and methods
40
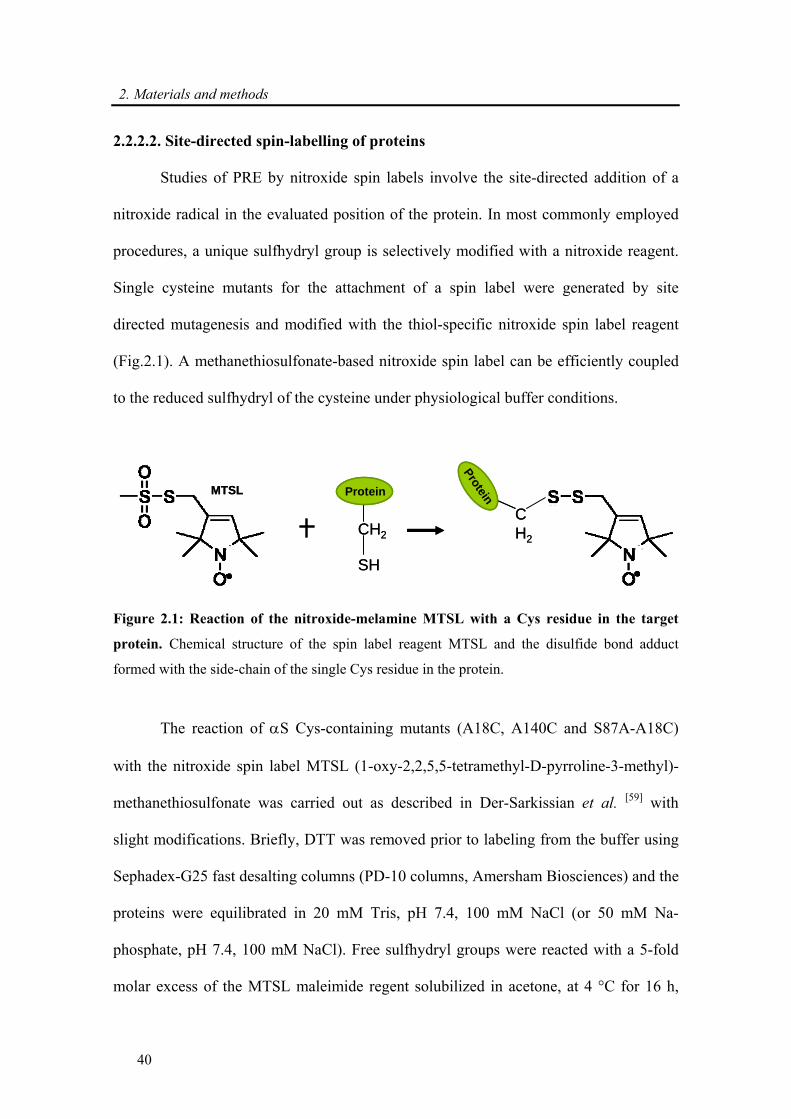
2.2.2.2. Site-directed spin-labelling of proteins
Studies of PRE by nitroxide spin labels involve the site-directed addition of a
nitroxide radical in the evaluated position of the protein. In most commonly employed
procedures, a unique sulfhydryl group is selectively modified with a nitroxide reagent.
Single cysteine mutants for the attachment of a spin label were generated by site
directed mutagenesis and modified with the thiol-specific nitroxide spin label reagent
(Fig.2.1). A methanethiosulfonate-based nitroxide spin label can be efficiently coupled
to the reduced sulfhydryl of the cysteine under physiological buffer conditions.
MTSL Protein
CH2
SH
Protein
CH2
MTSL Protein
CH2
SH
Protein
CH2
Figure 2.1: Reaction of the nitroxide-melamine MTSL with a Cys residue in the target
protein. Chemical structure of the spin label reagent MTSL and the disulfide bond adduct
formed with the side-chain of the single Cys residue in the protein.
The reaction of αS Cys-containing mutants (A18C, A140C and S87A-A18C)
with the nitroxide spin label MTSL (1-oxy-2,2,5,5-tetramethyl-D-pyrroline-3-methyl)-
methanethiosulfonate was carried out as described in Der-Sarkissian et al. [59] with
slight modifications. Briefly, DTT was removed prior to labeling from the buffer using
Sephadex-G25 fast desalting columns (PD-10 columns, Amersham Biosciences) and the
proteins were equilibrated in 20 mM Tris, pH 7.4, 100 mM NaCl (or 50 mM Na-
phosphate, pH 7.4, 100 mM NaCl). Free sulfhydryl groups were reacted with a 5-fold
molar excess of the MTSL maleimide regent solubilized in acetone, at 4 °C for 16 h,
2. Materials and methods
41
wrapped by aluminum foil. Access of spin label was removed during dialysis against
four liters NMR-buffer (50 mM Na-phosphate, pH 7.4, 100 mM NaCl or 300 mM
NaCl). Complete labeling with the nitroxide radical was verified by mass spectrometry
and proteins were aliquoted, flash freezed in liquid N2 and stored at −80 °C.
2.2.2.3. Phosphorylation of α-synuclein in vitro
wt and variants of αS (S87A, S87E, S129A and S129D) were phosphorylated by
Casein Kinase1 (CK1) (specific activity 2,000,000 U/mg) (New England Biolabs) at a
concentration of 1.44 mg/ml (100 μM), unless otherwise stated. The reaction was
carried out in the presence of 1.09 mM ATP (Sigma), 1x reaction solution supplied with
the enzyme and 1200U of CK1/145 μg of αS. The reaction was stopped with
ethylenediaminetetraacetic acid (EDTA) disodium salt (5 mM final concentration). The
progress of the reaction was monitored by RP-HPLC and mass spectrometry. The in situ
phosphorylation assay was performed in a Shigemmi NMR tube (Shigemmi, Inc. USA)
at 15 °C, with a sample containing 100 μM 15N-labeled wt or mutants αS and 2 mg/ml
CK1 in the standard phosphorylation buffer. After addition of 1.5 mM ATP solution, a
series of 1H-15N HSQCs were measured on a Bruker 600 MHz spectrometer. Each
HSQC was measured with 16 scans per increment for 90 minutes.
2.2.2.4. Synthesis of random coil peptides
Synthesis of random coil peptides was made by Dr. Volker Klaukien in the
department of NMR-based Structural biology, MPIBPC. Two types of random coil
peptides, Ac-GGXAGG-NH2 and Ac-GGXGG-NH2, were synthesized employing
standard solid-phase Fmoc chemistry. The peptides were purified by semi-preparative
2. Materials and methods
42
C4-RP column (see 2.2.2.5) and the purity (> 95 %) were analyzed by mass
spectrometry (MS).
2.2.2.5. Reversed phase-high performance liquid chromatography (RP-HPLC)
RP-HPLC systems were operated by Gerhard Wolf in the department of NMR-
based Structural biology, MPIBPC. Monitoring the phosphorylation reaction and
purification of the various phosphorylated species of wt, S129E, S129A, S87E and
S87A αS and synthesized random coil peptides were accomplished using RP-HPLC on
JASCO systems using semi-preparative C4- or C18-RP column. A 35-50 % linear
gradient (flow rate 1 ml /min) [0.09 % (v/v) trifuloroacetic acid (TFA) (buffer A)/90 %
(v/v) acetonitrile aqueous solution (buffer B)] was applied, and the signal was
monitored at 214 nm.
2.2.2.6. Sample preparation for supercooled water.
For measurements in supercooled water at −15 °C, monomeric αS (100 μM
protein) and fibrillar αS were suspended in 50 mM Na-phosphate buffer pH 7.4, 300
mM NaCl and injected into glass capillaries of 1.0 mm outer diameter (Wilmed-
Labglass, USA) using 25 μm syringe (Hamilton Syringe, USA).
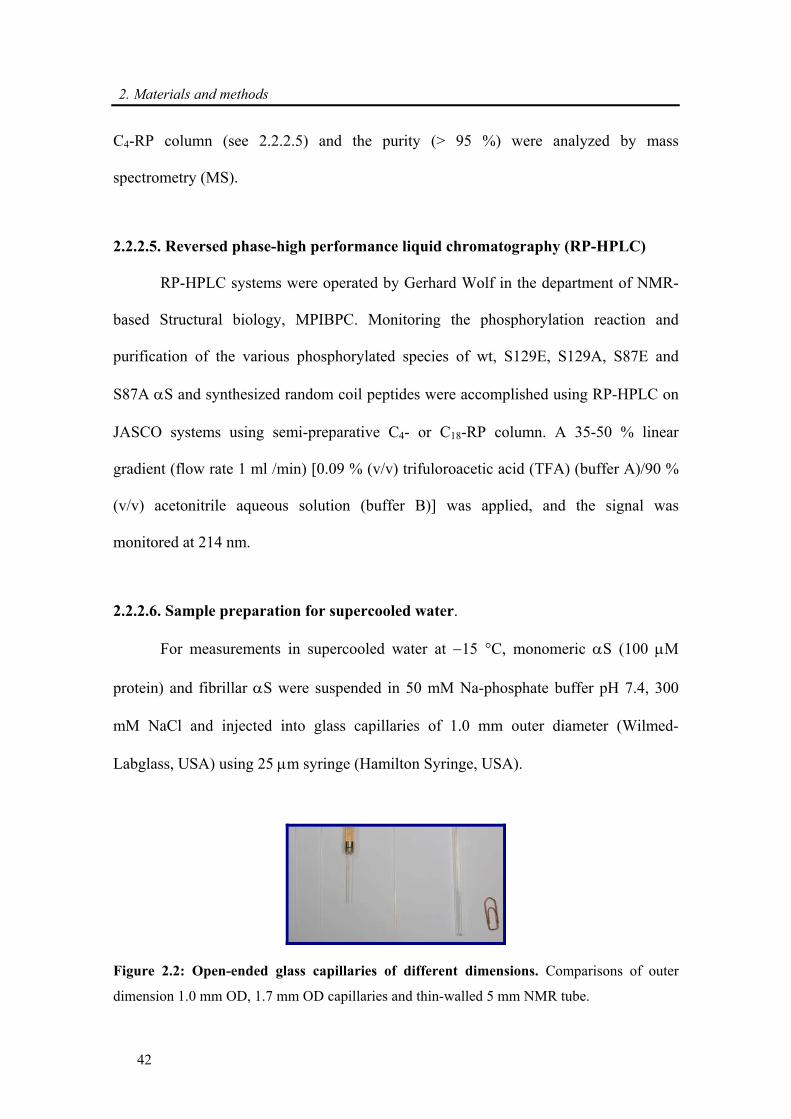
Figure 2.2: Open-ended glass capillaries of different dimensions. Comparisons of outer
dimension 1.0 mm OD, 1.7 mm OD capillaries and thin-walled 5 mm NMR tube.
2. Materials and methods
43
Ends of the capillaries were flame sealed, and ten capillaries were placed in a 5
mm NMR tube (Fig.2.2) [39]. Prior to insertion of the sample into the NMR spectrometer,
the temperature was set to −15 °C.
2.2.2.7. Protein aggregation assay
Investigation of amyloid fibril formation requires not only the ability to
distinguish the characteristic ordered extended β-sheet structure from the amorphous
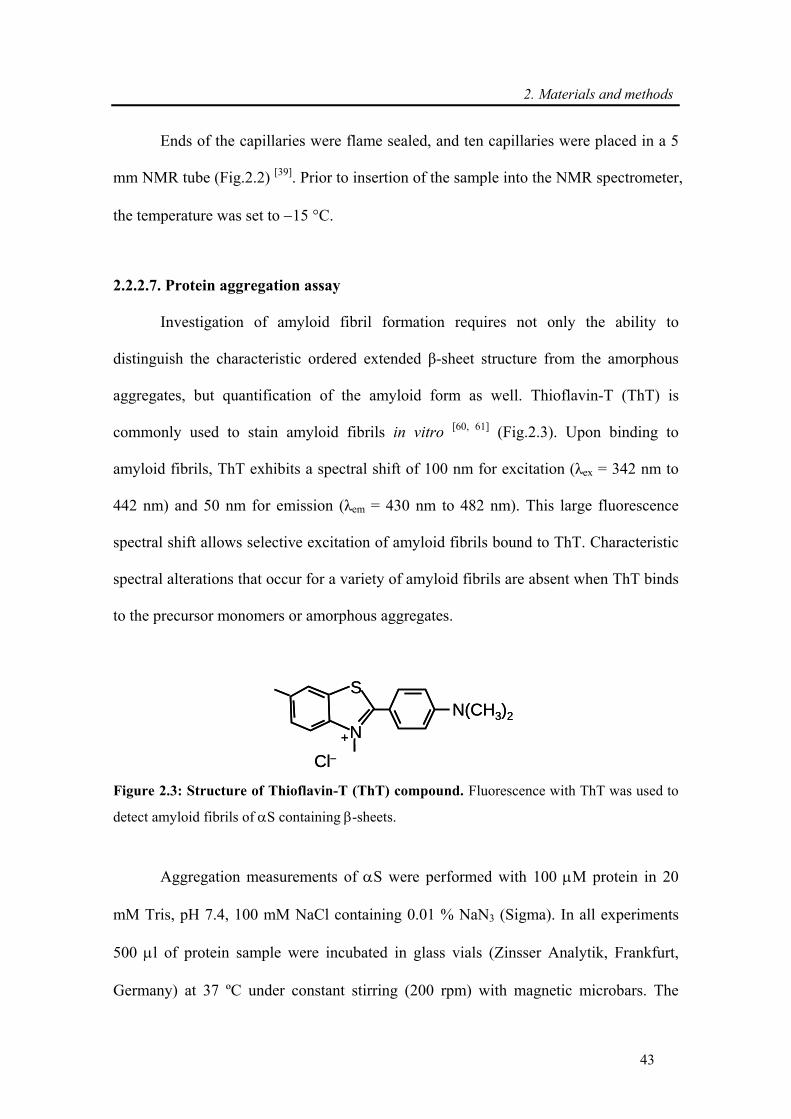
aggregates, but quantification of the amyloid form as well. Thioflavin-T (ThT) is
commonly used to stain amyloid fibrils in vitro [60, 61] (Fig.2.3). Upon binding to
amyloid fibrils, ThT exhibits a spectral shift of 100 nm for excitation (λex = 342 nm to
442 nm) and 50 nm for emission (λem = 430 nm to 482 nm). This large fluorescence
spectral shift allows selective excitation of amyloid fibrils bound to ThT. Characteristic
spectral alterations that occur for a variety of amyloid fibrils are absent when ThT binds
to the precursor monomers or amorphous aggregates.
N(CH3)2
Cl−N
S
+
N(CH3)2
Cl−N
S
+
Figure 2.3: Structure of Thioflavin-T (ThT) compound. Fluorescence with ThT was used to
detect amyloid fibrils of αS containing β-sheets.
Aggregation measurements of αS were performed with 100 μM protein in 20
mM Tris, pH 7.4, 100 mM NaCl containing 0.01 % NaN3 (Sigma). In all experiments
500 μl of protein sample were incubated in glass vials (Zinsser Analytik, Frankfurt,
Germany) at 37 ºC under constant stirring (200 rpm) with magnetic microbars. The
2. Materials and methods
44
amount of fibril formation at different time points was carried out by ThT assay. Briefly,
5-10 μl aliquots were withdrawn from the incubations and diluted into 2 ml of 50 μM
ThT in 50 mM Glycine buffer, pH 8.0. ThT fluorescence was measured in a Varian
Cary Eclipse spectroflourimeter, with an excitation wavelength of 446 nm. Fluorescence
emission from 460 to 600 nm was collected. Fluorescence at 480 nm was employed for
determination of the relative content of αS fibrils in the sample. ThT fluorescence
values were normalized to the values at the end of the aggregation assay.
2.2.2.8. Immunoblotting (dot blotting)
A technique for detecting, analyzing, and identifying proteins, similar to the
western blot technique but differing in that protein samples are not separated
electrophoretically but are spotted through circular templates directly onto the
membrane or paper substrate [62]. wt αS, oligomers and fibrils were spotted onto
nitrocellulose membrane (Protran BA85, 0.45 μm pore size). 2 μl-8 μl of sample was
loaded onto nitrocellulose membrane. Blotting was performed using the conformation-
specific A11 antibody (1:1000, Invitrogen´s Biosource) as described previously [62]. The
amount of protein used for each spot was around 10 µg. In a parallel experiment, same
samples were blotted using the anti-αS antibody (1:2000, BD Biosciences). The amount
of the protein used was 1 μg.
2.2.2.9. Lipid bilayer experiments
Black lipid bilayer membranes were performed as described by Benz et al [63]
and performed by Elke Maier in Prof. Roland Benz group, Würzburg, Germany. The
instrumentation consisted of a teflon chamber with two aqueous compartments
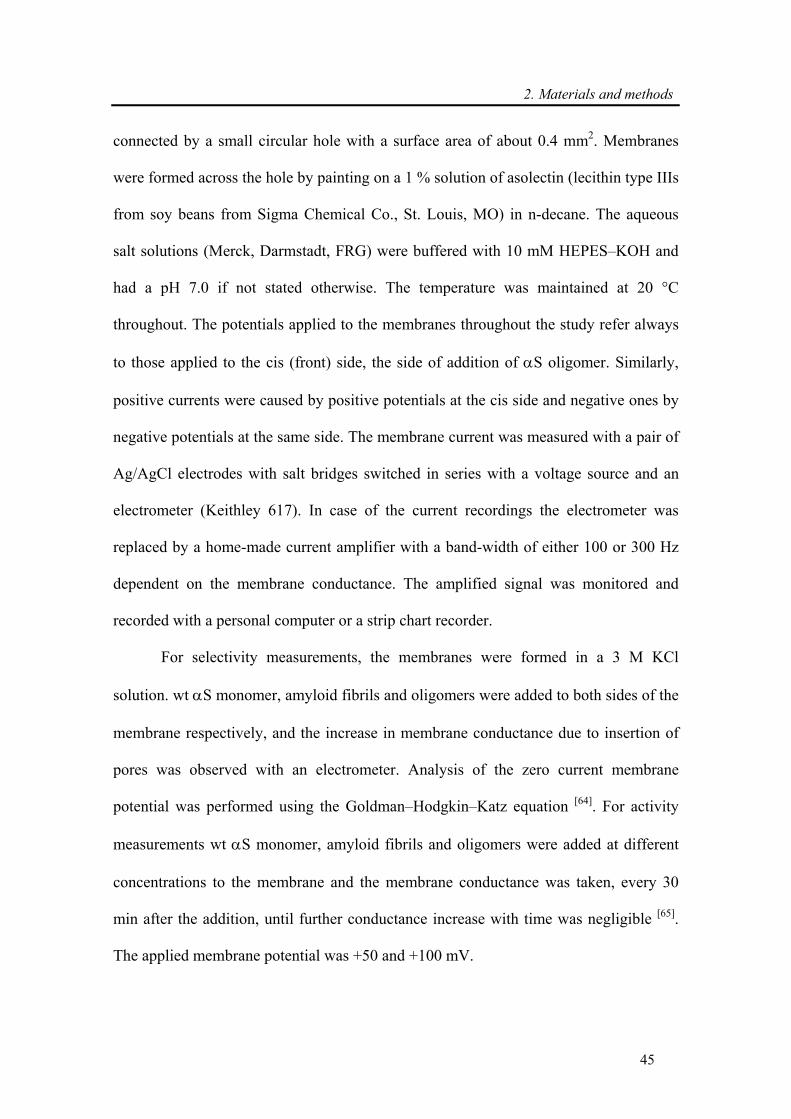
2. Materials and methods
45
connected by a small circular hole with a surface area of about 0.4 mm2. Membranes
were formed across the hole by painting on a 1 % solution of asolectin (lecithin type IIIs
from soy beans from Sigma Chemical Co., St. Louis, MO) in n-decane. The aqueous
salt solutions (Merck, Darmstadt, FRG) were buffered with 10 mM HEPES–KOH and
had a pH 7.0 if not stated otherwise. The temperature was maintained at 20 °C
throughout. The potentials applied to the membranes throughout the study refer always
to those applied to the cis (front) side, the side of addition of αS oligomer. Similarly,
positive currents were caused by positive potentials at the cis side and negative ones by
negative potentials at the same side. The membrane current was measured with a pair of
Ag/AgCl electrodes with salt bridges switched in series with a voltage source and an
electrometer (Keithley 617). In case of the current recordings the electrometer was
replaced by a home-made current amplifier with a band-width of either 100 or 300 Hz
dependent on the membrane conductance. The amplified signal was monitored and
recorded with a personal computer or a strip chart recorder.
For selectivity measurements, the membranes were formed in a 3 M KCl
solution. wt αS monomer, amyloid fibrils and oligomers were added to both sides of the
membrane respectively, and the increase in membrane conductance due to insertion of
pores was observed with an electrometer. Analysis of the zero current membrane
potential was performed using the Goldman–Hodgkin–Katz equation [64]. For activity
measurements wt αS monomer, amyloid fibrils and oligomers were added at different
concentrations to the membrane and the membrane conductance was taken, every 30
min after the addition, until further conductance increase with time was negligible [65].
The applied membrane potential was +50 and +100 mV.
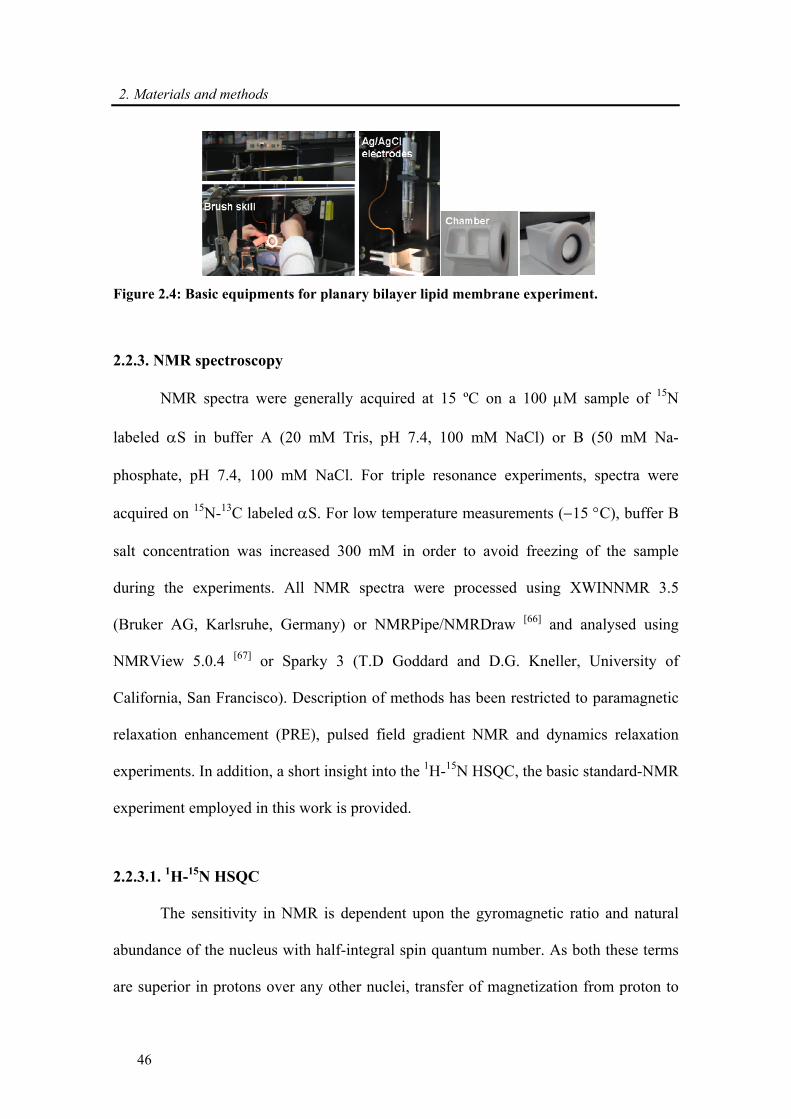
2. Materials and methods
46
Figure 2.4: Basic equipments for planary bilayer lipid membrane experiment.
2.2.3. NMR spectroscopy
NMR spectra were generally acquired at 15 ºC on a 100 μM sample of 15N
labeled αS in buffer A (20 mM Tris, pH 7.4, 100 mM NaCl) or B (50 mM Na-
phosphate, pH 7.4, 100 mM NaCl. For triple resonance experiments, spectra were
acquired on 15N-13C labeled αS. For low temperature measurements (−15 °C), buffer B
salt concentration was increased 300 mM in order to avoid freezing of the sample
during the experiments. All NMR spectra were processed using XWINNMR 3.5
(Bruker AG, Karlsruhe, Germany) or NMRPipe/NMRDraw [66] and analysed using
NMRView 5.0.4 [67] or Sparky 3 (T.D Goddard and D.G. Kneller, University of
California, San Francisco). Description of methods has been restricted to paramagnetic
relaxation enhancement (PRE), pulsed field gradient NMR and dynamics relaxation
experiments. In addition, a short insight into the 1H-15N HSQC, the basic standard-NMR
experiment employed in this work is provided.
2.2.3.1. 1H-15N HSQC
The sensitivity in NMR is dependent upon the gyromagnetic ratio and natural
abundance of the nucleus with half-integral spin quantum number. As both these terms
are superior in protons over any other nuclei, transfer of magnetization from proton to
2. Materials and methods
47
any other nuclei can be performed by complex pulse sequences. Heteronuclear NMR
involves the transfer of magnetization between nuclei of different nature (1H, 15N, 13C,
etc.). Excitation of the proton (1H), followed by polarization transfer to the
heteronucleus (15N), and subsequent reverse polarization transfer to the proton for
detection, offers high sensitivity [68].
The pulse sequence for a basic HSQC experiment is shown in Figure 2.5. The
experiment employs two INEPT (Insensitive nuclei enhancement through polarization
transfer) magnetization transfers. The first one creates an anti-phase heteronuclear
coherence (IY → 2IZSY) and the second is used to convert this coherence back to
observable magnetization (2IZSY → IY) [69]. The first INEPT step creates a proton anti-
phase magnetization (2IXSZ) during τ.
I S Ipolarization
transfer transferEvolution Detection
Reversepolarization
t1 t2
I
S Decoupling
y -y
y y
yyy
φ1 φ2
t1/2 t1/2
φR
τ/2 τ/2 τ/2 τ/2
I S Ipolarization
transfer transferEvolution Detection
Reversepolarization
t1 t2
I
S Decoupling
y -y
y y
yyy
φ1 φ2
t1/2 t1/2
φR
τ/2 τ/2 τ/2 τ/2I
S Decoupling
y -y
y y
yyy
φ1 φ2
t1/2 t1/2
φR
τ/2 τ/2 τ/2 τ/2
Figure 2.5: Fundamental pulse sequence for a HSQC experiment. Narrow and wide pulses
correspond to 90° and 180° flip angles, respectively, with the indicated phase. The delay τ is set
to 1/ (2JIS). Decoupling of the S-spins during acquisition is accomplished using the Waltz-16
sequence. The basic phase cycling φ1 (x, -x, x, -x), φ2 (x, x, -x, -x), and receiver φR (x, -x, -x, x)
is applied in the sequence.
2. Materials and methods
48
To refocus chemical shift modulation during this period, a 180° pulse on both
spins is introduced in the middle of τ period. Coherence is subsequently transferred to
the directly attached heteronucleus (15N for example) by simultaneous 90° pulses on
both spins (2IZSY). The S-spin coherence is frequency-labeled during the t1 period. The
180° pulse on the I-spin in the middle of t1 refocuses the evolution of heteronuclear JIS
coupling. The 90° pulse on both spins transfer the magnetization back to proton as anti-
phase I-spin magnetization (2IYSZ). The final spin-echo period converts this anti-phase
term into in-phase proton magnetization (2IYSZ → IX). The outcome of such a pulse
sequence is a signal, detected in the proton dimension (F2), which contains information
on the chemical shifts of both 1H and 15N nuclei, for a given nitrogen frequency
observed. The desired frequency space is sampled by repeating the pulse sequence for
variable frequencies on the nitrogen dimension (F1), and the set of one dimensional
spectrum is merged in a single two dimensional representation, the 2D 1H-15N HSQC
spectrum. NH bonds will thus be seen as cross-peaks situated at the intersection
between the 1H and 15N resonance frequencies or chemical shifts.
2D 1H-15N HSQC experiments in wt αS, S87A, S87, S129A and S129E were
recorded using 256 x 1024 complex incremental data points in F1 (15N) and F2 (1H)
dimensions, with 8 to 32 scans per increment and a relaxation delay of 1.2 s. The
sampled frequency space (sweep width) was 26 ppm for the nitrogen dimension
(centered in 119 ppm) and 10 ppm for the proton dimension (centered in 4.7 ppm).
2.2.3.2. Paramagnetic relaxation enhancement (PRE)
2D 15N-1H HSQC spectra were recorded of phosphorylation mimic αS mutants
and αS Cys-containing mutants, with and without the paramagnetic MTSL-tag, HSQC
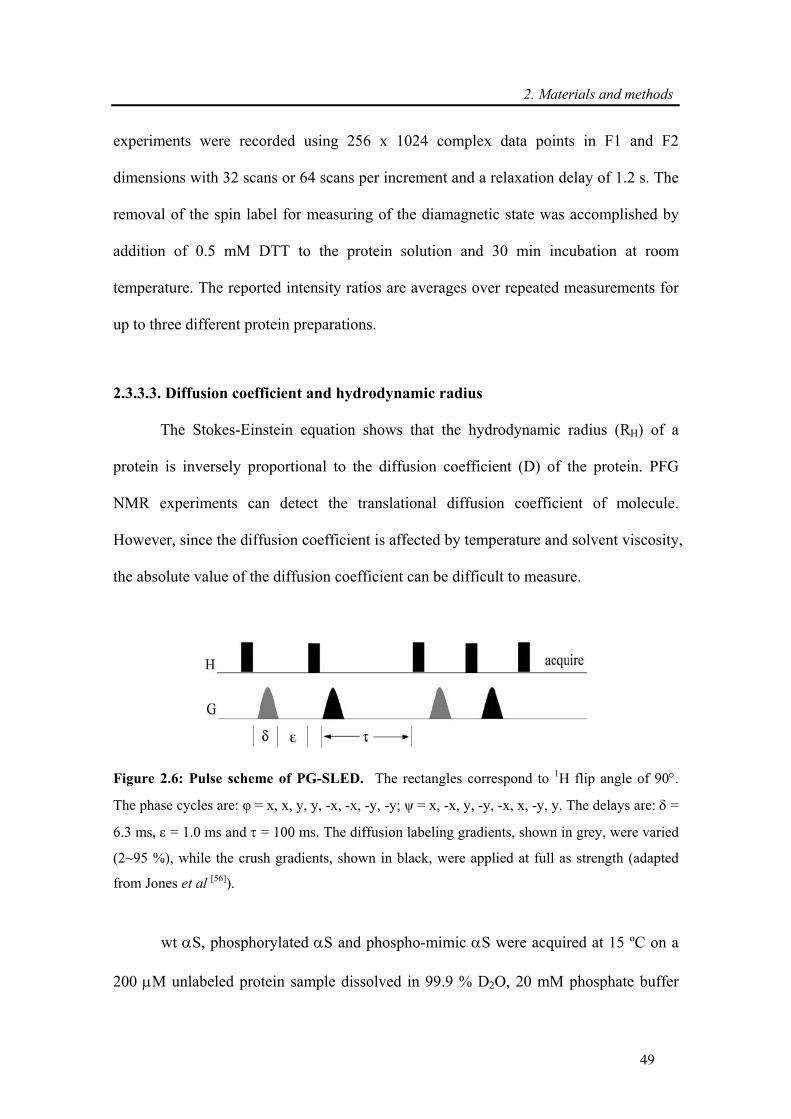
2. Materials and methods
49
experiments were recorded using 256 x 1024 complex data points in F1 and F2
dimensions with 32 scans or 64 scans per increment and a relaxation delay of 1.2 s. The
removal of the spin label for measuring of the diamagnetic state was accomplished by
addition of 0.5 mM DTT to the protein solution and 30 min incubation at room
temperature. The reported intensity ratios are averages over repeated measurements for
up to three different protein preparations.
2.3.3.3. Diffusion coefficient and hydrodynamic radius
The Stokes-Einstein equation shows that the hydrodynamic radius (RH) of a
protein is inversely proportional to the diffusion coefficient (D) of the protein. PFG
NMR experiments can detect the translational diffusion coefficient of molecule.
However, since the diffusion coefficient is affected by temperature and solvent viscosity,
the absolute value of the diffusion coefficient can be difficult to measure.
Figure 2.6: Pulse scheme of PG-SLED. The rectangles correspond to 1H flip angle of 90°.
The phase cycles are: φ = x, x, y, y, -x, -x, -y, -y; ψ = x, -x, y, -y, -x, x, -y, y. The delays are: δ =
6.3 ms, ε = 1.0 ms and τ = 100 ms. The diffusion labeling gradients, shown in grey, were varied
(2~95 %), while the crush gradients, shown in black, were applied at full as strength (adapted
from Jones et al [56]).
wt αS, phosphorylated αS and phospho-mimic αS were acquired at 15 ºC on a
200 μM unlabeled protein sample dissolved in 99.9 % D2O, 20 mM phosphate buffer
2. Materials and methods
50
pH 7.4, and containing dioxane (~20 mM) as an internal radius standard and viscosity
probe [57]. To see the structural changes on αS with temperature, NMR experiments
were performed from −15 °C to 47 °C as mentioned above. Deuterium oxide was
employed instead of water in order to minimize the power level necessary for water pre-
saturation. 16 one-dimensional 1H spectra were collected as a function of gradient
amplitude employing the PG-SLED sequence (Fig.2.6) [56]. Each 1H spectrum
comprised 32 scans plus 16 steady-state scans. 16 K complex points were acquired with
a spectral width of 6,000 Hz. With Topspin 2.0 (Bruker Biospin, Germany), the signals
corresponding to the aliphatic region of the 1H spectra (3.3-0.5 ppm) were integrated
and the decay of the signal as a function of the gradient strength was fitted to a Gaussian
function to determine dprot. The same procedure was applied for the dioxane peak (~3.6
ppm) and the dref was measured. The RH for the protein was calculated from the known
RH (2.12 Å) [57] for the dioxane and the ratio between the measured dref/dprot.
2.2.3.4. Relaxation properties and motion
15N relaxation T2, T1ρ and 15N {1H}-Steady state nuclear Overhauser effects (NOEs)
15N relaxation data were acquired with modified versions of pulse sequences
described earlier [70], incorporating pulsed field gradients and a WATERGATE for
solvent suppression. T2 times were sampled using seven different 15N relaxation delays
(Δrelax): 3.8, 15.2, 22.8, 25.6, 91.2, 171, 342 and 3.8 ms. To extract 15N T2 relaxation
times by measuring the peak height (I) for all spectra recorded with different relaxation
delays and fitting the single-exponential function:
y = I(O) exp(-Δrelax R2-1) (12)
2. Materials and methods
51
where R2 is the transverse relaxation rate (T2 = 1/R2). Residue specific 15N R1ρ spin
relaxation rates were measured with a pulse sequence based on Farrow et al. [71] on a
Bruker Avance 600 MHz spectrometer. Relaxation delays were set to 8, 48, 64, 128 and
184 ms with spin lock frequency of 2.5 kHz that makes a tilt angle bigger than 68° for
the 15N magnetization in the desired spectral width [72]. The peak intensity decay of each
residue as a function of the delay time was fitted with single exponential curve and the
corresponding R1ρ was acquired. Relaxation times were calculated by fitting an
exponential function to the decaying signal integrals.
The heteronuclear nuclear Overhauser effect (NOEs) of 15N nuclei in NH groups
were measured using the Bruker standard pulse program invinoef3gpse. 15N {1H}-NOEs
values are reported as the ratio of peak heights in paired spectra collected with and
without a period (4 s) of proton saturation during the 5-s recycle delay.
2.2.3.5. Secondary structure determination
1H chemical shifts were referenced with 2,2-dimethyl-2-silapentane-5-sulfonic
acid (DSS), and 15N and 13C chemical shifts were referenced indirectly [73]. Averaged
secondary chemical shifts were calculated as ΔS= (3×ΔS(13Cα))+ 4×ΔS(13C'))/7), where
ΔS(13Cα) and ΔS(13C') are the difference between the experimental 13Cα and 13C'
chemical shifts and the corresponding random coil values [48, 73].
2.2.3.6. Mapping of long-range interactions by chemical shift differences
Chemical shifts depend on the local chemical environment of a nucleus. If
effectors bind to a protein, this environment changes at the interaction site. This causes
perturbations of the chemical shifts. These perturbations can be followed in every

2. Materials and methods
52
NMR-spectrum. 15N-1H-HSQC spectra have a high sensitivity. Therefore chemical shift
values can be easily followed in the 15N-1H-HSQC spectrum upon phosphorylation of
the protein. The chemical shift perturbations are commonly combined with the
following equation [74]:
( ) ( )2 2/ 5
2N H
HN
δ δδ
Δ + ΔΔ = (13)
ΔδHN: average amide chemical shift perturbation
ΔδN: amide nitrogen chemical shift changes
ΔδH: amide proton chemical shift changes
2.2.4. Other spectroscopic methods
2.2.4.1. UV absorbance
The concentration of proteins in solution was determined, according to the
Lambert-Beer law, by measuring the absorption at 280 nm (A280).
Aλ = ελ · c · d (14)
Aλ : absorption at wavelength λ
ελ : molar extinction coefficient at wavelength λ in M−1cm−1
c: protein concentration (M)
d: thickness of the cuvette (cm)
2. Materials and methods
53
2.2.4.2. Electrospray Quadrupole Mass spectrometry
For Electrospray Quadrupole Mass spectrometry the source capillary was set to
2.94 kV. Scans were acquired in positive-ion mode at m/z 500-2500. It was performed
after RP-HPLC (see 2.2.2.5).
2.2.4.3. Circular dichroism (CD) spectroscopy
The secondary structure of monomeric αS, fibrils and dissociated fibrils were
determined by CD spectroscopy using a Photophysics Chirascan spectrometer at the
Department of neurobiology, MPI-BPC. The Far UV-CD spectra (190-250 nm,
integration time of 2 seconds for 0.2 nm) were collected at 15 °C in a 1 mm path length
quartz cuvette containing 100 μM of protein in buffer 50 mM Na-phosphate buffer pH
7.4, 300 mM NaCl. Data were expressed as difference absorbance (ε) or circular
dichroism (Δε) per molar concentration of protein. Spectrophotometric data were fit
using the program Chirascan.
2.2.4.4. Electron microscopy (EM)
Electron microscopic images were taken by Dr. Dietmar Riedel at the
Department of neurobiology, MPIBPC. For EM studies, wt αS or other aggregated
protein samples were deposited on Formvar-coated 200 mesh copper grids (Electron
Microscopy Sciences) at a concentration of 25 μM. Grids were washed with two drops
of water and stained with two drops of freshly prepared 0.75 % (w/v) uranyl acetate
(Electron microscopy sciences). Specimens were inspected on a Philip CIME 12
electron microscope, operated at 80 kV. Digitized photographs were recorded with a
slow scan CCD camera.

3. Correlation of amyloid fibril β-structure with the unfolded state of αS
55
3. Correlation of amyloid fibril β-structure with the
unfolded state of α-synuclein
3.1. Introduction
Many human neurodegenerative disorders, including Alzheimer’s and
Parkinson’s disease, are associated with the deposition of proteinaceous aggregates
known as amyloid fibrils [75, 76]. Surprisingly, proteins with very different amino acid
sequences and three-dimensional structures aggregate into amyloid fibrils that share
common characteristics such as a similar morphology and a specific β-sheet based
molecular architecture [77, 78] (Fig.3.1). This suggests that the ability to fibrillate is an
intrinsic property of a polypeptide chain and that the native structure is not necessarily
the only ordered structure that each protein can assume [3].
An additional common property of aggregation into amyloid fibrils is the
presence of partially or fully unfolded states of the misfolding proteins. For proteins that
are natively folded, unfolded states are present during biosynthesis, or as a result of
proteolytic degradation [3, 79-81]. Though there is increasing knowledge about the factors
that drive aggregation [82, 83], the structural characteristics of aggregation-prone states
and the molecular details that determine the arrangement of misfolded proteins in
amyloid fibrils are not still fully understood.
Is a high population of a specific conformation in denatured states required for
the efficient generation of amyloid fibrils? What is the relation between the properties
of the unfolded state and the β-structure in amyloid fibrils? Are differences in the
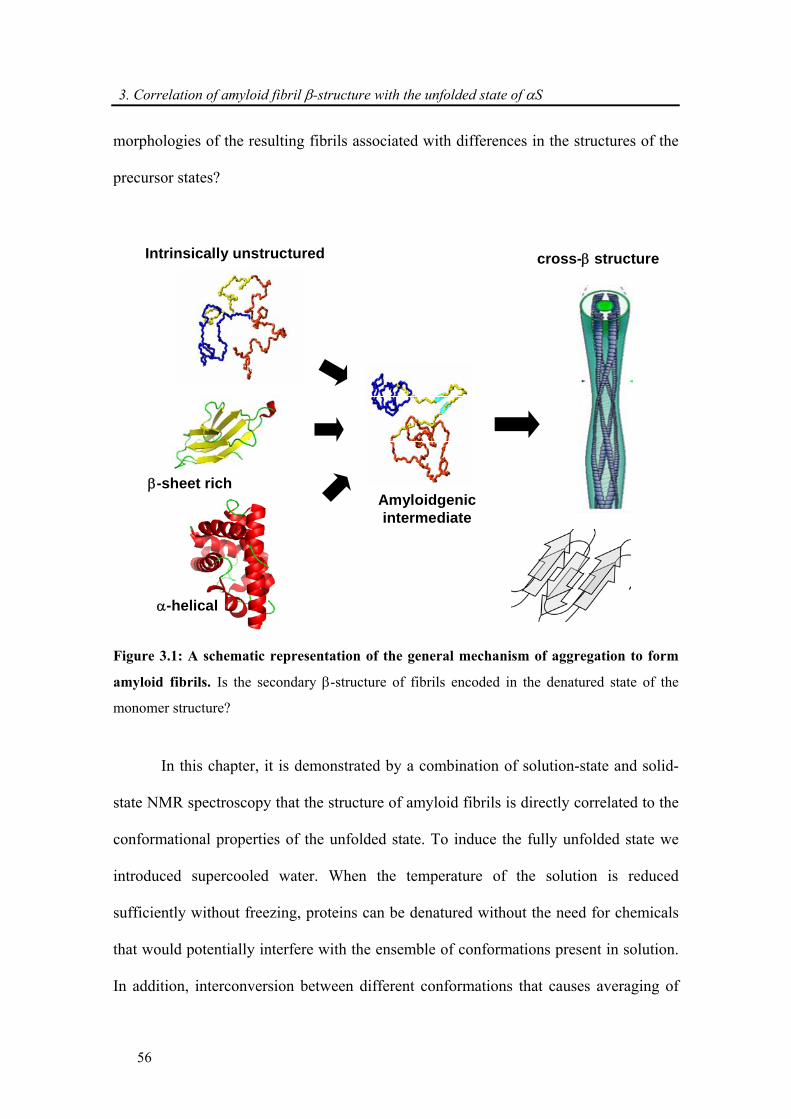
3. Correlation of amyloid fibril β-structure with the unfolded state of αS
56
morphologies of the resulting fibrils associated with differences in the structures of the
precursor states?
Toxic species (?)Protective function (?)
Deposit
Amyloidfibril
Amyloidgenicintermediate
Amorphousaggregates
Pore-likeaggregates
Membrane pores
α-helical
Intrinsicallyunstructured
Protectivefunction?
Toxicspecies?
Amyloidgenicintermediate
Intrinsically unstructured
Toxic species (?)
cross-β structure
α-helical
β-sheet rich
Figure 3.1: A schematic representation of the general mechanism of aggregation to form
amyloid fibrils. Is the secondary β-structure of fibrils encoded in the denatured state of the
monomer structure?
In this chapter, it is demonstrated by a combination of solution-state and solid-
state NMR spectroscopy that the structure of amyloid fibrils is directly correlated to the
conformational properties of the unfolded state. To induce the fully unfolded state we
introduced supercooled water. When the temperature of the solution is reduced
sufficiently without freezing, proteins can be denatured without the need for chemicals
that would potentially interfere with the ensemble of conformations present in solution.
In addition, interconversion between different conformations that causes averaging of
3. Correlation of amyloid fibril β-structure with the unfolded state of αS
57
spectroscopic probes at higher temperatures is slowed down. Similar or even identical
spectroscopic probes are used in solution-state and solid-state NMR, allowing a detailed
comparison of the structure of proteins in their unfolded and fibrillar states.
3.2. Experimental procedure
Sample preparation for supercooled water: Expression and purification of 15N- and
13C/15N-labeled wt αS were performed as described in 2.2.2.1. For measurements in
supercooled water at −15 °C, monomeric wt αS was dissolved in 50 mM Na-phosphate
buffer, pH 7.4, 300 mM NaCl and taken up into open-ended glass capillaries of 1.0 mm
outer diameter. The ends of the capillaries were flame sealed, and the capillaries were
placed in a 5-mm NMR tube (see 2.2.2.6). Preparation of spin labeled αS was
performed after the purification (see 2.2.2.2).
NMR Spectroscopy: Solution-state NMR experiments were recorded on Bruker Avance
600 and 700 MHz NMR spectrometers (see 2.2.3). Pulse field gradient NMR
experiments were acquired using the PG-SLED sequence and Errors in hydrodynamic
radius were estimated from repeat measurements and were about 0.3 Å (see 2.3.3.3).
3.3. Results and discussion
3.3.1. Backbone assignment of α-synuclein at −15 °C
Previous assignments of backbone resonances performed in our laboratory had
independently corroborated the assignment of αS in physiological aqueous solution [84].
For the characterization of the structure and dynamics of αS at −15 °C, we had to
determine the sequence-specific assignment of backbone resonances of αS. 3D 15N-1H
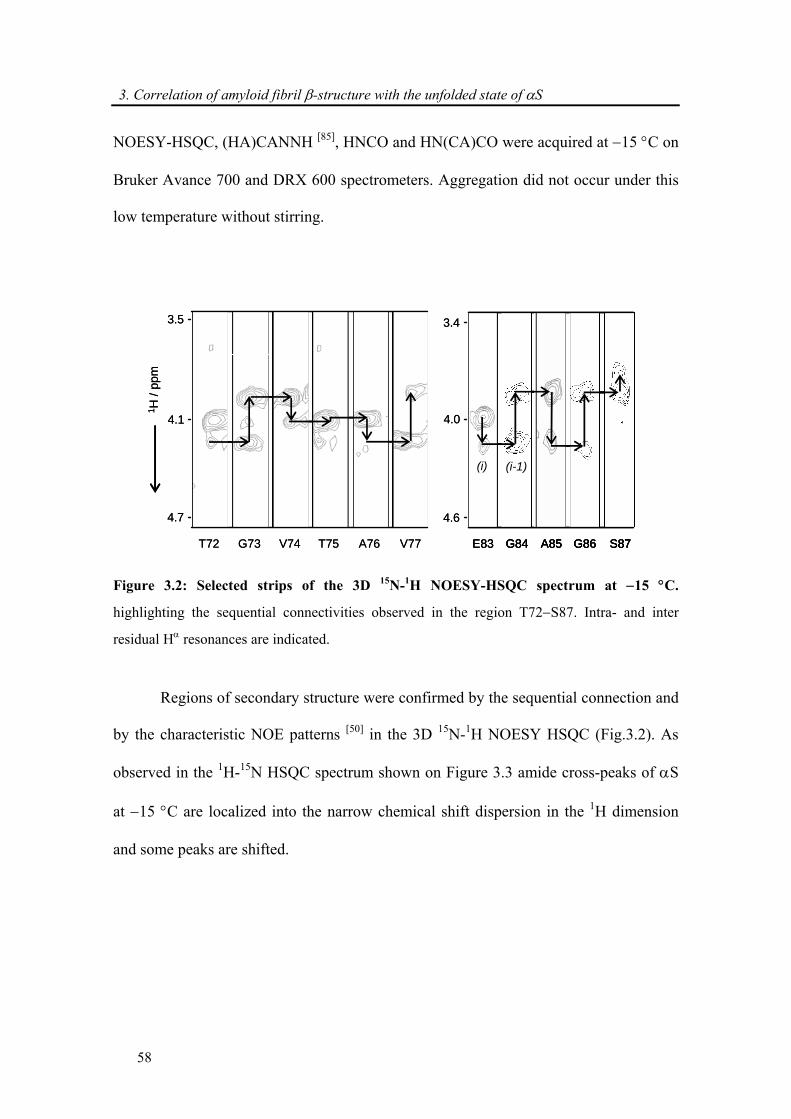
3. Correlation of amyloid fibril β-structure with the unfolded state of αS
58
NOESY-HSQC, (HA)CANNH [85], HNCO and HN(CA)CO were acquired at −15 °C on
Bruker Avance 700 and DRX 600 spectrometers. Aggregation did not occur under this
low temperature without stirring.
1 H /
ppm
3.5
4.1
4.7
E83 S87G86A85G84
(i-1)(i)
A76T75V74G73T72 V77
3.4
4.0
4.6
1 H /
ppm
3.5
4.1
4.7
E83 S87G86A85G84
(i-1)(i)
E83 S87G86A85G84
(i-1)(i)
S87G86A85G84
(i-1)(i)
A76T75V74G73T72 V77
3.4
4.0
4.6
Figure 3.2: Selected strips of the 3D 15N-1H NOESY-HSQC spectrum at −15 °C.
highlighting the sequential connectivities observed in the region T72−S87. Intra- and inter
residual Hα resonances are indicated.
Regions of secondary structure were confirmed by the sequential connection and
by the characteristic NOE patterns [50] in the 3D 15N-1H NOESY HSQC (Fig.3.2). As
observed in the 1H-15N HSQC spectrum shown on Figure 3.3 amide cross-peaks of αS
at −15 °C are localized into the narrow chemical shift dispersion in the 1H dimension
and some peaks are shifted.
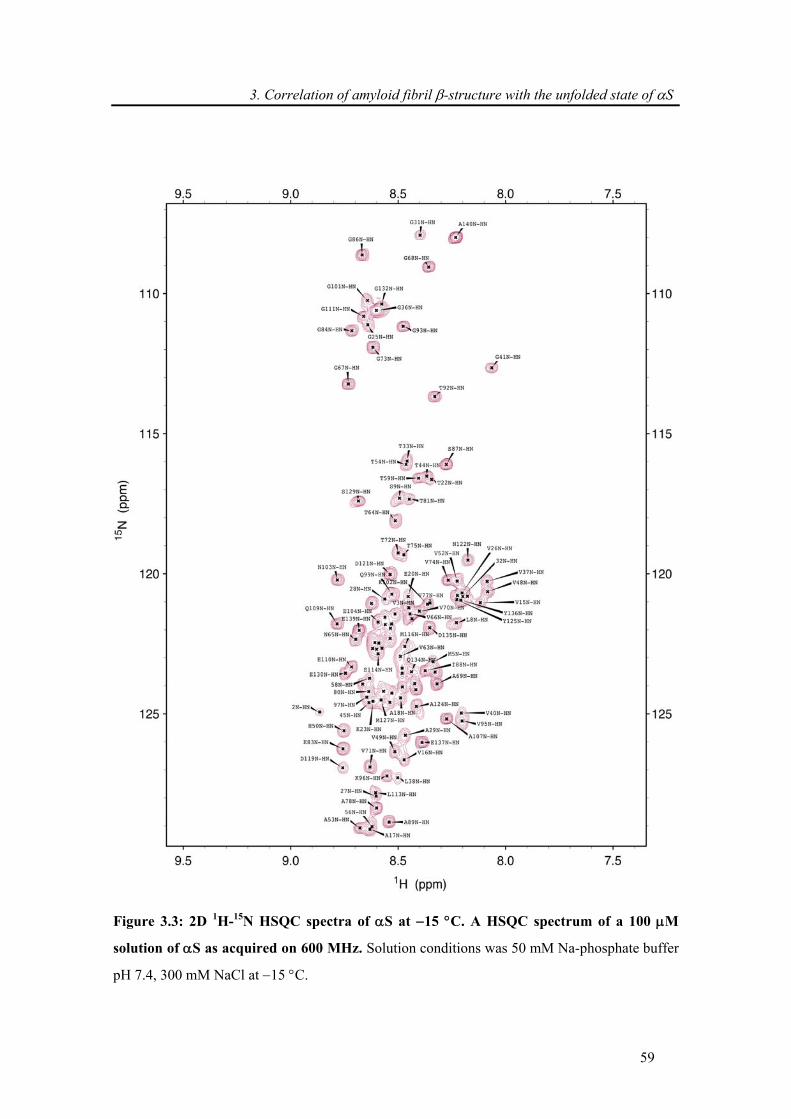
3. Correlation of amyloid fibril β-structure with the unfolded state of αS
59
Figure 3.3: 2D 1H-15N HSQC spectra of αS at −15 °C. A HSQC spectrum of a 100 μM
solution of αS as acquired on 600 MHz. Solution conditions was 50 mM Na-phosphate buffer
pH 7.4, 300 mM NaCl at −15 °C.
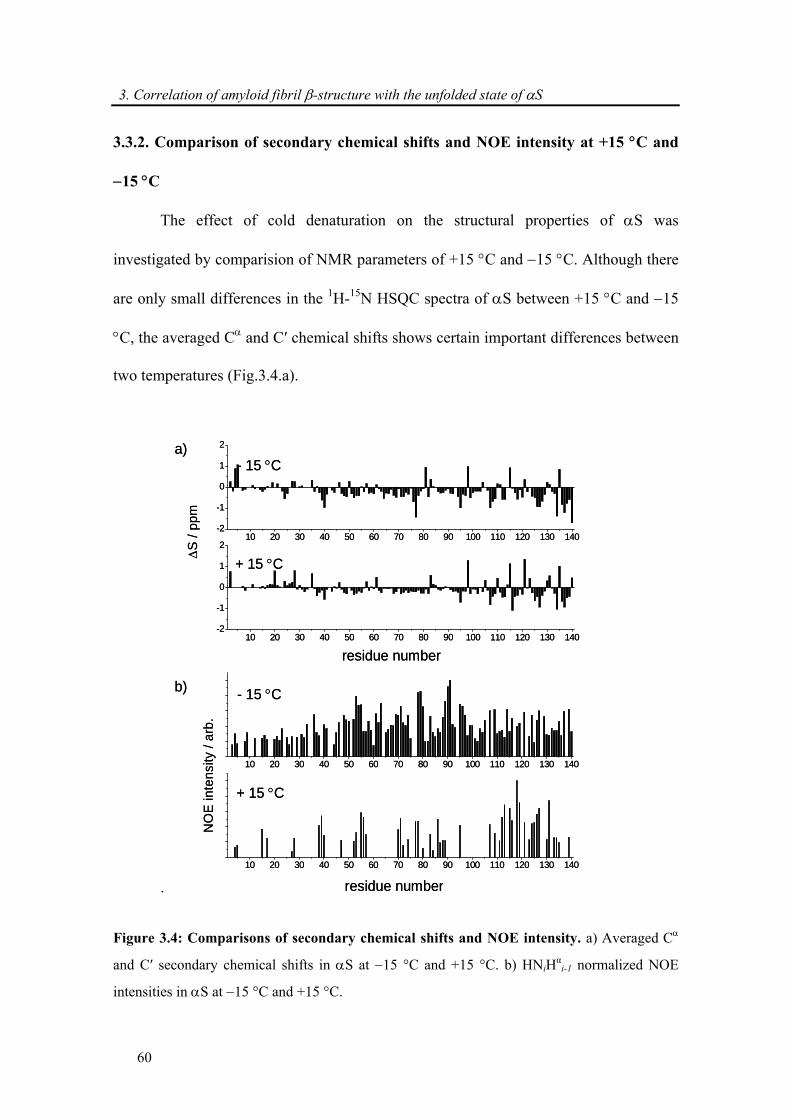
3. Correlation of amyloid fibril β-structure with the unfolded state of αS
60
3.3.2. Comparison of secondary chemical shifts and NOE intensity at +15 °C and
−15 °C
The effect of cold denaturation on the structural properties of αS was
investigated by comparision of NMR parameters of +15 °C and −15 °C. Although there
are only small differences in the 1H-15N HSQC spectra of αS between +15 °C and −15
°C, the averaged Cα and C′ chemical shifts shows certain important differences between
two temperatures (Fig.3.4.a).
.
a)
residue number
ΔS /
ppm
+ 15 °C
- 15 °C
10 20 30 40 50 60 70 80 90 100 110 120 130 140-2
-1
0
1
2
10 20 30 40 50 60 70 80 90 100 110 120 130 140-2
-1
0
1
2
10 20 30 40 50 60 70 80 90 100 110 120 130 140
10 20 30 40 50 60 70 80 90 100 110 120 130 140
+ 15 °C
- 15 °C
residue number
b)
NO
E in
tens
ity /
arb.
Figure 3.4: Comparisons of secondary chemical shifts and NOE intensity. a) Averaged Cα
and C′ secondary chemical shifts in αS at −15 °C and +15 °C. b) HNiHαi-1 normalized NOE
intensities in αS at −15 °C and +15 °C.
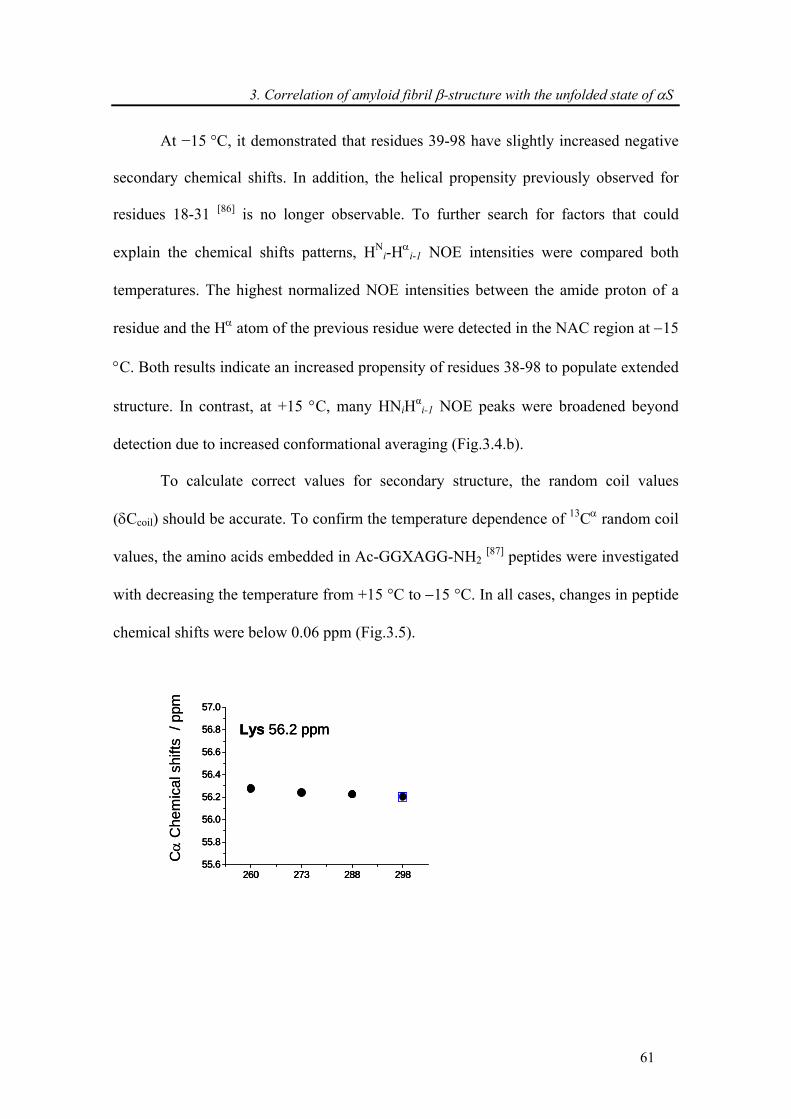
3. Correlation of amyloid fibril β-structure with the unfolded state of αS
61
At −15 °C, it demonstrated that residues 39-98 have slightly increased negative
secondary chemical shifts. In addition, the helical propensity previously observed for
residues 18-31 [86] is no longer observable. To further search for factors that could
explain the chemical shifts patterns, HNi-Hα
i-1 NOE intensities were compared both
temperatures. The highest normalized NOE intensities between the amide proton of a
residue and the Hα atom of the previous residue were detected in the NAC region at −15
°C. Both results indicate an increased propensity of residues 38-98 to populate extended
structure. In contrast, at +15 °C, many HNiHαi-1 NOE peaks were broadened beyond
detection due to increased conformational averaging (Fig.3.4.b).
To calculate correct values for secondary structure, the random coil values
(δCcoil) should be accurate. To confirm the temperature dependence of 13Cα random coil
values, the amino acids embedded in Ac-GGXAGG-NH2 [87] peptides were investigated
with decreasing the temperature from +15 °C to −15 °C. In all cases, changes in peptide
chemical shifts were below 0.06 ppm (Fig.3.5).
260 273 288 29855.6
55.8
56.0
56.2
56.4
56.6
56.8
57.0
Lys 56.2 ppm
Cα
Che
mic
al s
hifts
/ ppm
260 273 288 29855.6
55.8
56.0
56.2
56.4
56.6
56.8
57.0
Lys 56.2 ppm
260 273 288 29855.6
55.8
56.0
56.2
56.4
56.6
56.8
57.0
Lys 56.2 ppm
Cα
Che
mic
al s
hifts
/ ppm
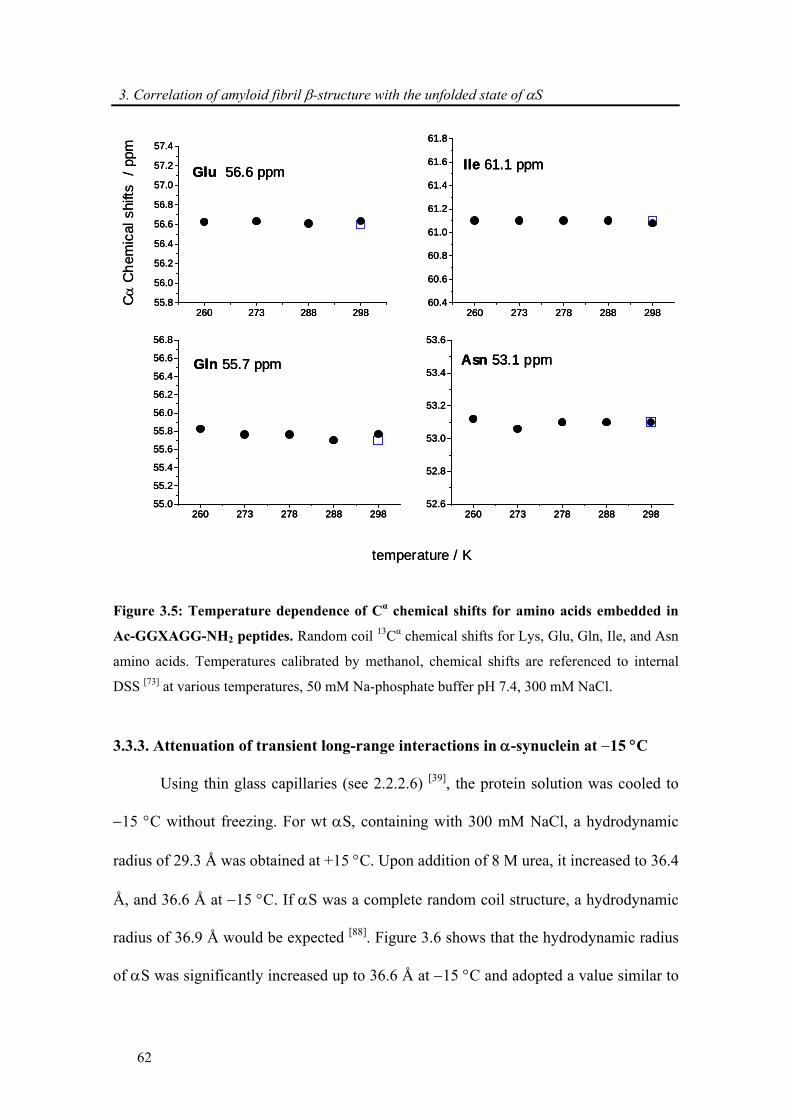
3. Correlation of amyloid fibril β-structure with the unfolded state of αS
62
260 273 278 288 29860.4
60.6
60.8
61.0
61.2
61.4
61.6
61.8
Ile 61.1 ppm
260 273 278 288 29855.0
55.2
55.4
55.6
55.8
56.0
56.2
56.4
56.6
56.8
Gln 55.7 ppm
260 273 278 288 29852.6
52.8
53.0
53.2
53.4
53.6
Asn 53.1 ppm
260 273 288 29855.8
56.0
56.2
56.4
56.6
56.8
57.0
57.2
57.4
Glu 56.6 ppm
temperature / K
Cα
Che
mic
al s
hifts
/ ppm
260 273 278 288 29860.4
60.6
60.8
61.0
61.2
61.4
61.6
61.8
Ile 61.1 ppm
260 273 278 288 29860.4
60.6
60.8
61.0
61.2
61.4
61.6
61.8
Ile 61.1 ppm
260 273 278 288 29855.0
55.2
55.4
55.6
55.8
56.0
56.2
56.4
56.6
56.8
Gln 55.7 ppm
260 273 278 288 29855.0
55.2
55.4
55.6
55.8
56.0
56.2
56.4
56.6
56.8
Gln 55.7 ppm
260 273 278 288 29852.6
52.8
53.0
53.2
53.4
53.6
Asn 53.1 ppm
260 273 278 288 29852.6
52.8
53.0
53.2
53.4
53.6
Asn 53.1 ppm
260 273 288 29855.8
56.0
56.2
56.4
56.6
56.8
57.0
57.2
57.4
Glu 56.6 ppm
260 273 288 29855.8
56.0
56.2
56.4
56.6
56.8
57.0
57.2
57.4
Glu 56.6 ppm
temperature / K
Cα
Che
mic
al s
hifts
/ ppm
Figure 3.5: Temperature dependence of Cα chemical shifts for amino acids embedded in
Ac-GGXAGG-NH2 peptides. Random coil 13Cα chemical shifts for Lys, Glu, Gln, Ile, and Asn
amino acids. Temperatures calibrated by methanol, chemical shifts are referenced to internal
DSS [73] at various temperatures, 50 mM Na-phosphate buffer pH 7.4, 300 mM NaCl.
3.3.3. Attenuation of transient long-range interactions in α-synuclein at −15 °C
Using thin glass capillaries (see 2.2.2.6) [39], the protein solution was cooled to
−15 °C without freezing. For wt αS, containing with 300 mM NaCl, a hydrodynamic
radius of 29.3 Å was obtained at +15 °C. Upon addition of 8 M urea, it increased to 36.4
Å, and 36.6 Å at −15 °C. If αS was a complete random coil structure, a hydrodynamic
radius of 36.9 Å would be expected [88]. Figure 3.6 shows that the hydrodynamic radius
of αS was significantly increased up to 36.6 Å at −15 °C and adopted a value similar to
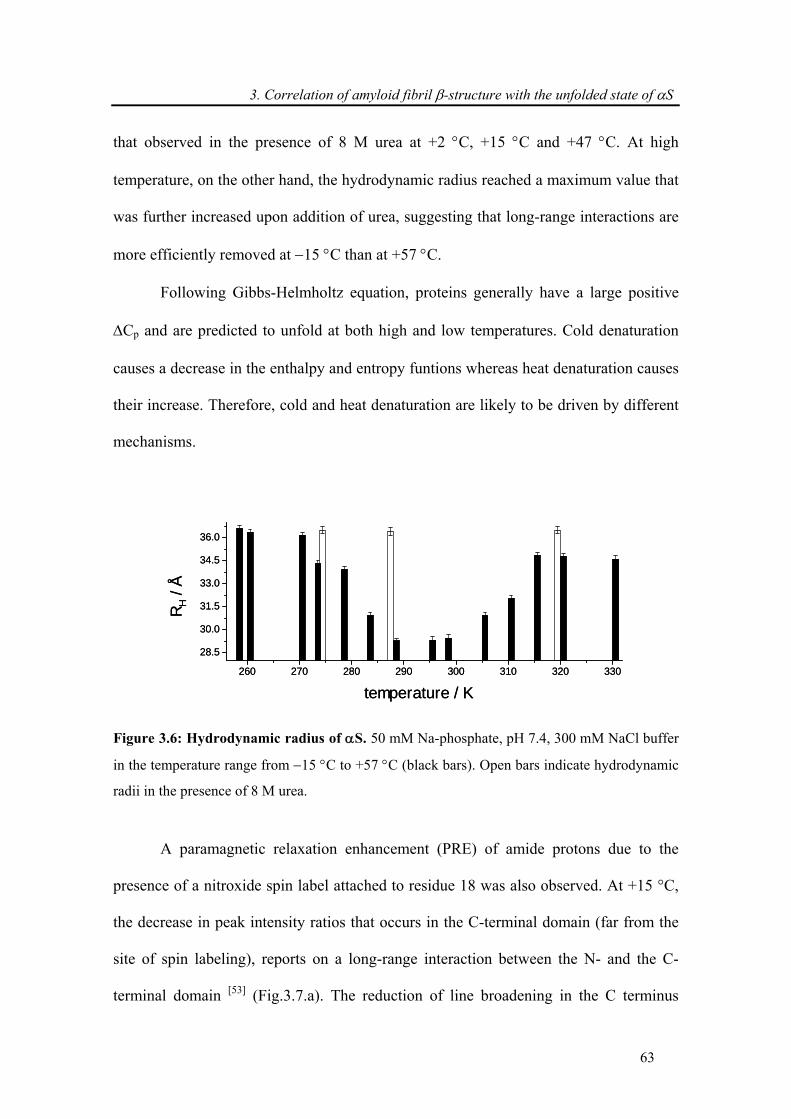
3. Correlation of amyloid fibril β-structure with the unfolded state of αS
63
that observed in the presence of 8 M urea at +2 °C, +15 °C and +47 °C. At high
temperature, on the other hand, the hydrodynamic radius reached a maximum value that
was further increased upon addition of urea, suggesting that long-range interactions are
more efficiently removed at −15 °C than at +57 °C.
Following Gibbs-Helmholtz equation, proteins generally have a large positive
ΔCp and are predicted to unfold at both high and low temperatures. Cold denaturation
causes a decrease in the enthalpy and entropy funtions whereas heat denaturation causes
their increase. Therefore, cold and heat denaturation are likely to be driven by different
mechanisms.
R H/ Å
temperature / K260 270 280 290 300 310 320 330
28.5
30.0
31.5
33.0
34.5
36.0
R H
/ Å
temperature / K260 270 280 290 300 310 320 330
28.5
30.0
31.5
33.0
34.5
36.0
Figure 3.6: Hydrodynamic radius of αS. 50 mM Na-phosphate, pH 7.4, 300 mM NaCl buffer
in the temperature range from −15 °C to +57 °C (black bars). Open bars indicate hydrodynamic
radii in the presence of 8 M urea.
A paramagnetic relaxation enhancement (PRE) of amide protons due to the
presence of a nitroxide spin label attached to residue 18 was also observed. At +15 °C,
the decrease in peak intensity ratios that occurs in the C-terminal domain (far from the
site of spin labeling), reports on a long-range interaction between the N- and the C-
terminal domain [53] (Fig.3.7.a). The reduction of line broadening in the C terminus
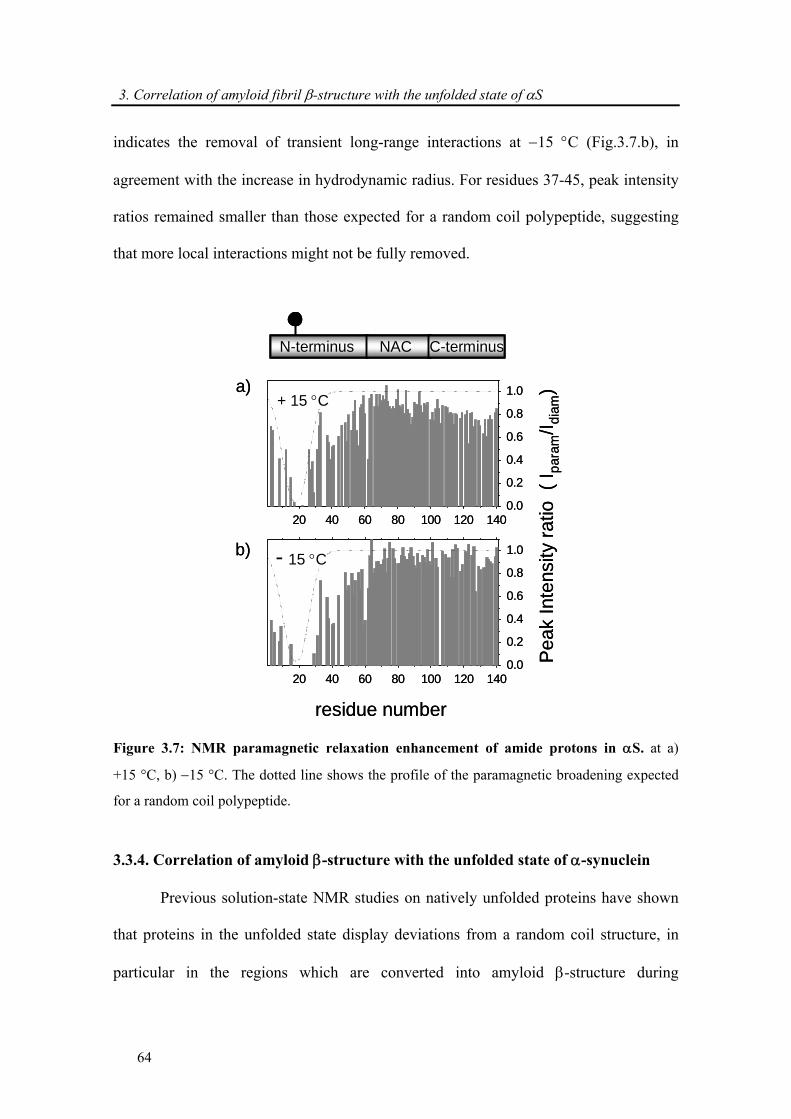
3. Correlation of amyloid fibril β-structure with the unfolded state of αS
64
indicates the removal of transient long-range interactions at −15 °C (Fig.3.7.b), in
agreement with the increase in hydrodynamic radius. For residues 37-45, peak intensity
ratios remained smaller than those expected for a random coil polypeptide, suggesting
that more local interactions might not be fully removed.
20 40 60 80 100 120 1400.0
0.2
0.4
0.6
0.8
1.0
20 40 60 80 100 120 1400.0
0.2
0.4
0.6
0.8
1.0
N-terminus C-terminusNAC
residue number
Peak
Inte
nsity
ratio
( I p
aram
/I dia
m)a)
b)
+ 15 °C
- 15 °C
20 40 60 80 100 120 1400.0
0.2
0.4
0.6
0.8
1.0
20 40 60 80 100 120 1400.0
0.2
0.4
0.6
0.8
1.0
N-terminus C-terminusNACN-terminus C-terminusNAC
residue number
Peak
Inte
nsity
ratio
( I p
aram
/I dia
m)a)
b)
+ 15 °C
- 15 °C
Figure 3.7: NMR paramagnetic relaxation enhancement of amide protons in αS. at a)
+15 °C, b) −15 °C. The dotted line shows the profile of the paramagnetic broadening expected
for a random coil polypeptide.
3.3.4. Correlation of amyloid β-structure with the unfolded state of α-synuclein
Previous solution-state NMR studies on natively unfolded proteins have shown
that proteins in the unfolded state display deviations from a random coil structure, in
particular in the regions which are converted into amyloid β-structure during
3. Correlation of amyloid fibril β-structure with the unfolded state of αS
65
aggregation [89-92]. However, for regions in which negative secondary chemical shifts
identify nascent β-structure in solution, strong negative secondary chemical shifts were
observed in αS fibrils. A detailed comparison of the conformational properties of the
fibrillar and unfolded state was not possible so far due to a lack of high-resolution
structural information for amyloid fibrils.
As shown in Figure 3.8, the secondary chemical shifts in the unfolded state of aS
are compared to the recent observation made by solid-state NMR in amyloid fibrils of
αS [93], and the values detected in solution at −15 °C. Clearly, the secondary chemical
shifts in the monomeric state at −15 °C in solution are smaller than those observed in
amyloid fibrils. For residues 1-38, the sign of secondary NMR chemical shifts was
alternating, indicating the absence of a propensity for either helical or β-structure.
Residues 38-98, which form the core of amyloid fibrils, as well as the acidic C-terminal
domain showed predominantly negative secondary chemical shifts. While negative
secondary chemical shifts are characteristic of either β-structure or poly-proline helix-
like conformations, large 3JHNHα scalar couplings are only found in extended β-
structure. In the C-terminal domain of αS, 3JHNHα were mostly below average in
agreement with the presence of several proline residues. Only for residues 38-98,
negative secondary chemical shifts and above average 3JHNHα couplings were observed
suggesting that the central domain of αS transiently populates the β-region in the
Ramachandran plot. In addition, residues L38, H50, E61, T81 and E83, which had
positive or only slightly negative secondary chemical shifts in αS fibrils indicating the
ends of β-strands, showed positive values in the unfolded state.
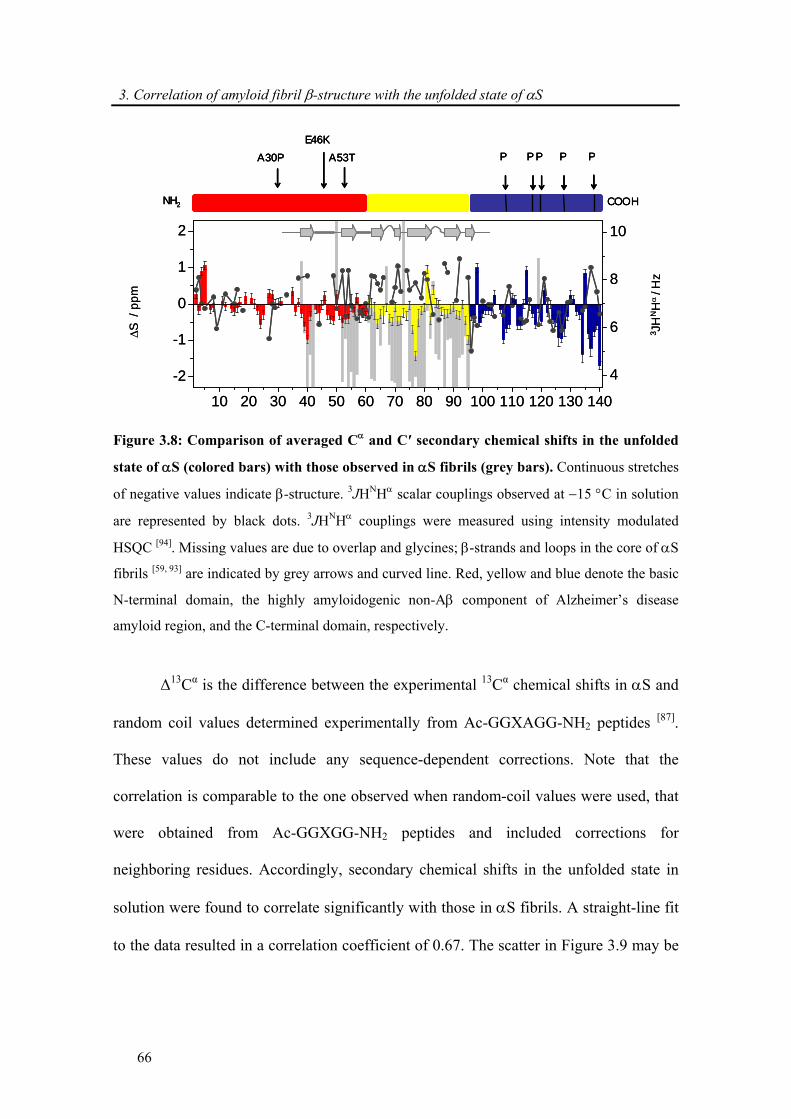
3. Correlation of amyloid fibril β-structure with the unfolded state of αS
66
10 20 30 40 50 60 70 80 90 100 110 120 130 140
-2
-1
0
1
2
4
6
8
10
ΔS /
ppm
3 JH
NH
α/ H
z
COOH
A53T
NH2
A30PE46K
P PPPP
10 20 30 40 50 60 70 80 90 100 110 120 130 140
-2
-1
0
1
2
4
6
8
10
ΔS /
ppm
3 JH
NH
α/ H
z
COOH
A53T
NH2
A30PE46K
P PPPP
COOH
A53T
NH2
A30PE46K
P PPPP
Figure 3.8: Comparison of averaged Cα and C′ secondary chemical shifts in the unfolded
state of αS (colored bars) with those observed in αS fibrils (grey bars). Continuous stretches
of negative values indicate β-structure. 3JHNHα scalar couplings observed at −15 °C in solution
are represented by black dots. 3JHNHα couplings were measured using intensity modulated
HSQC [94]. Missing values are due to overlap and glycines; β-strands and loops in the core of αS
fibrils [59, 93] are indicated by grey arrows and curved line. Red, yellow and blue denote the basic
N-terminal domain, the highly amyloidogenic non-Aβ component of Alzheimer’s disease
amyloid region, and the C-terminal domain, respectively.
Δ13Cα is the difference between the experimental 13Cα chemical shifts in αS and
random coil values determined experimentally from Ac-GGXAGG-NH2 peptides [87].
These values do not include any sequence-dependent corrections. Note that the
correlation is comparable to the one observed when random-coil values were used, that
were obtained from Ac-GGXGG-NH2 peptides and included corrections for
neighboring residues. Accordingly, secondary chemical shifts in the unfolded state in
solution were found to correlate significantly with those in αS fibrils. A straight-line fit
to the data resulted in a correlation coefficient of 0.67. The scatter in Figure 3.9 may be
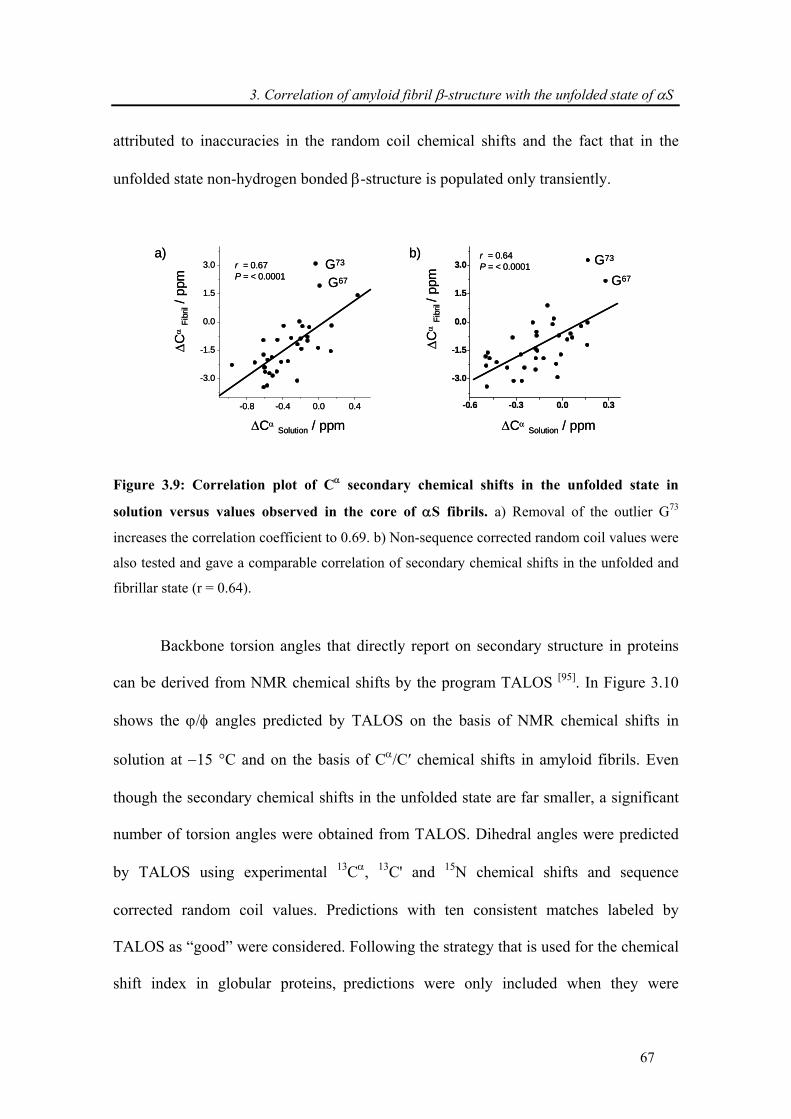
3. Correlation of amyloid fibril β-structure with the unfolded state of αS
67
attributed to inaccuracies in the random coil chemical shifts and the fact that in the
unfolded state non-hydrogen bonded β-structure is populated only transiently. Δ
Cα
Fibr
il/ p
pm
ΔCαSolution / ppm
G73
G67
ΔCα
Fibr
il / p
pmΔCα
Solution / ppm-0.6 -0.3 0.0 0.3
-3.0
-1.5
0.0
1.5
3.0
r = 0.64P = < 0.0001
-0.8 -0.4 0.0 0.4
-3.0
-1.5
0.0
1.5
3.0 r = 0.67P = < 0.0001
G73
G67
a) b)
ΔC
αFi
bril/ p
pm
ΔCαSolution / ppm
G73
G67
ΔCα
Fibr
il / p
pmΔCα
Solution / ppm-0.6 -0.3 0.0 0.3
-3.0
-1.5
0.0
1.5
3.0
r = 0.64P = < 0.0001
-0.8 -0.4 0.0 0.4
-3.0
-1.5
0.0
1.5
3.0 r = 0.67P = < 0.0001
G73
G67
a) b)
Figure 3.9: Correlation plot of Cα secondary chemical shifts in the unfolded state in
solution versus values observed in the core of αS fibrils. a) Removal of the outlier G73
increases the correlation coefficient to 0.69. b) Non-sequence corrected random coil values were
also tested and gave a comparable correlation of secondary chemical shifts in the unfolded and
fibrillar state (r = 0.64).
Backbone torsion angles that directly report on secondary structure in proteins
can be derived from NMR chemical shifts by the program TALOS [95]. In Figure 3.10
shows the ϕ/φ angles predicted by TALOS on the basis of NMR chemical shifts in
solution at −15 °C and on the basis of Cα/C′ chemical shifts in amyloid fibrils. Even
though the secondary chemical shifts in the unfolded state are far smaller, a significant
number of torsion angles were obtained from TALOS. Dihedral angles were predicted
by TALOS using experimental 13Cα, 13C' and 15N chemical shifts and sequence
corrected random coil values. Predictions with ten consistent matches labeled by
TALOS as “good” were considered. Following the strategy that is used for the chemical
shift index in globular proteins, predictions were only included when they were
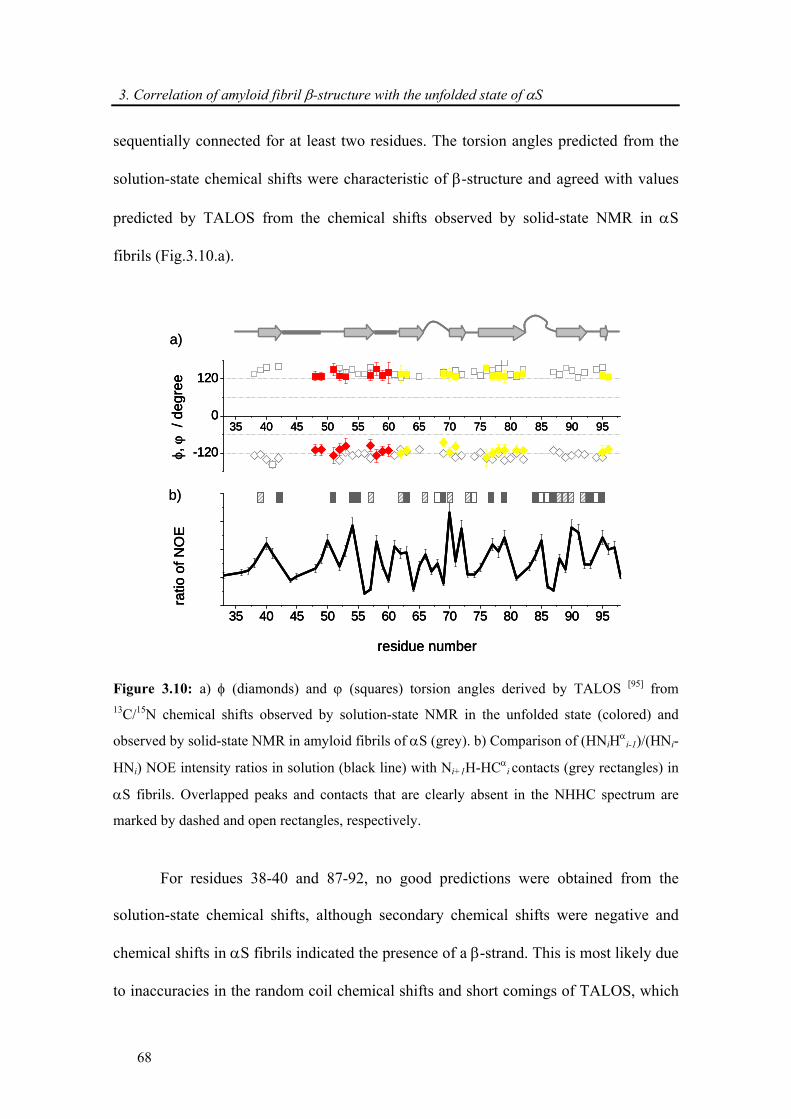
3. Correlation of amyloid fibril β-structure with the unfolded state of αS
68
sequentially connected for at least two residues. The torsion angles predicted from the
solution-state chemical shifts were characteristic of β-structure and agreed with values
predicted by TALOS from the chemical shifts observed by solid-state NMR in αS
fibrils (Fig.3.10.a).
35 40 45 50 55 60 65 70 75 80 85 90 95
-120
0
120
35 40 45 50 55 60 65 70 75 80 85 90 95
residue number
ratio
of N
OE
φ, ϕ
/ deg
ree
a)
b)
35 40 45 50 55 60 65 70 75 80 85 90 95
-120
0
120
35 40 45 50 55 60 65 70 75 80 85 90 95
residue number
ratio
of N
OE
φ, ϕ
/ deg
ree
35 40 45 50 55 60 65 70 75 80 85 90 95
-120
0
120
35 40 45 50 55 60 65 70 75 80 85 90 95
residue number
ratio
of N
OE
φ, ϕ
/ deg
ree
a)
b)
Figure 3.10: a) φ (diamonds) and ϕ (squares) torsion angles derived by TALOS [95] from 13C/15N chemical shifts observed by solution-state NMR in the unfolded state (colored) and
observed by solid-state NMR in amyloid fibrils of αS (grey). b) Comparison of (HNiHαi-1)/(HNi-
HNi) NOE intensity ratios in solution (black line) with Ni+1H-HCαi contacts (grey rectangles) in
αS fibrils. Overlapped peaks and contacts that are clearly absent in the NHHC spectrum are
marked by dashed and open rectangles, respectively.
For residues 38-40 and 87-92, no good predictions were obtained from the
solution-state chemical shifts, although secondary chemical shifts were negative and
chemical shifts in αS fibrils indicated the presence of a β-strand. This is most likely due
to inaccuracies in the random coil chemical shifts and short comings of TALOS, which
3. Correlation of amyloid fibril β-structure with the unfolded state of αS
69
on average can predict dihedral angles for 65 % of residues in globular proteins with an
error rate of 3 % [95]. On the other hand, β-structure was predicted for residues 48, 49,
51 and 58-60 on the basis of solution-state chemical shifts, whereas no information is
available for these residues in amyloid fibrils due to missing resonance.
Further support for the presence of amyloid seed structure in the unfolded state
of αS was obtained by comparison of HNi-Hα
i-1 nuclear Overhauser effect (NOE)
intensities in solution with Ni+1H-HCαi contacts in the amyloid fibril. NOEs were
extracted from a 3D 15N-1H NOESY-HSQC (mixing time = 50 ms). Solid-state NMR
experiments on amyloid fibrils of αS have been reported previously [93]. Ni+1H-HCαi
contacts indicated in Figure 3.10.b) were extracted from a NHHC correlation
experiment with a (1H, 1H) mixing time of 80 µs, bracketed by short 1H, X CP transfers
for contact times of 90 μs (X = 13C) and 200 μs (X = 15N). The highest normalized NOE
intensities between the amide proton of a residue and the Hα atom of the previous
residue were detected in the NAC region (Fig.3.10.b). Many residues in the NAC region
also showed Ni+1H-HCαi cross-peaks in a two-dimensional NHHC correlation
experiment performed on αS fibrils under magic angle spinning conditions [96, 97].
Strong HNi-Hα
i-1 NOEs in solution and Ni+1H-HCαi cross-peaks in the solid phase
indicate the presence of β-structure (Fig.3.10.b).
3.4. Conclusion
In summary, the secondary structure of amyloid fibrils is directly encoded in the
unfolded, monomeric state of misfolding proteins (Fig.3.11). This supports the idea that
amyloid fibrils represent a general conformational state of a polypeptide chain, which
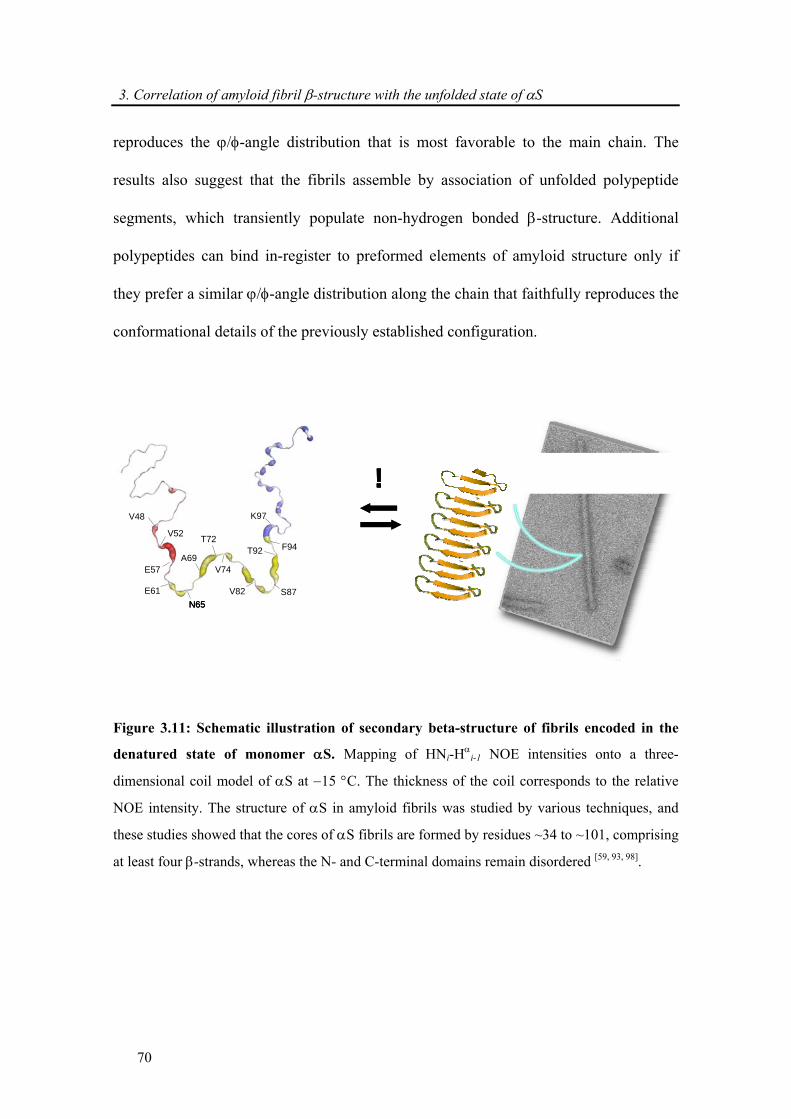
3. Correlation of amyloid fibril β-structure with the unfolded state of αS
70
reproduces the ϕ/φ-angle distribution that is most favorable to the main chain. The
results also suggest that the fibrils assemble by association of unfolded polypeptide
segments, which transiently populate non-hydrogen bonded β-structure. Additional
polypeptides can bind in-register to preformed elements of amyloid structure only if
they prefer a similar ϕ/φ-angle distribution along the chain that faithfully reproduces the
conformational details of the previously established configuration.
!
E61
A69V74
T72
V82 S87
T92
K97
F94
E57
V52
V48
N65
!
E61
A69V74
T72
V82 S87
T92
K97
F94
E57
V52
V48
N65E61
A69V74
T72
V82 S87
T92
K97
F94
E57
V52
V48
N65
Figure 3.11: Schematic illustration of secondary beta-structure of fibrils encoded in the
denatured state of monomer αS. Mapping of HNi-Hαi-1 NOE intensities onto a three-
dimensional coil model of αS at −15 °C. The thickness of the coil corresponds to the relative
NOE intensity. The structure of αS in amyloid fibrils was studied by various techniques, and
these studies showed that the cores of αS fibrils are formed by residues ~34 to ~101, comprising
at least four β-strands, whereas the N- and C-terminal domains remain disordered [59, 93, 98].
4. αS amyloid fibrils dissociation
71
4. Dissociation of amyloid fibrils of α-synuclein in
supercooled water.
4.1. Introduction
Amyloid fibrils have a β-sheet rich molecular architecture called cross-β structure [99].
The β-sheet conformation imparts extremely high thermodynamic stability and
remarkable physical properties to amyloid fibrils [100]. They are highly resistant to
hydrostatic pressure and high temperature, while protofibrils and earlier aggregates are
more sensitive to these extreme conditions [101, 102]. The stability of mature amyloid
fibrils exceeds that of globular proteins, suggesting that they may represent the global
minimum in free energy. In addition, they have strength comparable to that of steel [103].
Nature exploits these unusual properties of amyloidgenic structures for a variety of
physiological functions [104]. Moreover, fibrillar peptide structures might have great
potential as structural or structuring elements in nanotechnology applications [105].
The native state of proteins can be unfolded both by high temperature and by
cooling. Cold denaturation is predicted by the Gibbs-Helmholtz equation and attributed
to specific interactions of protein nonpolar groups with water; tightly packed structures
unfold at sufficiently low temperature exposing internal nonpolar groups to water [36].
Direct observation of cold denaturation is generally hard to achieve in the absence of
denaturant, extreme pH or mutations, as for most proteins the transition temperature is
well below 0 °C. Freezing, however, can be avoided to temperatures as low as −20 °C
with careful supercooling of small sample volumes [39, 106]. Nevertheless, this is
generally not sufficiently cold to induce denaturation in stable, native proteins [36, 39]. In
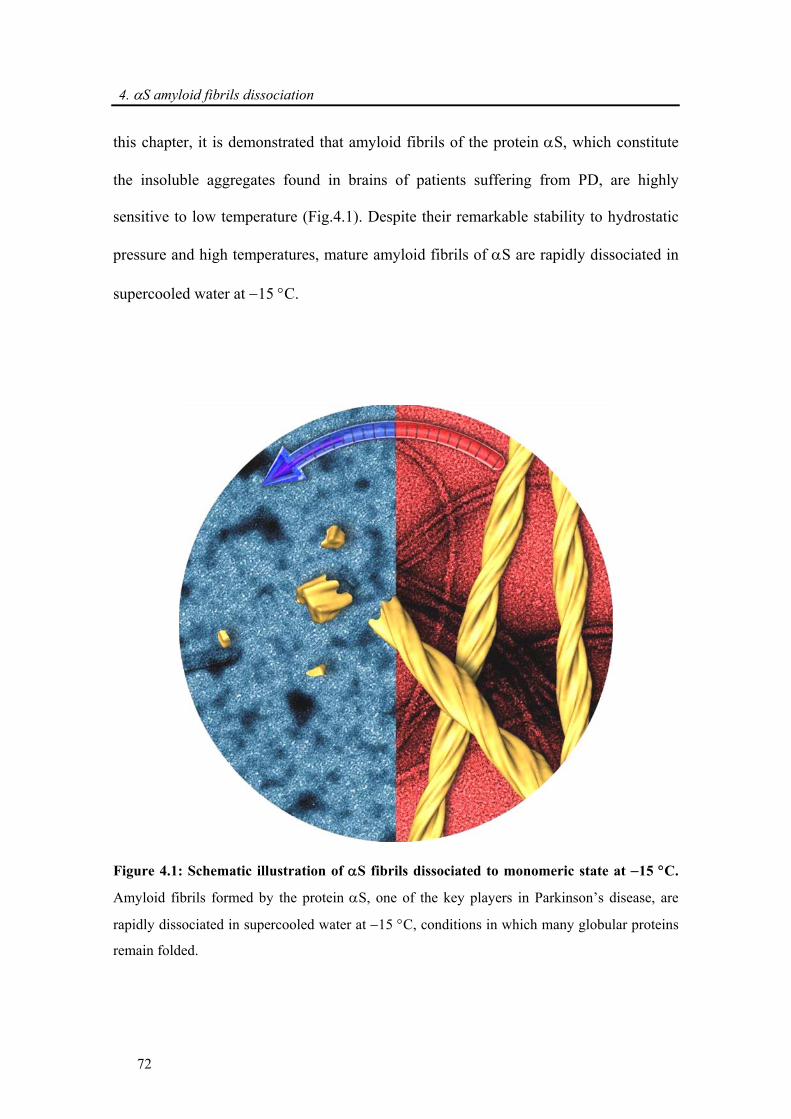
4. αS amyloid fibrils dissociation
72
this chapter, it is demonstrated that amyloid fibrils of the protein αS, which constitute
the insoluble aggregates found in brains of patients suffering from PD, are highly
sensitive to low temperature (Fig.4.1). Despite their remarkable stability to hydrostatic
pressure and high temperatures, mature amyloid fibrils of αS are rapidly dissociated in
supercooled water at −15 °C.
Figure 4.1: Schematic illustration of αS fibrils dissociated to monomeric state at −15 °C.
Amyloid fibrils formed by the protein αS, one of the key players in Parkinson’s disease, are
rapidly dissociated in supercooled water at −15 °C, conditions in which many globular proteins
remain folded.
4. αS amyloid fibrils dissociation
73
4.2. Experimental procedure
Sample preparation for fibrillization and dissociation of αS fibrils: Recombinant αS
was expressed and purified as described in 2.2.2.1. 15N-labeled αS amyloid fibrils were
prepared by incubating 100 μM freshly prepared 15N-labeled αS in a solution of 20 mM
Tris and 100 mM NaCl at pH 7.4 in the presence of 0.01 %sodium azide in glass vials.
Incubation was carried out under continuous stirring with a micro-sized stir bar at 37 °C
until a steady state was reached according to a stained ThT fluorescence assay (see
2.2.2.7). Matured fibrils were centrifuged at 215,000 x g with a TL 100 ultracentrifuge
(Beckman Coulter). For measurements in supercooled water at −15 °C, monomeric αS
(0.1 mm protein concentration) and fibrillar αS were suspended in 50 mM phosphate
buffer (pH 7.4) and 300 mM NaCl, and injected into glass capillaries of 1.0 mm outer
diameter (see 2.2.2.6). Prior to insertion of the sample into the NMR spectrometer, the
temperature was set to −15 °C.
Preparation of spin-labeled αS: A single cysteine residue was introduced into αS at
position 18 (A18C) and 140 (A140C) as described in 2.2.1.2.
NMR spectroscopy: NMR experiments were recorded on Bruker Avance 600 and 700
MHz NMR spectrometers. Dissociation of amyloid fibrils was followed by recording a
series of 1D 1H and 2D 1H-15N HSQC spectra. Pulse field gradient NMR experiments
were measured for the determination of the hydrodynamic radius (see 1.4.4 and 2.3.3.3).
The 15N T1ρ values were obtained by collecting five 2D spectra (see 2.2.3.4), and by
collecting two 1D spectra using a delay of 2 and 100 ms for denatured fibrils. An on-
resonance spin-lock pulse of 2.5 kHz was used. PRE profiles were derived from the
4. αS amyloid fibrils dissociation
74
measurement of the ratios of the peak intensity between two 2D HSQC spectra in the
presence (Ipara) and absence (Idia) of the nitroxide radical (see 1.4.3 and 2.2.3.2).
Transmission electron micrographs (TEM): Amyloid fibrils, resuspended from the
pellet, were prepared on a glow-discharged carbon foil and stained with 1 % uranyl
acetate (see 2.2.4.4).
Circular dichroism (CD): The average secondary structure of monomeric aS, fibrils and
dissociated fibrils was determined as described in 2.2.4.3.
Immunoblotting (dot blotting): Amyloid fibrils, oligomers and wt αS were spotted onto
nitrocellulose membrane as described in 2.2.2.8.
Lipid bilayer experiments: Lipid bilayer membranes were performed as described in
2.2.2.9.
4.3. Results and discussion
4.3.1. Dissociation of α-synuclein fibrils in supercooled water
After aggregation, TEM showed regular fibrils with a diameter of ~40 nm
(Fig.4.2.a, right panel) and a strong ThT fluorescence signal was detected (Fig.4.3.b).
2D 1H-15N HSQC spectra showed no visible cross peaks in agreement with the large
molecular weight of amyloid fibrils that makes it beyond detection limit in solution-sate
NMR (Fig.4.2.a, left panel). To probe the stability of αS fibrils at the temperature below
0 °C, we employed supercooled water. 15N-labeled αS fibrils were injected into glass
capillaries as described above (see 2.2.2.6).
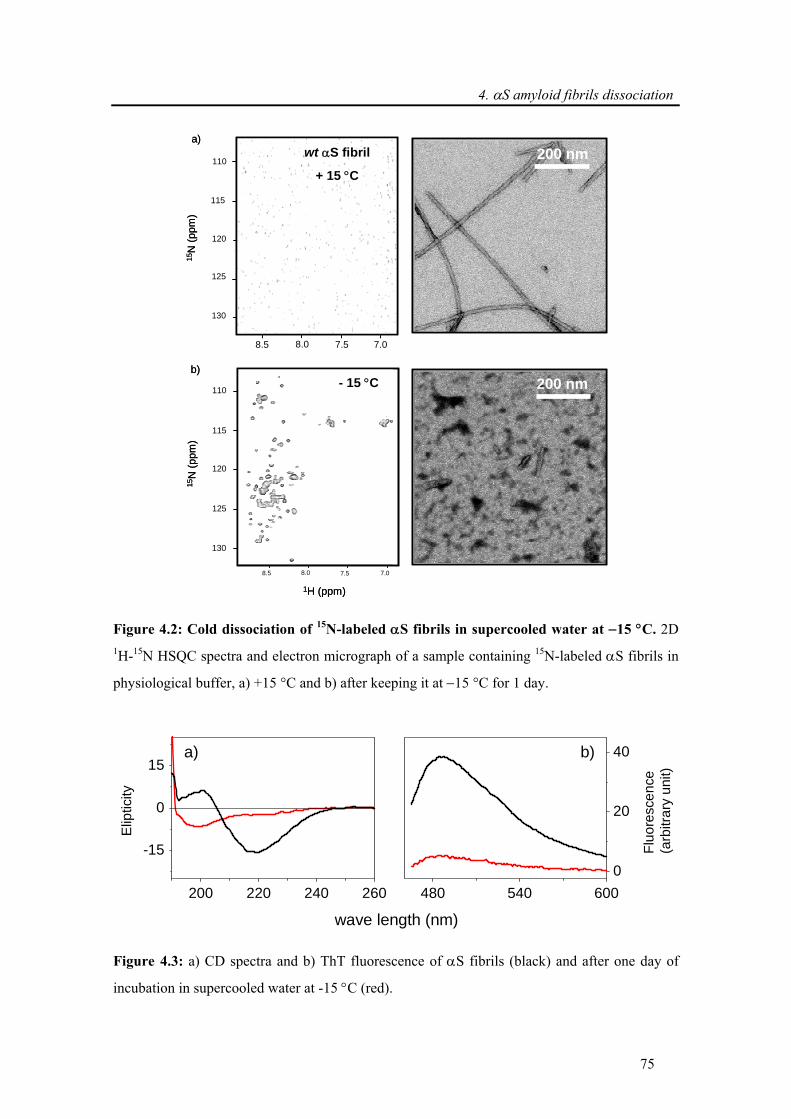
4. αS amyloid fibrils dissociation
75
1H (ppm)
130
125
120
115
110
8.5 8.0 7.5 7.0
- 15 °C
15N
(ppm
)
b)
15N
(ppm
)
130
125
120
115
110
8.5 8.0 7.5 7.0
wt αS fibril
+ 15 °C
a)
200 nm
200 nm
1H (ppm)
130
125
120
115
110
8.5 8.0 7.5 7.0
- 15 °C
15N
(ppm
)
b)
15N
(ppm
)
130
125
120
115
110
8.5 8.0 7.5 7.0
wt αS fibril
+ 15 °C
a)
200 nm
200 nm
Figure 4.2: Cold dissociation of 15N-labeled αS fibrils in supercooled water at −15 °C. 2D 1H-15N HSQC spectra and electron micrograph of a sample containing 15N-labeled αS fibrils in
physiological buffer, a) +15 °C and b) after keeping it at −15 °C for 1 day.
200 220 240 260
-15
0
15
480 540 6000
20
40
Elip
ticity
a)
Fluo
resc
ence
(a
rbitr
ary
unit)
b)
wave length (nm)
Figure 4.3: a) CD spectra and b) ThT fluorescence of αS fibrils (black) and after one day of
incubation in supercooled water at -15 °C (red).
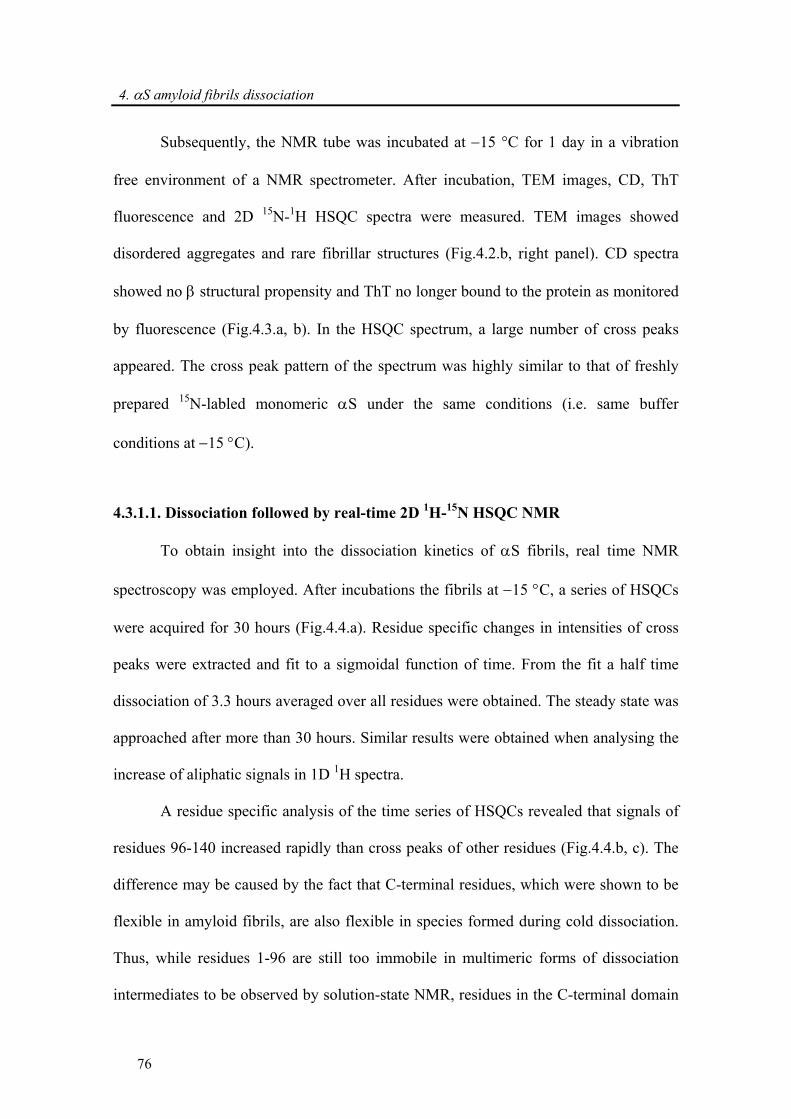
4. αS amyloid fibrils dissociation
76
Subsequently, the NMR tube was incubated at −15 °C for 1 day in a vibration
free environment of a NMR spectrometer. After incubation, TEM images, CD, ThT
fluorescence and 2D 15N-1H HSQC spectra were measured. TEM images showed
disordered aggregates and rare fibrillar structures (Fig.4.2.b, right panel). CD spectra
showed no β structural propensity and ThT no longer bound to the protein as monitored
by fluorescence (Fig.4.3.a, b). In the HSQC spectrum, a large number of cross peaks
appeared. The cross peak pattern of the spectrum was highly similar to that of freshly
prepared 15N-labled monomeric αS under the same conditions (i.e. same buffer
conditions at −15 °C).
4.3.1.1. Dissociation followed by real-time 2D 1H-15N HSQC NMR
To obtain insight into the dissociation kinetics of αS fibrils, real time NMR
spectroscopy was employed. After incubations the fibrils at −15 °C, a series of HSQCs
were acquired for 30 hours (Fig.4.4.a). Residue specific changes in intensities of cross
peaks were extracted and fit to a sigmoidal function of time. From the fit a half time
dissociation of 3.3 hours averaged over all residues were obtained. The steady state was
approached after more than 30 hours. Similar results were obtained when analysing the
increase of aliphatic signals in 1D 1H spectra.
A residue specific analysis of the time series of HSQCs revealed that signals of
residues 96-140 increased rapidly than cross peaks of other residues (Fig.4.4.b, c). The
difference may be caused by the fact that C-terminal residues, which were shown to be
flexible in amyloid fibrils, are also flexible in species formed during cold dissociation.
Thus, while residues 1-96 are still too immobile in multimeric forms of dissociation
intermediates to be observed by solution-state NMR, residues in the C-terminal domain
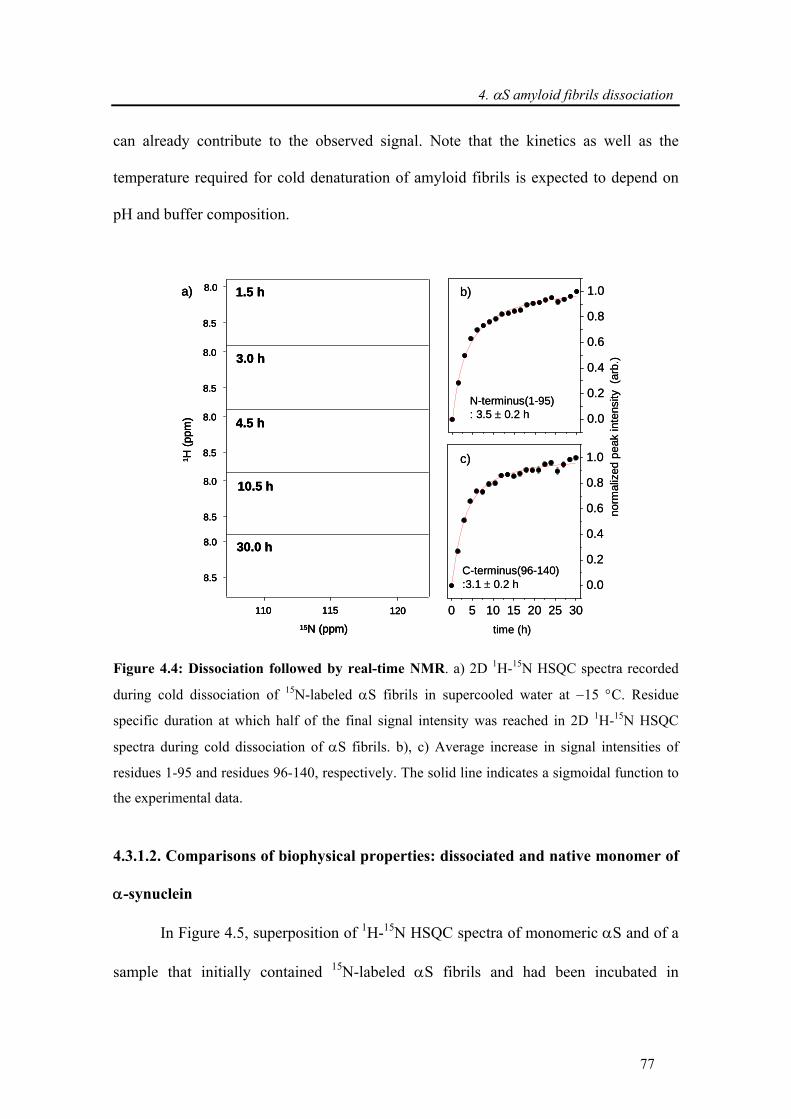
4. αS amyloid fibrils dissociation
77
can already contribute to the observed signal. Note that the kinetics as well as the
temperature required for cold denaturation of amyloid fibrils is expected to depend on
pH and buffer composition.
0 5 10 15 20 25 30
0.0
0.2
0.4
0.6
0.8
1.0
0.0
0.2
0.4
0.6
0.8
1.0
norm
aliz
ed p
eak
inte
nsity
(ar
b.)
C-terminus(96-140):3.1 ± 0.2 h
time (h)15N (ppm)
1 H (p
pm) 4.5 h
1.5 h
110 115
10.5 h8.0
8.5
8.0
8.5
3.0 h8.0
8.5
8.0
8.5
120
30.0 h8.0
8.5
a)
N-terminus(1-95): 3.5 ± 0.2 h
b)
c)
0 5 10 15 20 25 30
0.0
0.2
0.4
0.6
0.8
1.0
0.0
0.2
0.4
0.6
0.8
1.0
norm
aliz
ed p
eak
inte
nsity
(ar
b.)
C-terminus(96-140):3.1 ± 0.2 h
time (h)15N (ppm)
1 H (p
pm) 4.5 h
1.5 h
110 115
10.5 h8.0
8.5
8.0
8.5
3.0 h8.0
8.5
8.0
8.5
120
30.0 h8.0
8.5
a)
15N (ppm)
1 H (p
pm) 4.5 h
1.5 h
110 115
10.5 h8.0
8.5
8.0
8.5
3.0 h8.0
8.5
8.0
8.5
120
30.0 h8.0
8.5
a)
N-terminus(1-95): 3.5 ± 0.2 h
b)
c)
Figure 4.4: Dissociation followed by real-time NMR. a) 2D 1H-15N HSQC spectra recorded
during cold dissociation of 15N-labeled αS fibrils in supercooled water at −15 °C. Residue
specific duration at which half of the final signal intensity was reached in 2D 1H-15N HSQC
spectra during cold dissociation of αS fibrils. b), c) Average increase in signal intensities of
residues 1-95 and residues 96-140, respectively. The solid line indicates a sigmoidal function to
the experimental data.
4.3.1.2. Comparisons of biophysical properties: dissociated and native monomer of
α-synuclein
In Figure 4.5, superposition of 1H-15N HSQC spectra of monomeric αS and of a
sample that initially contained 15N-labeled αS fibrils and had been incubated in
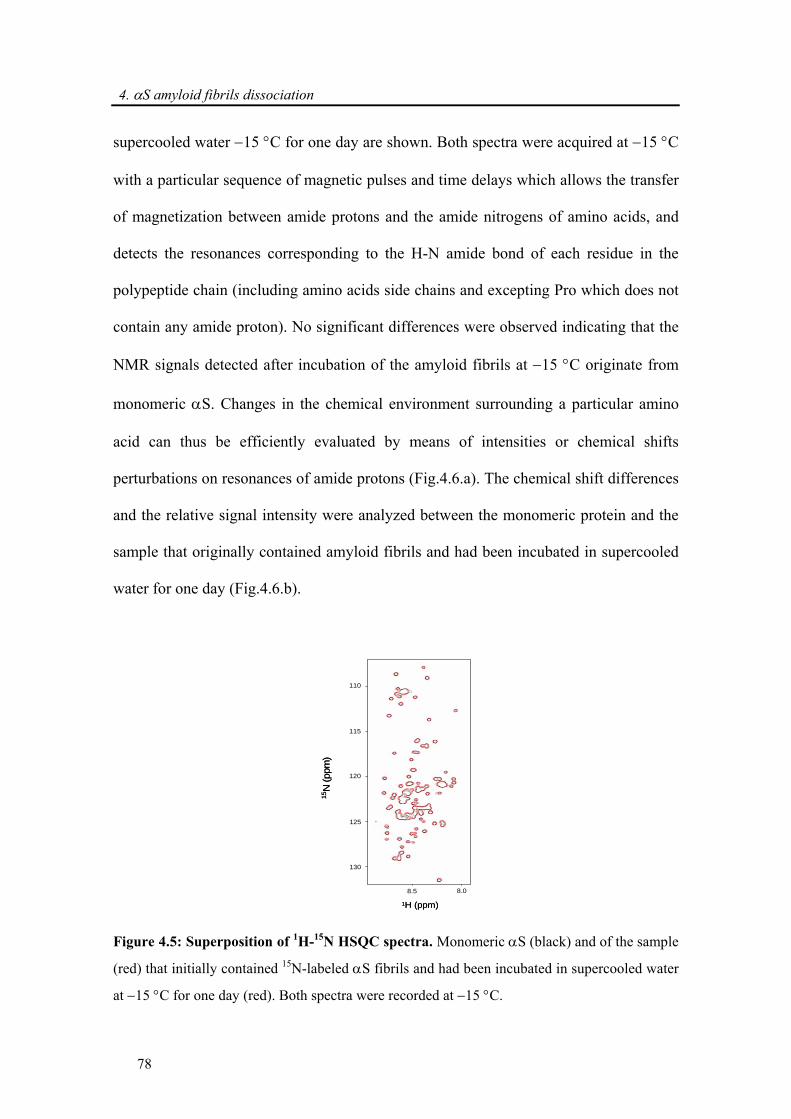
4. αS amyloid fibrils dissociation
78
supercooled water −15 °C for one day are shown. Both spectra were acquired at −15 °C
with a particular sequence of magnetic pulses and time delays which allows the transfer
of magnetization between amide protons and the amide nitrogens of amino acids, and
detects the resonances corresponding to the H-N amide bond of each residue in the
polypeptide chain (including amino acids side chains and excepting Pro which does not
contain any amide proton). No significant differences were observed indicating that the
NMR signals detected after incubation of the amyloid fibrils at −15 °C originate from
monomeric αS. Changes in the chemical environment surrounding a particular amino
acid can thus be efficiently evaluated by means of intensities or chemical shifts
perturbations on resonances of amide protons (Fig.4.6.a). The chemical shift differences
and the relative signal intensity were analyzed between the monomeric protein and the
sample that originally contained amyloid fibrils and had been incubated in supercooled
water for one day (Fig.4.6.b).
1H (ppm)
15N
(ppm
)
130
125
120
115
110
8.5 8.0
1H (ppm)
15N
(ppm
)
130
125
120
115
110
8.5 8.0
Figure 4.5: Superposition of 1H-15N HSQC spectra. Monomeric αS (black) and of the sample
(red) that initially contained 15N-labeled αS fibrils and had been incubated in supercooled water
at −15 °C for one day (red). Both spectra were recorded at −15 °C.
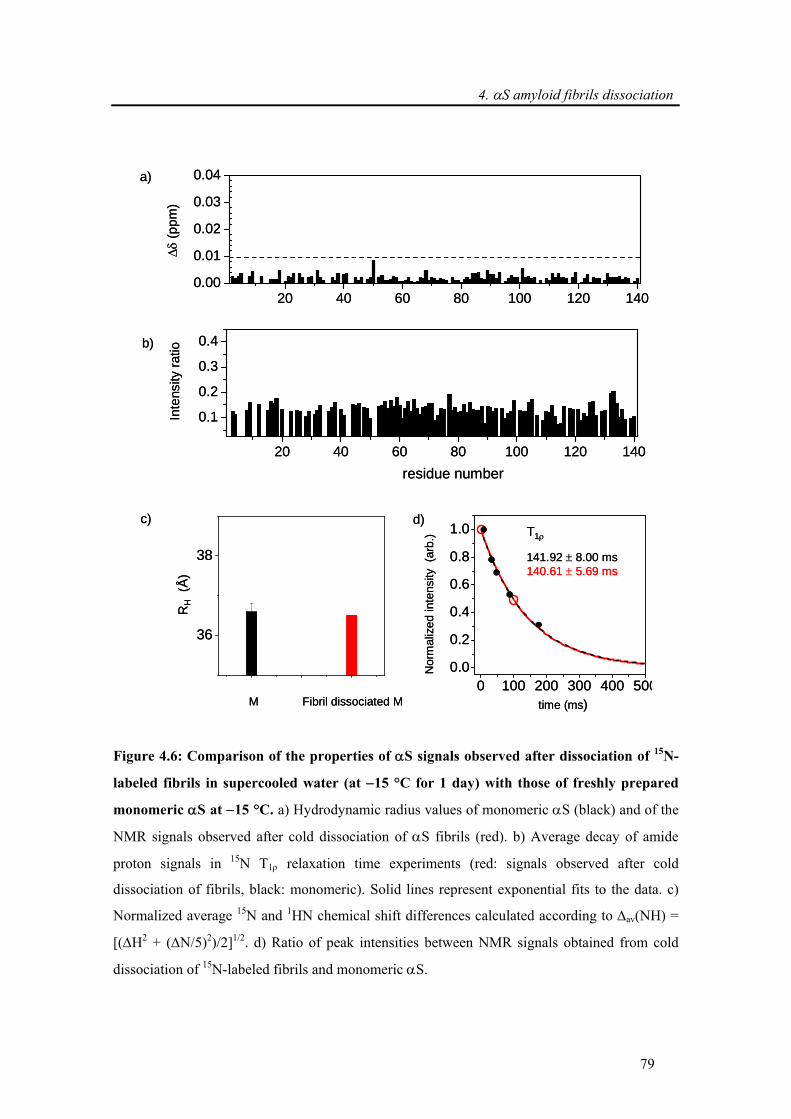
4. αS amyloid fibrils dissociation
79
0 100 200 300 400 5000.0
0.2
0.4
0.6
0.8
1.0
20 40 60 80 100 120 140
0.1
0.2
0.3
0.4
residue number
T1ρ
141.92 ± 8.00 ms140.61 ± 5.69 ms
Δδ(p
pm)
20 40 60 80 100 120 1400.00
0.01
0.02
0.03
0.04a)
b)
c)
RH
(Å)
Inte
nsity
ratio
d)
Nor
mal
ized
inte
nsity
(arb
.)
time (ms)M
36
38
Fibril dissociated M0 100 200 300 400 500
0.0
0.2
0.4
0.6
0.8
1.0
20 40 60 80 100 120 140
0.1
0.2
0.3
0.4
residue number
T1ρ
141.92 ± 8.00 ms140.61 ± 5.69 ms
Δδ(p
pm)
20 40 60 80 100 120 1400.00
0.01
0.02
0.03
0.04a)
b)
c)
RH
(Å)
Inte
nsity
ratio
d)
Nor
mal
ized
inte
nsity
(arb
.)
time (ms)M
36
38
Fibril dissociated M
Figure 4.6: Comparison of the properties of αS signals observed after dissociation of 15N-
labeled fibrils in supercooled water (at −15 °C for 1 day) with those of freshly prepared
monomeric αS at −15 °C. a) Hydrodynamic radius values of monomeric αS (black) and of the
NMR signals observed after cold dissociation of αS fibrils (red). b) Average decay of amide
proton signals in 15N T1ρ relaxation time experiments (red: signals observed after cold
dissociation of fibrils, black: monomeric). Solid lines represent exponential fits to the data. c)
Normalized average 15N and 1HN chemical shift differences calculated according to Δav(NH) =
[(ΔH2 + (ΔN/5)2)/2]1/2. d) Ratio of peak intensities between NMR signals obtained from cold
dissociation of 15N-labeled fibrils and monomeric αS.
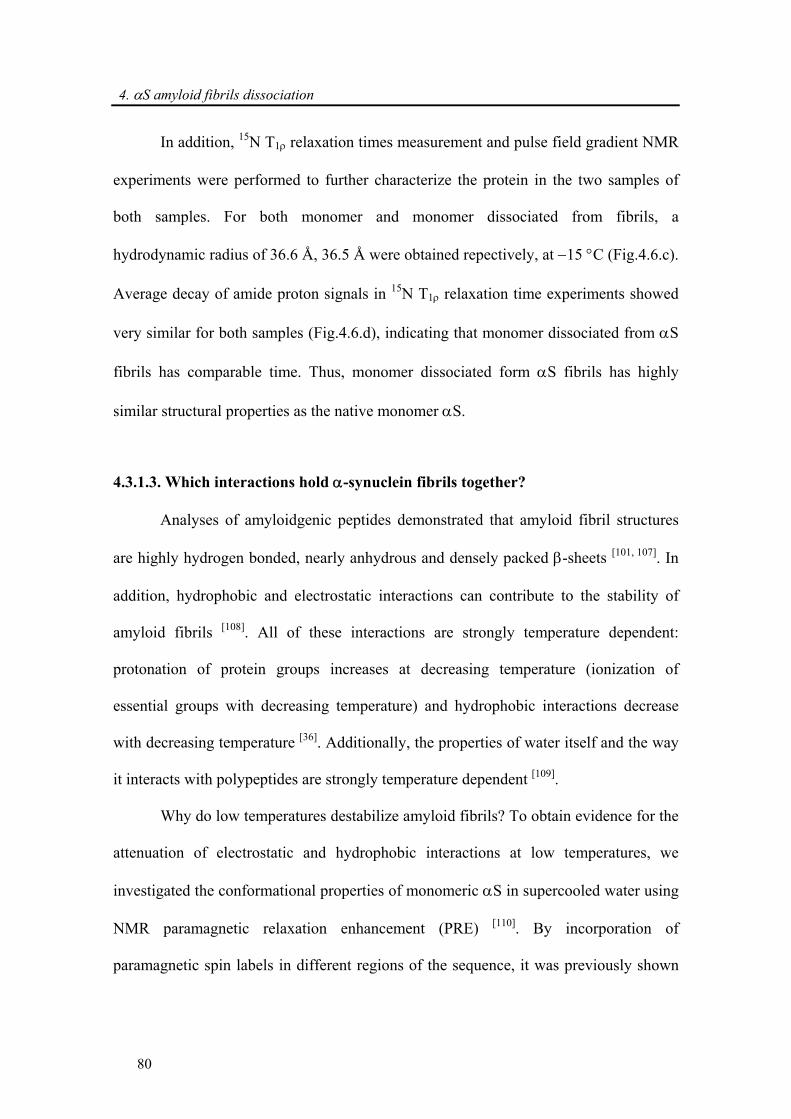
4. αS amyloid fibrils dissociation
80
In addition, 15N T1ρ relaxation times measurement and pulse field gradient NMR
experiments were performed to further characterize the protein in the two samples of
both samples. For both monomer and monomer dissociated from fibrils, a
hydrodynamic radius of 36.6 Å, 36.5 Å were obtained repectively, at −15 °C (Fig.4.6.c).
Average decay of amide proton signals in 15N T1ρ relaxation time experiments showed
very similar for both samples (Fig.4.6.d), indicating that monomer dissociated from αS
fibrils has comparable time. Thus, monomer dissociated form αS fibrils has highly
similar structural properties as the native monomer αS.
4.3.1.3. Which interactions hold α-synuclein fibrils together?
Analyses of amyloidgenic peptides demonstrated that amyloid fibril structures
are highly hydrogen bonded, nearly anhydrous and densely packed β-sheets [101, 107]. In
addition, hydrophobic and electrostatic interactions can contribute to the stability of
amyloid fibrils [108]. All of these interactions are strongly temperature dependent:
protonation of protein groups increases at decreasing temperature (ionization of
essential groups with decreasing temperature) and hydrophobic interactions decrease
with decreasing temperature [36]. Additionally, the properties of water itself and the way
it interacts with polypeptides are strongly temperature dependent [109].
Why do low temperatures destabilize amyloid fibrils? To obtain evidence for the
attenuation of electrostatic and hydrophobic interactions at low temperatures, we
investigated the conformational properties of monomeric αS in supercooled water using
NMR paramagnetic relaxation enhancement (PRE) [110]. By incorporation of
paramagnetic spin labels in different regions of the sequence, it was previously shown
4. αS amyloid fibrils dissociation
81
that the ensemble of conformations populated by monomeric αS at +15 °C is stabilized
by intramolecular long-range interactions [53, 111].
+ 15 °C8M Urea
+ 15 °C0.6M NaCl
20 40 60 80 100 120 1400.0
0.2
0.4
0.6
0.8
1.0
20 40 60 80 100 120 1400.0
0.2
0.4
0.6
0.8
1.0
20 40 60 80 100 120 1400.0
0.2
0.4
0.6
0.8
1.0
residue number
Peak
Inte
nsity
ratio
( I p
aram
/I dia
m)
20 40 60 80 100 120 1400.0
0.2
0.4
0.6
0.8
1.0
20 40 60 80 100 120 1400.0
0.2
0.4
0.6
0.8
1.0
20 40 60 80 100 120 1400.0
0.2
0.4
0.6
0.8
1.0
20 40 60 80 100 120 1400.0
0.2
0.4
0.6
0.8
1.0
a)
b)
c)
+ 15 °C
20 40 60 80 100 120 1400.0
0.2
0.4
0.6
0.8
1.0
d) - 15 °C
N-terminus C-terminusNAC N-terminus C-terminusNAC
+ 15 °C8M Urea
+ 15 °C0.6M NaCl
20 40 60 80 100 120 1400.0
0.2
0.4
0.6
0.8
1.0
20 40 60 80 100 120 1400.0
0.2
0.4
0.6
0.8
1.0
20 40 60 80 100 120 1400.0
0.2
0.4
0.6
0.8
1.0
residue number
Peak
Inte
nsity
ratio
( I p
aram
/I dia
m)
20 40 60 80 100 120 1400.0
0.2
0.4
0.6
0.8
1.0
20 40 60 80 100 120 1400.0
0.2
0.4
0.6
0.8
1.0
20 40 60 80 100 120 1400.0
0.2
0.4
0.6
0.8
1.0
20 40 60 80 100 120 1400.0
0.2
0.4
0.6
0.8
1.0
a)
b)
c)
+ 15 °C
20 40 60 80 100 120 1400.0
0.2
0.4
0.6
0.8
1.0
d) - 15 °C
N-terminus C-terminusNACN-terminus C-terminusNAC N-terminus C-terminusNACN-terminus C-terminusNAC
Figure 4.7: PRE of αS. Intensity ratios (Iparam/Idiam) of cross peaks in 1H-15N HSQC spectra
recorded in the presence (paramagnetic) and the absence (diamagnetic) of the spin label MTSL
attached to position A18C or A140C in buffer at a) +15 °C, b) in the presence of 0.6 M NaCl at
+15 °C, c) upon addition of 8 M urea at +15 °C and d) in buffer at −15 °C. Dotted lines indicate
intensity ratios expected for a fully extended structure.
4. αS amyloid fibrils dissociation
82
In particular, transient long-range interactions exist between the positively
charged N-terminus and the negatively charged C-terminus (Fig.4.7.a, left panel).
Moreover, signal broadening was observed in the hydrophobic central domain between
residues 70-105 when a spin label was attached to residue 140 (Fig.4.7.a, right panel).
Changes in the PRE profile upon addition of 0.6 M NaCl (Fig.4.7.b), addition of 8 M
urea (Fig.4.7.c) and decrease of temperature to −15 °C (Fig.4.7.d) was then studied. In
the presence of 0.6 M NaCl, the spin label at position 18 no longer caused signal
broadening in the C-terminus (Fig.4.7.b, left panel) suggesting that the interaction
between the N- and C-terminal domains is electrostatically driven.
On the other hand, the broadening that was observed for residues 70-105 when
the spin label was attached to residue 140 was not reduced (Fig.4.7.b, right panel). The
opposite effect was observed when 8 M urea was added: the PRE profile observed for
A18C was not changed, whereas signals in the central domain were no longer
broadened (Fig.4.7.c, right panel). This suggests that long-range interactions probed by
the A140C-MTSL protein are mainly related to hydrophobic interactions. At −15 °C,
both long-range broadening effects were removed indicating that hydrophobic and
electrostatic interactions were attenuated (Fig.4.7.d).
To gain insight into the importance of hydrophobic and electrostatic interactions
for the stability of αS fibrils, 15N-labeled fibrils was exposed to 8 M urea and 0.6 M
NaCl. TEM and NMR spectroscopy showed that αS fibrils are fully dissociated into
monomeric protein in 8 M urea (Fig.4.8.a). In 0.6 M NaCl, the morphology of fibrils
was changed as observed by TEM. Fibrils were fragmented and less regular. Also, cross
peaks of some residues (mainly C-terminus, e.g. N122, E137, E139 and A140) appeared
in the HSQC spectrum, indicating that αS fibrils are destabilized by increased ionic
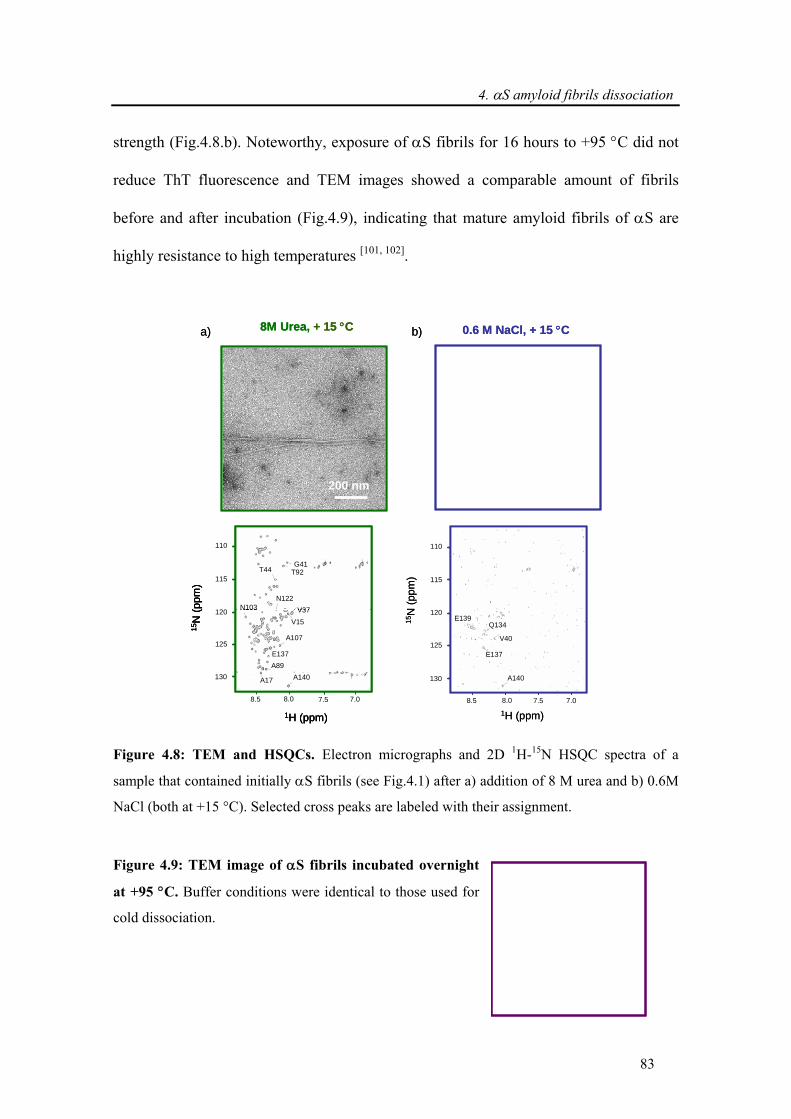
4. αS amyloid fibrils dissociation
83
strength (Fig.4.8.b). Noteworthy, exposure of αS fibrils for 16 hours to +95 °C did not
reduce ThT fluorescence and TEM images showed a comparable amount of fibrils
before and after incubation (Fig.4.9), indicating that mature amyloid fibrils of αS are
highly resistance to high temperatures [101, 102].
130
125
120
115
110
8.5 8.0 7.5 7.0
15N
(ppm
)
A140
E137
E139
V40
Q134
1H (ppm)
130
125
120
115
110
8.5 8.0 7.5 7.0
15N
(ppm
)
A140
E137
A107
N103
A17
A89
V37
T92G41
T44
N122
V15
1H (ppm)
0.6 M NaCl, + 15 °C
200 nm
8M Urea, + 15 °C
200 nm
a) b)
130
125
120
115
110
130
125
120
115
110
8.5 8.0 7.5 7.08.5 8.0 7.5 7.0
15N
(ppm
)
A140
E137
E139
V40
Q134
1H (ppm)
130
125
120
115
110
8.5 8.0 7.5 7.0
15N
(ppm
)
A140
E137
A107
N103
A17
A89
V37
T92G41
T44
N122
V15
1H (ppm)
130
125
120
115
110
130
125
120
115
110
8.5 8.0 7.5 7.08.5 8.0 7.5 7.0
15N
(ppm
)
A140
E137
A107
N103
A17
A89
V37
T92G41
T44
N122
V15
1H (ppm)
0.6 M NaCl, + 15 °C
200 nm
8M Urea, + 15 °C
200 nm
a) b)
Figure 4.8: TEM and HSQCs. Electron micrographs and 2D 1H-15N HSQC spectra of a
sample that contained initially αS fibrils (see Fig.4.1) after a) addition of 8 M urea and b) 0.6M
NaCl (both at +15 °C). Selected cross peaks are labeled with their assignment.
Figure 4.9: TEM image of αS fibrils incubated overnight
at +95 °C. Buffer conditions were identical to those used for
cold dissociation.
200 nm200 nm
4. αS oligomers characterization
84
4.3.2. Characterization of α-synuclein oligomers derived from amyloid fibrils
through supercooled water
Real-time aggregation by NMR and AFM experiments were done by Min-Kyu Cho,
amyloid fibrils dissociation by NMR, ThT fluorescence emission, native gel
electrophoresis and antibody assay were performed by myself.
4.3.2.1. Quantification of oligomers
The dissociation was confirmed by TEM, NMR, and ThT fluorescence.
Intriguingly, TEM of the dissociation shows dark and crowded background that was not
observed in TEM of amyloid fibrils (Fig.4.2.b, right panel). The amount of the
dissociated monomer was determined as ~15 % by NMR together with ~30 %
remaining of fibril, indicated that there must be another species which remains
undetected by NMR and ThT. This species with high molecular weight probably
oligomers, and further characterization has been performed.
Quantitative analysis for the oligomers derived from cold-induced dissociation
of amyloid fibrils is shown in Figure 4.10. After one week of amyloid fibril aggregation
of 15N-labeled wt αS, the intensity of the cross-peaks in 2D 1H-15N HSQC spectra
showed that ~15 % of monomers remain in the solution (I) compared to the initial
intensity. The remaining monomers were removed and then the collected amyloid fibrils
were used for the dissociation. After two days of dissociation in supercooled water, (II)
the signal intensity of the dissociated monomer in 1H-15N HSQC was compared with
that of the initial monomer sample prior to aggregation and (III) ThT signal of the
remaining amyloid fibril was compared with that of the initial fibril before the
dissociation. Based on both quantifications (II, III), it is revealed that ~15 % of 15N αS
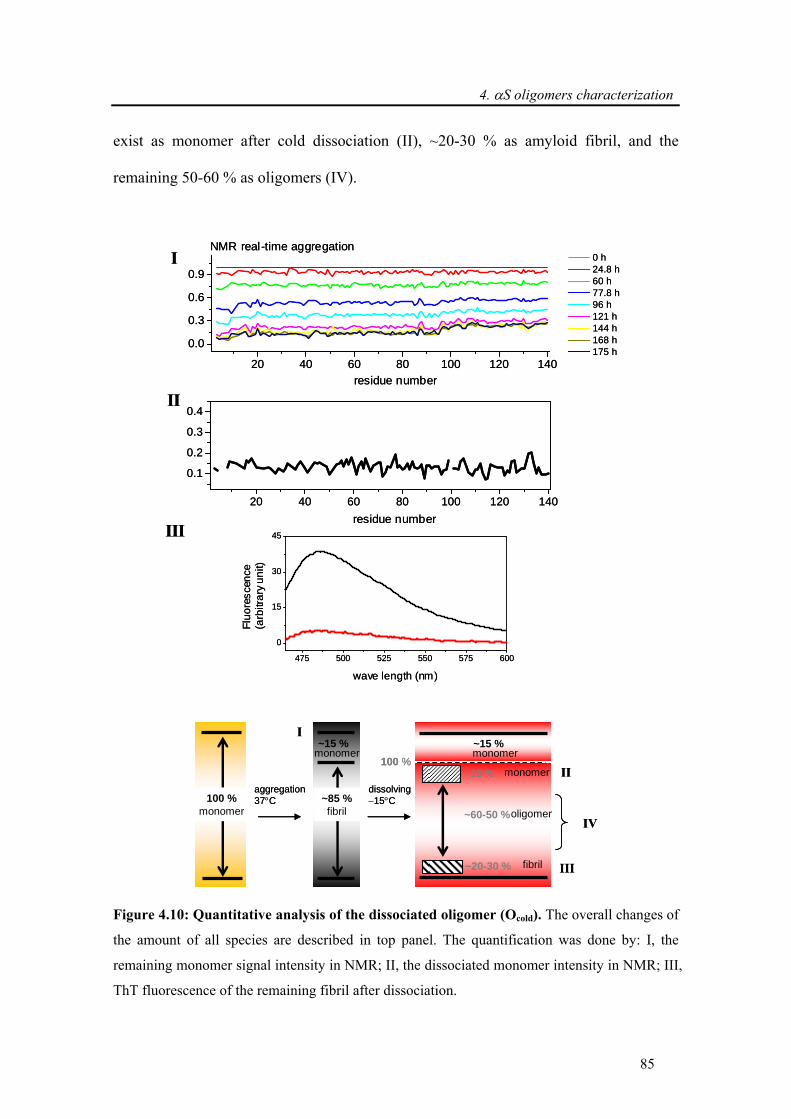
4. αS oligomers characterization
85
exist as monomer after cold dissociation (II), ~20-30 % as amyloid fibril, and the
remaining 50-60 % as oligomers (IV).
NMR real-time aggregationI
wave length (nm)
Fluo
resc
ence
(a
rbitr
ary
unit)
III
II
20 40 60 80 100 120 140
0.1
0.2
0.3
0.4
residue number
residue number20 40 60 80 100 120 140
0.0
0.3
0.6
0.9 0 h 24.8 h 60 h 77.8 h 96 h 121 h 144 h 168 h 175 h
475 500 525 550 575 600
0
15
30
45
NMR real-time aggregationI
wave length (nm)
Fluo
resc
ence
(a
rbitr
ary
unit)
III
II
20 40 60 80 100 120 140
0.1
0.2
0.3
0.4
residue number
residue number20 40 60 80 100 120 140
0.0
0.3
0.6
0.9 0 h 24.8 h 60 h 77.8 h 96 h 121 h 144 h 168 h 175 h
475 500 525 550 575 600
0
15
30
45
100 %monomer
~15 %
~85 %fibril
monomer
aggregation37°C
dissolving−15°C
~15 % monomer
~20-30 % fibril
~60-50 %oligomer
~15 %monomer
100 %
I
II
III
IV
100 %monomer
~15 %
~85 %fibril
monomer~15 %
~85 %fibril
monomer
aggregation37°C
dissolving−15°C
~15 % monomer
~20-30 % fibril
~60-50 %oligomer
~15 %monomer
100 %
I
II
III
IV
Figure 4.10: Quantitative analysis of the dissociated oligomer (Ocold). The overall changes of
the amount of all species are described in top panel. The quantification was done by: I, the
remaining monomer signal intensity in NMR; II, the dissociated monomer intensity in NMR; III,
ThT fluorescence of the remaining fibril after dissociation.
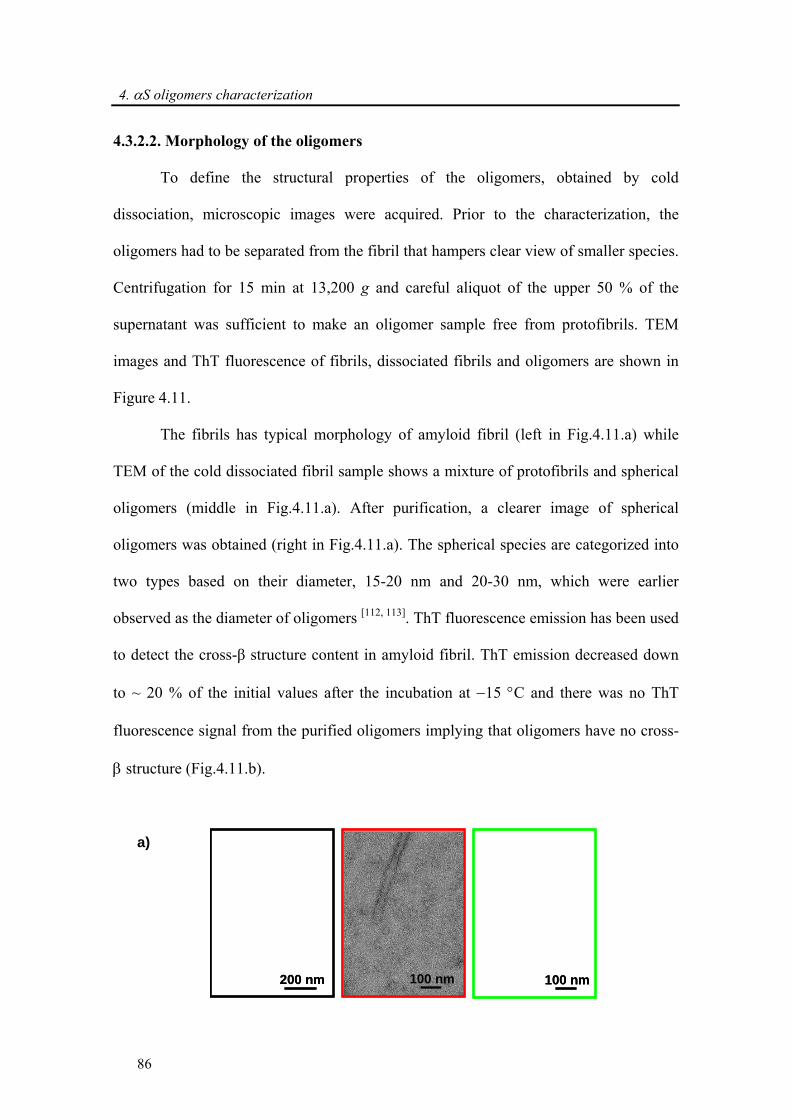
4. αS oligomers characterization
86
4.3.2.2. Morphology of the oligomers
To define the structural properties of the oligomers, obtained by cold
dissociation, microscopic images were acquired. Prior to the characterization, the
oligomers had to be separated from the fibril that hampers clear view of smaller species.
Centrifugation for 15 min at 13,200 g and careful aliquot of the upper 50 % of the
supernatant was sufficient to make an oligomer sample free from protofibrils. TEM
images and ThT fluorescence of fibrils, dissociated fibrils and oligomers are shown in
Figure 4.11.
The fibrils has typical morphology of amyloid fibril (left in Fig.4.11.a) while
TEM of the cold dissociated fibril sample shows a mixture of protofibrils and spherical
oligomers (middle in Fig.4.11.a). After purification, a clearer image of spherical
oligomers was obtained (right in Fig.4.11.a). The spherical species are categorized into
two types based on their diameter, 15-20 nm and 20-30 nm, which were earlier
observed as the diameter of oligomers [112, 113]. ThT fluorescence emission has been used
to detect the cross-β structure content in amyloid fibril. ThT emission decreased down
to ~ 20 % of the initial values after the incubation at −15 °C and there was no ThT
fluorescence signal from the purified oligomers implying that oligomers have no cross-
β structure (Fig.4.11.b).
200 nm 100 nm100 nm200 nm 100 nm100 nm
a)
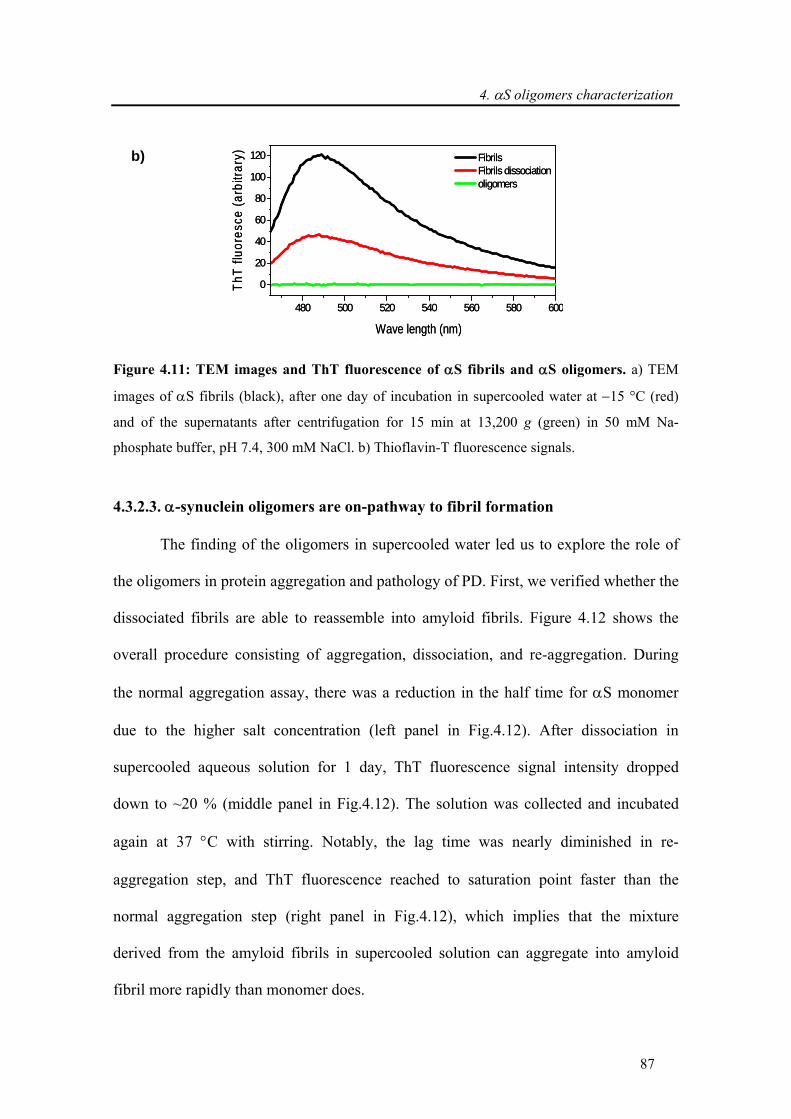
4. αS oligomers characterization
87
480 500 520 540 560 580 600
0
20
40
60
80
100
120 Fibrils Fibrils dissociation oligomers
Wave length (nm)
ThT
fluor
esce
(arb
itrar
y)
480 500 520 540 560 580 600
0
20
40
60
80
100
120 Fibrils Fibrils dissociation oligomers
Wave length (nm)
ThT
fluor
esce
(arb
itrar
y)
Figure 4.11: TEM images and ThT fluorescence of αS fibrils and αS oligomers. a) TEM
images of αS fibrils (black), after one day of incubation in supercooled water at −15 °C (red)
and of the supernatants after centrifugation for 15 min at 13,200 g (green) in 50 mM Na-
phosphate buffer, pH 7.4, 300 mM NaCl. b) Thioflavin-T fluorescence signals.
4.3.2.3. α-synuclein oligomers are on-pathway to fibril formation
The finding of the oligomers in supercooled water led us to explore the role of
the oligomers in protein aggregation and pathology of PD. First, we verified whether the
dissociated fibrils are able to reassemble into amyloid fibrils. Figure 4.12 shows the
overall procedure consisting of aggregation, dissociation, and re-aggregation. During
the normal aggregation assay, there was a reduction in the half time for αS monomer
due to the higher salt concentration (left panel in Fig.4.12). After dissociation in
supercooled aqueous solution for 1 day, ThT fluorescence signal intensity dropped
down to ~20 % (middle panel in Fig.4.12). The solution was collected and incubated
again at 37 °C with stirring. Notably, the lag time was nearly diminished in re-
aggregation step, and ThT fluorescence reached to saturation point faster than the
normal aggregation step (right panel in Fig.4.12), which implies that the mixture
derived from the amyloid fibrils in supercooled solution can aggregate into amyloid
fibril more rapidly than monomer does.
b)
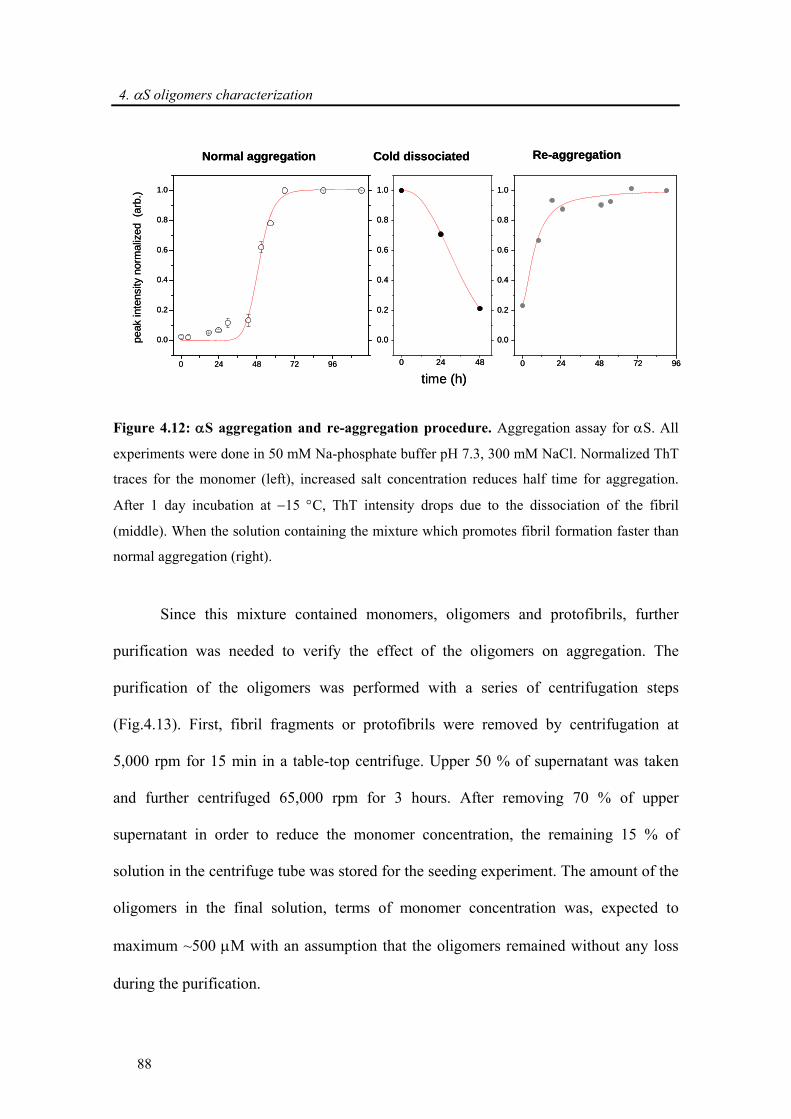
4. αS oligomers characterization
88
0 24 48 72 96
0.0
0.2
0.4
0.6
0.8
1.0
0 24 48 72 96
0.0
0.2
0.4
0.6
0.8
1.0
0 24 48
0.0
0.2
0.4
0.6
0.8
1.0
time (h)
peak
inte
nsity
nor
mal
ized
(ar
b.)
Normal aggregation Re-aggregationCold dissociated
0 24 48 72 96
0.0
0.2
0.4
0.6
0.8
1.0
0 24 48 72 96
0.0
0.2
0.4
0.6
0.8
1.0
0 24 48
0.0
0.2
0.4
0.6
0.8
1.0
time (h)
peak
inte
nsity
nor
mal
ized
(ar
b.)
Normal aggregation Re-aggregationCold dissociated
Figure 4.12: αS aggregation and re-aggregation procedure. Aggregation assay for αS. All
experiments were done in 50 mM Na-phosphate buffer pH 7.3, 300 mM NaCl. Normalized ThT
traces for the monomer (left), increased salt concentration reduces half time for aggregation.
After 1 day incubation at −15 °C, ThT intensity drops due to the dissociation of the fibril
(middle). When the solution containing the mixture which promotes fibril formation faster than
normal aggregation (right).
Since this mixture contained monomers, oligomers and protofibrils, further
purification was needed to verify the effect of the oligomers on aggregation. The
purification of the oligomers was performed with a series of centrifugation steps
(Fig.4.13). First, fibril fragments or protofibrils were removed by centrifugation at
5,000 rpm for 15 min in a table-top centrifuge. Upper 50 % of supernatant was taken
and further centrifuged 65,000 rpm for 3 hours. After removing 70 % of upper
supernatant in order to reduce the monomer concentration, the remaining 15 % of
solution in the centrifuge tube was stored for the seeding experiment. The amount of the
oligomers in the final solution, terms of monomer concentration was, expected to
maximum ~500 μM with an assumption that the oligomers remained without any loss
during the purification.
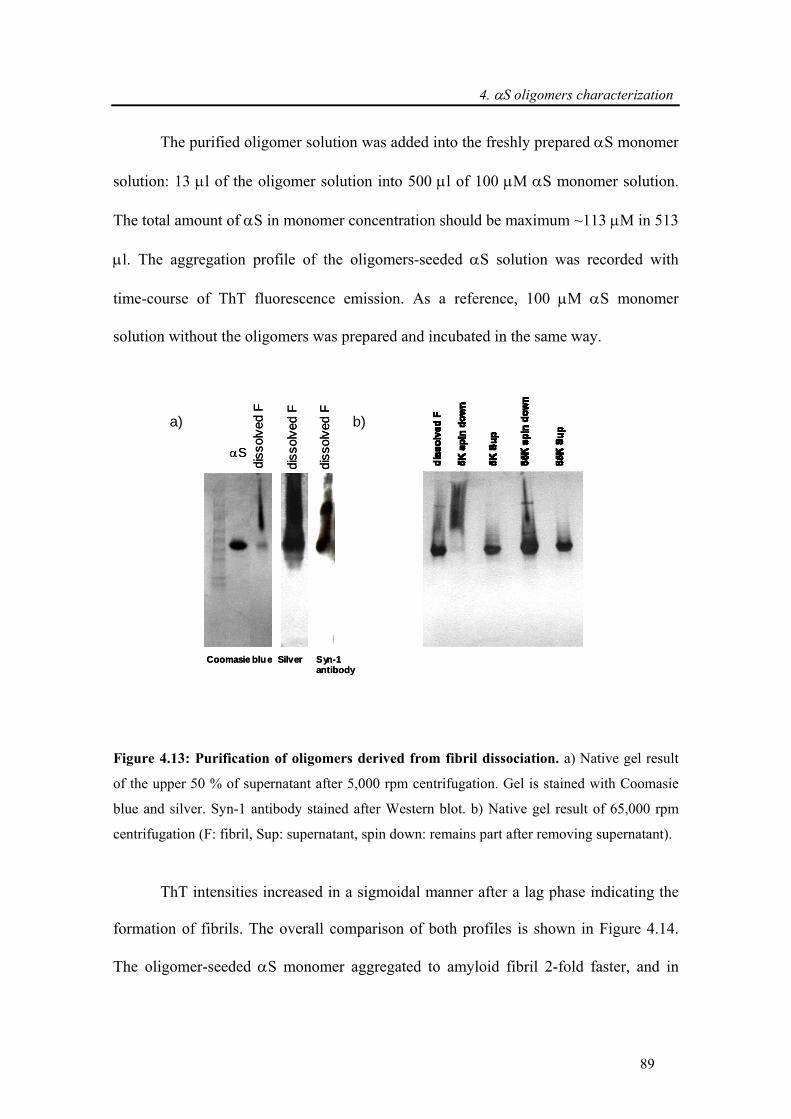
4. αS oligomers characterization
89
The purified oligomer solution was added into the freshly prepared αS monomer
solution: 13 μl of the oligomer solution into 500 μl of 100 μM αS monomer solution.
The total amount of αS in monomer concentration should be maximum ~113 μM in 513
μl. The aggregation profile of the oligomers-seeded αS solution was recorded with
time-course of ThT fluorescence emission. As a reference, 100 μM αS monomer
solution without the oligomers was prepared and incubated in the same way.
Figure 4.13: Purification of oligomers derived from fibril dissociation. a) Native gel result
of the upper 50 % of supernatant after 5,000 rpm centrifugation. Gel is stained with Coomasie
blue and silver. Syn-1 antibody stained after Western blot. b) Native gel result of 65,000 rpm
centrifugation (F: fibril, Sup: supernatant, spin down: remains part after removing supernatant).
ThT intensities increased in a sigmoidal manner after a lag phase indicating the
formation of fibrils. The overall comparison of both profiles is shown in Figure 4.14.
The oligomer-seeded αS monomer aggregated to amyloid fibril 2-fold faster, and in
Coomasie blue Silver Syn-1 antibody
αS
diss
olve
d F
diss
olve
d F
diss
olve
d F
Coomasie blue Silver Syn-1 antibody
αS
diss
olve
d F
diss
olve
d F
diss
olve
d F
a) b)
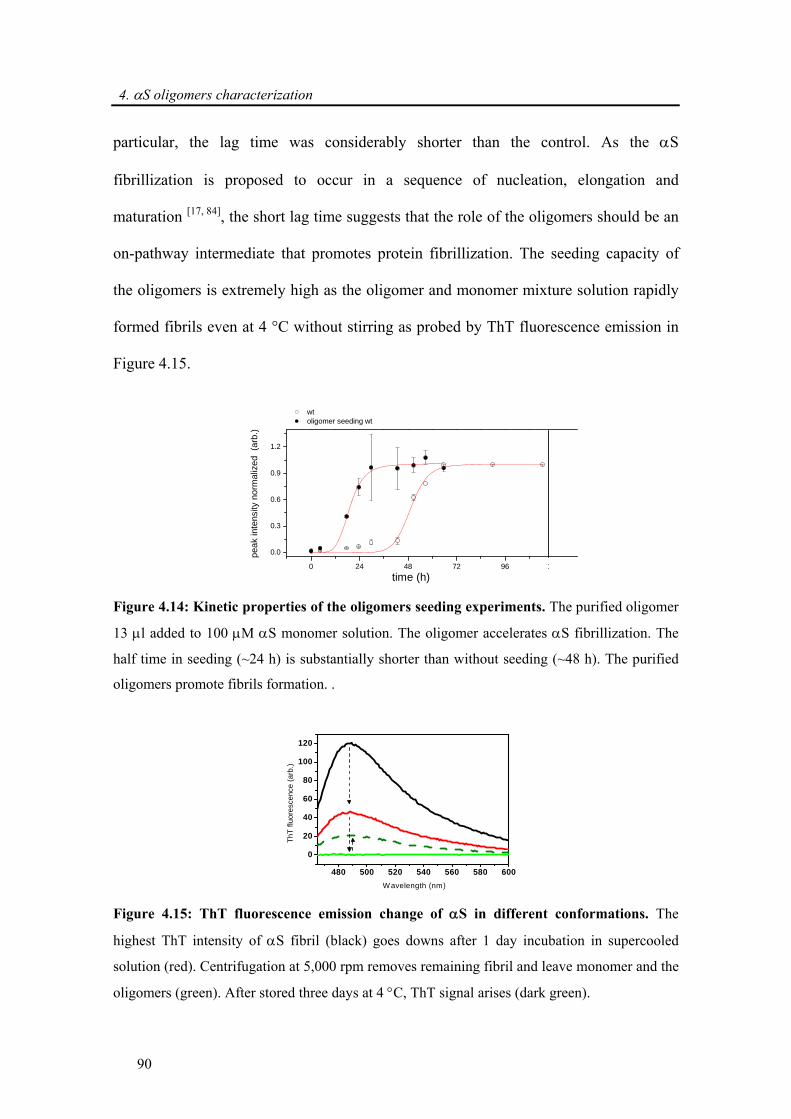
4. αS oligomers characterization
90
particular, the lag time was considerably shorter than the control. As the αS
fibrillization is proposed to occur in a sequence of nucleation, elongation and
maturation [17, 84], the short lag time suggests that the role of the oligomers should be an
on-pathway intermediate that promotes protein fibrillization. The seeding capacity of
the oligomers is extremely high as the oligomer and monomer mixture solution rapidly
formed fibrils even at 4 °C without stirring as probed by ThT fluorescence emission in
Figure 4.15.
0 24 48 72 96 1
0.0
0.3
0.6
0.9
1.2
wt oligomer seeding wt
time (h)
peak
inte
nsity
nor
mal
ized
(ar
b.)
Figure 4.14: Kinetic properties of the oligomers seeding experiments. The purified oligomer
13 μl added to 100 μM αS monomer solution. The oligomer accelerates αS fibrillization. The
half time in seeding (~24 h) is substantially shorter than without seeding (~48 h). The purified
oligomers promote fibrils formation. .
480 500 520 540 560 580 600
0
20
40
60
80
100
120
Wavelength (nm)
ThT
fluo
resc
ence
(arb
.)
Figure 4.15: ThT fluorescence emission change of αS in different conformations. The
highest ThT intensity of αS fibril (black) goes downs after 1 day incubation in supercooled
solution (red). Centrifugation at 5,000 rpm removes remaining fibril and leave monomer and the
oligomers (green). After stored three days at 4 °C, ThT signal arises (dark green).
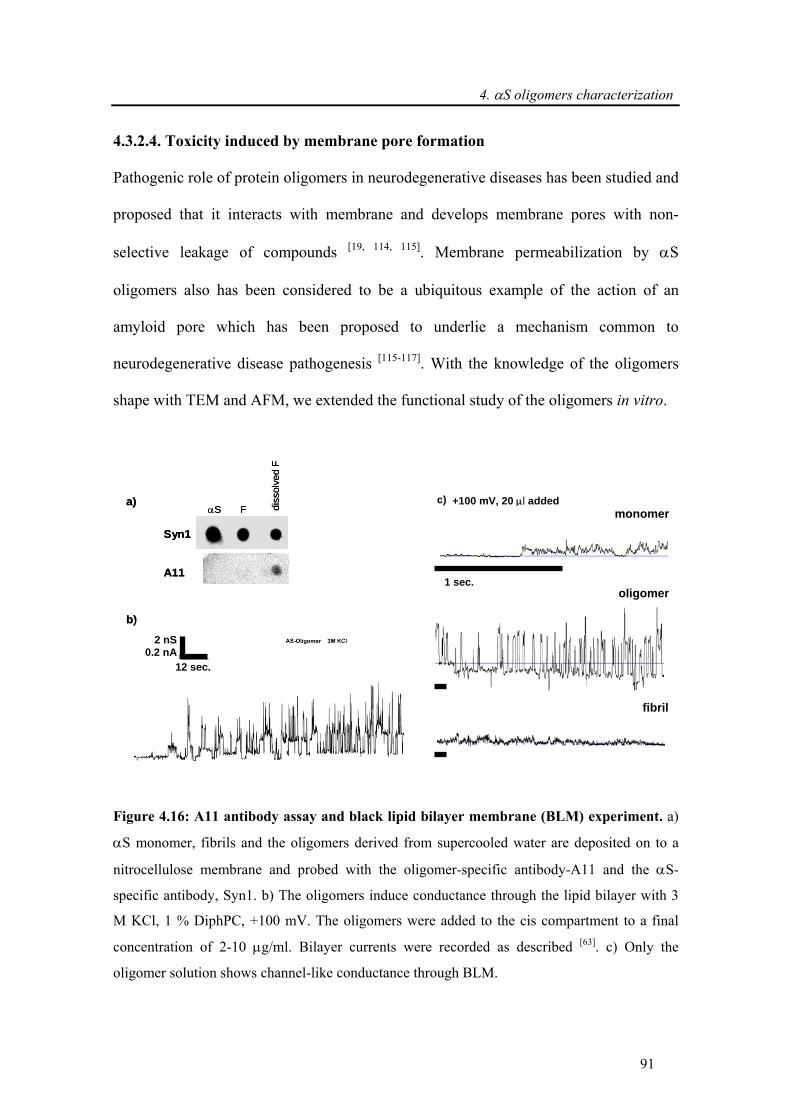
4. αS oligomers characterization
91
4.3.2.4. Toxicity induced by membrane pore formation
Pathogenic role of protein oligomers in neurodegenerative diseases has been studied and
proposed that it interacts with membrane and develops membrane pores with non-
selective leakage of compounds [19, 114, 115]. Membrane permeabilization by αS
oligomers also has been considered to be a ubiquitous example of the action of an
amyloid pore which has been proposed to underlie a mechanism common to
neurodegenerative disease pathogenesis [115-117]. With the knowledge of the oligomers
shape with TEM and AFM, we extended the functional study of the oligomers in vitro.
Figure 4.16: A11 antibody assay and black lipid bilayer membrane (BLM) experiment. a)
αS monomer, fibrils and the oligomers derived from supercooled water are deposited on to a
nitrocellulose membrane and probed with the oligomer-specific antibody-A11 and the αS-
specific antibody, Syn1. b) The oligomers induce conductance through the lipid bilayer with 3
M KCl, 1 % DiphPC, +100 mV. The oligomers were added to the cis compartment to a final
concentration of 2-10 μg/ml. Bilayer currents were recorded as described [63]. c) Only the
oligomer solution shows channel-like conductance through BLM.
monomer
oligomer
c) +100 mV, 20 μl added
fibril
1 sec.
αS diss
olve
d F
F
Syn1
A11
a)
b)
αS diss
olve
d F
F
Syn1
A11
a)
b)
12 sec.
2 nS 0.2 nA
4. αS oligomers characterization
92
Previous studies suggested that A11-antibody developed to target the earlier-
stage spherical intermediate of Aβ, recognizes subfibrillar aggregates of various
amyloid proteins, which induce membrane permeabilization [62]. Dot-blotting results of
the oligomer with A11 antibody showed that the oligomers are recognized by A11
antibody (Fig.4.16.a) implying that the structures of the oligomers share the common
conformation with those intermediates and the function in neurotoxicity of
amyloidogenic misfolding proteins.
Together with the conformational characterization by A11 antibody, the
membrane permeability of the oligomers was investigated with physiology experiment
with black lipid bilayer membrane system [63]. Figure 4.16.b shows the conductance of
planar lipid bilayer membranes containing 3 M KCl, 1 % DiphPC, which reveals that
the oligomers are able to induce leakage of electrolytes through the bilayer membrane.
The conductance of the pore induced by the oligomers exhibited, like channel protein,
several conductance states with well defined amplitude in every trial, but the absolute
size of the channels varied in different trials. The major conductance state of the
oligomers was averaged to 600 pS (the net conductance of the larger channels was
1400-1700 pS). Intriguingly, Zakharov et al. reported that monomeric αS can produce
ion channels in membranes containing an optimum anionic lipid content and proposed
that the formation of α-helical channels provide an alternative mechanism for
membrane permeabilization [117]. Together with the channel formation by oligomer
species, those physiological data show a potential mechanism of toxicity induced by
misfolding proteins, in vivo.
4. αS oligomers characterization
93
4.4. Conclusion
Taken together, our data suggests that −although we currently cannot estimate
the relative importance of the various contributions− the temperature dependence of
hydrophobic and electrostatic interactions contribute to the cold denaturation of αS
fibrils. We have demonstrated that amyloid fibrils formed by the protein αS are rapidly
denatured, that is, dissociate and lose the conformation of its constituent proteins
molecules, in supercooled water at −15 °C. Thus, the stability of αS fibrils towards low
temperature is low compared to the transition temperatures commonly found for
globular proteins. This resembles the situation found for other supramolecular
assemblies such as microtubules that dissociate upon cooling [118].
In addition, the incubation of amyloid fibrils in supercooled solution appeared to
be an effective tool to get a high amount of oligomers even though the oligomers are
heterogeneous mixture. Together with the morphology study, the role of the oligomers
both in amyloid fibrils formation and in membrane physiology was investigated. It was
revealed that the oligomers promote fibril formation suggesting that the oligomers are
on-pathway intermediates in fibrillization. The intermediate role and the heterogeneity
of the oligomers support the mechanism of the oligomer-based concerted amyloid fibril
formation. Also, the potential toxicology of the oligomers, known to be related with
channel activities (membrane permeabilization), was demonstrated by BLM physiology
experiment.
4. αS oligomers characterization
94
4.5. Outlook
For a better understanding of the cold denaturation of amyloid fibril, we are
extending our study to other systems including Aβ, lysozyme, β2microglobulin and C-
terminus truncated αS (108). In parallel, to extend our knowledge about the oligomers
in atomic resolution, study of oligomers by solid-state NMR, electron paramagnetic
resonance (EPR) spectroscopy, and hydrogen/deuterium exchange coupled with NMR
is in progress. Furthermore, the toxicity of the oligomers is being assayed with primary
neuronal culture. All these information would provide a conceptual framework for
which therapeutic strategies could be developed to take care of various amyloidosis-
related diseases.
5. Phosphorylation at S129
95
5. Biophysical studies of α-synuclein
phosphorylation and its aggregation
5.1. Introduction
Increasing evidence suggests that phosphorylation may play an important role in
the oligomerization and fibrillogenesis [119], LBs formation [119, 120] and neurotoxicity of
αS in vivo [121]. Immunohistochemical and biochemical studies revealed that the
majority of αS within LBs from patients with PD and other synucleinopathies like
multiple system atrophy (MSA) [119, 120, 122, 123] is phosphorylated at S129 (S129-P).
Proteinaceous inclusions formed in cellular and animal models overexpressing wt or
mutant αS [121, 123-125] can also be stained with an antibody against S129-P. A study by
Fujiwara et al. reported that in vitro phosphorylated αS, at S129 using Casein Kinase II
(CK2), forms fibrils more readily than unmodified αS [119]. Phosphorylation at S129
was also reported to promote the formation of cytoplasmic inclusions in some cell
culture models of synucleinopathies [126]. Together, these findings suggested that
phosphorylation at S129 plays an important role in modulating αS aggregation, LBs
formation and toxicity in vivo. However, whether phosphorylation promotes or inhibits
αS aggregation and neurotoxicity in vivo remains unknown. This understanding is
critical for elucidating the role of αS in the pathogenesis of PD and for development of
therapeutic strategies for PD.
Furthermore, the kinases and phosphatases responsible for regulating αS
phosphorylation in vivo are still not known. A series of in vitro and cell culture-based
5. Phosphorylation at S129
96
studies have identified a number of kinases, which phosphorylated αS at S129 and/or
S87. Okochi et al. [127] demonstrated that αS undergoes constitutive phosphorylation by
casein kinase 1 (CK1) and CK2 in vitro. The same study also revealed that CK2
phosphorylates αS at S129, whereas CK1 phosphorylates at S129 and S87, with S129
being the major phosphorylation site. Similarly, Pronin et al. [128] showed that the G-
protein coupled receptor kinases (GRKs), like GRK1, GRK2 and GRK5 and GRK6 can
phosphorylate αS in vitro, with a preference for phosphorylation at S129.
A comparison of the amino acid sequences of all synucleins from humans and
other species shows that the majority of potential αS phosphorylation sites, including
Y125, S129, Y133 and Y136 are highly conserved in all species. Considering all the in
vitro and tissue culture identified phosphorylation sites of αS, S87 [127, 129], S129 [119, 121,
123, 127-129], Y125 [123, 130-133], Y133 [130, 133] and Y136 [130, 133], it is striking that only S87
lies in the hydrophobic NAC region of αS, which is thought to drive the association and
aggregation of αS [134]. S87 is also one of the few phosphorylation sites that are
characteristic of human αS and distinguish it from mouse and rat αS, which have the
PD associated mutation A53T, but do not cause PD-like pathology and symptoms in
mice and rats. Therefore, phosphorylation at S87 potentially distinguishes the human αS
from all other members of the synuclein family, which share a conserved Asparagine
residue at this position and may contribute to the PD-like pathology and symptoms in
human, but not mouse and rat αS.
5. Phosphorylation at S129
97
5.2. Experimental procedure
During this work, protein aggregation assay in vitro and TEM were performed by
Katrina E. Paleologou and Hilal A. Lashuel, at the Brain Mind Institute in Lausanne,
Switzerland.
Cloning, expression, and purification of αS mutants: S129E, S129A and S87A αS
mutants were generated using site-directed mutagenesis employing complementary
internal mutagenic primers (see 2.1.3). Recombinant αS was expressed and purified as
described in 2.2.2.1. except those used for SDS-micell condition NMR studies (see
below).
Preparation of spin-labeled αS: A single cysteine residue was introduced into αS at
position 18 (A18C) as described in 2.2.1.2 and 2.2.2.2.
NMR spectroscopy: NMR experiments were recorded on Bruker Avance 600 and 700
MHz NMR spectrometers. Pulse field gradient NMR experiments were measured for
the determination of the hydrodynamic radius (see 1.4.4 and 2.3.3.3). The 15N T1ρ, 1H
{15N}-NOEs values were obtained by collecting five 2D spectra (see 2.2.3.4). An on-
resonance spin-lock pulse of 2.5 kHz was used. PRE profiles were derived from the
measurement of the ratios of the peak intensity between two 2D HSQC spectra in the
presence (Ipara) and absence (Idia) of the nitroxide radical (see 1.4.3 and 2.2.3.2).
Phosphorylation of αS in vitro: wt or mutants αS was phosphorylated by CK1 (NEB) at
concentrations of 1.446 mg/ml in the presence of 1.09 mM ATP (Sigma), 1x reaction
solution supplied with the enzyme. The phosphorylation reaction was incubated at 30 ºC
for the stated time points and the reaction was stopped with ethylenediaminetetraacetic
5. Phosphorylation at S129
98
acid (EDTA) disodium salt (5 mM final concentration) (Axon Lab). The progress of the
reaction was monitored by RP-HPLC and mass spectrometry (see 2.2.2.3 and 2.2.2.5).
Fibrillization studies: To probe the effect of CK1 phosphorylation on the aggregation of
αS, wt αS was phosphorylated for 24 h at 30 °C and the reaction was stopped with
EDTA disodium salt before the samples were subjected to fibrillization conditions, at
37 °C with continuous shaking. The unphosphorylated controls were subjected to the
same conditions, but in the absence of CK1. For fibrillization studies the proteins were
dissolved in 20 mM Tris, 100 mM lithium chloride (Aldrich), pH 7.4, at a concentration
of 70 μM and fibril formation was monitored by ThT fluorescence.
Circular dichroism (CD): The average secondary structure of monomeric αS in the
presence and absence of 1-Palmitoyl-2-Oleoyl-sn-Glycero-3-[Phospho-rac-(1-glycerol)]
(Sodium salt) (POPG) (Avanti Polar Lipids Inc.) vesicles was determined by CD
spectroscopy using a Jasco 810 Spectrometer. The Far UV-CD spectra (190-250 nm,
integration time of 2 seconds for 0.2 nm) were collected at RT in a 1 mm path length
quartz cuvette containing 0.1 mg/ml of αS in PBS or sodium phosphate buffer and
vesicles were prepared as described in Paleologu et al. [135].
TEM: wt or mutant αS samples were deposited on Formvar-coated 200 mesh copper
grids (Electron Microscopy Sciences) at a concentration of 25 μM. Grids were washed
with two drops of water and stained with two drops of freshly prepared 0.75 % (w/v)
uranyl acetate (Electron microscopy sciences). Specimens were inspected on a Philip
CIME 12 electron microscope, operated at 80 kV. Digitized photographs were recorded
with a slow scan CCD camera (Gatan, Model 679).
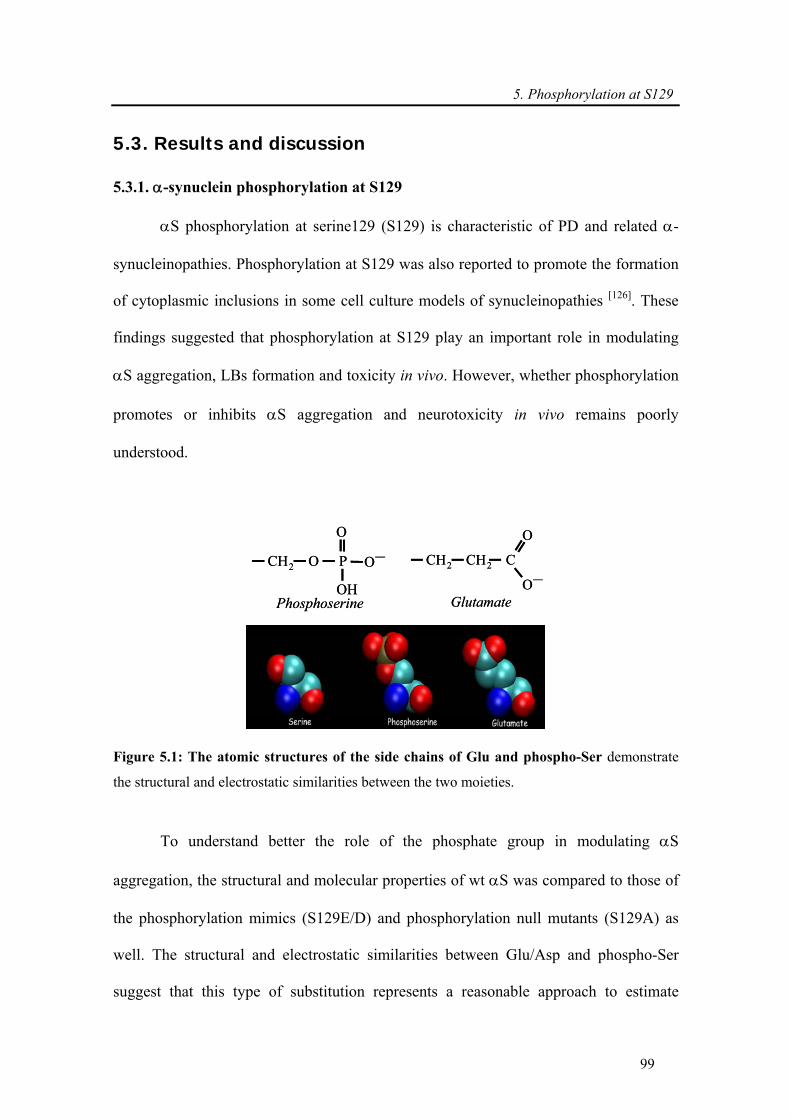
5. Phosphorylation at S129
99
5.3. Results and discussion
5.3.1. α-synuclein phosphorylation at S129
αS phosphorylation at serine129 (S129) is characteristic of PD and related α-
synucleinopathies. Phosphorylation at S129 was also reported to promote the formation
of cytoplasmic inclusions in some cell culture models of synucleinopathies [126]. These
findings suggested that phosphorylation at S129 play an important role in modulating
αS aggregation, LBs formation and toxicity in vivo. However, whether phosphorylation
promotes or inhibits αS aggregation and neurotoxicity in vivo remains poorly
understood.
CH2 O P
O
O—
OHPhosphoserine
CH2 CH2 C
O
O—
Glutamate
CH2 O P
O
O—
OHPhosphoserine
CH2 CH2 C
O
O—
Glutamate
Figure 5.1: The atomic structures of the side chains of Glu and phospho-Ser demonstrate
the structural and electrostatic similarities between the two moieties.
To understand better the role of the phosphate group in modulating αS
aggregation, the structural and molecular properties of wt αS was compared to those of
the phosphorylation mimics (S129E/D) and phosphorylation null mutants (S129A) as
well. The structural and electrostatic similarities between Glu/Asp and phospho-Ser
suggest that this type of substitution represents a reasonable approach to estimate
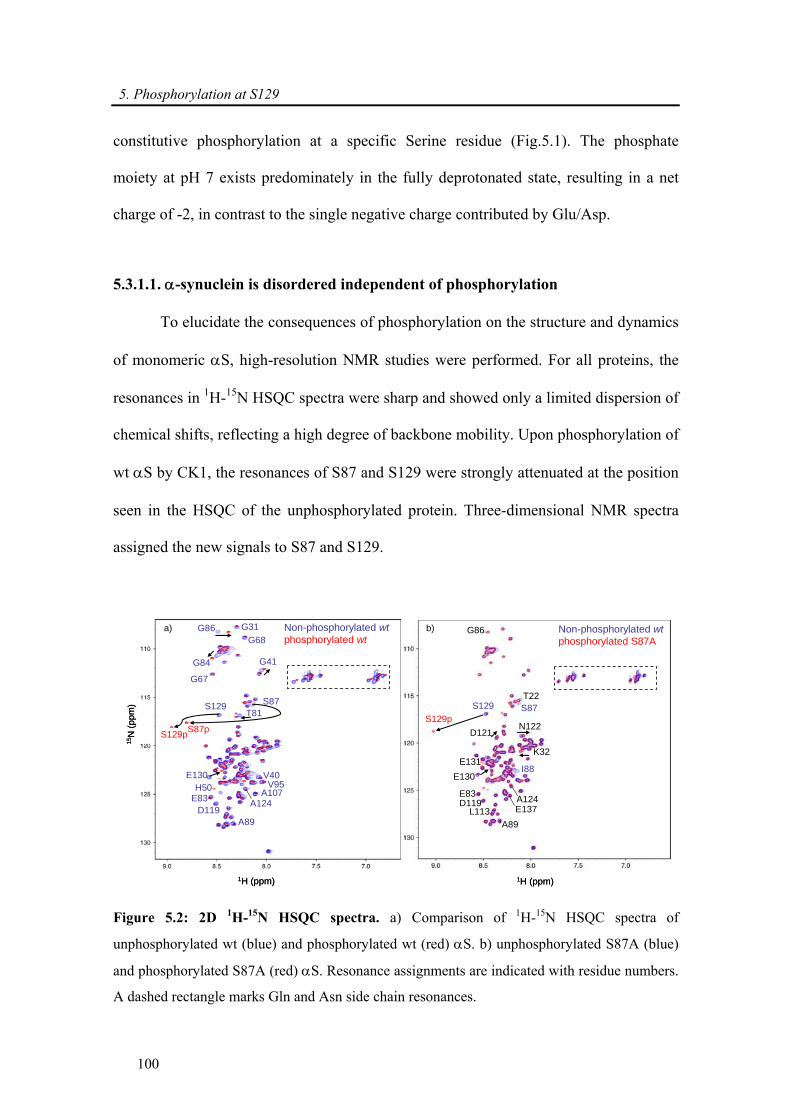
5. Phosphorylation at S129
100
constitutive phosphorylation at a specific Serine residue (Fig.5.1). The phosphate
moiety at pH 7 exists predominately in the fully deprotonated state, resulting in a net
charge of -2, in contrast to the single negative charge contributed by Glu/Asp.
5.3.1.1. α-synuclein is disordered independent of phosphorylation
To elucidate the consequences of phosphorylation on the structure and dynamics
of monomeric αS, high-resolution NMR studies were performed. For all proteins, the
resonances in 1H-15N HSQC spectra were sharp and showed only a limited dispersion of
chemical shifts, reflecting a high degree of backbone mobility. Upon phosphorylation of
wt αS by CK1, the resonances of S87 and S129 were strongly attenuated at the position
seen in the HSQC of the unphosphorylated protein. Three-dimensional NMR spectra
assigned the new signals to S87 and S129.
1H (ppm)
15N
(ppm
)
S129pS87p
G86
G84
S129 S87
E130
E83
T81
Non-phosphorylated wtphosphorylated wt
G41
G68G31
D119A89
A107V95
V40
A124
G67
H50
1H (ppm)
S129pS129
G86
S87
A89
D119
K32
A124E83
E137
I88E130
E131
D121N122
L113
Non-phosphorylated wtphosphorylated S87A
T22
a) b)
1H (ppm)
15N
(ppm
)
S129pS87p
G86
G84
S129 S87
E130
E83
T81
Non-phosphorylated wtphosphorylated wt
G41
G68G31
D119A89
A107V95
V40
A124
G67
H50
1H (ppm)
S129pS129
G86
S87
A89
D119
K32
A124E83
E137
I88E130
E131
D121N122
L113
Non-phosphorylated wtphosphorylated S87A
T22
a) b)
Figure 5.2: 2D 1H-15N HSQC spectra. a) Comparison of 1H-15N HSQC spectra of
unphosphorylated wt (blue) and phosphorylated wt (red) αS. b) unphosphorylated S87A (blue)
and phosphorylated S87A (red) αS. Resonance assignments are indicated with residue numbers.
A dashed rectangle marks Gln and Asn side chain resonances.
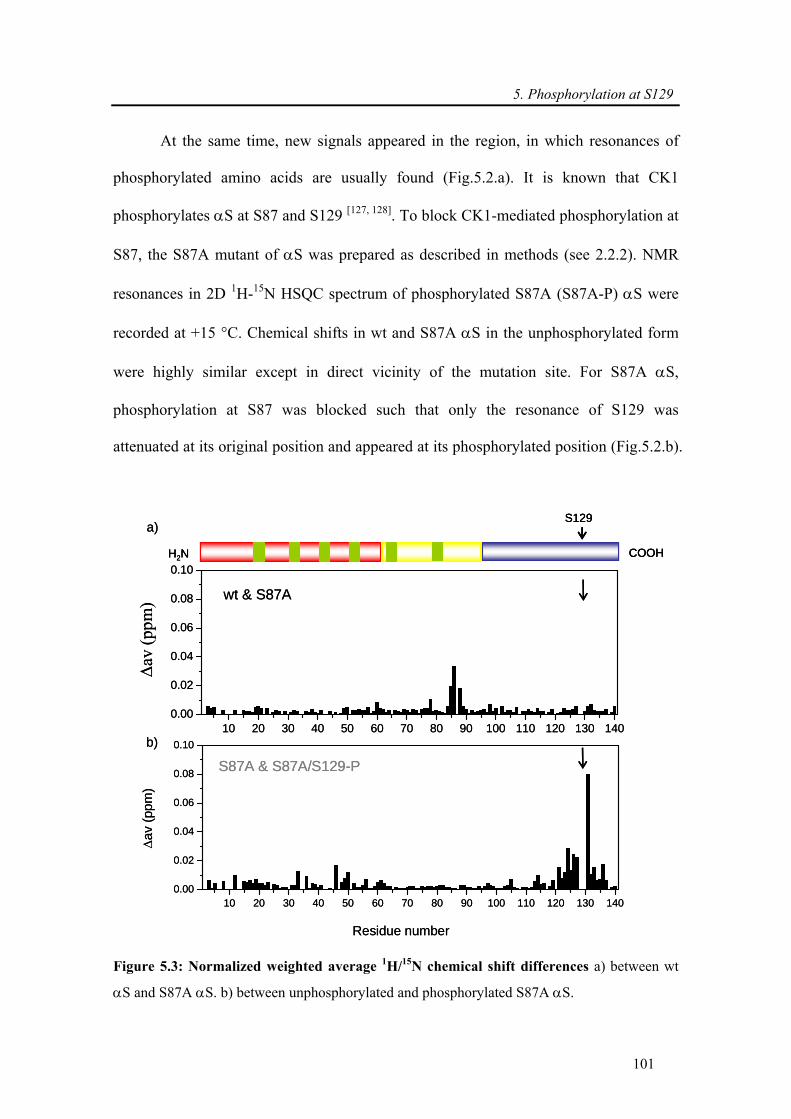
5. Phosphorylation at S129
101
At the same time, new signals appeared in the region, in which resonances of
phosphorylated amino acids are usually found (Fig.5.2.a). It is known that CK1
phosphorylates αS at S87 and S129 [127, 128]. To block CK1-mediated phosphorylation at
S87, the S87A mutant of αS was prepared as described in methods (see 2.2.2). NMR
resonances in 2D 1H-15N HSQC spectrum of phosphorylated S87A (S87A-P) αS were
recorded at +15 °C. Chemical shifts in wt and S87A αS in the unphosphorylated form
were highly similar except in direct vicinity of the mutation site. For S87A αS,
phosphorylation at S87 was blocked such that only the resonance of S129 was
attenuated at its original position and appeared at its phosphorylated position (Fig.5.2.b).
10 20 30 40 50 60 70 80 90 100 110 120 130 1400.00
0.02
0.04
0.06
0.08
0.10
10 20 30 40 50 60 70 80 90 100 110 120 130 1400.00
0.02
0.04
0.06
0.08
0.10
Δa
v(p
pm)
Residue number
wt & S87A
a)
S87A & S87A/S129-P
Δav
(ppm
)
S129
H2N COOH
b)
10 20 30 40 50 60 70 80 90 100 110 120 130 1400.00
0.02
0.04
0.06
0.08
0.10
10 20 30 40 50 60 70 80 90 100 110 120 130 1400.00
0.02
0.04
0.06
0.08
0.10
Δa
v(p
pm)
Residue number
wt & S87A
a)
S87A & S87A/S129-P
Δav
(ppm
)
S129
H2N COOH
S129
H2N COOH
b)
Figure 5.3: Normalized weighted average 1H/15N chemical shift differences a) between wt
αS and S87A αS. b) between unphosphorylated and phosphorylated S87A αS.
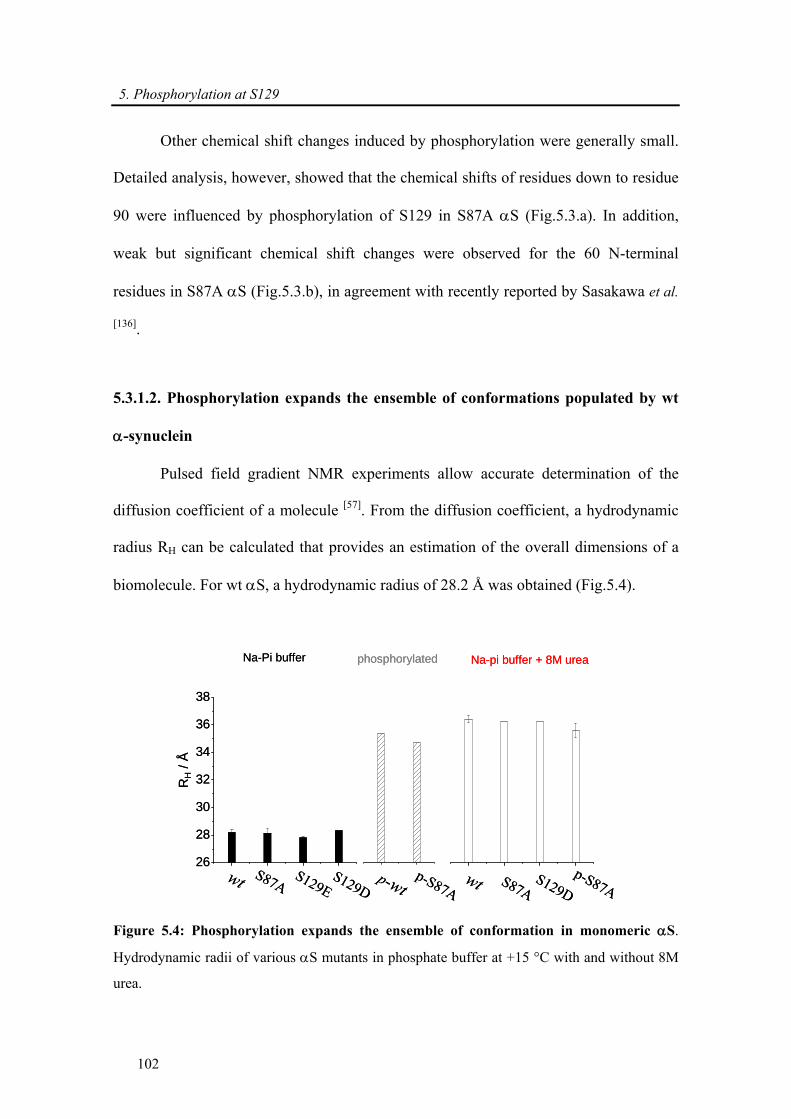
5. Phosphorylation at S129
102
Other chemical shift changes induced by phosphorylation were generally small.
Detailed analysis, however, showed that the chemical shifts of residues down to residue
90 were influenced by phosphorylation of S129 in S87A αS (Fig.5.3.a). In addition,
weak but significant chemical shift changes were observed for the 60 N-terminal
residues in S87A αS (Fig.5.3.b), in agreement with recently reported by Sasakawa et al.
[136].
5.3.1.2. Phosphorylation expands the ensemble of conformations populated by wt
α-synuclein
Pulsed field gradient NMR experiments allow accurate determination of the
diffusion coefficient of a molecule [57]. From the diffusion coefficient, a hydrodynamic
radius RH can be calculated that provides an estimation of the overall dimensions of a
biomolecule. For wt αS, a hydrodynamic radius of 28.2 Å was obtained (Fig.5.4).
p-wtp-S87A
phosphorylated
p-S87AS87AS129D
wt
Na-pi buffer + 8M urea
26
28
30
32
34
36
38
RH
/ Å
wt S129DS87A
Na-Pi buffer
S129E p-wt
p-S87A
phosphorylated
p-S87AS87AS129D
wt
Na-pi buffer + 8M urea
26
28
30
32
34
36
38
RH
/ Å
wt S129DS87A
Na-Pi buffer
S129E
Figure 5.4: Phosphorylation expands the ensemble of conformation in monomeric αS.
Hydrodynamic radii of various αS mutants in phosphate buffer at +15 °C with and without 8M
urea.
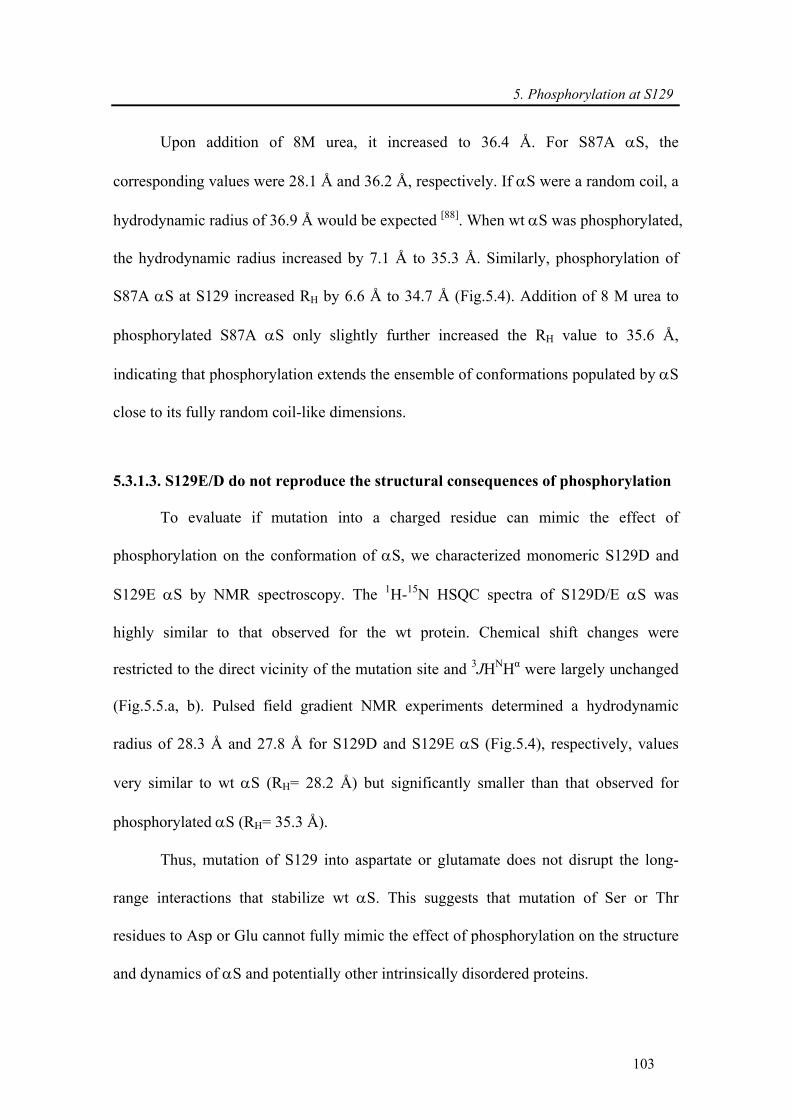
5. Phosphorylation at S129
103
Upon addition of 8M urea, it increased to 36.4 Å. For S87A αS, the
corresponding values were 28.1 Å and 36.2 Å, respectively. If αS were a random coil, a
hydrodynamic radius of 36.9 Å would be expected [88]. When wt αS was phosphorylated,
the hydrodynamic radius increased by 7.1 Å to 35.3 Å. Similarly, phosphorylation of
S87A αS at S129 increased RH by 6.6 Å to 34.7 Å (Fig.5.4). Addition of 8 M urea to
phosphorylated S87A αS only slightly further increased the RH value to 35.6 Å,
indicating that phosphorylation extends the ensemble of conformations populated by αS
close to its fully random coil-like dimensions.
5.3.1.3. S129E/D do not reproduce the structural consequences of phosphorylation
To evaluate if mutation into a charged residue can mimic the effect of
phosphorylation on the conformation of αS, we characterized monomeric S129D and
S129E αS by NMR spectroscopy. The 1H-15N HSQC spectra of S129D/E αS was
highly similar to that observed for the wt protein. Chemical shift changes were
restricted to the direct vicinity of the mutation site and 3JHNHα were largely unchanged
(Fig.5.5.a, b). Pulsed field gradient NMR experiments determined a hydrodynamic
radius of 28.3 Å and 27.8 Å for S129D and S129E αS (Fig.5.4), respectively, values
very similar to wt αS (RH= 28.2 Å) but significantly smaller than that observed for
phosphorylated αS (RH= 35.3 Å).
Thus, mutation of S129 into aspartate or glutamate does not disrupt the long-
range interactions that stabilize wt αS. This suggests that mutation of Ser or Thr
residues to Asp or Glu cannot fully mimic the effect of phosphorylation on the structure
and dynamics of αS and potentially other intrinsically disordered proteins.
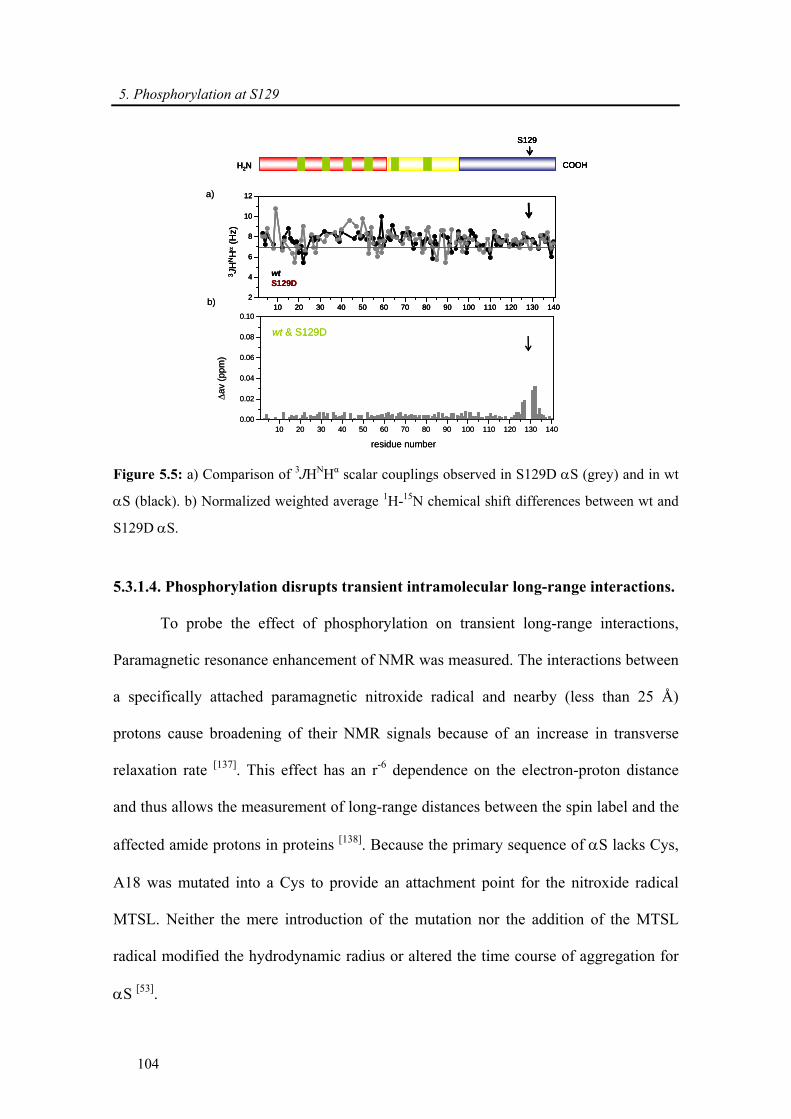
5. Phosphorylation at S129
104
S129
H2N COOH
10 20 30 40 50 60 70 80 90 100 110 120 130 1402
4
6
8
10
12
3 J
HNH
α(H
z)
wtS129D
wt & S129D
Δav
(ppm
)
10 20 30 40 50 60 70 80 90 100 110 120 130 1400.00
0.02
0.04
0.06
0.08
0.10
b)
residue number
a)
S129
H2N COOH
10 20 30 40 50 60 70 80 90 100 110 120 130 1402
4
6
8
10
12
3 J
HNH
α(H
z)
wtS129D
S129
H2N COOH
S129
H2N COOH
10 20 30 40 50 60 70 80 90 100 110 120 130 1402
4
6
8
10
12
3 J
HNH
α(H
z)
wtS129D
wt & S129D
Δav
(ppm
)
10 20 30 40 50 60 70 80 90 100 110 120 130 1400.00
0.02
0.04
0.06
0.08
0.10
b)
residue number
a)
Figure 5.5: a) Comparison of 3JHNHα scalar couplings observed in S129D αS (grey) and in wt
αS (black). b) Normalized weighted average 1H-15N chemical shift differences between wt and
S129D αS.
5.3.1.4. Phosphorylation disrupts transient intramolecular long-range interactions.
To probe the effect of phosphorylation on transient long-range interactions,
Paramagnetic resonance enhancement of NMR was measured. The interactions between
a specifically attached paramagnetic nitroxide radical and nearby (less than 25 Å)
protons cause broadening of their NMR signals because of an increase in transverse
relaxation rate [137]. This effect has an r-6 dependence on the electron-proton distance
and thus allows the measurement of long-range distances between the spin label and the
affected amide protons in proteins [138]. Because the primary sequence of αS lacks Cys,
A18 was mutated into a Cys to provide an attachment point for the nitroxide radical
MTSL. Neither the mere introduction of the mutation nor the addition of the MTSL
radical modified the hydrodynamic radius or altered the time course of aggregation for
αS [53].
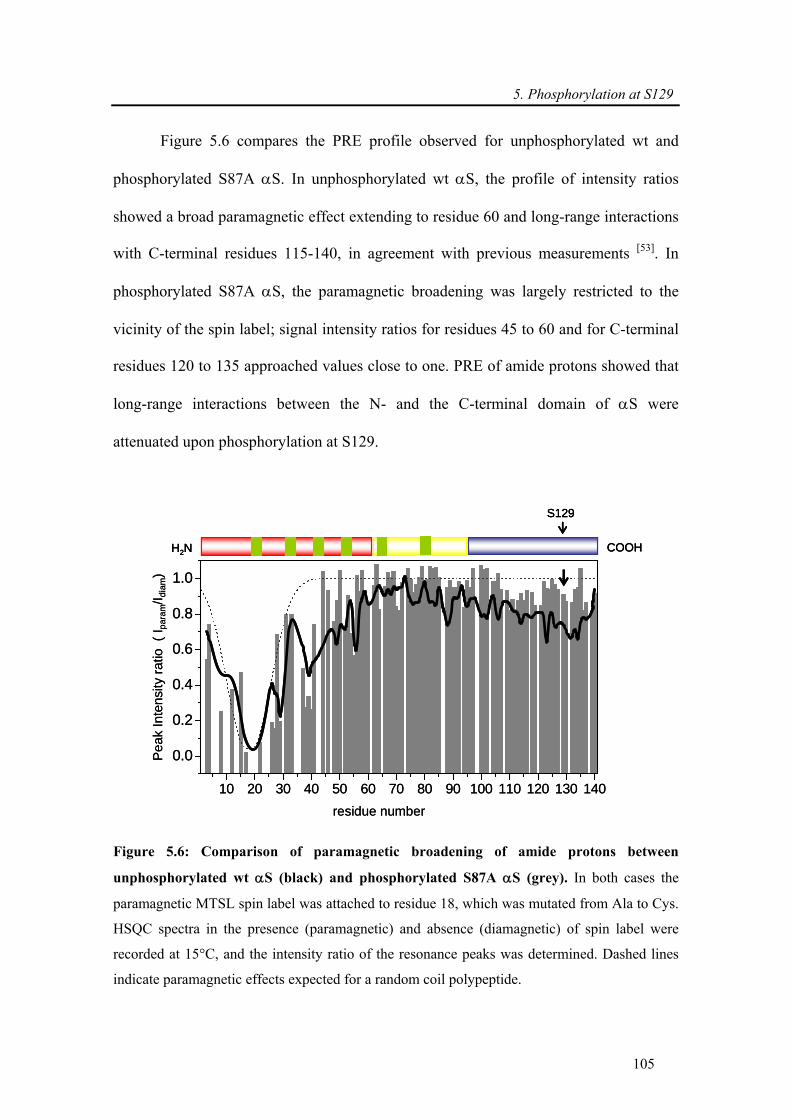
5. Phosphorylation at S129
105
Figure 5.6 compares the PRE profile observed for unphosphorylated wt and
phosphorylated S87A αS. In unphosphorylated wt αS, the profile of intensity ratios
showed a broad paramagnetic effect extending to residue 60 and long-range interactions
with C-terminal residues 115-140, in agreement with previous measurements [53]. In
phosphorylated S87A αS, the paramagnetic broadening was largely restricted to the
vicinity of the spin label; signal intensity ratios for residues 45 to 60 and for C-terminal
residues 120 to 135 approached values close to one. PRE of amide protons showed that
long-range interactions between the N- and the C-terminal domain of αS were
attenuated upon phosphorylation at S129.
10 20 30 40 50 60 70 80 90 100 110 120 130 140
0.0
0.2
0.4
0.6
0.8
1.0
residue number
Pea
k In
tens
ity ra
tio (
I par
am/I d
iam)
S129
H2N COOH
10 20 30 40 50 60 70 80 90 100 110 120 130 140
0.0
0.2
0.4
0.6
0.8
1.0
residue number
Pea
k In
tens
ity ra
tio (
I par
am/I d
iam)
S129
H2N COOH
S129
H2N COOH
Figure 5.6: Comparison of paramagnetic broadening of amide protons between
unphosphorylated wt αS (black) and phosphorylated S87A αS (grey). In both cases the
paramagnetic MTSL spin label was attached to residue 18, which was mutated from Ala to Cys.
HSQC spectra in the presence (paramagnetic) and absence (diamagnetic) of spin label were
recorded at 15°C, and the intensity ratio of the resonance peaks was determined. Dashed lines
indicate paramagnetic effects expected for a random coil polypeptide.
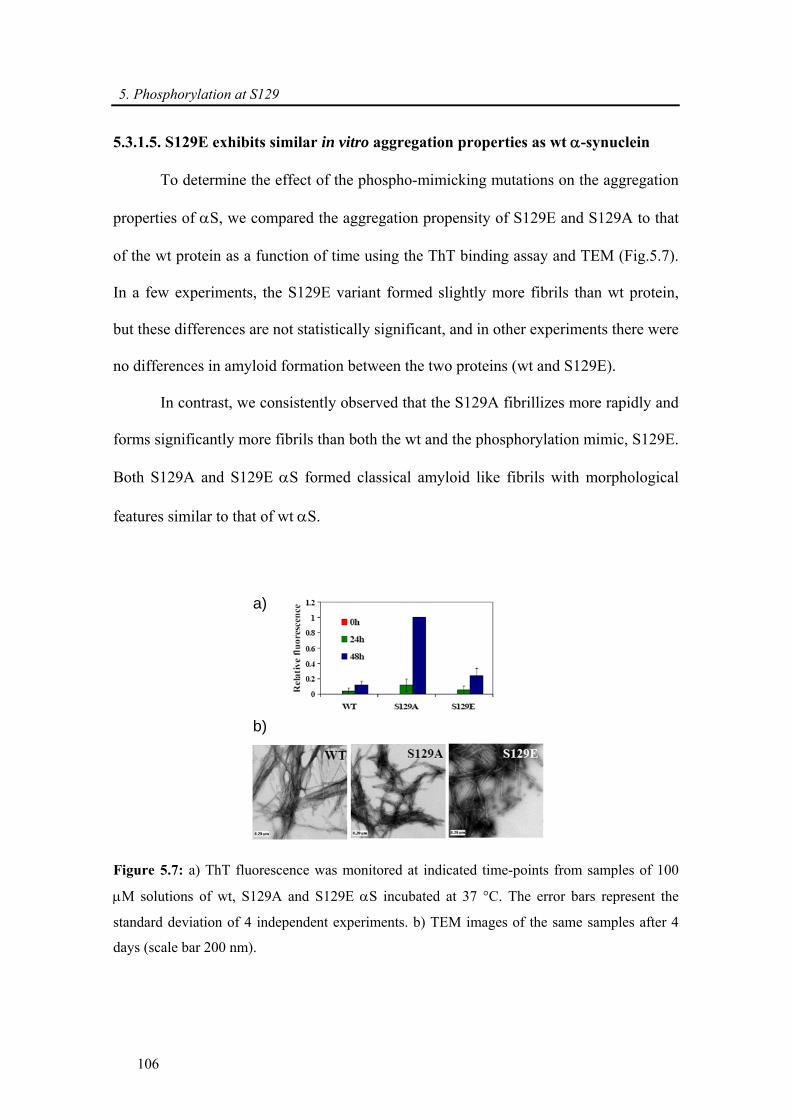
5. Phosphorylation at S129
106
5.3.1.5. S129E exhibits similar in vitro aggregation properties as wt α-synuclein
To determine the effect of the phospho-mimicking mutations on the aggregation
properties of αS, we compared the aggregation propensity of S129E and S129A to that
of the wt protein as a function of time using the ThT binding assay and TEM (Fig.5.7).
In a few experiments, the S129E variant formed slightly more fibrils than wt protein,
but these differences are not statistically significant, and in other experiments there were
no differences in amyloid formation between the two proteins (wt and S129E).
In contrast, we consistently observed that the S129A fibrillizes more rapidly and
forms significantly more fibrils than both the wt and the phosphorylation mimic, S129E.
Both S129A and S129E αS formed classical amyloid like fibrils with morphological
features similar to that of wt αS.
a)
b)
a)
b)
Figure 5.7: a) ThT fluorescence was monitored at indicated time-points from samples of 100
μM solutions of wt, S129A and S129E αS incubated at 37 °C. The error bars represent the
standard deviation of 4 independent experiments. b) TEM images of the same samples after 4
days (scale bar 200 nm).
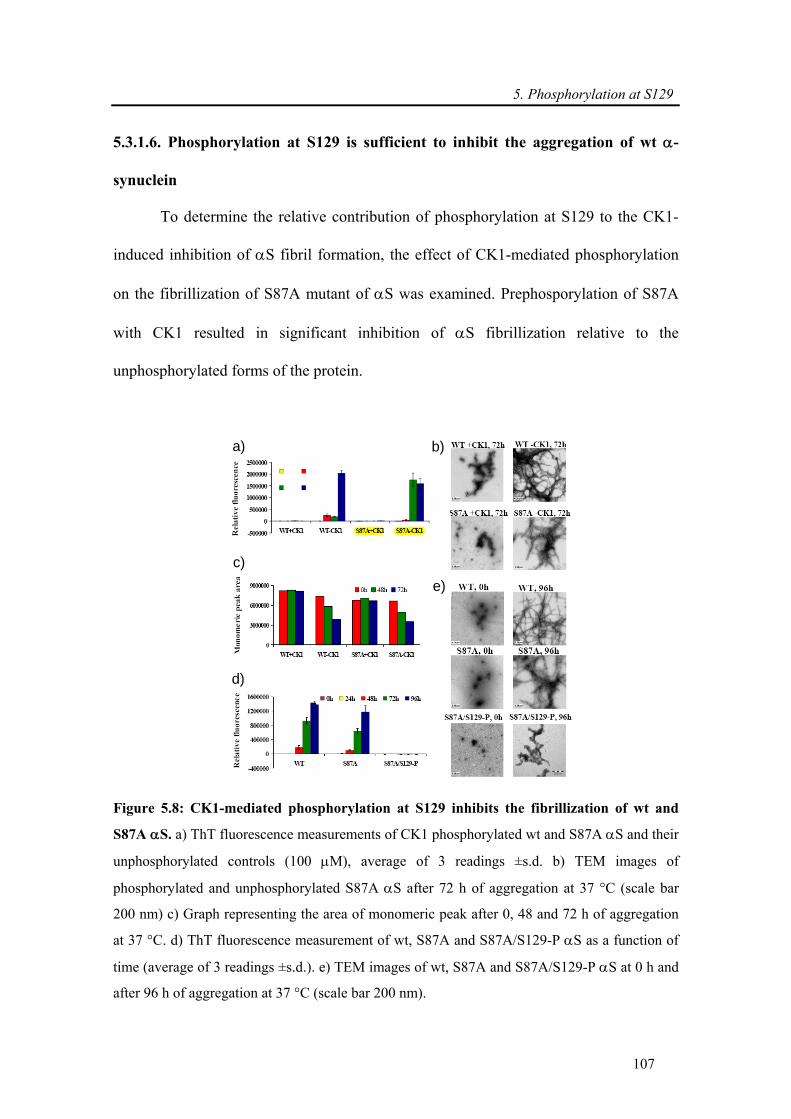
5. Phosphorylation at S129
107
5.3.1.6. Phosphorylation at S129 is sufficient to inhibit the aggregation of wt α-
synuclein
To determine the relative contribution of phosphorylation at S129 to the CK1-
induced inhibition of αS fibril formation, the effect of CK1-mediated phosphorylation
on the fibrillization of S87A mutant of αS was examined. Prephosporylation of S87A
with CK1 resulted in significant inhibition of αS fibrillization relative to the
unphosphorylated forms of the protein.
a) b)
c)
d)
e)
a) b)
c)
d)
e)
Figure 5.8: CK1-mediated phosphorylation at S129 inhibits the fibrillization of wt and
S87A αS. a) ThT fluorescence measurements of CK1 phosphorylated wt and S87A αS and their
unphosphorylated controls (100 μM), average of 3 readings ±s.d. b) TEM images of
phosphorylated and unphosphorylated S87A αS after 72 h of aggregation at 37 °C (scale bar
200 nm) c) Graph representing the area of monomeric peak after 0, 48 and 72 h of aggregation
at 37 °C. d) ThT fluorescence measurement of wt, S87A and S87A/S129-P αS as a function of
time (average of 3 readings ±s.d.). e) TEM images of wt, S87A and S87A/S129-P αS at 0 h and
after 96 h of aggregation at 37 °C (scale bar 200 nm).
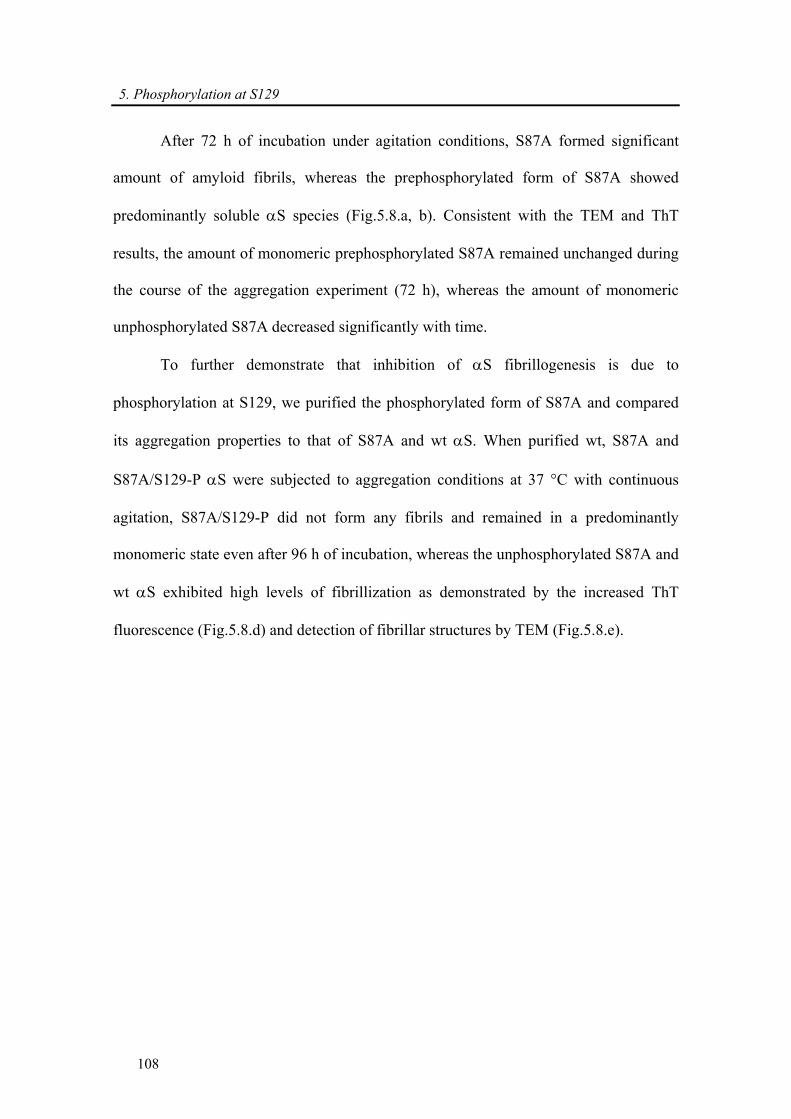
5. Phosphorylation at S129
108
After 72 h of incubation under agitation conditions, S87A formed significant
amount of amyloid fibrils, whereas the prephosphorylated form of S87A showed
predominantly soluble αS species (Fig.5.8.a, b). Consistent with the TEM and ThT
results, the amount of monomeric prephosphorylated S87A remained unchanged during
the course of the aggregation experiment (72 h), whereas the amount of monomeric
unphosphorylated S87A decreased significantly with time.
To further demonstrate that inhibition of αS fibrillogenesis is due to
phosphorylation at S129, we purified the phosphorylated form of S87A and compared
its aggregation properties to that of S87A and wt αS. When purified wt, S87A and
S87A/S129-P αS were subjected to aggregation conditions at 37 °C with continuous
agitation, S87A/S129-P did not form any fibrils and remained in a predominantly
monomeric state even after 96 h of incubation, whereas the unphosphorylated S87A and
wt αS exhibited high levels of fibrillization as demonstrated by the increased ThT
fluorescence (Fig.5.8.d) and detection of fibrillar structures by TEM (Fig.5.8.e).
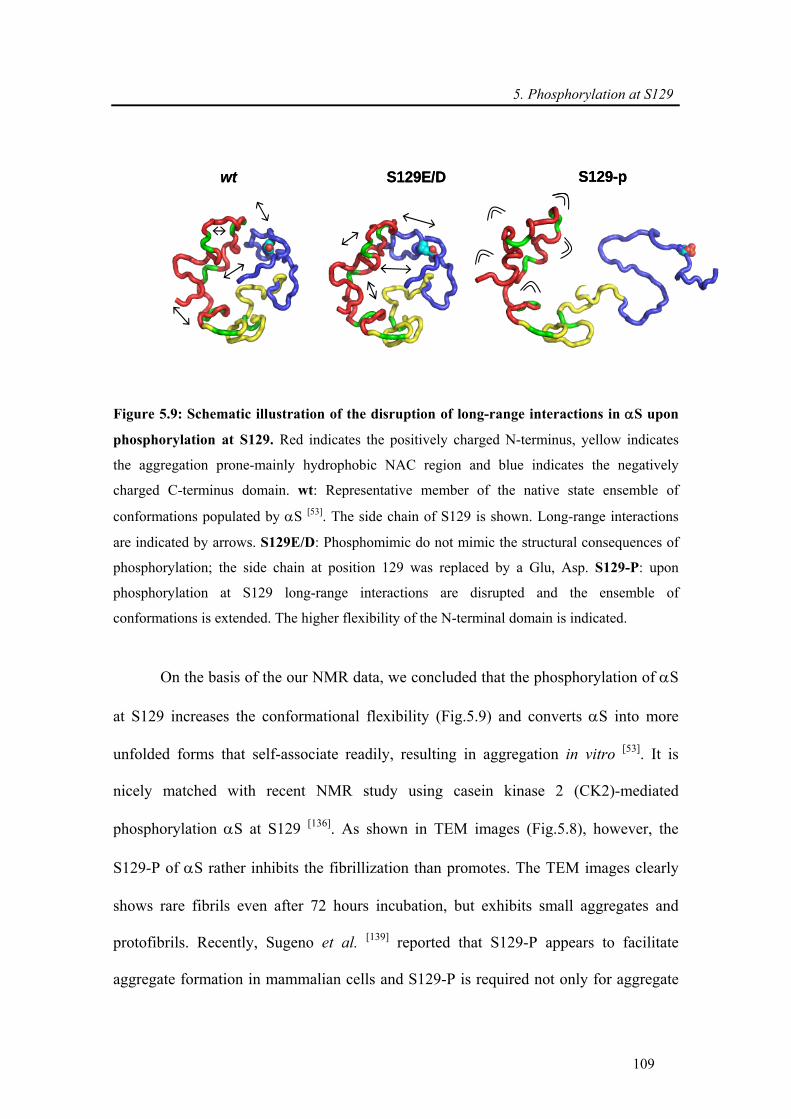
5. Phosphorylation at S129
109
wt S129E/D S129-pwt S129E/D S129-p
Figure 5.9: Schematic illustration of the disruption of long-range interactions in αS upon
phosphorylation at S129. Red indicates the positively charged N-terminus, yellow indicates
the aggregation prone-mainly hydrophobic NAC region and blue indicates the negatively
charged C-terminus domain. wt: Representative member of the native state ensemble of
conformations populated by αS [53]. The side chain of S129 is shown. Long-range interactions
are indicated by arrows. S129E/D: Phosphomimic do not mimic the structural consequences of
phosphorylation; the side chain at position 129 was replaced by a Glu, Asp. S129-P: upon
phosphorylation at S129 long-range interactions are disrupted and the ensemble of
conformations is extended. The higher flexibility of the N-terminal domain is indicated.
On the basis of the our NMR data, we concluded that the phosphorylation of αS
at S129 increases the conformational flexibility (Fig.5.9) and converts αS into more
unfolded forms that self-associate readily, resulting in aggregation in vitro [53]. It is
nicely matched with recent NMR study using casein kinase 2 (CK2)-mediated
phosphorylation αS at S129 [136]. As shown in TEM images (Fig.5.8), however, the
S129-P of αS rather inhibits the fibrillization than promotes. The TEM images clearly
shows rare fibrils even after 72 hours incubation, but exhibits small aggregates and
protofibrils. Recently, Sugeno et al. [139] reported that S129-P appears to facilitate
aggregate formation in mammalian cells and S129-P is required not only for aggregate
5. Phosphorylation at S129
110
formation but also for the induction of αS toxicity. Taken together, the S129-P does not
procduce the fibril but the small aggregates whcih may be important for the toxic effect
of αS, called protofibrils.
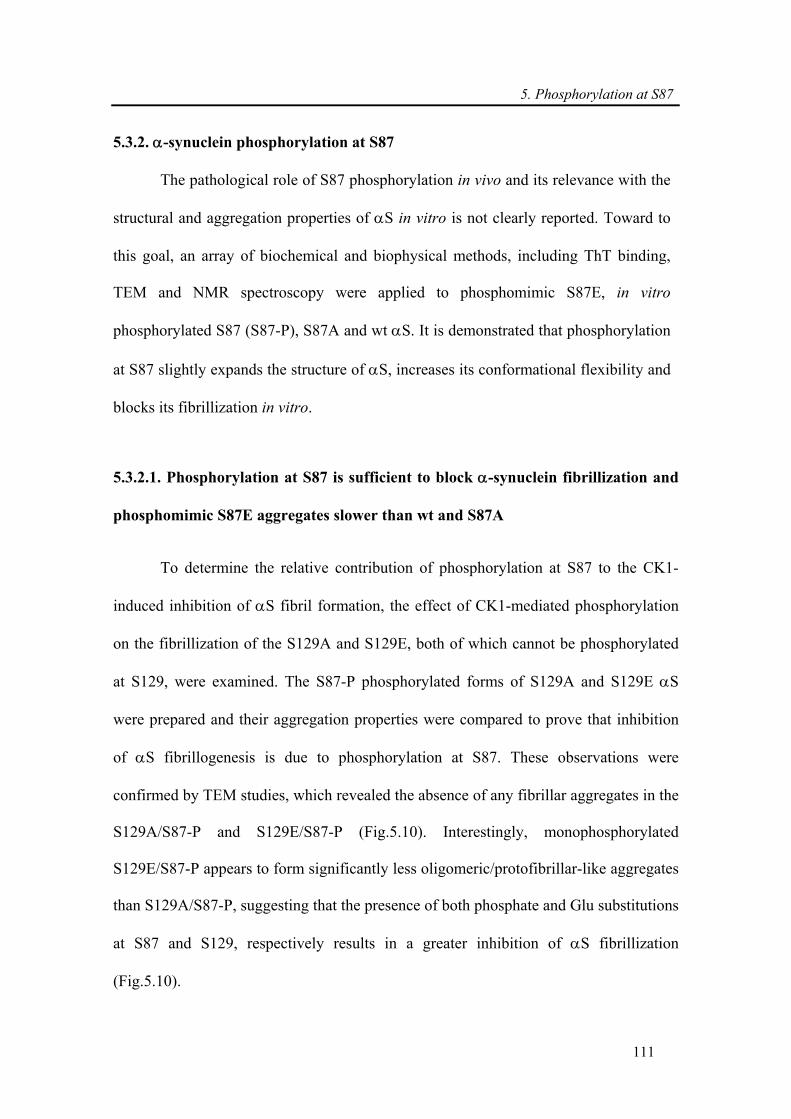
5. Phosphorylation at S87
111
5.3.2. α-synuclein phosphorylation at S87
The pathological role of S87 phosphorylation in vivo and its relevance with the
structural and aggregation properties of αS in vitro is not clearly reported. Toward to
this goal, an array of biochemical and biophysical methods, including ThT binding,
TEM and NMR spectroscopy were applied to phosphomimic S87E, in vitro
phosphorylated S87 (S87-P), S87A and wt αS. It is demonstrated that phosphorylation
at S87 slightly expands the structure of αS, increases its conformational flexibility and
blocks its fibrillization in vitro.
5.3.2.1. Phosphorylation at S87 is sufficient to block α-synuclein fibrillization and
phosphomimic S87E aggregates slower than wt and S87A
To determine the relative contribution of phosphorylation at S87 to the CK1-
induced inhibition of αS fibril formation, the effect of CK1-mediated phosphorylation
on the fibrillization of the S129A and S129E, both of which cannot be phosphorylated
at S129, were examined. The S87-P phosphorylated forms of S129A and S129E αS
were prepared and their aggregation properties were compared to prove that inhibition
of αS fibrillogenesis is due to phosphorylation at S87. These observations were
confirmed by TEM studies, which revealed the absence of any fibrillar aggregates in the
S129A/S87-P and S129E/S87-P (Fig.5.10). Interestingly, monophosphorylated
S129E/S87-P appears to form significantly less oligomeric/protofibrillar-like aggregates
than S129A/S87-P, suggesting that the presence of both phosphate and Glu substitutions
at S87 and S129, respectively results in a greater inhibition of αS fibrillization
(Fig.5.10).
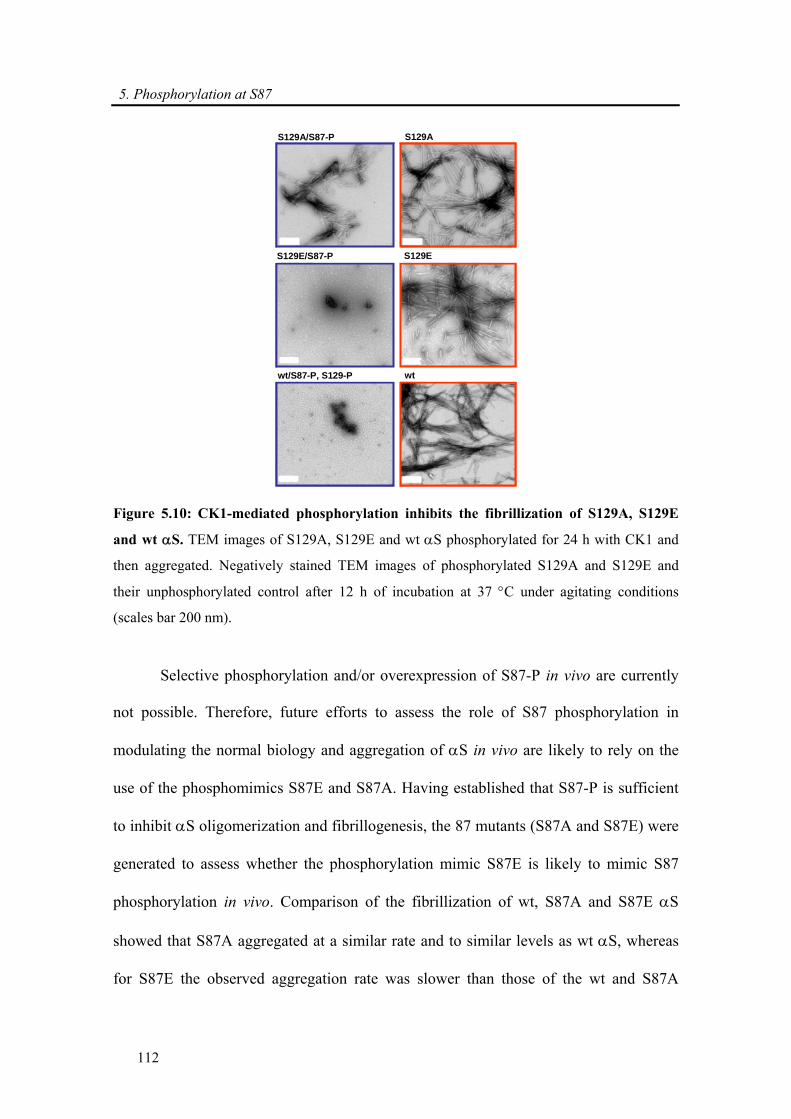
5. Phosphorylation at S87
112
S129A/S87-P S129A
S129E/S87-P S129E
wt/S87-P, S129-P wt
S129A/S87-P S129A
S129E/S87-P S129E
wt/S87-P, S129-P wt
Figure 5.10: CK1-mediated phosphorylation inhibits the fibrillization of S129A, S129E
and wt αS. TEM images of S129A, S129E and wt αS phosphorylated for 24 h with CK1 and
then aggregated. Negatively stained TEM images of phosphorylated S129A and S129E and
their unphosphorylated control after 12 h of incubation at 37 °C under agitating conditions
(scales bar 200 nm).
Selective phosphorylation and/or overexpression of S87-P in vivo are currently
not possible. Therefore, future efforts to assess the role of S87 phosphorylation in
modulating the normal biology and aggregation of αS in vivo are likely to rely on the
use of the phosphomimics S87E and S87A. Having established that S87-P is sufficient
to inhibit αS oligomerization and fibrillogenesis, the 87 mutants (S87A and S87E) were
generated to assess whether the phosphorylation mimic S87E is likely to mimic S87
phosphorylation in vivo. Comparison of the fibrillization of wt, S87A and S87E αS
showed that S87A aggregated at a similar rate and to similar levels as wt αS, whereas
for S87E the observed aggregation rate was slower than those of the wt and S87A
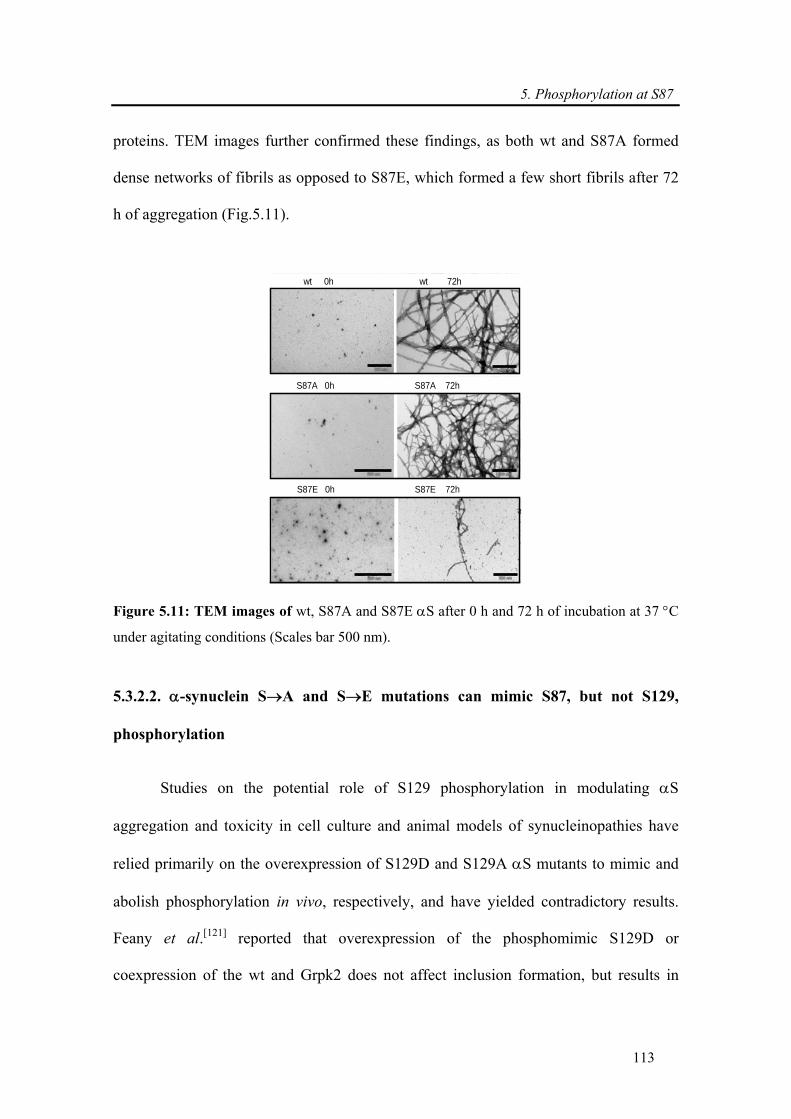
5. Phosphorylation at S87
113
proteins. TEM images further confirmed these findings, as both wt and S87A formed
dense networks of fibrils as opposed to S87E, which formed a few short fibrils after 72
h of aggregation (Fig.5.11).
wt 0h wt 72h
S87A 0h S87A 72h
S87E 0h S87E 72h
wt 0h wt 72h
S87A 0h S87A 72h
S87E 0h S87E 72h
Figure 5.11: TEM images of wt, S87A and S87E αS after 0 h and 72 h of incubation at 37 °C
under agitating conditions (Scales bar 500 nm).
5.3.2.2. α-synuclein S→A and S→E mutations can mimic S87, but not S129,
phosphorylation
Studies on the potential role of S129 phosphorylation in modulating αS
aggregation and toxicity in cell culture and animal models of synucleinopathies have
relied primarily on the overexpression of S129D and S129A αS mutants to mimic and
abolish phosphorylation in vivo, respectively, and have yielded contradictory results.
Feany et al.[121] reported that overexpression of the phosphomimic S129D or
coexpression of the wt and Grpk2 does not affect inclusion formation, but results in
5. Phosphorylation at S87
114
enhanced loss of dopaminergic neurons, whereas overexpression of S129A results in
increased aggregation (4-5 times more than wt αS), yet protects against αS toxicity.
However, recent studies by two independent research groups demonstrated that AAV
mediated overexpression of the S129A in the substantia nigra of rats results in both
increased aggregation and loss of dopaminergic neurons relative to overexpression of wt
and S129D αS [140].
Thus it appears that the increased in vivo aggregation caused by the S129A
mutation (which also promotes αS aggregation in vitro) may lead to toxicity that is
unrelated to its effect in blocking phosphorylation at S129. To properly probe the role of
phosphorylation in vivo, it is essential that mutants designed to abolish phosphorylation
should exhibit aggregation properties similar to that of the wt protein. Similarly,
phosphorylation mimicking mutations should reproduce the structural and functional
consequences of αS phosphorylation. Neither the S129A nor S129D/E mutants fulfill
these criteria as demonstrated by both the in vivo studies cited above and our own recent
in vitro studies.
In contrast, as shown above, the S87A and S87E mutants fulfill these criteria to
a greater extent. Figure 5.11 demonstrates that S87A exhibits similar fibrillization
properties as the wt protein, whereas S87E does not form amyloid fibrils, suggesting
S E substitution at S87 reproduces the effect of phosphorylation on αS aggregation.
Together these findings suggest that overexpression of S87E and S87A mutants should
facilitate in the elucidation of the role of phosphorylating this residue on the normal
physiology and pathogenesis of αS. In the case of blocking phosphorylation at S129,
this could in principle be achieved by identifying S129x mutant that, like S129A, cannot
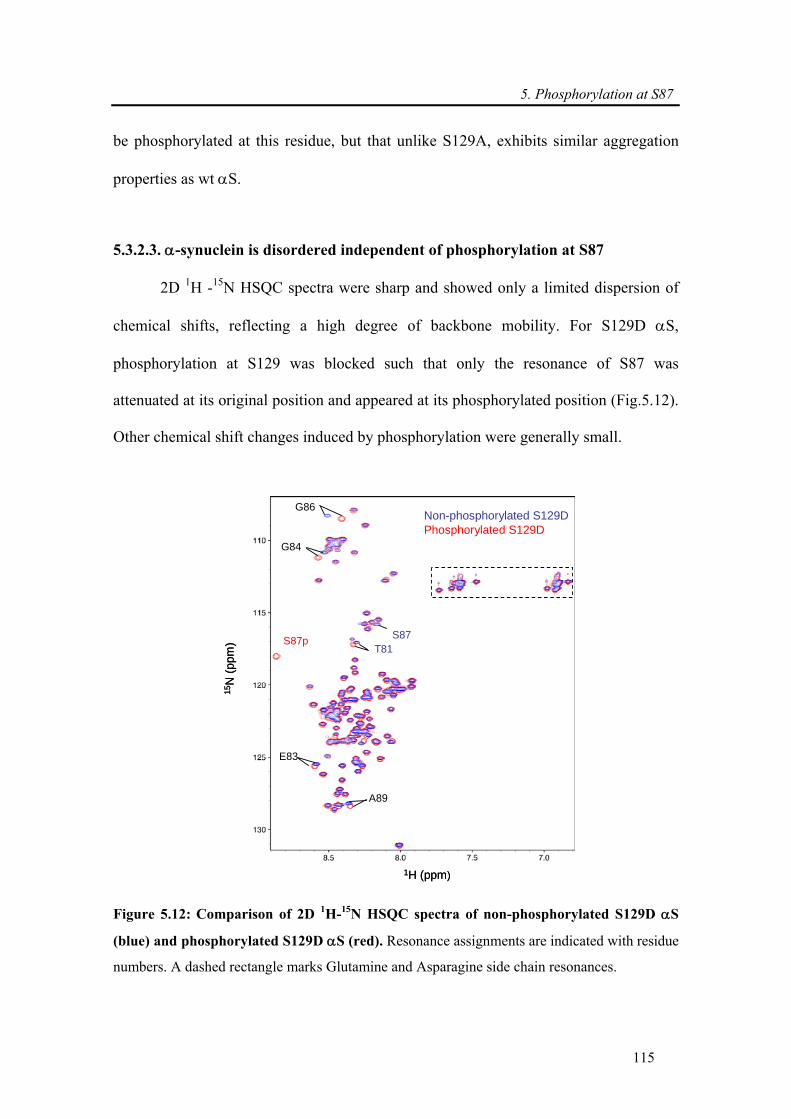
5. Phosphorylation at S87
115
be phosphorylated at this residue, but that unlike S129A, exhibits similar aggregation
properties as wt αS.
5.3.2.3. α-synuclein is disordered independent of phosphorylation at S87
2D 1H -15N HSQC spectra were sharp and showed only a limited dispersion of
chemical shifts, reflecting a high degree of backbone mobility. For S129D αS,
phosphorylation at S129 was blocked such that only the resonance of S87 was
attenuated at its original position and appeared at its phosphorylated position (Fig.5.12).
Other chemical shift changes induced by phosphorylation were generally small.
Non-phosphorylated S129DPhosphorylated S129D
1H (ppm)
15N
(ppm
)
G86
S87p
G84
S87T81
A89
E83
Non-phosphorylated S129DPhosphorylated S129D
1H (ppm)
15N
(ppm
)
G86
S87p
G84
S87T81
A89
E83
Figure 5.12: Comparison of 2D 1H-15N HSQC spectra of non-phosphorylated S129D αS
(blue) and phosphorylated S129D αS (red). Resonance assignments are indicated with residue
numbers. A dashed rectangle marks Glutamine and Asparagine side chain resonances.
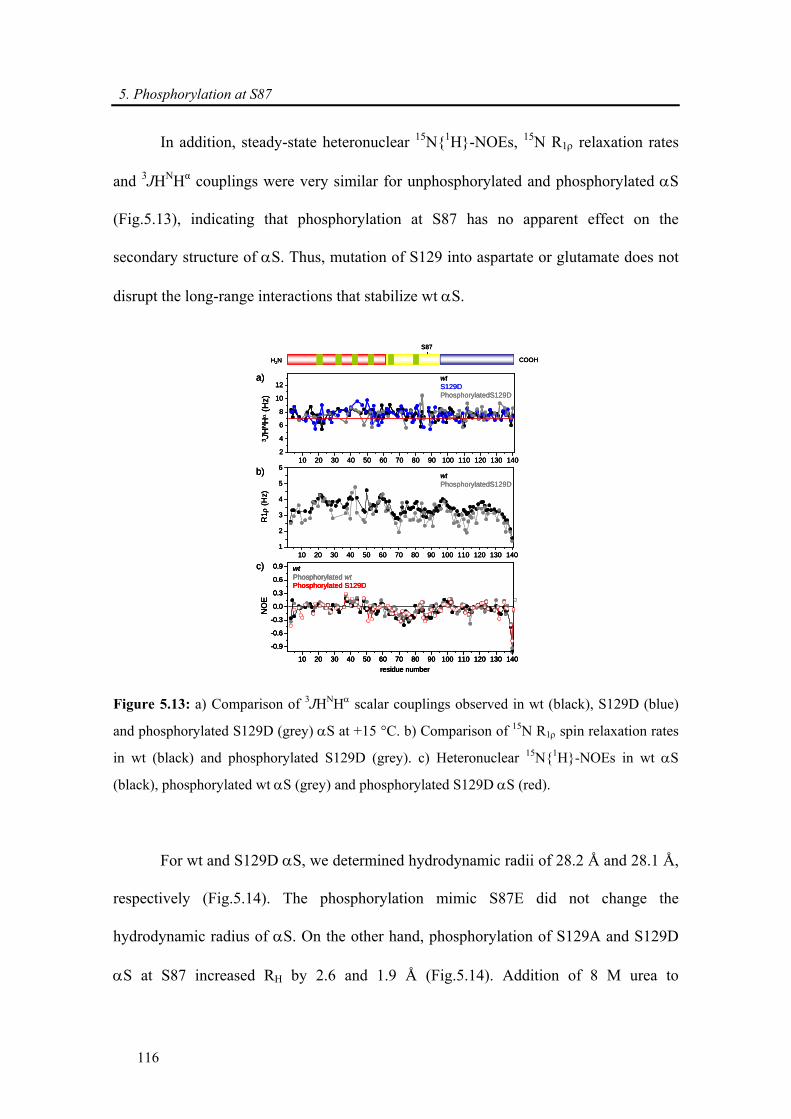
5. Phosphorylation at S87
116
In addition, steady-state heteronuclear 15N{1H}-NOEs, 15N R1ρ relaxation rates
and 3JHNHα couplings were very similar for unphosphorylated and phosphorylated αS
(Fig.5.13), indicating that phosphorylation at S87 has no apparent effect on the
secondary structure of αS. Thus, mutation of S129 into aspartate or glutamate does not
disrupt the long-range interactions that stabilize wt αS.
S87
10 20 30 40 50 60 70 80 90 100 110 120 130 1402
4
6
8
10
12
residue number
NO
E
wt Phosphorylated wtPhosphorylated S129D
10 20 30 40 50 60 70 80 90 100 110 120 130 140
-0.9
-0.6
-0.3
0.0
0.3
0.6
0.9
3 JH
NH
α(H
z)
H2N COOH
R1ρ
(Hz)
10 20 30 40 50 60 70 80 90 100 110 120 130 1401
2
3
4
5
6
wt PhosphorylatedS129D
wt S129DPhosphorylatedS129D
a)
b)
c)
S87S87
10 20 30 40 50 60 70 80 90 100 110 120 130 1402
4
6
8
10
12
residue number
NO
E
wt Phosphorylated wtPhosphorylated S129D
10 20 30 40 50 60 70 80 90 100 110 120 130 140
-0.9
-0.6
-0.3
0.0
0.3
0.6
0.9
3 JH
NH
α(H
z)
H2N COOH
R1ρ
(Hz)
10 20 30 40 50 60 70 80 90 100 110 120 130 1401
2
3
4
5
6
wt PhosphorylatedS129D
wt S129DPhosphorylatedS129D
a)
b)
c)
10 20 30 40 50 60 70 80 90 100 110 120 130 1402
4
6
8
10
12
residue number
NO
E
wt Phosphorylated wtPhosphorylated S129D
10 20 30 40 50 60 70 80 90 100 110 120 130 140
-0.9
-0.6
-0.3
0.0
0.3
0.6
0.9
residue number
NO
E
wt Phosphorylated wtPhosphorylated S129D
10 20 30 40 50 60 70 80 90 100 110 120 130 140
-0.9
-0.6
-0.3
0.0
0.3
0.6
0.9
3 JH
NH
α(H
z)
H2N COOH
R1ρ
(Hz)
10 20 30 40 50 60 70 80 90 100 110 120 130 1401
2
3
4
5
6
wt PhosphorylatedS129D
wt S129DPhosphorylatedS129D
a)
b)
c)
Figure 5.13: a) Comparison of 3JHNHα scalar couplings observed in wt (black), S129D (blue)
and phosphorylated S129D (grey) αS at +15 °C. b) Comparison of 15N R1ρ spin relaxation rates
in wt (black) and phosphorylated S129D (grey). c) Heteronuclear 15N{1H}-NOEs in wt αS
(black), phosphorylated wt αS (grey) and phosphorylated S129D αS (red).
For wt and S129D αS, we determined hydrodynamic radii of 28.2 Å and 28.1 Å,
respectively (Fig.5.14). The phosphorylation mimic S87E did not change the
hydrodynamic radius of αS. On the other hand, phosphorylation of S129A and S129D
αS at S87 increased RH by 2.6 and 1.9 Å (Fig.5.14). Addition of 8 M urea to
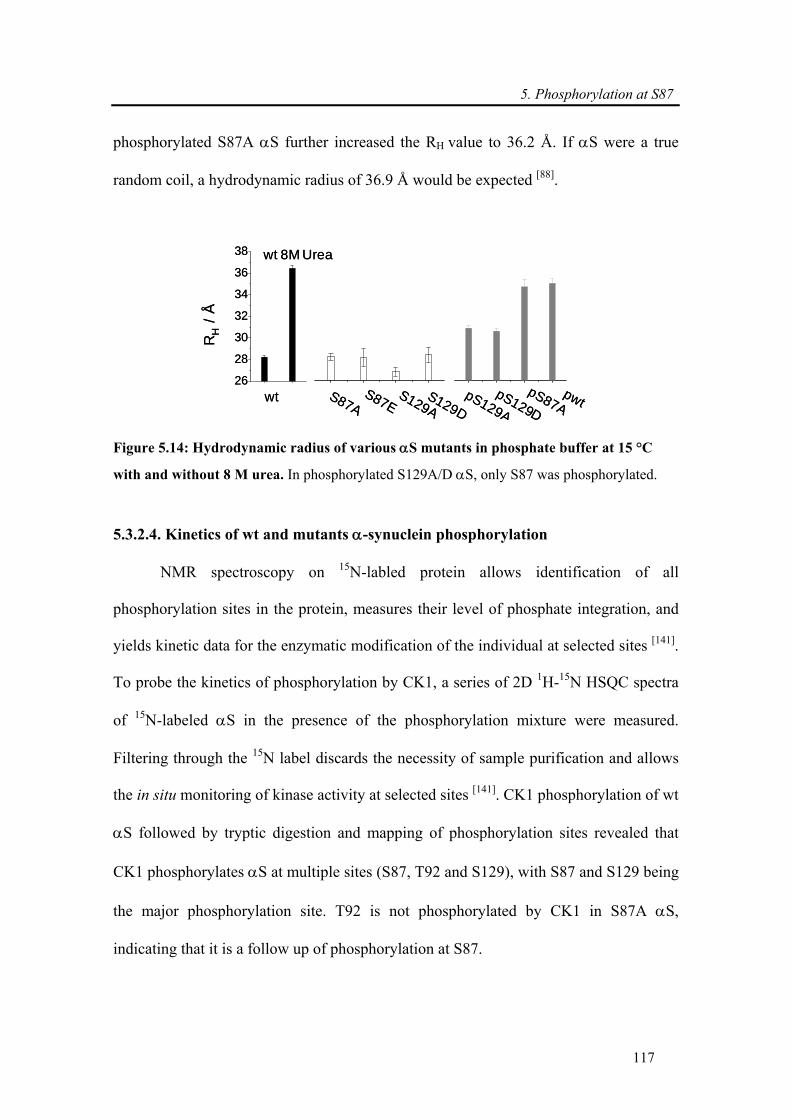
5. Phosphorylation at S87
117
phosphorylated S87A αS further increased the RH value to 36.2 Å. If αS were a true
random coil, a hydrodynamic radius of 36.9 Å would be expected [88].
S129A
RH
/ Å
wt S129DS87A
pwtpS129A
wt 8M Urea
S87EpS87A
26
28
30
32
34
36
38
pS129DS129A
RH
/ Å
wt S129DS87A
pwtpS129A
wt 8M Urea
S87EpS87A
26
28
30
32
34
36
38
pS129D
Figure 5.14: Hydrodynamic radius of various αS mutants in phosphate buffer at 15 °C
with and without 8 M urea. In phosphorylated S129A/D αS, only S87 was phosphorylated.
5.3.2.4. Kinetics of wt and mutants α-synuclein phosphorylation
NMR spectroscopy on 15N-labled protein allows identification of all
phosphorylation sites in the protein, measures their level of phosphate integration, and
yields kinetic data for the enzymatic modification of the individual at selected sites [141].
To probe the kinetics of phosphorylation by CK1, a series of 2D 1H-15N HSQC spectra
of 15N-labeled αS in the presence of the phosphorylation mixture were measured.
Filtering through the 15N label discards the necessity of sample purification and allows
the in situ monitoring of kinase activity at selected sites [141]. CK1 phosphorylation of wt
αS followed by tryptic digestion and mapping of phosphorylation sites revealed that
CK1 phosphorylates αS at multiple sites (S87, T92 and S129), with S87 and S129 being
the major phosphorylation site. T92 is not phosphorylated by CK1 in S87A αS,
indicating that it is a follow up of phosphorylation at S87.
5. Phosphorylation at S87
118
Figure 5.15 shows 1D 1H slices through the center of the S87-P cross peak
observed in 1H-15N HSQC spectra of wt αS. The intensity of the S87-P cross peak
increased rapidly and started to saturate at a phosphate integration level of about 85-
90 % after 2000 to 3000 minutes. A similar behavior was observed for the S87-P cross
peak of S129A and S129D αS (Fig.5.15.c). Detailed comparison of the time
dependence of phosphorylation at S87 in wt, S129A and S129D αS shows that the
kinetics of in vitro phosphorylation by CK1 at S87 is identical for all the three mutants.
A similar approach was applied to study the kinetics of in vitro phosphorylation at S129.
The intensity of the S129-P crosspeak continuously increased in both wt and S87A αS
with increasing exposure time to the phosphorylation mixture (Fig.5.15.b, d). However,
the rate of phosphorylation and the level of phosphate integration were different for wt,
S87E and S87A αS. In wt αS, 75 % of the protein molecules had a phosphate group
attached to S129 after 2000 minutes. In contrast, phosphorylation by CK1 was
significantly slowed down in S87A αS such that only 40 % of protein molecules were
phosphorylated at S129 after 2000 minutes. Interestingly, when S87 was mutated into
S87E the rate of phosphorylation was intermediate to that of wt and S87A αS.
In vitro phosphorylation by CK1 was highly efficient resulting in phosphate
integration of more than 90 % at position S87. Both the levels of phosphate integration
at S87 and its kinetics were not influenced by the state of S129 phosphorylation
(Fig.5.15.c). In contrast, in vitro phosphorylation at S129 is influenced by the
phosphorylation state of S87. When phosphorylation at S87 was blocked by mutation of
this residue into alanine, attachment of a phosphate group to the side chain of S129 was
slowed down dramatically (Fig.5.15.d).
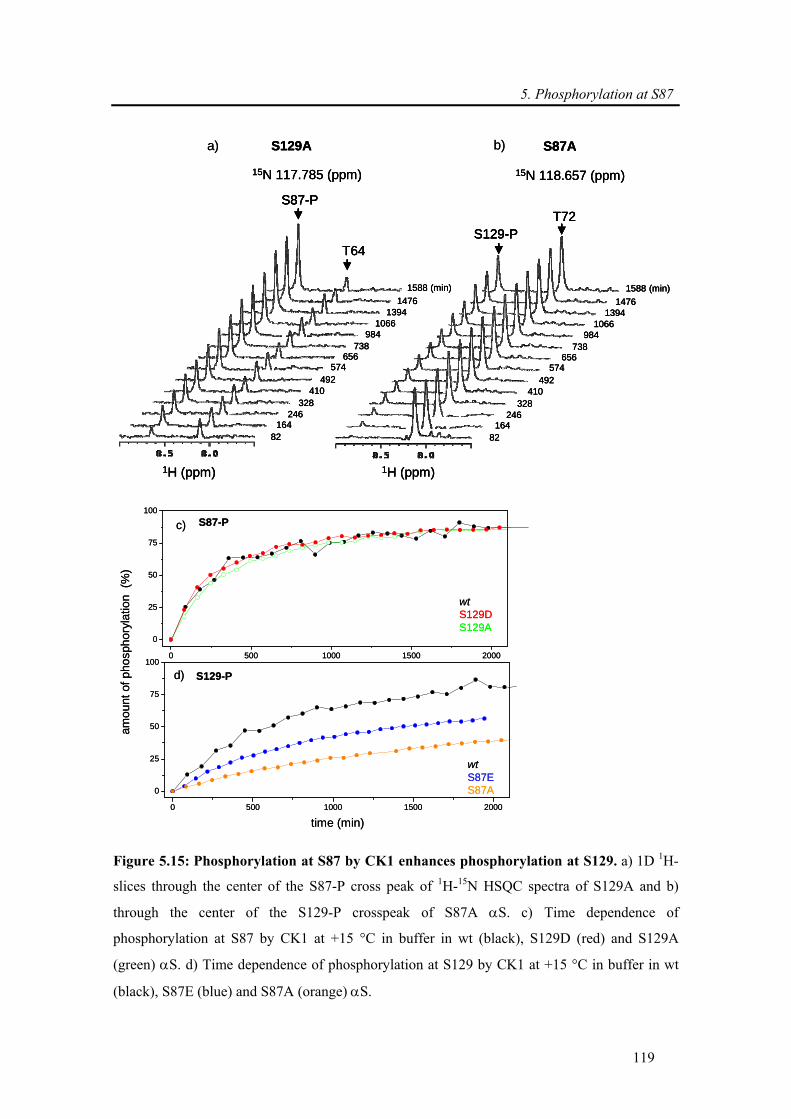
5. Phosphorylation at S87
119
S129A
15N 117.785 (ppm)
S87A
15N 118.657 (ppm)
1H (ppm)
S87-P
T64
1588 (min)
82164
1476
10661394
738984
574656
410492
246328
S129-PT72
1H (ppm)
1588 (min)
82164
1476
10661394
738984
574656
410492
246328
a) b)S129A
15N 117.785 (ppm)
S129A
15N 117.785 (ppm)
S87A
15N 118.657 (ppm)
S87A
15N 118.657 (ppm)
1H (ppm)
S87-P
T64
1588 (min)
82164
1476
10661394
738984
574656
410492
246328
1H (ppm)
S87-PS87-P
T64
1588 (min)
82164
1476
10661394
738984
574656
410492
246328
S129-PT72
1H (ppm)
1588 (min)
82164
1476
10661394
738984
574656
410492
246328
S129-PS129-PT72T72
1H (ppm)
1588 (min)
82164
1476
10661394
738984
574656
410492
246328
a) b)
0 500 1000 1500 2000
0
25
50
75
100
amou
nt o
f pho
spho
ryla
tion
(%)
c)
wt S129DS129A
S87-P
0 500 1000 1500 2000
0
25
50
75
100
d)
wt S87ES87A
S129-P
time (min)
0 500 1000 1500 2000
0
25
50
75
100
amou
nt o
f pho
spho
ryla
tion
(%)
c)
wt S129DS129A
S87-P
0 500 1000 1500 2000
0
25
50
75
100
d)
wt S87ES87A
S129-P
time (min)
Figure 5.15: Phosphorylation at S87 by CK1 enhances phosphorylation at S129. a) 1D 1H-
slices through the center of the S87-P cross peak of 1H-15N HSQC spectra of S129A and b)
through the center of the S129-P crosspeak of S87A αS. c) Time dependence of
phosphorylation at S87 by CK1 at +15 °C in buffer in wt (black), S129D (red) and S129A
(green) αS. d) Time dependence of phosphorylation at S129 by CK1 at +15 °C in buffer in wt
(black), S87E (blue) and S87A (orange) αS.
5. Phosphorylation at S87
120
For S87E αS, the rate of phosphorylation is intermediate between wt and S87A
αS. This suggests that the increased efficiency of in vitro phosphorylation at S129 in the
presence of a phosphate group at position S87 is most likely due to an electrostatic
effect: the two introduced negative charges result in an improved targeting of CK1 to
S129. In addition, our hydrodynamic radius measurements showed that phosphorylation
at S87 slightly expands the ensemble of conformations populated by αS in solution.
Thus, the side chain of S129 might be more accessible to CK1, further enhancing the
targeting of CK1 to S129. As signaling events as well as aggregation critically depend
on the number of phosphorylation sites and the level of modification of any individual
site [142], our data provide support for the importance of S87 for phosphorylation at S129
and its associated effects on aggregation and signaling.
5.3.2.5. Neither S87 nor S129 phosphorylation is required for LBs formation
The finding that majority of αS species within LBs are phosphorylated at S129
gave rise to the hypothesis that phosphorylation at this residue enhances αS fibrillization
and promotes inclusions and LBs formation [119]. However, S129 lies in the highly
negatively charged region of αS, which is disordered and remains accessible to kinases
during the various stages of αS fibrillization including the mature fibrils (Fig.5.16.a).
The co-localization of several kinases and αS within LBs, also the recent studies by
Waxman and Giasson [134], which demonstrated that aggregated αS species are better
substrate for CK1 and CK2 suggest that S129 phosphorylation could easily occur
subsequent to LBs formation. These observations provide strong support for the
hypothesis that phosphorylation at S129 is in fact not a prerequisite for LBs formation
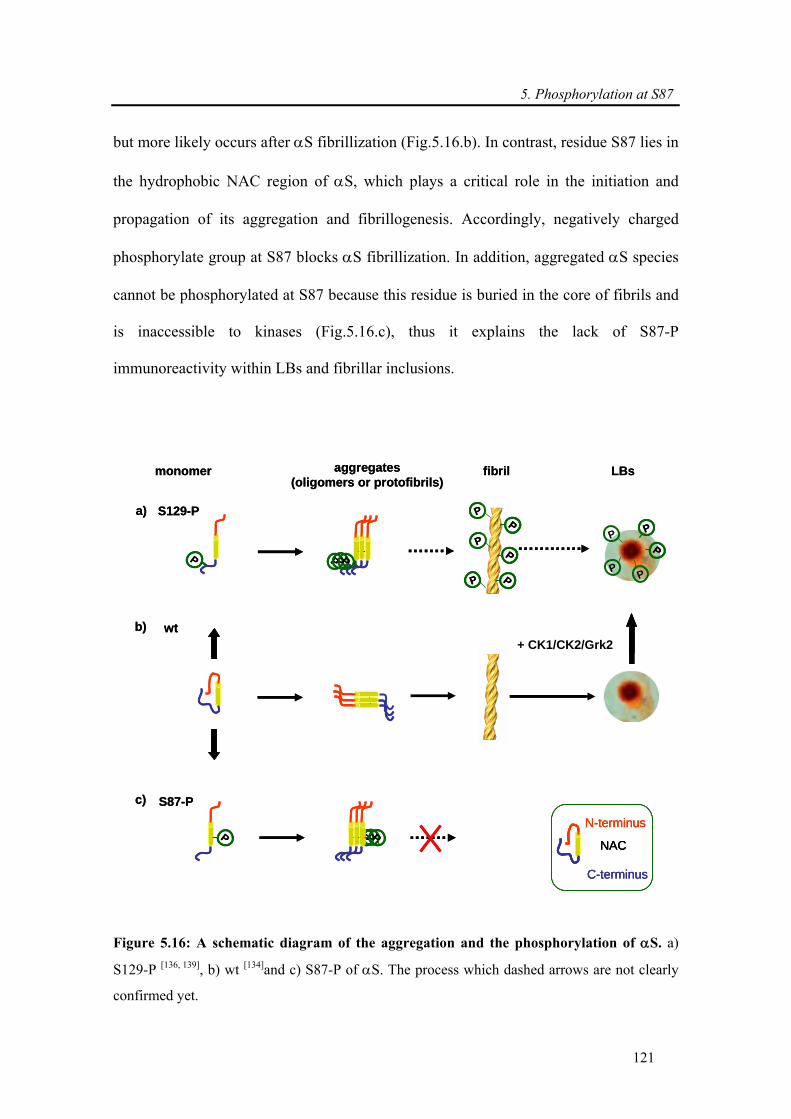
5. Phosphorylation at S87
121
but more likely occurs after αS fibrillization (Fig.5.16.b). In contrast, residue S87 lies in
the hydrophobic NAC region of αS, which plays a critical role in the initiation and
propagation of its aggregation and fibrillogenesis. Accordingly, negatively charged
phosphorylate group at S87 blocks αS fibrillization. In addition, aggregated αS species
cannot be phosphorylated at S87 because this residue is buried in the core of fibrils and
is inaccessible to kinases (Fig.5.16.c), thus it explains the lack of S87-P
immunoreactivity within LBs and fibrillar inclusions.
N-terminus
NAC
C-terminus
S87-P
S129-P
P PPP
b)
c)
a)
+ CK1/CK2/Grk2 wt
P PPPP
PP
P P
P
PP
P
P
P
aggregates(oligomers or protofibrils)
monomer fibril LBs
N-terminus
NAC
C-terminus
N-terminus
NAC
C-terminus
S87-P
S129-P
P PPP
b)
c)
a)
+ CK1/CK2/Grk2 wt
P PPPP
PP
P P
PP
PPP
P P
PP
PPP
PP
P
P
aggregates(oligomers or protofibrils)
monomer fibril LBs
Figure 5.16: A schematic diagram of the aggregation and the phosphorylation of αS. a)
S129-P [136, 139], b) wt [134]and c) S87-P of αS. The process which dashed arrows are not clearly
confirmed yet.
5. Phosphorylation at S87
122
5.4. Conclusion
In summary, above results have demonstrated that phosphorylation at S129 and
S87 increases the conformational flexibility of αS and inhibits, rather than promotes, αS
fibril formation in vitro. The C-terminal region of αS has been implicated in the
majority of αS interactions with proteins [84, 143, 144] and metal ions[145, 146]. Therefore,
phosphorylation at S129 is likely to influence αS affinity to proteins, metals and other
ligands (e.g. dopamine) and alter the biochemical and biological processes regulated by
these interactions. Equally important is our finding that the phosphorylation mimics
(S129E/D) do not reproduce the effect of phosphorylation at this site in αS structure and
aggregation properties in vitro. However, the phosphorylation mimic S87E is able to
mimic the effect of phosphorylation on the aggregation properties of αS in vitro.
These findings highlight the critical importance of the increased negative charge
and/or bulkiness of the phosphate group, relative to the carboxylate of Glu and Asp, in
mediating the structural and functional consequences of phosphorylation. Several
studies have reported that protein-protein interactions mediated by phospho-serines are
abolished when serine is replaced by glutamate. In some of these studies it was shown
that the bulkiness, steric hindrance [147], or conformational changes [148] induced by the
phosphate group, rather than its negative charge, is responsible for the observed effects
of phosphorylation. On this basis, one can speculate that phosphorylation of αS may
constitute an important and specific regulator of αS aggregation and interactions with
other proteins.
5. Phosphorylation at S87
123
Taken all together, these observations have important implications for use of
phosphomimics to elucidate the role of phosphorylation in modulating biological
processes in vivo and underscore the importance of exercising caution when interpreting
results obtained using phospho-mimicking mutants.
6. Bibliography
124
6. Bibliography
[1] F. H. Crick, On protein synthesis, Symp Soc Exp Biol 1958, 12, 138.
[2] F. Crick, Central dogma of molecular biology, Nature 1970, 227, 561.
[3] C. M. Dobson, Protein folding and misfolding, Nature 2003, 426, 884.
[4] C. B. Anfinsen, Principles that govern the folding of protein chains, Science 1973, 181,
223.
[5] C. M. Dobson, M. Karplus, The fundamentals of protein folding: bringing together
theory and experiment, Curr Opin Struct Biol 1999, 9, 92.
[6] A. Fersht, Structure and Mechanism in Protein Science: A Guide to Enzyme Catalysis
and Protein Folding, New York: W H Freeman & Co., 1999.
[7] M. Vendruscolo, E. Paci, M. Karplus, C. M. Dobson, Structures and relative free
energies of partially folded states of proteins, Proc Natl Acad Sci U S A 2003, 100,
14817.
[8] J. N. Onuchic, P. G. Wolynes, Theory of protein folding, Curr Opin Struct Biol 2004,
14, 70.
[9] R. Winter, D. Ropes, S. Grudzielanek, K. Vogtt, Towards an Understanding of the
Temperature/Pressure Configurational and Free-Energy Landscape of Biomolecules, J
Non-Equilib Thermodyn 2007, 32, 41.
[10] R. Mishra, R. Winter, Cold- and Pressure-Induced Dissociation of Protein Aggregates
and Amyloid Fibrils, Angew Chem Int Ed Engl 2008, 47, 6518.
[11] F. Chiti, C. M. Dobson, Protein misfolding, functional amyloid, and human disease,
Annu Rev Biochem 2006, 75, 333.
[12] L. C. Serpell, Alzheimer's amyloid fibrils: structure and assembly, Biochim Biophys
Acta 2000, 1502, 16.
6. Bibliography
125
[13] E. H. Koo, P. T. Lansbury, Jr., J. W. Kelly, Amyloid diseases: abnormal protein
aggregation in neurodegeneration, Proc Natl Acad Sci U S A 1999, 96, 9989.
[14] D. J. Selkoe, Folding proteins in fatal ways, Nature 2003, 426, 900.
[15] A. Lomakin, D. B. Teplow, D. A. Kirschner, G. B. Benedek, Kinetic theory of
fibrillogenesis of amyloid beta-protein, Proc Natl Acad Sci U S A 1997, 94, 7942.
[16] R. Sabate, J. Estelrich, Evidence of the existence of micelles in the fibrillogenesis of
beta-amyloid peptide, J Phys Chem B 2005, 109, 11027.
[17] R. M. Murphy, Peptide aggregation in neurodegenerative disease, Annu Rev Biomed
Eng 2002, 4, 155.
[18] O. S. Makin, E. Atkins, P. Sikorski, J. Johansson, L. C. Serpell, Molecular basis for
amyloid fibril formation and stability, Proc Natl Acad Sci U S A 2005, 102, 315.
[19] H. A. Lashuel, B. M. Petre, J. Wall, M. Simon, R. J. Nowak, T. Walz, P. T. Lansbury,
Jr., Alpha-synuclein, especially the Parkinson's disease-associated mutants, forms pore-
like annular and tubular protofibrils, J Mol Biol 2002, 322, 1089.
[20] H. A. Lashuel, Membrane permeabilization: a common mechanism in protein-
misfolding diseases, Sci Aging Knowledge Environ 2005, 2005, pe28.
[21] M. Goedert, Parkinson's disease and other alpha-synucleinopathies, Clin Chem Lab Med
2001, 39, 308.
[22] J. E. Galvin, K. Uryu, V. M. Lee, J. Q. Trojanowski, Axon pathology in Parkinson's
disease and Lewy body dementia hippocampus contains alpha-, beta-, and gamma-
synuclein, Proc Natl Acad Sci U S A 1999, 96, 13450.
[23] M. G. Spillantini, M. L. Schmidt, V. M. Lee, J. Q. Trojanowski, R. Jakes, M. Goedert,
Alpha-synuclein in Lewy bodies, Nature 1997, 388, 839.
[24] T. M. Dawson, V. L. Dawson, Molecular pathways of neurodegeneration in Parkinson's
disease, Science 2003, 302, 819.
6. Bibliography
126
[25] M. H. Polymeropoulos, C. Lavedan, E. Leroy, S. E. Ide, A. Dehejia, A. Dutra, B. Pike,
H. Root, J. Rubenstein, R. Boyer, E. S. Stenroos, S. Chandrasekharappa, A.
Athanassiadou, T. Papapetropoulos, W. G. Johnson, A. M. Lazzarini, R. C. Duvoisin, G.
Di Iorio, L. I. Golbe, R. L. Nussbaum, Mutation in the alpha-synuclein gene identified
in families with Parkinson's disease, Science 1997, 276, 2045.
[26] R. Kruger, W. Kuhn, T. Muller, D. Woitalla, M. Graeber, S. Kosel, H. Przuntek, J. T.
Epplen, L. Schols, O. Riess, Ala30Pro mutation in the gene encoding alpha-synuclein in
Parkinson's disease, Nat Genet 1998, 18, 106.
[27] A. B. Singleton, M. Farrer, J. Johnson, A. Singleton, S. Hague, J. Kachergus, M.
Hulihan, T. Peuralinna, A. Dutra, R. Nussbaum, S. Lincoln, A. Crawley, M. Hanson, D.
Maraganore, C. Adler, M. R. Cookson, M. Muenter, M. Baptista, D. Miller, J. Blancato,
J. Hardy, K. Gwinn-Hardy, alpha-Synuclein locus triplication causes Parkinson's
disease, Science 2003, 302, 841.
[28] J. J. Zarranz, J. Alegre, J. C. Gomez-Esteban, E. Lezcano, R. Ros, I. Ampuero, L. Vidal,
J. Hoenicka, O. Rodriguez, B. Atares, V. Llorens, E. Gomez Tortosa, T. del Ser, D. G.
Munoz, J. G. de Yebenes, The new mutation, E46K, of alpha-synuclein causes
Parkinson and Lewy body dementia, Ann Neurol 2004, 55, 164.
[29] K. A. Conway, S. J. Lee, J. C. Rochet, T. T. Ding, R. E. Williamson, P. T. Lansbury, Jr.,
Acceleration of oligomerization, not fibrillization, is a shared property of both alpha-
synuclein mutations linked to early-onset Parkinson's disease: implications for
pathogenesis and therapy, Proc Natl Acad Sci U S A 2000, 97, 571.
[30] S. J. Wood, J. Wypych, S. Steavenson, J. C. Louis, M. Citron, A. L. Biere, alpha-
synuclein fibrillogenesis is nucleation-dependent. Implications for the pathogenesis of
Parkinson's disease, J Biol Chem 1999, 274, 19509.
[31] O. M. El-Agnaf, R. Jakes, M. D. Curran, D. Middleton, R. Ingenito, E. Bianchi, A.
Pessi, D. Neill, A. Wallace, Aggregates from mutant and wild-type alpha-synuclein

6. Bibliography
127
proteins and NAC peptide induce apoptotic cell death in human neuroblastoma cells by
formation of beta-sheet and amyloid-like filaments, FEBS Lett 1998, 440, 71.
[32] B. I. Giasson, I. V. Murray, J. Q. Trojanowski, V. M. Lee, A hydrophobic stretch of 12
amino acid residues in the middle of alpha-synuclein is essential for filament assembly,
J Biol Chem 2001, 276, 2380.
[33] J. C. Rochet, K. A. Conway, P. T. Lansbury, Jr., Inhibition of fibrillization and
accumulation of prefibrillar oligomers in mixtures of human and mouse alpha-synuclein,
Biochemistry 2000, 39, 10619.
[34] M. M. Mouradian, Recent advances in the genetics and pathogenesis of Parkinson
disease, Neurology 2002, 58, 179.
[35] F. Meersman, C. M. Dobson, K. Heremans, Protein unfolding, amyloid fibril formation
and configurational energy landscapes under high pressure conditions, Chem Soc Rev
2006, 35, 908.
[36] P. L. Privalov, Cold denaturation of proteins, Crit Rev Biochem Mol Biol 1990, 25, 281.
[37] G. S. Huang, T. G. Oas, Heat and cold denatured states of monomeric lambda repressor
are thermodynamically and conformationally equivalent, Biochemistry 1996, 35, 6173.
[38] P. L. Privalov, V. Griko Yu, S. Venyaminov, V. P. Kutyshenko, Cold denaturation of
myoglobin, J Mol Biol 1986, 190, 487.
[39] J. J. Skalicky, D. K. Sukumaran, J. L. Mills, T. Szyperski, Toward Structural Biology in
Supercooled Water, J. Am. Chem. Soc. 2000, 122, 3230.
[40] H. Y. Kim, M. K. Cho, D. Riedel, C. O. Fernandez, M. Zweckstetter, Dissociation of
amyloid fibrils of alpha-synuclein in supercooled water, Angew Chem Int Ed Engl 2008,
47, 5046.
[41] Y. Li, B. Shan, D. P. Raleigh, The cold denatured state is compact but expands at low
temperatures: hydrodynamic properties of the cold denatured state of the C-terminal
domain of L9, J Mol Biol 2007, 368, 256.
6. Bibliography
128
[42] C. R. Babu, V. J. Hilser, A. J. Wand, Direct access to the cooperative substructure of
proteins and the protein ensemble via cold denaturation, Nat Struct Mol Biol 2004, 11,
352.
[43] F. Bloch, Nuclear Induction, Physical Review 1946, 70, 460.
[44] E. M. Purcell, H. C. Torrey, R. V. Pound, Resonance Absorption by Nuclear Magnetic
Moments in a Solid, Physical Review 1946, 69, 37.
[45] M. Sattler, J. g. Schleucher, C. Griesinger, Heteronuclear multidimensional NMR
experiments for the structure determination of proteins in solution employing pulsed
field gradients, Progress in Nuclear Magnetic Resonance Spectroscopy 1999, 34, 93.
[46] M. Karplus, Vicinal proton coupling in nuclear magnetic resonance, Journal of the
American Chemical Society 1963, 85, 2870.
[47] H. Schwalbe, K. M. Fiebig, M. Buck, J. A. Jones, S. B. Grimshaw, A. Spencer, S. J.
Glaser, L. J. Smith, C. M. Dobson, Structural and dynamical properties of a denatured
protein. Heteronuclear 3D NMR experiments and theoretical simulations of lysozyme in
8 M urea, Biochemistry 1997, 36, 8977.
[48] D. S. Wishart, B. D. Sykes, Chemical shifts as a tool for structure determination,
Methods Enzymol 1994, 239, 363.
[49] J. Jeener, B. H. Meier, P. Bachmann, R. R. Ernst, Investigation of exchange processes
by two-dimensional NMR spectroscopy, The Journal of Chemical Physics 1979, 71,
4546.
[50] K. Wütrich, NMR of proteins and nucleic acids, Wiley-Interscience, New York, 1986.
[51] J. L. Battiste, G. Wagner, Utilization of site-directed spin labeling and high-resolution
heteronuclear nuclear magnetic resonance for global fold determination of large
proteins with limited nuclear overhauser effect data, Biochemistry 2000, 39, 5355.
[52] P. A. Kosen, Spin labeling of proteins, Methods Enzymol 1989, 177, 86.
6. Bibliography
129
[53] C. W. Bertoncini, Y. S. Jung, C. O. Fernandez, W. Hoyer, C. Griesinger, T. M. Jovin,
M. Zweckstetter, Release of long-range tertiary interactions potentiates aggregation of
natively unstructured alpha-synuclein, Proc Natl Acad Sci U S A 2005, 102, 1430.
[54] E. O. Stejskal, J. E. Tanner, Spin Diffusion Measurements - Spin Echoes In Presence Of
A Time-Dependent Field Gradient, J Chem Phys 1965, 42, 288.
[55] P. Bernado, J. Garcia de la Torre, M. Pons, Macromolecular crowding in biological
systems: hydrodynamics and NMR methods, J Mol Recognit 2004, 17, 397.
[56] J. A. Jones, D. K. Wilkins, L. J. Smith, C. M. Dobson, Characterisation of protein
unfolding by NMR diffusion measurements, J Biomol NMR 1997, 10, 199.
[57] D. K. Wilkins, S. B. Grimshaw, V. Receveur, C. M. Dobson, J. A. Jones, L. J. Smith,
Hydrodynamic radii of native and denatured proteins measured by pulse field gradient
NMR techniques, Biochemistry 1999, 38, 16424.
[58] M. Masuda, N. Dohmae, T. Nonaka, T. Oikawa, S. Hisanaga, M. Goedert, M.
Hasegawa, Cysteine misincorporation in bacterially expressed human alpha-synuclein,
FEBS Lett 2006, 580, 1775.
[59] S. Der Sarkissian, E. L. Marchand, D. Duguay, P. Hamet, D. deBlois, Reversal of
interstitial fibroblast hyperplasia via apoptosis in hypertensive rat heart with valsartan
or enalapril, Cardiovasc Res 2003, 57, 775.
[60] D. M. Walsh, D. M. Hartley, Y. Kusumoto, Y. Fezoui, M. M. Condron, A. Lomakin, G.
B. Benedek, D. J. Selkoe, D. B. Teplow, Amyloid beta-protein fibrillogenesis. Structure
and biological activity of protofibrillar intermediates, J Biol Chem 1999, 274, 25945.
[61] H. LeVine, 3rd, Thioflavine T interaction with synthetic Alzheimer's disease beta-
amyloid peptides: detection of amyloid aggregation in solution, Protein Sci 1993, 2, 404.
[62] R. Kayed, E. Head, J. L. Thompson, T. M. McIntire, S. C. Milton, C. W. Cotman, C. G.
Glabe, Common structure of soluble amyloid oligomers implies common mechanism of
pathogenesis, Science 2003, 300, 486.
6. Bibliography
130
[63] R. Benz, K. Janko, W. Boos, P. Lauger, Formation of large, ion-permeable membrane
channels by the matrix protein (porin) of Escherichia coli, Biochim Biophys Acta 1978,
511, 305.
[64] R. Benz, K. Janko, P. Lauger, Ionic selectivity of pores formed by the matrix protein
(porin) of Escherichia coli, Biochim Biophys Acta 1979, 551, 238.
[65] R. Benz, E. Maier, D. Ladant, A. Ullmann, P. Sebo, Adenylate cyclase toxin (CyaA) of
Bordetella pertussis. Evidence for the formation of small ion-permeable channels and
comparison with HlyA of Escherichia coli, J Biol Chem 1994, 269, 27231.
[66] F. Delaglio, S. Grzesiek, G. W. Vuister, G. Zhu, J. Pfeifer, A. Bax, NMRPipe: a
multidimensional spectral processing system based on UNIX pipes, J Biomol NMR
1995, 6, 277.
[67] B. A. Johnson, R. A. Blevins, NMRView: A computer program for the visualization
and analysis of NMR data, J. Biomolecular NMR 1994, 4, 603.
[68] G. Bodenhausen, D. J. Ruben, Natural abundance 15N NMR by enhanced heteronuclear
spectroscopy, Chem. Phys. Lett. 1980, 69, 185.
[69] P. K. Mandal, A. Majumdar, A comprehensive discussion of HSQC and HMQC pulse
sequences, Conc Mag Res 2004, A, 1.
[70] J. W. Peng, G. Wagner, Investigation of protein motions via relaxation measurements,
Methods Enzymol 1994, 239, 563.
[71] N. A. Farrow, R. Muhandiram, A. U. Singer, S. M. Pascal, C. M. Kay, G. Gish, S. E.
Shoelson, T. Pawson, J. D. Forman-Kay, L. E. Kay, Backbone dynamics of a free and
phosphopeptide-complexed Src homology 2 domain studied by 15N NMR relaxation,
Biochemistry 1994, 33, 5984.
[72] J. Cavanagh, Protein NMR spectroscopy : principles and practice, 2nd ed., Academic
Press, Amsterdam ; Boston, 2007.
6. Bibliography
131
[73] D. S. Wishart, C. G. Bigam, J. Yao, F. Abildgaard, H. J. Dyson, E. Oldfield, J. L.
Markley, B. D. Sykes, 1H, 13C and 15N chemical shift referencing in biomolecular
NMR, J Biomol NMR 1995, 6, 135.
[74] D. J. Craik, J. A. Wilce, Studies of protein-ligand interactions by NMR, Methods Mol
Biol 1997, 60, 195.
[75] J. Hardy, D. J. Selkoe, The amyloid hypothesis of Alzheimer's disease: progress and
problems on the road to therapeutics, Science 2002, 297, 353.
[76] J. C. Rochet, P. T. Lansbury, Jr., Amyloid fibrillogenesis: themes and variations, Curr
Opin Struct Biol 2000, 10, 60.
[77] M. Sunde, L. C. Serpell, M. Bartlam, P. E. Fraser, M. B. Pepys, C. C. Blake, Common
core structure of amyloid fibrils by synchrotron X-ray diffraction, J Mol Biol 1997, 273,
729.
[78] J. W. Kelly, The alternative conformations of amyloidogenic proteins and their multi-
step assembly pathways, Curr Opin Struct Biol 1998, 8, 101.
[79] V. N. Uversky, A. L. Fink, Conformational constraints for amyloid fibrillation: the
importance of being unfolded, Biochim Biophys Acta 2004, 1698, 131.
[80] M. Fandrich, V. Forge, K. Buder, M. Kittler, C. M. Dobson, S. Diekmann, Myoglobin
forms amyloid fibrils by association of unfolded polypeptide segments, Proc Natl Acad
Sci U S A 2003, 100, 15463.
[81] R. Tycko, Molecular structure of amyloid fibrils: insights from solid-state NMR, Q Rev
Biophys 2006, 39, 1.
[82] F. Chiti, M. Stefani, N. Taddei, G. Ramponi, C. M. Dobson, Rationalization of the
effects of mutations on peptide and protein aggregation rates, Nature 2003, 424, 805.
[83] A. M. Fernandez-Escamilla, F. Rousseau, J. Schymkowitz, L. Serrano, Prediction of
sequence-dependent and mutational effects on the aggregation of peptides and proteins,
Nat Biotechnol 2004, 22, 1302.
6. Bibliography
132
[84] C. O. Fernandez, W. Hoyer, M. Zweckstetter, E. A. Jares-Erijman, V. Subramaniam, C.
Griesinger, T. M. Jovin, NMR of alpha-synuclein-polyamine complexes elucidates the
mechanism and kinetics of induced aggregation, Embo J 2004, 23, 2039.
[85] M. Zweckstetter, A. Bax, Single-step determination of protein substructures using
dipolar couplings: aid to structural genomics, J Am Chem Soc 2001, 123, 9490.
[86] R. Bussell, Jr., D. Eliezer, Residual structure and dynamics in Parkinson's disease-
associated mutants of alpha-synuclein, J Biol Chem 2001, 276, 45996.
[87] S. Schwarzinger, G. J. Kroon, T. R. Foss, J. Chung, P. E. Wright, H. J. Dyson,
Sequence-dependent correction of random coil NMR chemical shifts, J Am Chem Soc
2001, 123, 2970.
[88] J. E. Kohn, I. S. Millett, J. Jacob, B. Zagrovic, T. M. Dillon, N. Cingel, R. S. Dothager,
S. Seifert, P. Thiyagarajan, T. R. Sosnick, M. Z. Hasan, V. S. Pande, I. Ruczinski, S.
Doniach, K. W. Plaxco, Random-coil behavior and the dimensions of chemically
unfolded proteins, Proc Natl Acad Sci U S A 2004, 101, 12491.
[89] M. D. Mukrasch, J. Biernat, M. von Bergen, C. Griesinger, E. Mandelkow, M.
Zweckstetter, Sites of tau important for aggregation populate {beta}-structure and bind
to microtubules and polyanions, J Biol Chem 2005, 280, 24978.
[90] J. Wirmer, C. Schlorb, J. Klein-Seetharaman, R. Hirano, T. Ueda, T. Imoto, H.
Schwalbe, Modulation of compactness and long-range interactions of unfolded
lysozyme by single point mutations, Angew Chem Int Ed Engl 2004, 43, 5780.
[91] L. Hou, H. Shao, Y. Zhang, H. Li, N. K. Menon, E. B. Neuhaus, J. M. Brewer, I. J.
Byeon, D. G. Ray, M. P. Vitek, T. Iwashita, R. A. Makula, A. B. Przybyla, M. G.
Zagorski, Solution NMR studies of the A beta(1-40) and A beta(1-42) peptides establish
that the Met35 oxidation state affects the mechanism of amyloid formation, J Am Chem
Soc 2004, 126, 1992.
6. Bibliography
133
[92] J. Danielsson, A. Andersson, J. Jarvet, A. Graslund, 15N relaxation study of the
amyloid beta-peptide: structural propensities and persistence length, Magn Reson Chem
2006, 44 Spec No, S114.
[93] H. Heise, W. Hoyer, S. Becker, O. C. Andronesi, D. Riedel, M. Baldus, Molecular-level
secondary structure, polymorphism, and dynamics of full-length alpha-synuclein fibrils
studied by solid-state NMR, Proc Natl Acad Sci U S A 2005, 102, 15871.
[94] P. Permi, I. Kilpelainen, A. Annila, S. Heikkinen, Intensity modulated HSQC and
HMQC: two simple methods to measure 3J(HNH)alpha in proteins, J Biomol NMR
2000, 16, 29.
[95] G. Cornilescu, F. Delaglio, A. Bax, Protein backbone angle restraints from searching a
database for chemical shift and sequence homology, J Biomol NMR 1999, 13, 289.
[96] A. Lange, S. Luca, M. Baldus, Structural constraints from proton-mediated rare-spin
correlation spectroscopy in rotating solids, J Am Chem Soc 2002, 124, 9704.
[97] A. Lange, K. Seidel, L. Verdier, S. Luca, M. Baldus, Analysis of proton-proton transfer
dynamics in rotating solids and their use for 3D structure determination, J Am Chem
Soc 2003, 125, 12640.
[98] M. Vilar, H. T. Chou, T. Luhrs, S. K. Maji, D. Riek-Loher, R. Verel, G. Manning, H.
Stahlberg, R. Riek, The fold of alpha-synuclein fibrils, Proc Natl Acad Sci U S A 2008,
105, 8637.
[99] M. Sunde, C. Blake, The structure of amyloid fibrils by electron microscopy and X-ray
diffraction, Adv Protein Chem 1997, 50, 123.
[100] T. P. Knowles, A. W. Fitzpatrick, S. Meehan, H. R. Mott, M. Vendruscolo, C. M.
Dobson, M. E. Welland, Role of intermolecular forces in defining material properties of
protein nanofibrils, Science 2007, 318, 1900.
6. Bibliography
134
[101] F. Meersman, C. M. Dobson, Probing the pressure-temperature stability of amyloid
fibrils provides new insights into their molecular properties, Biochim Biophys Acta
2006, 1764, 452.
[102] D. Foguel, M. C. Suarez, A. D. Ferrao-Gonzales, T. C. Porto, L. Palmieri, C. M.
Einsiedler, L. R. Andrade, H. A. Lashuel, P. T. Lansbury, J. W. Kelly, J. L. Silva,
Dissociation of amyloid fibrils of alpha-synuclein and transthyretin by pressure reveals
their reversible nature and the formation of water-excluded cavities, Proc Natl Acad Sci
U S A 2003, 100, 9831.
[103] J. F. Smith, T. P. Knowles, C. M. Dobson, C. E. Macphee, M. E. Welland,
Characterization of the nanoscale properties of individual amyloid fibrils, Proc Natl
Acad Sci U S A 2006, 103, 15806.
[104] V. A. Iconomidou, G. Vriend, S. J. Hamodrakas, Amyloids protect the silkmoth oocyte
and embryo, FEBS Lett 2000, 479, 141.
[105] I. W. Hamley, Peptide fibrillization, Angew Chem Int Ed Engl 2007, 46, 8128.
[106] L. Poppe, H. van Halbeek, NMR spectroscopy of hydroxyl protons in supercooled
carbohydrates, Nat Struct Biol 1994, 1, 215.
[107] R. Nelson, M. R. Sawaya, M. Balbirnie, A. O. Madsen, C. Riekel, R. Grothe, D.
Eisenberg, Structure of the cross-beta spine of amyloid-like fibrils, Nature 2005, 435,
773.
[108] P. Picotti, G. De Franceschi, E. Frare, B. Spolaore, M. Zambonin, F. Chiti, P. P. de
Laureto, A. Fontana, Amyloid fibril formation and disaggregation of fragment 1-29 of
apomyoglobin: insights into the effect of pH on protein fibrillogenesis, J Mol Biol 2007,
367, 1237.
[109] F. Mallamace, M. Broccio, C. Corsaro, A. Faraone, D. Majolino, V. Venuti, L. Liu, C.
Y. Mou, S. H. Chen, Evidence of the existence of the low-density liquid phase in
supercooled, confined water, Proc Natl Acad Sci U S A 2007, 104, 424.
6. Bibliography
135
[110] H. J. Dyson, P. E. Wright, Unfolded proteins and protein folding studied by NMR,
Chem Rev 2004, 104, 3607.
[111] H. Y. Kim, H. Heise, C. O. Fernandez, M. Baldus, M. Zweckstetter, Correlation of
amyloid fibril beta-structure with the unfolded state of alpha-synuclein, Chembiochem
2007, 8, 1671.
[112] S. Chimon, M. A. Shaibat, C. R. Jones, D. C. Calero, B. Aizezi, Y. Ishii, Evidence of
fibril-like beta-sheet structures in a neurotoxic amyloid intermediate of Alzheimer's
beta-amyloid, Nat Struct Mol Biol 2007.
[113] D. E. Ehrnhoefer, J. Bieschke, A. Boeddrich, M. Herbst, L. Masino, R. Lurz, S.
Engemann, A. Pastore, E. E. Wanker, EGCG redirects amyloidogenic polypeptides into
unstructured, off-pathway oligomers, Nat Struct Mol Biol 2008, 15, 558.
[114] C. G. Glabe, Common mechanisms of amyloid oligomer pathogenesis in degenerative
disease, Neurobiol Aging 2006, 27, 570.
[115] M. J. Volles, P. T. Lansbury, Jr., Zeroing in on the pathogenic form of alpha-synuclein
and its mechanism of neurotoxicity in Parkinson's disease, Biochemistry 2003, 42, 7871.
[116] T. T. Ding, S. J. Lee, J. C. Rochet, P. T. Lansbury, Jr., Annular alpha-synuclein
protofibrils are produced when spherical protofibrils are incubated in solution or bound
to brain-derived membranes, Biochemistry 2002, 41, 10209.
[117] S. D. Zakharov, J. D. Hulleman, E. A. Dutseva, Y. N. Antonenko, J. C. Rochet, W. A.
Cramer, Helical alpha-synuclein forms highly conductive ion channels, Biochemistry
2007, 46, 14369.
[118] P. Dustin, Microtubules, Springer, Berlin, 1984.
[119] H. Fujiwara, M. Hasegawa, N. Dohmae, A. Kawashima, E. Masliah, M. S. Goldberg, J.
Shen, K. Takio, T. Iwatsubo, alpha-Synuclein is phosphorylated in synucleinopathy
lesions, Nat Cell Biol 2002, 4, 160.
6. Bibliography
136
[120] J. P. Anderson, D. E. Walker, J. M. Goldstein, R. de Laat, K. Banducci, R. J.
Caccavello, R. Barbour, J. Huang, K. Kling, M. Lee, L. Diep, P. S. Keim, X. Shen, T.
Chataway, M. G. Schlossmacher, P. Seubert, D. Schenk, S. Sinha, W. P. Gai, T. J.
Chilcote, Phosphorylation of Ser-129 is the dominant pathological modification of
alpha-synuclein in familial and sporadic Lewy body disease, J Biol Chem 2006, 281,
29739.
[121] L. Chen, M. B. Feany, Alpha-synuclein phosphorylation controls neurotoxicity and
inclusion formation in a Drosophila model of Parkinson disease, Nat Neurosci 2005, 8,
657.
[122] P. J. Kahle, M. Neumann, L. Ozmen, V. Muller, H. Jacobsen, W. Spooren, B. Fuss, B.
Mallon, W. B. Macklin, H. Fujiwara, M. Hasegawa, T. Iwatsubo, H. A. Kretzschmar, C.
Haass, Hyperphosphorylation and insolubility of alpha-synuclein in transgenic mouse
oligodendrocytes, EMBO Rep 2002, 3, 583.
[123] M. Takahashi, H. Kanuka, H. Fujiwara, A. Koyama, M. Hasegawa, M. Miura, T.
Iwatsubo, Phosphorylation of alpha-synuclein characteristic of synucleinopathy lesions
is recapitulated in alpha-synuclein transgenic Drosophila, Neurosci Lett 2003, 336, 155.
[124] C. Lo Bianco, J. L. Ridet, B. L. Schneider, N. Deglon, P. Aebischer, alpha -
Synucleinopathy and selective dopaminergic neuron loss in a rat lentiviral-based model
of Parkinson's disease, Proc Natl Acad Sci U S A 2002, 99, 10813.
[125] M. Yamada, T. Iwatsubo, Y. Mizuno, H. Mochizuki, Overexpression of alpha-synuclein
in rat substantia nigra results in loss of dopaminergic neurons, phosphorylation of
alpha-synuclein and activation of caspase-9: resemblance to pathogenetic changes in
Parkinson's disease, J Neurochem 2004, 91, 451.
[126] W. W. Smith, R. L. Margolis, X. Li, J. C. Troncoso, M. K. Lee, V. L. Dawson, T. M.
Dawson, T. Iwatsubo, C. A. Ross, Alpha-synuclein phosphorylation enhances
6. Bibliography
137
eosinophilic cytoplasmic inclusion formation in SH-SY5Y cells, J Neurosci 2005, 25,
5544.
[127] M. Okochi, J. Walter, A. Koyama, S. Nakajo, M. Baba, T. Iwatsubo, L. Meijer, P. J.
Kahle, C. Haass, Constitutive phosphorylation of the Parkinson's disease associated
alpha-synuclein, J Biol Chem 2000, 275, 390.
[128] A. N. Pronin, A. J. Morris, A. Surguchov, J. L. Benovic, Synucleins are a novel class of
substrates for G protein-coupled receptor kinases, J Biol Chem 2000, 275, 26515.
[129] E. J. Kim, J. Y. Sung, H. J. Lee, H. Rhim, M. Hasegawa, T. Iwatsubo, S. Min do, J.
Kim, S. R. Paik, K. C. Chung, Dyrk1A phosphorylates alpha-synuclein and enhances
intracellular inclusion formation, J Biol Chem 2006, 281, 33250.
[130] C. E. Ellis, P. L. Schwartzberg, T. L. Grider, D. W. Fink, R. L. Nussbaum, alpha-
synuclein is phosphorylated by members of the Src family of protein-tyrosine kinases, J
Biol Chem 2001, 276, 3879.
[131] B. H. Ahn, H. Rhim, S. Y. Kim, Y. M. Sung, M. Y. Lee, J. Y. Choi, B. Wolozin, J. S.
Chang, Y. H. Lee, T. K. Kwon, K. C. Chung, S. H. Yoon, S. J. Hahn, M. S. Kim, Y. H.
Jo, D. S. Min, alpha-Synuclein interacts with phospholipase D isozymes and inhibits
pervanadate-induced phospholipase D activation in human embryonic kidney-293 cells,
J Biol Chem 2002, 277, 12334.
[132] T. Nakamura, H. Yamashita, T. Takahashi, S. Nakamura, Activated Fyn phosphorylates
alpha-synuclein at tyrosine residue 125, Biochem Biophys Res Commun 2001, 280,
1085.
[133] A. Negro, A. M. Brunati, A. Donella-Deana, M. L. Massimino, L. A. Pinna, Multiple
phosphorylation of alpha-synuclein by protein tyrosine kinase Syk prevents eosin-
induced aggregation, Faseb J 2002, 16, 210.
[134] E. A. Waxman, B. I. Giasson, Specificity and regulation of casein kinase-mediated
phosphorylation of alpha-synuclein, J Neuropathol Exp Neurol 2008, 67, 402.
6. Bibliography
138
[135] K. E. Paleologou, A. W. Schmid, C. C. Rospigliosi, H. Y. Kim, G. R. Lamberto, R. A.
Fredenburg, P. T. Lansbury, Jr., C. O. Fernandez, D. Eliezer, M. Zweckstetter, H. A.
Lashuel, Phosphorylation at Ser-129 but not the phosphomimics S129E/D inhibits the
fibrillation of alpha-synuclein, J Biol Chem 2008, 283, 16895.
[136] H. Sasakawa, E. Sakata, Y. Yamaguchi, M. Masuda, T. Mori, E. Kurimoto, T. Iguchi, S.
Hisanaga, T. Iwatsubo, M. Hasegawa, K. Kato, Ultra-high field NMR studies of
antibody binding and site-specific phosphorylation of alpha-synuclein, Biochem
Biophys Res Commun 2007, 363, 795.
[137] J. R. Gillespie, D. Shortle, Characterization of long-range structure in the denatured
state of staphylococcal nuclease. I. Paramagnetic relaxation enhancement by nitroxide
spin labels, J Mol Biol 1997, 268, 158.
[138] P. A. Kosen, R. M. Scheek, H. Naderi, V. J. Basus, S. Manogaran, P. G. Schmidt, N. J.
Oppenheimer, I. D. Kuntz, Two-dimensional 1H NMR of three spin-labeled derivatives
of bovine pancreatic trypsin inhibitor, Biochemistry 1986, 25, 2356.
[139] N. Sugeno, A. Takeda, T. Hasegawa, M. Kobayashi, A. Kikuchi, F. Mori, K.
Wakabayashi, Y. Itoyama, Serine 129 phosphorylation of alpha-synuclein induces
unfolded protein response-mediated cell death, J Biol Chem 2008, 283, 23179.
[140] O. S. Gorbatyuk, S. Li, L. F. Sullivan, W. Chen, G. Kondrikova, F. P. Manfredsson, R.
J. Mandel, N. Muzyczka, The phosphorylation state of Ser-129 in human alpha-
synuclein determines neurodegeneration in a rat model of Parkinson disease, Proc Natl
Acad Sci U S A 2008, 105, 763.
[141] I. Landrieu, L. Lacosse, A. Leroy, J. M. Wieruszeski, X. Trivelli, A. Sillen, N. Sibille,
H. Schwalbe, K. Saxena, T. Langer, G. Lippens, NMR analysis of a Tau
phosphorylation pattern, J Am Chem Soc 2006, 128, 3575.
[142] R. J. Deshaies, J. E. Ferrell, Jr., Multisite phosphorylation and the countdown to S
phase, Cell 2001, 107, 819.
6. Bibliography
139
[143] B. I. Giasson, M. S. Forman, M. Higuchi, L. I. Golbe, C. L. Graves, P. T. Kotzbauer, J.
Q. Trojanowski, V. M. Lee, Initiation and synergistic fibrillization of tau and alpha-
synuclein, Science 2003, 300, 636.
[144] P. H. Jensen, H. Hager, M. S. Nielsen, P. Hojrup, J. Gliemann, R. Jakes, alpha-
synuclein binds to Tau and stimulates the protein kinase A-catalyzed tau
phosphorylation of serine residues 262 and 356, J Biol Chem 1999, 274, 25481.
[145] S. R. Paik, H. J. Shin, J. H. Lee, C. S. Chang, J. Kim, Copper(II)-induced self-
oligomerization of alpha-synuclein, Biochem J 1999, 340 ( Pt 3), 821.
[146] D. R. Brown, Interactions between metals and alpha-synuclein--function or artefact?,
Febs J 2007, 274, 3766.
[147] K. C. Corbit, N. Trakul, E. M. Eves, B. Diaz, M. Marshall, M. R. Rosner, Activation of
Raf-1 signaling by protein kinase C through a mechanism involving Raf kinase
inhibitory protein, J Biol Chem 2003, 278, 13061.
[148] S. Tabor, C. C. Richardson, A bacteriophage T7 RNA polymerase/promoter system for
controlled exclusive expression of specific genes, Proc Natl Acad Sci U S A 1985, 82,
1074.
[149] Y. S. Jung, M. Zweckstetter, Backbone assignment of proteins with known structure
using residual dipolar couplings, J Biomol NMR 2004, 30, 25.
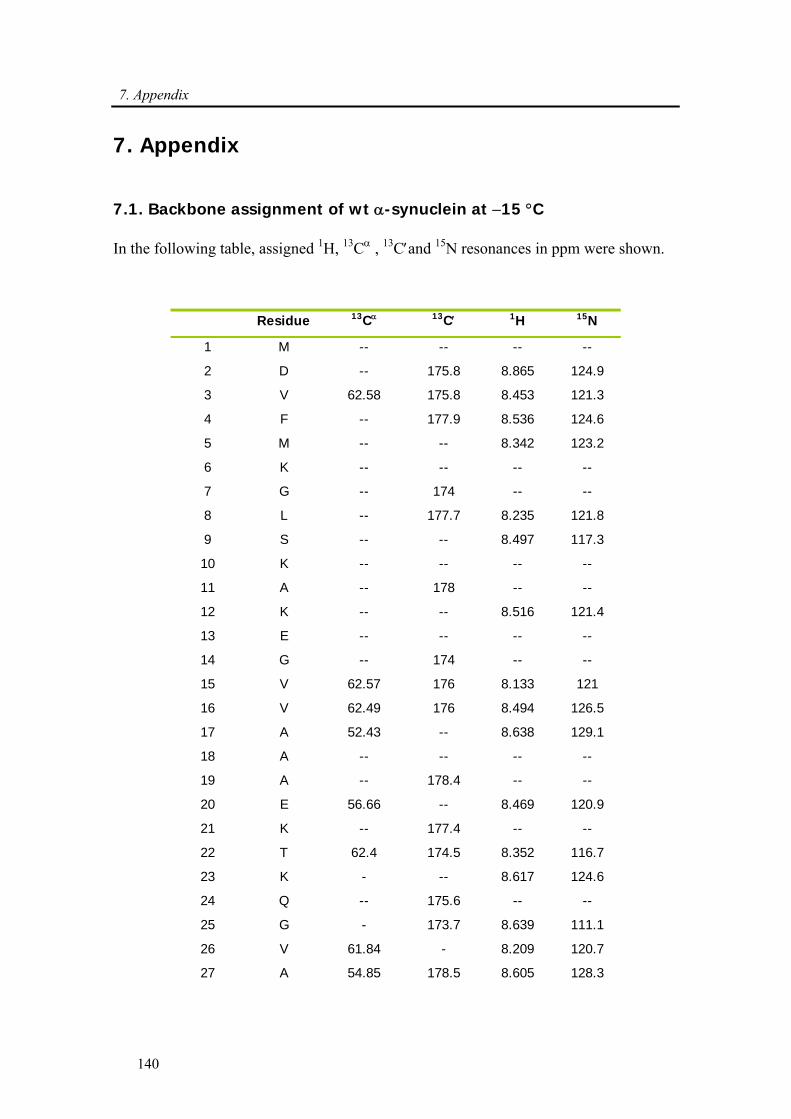
7. Appendix
140
7. Appendix
7.1. Backbone assignment of wt α-synuclein at −15 °C
In the following table, assigned 1H, 13Cα , 13C′and 15N resonances in ppm were shown.
Residue 13Cα 13C′ 1H 15N
1 M -- -- -- --
2 D -- 175.8 8.865 124.9
3 V 62.58 175.8 8.453 121.3
4 F -- 177.9 8.536 124.6
5 M -- -- 8.342 123.2
6 K -- -- -- --
7 G -- 174 -- --
8 L -- 177.7 8.235 121.8
9 S -- -- 8.497 117.3
10 K -- -- -- --
11 A -- 178 -- --
12 K -- -- 8.516 121.4
13 E -- -- -- --
14 G -- 174 -- --
15 V 62.57 176 8.133 121
16 V 62.49 176 8.494 126.5
17 A 52.43 -- 8.638 129.1
18 A -- -- -- --
19 A -- 178.4 -- --
20 E 56.66 -- 8.469 120.9
21 K -- 177.4 -- --
22 T 62.4 174.5 8.352 116.7
23 K - -- 8.617 124.6
24 Q -- 175.6 -- --
25 G - 173.7 8.639 111.1
26 V 61.84 - 8.209 120.7
27 A 54.85 178.5 8.605 128.3
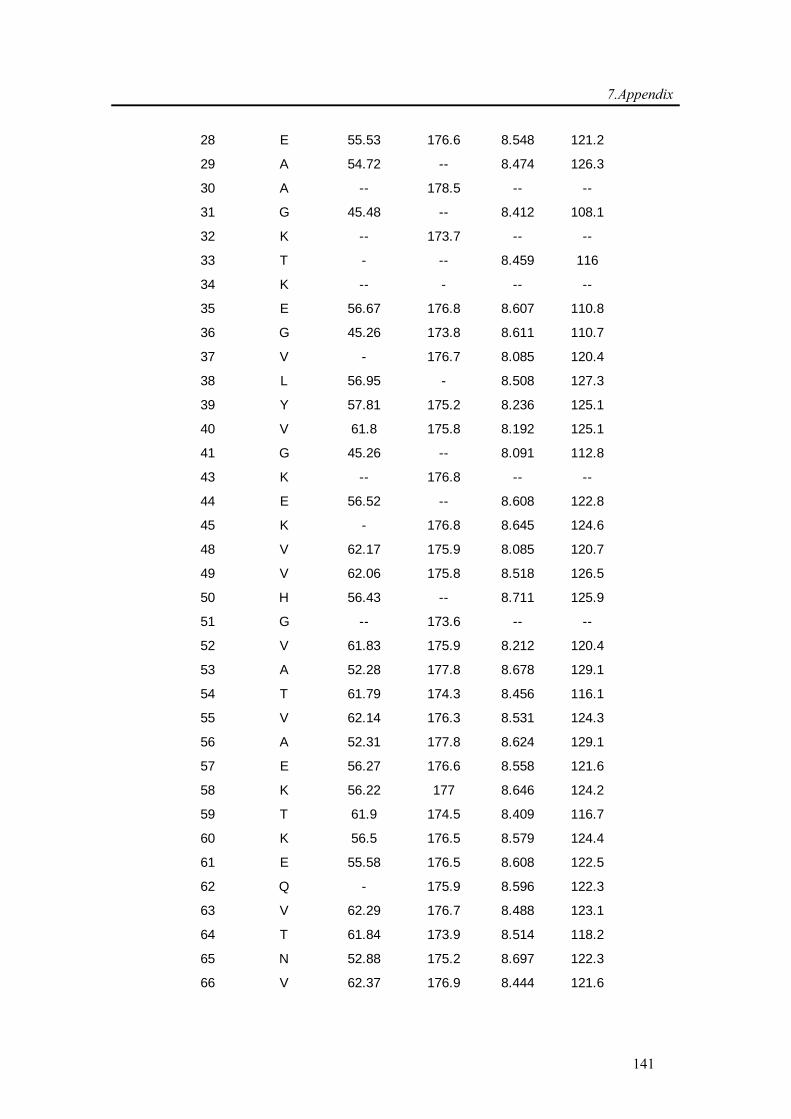
7.Appendix
141
28 E 55.53 176.6 8.548 121.2
29 A 54.72 -- 8.474 126.3
30 A -- 178.5 -- --
31 G 45.48 -- 8.412 108.1
32 K -- 173.7 -- --
33 T - -- 8.459 116
34 K -- - -- --
35 E 56.67 176.8 8.607 110.8
36 G 45.26 173.8 8.611 110.7
37 V - 176.7 8.085 120.4
38 L 56.95 - 8.508 127.3
39 Y 57.81 175.2 8.236 125.1
40 V 61.8 175.8 8.192 125.1
41 G 45.26 -- 8.091 112.8
43 K -- 176.8 -- --
44 E 56.52 -- 8.608 122.8
45 K - 176.8 8.645 124.6
48 V 62.17 175.9 8.085 120.7
49 V 62.06 175.8 8.518 126.5
50 H 56.43 -- 8.711 125.9
51 G -- 173.6 -- --
52 V 61.83 175.9 8.212 120.4
53 A 52.28 177.8 8.678 129.1
54 T 61.79 174.3 8.456 116.1
55 V 62.14 176.3 8.531 124.3
56 A 52.31 177.8 8.624 129.1
57 E 56.27 176.6 8.558 121.6
58 K 56.22 177 8.646 124.2
59 T 61.9 174.5 8.409 116.7
60 K 56.5 176.5 8.579 124.4
61 E 55.58 176.5 8.608 122.5
62 Q - 175.9 8.596 122.3
63 V 62.29 176.7 8.488 123.1
64 T 61.84 173.9 8.514 118.2
65 N 52.88 175.2 8.697 122.3
66 V 62.37 176.9 8.444 121.6
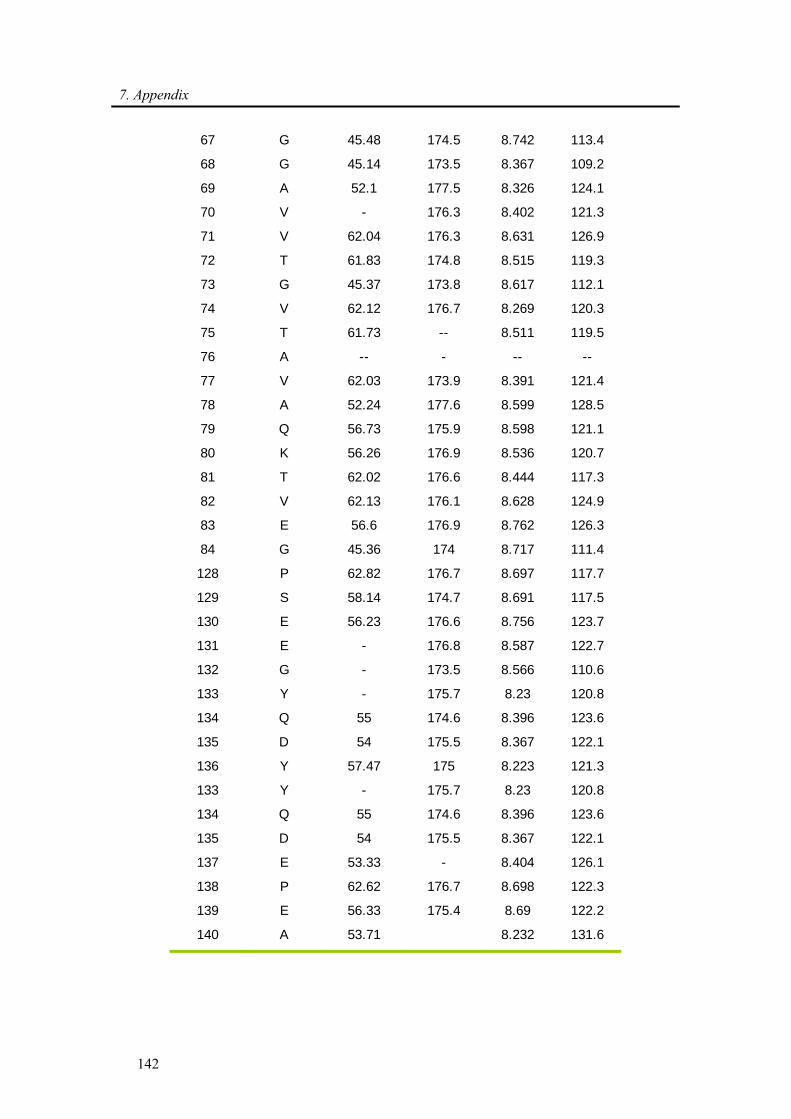
7. Appendix
142
67 G 45.48 174.5 8.742 113.4
68 G 45.14 173.5 8.367 109.2
69 A 52.1 177.5 8.326 124.1
70 V - 176.3 8.402 121.3
71 V 62.04 176.3 8.631 126.9
72 T 61.83 174.8 8.515 119.3
73 G 45.37 173.8 8.617 112.1
74 V 62.12 176.7 8.269 120.3
75 T 61.73 -- 8.511 119.5
76 A -- - -- --
77 V 62.03 173.9 8.391 121.4
78 A 52.24 177.6 8.599 128.5
79 Q 56.73 175.9 8.598 121.1
80 K 56.26 176.9 8.536 120.7
81 T 62.02 176.6 8.444 117.3
82 V 62.13 176.1 8.628 124.9
83 E 56.6 176.9 8.762 126.3
84 G 45.36 174 8.717 111.4
128 P 62.82 176.7 8.697 117.7
129 S 58.14 174.7 8.691 117.5
130 E 56.23 176.6 8.756 123.7
131 E - 176.8 8.587 122.7
132 G - 173.5 8.566 110.6
133 Y - 175.7 8.23 120.8
134 Q 55 174.6 8.396 123.6
135 D 54 175.5 8.367 122.1
136 Y 57.47 175 8.223 121.3
133 Y - 175.7 8.23 120.8
134 Q 55 174.6 8.396 123.6
135 D 54 175.5 8.367 122.1
137 E 53.33 - 8.404 126.1
138 P 62.62 176.7 8.698 122.3
139 E 56.33 175.4 8.69 122.2
140 A 53.71 8.232 131.6

7.Appendix
143
7.2. Backbone assignment of the C2A domain of Rabphilin-3A using
the automatic assignment program MARS
The gene coding for the C2A domain of mouse rabphilin3A (E371-I510) was
cloned into the BamHI and EcoRI restriction sites of pGex2T (Novagen, Madison,
USA) in order to produce GST-tagged recombinant protein in E. coli BL21. The protein
was purified by affinity chromatography on a Glutathione sepharose resin (Amersham
Biosciences) and the GST tag was removed on column by a thrombin-protease cleavage.
The protein was further purified by anion exchange chromatography on a HiTrap SP-
Sepharose column (Amersham Biosciences). 15N/13C labeled protein sample was
prepared from cells grown in M9-based minimal medium containing 15NH4Cl and
13C6-glucose. NMR samples contained approximately 1 mM rabphilin3A C2A domain
in 20 mM sodium acetate pH 5.0, 150 mM NaCl, 1 mM DTT, 20 mM calcium chloride
and 10 % D2O (v/v).
NMR spectra were acquired at 301 K on Bruker AVANCE 600, 700 and 900
spectrometers, processed using NMRPipe/NMRDraw [66] and analyzed using Sparky (T.
D. Goddard and D. G. Kneller, University of California, San Francisco). Assignments
were derived from standard versions of 2D 15N-1H HSQC, 3D HNCA, 3D HN(CO)CA,
3D CBCA(CO)NH, 3D HNCACB, 3D HNCO experiments. Chemical shifts of all
proton, carbon and nitrogen nuclei were referenced externally to that of DSS at 0 ppm.
The backbone resonance assignment was largely performed by using the automatic
assignment program MARS [149].
The chemical shift data have been deposited in the BioMagResBank (BMRB)
http://www.bmrb.wisc.edu under accession number 6787. In the following table,
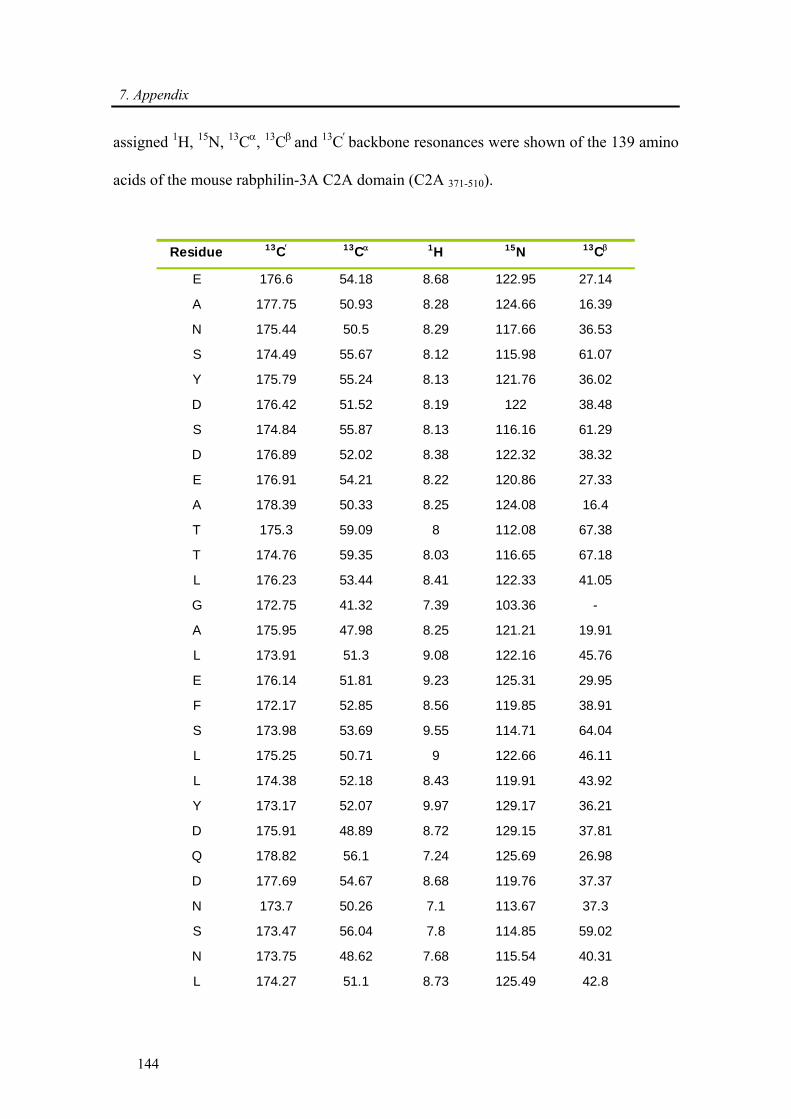
7. Appendix
144
assigned 1H, 15N, 13Cα, 13Cβ and 13C′ backbone resonances were shown of the 139 amino
acids of the mouse rabphilin-3A C2A domain (C2A 371-510).
Residue 13C′ 13Cα 1H 15N 13Cβ
E 176.6 54.18 8.68 122.95 27.14
A 177.75 50.93 8.28 124.66 16.39
N 175.44 50.5 8.29 117.66 36.53
S 174.49 55.67 8.12 115.98 61.07
Y 175.79 55.24 8.13 121.76 36.02
D 176.42 51.52 8.19 122 38.48
S 174.84 55.87 8.13 116.16 61.29
D 176.89 52.02 8.38 122.32 38.32
E 176.91 54.21 8.22 120.86 27.33
A 178.39 50.33 8.25 124.08 16.4
T 175.3 59.09 8 112.08 67.38
T 174.76 59.35 8.03 116.65 67.18
L 176.23 53.44 8.41 122.33 41.05
G 172.75 41.32 7.39 103.36 -
A 175.95 47.98 8.25 121.21 19.91
L 173.91 51.3 9.08 122.16 45.76
E 176.14 51.81 9.23 125.31 29.95
F 172.17 52.85 8.56 119.85 38.91
S 173.98 53.69 9.55 114.71 64.04
L 175.25 50.71 9 122.66 46.11
L 174.38 52.18 8.43 119.91 43.92
Y 173.17 52.07 9.97 129.17 36.21
D 175.91 48.89 8.72 129.15 37.81
Q 178.82 56.1 7.24 125.69 26.98
D 177.69 54.67 8.68 119.76 37.37
N 173.7 50.26 7.1 113.67 37.3
S 173.47 56.04 7.8 114.85 59.02
N 173.75 48.62 7.68 115.54 40.31
L 174.27 51.1 8.73 125.49 42.8
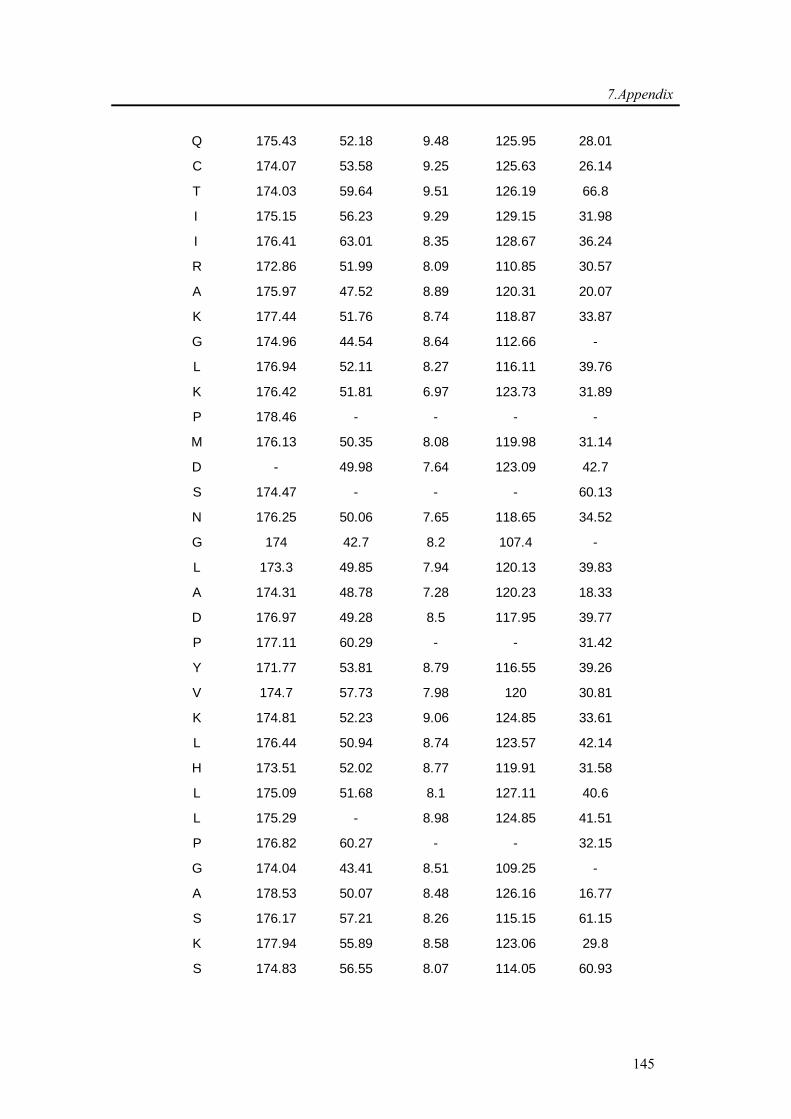
7.Appendix
145
Q 175.43 52.18 9.48 125.95 28.01
C 174.07 53.58 9.25 125.63 26.14
T 174.03 59.64 9.51 126.19 66.8
I 175.15 56.23 9.29 129.15 31.98
I 176.41 63.01 8.35 128.67 36.24
R 172.86 51.99 8.09 110.85 30.57
A 175.97 47.52 8.89 120.31 20.07
K 177.44 51.76 8.74 118.87 33.87
G 174.96 44.54 8.64 112.66 -
L 176.94 52.11 8.27 116.11 39.76
K 176.42 51.81 6.97 123.73 31.89
P 178.46 - - - -
M 176.13 50.35 8.08 119.98 31.14
D - 49.98 7.64 123.09 42.7
S 174.47 - - - 60.13
N 176.25 50.06 7.65 118.65 34.52
G 174 42.7 8.2 107.4 -
L 173.3 49.85 7.94 120.13 39.83
A 174.31 48.78 7.28 120.23 18.33
D 176.97 49.28 8.5 117.95 39.77
P 177.11 60.29 - - 31.42
Y 171.77 53.81 8.79 116.55 39.26
V 174.7 57.73 7.98 120 30.81
K 174.81 52.23 9.06 124.85 33.61
L 176.44 50.94 8.74 123.57 42.14
H 173.51 52.02 8.77 119.91 31.58
L 175.09 51.68 8.1 127.11 40.6
L 175.29 - 8.98 124.85 41.51
P 176.82 60.27 - - 32.15
G 174.04 43.41 8.51 109.25 -
A 178.53 50.07 8.48 126.16 16.77
S 176.17 57.21 8.26 115.15 61.15
K 177.94 55.89 8.58 123.06 29.8
S 174.83 56.55 8.07 114.05 60.93
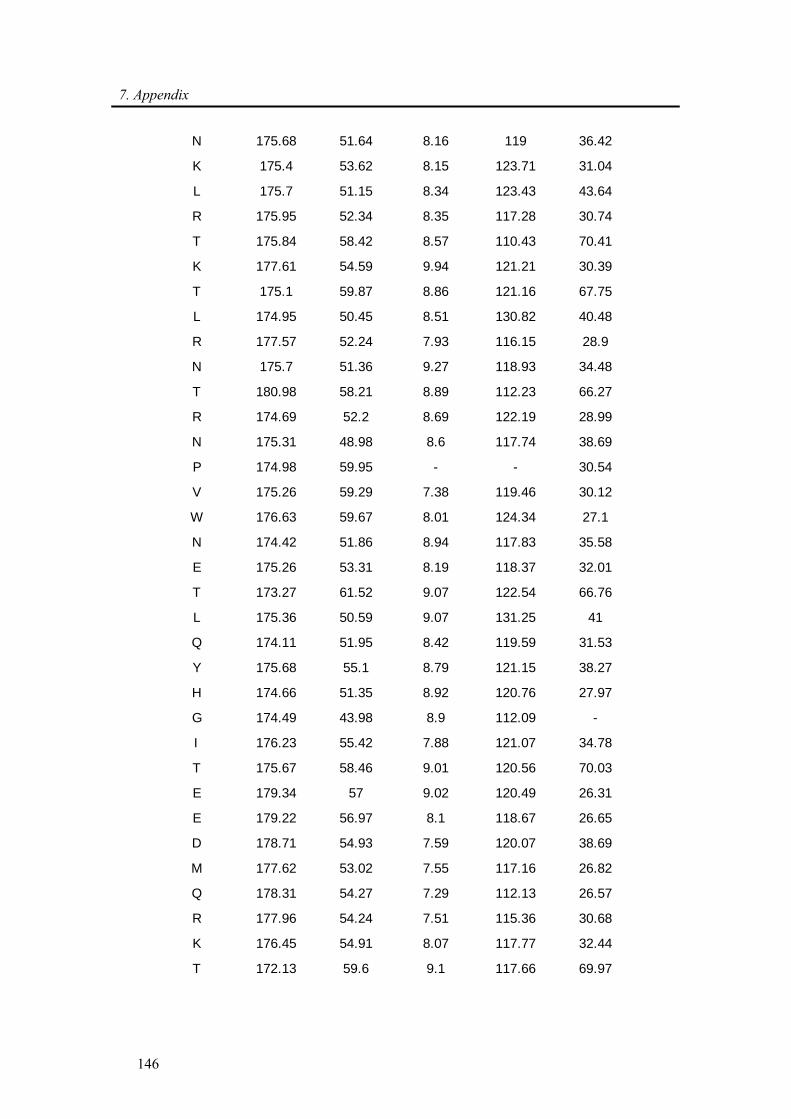
7. Appendix
146
N 175.68 51.64 8.16 119 36.42
K 175.4 53.62 8.15 123.71 31.04
L 175.7 51.15 8.34 123.43 43.64
R 175.95 52.34 8.35 117.28 30.74
T 175.84 58.42 8.57 110.43 70.41
K 177.61 54.59 9.94 121.21 30.39
T 175.1 59.87 8.86 121.16 67.75
L 174.95 50.45 8.51 130.82 40.48
R 177.57 52.24 7.93 116.15 28.9
N 175.7 51.36 9.27 118.93 34.48
T 180.98 58.21 8.89 112.23 66.27
R 174.69 52.2 8.69 122.19 28.99
N 175.31 48.98 8.6 117.74 38.69
P 174.98 59.95 - - 30.54
V 175.26 59.29 7.38 119.46 30.12
W 176.63 59.67 8.01 124.34 27.1
N 174.42 51.86 8.94 117.83 35.58
E 175.26 53.31 8.19 118.37 32.01
T 173.27 61.52 9.07 122.54 66.76
L 175.36 50.59 9.07 131.25 41
Q 174.11 51.95 8.42 119.59 31.53
Y 175.68 55.1 8.79 121.15 38.27
H 174.66 51.35 8.92 120.76 27.97
G 174.49 43.98 8.9 112.09 -
I 176.23 55.42 7.88 121.07 34.78
T 175.67 58.46 9.01 120.56 70.03
E 179.34 57 9.02 120.49 26.31
E 179.22 56.97 8.1 118.67 26.65
D 178.71 54.93 7.59 120.07 38.69
M 177.62 53.02 7.55 117.16 26.82
Q 178.31 54.27 7.29 112.13 26.57
R 177.96 54.24 7.51 115.36 30.68
K 176.45 54.91 8.07 117.77 32.44
T 172.13 59.6 9.1 117.66 69.97
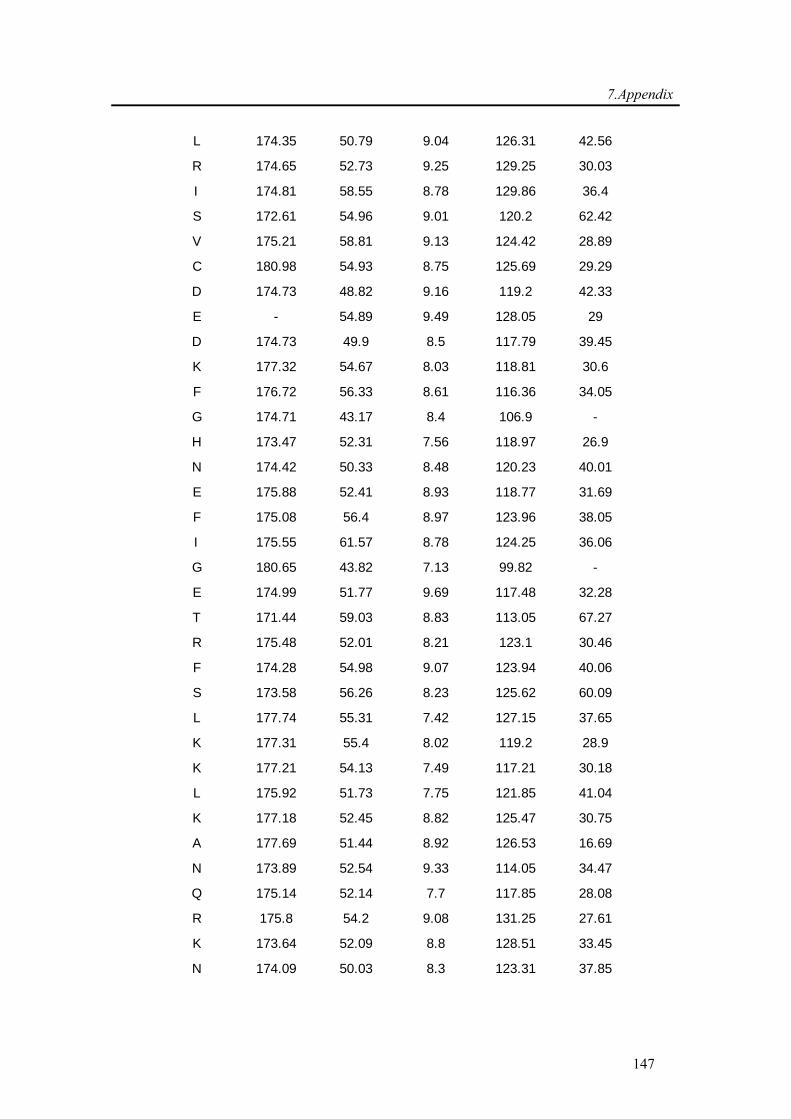
7.Appendix
147
L 174.35 50.79 9.04 126.31 42.56
R 174.65 52.73 9.25 129.25 30.03
I 174.81 58.55 8.78 129.86 36.4
S 172.61 54.96 9.01 120.2 62.42
V 175.21 58.81 9.13 124.42 28.89
C 180.98 54.93 8.75 125.69 29.29
D 174.73 48.82 9.16 119.2 42.33
E - 54.89 9.49 128.05 29
D 174.73 49.9 8.5 117.79 39.45
K 177.32 54.67 8.03 118.81 30.6
F 176.72 56.33 8.61 116.36 34.05
G 174.71 43.17 8.4 106.9 -
H 173.47 52.31 7.56 118.97 26.9
N 174.42 50.33 8.48 120.23 40.01
E 175.88 52.41 8.93 118.77 31.69
F 175.08 56.4 8.97 123.96 38.05
I 175.55 61.57 8.78 124.25 36.06
G 180.65 43.82 7.13 99.82 -
E 174.99 51.77 9.69 117.48 32.28
T 171.44 59.03 8.83 113.05 67.27
R 175.48 52.01 8.21 123.1 30.46
F 174.28 54.98 9.07 123.94 40.06
S 173.58 56.26 8.23 125.62 60.09
L 177.74 55.31 7.42 127.15 37.65
K 177.31 55.4 8.02 119.2 28.9
K 177.21 54.13 7.49 117.21 30.18
L 175.92 51.73 7.75 121.85 41.04
K 177.18 52.45 8.82 125.47 30.75
A 177.69 51.44 8.92 126.53 16.69
N 173.89 52.54 9.33 114.05 34.47
Q 175.14 52.14 7.7 117.85 28.08
R 175.8 54.2 9.08 131.25 27.61
K 173.64 52.09 8.8 128.51 33.45
N 174.09 50.03 8.3 123.31 37.85
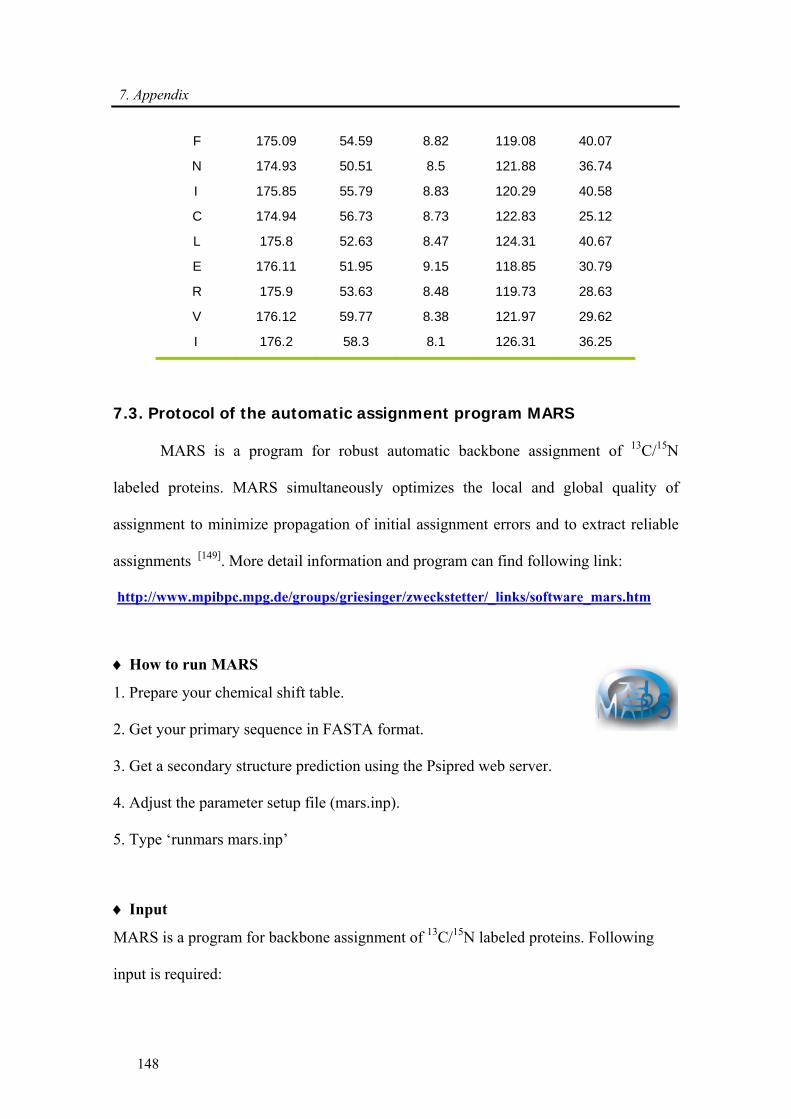
7. Appendix
148
F 175.09 54.59 8.82 119.08 40.07
N 174.93 50.51 8.5 121.88 36.74
I 175.85 55.79 8.83 120.29 40.58
C 174.94 56.73 8.73 122.83 25.12
L 175.8 52.63 8.47 124.31 40.67
E 176.11 51.95 9.15 118.85 30.79
R 175.9 53.63 8.48 119.73 28.63
V 176.12 59.77 8.38 121.97 29.62
I 176.2 58.3 8.1 126.31 36.25
7.3. Protocol of the automatic assignment program MARS
MARS is a program for robust automatic backbone assignment of 13C/15N
labeled proteins. MARS simultaneously optimizes the local and global quality of
assignment to minimize propagation of initial assignment errors and to extract reliable
assignments [149]. More detail information and program can find following link:
http://www.mpibpc.mpg.de/groups/griesinger/zweckstetter/_links/software_mars.htm
♦ How to run MARS
1. Prepare your chemical shift table.
2. Get your primary sequence in FASTA format.
3. Get a secondary structure prediction using the Psipred web server.
4. Adjust the parameter setup file (mars.inp).
5. Type ‘runmars mars.inp’
♦ Input
MARS is a program for backbone assignment of 13C/15N labeled proteins. Following
input is required:
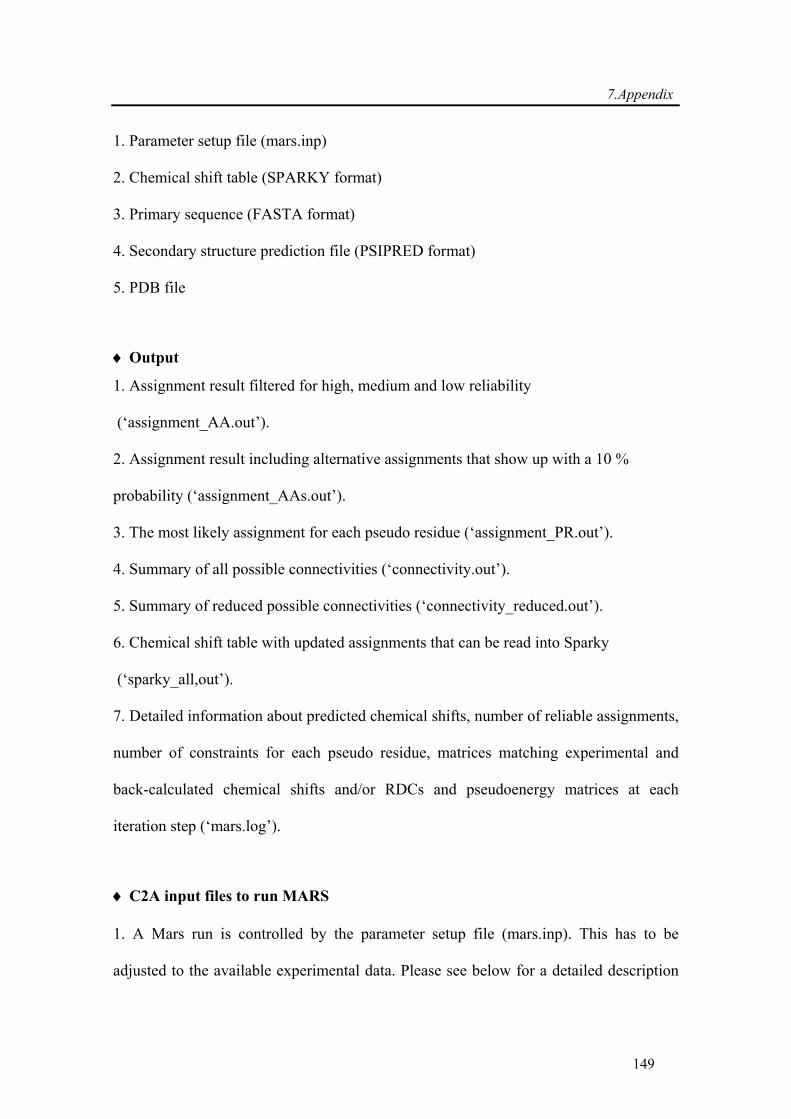
7.Appendix
149
1. Parameter setup file (mars.inp)
2. Chemical shift table (SPARKY format)
3. Primary sequence (FASTA format)
4. Secondary structure prediction file (PSIPRED format)
5. PDB file
♦ Output
1. Assignment result filtered for high, medium and low reliability
(‘assignment_AA.out’).
2. Assignment result including alternative assignments that show up with a 10 %
probability (‘assignment_AAs.out’).
3. The most likely assignment for each pseudo residue (‘assignment_PR.out’).
4. Summary of all possible connectivities (‘connectivity.out’).
5. Summary of reduced possible connectivities (‘connectivity_reduced.out’).
6. Chemical shift table with updated assignments that can be read into Sparky
(‘sparky_all,out’).
7. Detailed information about predicted chemical shifts, number of reliable assignments,
number of constraints for each pseudo residue, matrices matching experimental and
back-calculated chemical shifts and/or RDCs and pseudoenergy matrices at each
iteration step (‘mars.log’).
♦ C2A input files to run MARS
1. A Mars run is controlled by the parameter setup file (mars.inp). This has to be
adjusted to the available experimental data. Please see below for a detailed description
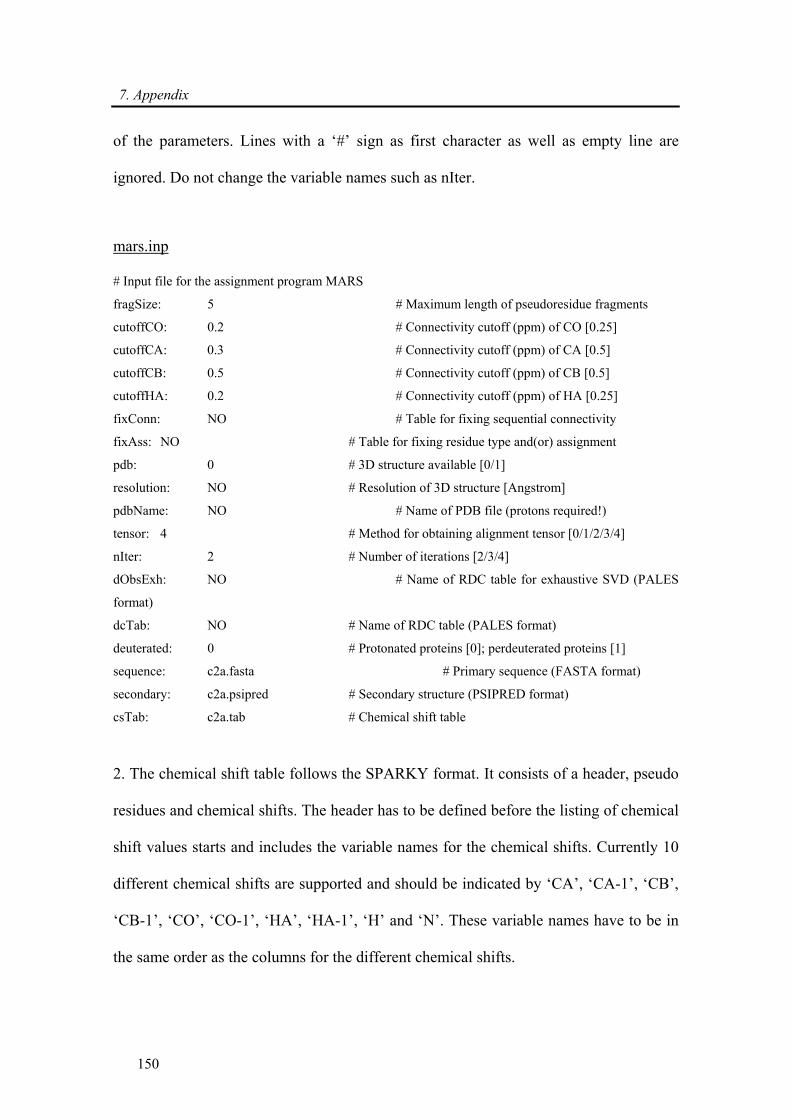
7. Appendix
150
of the parameters. Lines with a ‘#’ sign as first character as well as empty line are
ignored. Do not change the variable names such as nIter.
mars.inp
# Input file for the assignment program MARS
fragSize: 5 # Maximum length of pseudoresidue fragments
cutoffCO: 0.2 # Connectivity cutoff (ppm) of CO [0.25]
cutoffCA: 0.3 # Connectivity cutoff (ppm) of CA [0.5]
cutoffCB: 0.5 # Connectivity cutoff (ppm) of CB [0.5]
cutoffHA: 0.2 # Connectivity cutoff (ppm) of HA [0.25]
fixConn: NO # Table for fixing sequential connectivity
fixAss: NO # Table for fixing residue type and(or) assignment
pdb: 0 # 3D structure available [0/1]
resolution: NO # Resolution of 3D structure [Angstrom]
pdbName: NO # Name of PDB file (protons required!)
tensor: 4 # Method for obtaining alignment tensor [0/1/2/3/4]
nIter: 2 # Number of iterations [2/3/4]
dObsExh: NO # Name of RDC table for exhaustive SVD (PALES
format)
dcTab: NO # Name of RDC table (PALES format)
deuterated: 0 # Protonated proteins [0]; perdeuterated proteins [1]
sequence: c2a.fasta # Primary sequence (FASTA format)
secondary: c2a.psipred # Secondary structure (PSIPRED format)
csTab: c2a.tab # Chemical shift table
2. The chemical shift table follows the SPARKY format. It consists of a header, pseudo
residues and chemical shifts. The header has to be defined before the listing of chemical
shift values starts and includes the variable names for the chemical shifts. Currently 10
different chemical shifts are supported and should be indicated by ‘CA’, ‘CA-1’, ‘CB’,
‘CB-1’, ‘CO’, ‘CO-1’, ‘HA’, ‘HA-1’, ‘H’ and ‘N’. These variable names have to be in
the same order as the columns for the different chemical shifts.
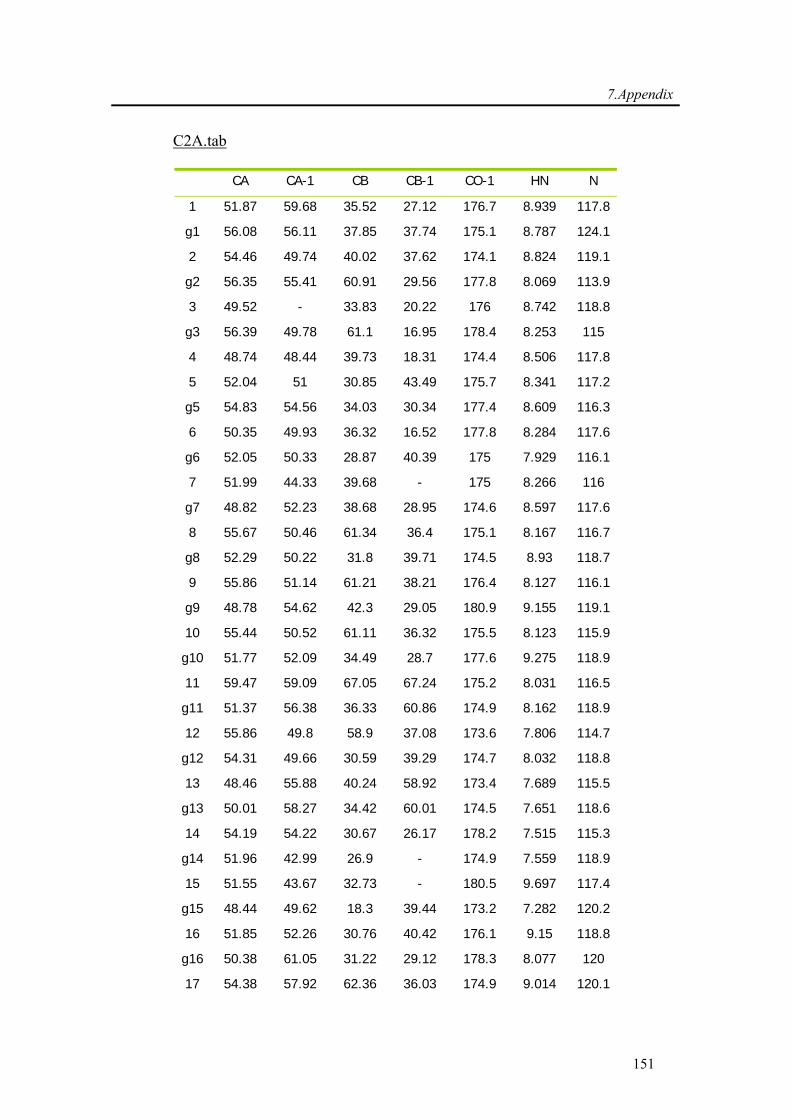
7.Appendix
151
C2A.tab
CA CA-1 CB CB-1 CO-1 HN N
1 51.87 59.68 35.52 27.12 176.7 8.939 117.8
g1 56.08 56.11 37.85 37.74 175.1 8.787 124.1
2 54.46 49.74 40.02 37.62 174.1 8.824 119.1
g2 56.35 55.41 60.91 29.56 177.8 8.069 113.9
3 49.52 - 33.83 20.22 176 8.742 118.8
g3 56.39 49.78 61.1 16.95 178.4 8.253 115
4 48.74 48.44 39.73 18.31 174.4 8.506 117.8
5 52.04 51 30.85 43.49 175.7 8.341 117.2
g5 54.83 54.56 34.03 30.34 177.4 8.609 116.3
6 50.35 49.93 36.32 16.52 177.8 8.284 117.6
g6 52.05 50.33 28.87 40.39 175 7.929 116.1
7 51.99 44.33 39.68 - 175 8.266 116
g7 48.82 52.23 38.68 28.95 174.6 8.597 117.6
8 55.67 50.46 61.34 36.4 175.1 8.167 116.7
g8 52.29 50.22 31.8 39.71 174.5 8.93 118.7
9 55.86 51.14 61.21 38.21 176.4 8.127 116.1
g9 48.78 54.62 42.3 29.05 180.9 9.155 119.1
10 55.44 50.52 61.11 36.32 175.5 8.123 115.9
g10 51.77 52.09 34.49 28.7 177.6 9.275 118.9
11 59.47 59.09 67.05 67.24 175.2 8.031 116.5
g11 51.37 56.38 36.33 60.86 174.9 8.162 118.9
12 55.86 49.8 58.9 37.08 173.6 7.806 114.7
g12 54.31 49.66 30.59 39.29 174.7 8.032 118.8
13 48.46 55.88 40.24 58.92 173.4 7.689 115.5
g13 50.01 58.27 34.42 60.01 174.5 7.651 118.6
14 54.19 54.22 30.67 26.17 178.2 7.515 115.3
g14 51.96 42.99 26.9 - 174.9 7.559 118.9
15 51.55 43.67 32.73 - 180.5 9.697 117.4
g15 48.44 49.62 18.3 39.44 173.2 7.282 120.2
16 51.85 52.26 30.76 40.42 176.1 9.15 118.8
g16 50.38 61.05 31.22 29.12 178.3 8.077 120
17 54.38 57.92 62.36 36.03 174.9 9.014 120.1
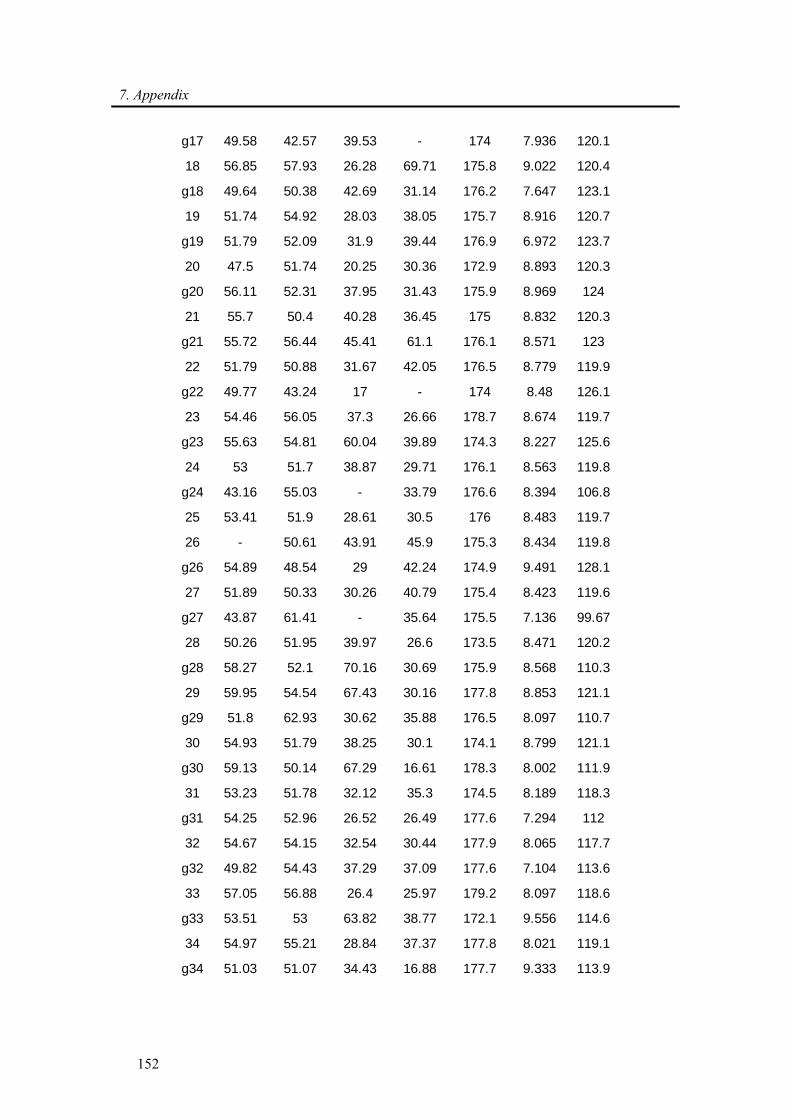
7. Appendix
152
g17 49.58 42.57 39.53 - 174 7.936 120.1
18 56.85 57.93 26.28 69.71 175.8 9.022 120.4
g18 49.64 50.38 42.69 31.14 176.2 7.647 123.1
19 51.74 54.92 28.03 38.05 175.7 8.916 120.7
g19 51.79 52.09 31.9 39.44 176.9 6.972 123.7
20 47.5 51.74 20.25 30.36 172.9 8.893 120.3
g20 56.11 52.31 37.95 31.43 175.9 8.969 124
21 55.7 50.4 40.28 36.45 175 8.832 120.3
g21 55.72 56.44 45.41 61.1 176.1 8.571 123
22 51.79 50.88 31.67 42.05 176.5 8.779 119.9
g22 49.77 43.24 17 - 174 8.48 126.1
23 54.46 56.05 37.3 26.66 178.7 8.674 119.7
g23 55.63 54.81 60.04 39.89 174.3 8.227 125.6
24 53 51.7 38.87 29.71 176.1 8.563 119.8
g24 43.16 55.03 - 33.79 176.6 8.394 106.8
25 53.41 51.9 28.61 30.5 176 8.483 119.7
26 - 50.61 43.91 45.9 175.3 8.434 119.8
g26 54.89 48.54 29 42.24 174.9 9.491 128.1
27 51.89 50.33 30.26 40.79 175.4 8.423 119.6
g27 43.87 61.41 - 35.64 175.5 7.136 99.67
28 50.26 51.95 39.97 26.6 173.5 8.471 120.2
g28 58.27 52.1 70.16 30.69 175.9 8.568 110.3
29 59.95 54.54 67.43 30.16 177.8 8.853 121.1
g29 51.8 62.93 30.62 35.88 176.5 8.097 110.7
30 54.93 51.79 38.25 30.1 174.1 8.799 121.1
g30 59.13 50.14 67.29 16.61 178.3 8.002 111.9
31 53.23 51.78 32.12 35.3 174.5 8.189 118.3
g31 54.25 52.96 26.52 26.49 177.6 7.294 112
32 54.67 54.15 32.54 30.44 177.9 8.065 117.7
g32 49.82 54.43 37.29 37.09 177.6 7.104 113.6
33 57.05 56.88 26.4 25.97 179.2 8.097 118.6
g33 53.51 53 63.82 38.77 172.1 9.556 114.6
34 54.97 55.21 28.84 37.37 177.8 8.021 119.1
g34 51.03 51.07 34.43 16.88 177.7 9.333 113.9
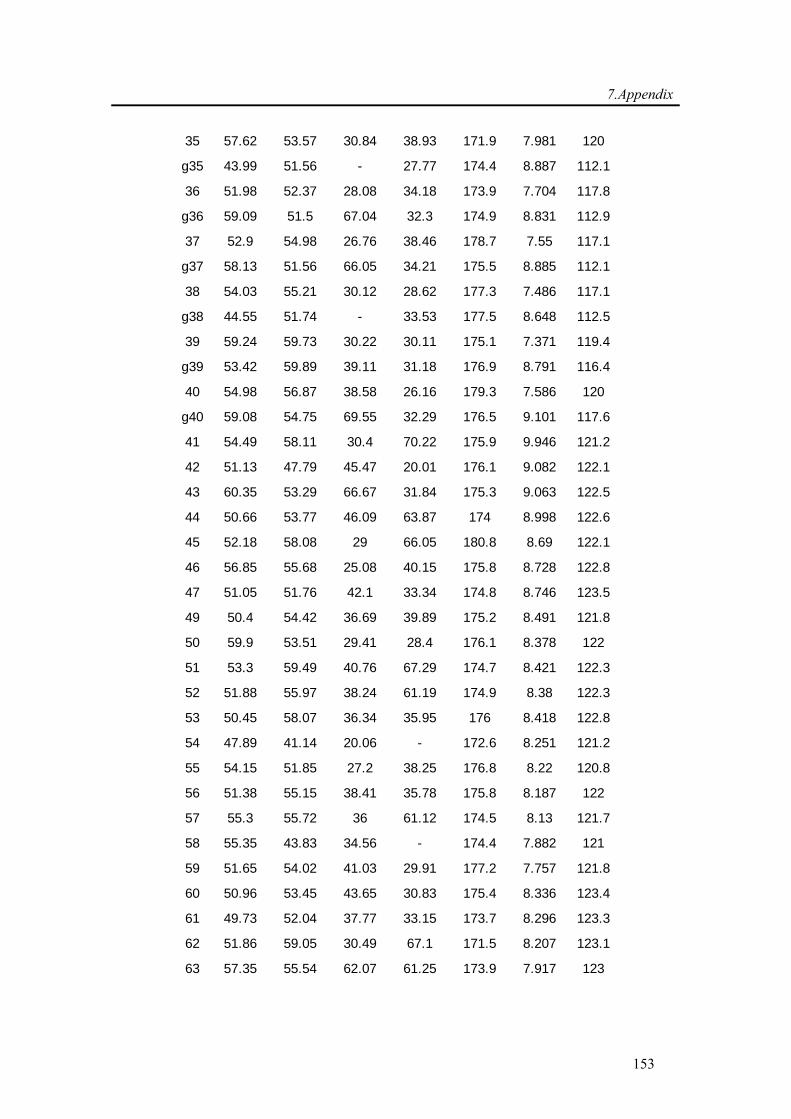
7.Appendix
153
35 57.62 53.57 30.84 38.93 171.9 7.981 120
g35 43.99 51.56 - 27.77 174.4 8.887 112.1
36 51.98 52.37 28.08 34.18 173.9 7.704 117.8
g36 59.09 51.5 67.04 32.3 174.9 8.831 112.9
37 52.9 54.98 26.76 38.46 178.7 7.55 117.1
g37 58.13 51.56 66.05 34.21 175.5 8.885 112.1
38 54.03 55.21 30.12 28.62 177.3 7.486 117.1
g38 44.55 51.74 - 33.53 177.5 8.648 112.5
39 59.24 59.73 30.22 30.11 175.1 7.371 119.4
g39 53.42 59.89 39.11 31.18 176.9 8.791 116.4
40 54.98 56.87 38.58 26.16 179.3 7.586 120
g40 59.08 54.75 69.55 32.29 176.5 9.101 117.6
41 54.49 58.11 30.4 70.22 175.9 9.946 121.2
42 51.13 47.79 45.47 20.01 176.1 9.082 122.1
43 60.35 53.29 66.67 31.84 175.3 9.063 122.5
44 50.66 53.77 46.09 63.87 174 8.998 122.6
45 52.18 58.08 29 66.05 180.8 8.69 122.1
46 56.85 55.68 25.08 40.15 175.8 8.728 122.8
47 51.05 51.76 42.1 33.34 174.8 8.746 123.5
49 50.4 54.42 36.69 39.89 175.2 8.491 121.8
50 59.9 53.51 29.41 28.4 176.1 8.378 122
51 53.3 59.49 40.76 67.29 174.7 8.421 122.3
52 51.88 55.97 38.24 61.19 174.9 8.38 122.3
53 50.45 58.07 36.34 35.95 176 8.418 122.8
54 47.89 41.14 20.06 - 172.6 8.251 121.2
55 54.15 51.85 27.2 38.25 176.8 8.22 120.8
56 51.38 55.15 38.41 35.78 175.8 8.187 122
57 55.3 55.72 36 61.12 174.5 8.13 121.7
58 55.35 43.83 34.56 - 174.4 7.882 121
59 51.65 54.02 41.03 29.91 177.2 7.757 121.8
60 50.96 53.45 43.65 30.83 175.4 8.336 123.4
61 49.73 52.04 37.77 33.15 173.7 8.296 123.3
62 51.86 59.05 30.49 67.1 171.5 8.207 123.1
63 57.35 55.54 62.07 61.25 173.9 7.917 123
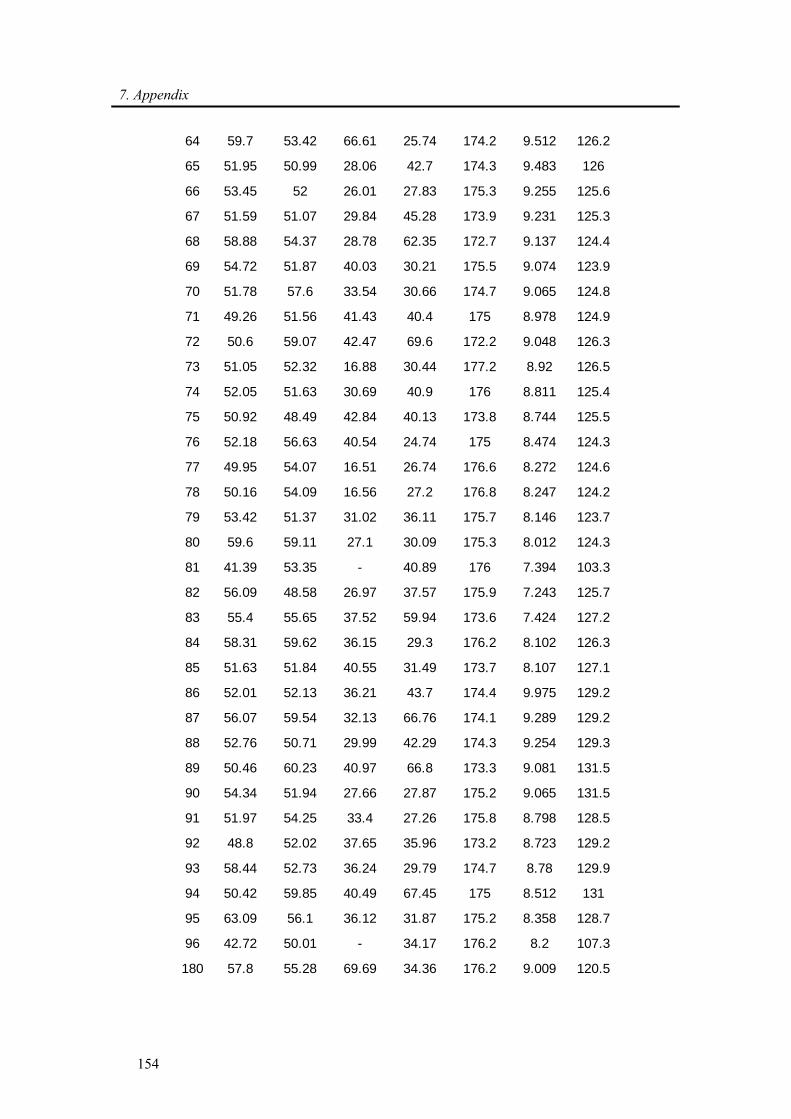
7. Appendix
154
64 59.7 53.42 66.61 25.74 174.2 9.512 126.2
65 51.95 50.99 28.06 42.7 174.3 9.483 126
66 53.45 52 26.01 27.83 175.3 9.255 125.6
67 51.59 51.07 29.84 45.28 173.9 9.231 125.3
68 58.88 54.37 28.78 62.35 172.7 9.137 124.4
69 54.72 51.87 40.03 30.21 175.5 9.074 123.9
70 51.78 57.6 33.54 30.66 174.7 9.065 124.8
71 49.26 51.56 41.43 40.4 175 8.978 124.9
72 50.6 59.07 42.47 69.6 172.2 9.048 126.3
73 51.05 52.32 16.88 30.44 177.2 8.92 126.5
74 52.05 51.63 30.69 40.9 176 8.811 125.4
75 50.92 48.49 42.84 40.13 173.8 8.744 125.5
76 52.18 56.63 40.54 24.74 175 8.474 124.3
77 49.95 54.07 16.51 26.74 176.6 8.272 124.6
78 50.16 54.09 16.56 27.2 176.8 8.247 124.2
79 53.42 51.37 31.02 36.11 175.7 8.146 123.7
80 59.6 59.11 27.1 30.09 175.3 8.012 124.3
81 41.39 53.35 - 40.89 176 7.394 103.3
82 56.09 48.58 26.97 37.57 175.9 7.243 125.7
83 55.4 55.65 37.52 59.94 173.6 7.424 127.2
84 58.31 59.62 36.15 29.3 176.2 8.102 126.3
85 51.63 51.84 40.55 31.49 173.7 8.107 127.1
86 52.01 52.13 36.21 43.7 174.4 9.975 129.2
87 56.07 59.54 32.13 66.76 174.1 9.289 129.2
88 52.76 50.71 29.99 42.29 174.3 9.254 129.3
89 50.46 60.23 40.97 66.8 173.3 9.081 131.5
90 54.34 51.94 27.66 27.87 175.2 9.065 131.5
91 51.97 54.25 33.4 27.26 175.8 8.798 128.5
92 48.8 52.02 37.65 35.96 173.2 8.723 129.2
93 58.44 52.73 36.24 29.79 174.7 8.78 129.9
94 50.42 59.85 40.49 67.45 175 8.512 131
95 63.09 56.1 36.12 31.87 175.2 8.358 128.7
96 42.72 50.01 - 34.17 176.2 8.2 107.3
180 57.8 55.28 69.69 34.36 176.2 9.009 120.5
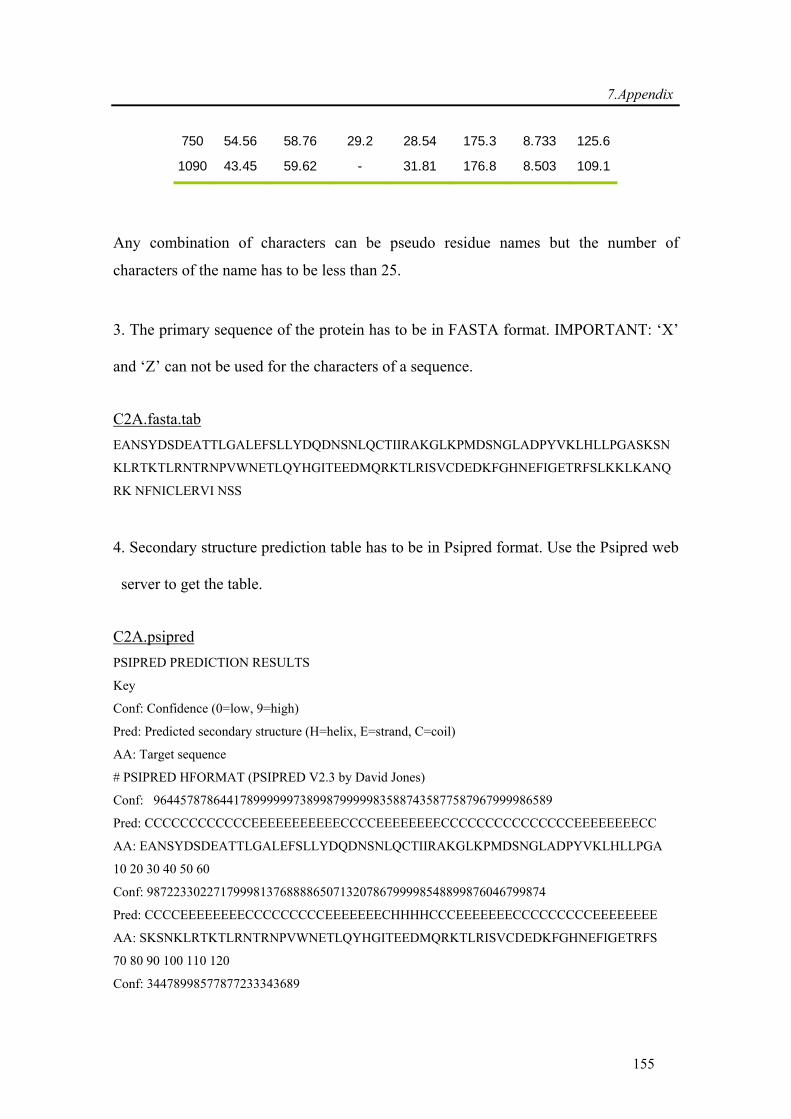
7.Appendix
155
750 54.56 58.76 29.2 28.54 175.3 8.733 125.6
1090 43.45 59.62 - 31.81 176.8 8.503 109.1
Any combination of characters can be pseudo residue names but the number of
characters of the name has to be less than 25.
3. The primary sequence of the protein has to be in FASTA format. IMPORTANT: ‘X’
and ‘Z’ can not be used for the characters of a sequence.
C2A.fasta.tab EANSYDSDEATTLGALEFSLLYDQDNSNLQCTIIRAKGLKPMDSNGLADPYVKLHLLPGASKSN
KLRTKTLRNTRNPVWNETLQYHGITEEDMQRKTLRISVCDEDKFGHNEFIGETRFSLKKLKANQ
RK NFNICLERVI NSS
4. Secondary structure prediction table has to be in Psipred format. Use the Psipred web
server to get the table.
C2A.psipred PSIPRED PREDICTION RESULTS
Key
Conf: Confidence (0=low, 9=high)
Pred: Predicted secondary structure (H=helix, E=strand, C=coil)
AA: Target sequence
# PSIPRED HFORMAT (PSIPRED V2.3 by David Jones)
Conf: 964457878644178999999738998799999835887435877587967999986589
Pred: CCCCCCCCCCCCEEEEEEEEEEECCCCEEEEEEEECCCCCCCCCCCCCCCEEEEEEEECC
AA: EANSYDSDEATTLGALEFSLLYDQDNSNLQCTIIRAKGLKPMDSNGLADPYVKLHLLPGA
10 20 30 40 50 60
Conf: 987223302271799981376888865071320786799998548899876046799874
Pred: CCCCEEEEEEEECCCCCCCCCEEEEEEECHHHHCCCEEEEEEECCCCCCCCCEEEEEEEE
AA: SKSNKLRTKTLRNTRNPVWNETLQYHGITEEDMQRKTLRISVCDEDKFGHNEFIGETRFS
70 80 90 100 110 120
Conf: 34478998577877233343689
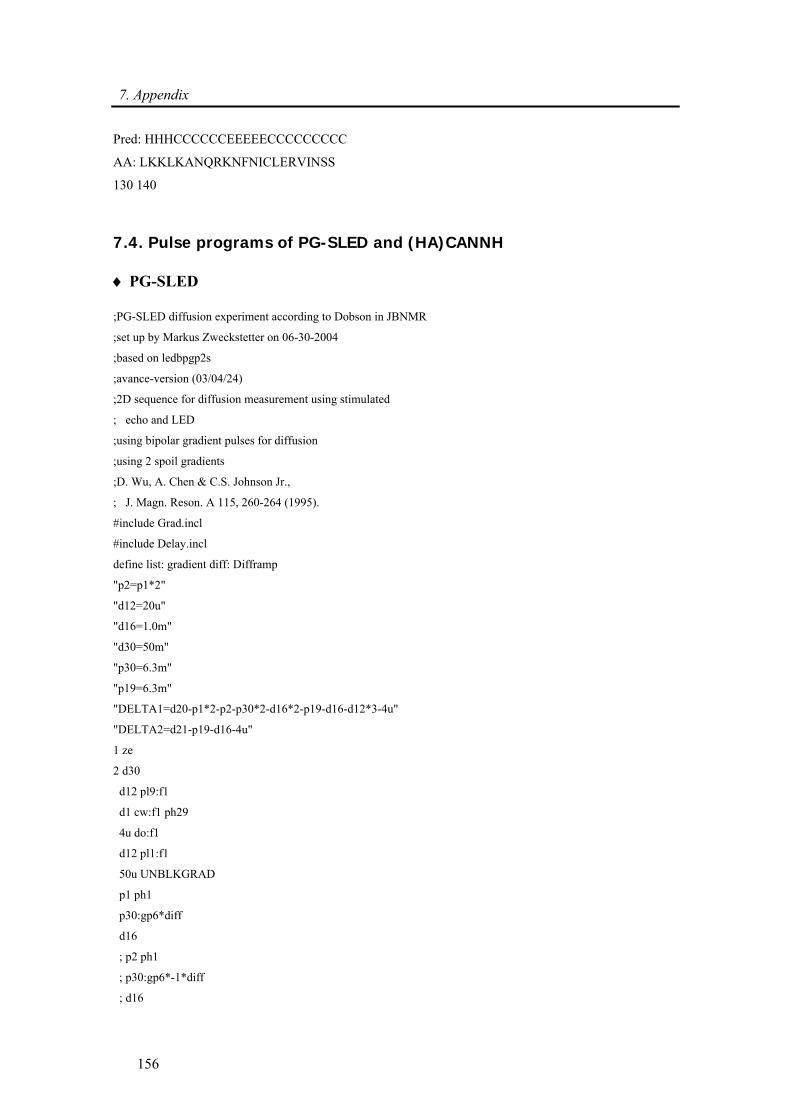
7. Appendix
156
Pred: HHHCCCCCCEEEEECCCCCCCCC
AA: LKKLKANQRKNFNICLERVINSS
130 140
7.4. Pulse programs of PG-SLED and (HA)CANNH
♦ PG-SLED
;PG-SLED diffusion experiment according to Dobson in JBNMR
;set up by Markus Zweckstetter on 06-30-2004
;based on ledbpgp2s
;avance-version (03/04/24)
;2D sequence for diffusion measurement using stimulated
; echo and LED
;using bipolar gradient pulses for diffusion
;using 2 spoil gradients
;D. Wu, A. Chen & C.S. Johnson Jr.,
; J. Magn. Reson. A 115, 260-264 (1995).
#include Grad.incl
#include Delay.incl
define list: gradient diff: Difframp
"p2=p1*2"
"d12=20u"
"d16=1.0m"
"d30=50m"
"p30=6.3m"
"p19=6.3m"
"DELTA1=d20-p1*2-p2-p30*2-d16*2-p19-d16-d12*3-4u"
"DELTA2=d21-p19-d16-4u"
1 ze
2 d30
d12 pl9:f1
d1 cw:f1 ph29
4u do:f1
d12 pl1:f1
50u UNBLKGRAD
p1 ph1
p30:gp6*diff
d16
; p2 ph1
; p30:gp6*-1*diff
; d16
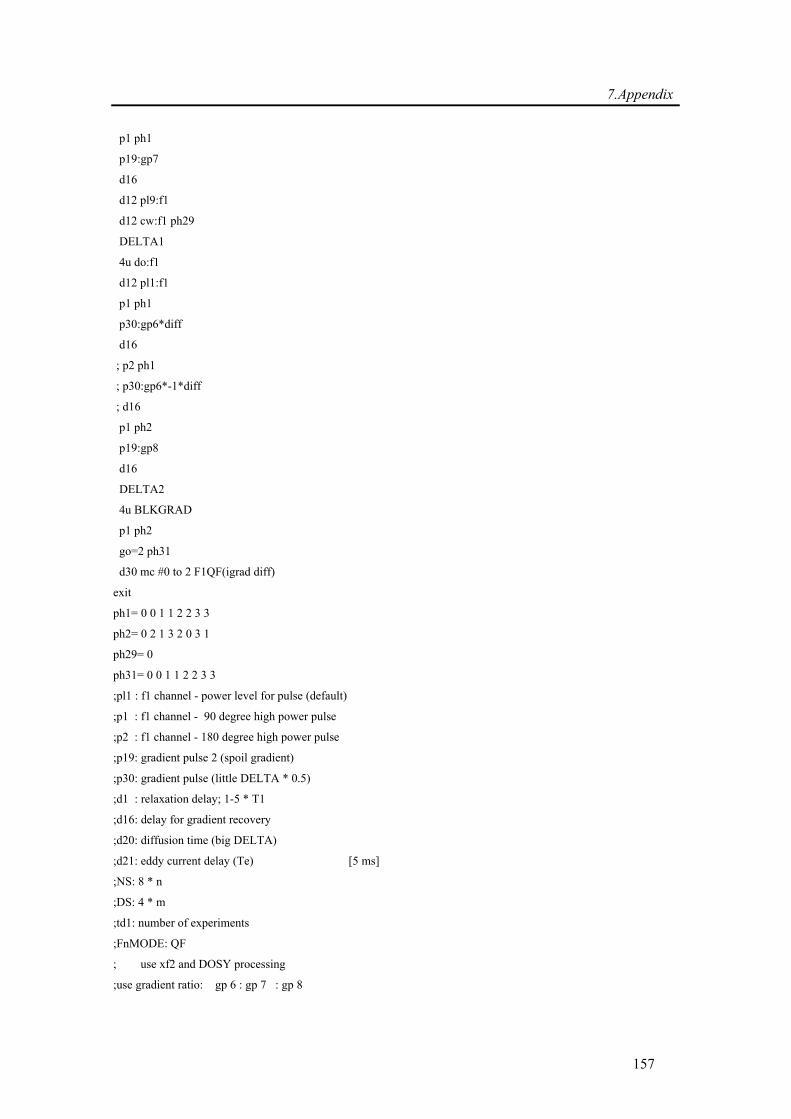
7.Appendix
157
p1 ph1
p19:gp7
d16
d12 pl9:f1
d12 cw:f1 ph29
DELTA1
4u do:f1
d12 pl1:f1
p1 ph1
p30:gp6*diff
d16
; p2 ph1
; p30:gp6*-1*diff
; d16
p1 ph2
p19:gp8
d16
DELTA2
4u BLKGRAD
p1 ph2
go=2 ph31
d30 mc #0 to 2 F1QF(igrad diff)
exit
ph1= 0 0 1 1 2 2 3 3
ph2= 0 2 1 3 2 0 3 1
ph29= 0
ph31= 0 0 1 1 2 2 3 3
;pl1 : f1 channel - power level for pulse (default)
;p1 : f1 channel - 90 degree high power pulse
;p2 : f1 channel - 180 degree high power pulse
;p19: gradient pulse 2 (spoil gradient)
;p30: gradient pulse (little DELTA * 0.5)
;d1 : relaxation delay; 1-5 * T1
;d16: delay for gradient recovery
;d20: diffusion time (big DELTA)
;d21: eddy current delay (Te) [5 ms]
;NS: 8 * n
;DS: 4 * m
;td1: number of experiments
;FnMODE: QF
; use xf2 and DOSY processing
;use gradient ratio: gp 6 : gp 7 : gp 8
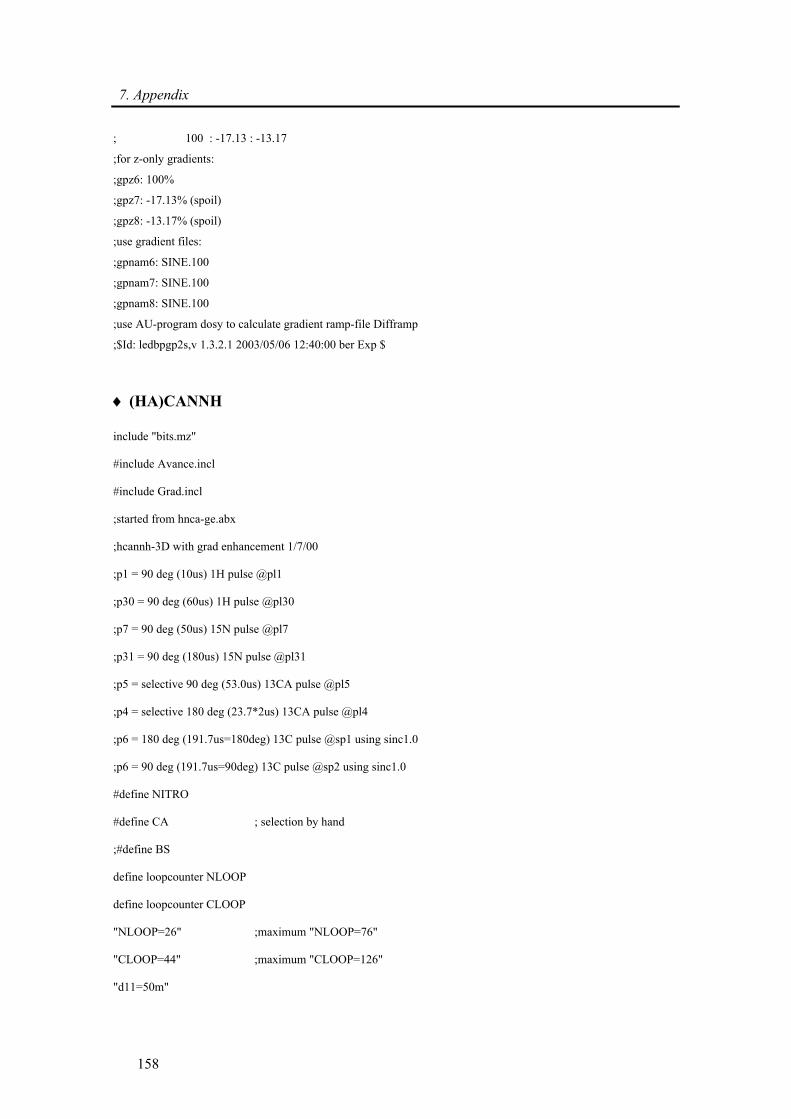
7. Appendix
158
; 100 : -17.13 : -13.17
;for z-only gradients:
;gpz6: 100%
;gpz7: -17.13% (spoil)
;gpz8: -13.17% (spoil)
;use gradient files:
;gpnam6: SINE.100
;gpnam7: SINE.100
;gpnam8: SINE.100
;use AU-program dosy to calculate gradient ramp-file Difframp
;$Id: ledbpgp2s,v 1.3.2.1 2003/05/06 12:40:00 ber Exp $
♦ (HA)CANNH
include "bits.mz"
#include Avance.incl
#include Grad.incl
;started from hnca-ge.abx
;hcannh-3D with grad enhancement 1/7/00
;p1 = 90 deg (10us) 1H pulse @pl1
;p30 = 90 deg (60us) 1H pulse @pl30
;p7 = 90 deg (50us) 15N pulse @pl7
;p31 = 90 deg (180us) 15N pulse @pl31
;p5 = selective 90 deg (53.0us) 13CA pulse @pl5
;p4 = selective 180 deg (23.7*2us) 13CA pulse @pl4
;p6 = 180 deg (191.7us=180deg) 13C pulse @sp1 using sinc1.0
;p6 = 90 deg (191.7us=90deg) 13C pulse @sp2 using sinc1.0
#define NITRO
#define CA ; selection by hand
;#define BS
define loopcounter NLOOP
define loopcounter CLOOP
"NLOOP=26" ;maximum "NLOOP=76"
"CLOOP=44" ;maximum "CLOOP=126"
"d11=50m"
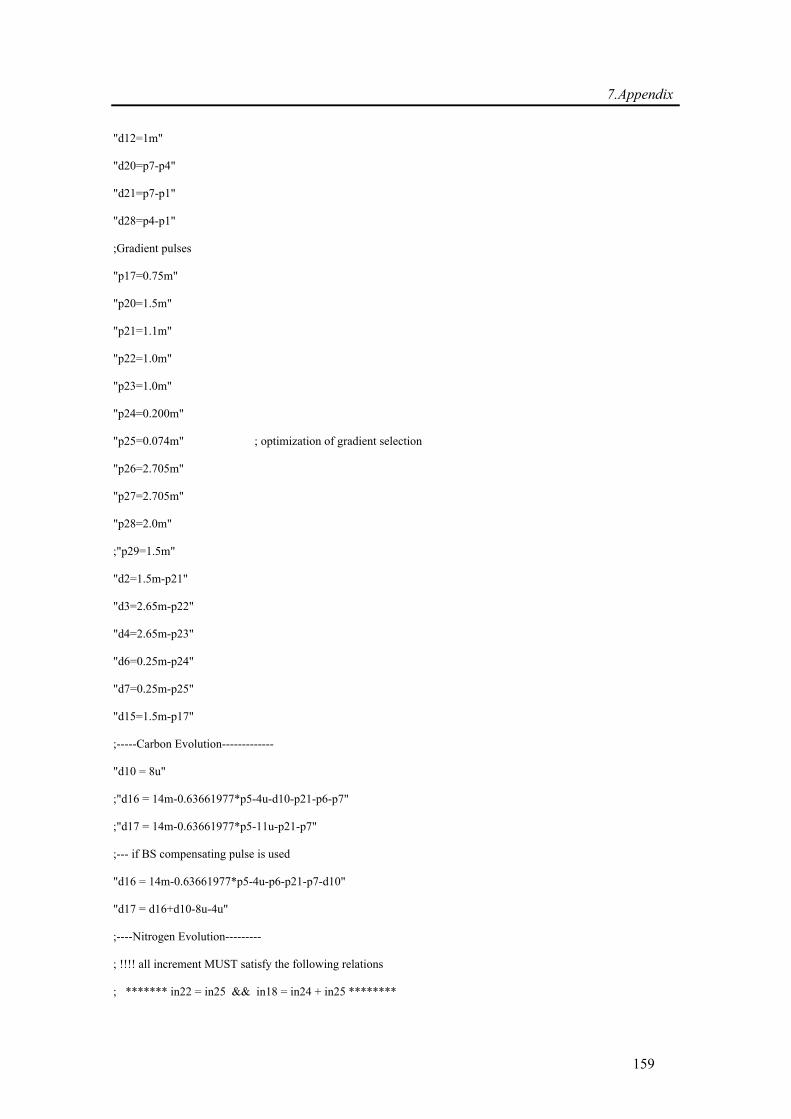
7.Appendix
159
"d12=1m"
"d20=p7-p4"
"d21=p7-p1"
"d28=p4-p1"
;Gradient pulses
"p17=0.75m"
"p20=1.5m"
"p21=1.1m"
"p22=1.0m"
"p23=1.0m"
"p24=0.200m"
"p25=0.074m" ; optimization of gradient selection
"p26=2.705m"
"p27=2.705m"
"p28=2.0m"
;"p29=1.5m"
"d2=1.5m-p21"
"d3=2.65m-p22"
"d4=2.65m-p23"
"d6=0.25m-p24"
"d7=0.25m-p25"
"d15=1.5m-p17"
;-----Carbon Evolution-------------
"d10 = 8u"
;"d16 = 14m-0.63661977*p5-4u-d10-p21-p6-p7"
;"d17 = 14m-0.63661977*p5-11u-p21-p7"
;--- if BS compensating pulse is used
"d16 = 14m-0.63661977*p5-4u-p6-p21-p7-d10"
"d17 = d16+d10-8u-4u"
;----Nitrogen Evolution---------
; !!!! all increment MUST satisfy the following relations
; ******* in22 = in25 && in18 = in24 + in25 ********
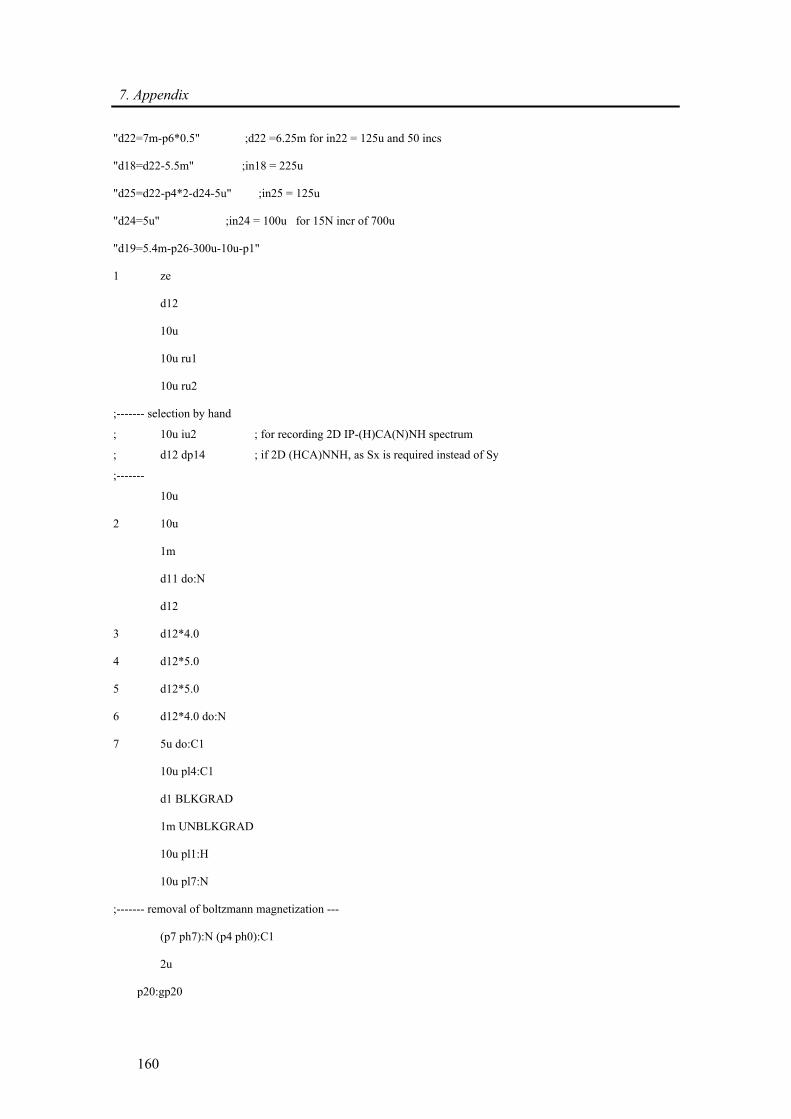
7. Appendix
160
"d22=7m-p6*0.5" ;d22 =6.25m for in22 = 125u and 50 incs
"d18=d22-5.5m" ;in18 = 225u
"d25=d22-p4*2-d24-5u" ;in25 = 125u
"d24=5u" ;in24 = 100u for 15N incr of 700u
"d19=5.4m-p26-300u-10u-p1"
1 ze
d12
10u
10u ru1
10u ru2
;------- selection by hand
; 10u iu2 ; for recording 2D IP-(H)CA(N)NH spectrum
; d12 dp14 ; if 2D (HCA)NNH, as Sx is required instead of Sy
;-------
10u
2 10u
1m
d11 do:N
d12
3 d12*4.0
4 d12*5.0
5 d12*5.0
6 d12*4.0 do:N
7 5u do:C1
10u pl4:C1
d1 BLKGRAD
1m UNBLKGRAD
10u pl1:H
10u pl7:N
;------- removal of boltzmann magnetization ---
(p7 ph7):N (p4 ph0):C1
2u
p20:gp20
7.Appendix
161
1.0m
;------- INEPT HA -> CA -----------------------
(p1 ph0):H
10u
p21:gp21
d2
(d28 p1*2 ph1):H (p4*2 ph8):C1
10u
p21:gp21
d2
(p1 ph2):H
10u
;------- flip back -----------------------
; problems with water flip back !!
; if "l2==1" goto 13
; (p2 ph0):H
; if "l2==2" goto 14
;13 (p2 ph20):H
;14 50u pl1:H
300u pl5:C1
;------- IPAP selection -----------------------
if "l2==1" goto 15
(p5 ph0):C1
2u
p17:gp20
d15 pl4:C1
(p4*2 ph5):C1 (d28 p1*2 ph0):H
2u
p17:gp20
d15 pl5:C1
(p5 ph3):C1
4u
7. Appendix
162
p20:gp20
1m
(p5 ph14):C1
2u
if "l2==2" goto 16
15 20u ; symmetry gradients
p17:gp20
d15
p17:gp20
d15
p20:gp20
1m
(p5 ph0):C1
2u
;------- end IPAP selection -----------------------
;--------------- CT evolution on CA -------------------
16 d10
(p6:sp1 ph0):C1 ;carbonyl decoupling with sinc
2u
p21:gp19
d16 pl4:C1
(d20 p4*2 ph13):C1 (p7*2 ph0):N
2u
p21:gp19
d17 pl5:C1
4u
(p6:sp1 ph0):C1 ;BS compensating pulse
2u
8u pl5:C1
(p5 ph6):C1
5u
7.Appendix
163
p28:gp28
300u pl5:C1
(p1 ph1):H ;trim H decoup on
5u pl30:H
5u cpds1:H
;--------------- CT evolution on N -------------------
(p7 ph10):N
d22
(p6:sp1 ph0):C1 ;carbonyl decoupling with sinc
d22
(p7*2 ph7):N
d24
5u pl4:C1
(p4*2 ph0):C1
d25
(p6:sp1 ph0):C1 ;carbonyl decoupling with sinc
d18
0.1m do:H ;H decoupling off
10u pl1:H
(p1 ph3):H ;trim pulse
d19 pl1:H
;alternating Rance-Kay coherence encoding
if "l1==1" goto 10
if "l1==2" goto 20
10 p26:gp26 ;coherence encoding gradient
100u
goto 30
20 p27:gp27 ;coherence encoding gradient
100u
30 200u pl1:H
;end coherence encoding
(p7 ph9):N (d21 p1 ph0):H
7. Appendix
164
;--------- Rance-Kay transfer N -> HN --------------------
2u
p22:gp22
d3
(d21 p1*2 ph0):H (p7*2 ph7):N
2u
p22:gp22
d3
(p1 ph1):H (p7 ph8):N
2u
p23:gp23
d4
(d21 p1*2 ph0):H (p7*2 ph7):N
2u
p23:gp23
d4
(d21 p1 ph0):H (p7 ph0):N
4u
p24:gp24
d6
(p1*2 ph0):H
2u
p25:gp25
d7 pl31:N
(2u ph0)
go=2 ph31 cpd2:N
10u do:N
1m BLKGRAD
d11 wr #0 if #0 zd
;------- selection by hand
d12 iu2 ; 3D IPAP selection
lo to 3 times 2
7.Appendix
165
d12 ru2
;-------
#ifdef NITRO
d12 ip9
d12 ip9
d12 iu1
lo to 4 times 2
d12 ru1
d12 dd22
d12 id18
d12 id24
d12 id25
lo to 5 times NLOOP
d12 rd22
d12 rd24
d12 rd25
d12 rd18
#endif
#ifdef CA
d12 ip6
lo to 6 times 2
d12 id10
d12 dd17
d12 ip31
d12 ip31
lo to 7 times CLOOP
#endif
#ifdef BS
d12 ip13
lo to 7 times td1
#endif
d12
7. Appendix
166
d12 do:C1
d12 do:N
exit
ph0=0
ph1=1
ph2=1 3
;ph2=3
ph3=3
ph5=0
;ph6=0 2
ph6=0
ph7=0
ph8=1
ph9=2
ph10=0 0 2 2
ph11=0
ph13=0
;ph13=(360) 11 ;BS compensation
ph14=2
ph20=2
ph31=0 2 2 0

167
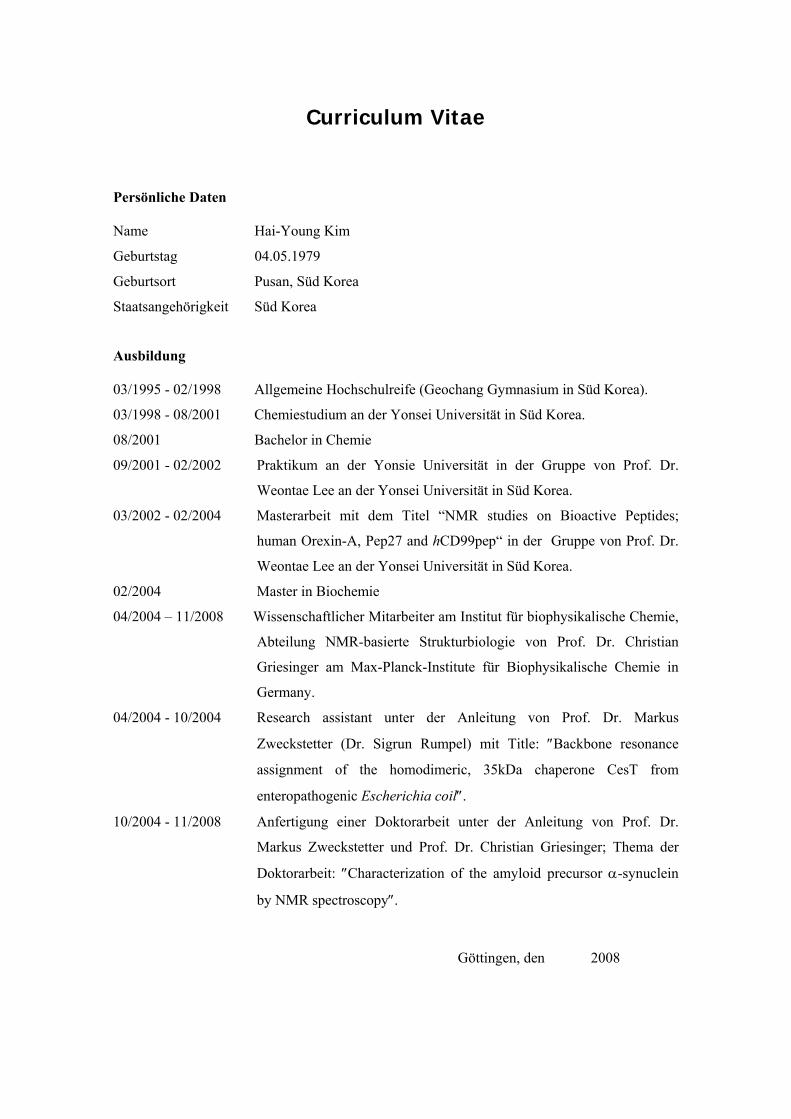
Persönliche Daten
Name Hai-Young Kim
Geburtstag 04.05.1979
Geburtsort Pusan, Süd Korea
Staatsangehörigkeit Süd Korea
Ausbildung
03/1995 - 02/1998 Allgemeine Hochschulreife (Geochang Gymnasium in Süd Korea).
03/1998 - 08/2001 Chemiestudium an der Yonsei Universität in Süd Korea.
08/2001 Bachelor in Chemie
09/2001 - 02/2002 Praktikum an der Yonsie Universität in der Gruppe von Prof. Dr.
Weontae Lee an der Yonsei Universität in Süd Korea.
03/2002 - 02/2004 Masterarbeit mit dem Titel “NMR studies on Bioactive Peptides;
human Orexin-A, Pep27 and hCD99pep“ in der Gruppe von Prof. Dr.
Weontae Lee an der Yonsei Universität in Süd Korea.
02/2004 Master in Biochemie
04/2004 – 11/2008 Wissenschaftlicher Mitarbeiter am Institut für biophysikalische Chemie,
Abteilung NMR-basierte Strukturbiologie von Prof. Dr. Christian
Griesinger am Max-Planck-Institute für Biophysikalische Chemie in
Germany.
04/2004 - 10/2004 Research assistant unter der Anleitung von Prof. Dr. Markus
Zweckstetter (Dr. Sigrun Rumpel) mit Title: ″Backbone resonance
assignment of the homodimeric, 35kDa chaperone CesT from
enteropathogenic Escherichia coil″.
10/2004 - 11/2008 Anfertigung einer Doktorarbeit unter der Anleitung von Prof. Dr.
Markus Zweckstetter und Prof. Dr. Christian Griesinger; Thema der
Doktorarbeit: ″Characterization of the amyloid precursor α-synuclein
by NMR spectroscopy″.
Göttingen, den 2008
Curriculum Vitae