Embed Size (px)
Citation preview
Journal of Alloys and Compounds 582 (2014) 827–833
Contents lists available at ScienceDirect
Journal of Alloys and Compounds
journal homepage: www.elsevier .com/locate / ja lcom
Characterization of the interface between an Fe–Cr alloy and the p-typethermoelectric oxide Ca3Co4O9
0925-8388/$ - see front matter � 2013 Elsevier B.V. All rights reserved.http://dx.doi.org/10.1016/j.jallcom.2013.08.096
⇑ Corresponding author. Tel.: +45 21798782.E-mail addresses: [email protected], [email protected] (T.C. Holgate).
Tim C. Holgate a,⇑, Li Han a, NingYu Wu a, Espen D. Bøjesen b, Mogens Christensen b, Bo B. Iversen b,Ngo Van Nong a, Nini Pryds a
a Dept. of Energy Conversion and Storage, Technical University of Denmark, Risø Campus, Frederiksborgvej 399, Building 779, 4000 Roskilde, Denmarkb Centre for Materials Crystallography, Department of Chemistry and iNANO, Aarhus University, 8000 Aarhus C, Denmark
a r t i c l e i n f o
Article history:Received 15 July 2013Received in revised form 12 August 2013Accepted 13 August 2013Available online 30 August 2013
Keywords:Metal-oxide interfaceCa3Co4O9
ThermoelectricModuleContact resistance
a b s t r a c t
A customized Fe–Cr alloy that has been optimized for high temperature applications in oxidizing atmo-spheres has been interfaced via spark plasma sintering (SPS) with a p-type thermoelectric oxide material:calcium cobaltate (Ca3Co4O9). The properties of the alloy have been analyzed for its compatibility withthe Ca3Co4O9 in terms of its thermal expansion and transport properties. The thermal and electrical con-tact resistances have been measured as a function of temperature, and the long term electronic integrityof the interface analyzed by measuring the resistance vs. time at an elevated temperature. The kinetics ofthe interface have been analyzed through imaging with scanning electron microscopy (SEM), elementalanalysis using energy dispersive spectroscopy (EDS), and phase identification with X-ray diffraction(XRD). The results reveal the formation of an intermediate phase containing calcium and chromium inthe interface that is highly resistive at room temperature, but conducting at the intended thermoelectricdevice hot-side operating temperature of 800 �C. As the alloy is well matched in terms of its thermalexpansion and highly conducting compared to the Ca3Co4O9, it may be further considered as an intercon-nect material candidate at least with application on the hot-side of an oxide thermoelectric powergeneration module.
� 2013 Elsevier B.V. All rights reserved.
1. Introduction
The past several decades have witnessed great advances inmaterials research pertaining to renewable energy technologies.Oxides often play a role as energy materials in many of these tech-nologies, such as solid oxide fuel cells (SOFCs) and thermoelectric-ity. Oxide thermoelectrics are excellent candidates for hightemperature thermoelectric (TE) energy conversion due to theirchemical stability in air at the high temperatures associated withwaste heat recovery (up to 800 �C) and the relative low cost andavailability of materials [1]. Inevitably, the issue of forming wellcontacted interfaces (that is to say, exhibiting low thermal andelectrical contact resistance) between these oxides and pure met-als or alloys serving as interconnects must be addressed in orderto minimize the internal resistances of the modules to maximizethe power output. This issue is compounded at high temperaturesin that the chemical stability of the metal-oxide interface is under-mined by mass diffusion and the formation of intermediate phasesthat may degrade the electrical and structural integrity of theinterface. Wide-scale implementation of oxide thermoelectric
power generation modules in the recovery of waste heat energywill require the development of oxide TE-interconnect contactinterfaces that are long term chemically and electrically stable inair and minimal in their contribution to the internal resistancesof modules.
Several reviews have covered the extensive work on contactresistances between metal interconnects and oxide cathode andanode materials in SOFCs [2,3]. While a great deal of informationmay be gleaned from the work in SOFCs, there are a few key differ-ences between SOFCs and oxide TE applications. First of all, SOFCsinvolve both oxidizing and reducing atmospheres whereas oxideTEs generally only operate in air. Secondly, the excepted value ofarea specific contact resistance (ASR) for SOFCs (<100 mX cm2) isunacceptably high by a few orders of magnitude for oxide TE appli-cations. This is due to their considerably lower densities (SOFCcathodes and anodes are porous) and higher intrinsic resistivitiesthan oxide TE materials. So while the issue of atmosphere is sim-pler for oxide TEs, the issue of the contact resistance of metal inter-connect-oxide TE interfaces may be more demanding to solve sinceit is the relative magnitude of the contact resistance in comparisonto the intrinsic material resistances that matters.
There have been a limited number of works that address the is-sue of contact resistance in both alloy/intermetallic [4–6] and
828 T.C. Holgate et al. / Journal of Alloys and Compounds 582 (2014) 827–833
oxide thermoelectric devices [7–11]. As for the latter, Ca3Co4O9
(pure or doped) was used as the p-type material in all but Ref.[11] (Arai et al.) which used a related cobaltate – NaCo2O4. Severalother well-known studies have focused on Ca3Co4O9 as the p-typeTE element of a unicouple or TE module but without quantitativeanalysis of the contact resistances [12–15]. In these studies, theauthors made contact between TE elements using either screenprinted Ag paste [14,15] or combination of Ag paste mixed witha few percent of oxide TE powders and Ag foil [12,13], with the lat-ter resulting in a decrease of the total internal resistance and betterstability of the Ca3Co4O9 based TE modules.
As for Refs. [7–10], the contact resistance was obtained by sub-tracting the theoretical resistances of the TE elements based ontheir intrinsic resistivities and dimensions from the total measuredresistances of the unicouples or modules; only Arai et al. [11] useda preferred method of extrapolating a resistance vs. distance to theinterface to quantify the contact resistance. In their work, Arai et el.successfully formed stable contacts between Ni interconnects andboth p-type NaCo2O4 and n-type Mg2Si via spark plasma sintering(a method also used by Zhao et al. [5]) by introducing a buffer layerof Ni powder mixed with SrRuO3 between the Ni interconnect andthe TE elements – presumably inhibiting the growth of NiO at theinterface.
The work presented herein explores the feasibility of a high per-formance Fe–Cr alloy as an interconnect material in oxide thermo-electric power generation modules where the p-type TE elementis calcium cobaltate. Using SPS as the method for interfacing and acareful measurement of the contact resistance by extrapolation ofthe resistance vs. distance to the interface, the analysis of an Fe–Cr alloy is presented and discussed both in terms of the magnitudeof the contact resistance and the long term stability of the interfaceat high temperatures. A tailored Fe–22%Cr alloy (denoted as Fe22Cr)was chosen for this study in light of the success of high-chrome steelalloys in high temperature solid oxide fuel cell applications – mainlydue to their high temperature corrosion resistance and a thermalexpansion coefficient on the order of many conducting oxides [2].
2. Experimental methods
2.1. Sample preparation
The interfaces were formed by first pelletizing the alloy powders (average par-ticle size of �47 lm) using a spark plasma sintering (SPS) system (Dr. Sinter 515S,Fuji Electronic Industrial Co., Japan). The pellet was then cut and polished withP1000 SiC metallurgical paper, placed back into the graphite SPS dies, and the Ca3-
Co4O9 powders placed on top of the alloy pellet (Fig. 1). The densification of the Ca3-
Co4O9 and the formation of the interface were then performed simultaneously atconditions optimized for the Ca3Co4O9 [16]. Forming the interface directly usingSPS was decided upon because of the mechanical strength and scalability that theprocess may provide. Though the high current density involved in the highly dy-namic SPS process may result in an expedited initial growth of interfacial secondaryphases, the eventual formation of these phases at operational temperaturesmitigates this possible disadvantage of the SPS process.
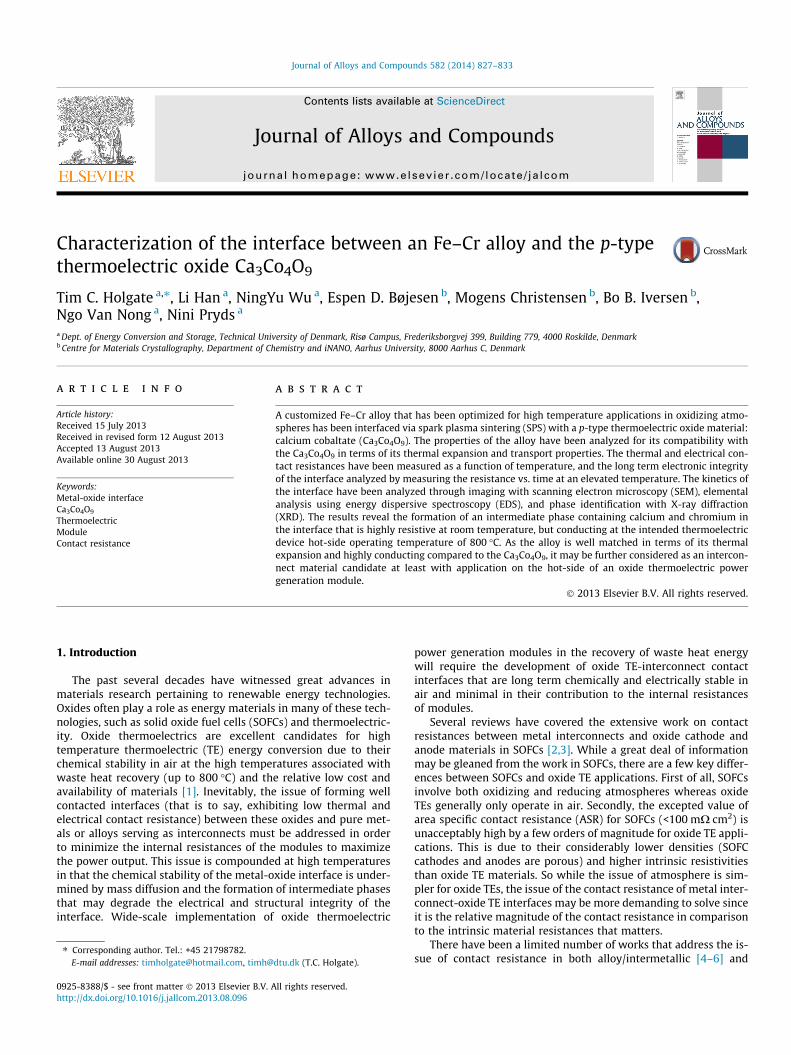
Fig. 1. Cross-sectional schematic of the SPS die with punch and sample configu-ration for simultaneous densification and interfacing of samples.
Both bi-layered (Fe22Cr/Ca3Co4O9) and tri-layered (Ca3Co4O9/Fe22Cr/Ca3Co4O9)samples were prepared for the various characterization measurements (Fig. 1). Addi-tionally, a comparative sample of pure nickel with Ca3Co4O9 was prepared in the samemanner using 400 mesh (<47 lm) Ni powders (Alfa Aesar, 99.99%). Samples were cutwith a diamond saw, polished with SiC metallurgical paper and cleaned with ethanolbefore measurements. Additionally, pure samples of both Fe22Cr and Ca3Co4O9 wereprepared for individual characterization in order to determine their contributions tothepropertiesofthelayeredsamples.ThedensityoftheFe22CrsamplemeasuredusingArchimedes’ method was 7.67 g/cm3. Using a statistical pixel counting method per-formed on cross-sectional scanning electron micrograph digital images, the Fe22Crsample exhibited a porosity of about 1.1%, which corresponds to a full density of7.76 g/cm3 – a value that agrees well with the theoretical density calculated using lat-tice parameters determined by X-ray diffraction (Bruker D8, Cu ka): 7.78 g/cm3. In allcases, thedensitiesoftheCa3Co4O9 samplesweremorethan99%ofthetheoreticalden-sity (4.68 g/cm3) [17] and showed no porosity.
2.2. Transport measurement methods
The thermal and electronic transport across the interfaces were measured usinga Netzch LFA-457 laser flash apparatus and a custom built system utilizing the four-probe technique, respectively. Specifically, the thermal contact resistance wasdetermined by first measuring the thermal diffusivity of Fe22Cr and Ca3Co4O9 inde-pendently using the Cape–Lehman model [18]. Data were measured on thebi-layered samples and the single layer results fed back into the Netzsch LFA anal-ysis software using a model for two-layers with contact resistance (based on thework of Hartmann et al. [19]).
The initial electrical contact resistance after interfacing via SPS was measuredon bar-shaped bi-layered samples from room temperature up to 800 �C. The sche-matic of the custom system used is presented in Fig. 2. This configuration allowsfor the determination of the resistivity of each component material, as well asthe contact resistance (Rc) of the interface by linear extrapolation of the resistance(R) vs. the distance to the interface (xn to0) and subsequent subtraction of the con-tribution from the alloy between the probe lead and the interface:
RC ¼ interceptðR vs: x6...3 to 0Þ � R1 to 2x1 to 2
x2 to 0ð1Þ
Using a four-probe Keithley 580 Micro-ohmmeter and a double-pole, 6-throwrotary switch, the current was injected at the two ends of the sample and the volt-age probed at various positions along the surface and across the interface via0.1 mm platinum wire leads affixed with silver paste. The separation of the leadsand positions relative to the interface were measured using the cell-A softwarepackage with images taken from an Olympus SC20 digital camera affixed to anOlympus SZX9 stereomicroscope. The voltage leads were arranged so that the fourleads used to obtain the resistance as a function of distance to the interface datawere evenly spaced along the Ca3Co4O9. The order of magnitude higher resistivityof the TE oxide compared to the interconnect allowed for a high signal-to-noiseratio in the four-probe measurement of the Keithley micro-ohmmeter and easysubtraction of the contribution of the interconnect to the intercept of R vs. xnto 0.
The Keithley micro-ohmmeter was set to pulse mode where the current is im-puted and the voltage probed for 150 ms and then the current is shutoff and a base-line voltage obtained for subtraction. This baseline voltage should account for anyoffsets due to thermal gradients, i.e., thermoelectric voltages. Still, measurementswere taken with both the forward and reverse current configurations and the re-sults averaged. Data was not recorded for a given temperature until both the systemtemperature was stabilized and the difference in forward and reverse mode resis-tances minimized.
In both measurements, the ‘‘contact’’ resistance is actually the interface resis-tance, which includes the electrical or thermal resistance of the intermediatephases and their respective contact resistances with the alloy and Ca3Co4O9. Theseresistances are multiplied by the cross-sectional area of the interface to give thearea specific resistance of the interface (ASR).
2.3. Microstructures and interface evolution
In order to ascertain the chemical stability of the interface, scanning electronmicroscopy (SEM) was employed with energy dispersive X-ray spectroscopy(EDS). As-prepared interfaced samples were cross-sectioned and polished for
Fig. 2. Schematic of the electrical contact resistance measurement configuration.The darker shaded material is the Ca3Co4O9 and the sign convention of the currentis for forward current mode.
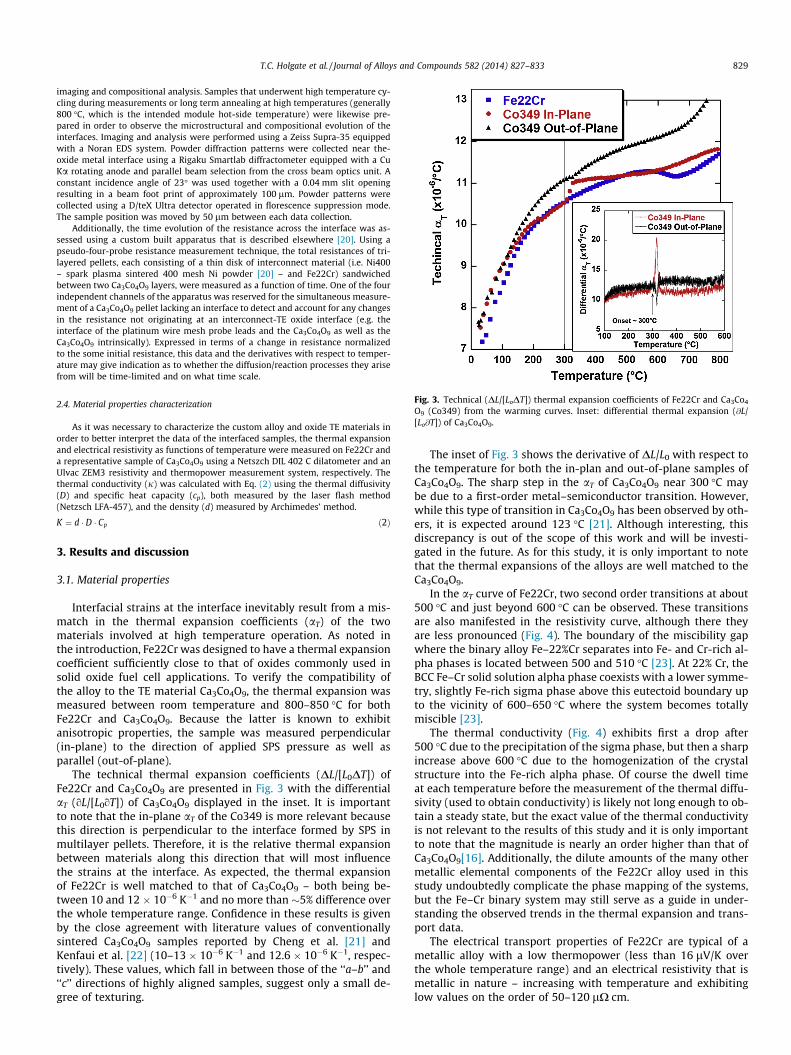
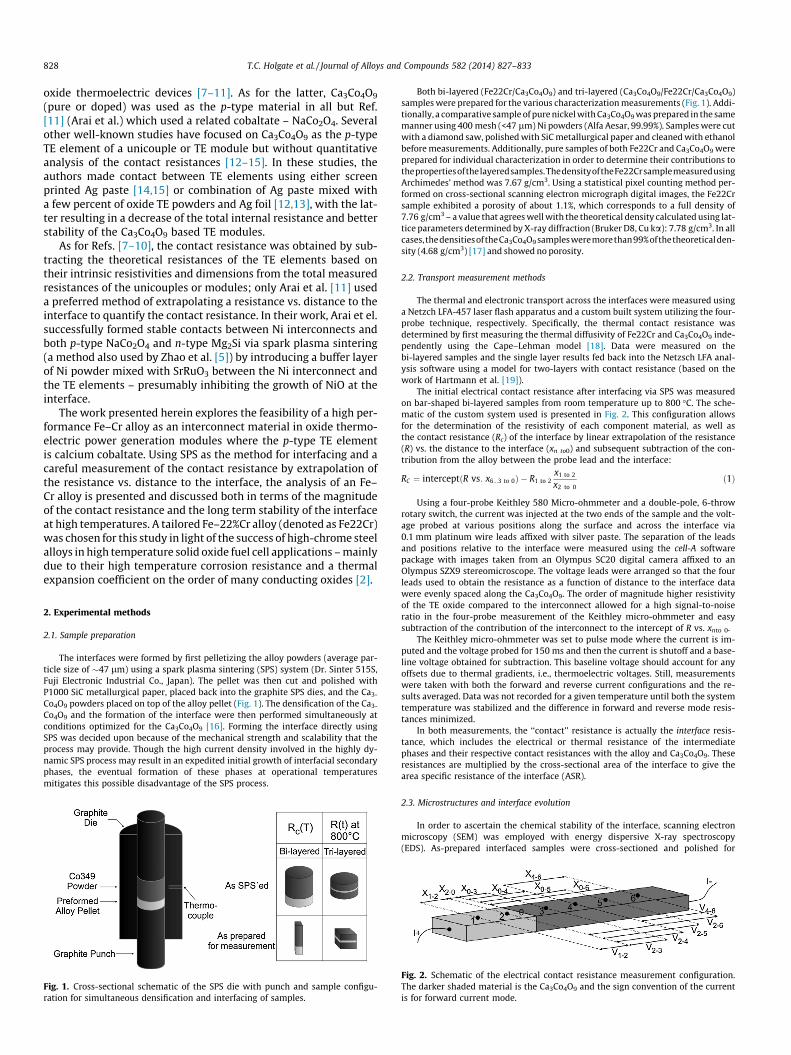
Fig. 3. Technical (DL/[LoDT]) thermal expansion coefficients of Fe22Cr and Ca3Co4
O9 (Co349) from the warming curves. Inset: differential thermal expansion (@L/[Lo@T]) of Ca3Co4O9.
T.C. Holgate et al. / Journal of Alloys and Compounds 582 (2014) 827–833 829
imaging and compositional analysis. Samples that underwent high temperature cy-cling during measurements or long term annealing at high temperatures (generally800 �C, which is the intended module hot-side temperature) were likewise pre-pared in order to observe the microstructural and compositional evolution of theinterfaces. Imaging and analysis were performed using a Zeiss Supra-35 equippedwith a Noran EDS system. Powder diffraction patterns were collected near the-oxide metal interface using a Rigaku Smartlab diffractometer equipped with a CuKa rotating anode and parallel beam selection from the cross beam optics unit. Aconstant incidence angle of 23� was used together with a 0.04 mm slit openingresulting in a beam foot print of approximately 100 lm. Powder patterns werecollected using a D/teX Ultra detector operated in florescence suppression mode.The sample position was moved by 50 lm between each data collection.
Additionally, the time evolution of the resistance across the interface was as-sessed using a custom built apparatus that is described elsewhere [20]. Using apseudo-four-probe resistance measurement technique, the total resistances of tri-layered pellets, each consisting of a thin disk of interconnect material (i.e. Ni400– spark plasma sintered 400 mesh Ni powder [20] – and Fe22Cr) sandwichedbetween two Ca3Co4O9 layers, were measured as a function of time. One of the fourindependent channels of the apparatus was reserved for the simultaneous measure-ment of a Ca3Co4O9 pellet lacking an interface to detect and account for any changesin the resistance not originating at an interconnect-TE oxide interface (e.g. theinterface of the platinum wire mesh probe leads and the Ca3Co4O9 as well as theCa3Co4O9 intrinsically). Expressed in terms of a change in resistance normalizedto the some initial resistance, this data and the derivatives with respect to temper-ature may give indication as to whether the diffusion/reaction processes they arisefrom will be time-limited and on what time scale.
2.4. Material properties characterization
As it was necessary to characterize the custom alloy and oxide TE materials inorder to better interpret the data of the interfaced samples, the thermal expansionand electrical resistivity as functions of temperature were measured on Fe22Cr anda representative sample of Ca3Co4O9 using a Netszch DIL 402 C dilatometer and anUlvac ZEM3 resistivity and thermopower measurement system, respectively. Thethermal conductivity (j) was calculated with Eq. (2) using the thermal diffusivity(D) and specific heat capacity (cp), both measured by the laser flash method(Netzsch LFA-457), and the density (d) measured by Archimedes’ method.
K ¼ d � D � Cp ð2Þ
3. Results and discussion
3.1. Material properties
Interfacial strains at the interface inevitably result from a mis-match in the thermal expansion coefficients (aT) of the twomaterials involved at high temperature operation. As noted inthe introduction, Fe22Cr was designed to have a thermal expansioncoefficient sufficiently close to that of oxides commonly used insolid oxide fuel cell applications. To verify the compatibility ofthe alloy to the TE material Ca3Co4O9, the thermal expansion wasmeasured between room temperature and 800–850 �C for bothFe22Cr and Ca3Co4O9. Because the latter is known to exhibitanisotropic properties, the sample was measured perpendicular(in-plane) to the direction of applied SPS pressure as well asparallel (out-of-plane).
The technical thermal expansion coefficients (DL/[L0DT]) ofFe22Cr and Ca3Co4O9 are presented in Fig. 3 with the differentialaT (oL/[L0oT]) of Ca3Co4O9 displayed in the inset. It is importantto note that the in-plane aT of the Co349 is more relevant becausethis direction is perpendicular to the interface formed by SPS inmultilayer pellets. Therefore, it is the relative thermal expansionbetween materials along this direction that will most influencethe strains at the interface. As expected, the thermal expansionof Fe22Cr is well matched to that of Ca3Co4O9 – both being be-tween 10 and 12 � 10�6 K�1 and no more than �5% difference overthe whole temperature range. Confidence in these results is givenby the close agreement with literature values of conventionallysintered Ca3Co4O9 samples reported by Cheng et al. [21] andKenfaui et al. [22] (10–13 � 10�6 K�1 and 12.6 � 10�6 K�1, respec-tively). These values, which fall in between those of the ‘‘a–b’’ and‘‘c’’ directions of highly aligned samples, suggest only a small de-gree of texturing.
The inset of Fig. 3 shows the derivative of DL/L0 with respect tothe temperature for both the in-plan and out-of-plane samples ofCa3Co4O9. The sharp step in the aT of Ca3Co4O9 near 300 �C maybe due to a first-order metal–semiconductor transition. However,while this type of transition in Ca3Co4O9 has been observed by oth-ers, it is expected around 123 �C [21]. Although interesting, thisdiscrepancy is out of the scope of this work and will be investi-gated in the future. As for this study, it is only important to notethat the thermal expansions of the alloys are well matched to theCa3Co4O9.
In the aT curve of Fe22Cr, two second order transitions at about500 �C and just beyond 600 �C can be observed. These transitionsare also manifested in the resistivity curve, although there theyare less pronounced (Fig. 4). The boundary of the miscibility gapwhere the binary alloy Fe–22%Cr separates into Fe- and Cr-rich al-pha phases is located between 500 and 510 �C [23]. At 22% Cr, theBCC Fe–Cr solid solution alpha phase coexists with a lower symme-try, slightly Fe-rich sigma phase above this eutectoid boundary upto the vicinity of 600–650 �C where the system becomes totallymiscible [23].
The thermal conductivity (Fig. 4) exhibits first a drop after500 �C due to the precipitation of the sigma phase, but then a sharpincrease above 600 �C due to the homogenization of the crystalstructure into the Fe-rich alpha phase. Of course the dwell timeat each temperature before the measurement of the thermal diffu-sivity (used to obtain conductivity) is likely not long enough to ob-tain a steady state, but the exact value of the thermal conductivityis not relevant to the results of this study and it is only importantto note that the magnitude is nearly an order higher than that ofCa3Co4O9[16]. Additionally, the dilute amounts of the many othermetallic elemental components of the Fe22Cr alloy used in thisstudy undoubtedly complicate the phase mapping of the systems,but the Fe–Cr binary system may still serve as a guide in under-standing the observed trends in the thermal expansion and trans-port data.
The electrical transport properties of Fe22Cr are typical of ametallic alloy with a low thermopower (less than 16 lV/K overthe whole temperature range) and an electrical resistivity that ismetallic in nature – increasing with temperature and exhibitinglow values on the order of 50–120 lX cm.
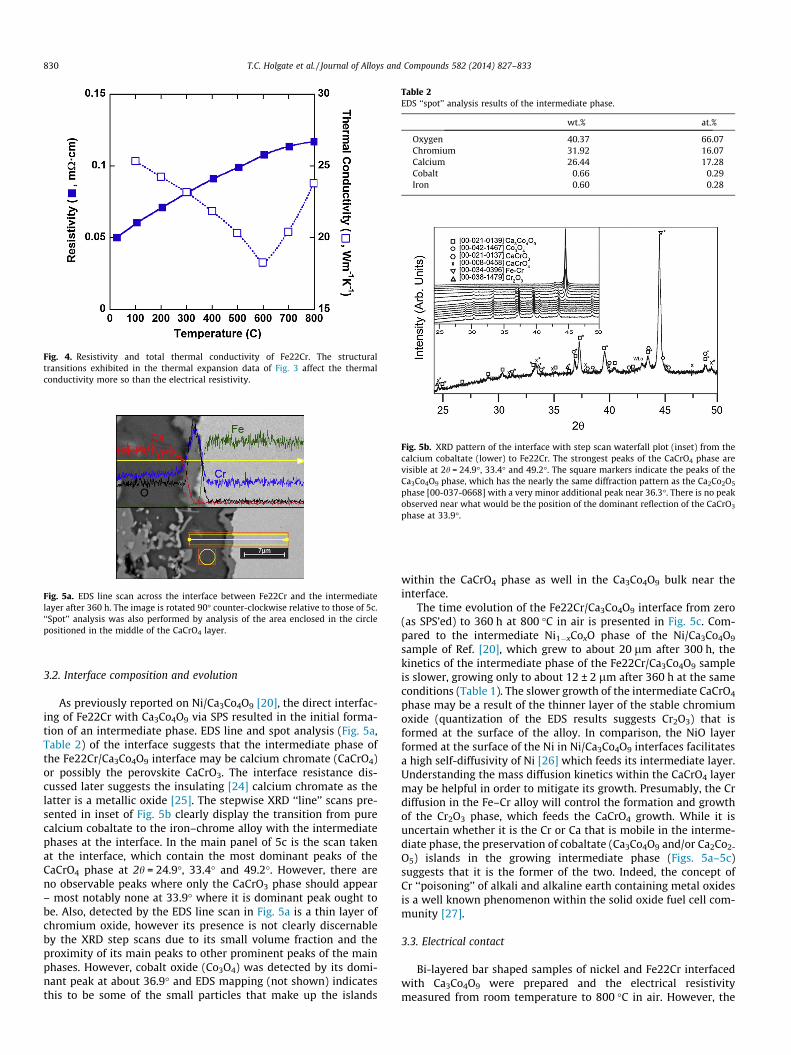
Fig. 4. Resistivity and total thermal conductivity of Fe22Cr. The structuraltransitions exhibited in the thermal expansion data of Fig. 3 affect the thermalconductivity more so than the electrical resistivity.
Fig. 5a. EDS line scan across the interface between Fe22Cr and the intermediatelayer after 360 h. The image is rotated 90� counter-clockwise relative to those of 5c.‘‘Spot’’ analysis was also performed by analysis of the area enclosed in the circlepositioned in the middle of the CaCrO4 layer.
Table 2EDS ‘‘spot’’ analysis results of the intermediate phase.
wt.% at.%
Oxygen 40.37 66.07Chromium 31.92 16.07Calcium 26.44 17.28Cobalt 0.66 0.29Iron 0.60 0.28
Fig. 5b. XRD pattern of the interface with step scan waterfall plot (inset) from thecalcium cobaltate (lower) to Fe22Cr. The strongest peaks of the CaCrO4 phase arevisible at 2h = 24.9�, 33.4� and 49.2�. The square markers indicate the peaks of theCa3Co4O9 phase, which has the nearly the same diffraction pattern as the Ca2Co2O5
phase [00-037-0668] with a very minor additional peak near 36.3�. There is no peakobserved near what would be the position of the dominant reflection of the CaCrO3
phase at 33.9�.
830 T.C. Holgate et al. / Journal of Alloys and Compounds 582 (2014) 827–833
3.2. Interface composition and evolution
As previously reported on Ni/Ca3Co4O9 [20], the direct interfac-ing of Fe22Cr with Ca3Co4O9 via SPS resulted in the initial forma-tion of an intermediate phase. EDS line and spot analysis (Fig. 5a,Table 2) of the interface suggests that the intermediate phase ofthe Fe22Cr/Ca3Co4O9 interface may be calcium chromate (CaCrO4)or possibly the perovskite CaCrO3. The interface resistance dis-cussed later suggests the insulating [24] calcium chromate as thelatter is a metallic oxide [25]. The stepwise XRD ‘‘line’’ scans pre-sented in inset of Fig. 5b clearly display the transition from purecalcium cobaltate to the iron–chrome alloy with the intermediatephases at the interface. In the main panel of 5c is the scan takenat the interface, which contain the most dominant peaks of theCaCrO4 phase at 2h = 24.9�, 33.4� and 49.2�. However, there areno observable peaks where only the CaCrO3 phase should appear– most notably none at 33.9� where it is dominant peak ought tobe. Also, detected by the EDS line scan in Fig. 5a is a thin layer ofchromium oxide, however its presence is not clearly discernableby the XRD step scans due to its small volume fraction and theproximity of its main peaks to other prominent peaks of the mainphases. However, cobalt oxide (Co3O4) was detected by its domi-nant peak at about 36.9� and EDS mapping (not shown) indicatesthis to be some of the small particles that make up the islands
within the CaCrO4 phase as well in the Ca3Co4O9 bulk near theinterface.
The time evolution of the Fe22Cr/Ca3Co4O9 interface from zero(as SPS’ed) to 360 h at 800 �C in air is presented in Fig. 5c. Com-pared to the intermediate Ni1�xCoxO phase of the Ni/Ca3Co4O9
sample of Ref. [20], which grew to about 20 lm after 300 h, thekinetics of the intermediate phase of the Fe22Cr/Ca3Co4O9 sampleis slower, growing only to about 12 ± 2 lm after 360 h at the sameconditions (Table 1). The slower growth of the intermediate CaCrO4
phase may be a result of the thinner layer of the stable chromiumoxide (quantization of the EDS results suggests Cr2O3) that isformed at the surface of the alloy. In comparison, the NiO layerformed at the surface of the Ni in Ni/Ca3Co4O9 interfaces facilitatesa high self-diffusivity of Ni [26] which feeds its intermediate layer.Understanding the mass diffusion kinetics within the CaCrO4 layermay be helpful in order to mitigate its growth. Presumably, the Crdiffusion in the Fe–Cr alloy will control the formation and growthof the Cr2O3 phase, which feeds the CaCrO4 growth. While it isuncertain whether it is the Cr or Ca that is mobile in the interme-diate phase, the preservation of cobaltate (Ca3Co4O9 and/or Ca2Co2-
O5) islands in the growing intermediate phase (Figs. 5a–5c)suggests that it is the former of the two. Indeed, the concept ofCr ‘‘poisoning’’ of alkali and alkaline earth containing metal oxidesis a well known phenomenon within the solid oxide fuel cell com-munity [27].
3.3. Electrical contact
Bi-layered bar shaped samples of nickel and Fe22Cr interfacedwith Ca3Co4O9 were prepared and the electrical resistivitymeasured from room temperature to 800 �C in air. However, the
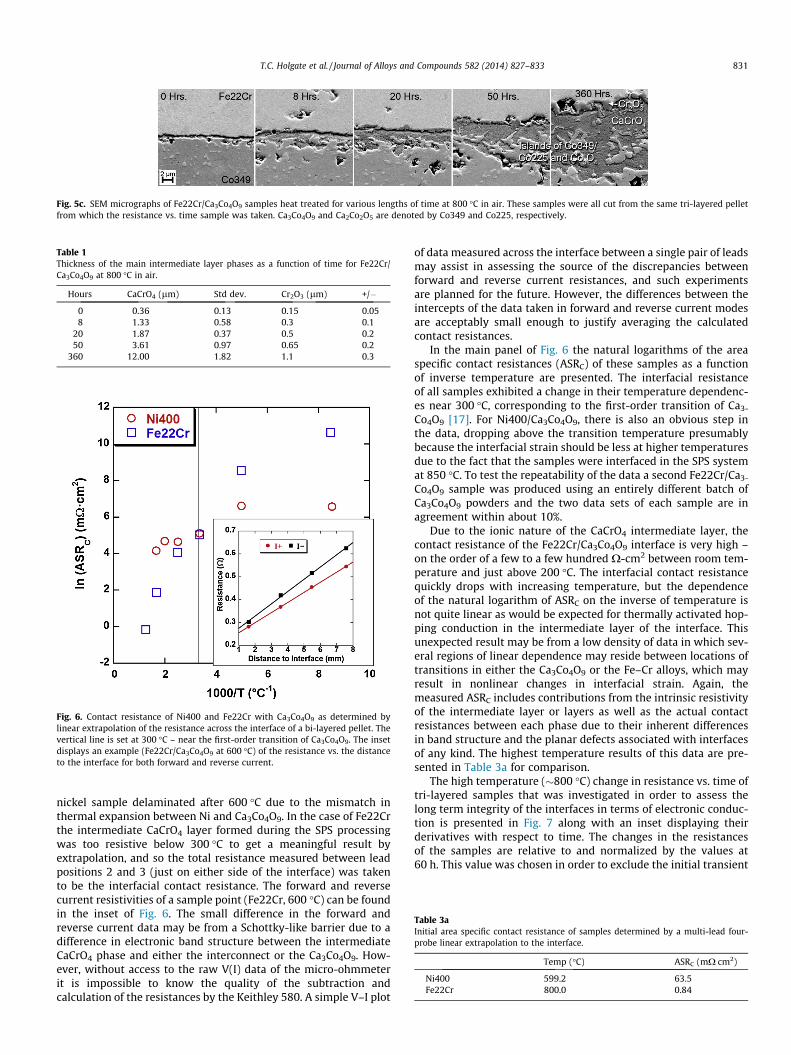
Fig. 5c. SEM micrographs of Fe22Cr/Ca3Co4O9 samples heat treated for various lengths of time at 800 �C in air. These samples were all cut from the same tri-layered pelletfrom which the resistance vs. time sample was taken. Ca3Co4O9 and Ca2Co2O5 are denoted by Co349 and Co225, respectively.
Table 1Thickness of the main intermediate layer phases as a function of time for Fe22Cr/Ca3Co4O9 at 800 �C in air.
Hours CaCrO4 (lm) Std dev. Cr2O3 (lm) +/�
0 0.36 0.13 0.15 0.058 1.33 0.58 0.3 0.1
20 1.87 0.37 0.5 0.250 3.61 0.97 0.65 0.2
360 12.00 1.82 1.1 0.3
Fig. 6. Contact resistance of Ni400 and Fe22Cr with Ca3Co4O9 as determined bylinear extrapolation of the resistance across the interface of a bi-layered pellet. Thevertical line is set at 300 �C – near the first-order transition of Ca3Co4O9. The insetdisplays an example (Fe22Cr/Ca3Co4O9 at 600 �C) of the resistance vs. the distanceto the interface for both forward and reverse current.
Table 3aInitial area specific contact resistance of samples determined by a multi-lead four-probe linear extrapolation to the interface.
Temp (�C) ASRC (mX cm2)
Ni400 599.2 63.5Fe22Cr 800.0 0.84
T.C. Holgate et al. / Journal of Alloys and Compounds 582 (2014) 827–833 831
nickel sample delaminated after 600 �C due to the mismatch inthermal expansion between Ni and Ca3Co4O9. In the case of Fe22Crthe intermediate CaCrO4 layer formed during the SPS processingwas too resistive below 300 �C to get a meaningful result byextrapolation, and so the total resistance measured between leadpositions 2 and 3 (just on either side of the interface) was takento be the interfacial contact resistance. The forward and reversecurrent resistivities of a sample point (Fe22Cr, 600 �C) can be foundin the inset of Fig. 6. The small difference in the forward andreverse current data may be from a Schottky-like barrier due to adifference in electronic band structure between the intermediateCaCrO4 phase and either the interconnect or the Ca3Co4O9. How-ever, without access to the raw V(I) data of the micro-ohmmeterit is impossible to know the quality of the subtraction andcalculation of the resistances by the Keithley 580. A simple V–I plot
of data measured across the interface between a single pair of leadsmay assist in assessing the source of the discrepancies betweenforward and reverse current resistances, and such experimentsare planned for the future. However, the differences between theintercepts of the data taken in forward and reverse current modesare acceptably small enough to justify averaging the calculatedcontact resistances.
In the main panel of Fig. 6 the natural logarithms of the areaspecific contact resistances (ASRC) of these samples as a functionof inverse temperature are presented. The interfacial resistanceof all samples exhibited a change in their temperature dependenc-es near 300 �C, corresponding to the first-order transition of Ca3-
Co4O9 [17]. For Ni400/Ca3Co4O9, there is also an obvious step inthe data, dropping above the transition temperature presumablybecause the interfacial strain should be less at higher temperaturesdue to the fact that the samples were interfaced in the SPS systemat 850 �C. To test the repeatability of the data a second Fe22Cr/Ca3-
Co4O9 sample was produced using an entirely different batch ofCa3Co4O9 powders and the two data sets of each sample are inagreement within about 10%.
Due to the ionic nature of the CaCrO4 intermediate layer, thecontact resistance of the Fe22Cr/Ca3Co4O9 interface is very high –on the order of a few to a few hundred X-cm2 between room tem-perature and just above 200 �C. The interfacial contact resistancequickly drops with increasing temperature, but the dependenceof the natural logarithm of ASRC on the inverse of temperature isnot quite linear as would be expected for thermally activated hop-ping conduction in the intermediate layer of the interface. Thisunexpected result may be from a low density of data in which sev-eral regions of linear dependence may reside between locations oftransitions in either the Ca3Co4O9 or the Fe–Cr alloys, which mayresult in nonlinear changes in interfacial strain. Again, themeasured ASRC includes contributions from the intrinsic resistivityof the intermediate layer or layers as well as the actual contactresistances between each phase due to their inherent differencesin band structure and the planar defects associated with interfacesof any kind. The highest temperature results of this data are pre-sented in Table 3a for comparison.
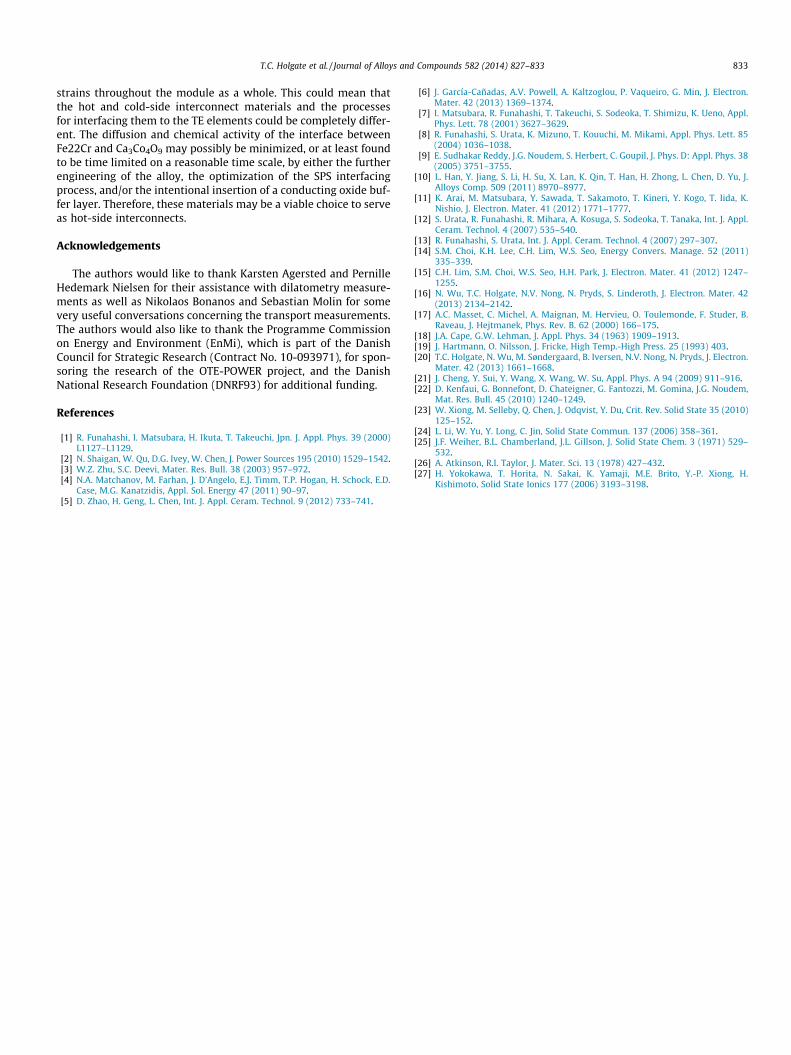
The high temperature (�800 �C) change in resistance vs. time oftri-layered samples that was investigated in order to assess thelong term integrity of the interfaces in terms of electronic conduc-tion is presented in Fig. 7 along with an inset displaying theirderivatives with respect to time. The changes in the resistancesof the samples are relative to and normalized by the values at60 h. This value was chosen in order to exclude the initial transient
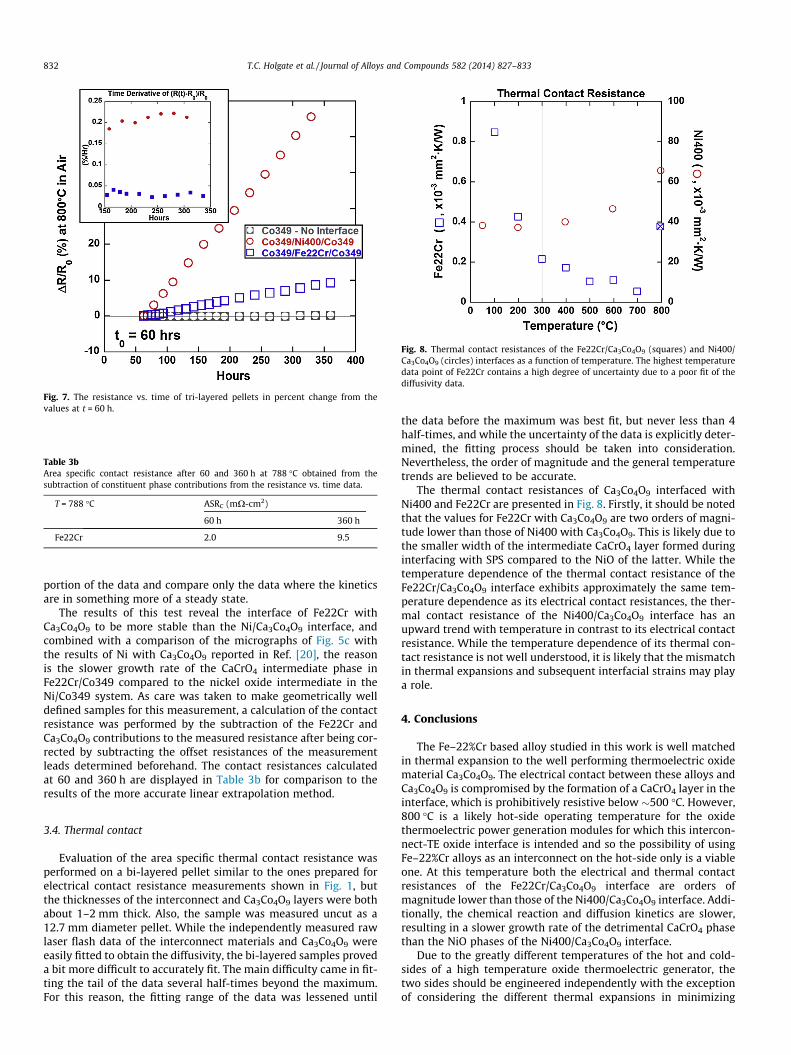
Fig. 7. The resistance vs. time of tri-layered pellets in percent change from thevalues at t = 60 h.
Table 3bArea specific contact resistance after 60 and 360 h at 788 �C obtained from thesubtraction of constituent phase contributions from the resistance vs. time data.
T = 788 �C ASRC (mX-cm2)
60 h 360 h
Fe22Cr 2.0 9.5
Fig. 8. Thermal contact resistances of the Fe22Cr/Ca3Co4O9 (squares) and Ni400/Ca3Co4O9 (circles) interfaces as a function of temperature. The highest temperaturedata point of Fe22Cr contains a high degree of uncertainty due to a poor fit of thediffusivity data.
832 T.C. Holgate et al. / Journal of Alloys and Compounds 582 (2014) 827–833
portion of the data and compare only the data where the kineticsare in something more of a steady state.
The results of this test reveal the interface of Fe22Cr withCa3Co4O9 to be more stable than the Ni/Ca3Co4O9 interface, andcombined with a comparison of the micrographs of Fig. 5c withthe results of Ni with Ca3Co4O9 reported in Ref. [20], the reasonis the slower growth rate of the CaCrO4 intermediate phase inFe22Cr/Co349 compared to the nickel oxide intermediate in theNi/Co349 system. As care was taken to make geometrically welldefined samples for this measurement, a calculation of the contactresistance was performed by the subtraction of the Fe22Cr andCa3Co4O9 contributions to the measured resistance after being cor-rected by subtracting the offset resistances of the measurementleads determined beforehand. The contact resistances calculatedat 60 and 360 h are displayed in Table 3b for comparison to theresults of the more accurate linear extrapolation method.
3.4. Thermal contact
Evaluation of the area specific thermal contact resistance wasperformed on a bi-layered pellet similar to the ones prepared forelectrical contact resistance measurements shown in Fig. 1, butthe thicknesses of the interconnect and Ca3Co4O9 layers were bothabout 1–2 mm thick. Also, the sample was measured uncut as a12.7 mm diameter pellet. While the independently measured rawlaser flash data of the interconnect materials and Ca3Co4O9 wereeasily fitted to obtain the diffusivity, the bi-layered samples proveda bit more difficult to accurately fit. The main difficulty came in fit-ting the tail of the data several half-times beyond the maximum.For this reason, the fitting range of the data was lessened until
the data before the maximum was best fit, but never less than 4half-times, and while the uncertainty of the data is explicitly deter-mined, the fitting process should be taken into consideration.Nevertheless, the order of magnitude and the general temperaturetrends are believed to be accurate.
The thermal contact resistances of Ca3Co4O9 interfaced withNi400 and Fe22Cr are presented in Fig. 8. Firstly, it should be notedthat the values for Fe22Cr with Ca3Co4O9 are two orders of magni-tude lower than those of Ni400 with Ca3Co4O9. This is likely due tothe smaller width of the intermediate CaCrO4 layer formed duringinterfacing with SPS compared to the NiO of the latter. While thetemperature dependence of the thermal contact resistance of theFe22Cr/Ca3Co4O9 interface exhibits approximately the same tem-perature dependence as its electrical contact resistances, the ther-mal contact resistance of the Ni400/Ca3Co4O9 interface has anupward trend with temperature in contrast to its electrical contactresistance. While the temperature dependence of its thermal con-tact resistance is not well understood, it is likely that the mismatchin thermal expansions and subsequent interfacial strains may playa role.
4. Conclusions
The Fe–22%Cr based alloy studied in this work is well matchedin thermal expansion to the well performing thermoelectric oxidematerial Ca3Co4O9. The electrical contact between these alloys andCa3Co4O9 is compromised by the formation of a CaCrO4 layer in theinterface, which is prohibitively resistive below �500 �C. However,800 �C is a likely hot-side operating temperature for the oxidethermoelectric power generation modules for which this intercon-nect-TE oxide interface is intended and so the possibility of usingFe–22%Cr alloys as an interconnect on the hot-side only is a viableone. At this temperature both the electrical and thermal contactresistances of the Fe22Cr/Ca3Co4O9 interface are orders ofmagnitude lower than those of the Ni400/Ca3Co4O9 interface. Addi-tionally, the chemical reaction and diffusion kinetics are slower,resulting in a slower growth rate of the detrimental CaCrO4 phasethan the NiO phases of the Ni400/Ca3Co4O9 interface.
Due to the greatly different temperatures of the hot and cold-sides of a high temperature oxide thermoelectric generator, thetwo sides should be engineered independently with the exceptionof considering the different thermal expansions in minimizing
T.C. Holgate et al. / Journal of Alloys and Compounds 582 (2014) 827–833 833
strains throughout the module as a whole. This could mean thatthe hot and cold-side interconnect materials and the processesfor interfacing them to the TE elements could be completely differ-ent. The diffusion and chemical activity of the interface betweenFe22Cr and Ca3Co4O9 may possibly be minimized, or at least foundto be time limited on a reasonable time scale, by either the furtherengineering of the alloy, the optimization of the SPS interfacingprocess, and/or the intentional insertion of a conducting oxide buf-fer layer. Therefore, these materials may be a viable choice to serveas hot-side interconnects.
Acknowledgements
The authors would like to thank Karsten Agersted and PernilleHedemark Nielsen for their assistance with dilatometry measure-ments as well as Nikolaos Bonanos and Sebastian Molin for somevery useful conversations concerning the transport measurements.The authors would also like to thank the Programme Commissionon Energy and Environment (EnMi), which is part of the DanishCouncil for Strategic Research (Contract No. 10-093971), for spon-soring the research of the OTE-POWER project, and the DanishNational Research Foundation (DNRF93) for additional funding.
References
[1] R. Funahashi, I. Matsubara, H. Ikuta, T. Takeuchi, Jpn. J. Appl. Phys. 39 (2000)L1127–L1129.
[2] N. Shaigan, W. Qu, D.G. Ivey, W. Chen, J. Power Sources 195 (2010) 1529–1542.[3] W.Z. Zhu, S.C. Deevi, Mater. Res. Bull. 38 (2003) 957–972.[4] N.A. Matchanov, M. Farhan, J. D’Angelo, E.J. Timm, T.P. Hogan, H. Schock, E.D.
Case, M.G. Kanatzidis, Appl. Sol. Energy 47 (2011) 90–97.[5] D. Zhao, H. Geng, L. Chen, Int. J. Appl. Ceram. Technol. 9 (2012) 733–741.
[6] J. García-Cañadas, A.V. Powell, A. Kaltzoglou, P. Vaqueiro, G. Min, J. Electron.Mater. 42 (2013) 1369–1374.
[7] I. Matsubara, R. Funahashi, T. Takeuchi, S. Sodeoka, T. Shimizu, K. Ueno, Appl.Phys. Lett. 78 (2001) 3627–3629.
[8] R. Funahashi, S. Urata, K. Mizuno, T. Kouuchi, M. Mikami, Appl. Phys. Lett. 85(2004) 1036–1038.
[9] E. Sudhakar Reddy, J.G. Noudem, S. Herbert, C. Goupil, J. Phys. D: Appl. Phys. 38(2005) 3751–3755.
[10] L. Han, Y. Jiang, S. Li, H. Su, X. Lan, K. Qin, T. Han, H. Zhong, L. Chen, D. Yu, J.Alloys Comp. 509 (2011) 8970–8977.
[11] K. Arai, M. Matsubara, Y. Sawada, T. Sakamoto, T. Kineri, Y. Kogo, T. Iida, K.Nishio, J. Electron. Mater. 41 (2012) 1771–1777.
[12] S. Urata, R. Funahashi, R. Mihara, A. Kosuga, S. Sodeoka, T. Tanaka, Int. J. Appl.Ceram. Technol. 4 (2007) 535–540.
[13] R. Funahashi, S. Urata, Int. J. Appl. Ceram. Technol. 4 (2007) 297–307.[14] S.M. Choi, K.H. Lee, C.H. Lim, W.S. Seo, Energy Convers. Manage. 52 (2011)
335–339.[15] C.H. Lim, S.M. Choi, W.S. Seo, H.H. Park, J. Electron. Mater. 41 (2012) 1247–
1255.[16] N. Wu, T.C. Holgate, N.V. Nong, N. Pryds, S. Linderoth, J. Electron. Mater. 42
(2013) 2134–2142.[17] A.C. Masset, C. Michel, A. Maignan, M. Hervieu, O. Toulemonde, F. Studer, B.
Raveau, J. Hejtmanek, Phys. Rev. B. 62 (2000) 166–175.[18] J.A. Cape, G.W. Lehman, J. Appl. Phys. 34 (1963) 1909–1913.[19] J. Hartmann, O. Nilsson, J. Fricke, High Temp.-High Press. 25 (1993) 403.[20] T.C. Holgate, N. Wu, M. Søndergaard, B. Iversen, N.V. Nong, N. Pryds, J. Electron.
Mater. 42 (2013) 1661–1668.[21] J. Cheng, Y. Sui, Y. Wang, X. Wang, W. Su, Appl. Phys. A 94 (2009) 911–916.[22] D. Kenfaui, G. Bonnefont, D. Chateigner, G. Fantozzi, M. Gomina, J.G. Noudem,
Mat. Res. Bull. 45 (2010) 1240–1249.[23] W. Xiong, M. Selleby, Q. Chen, J. Odqvist, Y. Du, Crit. Rev. Solid State 35 (2010)
125–152.[24] L. Li, W. Yu, Y. Long, C. Jin, Solid State Commun. 137 (2006) 358–361.[25] J.F. Weiher, B.L. Chamberland, J.L. Gillson, J. Solid State Chem. 3 (1971) 529–
532.[26] A. Atkinson, R.I. Taylor, J. Mater. Sci. 13 (1978) 427–432.[27] H. Yokokawa, T. Horita, N. Sakai, K. Yamaji, M.E. Brito, Y.-P. Xiong, H.
Kishimoto, Solid State Ionics 177 (2006) 3193–3198.