Embed Size (px)
Citation preview

Characterization of the optical properties of atmospheric aerosols
in Amazonia from long-term AERONET
monitoring (1993–1995 and 1999–2006)
J. S. Schafer,1,2 T. F. Eck,2,3 B. N. Holben,2 P. Artaxo,4 and A. F. Duarte5
Received 23 August 2007; revised 13 November 2007; accepted 11 December 2007; published 21 February 2008.
[1] We present a new climatology of atmospheric aerosols (primarily pyrogenic andbiogenic) for the Brazilian tropics on the basis of a high-quality data set of spectral aerosoloptical depth and directional sky radiance measurements from Aerosol RoboticNetwork (AERONET) Cimel Sun-sky radiometers at more than 15 sites distributed acrossthe Amazon basin and adjacent Cerrado region. This network is the only long-termproject (with a record including observations from more than 11 years at some locations)ever to have provided ground-based remotely-sensed column aerosol properties for thiscritical region. Distinctive features of the Amazonian area aerosol are presented bypartitioning the region into three aerosol regimes: southern Amazonian forest, Cerrado,and northern Amazonian forest. The monitoring sites generally include measurementsfrom the interval 1999–2006, but some sites have measurement records that date back tothe initial days of the AERONET program in 1993. Seasonal time series of aerosoloptical depth (AOD), Angstrom exponent, and columnar-averaged microphysicalproperties of the aerosol derived from sky radiance inversion techniques (single-scatteringalbedo, volume size distribution, fine mode fraction of AOD, etc.) are described andcontrasted for the defined regions. During the wet season, occurrences ofmineral dust penetrating deep into the interior were observed.
Citation: Schafer, J. S., T. F. Eck, B. N. Holben, P. Artaxo, and A. F. Duarte (2008), Characterization of the optical properties of
atmospheric aerosols in Amazonia from long-term AERONET monitoring (1993–1995 and 1999–2006), J. Geophys. Res., 113,
D04204, doi:10.1029/2007JD009319.
1. Introduction
[2] The Amazon basin is a key ecosystem in the globalclimate system, and one which is under particular stressfrom anthropogenic activities, especially deforestationwhich began to reach substantial levels in the mid-1970sand has continued unabated to the current day [Andreae etal., 2002]. The Amazon represents the largest continuousrain forest in the world, and much attention has beendevoted to studying the widespread deforestation by agri-cultural clearing and man-made fires and the impact ofbiomass burning aerosols on nucleation processes and cloudmicrophysics [Andreae et al., 2004]. The annual biomassburning events result in significant seasonal aerosol load-ings over vast stretches of the basin that are both pervasive
and persistent during the dry season [Holben et al., 1996],and as such, the Amazon is considered one of the primarysources of aerosol particles globally. Recently, additionalfocus has been placed upon studies conducted during thewet season and the transitional period between the seasonswith an emphasis on cloud condensation nuclei concentra-tion measurements and examining aerosol aging and hu-midification processes to improve regional precipitationmodels [Mircea et al., 2005; Rissler et al., 2006; Falkovichet al., 2005; Silva Dias et al., 2002].[3] Aerosol radiative forcing is an area of keen scientific
interest because it is a key parameter in understanding theperturbations that drive the climate system. The radiativeeffects of aerosols are conventionally broken down concep-tually with terminology that distinguishes the mechanism bywhich the influence of the aerosol is manifested. The mostbasic forcing is simply that of the modification of net fluxesby scattering and absorption processes, referred to as thedirect effect. Such forcing may be defined for the top ofthe atmosphere or at the surface and is calculated as thedifference between net fluxes assessed with and withoutaerosol loading in the atmosphere. Semidirect effects resultfrom increases in atmospheric stability due to heating of thetroposphere by absorbing aerosols and reduction of solarflux at the surface, thereby causing clouds to evaporate orsuppressing cloud formation [Koren et al., 2004]. The
JOURNAL OF GEOPHYSICAL RESEARCH, VOL. 113, D04204, doi:10.1029/2007JD009319, 2008ClickHere
for
FullArticle
1Science Systems and Applications, Inc., Lanham, Maryland, USA.2Biospheric Sciences Branch, NASA Goddard Space Flight Center,
Greenbelt, Maryland, USA.3Goddard Earth Sciences and Technology Center, University of
Maryland Baltimore County, Baltimore, Maryland, USA.4Departamento de Fısica Aplicada, Instituto de Fısica da Universidade
de Sao Paulo, Sao Paulo, Brazil.5Departamento de Ciencias da Natureza, Universidade Federal do Acre,
Rio Branco, Brazil.
Copyright 2008 by the American Geophysical Union.0148-0227/08/2007JD009319$09.00
D04204 1 of 16

indirect effects of aerosols have much greater uncertainties[Anderson et al., 2003] and include derivative consequencessuch as changes in cloud optical depth, albedo, and precip-itation efficiency (and thus cloud lifetime) as well asalterations in the atmospheric stability due to heating ofthe troposphere by absorbing aerosols. Although the theo-retical understanding of these indirect effects is wellfounded, evaluation of the magnitudes is subject to signif-icant uncertainties resulting from large spatial and temporalvariability of aerosols [Chylek et al., 2003].[4] With the exception of Aerosol Robotic Network
(AERONET), there is a dearth of historical, systematicground-based measurements of column-integrated aerosoloptical properties because of constraints imposed by instru-ment maintenance and calibration requirements [Liu et al.,2005], particularly in the developing region of the world[Jethva et al., 2005]. Efforts to establish aerosol databasesvia satellite-based aerosol characterization as well as aerosolsource and transport models have been increasingly suc-cessful [Yu et al., 2003; Kinne et al., 2003], however, mosthave dependencies upon aerosol parameterization assump-tions derived from networks such as AERONET. Detailedanalyses of high-quality observations of aerosol microphys-ical and optical properties from long-term AERONETmonitoring sites can yield a complete characterization ofaerosol optical effects for a wide range of applications.
2. Site Descriptions and Background
[5] The Brazilian sites (plus one Bolivian site, i.e., ElRefugio) can be organized into three regional groups:southern Amazonian forest, southern Cerrado (woodland/savanna), and northern Amazonian forest. Figure 1 shows
the location of every site that has contributed data to thisstudy since 1993, and the color of the marker indicates theregional group within which the site belongs (white sym-bols, northern forest; black symbols, Cerrado; gray sym-bols, southern forest).[6] The AERONET conducted its first large-scale deploy-
ments outside the continental United States beginning in1993 with a campaign based on eight monitoring sites in theAmazon [Holben et al., 1998, 2001]. This and subsequentdeployments to Brazil in 1994 and 1995 were largelyseasonal campaigns focused on characterizing the heavyaerosol loading associated with forest fires during the dryseason [Holben et al., 1996; Eck et al., 1998]. From theseorigins the project has expanded to include hundreds of sitesaround the world, and after a period of absence from Brazil,resumed year-round monitoring at multiple locations in1999 in conjunction with a component of the Large-ScaleBiosphere Atmosphere (LBA) project.[7] A Cimel Sun-sky radiometer is deployed at each site
and six sites also include a Kipp & Zonen CM-21 Pyran-ometer (305–2800 nm) for measuring the global solar fluxin the total solar spectrum. The automatic Sun-sky radio-meters (model CE318A) were manufactured by CimelElectronique and their characteristics are discussed at lengthby Holben et al. [1998]. Each is equipped with narrowbandpass filters in the visible and near infrared with centerwavelengths at 340, 380, 440, 500, 675, 870, 940, and1020 nm. The filters are ion-assisted deposition interferencefilters with bandpass (full width at half maximum) of 2 nmfor the 340 and 380 nm channels and 10 nm for all otherchannels. The Cimel Sun-sky radiometer measures aerosoloptical depth (AOD) at each of these wavelengths, exceptfor the 940 channel which is used to derive total columnwater vapor (CWV). The uncertainty in measured AOD,due primarily to calibration uncertainty, is approximately0.010–0.021 for field instruments (which is spectrallydependent with higher errors in the UV [Eck et al.,1999]). The spectral AOD data have been screened forclouds following the methodology of Smirnov et al. [2000],which relies on the greater temporal variability of cloudoptical depth versus aerosol optical depth. In addition to thedirect Sun irradiance measurements that are made with afield of view of 1.2� these instruments measure the skyradiance in four spectral bands (440, 670, 870, and 1020 nm)along the solar principal plane (i.e., at constant azimuthangle with varied view zenith angles) up to nine times a dayand along the solar almucantar (i.e., at constant solar zenithangle with varied view azimuth angles) up to eight times aday (for solar zenith angle greater than 45�). A preprog-rammed sequence of measurements is taken by these instru-ments starting at an air mass of seven in the morning andending at an air mass of seven in the evening. During thelarge air mass periods direct Sun measurements are made at0.25 air mass intervals, while at smaller air masses theinterval between measurements is typically 15 min. Thealmucantar measurements are taken at 0.5� azimuth angleintervals near the Sun (within 6�) and increase from 2 to 10�intervals away from the solar position. It is these skyradiance measurements that are used to retrieve additionalcolumn aerosol properties including volume size distribution,phase function, real and imaginary component of refractiveindex, effective radius, and single-scattering albedo (SSA)
Figure 1. Locations of AERONET aerosol monitoringsites used in this study (white symbols, northern forest; graysymbols, southern forest; black symbols, Cerrado).
D04204 SCHAFER ET AL.: ATMOSPHERIC AEROSOLS IN AMAZONIA
2 of 16
D04204

that are routinely computed with the AERONET inversionalgorithms [Dubovik and King, 2000; Dubovik et al., 2006].The almucantar radiance inversion technique for determin-ing both the real and imaginary refractive indices is mostaccurate when AOD at 440 nm is greater than 0.4 [Duboviket al., 2000], solar zenith angle is larger than 50�, and thesky-radiance-fitting error is less than 5–8%, dependent onAOD [Holben et al., 2006]. Therefore Cimel inversionproducts such as single-scattering albedo used in this studywere restricted to those that met the above criteria, resultingin SSA uncertainty of approximately 0.03 or less (uncer-tainty decreases as AOD increases).The changes in skyradiance processing and quality criteria implemented forthe version 2 inversions are detailed by Holben et al. [2006].
3. Aerosol Optical Depth and Column WaterVapor Seasonal Cycles
3.1. Regional Aerosol Comparison
[8] Figure 2 shows weekly averages for composite datasets that combine the observations from all sites within agiven regional group. These weekly values are an average
of all qualifying day averages from the given week and sothe standard deviation bars include variation due to bothinterannual and intersite variation. Additionally, monthlyaverages of AOD and Angstrom exponent are presented inTable 1. The majority of the data contributed from theoriginal study years (1993–1995) are for the burning seasonperiods, since the early campaign deployments were pref-erentially conducted during these intervals. Therefore thereare typically many more day averages available in the July–October months, although the much smaller variability inobserved AOD during the wet season period means that thelower number of observations is still quite suitable tocharacterize the AOD tendencies. Given the intermittentdeployments of some of the secondary sites and the longerdata record dating to 1993 for Alta Floresta and Cuiaba, theobservations from these two sites are represented dispro-portionately in their respective regional composite data sets.Alta Floresta contributes approximately 40% of the data forthe southern forest region, and Cuiaba is responsible formore than 60% of the Cerrado measurements.[9] All sites exhibit a broadly similar seasonal cycle in
atmospheric conditions with a relatively cloudy low-back-ground aerosol regime in effect during the Southern Hemi-sphere winter and spring (January–June). As the yearprogresses, a much drier interval manifests itself with anassociated large increase in aerosol optical depth as biomassburning activities become prevalent. The magnitude of thisseasonal variation in column water vapor is more pro-nounced in the southern Amazon, and the intensity andextent of the biomass burning is significantly greater. Thenorthern Amazon is found to experience its peak AODlevels later in the year (October) than is observed in thesouth (September) due to a later dry season peak.[10] In the inset plot of Figure 2, the slope of each line
depicting the average cumulative aerosol loading is propor-tional to the contribution of a given day to the total aerosolfor the year and it can be seen that the southern forest regionexhibits a greater degree of seasonality in AOD than thenorthern region. For the southern forest, 60% of the annualaerosol loading is produced during the period from mid-August to September (day range is 225–275).[11] The monthly average AOD (440 nm) values are very
similar in all regions during the first half of the year withconsistent background low-aerosol conditions (approxi-mately 0.1–0.15), and the averages for the north and south
Figure 2. Weekly averages of aerosol optical depth(440 nm) for regionally grouped sites and cumulative aerosolcontribution (inset).
Table 1. Monthly Averages and Standard Deviation of Aerosol Optical Depth (440 nm) and Angstrom Exponent (440/870 nm)
Grouped by Region
AOD 440NorthernForest
SDNorthernForest
AOD 440SouthernForest
SDSouthernForest
AOD 440Cerrado
SDCerrado
AngstromExponentNorthernForest
SDNorthernForest
AngstromExponentSouthernForest
SDSouthernForest
AngstromExponentCerrado
SDCerrado
Jan 0.16 0.09 0.15 0.08 0.22 0.14 0.88 0.35 1.09 0.45 0.79 0.31Feb 0.12 0.06 0.11 0.06 0.17 0.10 0.62 0.33 0.90 0.45 0.83 0.30Mar 0.14 0.08 0.10 0.06 0.12 0.05 0.65 0.34 0.96 0.46 1.05 0.52Apr 0.10 0.06 0.10 0.05 0.12 0.06 0.73 0.37 1.11 0.50 1.13 0.41May 0.12 0.06 0.12 0.05 0.16 0.05 0.84 0.31 1.33 0.42 1.02 0.31Jun 0.10 0.04 0.14 0.08 0.19 0.21 1.07 0.30 1.40 0.39 1.00 0.43Jul 0.12 0.05 0.23 0.17 0.18 0.12 1.18 0.37 1.54 0.34 1.11 0.43Aug 0.22 0.11 1.03 0.78 0.52 0.49 1.20 0.39 1.87 0.24 1.42 0.41Sep 0.32 0.16 1.24 0.80 1.03 0.66 1.14 0.33 1.69 0.33 1.65 0.23Oct 0.47 0.27 0.62 0.40 0.51 0.35 1.23 0.34 1.54 0.37 1.44 0.43Nov 0.46 0.26 0.33 0.21 0.26 0.18 1.28 0.35 1.26 0.43 0.91 0.53Dec 0.40 0.25 0.26 0.17 0.16 0.08 1.05 0.37 1.12 0.46 0.80 0.48
D04204 SCHAFER ET AL.: ATMOSPHERIC AEROSOLS IN AMAZONIA
3 of 16
D04204

differ by less than 0.05 for any given month. The onset ofthe burning season leads to dramatic increases in AOD,particularly in the south, with the September average AODfor the southern forest region (1.25) that is approximately3.5 times greater than the comparable average in thenorthern forest region (0.35) and represents an order ofmagnitude increase over the wet season month averages.The pattern of seasonal AOD for the Cerrado region issimilar to that of the southern forest region, though themagnitude of AOD is less and the peak delayed by about25 days, with early burning season averages that are
typically approximately 75% of those for the correspondingmonths at the forest sites.[12] Column water vapor monthly averages for each
region are presented in Figure 3 and are consistent withwhat might be expected from the observed AOD seasonal-ity, since rainfall is somewhat associated with the seasonalwater vapor cycle. The two southern regions exhibit thesmallest CWV values and the largest seasonal variabilitywith annual ranges of approximately 1.5 cm and standarddeviations of 0.35–0.8 cm. The two predominantly forestedregions have comparable water vapor amounts during thewet season, but the equatorial northern forest exhibits muchless decrease in CWV over the course of the year (approx-imately 0.6 cm), with standard deviations that are moreconsistent from month to month (0.3–0.4 cm). The CWVrecord for the Cerrado sites in this study are notably lowerthan even the southern forest region and remain so through-out the season.[13] The CWV measurements from the Cimel Sun pho-
tometer have been compared to several different sources toassess accuracy, including radiosondes [Halthore et al.,1997] and various other radiometers such as the AmesAirborne Tracking Sun Photometer (AATS-6), MultifilterRotating Shadowband Radiometer, and a microwave radi-ometer at the Great Plain Atmospheric Radiation Measure-ment site [Schmid et al., 2001]. Halthore et al. [1997]reported an agreement of ±10% between Cimel and radio-sonde measurements, while Schmid et al. found an RMSdifference in CWV measurements from the AATS-6 andCimel of 0.08 cm (3.2%) when using the same water vaporspectral profile. Recently, after refining the Cimel algorithmto use exact filter functions for each instrument the recordof Cimel precipitable water vapor measurements wereobserved to be in good agreement (RMS difference is0.15 cm (7.0%)) with CWV measurements derived from
Figure 3. Monthly averages of column water vapor forsites grouped by region.
Figure 4. Multiyear record of aerosol optical depth (440 nm) at Alta Floresta. Symbol size isproportional to AOD and the color indicates the Angstrom exponent.
D04204 SCHAFER ET AL.: ATMOSPHERIC AEROSOLS IN AMAZONIA
4 of 16
D04204

GPS receivers during a multiyear comparison at the God-dard Space Flight Center (GSFC) [Smirnov et al., 2004].[14] The timing of the onset of fire activity in the Amazon
is of course tied to the local meteorological cycle, thoughthe beginning of the burning is relatively consistent fromyear to year, usually varying by only a few weeks. Anexample of this can be seen in Figure 4 where the record ofAOD measurements at Alta Floresta is broken out by year.The size of each point is proportional to the magnitude ofthe daily averaged AOD and the scale bar on the bottom canbe used to determine the Angstrom exponent for the daybased on the data point’s color level. The precipitationminimum of the dry season cycle is also reflected in therelative humidity (daily minimum) and produces the envi-ronmental conditions favorable for initiating biomass burn-ing (example years shown in Figures 5 and 6). The dryseason is observed to be more pronounced for the southernforest sites (Abracos Hill data from 2001 (Figure 5)) than forthe northern forest site (Belterra data from 1999 (Figure 6)),though the consistent association of rainfall and AOD isevident (precipitation and relative humidity data providedcourtesy of David Fitzjarrald and the Atmospheric SciencesResearch Center, University of Albany).[15] Figures 7 and 8 depict the interannual variability of
day-averaged AOD for typical southern (Alta Floresta) andnorthern (Belterra) forest sites and illustrate the effect ofyear-to-year variation of factors that influence biomassburning aerosol production. For the day range from 150to 300 each point is typically based on daily AOD averagesfrom 5–11 different years at Alta Floresta. The shadedbands indicate the approximate starting and ending monthsof the respective burning seasons. The interannual variabil-ity is obviously greatest during the respective burningseasons in each site with the southern forest site exhibitinglarger relative variance (mean value of AODstd(day)/AODavg(day) for the burning season is 0.55) than does thenorthern forest site (0.43). The corresponding values for the
southern and northern sites during the rest of the year(nonburning) are 0.42 and 0.31, respectively. The biomassburning in the northern region begins more gradually thanin the south because of a dry season that is less severe in thisarea. The plotted values for the wet season (first months ofthe year) at the Belterra site are more scarce because of theconsistent cloud cover that limits aerosol measurementopportunities and because the persistently rainy conditionshave made instrument failure more common during theseintervals. Points with center marks represent cases whereonly a single day-averaged AOD was available for the dayof interest (i.e., there is a day-averaged AOD from one yearonly) and so no interannual standard deviation can becalculated. The aerosol loading on a given day during aparticular burning season is a result of such contingencies as
Figure 5. Day-averaged precipitation and daily minimumrelative humidity for a southern forest site (Abracos Hilldata from 2001) (precipitation and relative humidity dataprovided courtesy of David Fitzjarrald and the AtmosphericSciences Research Center, University of Albany).
Figure 6. Day-averaged precipitation and daily minimumrelative humidity for a northern forest site (Belterra datafrom 1999) (precipitation and relative humidity dataprovided courtesy of David Fitzjarrald and the AtmosphericSciences Research Center, University of Albany).
Figure 7. Time series and interannual variability of dayaverage AOD (440 nm) for Alta Floresta (11 years).
D04204 SCHAFER ET AL.: ATMOSPHERIC AEROSOLS IN AMAZONIA
5 of 16
D04204

the severity of the dry season, onset date of burning, localfire management policies, regional meteorology, and trans-port tendencies as well as other factors that are difficult orimpossible to predict.3.1.1. Aerosol Optical Depth Histograms[16] Relative frequency histograms of aerosol optical
depth during the respective burning season at two sites(August–October for Alta Floresta (Figure 9) and October–December for Belterra (Figure 10)) show the greater inter-annual variability of the southern forest sites. At Alta
Floresta, the data record for 2000 was not as completeduring the burning season months and was not included inthe plot. Burning season AOD440 averages can vary by afactor of 2.5 from year to year (0.6–1.5) as do the moreextreme events as indicated by the average value of the top10% of measurements shown in parentheses (range is 1.59–3.92). The occurrence of measurements during very highaerosol loading (AOD440 > 2.0) as a percentage of the totalnumber ranges from a low of 1% in 2001 to greater than20% for intense burning years such as 2002 and 2005.[17] By contrast the northern histograms are fairly uni-
form in appearance with relatively little difference in AODaverages and similar frequency distributions for all 5 yearson record. This may in part be due to less variation in theintensity of the dry seasons in the north.3.1.2. Wavelength Dependence of Aerosol OpticalDepth[18] Plots of interannual variability of the wavelength
dependence of AOD, as characterized by the Angstromexponent (based on two wavelengths, i.e., 440 and 870 nm)a, are presented for Alta Floresta, Belterra, and Cuiaba(Figures 11–13).[19] The salient feature of the Alta Floresta plot is the
peak of a during a week around the middle of August(approximately day 225). The Angstrom exponent is highlysensitive to the size distribution with larger values encoun-tered when the fine mode aerosol has a large relativecontribution to the total aerosol. This peak appears nearthe start of the burning season when there is a combinationof minimal cloud presence and initial fire activity and isassumed to be a period of nearly pure smoke aerosol withperhaps more fresh smoke and less contribution from aged
Figure 8. Time series and interannual variability of dayaverage AOD (440 nm) for Belterra (5 years).
Figure 9. Relative frequency histograms of aerosol optical depth (440 nm) during the burning seasonfor 10 years at Alta Floresta.
D04204 SCHAFER ET AL.: ATMOSPHERIC AEROSOLS IN AMAZONIA
6 of 16
D04204

smoke as would be expected later in the burning season.The Angstrom exponent can vary by a factor of nearly 2 foraged versus fresh smoke cases but also because of fuel typeand combustion phase [Eck et al., 2003]. The consistentlyhigh value of a during this week is remarkable withnegligible variability shown despite the fact that this intervalincludes observations from as many as 11 different years.The Angstrom exponent remains high after this period, butthe typical enhancement of convective activity introducessome inevitable cloud contamination that reduces the aver-age a slightly. This eventual reduction might also be due inpart to the effects of more aged aerosol and a greaterpercentage of smoldering combustion later in the burning
season that results in larger size accumulation mode par-ticles that would also decrease the Angstrom exponent.[20] The pattern is similar for the Cerrado site, Cuiaba
(Figure 13), though this region is typically dryer and sunnierand also may have more consistency in fuel type burned andcombustion mode fraction (smoldering/flaming). The Ang-strom exponent remains elevated longer than at Alta Flor-esta, commonly averaging greater than 1.6 for the wholemonth of September, though the peak value of a is higherfor Alta Floresta than the corresponding peak at Cuiaba.The Angstrom exponent is also observed to increase duringthe biomass burning season at Belterra but less prominently.This is partially due to lower AODs since the background
Figure 10. Relative frequency histograms of aerosol optical depth (440 nm) during the burning seasonfor 5 years at Belterra.
Figure 11. Time series and interannual standard deviationof day average Angstrom exponent (440/870 nm) for AltaFloresta (11 years). The time series of weekly average AOD(440 nm) is also shown (black line).
Figure 12. Time series and interannual standard deviationof day average Angstrom exponent (440/870 nm) forBelterra (5 years). The time series of weekly average AOD(440 nm) is also shown (black line).
D04204 SCHAFER ET AL.: ATMOSPHERIC AEROSOLS IN AMAZONIA
7 of 16
D04204

coarse mode AOD has a greater influence on the Angstromexponent, as shown by the observation that a increases asAOD increases for smoke aerosols [Eck et al., 2001].Another factor that might have resulted in lower a at
Belterra is a possibly greater contamination in the northernAmazon by clouds (which are more abundant there than isthe case for the southern Amazon during the dryer months).
3.2. Angstrom Exponent and Cloud ContaminationEffects
[21] Additional evidence of minor cloud effects upon thederived Angstrom exponent is provided by comparing thedata set of this parameter acquired from all direct Sunmeasurements with those acquired only during the almu-cantar sequence. Figure 14a depicts the time series of a forthe June–October interval in the southern forest region andthe observed differences in a for the two data sets may beindicative of the influence of clouds. Each point representsthe multiyear average of all available day-averaged a for thegiven day of year, and only days with at least 5 differentyears of day averages were included. Since the almucantarcoincident a values are limited to those derived fromalmucantar procedures with low retrieval errors, they arenecessarily drawn from observations taken during condi-tions where the sky radiances are considered free of cloudcover within the majority of the almucantar scan viewangles (and which have also passed the standard AODtriplet variability and time series variability checks). Thisshould serve to produce a data set that is less prone toexhibit effects because of clouds than the Angstrom expo-nent measurement data set derived from all direct Sun only
Figure 13. Time series and interannual standard deviationof day average Angstrom exponent (440/870 nm) forCuiaba (9 years). The time series of weekly average AOD(440 nm) is also shown (black line).
Figure 14. (a) Time series of a (440/870 nm) for the June–October interval in the southern forestregion derived from almucantar and direct Sun measurements. (b) Computed mean difference betweenthe day-averaged a for each day of year. (c) Time series of minimum (center-marked symbols) andmaximum (open symbols) observed day-averaged a derived from almucantars (circles) and direct Sunmeasurements (squares).
D04204 SCHAFER ET AL.: ATMOSPHERIC AEROSOLS IN AMAZONIA
8 of 16
D04204

observations, even though all the data are thoroughlyscreened for clouds as part of the standard protocol. Figure14b presents the computed mean difference between theday-averaged a for each day of year. It is apparent that theAngstrom exponents (from direct Sun measurements) asso-ciated with the almucantar measurement sequence arehigher (approximately 0.1 on average) than those basedon the average of all direct Sun measurements. Although theday average Angstrom exponent for the almucantars islimited to solar zenith angles greater than 45�, while theday average for the direct Sun measurements includeobservations throughout the day, it was found that therewas no bias introduced by including the midday Angstromexponents measurements for only one data set, i.e., therewas no diurnal dependence to the Angstrom exponent in thedirect Sun measurements that might produce the discrep-ancies that were observed.[22] Further, the difference appears to be positively cor-
related with the degree of cloudiness with almost nodiscrepancy in evidence during the least cloudy intervalbeginning around day 225. In part, the assessment ofgeneral cloudiness (cloud frequency) was based on in situbroadband flux measurements (2-min sampling) which havebeen operated at the site for the duration of the project. Wehave cloud-screening algorithms for the flux based oncomparisons with several radiative transfer models [e.g.,Vermote et al., 1997] which allow us to evaluate whichmonths are associated with minimal cloud fractions, andalso, broadly speaking, the seasonal tendencies of cloudcover are consistent and known well enough to makegeneral statements about which parts of the year are morefrequently cloud free than others.[23] Additional investigation supports the speculation that
this is due to cloud contamination. If for each day of theyear the maximum and minimum day values of a includedin the multiyear average are examined (Figure 14c), it isobserved that the maximum values are quite similar for bothdata sets (almucantar average is 2.01 and direct Sun is 2.04),while the minimum values are much lower on average forthe direct Sun measurements (average is 0.95) than for thealmucantar-associated measurements (average is 1.39). Thismay suggest that the discrepancy is not systematic but ratheran intermittent (but possibly not uncommon) contaminationeffect, at least for locations experiencing certain types ofcloud cover. When other long-term monitoring sites areexamined, the same effect is observed (a diminished aver-age minimum Angstrom exponent for direct Sun measure-ments is found), and additionally, the magnitude appearssmaller at less cloudy locations. At one site with predom-inantly minimal cloud fraction, Sede Boker, Israel, theaverage difference of minimum a for the two data setswas only 0.08, compared to approximately 0.44 at AltaFloresta.
4. Multiyear Aerosol Optical Depth Analysis
[24] An investigation of long-term trends was performedfor the site with the longest deployment record, AltaFloresta, which has burning season aerosol optical depthmeasurements for 11 years. The average AOD was com-puted for the August–October interval (calculated as theaverage of all day averages) for every year that had a largely
complete measurement record during the burning season.These average AOD values were plotted versus the datayear and included nine different years extending back to1994. Despite increasing efforts at fire management in theAmazon over the last decade, we did not observe any trendin AOD that was significant at the 95% confidence level.[25] Additionally, when AOD averages for individual
week intervals are examined for all available data years(based on as many as 10 years for many week intervals),they are also found to exhibit no significant trend in aerosoloptical depth over the data record. Of course this assessmentrepresents only one point location and may not be repre-sentative of the basin at large, and the trend analysis is alsodiminished by the absence of measurements in the yearsfrom 1996–1998. If the same analysis is performed for theCerrado site, Cuiaba, which has a record extending to 1993,there is a similar lack of any significant trend in AOD,although this site had only 6 years that possessed asufficiently complete set of burning season measurementsto meet our minimum requirements.
5. Aerosol Volume Size Distributions
5.1. Volume Median Radius and Aerosol Optical Depth
[26] Numerical inversion techniques applied to measuredsky radiances from Cimel almucantars scans provide ameans to retrieve columnar-averaged aerosol size distribu-tions during favorable conditions (relatively cloud-free,spatially homogeneous sky). Figures 15 and 16 weregenerated by grouping the data from a southern forest site(Alta Floresta) and a Cerrado site (Cuiaba), respectively,into designated AOD ranges and averaging the retrievedsize distributions within each aerosol bin. As noted inprevious studies of smoke aerosol, each region exhibits anincrease of fine mode (submicrometer) particles and ageneral shift toward larger volume median radius VMRf
for the accumulation mode as (smoke) aerosol optical depthincreases. This has typically been attributed to the fact thatthe heaviest smoke conditions have larger aerosol concen-trations which are more favorable for coagulation processesassociated with ‘‘aging’’ smoke [Reid et al., 1998, 1999].For the Cuiaba site the larger fine mode volume radiusretrievals for the lowest-AOD440nm bin (AOD < 0.1) may bedue to the influence of urban aerosols from the city(approximately 0.5 million people) rather than representa-tive of predominantly biomass burning aerosols.[27] Fine mode fraction (FMF) of the AOD represents the
relative contribution of the fine mode to the total aerosoloptical depth. In this context the fine/coarse mode thresholdsize is determined by calculating the inflection point be-tween observed modes (but with the threshold always beingconstrained to the range of 0.44–0.99 mm). This parametercan be used as a general indicator of the presence ofanthropogenic aerosol, which is predominantly found inthe fine mode. In the case of Brazilian aerosols the higherFMF values are associated with biomass burning activitiesfor land use purposes.[28] For both regions the fine mode contribution to
aerosol optical depth (as indicated by the fine mode frac-tion) is the dominant influence on the total AOD, amountingto approximately 80% of the attenuation even at the lowest
D04204 SCHAFER ET AL.: ATMOSPHERIC AEROSOLS IN AMAZONIA
9 of 16
D04204

AOD. For the highest AOD the coarse mode is essentiallyoptically negligible.
5.2. Column Water Vapor and Aerosol ParticleGrowth
[29] While column-averaged aerosol volume size distri-butions alone are not adequate to make quantitative assess-ments of hygroscopicity, they allow for useful inferencesabout this particular aerosol quality. Size distributions (finemode only (Figure 17)) for the composite Amazoniansouthern forest sites were partitioned into two ranges ofcolumn water vapor. Such a study would ideally be donewith relative humidity profile information, however, thesedata were not available and previous studies have foundsignificant correlation between relative humidity and totalcolumn water vapor [Raj et al., 2004]. The retrievals exhibitan increase of VMRf as a function of AOD that wasenhanced for the almucantars acquired during conditionsof greater column water vapor. The volume size distribu-tions in the submicrometer range are very similar for bothlow and high CWV for the lower-AOD bins, but as theaerosol loading increases, the separation between the twofamilies of size distribution curves becomes steadily greater.During the LBA-SMOCC (Smoke Aerosols, Clouds, Rain-fall, and Climate) campaign, Rissler et al. [2006] foundthe Amazonian (state of Rondonia) dry season (defined as11 September to 8 October for the year of study, 2002) to bedominated by largely hydrophobic aerosol, while the tran-sitional period (9–30 October) between the wet and dryseason had an increasing influence of hydrophilic particles.In the Rissler et al. study, two largely distinct aerosol typeswere observed in all seasons, one nearly hydrophobic andthe other moderately hygroscopic, and the overall effectivehygroscopicity of the average aerosol in a given season wasdetermined by the relative proportions of the number con-centrations for each aerosol type. The almucantars in Figure17 associated with the lowest CWV (1.5–2.5 cm) all
occurred during the start of the burning season (August).However, even if only this early interval is considered, asimilar stronger dependence of VMRf on AOD for highCWV is observed when the almucantars are grouped intoCWV bins, so by this assessment it is not evident that thedifference in hygroscopic growth between the populations isrelated to changes in the ambient aerosol type (or changes inthe relative contribution of different aerosol types) over theseason. Nonetheless, the apparent hygroscopicity of theAmazonian biomass burning aerosol is quite modest com-pared to that observed for the typical urban aerosol of theeastern United States, as can be seen when the 3.5–4.5 cmCWV size distributions are plotted with the equivalent
Figure 15. Retrieved aerosol volume size distributions fora southern forest site (Alta Floresta) averaged for eachaerosol optical depth interval. Volume median radius of thefine mode (VMRf) and fine mode fraction of AOD averagedfor each AOD bin are also shown.
Figure 16. Retrieved aerosol volume size distributions fora Cerrado site (Cuiaba) averaged for each aerosol opticaldepth interval. Volume median radius of the fine modeVMRf and fine mode fraction of AOD averaged for eachAOD bin are also shown.
Figure 17. Averaged volume size distributions (fine modeonly) grouped by aerosol optical depth for the compositeAmazonian southern forest sites partitioned into two rangesof column water vapor.
D04204 SCHAFER ET AL.: ATMOSPHERIC AEROSOLS IN AMAZONIA
10 of 16
D04204

curves for the AERONET site at the GSFC in Figure 18.Kotchenruther and Hobbs [1998] similarly measured amuch greater increase in light scattering coefficient at highrelative humidity for United States east coast pollution ascompared to biomass burning smoke in Brazil. A slightlydifferent set of AOD bins were used because of the lowermaximum AOD for the urban site. In each plot the large tickmarkers in the center of the upper axis indicate thecorresponding sizes of the peak volume concentration foreach of the dashed curves and ranged from 0.13 to 0.17 mm(from low to high AOD) for the higher-CWV bin in theAmazon for biomass burning aerosols, compared to a shiftfrom 0.15 to 0.26 mm for the set of size distributions atGSFC for urban/industrial pollution aerosols.[30] It was found that the sensitivity of VMRf to CWV
was dependent on the amount of aerosol (smoke) present. InFigure 19 volume mean radius (fine mode, VMRf) wasplotted versus column water vapor for moderate to highAOD440nm (0.25–1.5; N = 825) and for very high AOD(greater than 1.5; N = 192) during the burning season(1 August to 15 October). The significance of the correla-tion and the regression slopes were notably greater for thehighest-AOD conditions (r2 is 0.348 and slope is 0.018)than for the lower-AOD conditions (r2 is 0.115 and slope is0.008). This may be due to higher AOD being correlatedwith more aged smoke which has evolved under stagnationconditions or during prolonged transport. If so, it is possiblethat this aged aerosol would have longer exposure to theambient water vapor and thus more time to be influencedby it.[31] This hypothesis is possibly corroborated when almu-
cantar retrieved single-scattering albedo is examined as afunction of column water vapor (Figure 20). For lower-AOD bins there is no significant dependence, while for highAOD the correlation becomes moderately strong and sig-nificant at the 99% confidence level (r2 = 0.36; N = 89), andthe trend is toward higher SSA as would be expected for
increasingly hydrated aerosol. The differing trends fordifferent AOD bins may be associated with greater coagu-lation efficiency for conditions of greater aerosol concen-tration and may explain the monotonic increase of SSAversus CWV slope for the intermediate AOD bins (1.0–1.5and 1.5–2.0, not pictured).
5.3. Seasonal Volume Size Distribution and Evidenceof Dust in the Northern Amazon
[32] Figures 21 and 22 present averaged subsets of sizedistributions derived for the wet season and the respectivepeak burning seasons at Alta Floresta and Balbina. For thepeak months of biomass burning (August–October in thesouth and October–December in the north), averaged sizedistributions are shown for almucantars acquired during theaverage AOD conditions during these months (in AltaFloresta the dry season AODavg is 1.0 ± 0.06 [N = 57]and in Balbina the dry season AODavg is 0.43 ± 0.05 [N =
Figure 18. Averaged volume size distributions (fine modeonly) grouped by aerosol optical depth for the compositeAmazonian southern forest sites and for an urban aerosol(Goddard Space Flight Center) for all cases when theobserved column water vapor was between 3.5 and 4.5 cm.
Figure 19. Volume median radius of the fine mode VMRf
as a function of column water vapor for two aerosol opticaldepth (440 nm) bins.
Figure 20. Single-scattering albedo (SSA550nm) as afunction of column water vapor for two aerosol opticaldepth (440 nm) bins.
D04204 SCHAFER ET AL.: ATMOSPHERIC AEROSOLS IN AMAZONIA
11 of 16
D04204

48]) which may be taken as ‘‘typical’’ size distributions forthe burning season in each region. As would be expected,during the burning season the majority of the atmosphericextinction is due to fine mode aerosols, which are respon-sible for approximately 84% of the total AOD at Balbinaand more than 96% of the AOD at Alta Floresta.[33] The wet season size distributions were derived from
observations during the February–April months and arecomposites of size distributions for all almucantars. Pre-dominantly cloudy conditions at both sites during the wetseason limited the availability of days with suitable skyconditions for high-quality almucantar procedures, resultingin a relatively low number of successful retrievals duringthese months (for Alta Floresta N = 27; for Balbina N = 12).The aerosol fine mode volume concentrations were atminimal levels during this interval at both locations aswould be anticipated. The coarse mode peak concentrationis larger for the Balbina site (also observed at Belterra) thanin the southern forest, both in absolute terms (0.023 versus0.012) and relative to the fine mode peak and this factorresults in a much lower fine mode fractional contribution toAOD440nm (53%) at Balbina than is observed at AltaFloresta (76%). The peak size of the coarse mode radiusfor the Balbina site (approximately 1.55 mm) is consistentwith the size of desert particles retrieved by AERONET[Eck et al., 2008].[34] Dust transport to this region during the wet season
has been demonstrated previously by satellite [Koren et al.,2006] and in situ sampling (ground and aircraft [Formenti etal., 2001] and aircraft [Swap et al., 1992]). Swap et al.[1992] originally noted that considerable amounts of dustobserved in the central Amazon basin during the wet seasonis of Saharan origin, and Koren et al. [2006] have docu-mented routine and continuous dust transport from theSahara to the Amazon basin during the Northern winter.In 1998, the year before our monitoring began, Formenti etal. [2001] measured an unbroken 4-day interval of dust at
our Balbina site during the same seasonal interval that weobserved our dust events and back trajectories conclusivelyindicated source regions of both the Morrocan coast and theSahel.[35] Given the known annual transport of Saharan dust
into northeastern South America during this part of the year,it is reasonable to speculate that the enhanced coarse modefor the Balbina site represents a dust signature associatedwith transport into the Brazilian interior [Kaufman et al.,2005; Luo et al., 2003]. Back trajectory analyses for thedates when the Balbina wet season almucantars wereobtained indicated an origination of the aerosol in westernAfrica for all cases. The very low-average Angstrom expo-nent (0.54) observed in the northern forest during thisinterval is also consistent with the presence of large (dust-like) aerosol particles.
6. Single-Scattering Albedo Statistics6.1. Correlation of Aerosol Absorption Propertieswith Ground Cover Type[36] A measure of the absorption characteristics of the
atmospheric aerosol can also be derived from almucantarsky radiance retrievals for conditions with suitably high-aerosol loadings (greater than 0.4 at 440 nm) and may bequantified as single-scattering albedos at four wavelengths.Early season fires have a greater contribution from grassfires that are characterized by flaming phase combustionwhich have lower combustion efficiency and produce aero-sols with higher-black-carbon content and thus lower sin-gle-scattering albedos. As the burning season progresses itwould be anticipated that this type of combustion woulddiminish relative to smoldering-type combustion fromwoody fuel fires that burn more efficiently and result inhigher SSAs. Analyses identified no such seasonal trend inSSA that was statistically significant, however. By a largedegree the most robust predictor of the absorption featuresof smoke aerosols was the ground cover type of the region.
Figure 22. Averaged volume size distributions derivedfrom observations during the wet season (February–April)and the burning season months (October–December) atBalbina.
Figure 21. Averaged volume size distributions derivedfrom observations during the wet season (February–April)and the burning season months (August–October) at AltaFloresta.
D04204 SCHAFER ET AL.: ATMOSPHERIC AEROSOLS IN AMAZONIA
12 of 16
D04204

[37] We have a substantial record of single-scatteringalbedo measurements for the southern forest and Cerradosites derived from numerous years that are composited (theaverage of SSA440nm and SSA670nm is shown) and presentedas histograms in Figure 23. Regionally averaged values arealso presented in Table 2. All of the southern forest sitesexhibit similar values of SSA550nm and a moderately ab-sorbing average single-scattering albedo of 0.92–0.93 at550nm; the northern forest sites average slightly less (0.91),while the Cerrado site (Cuiaba) averages 0.04 less than thesouthern forest (as we would expect given the difference inpredominant fuel for this ground cover type). By definitionthe Cerrado region includes sites that are primarily influ-enced by savanna and open pasturelands that exhibit ahigher fraction of flaming phase combustion which explainswhy the mean single-scattering albedo averages substantial-ly less than the mean values in the southern forest region forthe corresponding month. The range of SSA is also greaterfor the Cerrado site (standard deviation is 0.04) than at thethree forest sites (approximately 0.025).[38] This is largely due to the fact that the Cuiaba region
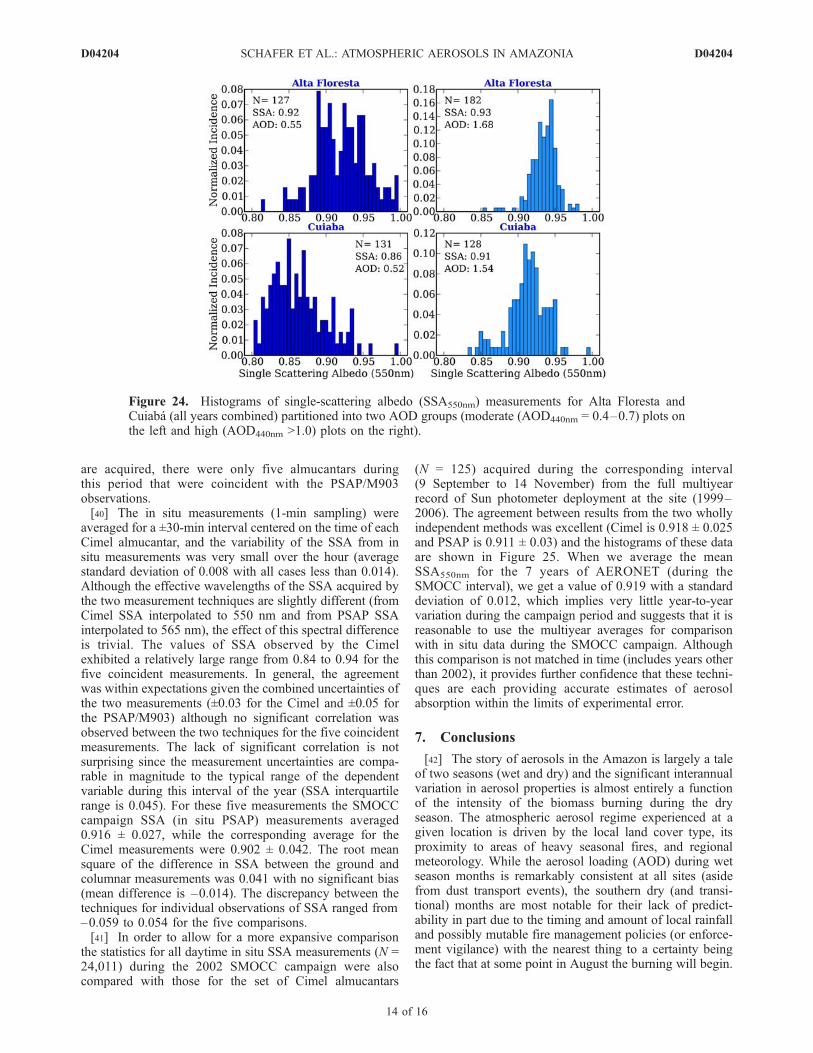
experiences significant amounts of smoke from both smol-dering and flaming fires as can be seen when the histogramsfor Alta Floresta and Cuiaba are produced separately formoderate and high-AOD conditions (0.4–0.7 (dark bars inFigure 24) and greater than 1.0 (light bars in Figure 24),respectively). Grass fires (flaming phase combustion) com-monly have smaller AODs than forest fires and this resultsin significantly lower SSA values (average is 0.86) beingassociated with the smaller AODs at Cuiaba when localsavannah fires are prevalent. The higher-AOD conditionsare presumably attributable to the transport of forest firesmoke from the north which is reflected in a higher averageSSA (average is 0.91) that is more in line with the valuesobserved in the forest region sites. By comparison, Alta
Floresta, which is not as strongly influenced by grass fires,exhibits a minimal difference of SSA between the two AODscenarios (low (0.92) and high (0.93)) which is not surpris-ing for a region where emissions are dominated by biomassburning of tropical forest vegetation. Note that the greatervariability of derived SSA for both lower-AOD data sets ispartly due to a loss of sensitivity of the inversion algorithmfor lower-aerosol loading.
6.2. Comparison With In Situ (Filter-Based) SSAMeasurements
[39] Schmid et al. [2006] performed in situ measurementsof the single-scattering albedo of atmospheric aerosols at theAbracos Hill site during the LBA-SMOCC campaign usinga single-wavelength Particle Soot Absorption Photometer(PSAP) (565 nm) and a single-wavelength integratingnephelometer (M903) (545 nm), both manufactured byRadiance Research. Ambient aerosol was sampled and driedprior to particle detection and the uncertainty in measuredSSA was estimated as ±0.05 because of errors from particleloss and relative humidity control [Schmid et al., 2006].Aerosol drying should result in lower SSA, but since thebiomass burning aerosol is only weakly hygroscopic thiseffect should be relatively small. A Cimel Sun Photometerwas collocated at the Abracos Hill site during this time.Because the period of study began at the time of year whenrelatively fewer SSA measurements from the Cimel
Figure 23. Histograms of single-scattering albedo (SSA550nm) measurements for the southern forest andCerrado sites (all years combined).
Table 2. Statistics for Observed Single-Scattering Albedo
(SSA550nm) Grouped by Region (All Years Combined)
SSA550nm SD Number of Alms
Southern forest 0.926 0.026 994Northern forest 0.914 0.043 129Cerrado 0.887 0.039 420
D04204 SCHAFER ET AL.: ATMOSPHERIC AEROSOLS IN AMAZONIA
13 of 16
D04204
are acquired, there were only five almucantars duringthis period that were coincident with the PSAP/M903observations.[40] The in situ measurements (1-min sampling) were
averaged for a ±30-min interval centered on the time of eachCimel almucantar, and the variability of the SSA from insitu measurements was very small over the hour (averagestandard deviation of 0.008 with all cases less than 0.014).Although the effective wavelengths of the SSA acquired bythe two measurement techniques are slightly different (fromCimel SSA interpolated to 550 nm and from PSAP SSAinterpolated to 565 nm), the effect of this spectral differenceis trivial. The values of SSA observed by the Cimelexhibited a relatively large range from 0.84 to 0.94 for thefive coincident measurements. In general, the agreementwas within expectations given the combined uncertainties ofthe two measurements (±0.03 for the Cimel and ±0.05 forthe PSAP/M903) although no significant correlation wasobserved between the two techniques for the five coincidentmeasurements. The lack of significant correlation is notsurprising since the measurement uncertainties are compa-rable in magnitude to the typical range of the dependentvariable during this interval of the year (SSA interquartilerange is 0.045). For these five measurements the SMOCCcampaign SSA (in situ PSAP) measurements averaged0.916 ± 0.027, while the corresponding average for theCimel measurements were 0.902 ± 0.042. The root meansquare of the difference in SSA between the ground andcolumnar measurements was 0.041 with no significant bias(mean difference is –0.014). The discrepancy between thetechniques for individual observations of SSA ranged from–0.059 to 0.054 for the five comparisons.[41] In order to allow for a more expansive comparison
the statistics for all daytime in situ SSA measurements (N =24,011) during the 2002 SMOCC campaign were alsocompared with those for the set of Cimel almucantars
(N = 125) acquired during the corresponding interval(9 September to 14 November) from the full multiyearrecord of Sun photometer deployment at the site (1999–2006). The agreement between results from the two whollyindependent methods was excellent (Cimel is 0.918 ± 0.025and PSAP is 0.911 ± 0.03) and the histograms of these dataare shown in Figure 25. When we average the meanSSA550nm for the 7 years of AERONET (during theSMOCC interval), we get a value of 0.919 with a standarddeviation of 0.012, which implies very little year-to-yearvariation during the campaign period and suggests that it isreasonable to use the multiyear averages for comparisonwith in situ data during the SMOCC campaign. Althoughthis comparison is not matched in time (includes years otherthan 2002), it provides further confidence that these techni-ques are each providing accurate estimates of aerosolabsorption within the limits of experimental error.
7. Conclusions
[42] The story of aerosols in the Amazon is largely a taleof two seasons (wet and dry) and the significant interannualvariation in aerosol properties is almost entirely a functionof the intensity of the biomass burning during the dryseason. The atmospheric aerosol regime experienced at agiven location is driven by the local land cover type, itsproximity to areas of heavy seasonal fires, and regionalmeteorology. While the aerosol loading (AOD) during wetseason months is remarkably consistent at all sites (asidefrom dust transport events), the southern dry (and transi-tional) months are most notable for their lack of predict-ability in part due to the timing and amount of local rainfalland possibly mutable fire management policies (or enforce-ment vigilance) with the nearest thing to a certainty beingthe fact that at some point in August the burning will begin.
Figure 24. Histograms of single-scattering albedo (SSA550nm) measurements for Alta Floresta andCuiaba (all years combined) partitioned into two AOD groups (moderate (AOD440nm = 0.4–0.7) plots onthe left and high (AOD440nm >1.0) plots on the right).
D04204 SCHAFER ET AL.: ATMOSPHERIC AEROSOLS IN AMAZONIA
14 of 16
D04204

[43] This investigation observed an apparent enhancedhygroscopicity for high-smoke AOD conditions during theburning season that may be associated with aerosol resi-dence time and coagulation effects. Evidence was presentedthat indicates a likely tendency to underestimate the Ang-strom exponent because of cloud contamination, at least forcertain types of cloud regimes, on the basis of discrepanciesbetween a derived from almucantar and direct Sun meas-urements. On average this underestimation is not large(approximately 0.1) but may be quite significant for certainobservations of a derived from direct Sun measurements.Finally, the highest-AOD events during the wet seasonclearly suggested the influence of atmospheric mineral dustat the sites in the northern equatorial forest region, likelydue to aerosol advected from Western Africa.
[44] Acknowledgments. We thank the scientists and techniciansresponsible for operating and maintaining the instrumentation over thecourse of many years that generated this high-quality data set and ultimatelyenabled this paper to be written. These colleagues include Edilson Bernar-dino de Andrade (Alta Floresta); Alejandro Fonseca Duarte (Rio Branco);Jose de Souza Nogueira, Edilberto Ojeda de Almeida Filho, and AlfredoJorge (Cuiaba); Fernando Cardoso, Renata Aguiar, Hemerson Pablo Castro,Rosivaldo Lelis da Silva, and Fabricio Berton Zanchi (Rondonia); EvanEverton (Belterra); and Sr. Zairon (Balbina). Special thanks to the Brazilianscientists that coordinated activities for our subnetwork and ensured thatour operations functioned efficiently: Marcia Yamasoe, Aline Procopio,Gilberto Nishioka, and Melina Mara de Andrade Paixao.
ReferencesAnderson, T. L., R. J. Charlson, S. E. Schwartz, R. Knutti, O. Boucher,H. Rodhe, and J. Heintzenberg (2003), Climate forcing by aerosols: Ahazy picture, Science, 300, 1103–1104.
Andreae, M. O., et al. (2002), Biogeochemical cycling of carbon, water,energy, trace gases, and aerosols in Amazonia: The LBA-EUSTACHexperiments, J. Geophys. Res., 107(D20), 8066, doi:10.1029/2001JD000524.
Andreae, M. O., D. Rosenfeld, P. Artaxo, A. A. Costa, G. P. Frank, K. M.Longo, and M. A. F. Silva-Dias (2004), Smoking rain clouds over theAmazon, Science, 303(5662), 1337–1342.
Chylek, P., B. Henderson, and M. Mishchenko (2003), Aerosol radiativeforcing and the accuracy of satellite aerosol optical depth retrieval,J. Geophys. Res., 108(D24), 4764, doi:10.1029/2003JD004044.
Dubovik, O., and M. D. King (2000), A flexible inversion algorithm forretrieval of aerosol optical properties from Sun and sky radiance mea-surements, J. Geophys. Res., 105(D16), 20,673–20,696.
Dubovik, O., A. Smirnov, B. N. Holben, M. D. King, Y. J. Kaufman, T. F.Eck, and I. Slutsker (2000), Accuracy assessments of aerosol opticalproperties retrieved from Aerosol Robotic Network (AERONET) Sunand sky radiance measurements, J. Geophys. Res., 105(D8), 9791–9806.
Dubovik, O., et al. (2006), Application of spheroid models to account foraerosol particle nonsphericity in remote sensing of desert dust, J. Geo-phys. Res., 111, D11208, doi:10.1029/2005JD006619.
Eck, T. F., B. N. Holben, I. Slutsker, and A. Setzer (1998), Measurements ofirradiance attenuation and estimation of aerosol single scattering albedofor biomass burning aerosols in Amazonia, J. Geophys. Res., 103(D24),31,865–31,878.
Eck, T. F., B. N. Holben, J. S. Reid, O. Dubovik, A. Smirnov, N. T. O’Neill,I. Slutsker, and S. Kinne (1999), Wavelength dependence of the opticaldepth of biomass burning, urban, and desert dust aerosols, J. Geophys.Res., 104(D24), 31,333–31,349.
Eck, T. F., B. N. Holben, D. E. Ward, O. Dubovik, J. S. Reid, A. Smirnov,M. M. Mukelabai, N. C. Hsu, N. T. O’Neill, and I. Slutsker (2001),Characterization of the optical properties of biomass burning aerosolsin Zambia during the 1997 ZIBBEE field campaign, J. Geophys. Res.,106(D4), 3425–3448.
Eck, T. F., et al. (2003), Variability of biomass burning aerosol opticalcharacteristics in southern Africa during the SAFARI 2000 dry seasoncampaign and a comparison of single scattering albedo estimates fromradiometric measurements, J. Geophys. Res., 108(D13), 8477,doi:10.1029/2002JD002321.
Eck, T. F., et al. (2008), Spatial and temporal variability of column-integratedaerosol optical properties in the southern Arabian Gulf and United ArabEmirates in summer, J. Geophys. Res., 113, D01204, doi:10.1029/2007JD008944.
Falkovich, A. H., E. R. Graber, G. Schkolnik, Y. Rudich, W. Maenhaut, andP. Artaxo (2005), Low molecular weight organic acids in aerosol particlesfrom Rondonia, Brazil, during the biomass-burning, transition, and wetperiods, Atmos. Chem. Phys., 5, 781–797.
Figure 25. Histograms of single-scattering albedo measurements at Abracos Hill from (top) Cimelalmucantars and (bottom) PSAP in situ filter-derived measurements. The interval of comparison wasfrom 9 September to 14 November with PSAP measurements from 2002 and Cimel measurementsincluding almucantars measurements from 1999–2006.
D04204 SCHAFER ET AL.: ATMOSPHERIC AEROSOLS IN AMAZONIA
15 of 16
D04204

Formenti, P., M. O. Andreae, L. Lange, G. Roberts, J. Cafmeyer, I. Rajta,W. Maenhaut, B. N. Holben, P. Artaxo, and J. Lelieveld (2001),Saharan dust in Brazil and Suriname during the Large-Scale Biosphere-Atmosphere Experiment in Amazonia (LBA) - Cooperative LBA Regio-nal Experiment (CLAIRE) in March 1998, J. Geophys. Res., 106(D14),14,919–14,934.
Halthore, R. N., T. F. Eck, B. N. Holben, and B. L. Markham (1997), Sunphotometric measurements of atmospheric water vapor column abun-dance in the 940-nm band, J. Geophys. Res., 102(D4), 4343–4352.
Holben, B. N., A. Setzer, T. F. Eck, A. Pereira, and I. Slutsker (1996), Effectof dry-season biomass burning on Amazon basin aerosol concentrationsand optical properties, 1992–1994, J. Geophys. Res., 101(D14), 19,465–19,482.
Holben, B. N., et al. (1998), AERONET: A federated instrument networkand data archive for aerosol characterization, Remote Sens. Environ., 66,1–16.
Holben, B. N., et al. (2001), An emerging ground-based aerosol climatol-ogy: Aerosol optical depth from AERONET, J. Geophys. Res., 106(D11),12,067–12,097.
Holben, B. N., T. F. Eck, I. Slutsker, A. Smirnov, A. Sinyuk, J. Schafer,D. Giles, O. Dubovik (2006), AERONET’s Version 2.0 quality assurancecriteria, in Remote Sensing of Atmosphere and Clouds, edited by S.-C.Tsay et al. Proc. SPIE, 6408, 64080Q, doi:10.1117/12.706524.
Jethva, H., S. K. Satheesh, and J. Srinivasan (2005), Seasonal variability ofaerosols over the Indo-Gangetic basin, J. Geophys. Res., 110, D21204,doi:10.1029/2005JD005938.
Kaufman, Y. J., I. Koren, L. A. Remer, D. Tanre, P. Ginoux, and S. Fan(2005), Dust transport and deposition observed from the Terra-ModerateResolution Imaging Spectroradiometer (MODIS) spacecraft over theAtlantic Ocean, J. Geophys. Res., 110, D10S12, doi:10.1029/2003JD004436.
Kinne, S., et al. (2003), Monthly averages of aerosol properties: A globalcomparison among models, satellite data, and AERONET ground data,J. Geophys. Res., 108(D20), 4634, doi:10.1029/2001JD001253.
Koren, I., Y. J. Kaufman, L. A. Remer, and J. V. Martins (2004), Measure-ment of the effect of Amazon smoke on inhibition of cloud formation,Science, 303(5662), 1342–1345.
Koren, I., Y. J. Kaufman, R. Washington, M. C. Todd, Y. Rudich, J. V.Martins, and D. Rosenfeld (2006), The Bodele depression: A single spotin the Sahara that provides most of the mineral dust to the Amazon forest,Environ. Res. Lett., 1(014005), doi:10.1088/1748-9326/1/1/014005.
Kotchenruther, R. A., and P. V. Hobbs (1998), Humidification factors ofaerosols from biomass burning in Brazil, J. Geophys. Res., 103(D24),32,081–32,090.
Liu, H., R. T. Pinker, and B. N. Holben (2005), A global view of aerosolsfrom merged transport models, satellite, and ground observations,J. Geophys. Res., 110, D10S15, doi:10.1029/2004JD004695.
Luo, C., N. M. Mahowald, and J. del Corral (2003), Sensitivity study ofmeteorological parameters on mineral aerosol mobilization, transport, anddistribution, J. Geophys. Res., 108(D15), 4447, doi:10.1029/2003JD003483.
Mircea, M., et al. (2005), Importance of the organic aerosol fraction formodeling aerosol hygroscopic growth and activation: A case study in theAmazon Basin, Atmos. Chem. Phys., 5, 3111–3126.
Raj, P. E., P. C. S. Devara, R. S. Maheskumar, G. Pandithurai, K. K. Dani,S. K. Saha, S. M. Sonbawne, and Y. K. Tiwari (2004), Results of sun
photometer-derived precipitable water content over a tropical Indian sta-tion, J. Appl. Meteorol., 43(10), 1452–1459.
Reid, J. S., P. V. Hobbs, R. J. Ferek, D. R. Blake, J. V. Martins, M. R.Dunlap, and C. Liousse (1998), Physical, chemical, and optical propertiesof regional hazes dominated by smoke in Brazil, J. Geophys. Res.,103(D24), 32,059–32,080.
Reid, J. S., T. F. Eck, S. A. Christopher, P. V. Hobbs, and B. Holben (1999),Use of the Angstrom exponent to estimate the variability of optical andphysical properties of aging smoke particles in Brazil, J. Geophys. Res.,104(D22), 27,473–27,489.
Rissler, J., A. Vestin, E. Swietlicki, G. Fisch, J. Zhou, P. Artaxo, and M. O.Andreae (2006), Size distribution and hygroscopic properties of aerosolparticles from dry-season biomass burning in Amazonia, Atmos. Chem.Phys., 6, 471–491.
Schmid, B., et al. (2001), Comparison of Columnar water-vapor measure-ments from solar transmittance methods, Appl. Opt., 40, 1886–1896.
Schmid, O., P. Artaxo, W. P. Arnott, D. Chand, L. V. Gatti, G. P. Frank,A. Hoffer, M. Schnaiter, and M. O. Andreae (2006), Spectral lightabsorption by ambient aerosols influenced by biomass burning in theAmazon Basin: part I: Comparison and field calibration of absorptionmeasurement techniques, Atmos. Chem. Phys., 6, 3443–3462.
Silva Dias, M. A. F., et al. (2002), A case study of convective organizationinto precipitating lines in the Southwest Amazon during the WETAMCand TRMM-LBA, J. Geophys. Res., 107(D20), 8078, doi:10.1029/2001JD000375.
Smirnov, A., B. N. Holben, T. F. Eck, O. Dubovik, and I. Slutsker (2000),Cloud-screening and quality control algorithms for the AERONET data-base, Remote Sens. Environ., 73(3), 337–349.
Smirnov, A., B. N. Holben, A. Lyapustin, I. Slutsker and T. F. Eck (2004),AERONETprocessing algorithm refinement, paper presented atAERONETWorkshop, Univ. of Huelva and the Span. Soc. of Optics, El Arenosillo,Spain, May 10–14, 2004.
Swap, R., M. Garstang, S. Greco, R. Talbot, and P. Kallberg (1992), Saharandust in the Amazon Basin, Tellus B, 44(2), 133–149, doi:10.1034/j.1600-0889.1992.t01-1-00005.x.
Vermote, E. F., D. Tanre, J. L. Deuze, M. Herman, and J. J. Morcrette(1997), Second simulation of the satellite signal in the solar spectrum,6S: An overview, IEEE Trans. Geosci. Remote Sens., 35, 675–686.
Yu, H., R. E. Dickinson, M. Chin, Y. J. Kaufman, B. N. Holben, I. V.Geogdzhayev, and M. I. Mishchenko (2003), Annual cycle of globaldistributions of aerosol optical depth from integration of MODIS retrie-vals and GOCART model simulations, J. Geophys. Res., 108(D3), 4128,doi:10.1029/2002JD002717.
�����������������������P. Artaxo, Departamento de Fısica Aplicada, Instituto de Fısica,
Universidade de Sao Paulo, Rua do Matao, Travessa R, 187, Caixa Postal66318, Sao Paulo, SP-05508-900, Brazil.A. F. Duarte, Departamento de Ciencias da Natureza, Universidade
Federal do Acre, BR 364, Km 04, Rio Branco, AC-69.915-900, Brazil.T. F. Eck and B. N. Holben, Biospheric Sciences Branch, NASA Goddard
Space Flight Center, Code 923, Greenbelt, MD 20771, USA.J. S. Schafer, Science Systems and Applications, Inc., 10210 Greenbelt
Road, Suite 600 Lanham, MD 20706, USA. ([email protected])
D04204 SCHAFER ET AL.: ATMOSPHERIC AEROSOLS IN AMAZONIA
16 of 16
D04204