Embed Size (px)
Citation preview
The Pennsylvania State University
The Graduate School
Huck Institute of Life Sciences
CHARACTERIZATION OF THE PATHOGEN-REGULATED ARABIDOPSIS
BONZAI1/COPINE1 PROTEIN AND ITS ROLE IN CALCIUM SIGNALING
A Dissertation in
Integrative Biosciences
by
Tzuu-fen Lee
Submitted in Partial Fulfillment
of the Requirements
for the Degree of
Doctor of Philosophy
August 2008

ii
The dissertation of Tzuu-fen Lee was reviewed and approved* by the following:
Timothy W. McNellis
Associate Professor of Plant Pathology
Thesis Advisor
Chair of Committee
Surinder Chopra
Associate Professor of Crop & Soil Sciences
Seogchan Kang
Associate Professor of Plant Pathology
Paula McSteen
Assistant Professor of Biology
Andrew Stephenson
Professor of Biology
Peter Hudson
Director,
Integrative Biosciences Program
Huck Institutes of the Life Sciences
*Signatures are on file in the Graduate School
iii
ABSTRACT
The Arabidopsis BONZAI1/COPINE1 (BON1/CPN1) gene is a suppressor of
defense responses controlled by the disease resistance gene homolog SNC1. The
BON1/CPN1 null mutant cpn1-1 has a recessive, temperature- and humidity-dependent
lesion mimic phenotype that includes enhanced disease resistance and activation of
Pathogenesis Related (PR) gene expression. This study shows that calcium perturbation
activated defense responses in the absence of BON1/CPN1. Leaf infiltration with the
calcium ionophore A23187 triggered strong PR gene expression specifically in cpn1-1
mutant plants grown under permissive conditions while co-infiltration of the calcium
chelator EGTA attenuated this effect. This suggests that BON1/CPN1 is required for
normal responses to calcium fluxes. Using a polyclonal anti-BON1/CPN1 antibody, the
accumulation of BON1/CPN1 protein was shown to be up-regulated by the activation of
defense signaling responses controlled by two Resistance (R) genes, SNC1 and RPS2.
Promoter deletion analysis identified a 280 bp portion of the BON1/CPN1 promoter
required for pathogen- and A23187-induced GUS expression, which occurred in a
punctate pattern in treated leaves. Finally, two BON1/CPN1 promoter T-DNA mutants
over-accumulated BON1/CPN1 despite T-DNA inserted extremely close to the
BON1/CPN1 transcriptional start site. Our study explains the conditional nature of the
cpn1-1 phenotype. These results are consistent with BON1/CPN1 being a calcium- and
pathogen-responsive plant defense suppressor protein.
iv
TABLE OF CONTENTS
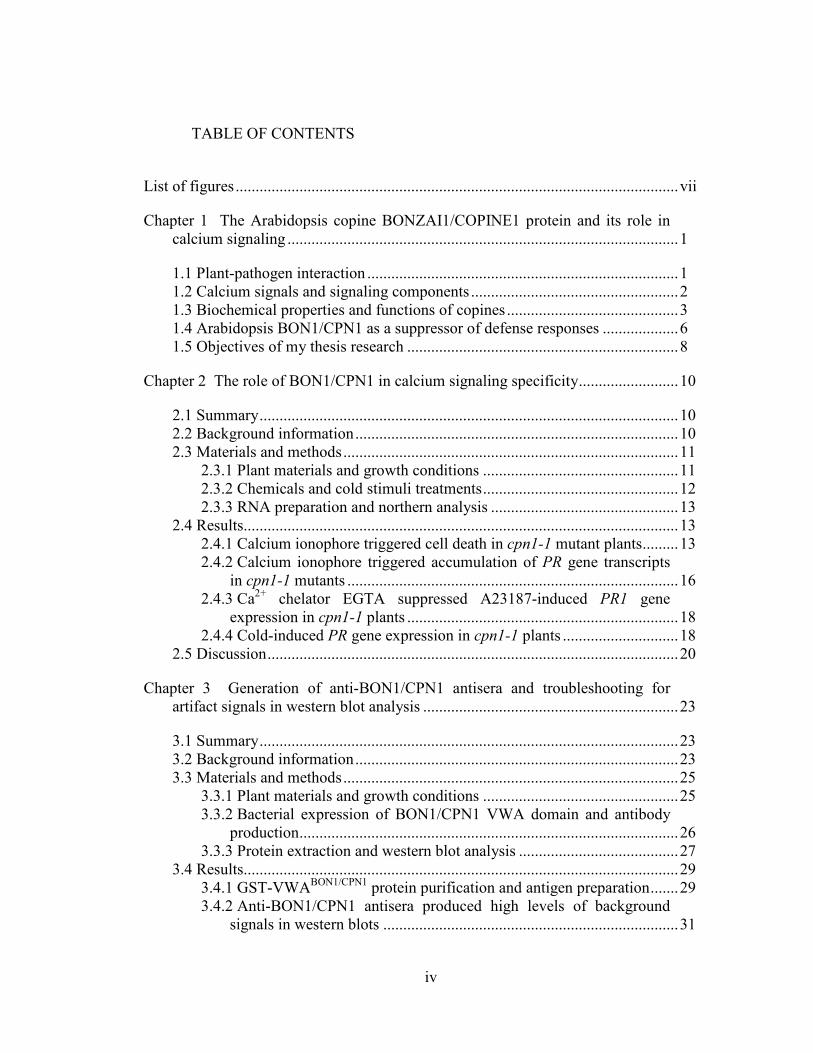
List of figures...............................................................................................................vii
Chapter 1 The Arabidopsis copine BONZAI1/COPINE1 protein and its role in
calcium signaling ..................................................................................................1
1.1 Plant-pathogen interaction ..............................................................................1
1.2 Calcium signals and signaling components ....................................................2
1.3 Biochemical properties and functions of copines...........................................3
1.4 Arabidopsis BON1/CPN1 as a suppressor of defense responses ...................6
1.5 Objectives of my thesis research ....................................................................8
Chapter 2 The role of BON1/CPN1 in calcium signaling specificity.........................10
2.1 Summary.........................................................................................................10
2.2 Background information.................................................................................10
2.3 Materials and methods....................................................................................11
2.3.1 Plant materials and growth conditions .................................................11
2.3.2 Chemicals and cold stimuli treatments.................................................12
2.3.3 RNA preparation and northern analysis ...............................................13
2.4 Results.............................................................................................................13
2.4.1 Calcium ionophore triggered cell death in cpn1-1 mutant plants.........13
2.4.2 Calcium ionophore triggered accumulation of PR gene transcripts
in cpn1-1 mutants ...................................................................................16
2.4.3 Ca2+ chelator EGTA suppressed A23187-induced PR1 gene
expression in cpn1-1 plants ....................................................................18
2.4.4 Cold-induced PR gene expression in cpn1-1 plants .............................18
2.5 Discussion.......................................................................................................20
Chapter 3 Generation of anti-BON1/CPN1 antisera and troubleshooting for
artifact signals in western blot analysis ................................................................23
3.1 Summary.........................................................................................................23
3.2 Background information.................................................................................23
3.3 Materials and methods....................................................................................25
3.3.1 Plant materials and growth conditions .................................................25
3.3.2 Bacterial expression of BON1/CPN1 VWA domain and antibody
production...............................................................................................26
3.3.3 Protein extraction and western blot analysis ........................................27
3.4 Results.............................................................................................................29
3.4.1 GST-VWABON1/CPN1
protein purification and antigen preparation.......29
3.4.2 Anti-BON1/CPN1 antisera produced high levels of background
signals in western blots ..........................................................................31
v
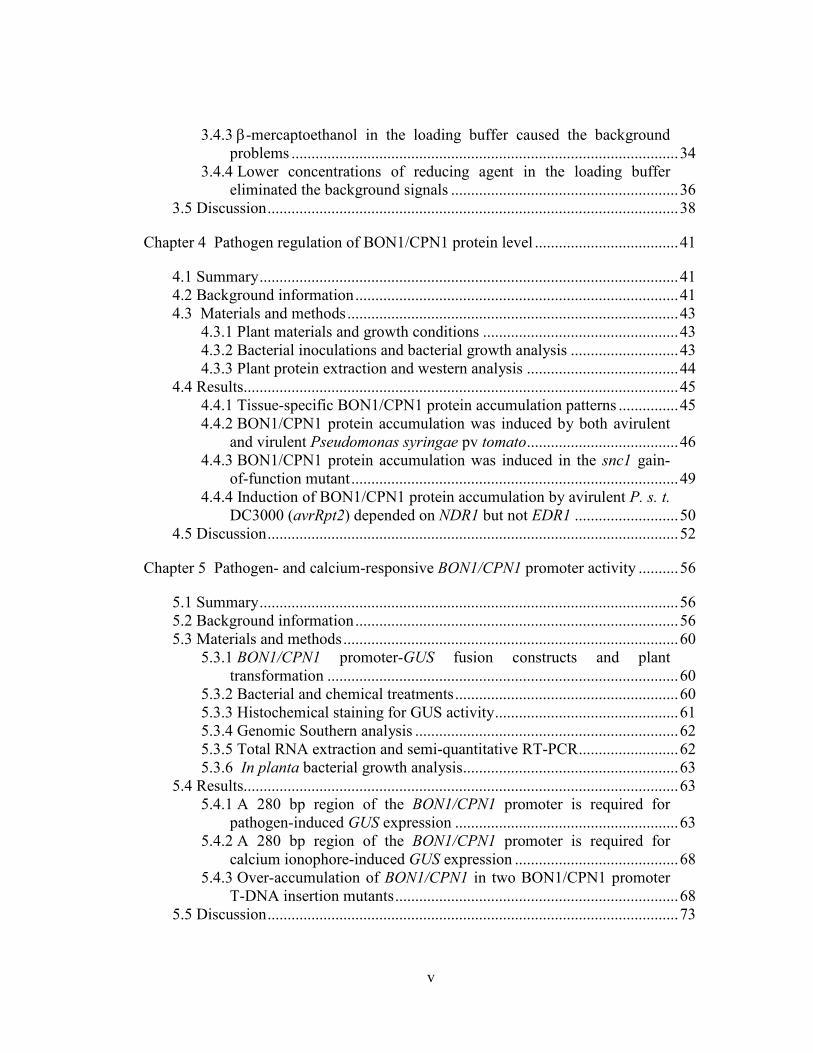
3.4.3 β-mercaptoethanol in the loading buffer caused the background
problems .................................................................................................34
3.4.4 Lower concentrations of reducing agent in the loading buffer
eliminated the background signals .........................................................36
3.5 Discussion.......................................................................................................38
Chapter 4 Pathogen regulation of BON1/CPN1 protein level ....................................41
4.1 Summary.........................................................................................................41
4.2 Background information.................................................................................41
4.3 Materials and methods...................................................................................43
4.3.1 Plant materials and growth conditions .................................................43
4.3.2 Bacterial inoculations and bacterial growth analysis ...........................43
4.3.3 Plant protein extraction and western analysis ......................................44
4.4 Results.............................................................................................................45
4.4.1 Tissue-specific BON1/CPN1 protein accumulation patterns ...............45
4.4.2 BON1/CPN1 protein accumulation was induced by both avirulent
and virulent Pseudomonas syringae pv tomato......................................46
4.4.3 BON1/CPN1 protein accumulation was induced in the snc1 gain-
of-function mutant..................................................................................49
4.4.4 Induction of BON1/CPN1 protein accumulation by avirulent P. s. t.
DC3000 (avrRpt2) depended on NDR1 but not EDR1 ..........................50
4.5 Discussion.......................................................................................................52
Chapter 5 Pathogen- and calcium-responsive BON1/CPN1 promoter activity ..........56
5.1 Summary.........................................................................................................56
5.2 Background information.................................................................................56
5.3 Materials and methods....................................................................................60
5.3.1 BON1/CPN1 promoter-GUS fusion constructs and plant
transformation ........................................................................................60
5.3.2 Bacterial and chemical treatments........................................................60
5.3.3 Histochemical staining for GUS activity..............................................61
5.3.4 Genomic Southern analysis ..................................................................62
5.3.5 Total RNA extraction and semi-quantitative RT-PCR.........................62
5.3.6 In planta bacterial growth analysis......................................................63
5.4 Results.............................................................................................................63
5.4.1 A 280 bp region of the BON1/CPN1 promoter is required for
pathogen-induced GUS expression ........................................................63
5.4.2 A 280 bp region of the BON1/CPN1 promoter is required for
calcium ionophore-induced GUS expression .........................................68
5.4.3 Over-accumulation of BON1/CPN1 in two BON1/CPN1 promoter
T-DNA insertion mutants.......................................................................68
5.5 Discussion.......................................................................................................73
vi
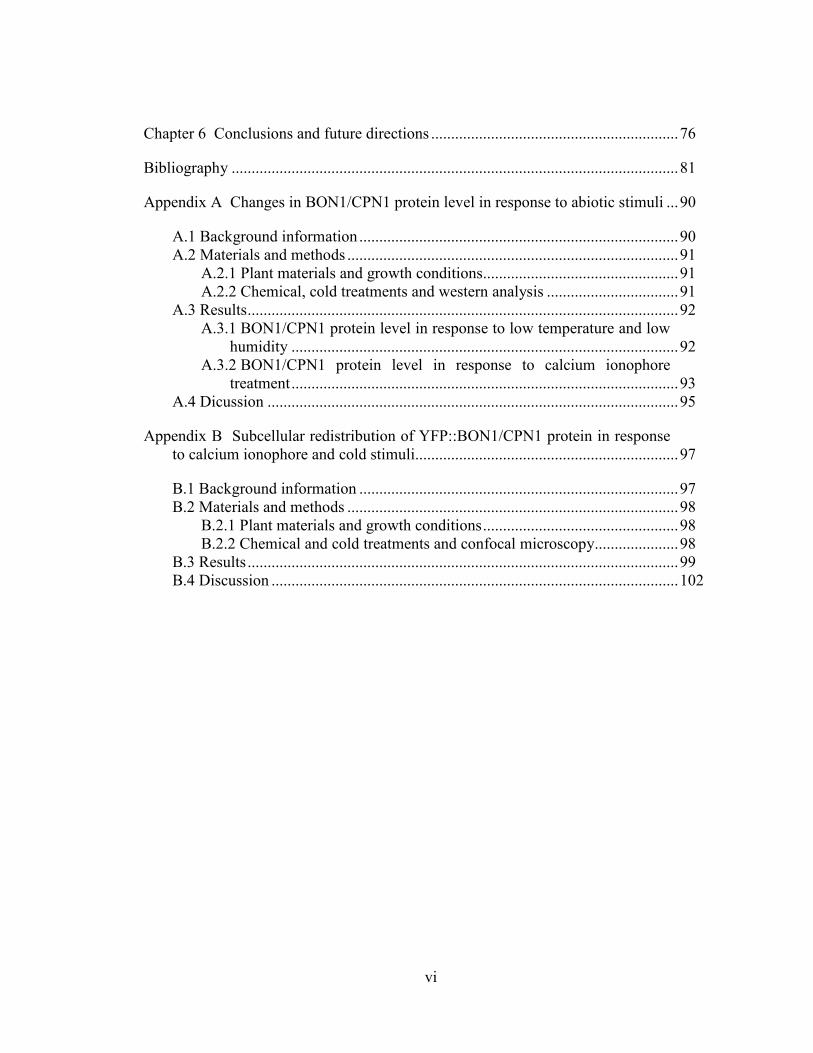
Chapter 6 Conclusions and future directions ..............................................................76
Bibliography ................................................................................................................81
Appendix A Changes in BON1/CPN1 protein level in response to abiotic stimuli ...90
A.1 Background information ................................................................................90
A.2 Materials and methods ...................................................................................91
A.2.1 Plant materials and growth conditions.................................................91
A.2.2 Chemical, cold treatments and western analysis .................................91
A.3 Results............................................................................................................92
A.3.1 BON1/CPN1 protein level in response to low temperature and low
humidity .................................................................................................92
A.3.2 BON1/CPN1 protein level in response to calcium ionophore
treatment.................................................................................................93
A.4 Dicussion .......................................................................................................95
Appendix B Subcellular redistribution of YFP::BON1/CPN1 protein in response
to calcium ionophore and cold stimuli..................................................................97
B.1 Background information ................................................................................97
B.2 Materials and methods ...................................................................................98
B.2.1 Plant materials and growth conditions.................................................98
B.2.2 Chemical and cold treatments and confocal microscopy.....................98
B.3 Results ............................................................................................................99
B.4 Discussion ......................................................................................................102
vii
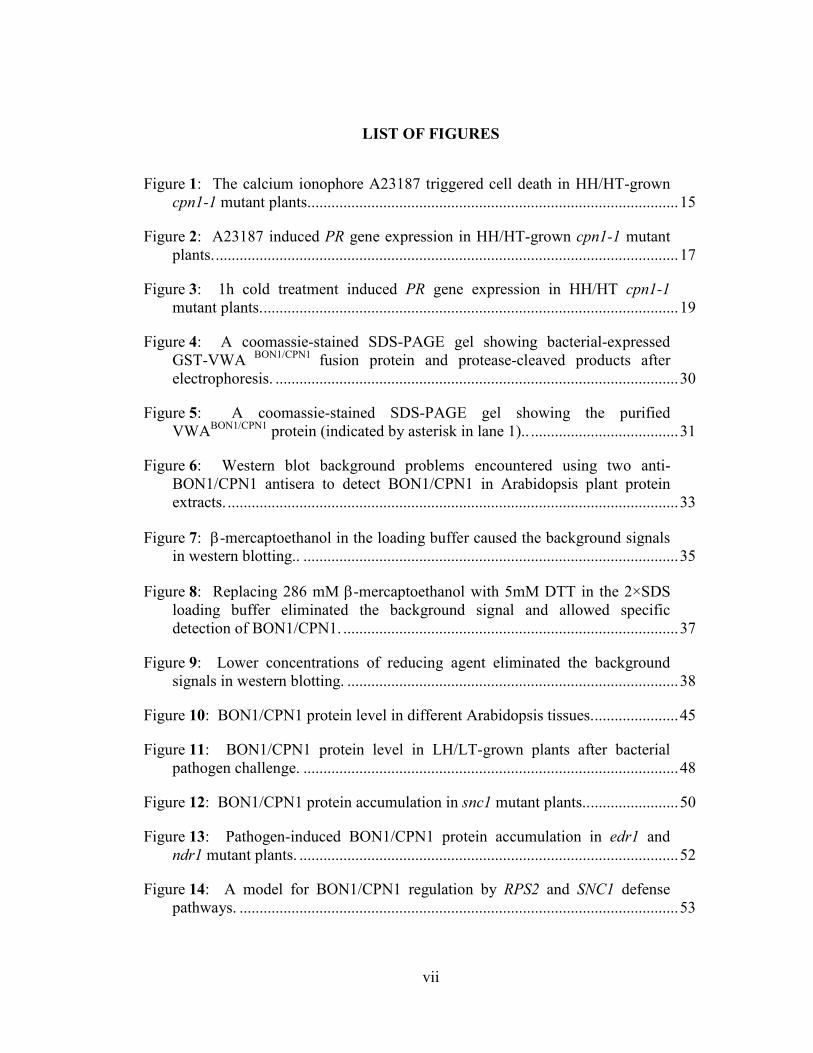
LIST OF FIGURES
Figure 1: The calcium ionophore A23187 triggered cell death in HH/HT-grown
cpn1-1 mutant plants.............................................................................................15
Figure 2: A23187 induced PR gene expression in HH/HT-grown cpn1-1 mutant
plants.....................................................................................................................17
Figure 3: 1h cold treatment induced PR gene expression in HH/HT cpn1-1
mutant plants.........................................................................................................19
Figure 4: A coomassie-stained SDS-PAGE gel showing bacterial-expressed
GST-VWA BON1/CPN1
fusion protein and protease-cleaved products after
electrophoresis. .....................................................................................................30
Figure 5: A coomassie-stained SDS-PAGE gel showing the purified
VWABON1/CPN1
protein (indicated by asterisk in lane 1).. .....................................31
Figure 6: Western blot background problems encountered using two anti-
BON1/CPN1 antisera to detect BON1/CPN1 in Arabidopsis plant protein
extracts. .................................................................................................................33
Figure 7: β-mercaptoethanol in the loading buffer caused the background signals
in western blotting.. ..............................................................................................35
Figure 8: Replacing 286 mM β-mercaptoethanol with 5mM DTT in the 2×SDS
loading buffer eliminated the background signal and allowed specific
detection of BON1/CPN1. ....................................................................................37
Figure 9: Lower concentrations of reducing agent eliminated the background
signals in western blotting. ...................................................................................38
Figure 10: BON1/CPN1 protein level in different Arabidopsis tissues......................45
Figure 11: BON1/CPN1 protein level in LH/LT-grown plants after bacterial
pathogen challenge. ..............................................................................................48
Figure 12: BON1/CPN1 protein accumulation in snc1 mutant plants........................50
Figure 13: Pathogen-induced BON1/CPN1 protein accumulation in edr1 and
ndr1 mutant plants. ...............................................................................................52
Figure 14: A model for BON1/CPN1 regulation by RPS2 and SNC1 defense
pathways. ..............................................................................................................53
viii
Figure 15: Some predicted cis-acting elements in the BON1/CPN1 promoter
region. ...................................................................................................................59
Figure 16: Expression of BON1/CPN1 promoter-GUS fusion construct in
transgenic Arabidopsis plants. ..............................................................................65
Figure 17: BON1/CPN1 promoter deletion analysis in response to pathogen and
calcium ionophore stimuli.. ..................................................................................67
Figure 18: Phenotypic effects of two T-DNA insertions in the BON1/CPN1
promoter................................................................................................................70
Figure 19: Overexpression of BON1/CPN1 in cpn1-2 and cpn1-3 mutants. .............72
Figure 20: A proposed model for the function of BON1/CPN1.. ...............................77
Figure A1: BON1/CPN1 protein level in LH/LT or HH/HT-grown Col-0 plants. ....92
Figure A2: BON1/CPN1 protein level in Col-0 plants after 4°C cold treatment. ......93
Figure A3: BON1/CPN1 protein level in wild-type Col-0 plants after A23187
treatment. ..............................................................................................................94
Figure B1: Subcellular localization of YFP::BON1/CPN1 in response to bacterial
pathogen, calcium ionophore, and cold stimuli in transgenic plant leaves. .........101

ix
ACKNOWLEDGEMENTS
First and foremost, I would like to express my greatest gratitude to my thesis advisor, Dr.
Timothy W. McNellis, for his full support and guidance throughout my doctoral study. I
would also like to thank my thesis committee members, Dr. Surinder Chopra, Dr. Paula
McSteen, Dr. Seogchan Kang, and Dr. Andrew Stephenson for their helpful suggestions
and discussions regarding my research projects. Furthermore, I would like to thank my
previous and current lab members, Dr. Niran Jambunathan, Dr. Jianxin Liu, Justin Dillon,
Dr. Philip Jensen, Judy Sinn, Steven Lee, and Dharmendra Singh for all their help,
discussion, and encouragement during my time in the lab. Finally, my deepest
appreciation and gratitude goes to my family in Taiwan and my fiancé Yilun Zhao. I
would have been able to complete this long journey without their love and support.
This thesis is dedicated to my dear late father Guang-Jie Lee, whose unconditional love
lives on forever in our memory
.
Chapter 1
The Arabidopsis copine BONZAI1/COPINE1 protein and its role in calcium
signaling
1.1 Plant-pathogen interaction
Plants frequently encounter a range of abiotic and biotic challenges during their
lifetime. Therefore, complex non-self recognition and defense mechanisms are deployed
to protect against microbial attack. The genetic basis of plant-pathogen recognition can
be explained by the “gene-for-gene” concept (Flor, 1971). In an incompatible plant-
pathogen interaction, a bacterial effector protein encoded by an avirulence gene (Avr) can
be specifically recognized by a corresponding protein encoded by a resistance (R) gene in
the plants (Flor, 1971; Staskawicz et al., 1995; Dangl and Jones, 2001; Nimchuk et al.,
2003). The recognition event then triggers a sequence of signaling events that leads to
defense activation and renders the plants resistant to pathogen invasion. On the other
hand, a compatible interaction occurs when either determinant from the plants or the
pathogens is absent, which leads to the breakdown of resistance and renders the plants
susceptible to the pathogen attack (Dangl and Jones, 2001; Nurnberger and Scheel, 2001;
Nimchuk et al., 2003).
The earliest steps in defense are changes in ion fluxes such as calcium influx
(Nurnberger and Scheel, 2001; Hetherington and Brownlee, 2004; Garcia-Brugger et al.,
2006). Other defense responses include production of reactive oxygen species (ROS),
2
production of nitric oxide (NO), cell wall reinforcement, and production of antimicrobial
compounds such as phytoalexins (Beynon and Dickinson, 2000; Dangl and Jones, 2001).
One of the most rapid defense responses is the hypersensitive response (HR), which
involves necrosis cell death at the infection sites to contain the pathogen progress. The
HR is thought to be a form of programmed cell death and has some similarity to
mammalian apoptosis (Greenberg, 1997). At the later stage of the defense activation, the
accumulation of the phenolic signaling molecule salicylic acid (SA) triggers a
heightened, systemic immune response throughout the plants by inducing several
Pathogenesis-Related (PR) defense genes and producing antimicrobial compounds
(Durrant and Dong, 2004). This phenomenon, termed systemic acquired resistance
(SAR), protects the host plants systemically against subsequent invasion of a broad range
of pathogens (Dong, 1998; Nurnberger and Scheel, 2001; Durrant and Dong, 2004).
1.2 Calcium signals and signaling components
In plants, a rise in cytosolic free Ca2+ concentration is a component of signal
transduction events in response to numerous developmental processes and environmental
stimuli (White and Broadley, 2003; Hepler, 2005; Lecourieux et al., 2006). For instance,
cold induces a rapid and transient rise in cytosolic Ca2+ level, whereas elicitors from
fungal pathogens trigger a sustained increase of cytosolic Ca2+ (Knight et al., 1991). The
transient changes in Ca2+ concentration serve as initial calcium signals which are then
perceived by various proteins that bind calcium ions. During calcium signaling, these
Ca2+-binding proteins may function as calcium sensors to detect changes in cytosolic
3
Ca2+ level and transduce different stimuli into appropriate physiological responses
through interaction with downstream target proteins (Zielinski, 1998; Sanders et al.,
2002; Hetherington and Brownlee, 2004; Reddy and Reddy, 2004).
Plant calcium sensors can be divided into two major categories, which employ
different mechanisms to perceive and transduce calcium signals through downstream
signaling components. Sensor relays such as calmodulin (CaM) and calcineurin B-like
proteins undergo a calcium-induced conformational change, and subsequently change the
structure or enzyme activity of their targets proteins through protein-protein interaction
(Luan et al., 2002). Sensor responders such as Ca2+-dependent protein kinases (CDPK)
undergo a calcium-induced conformational change which affects the protein’s own
activity through intramolecular interaction (Harmon et al., 2000; Luan et al., 2002;
Harper et al., 2004). For calcium binding, many calcium sensors including CaMs and
CDPKs contain multiple “EF hand” motifs with a helix-loop-helix structure that binds a
single calcium ion (Zielinski, 1998). Calcium binding proteins without EF-hands, such
as copines and phospholipase D, contain C2 domains which bind Ca2+ ions and mediate
Ca2+-dependent phospholipid binding (Rizo and Sudhof, 1998). Together, the activation
of a specific set of calcium sensors and their downstream target proteins in a complex
network determines the specificity of calcium signaling.
1.3 Biochemical properties and functions of copines
Copines are a highly conserved protein family found in protozoa, nematodes,
animals, and plants (Tomsig and Creutz, 2002). The copines are defined as a protein
4
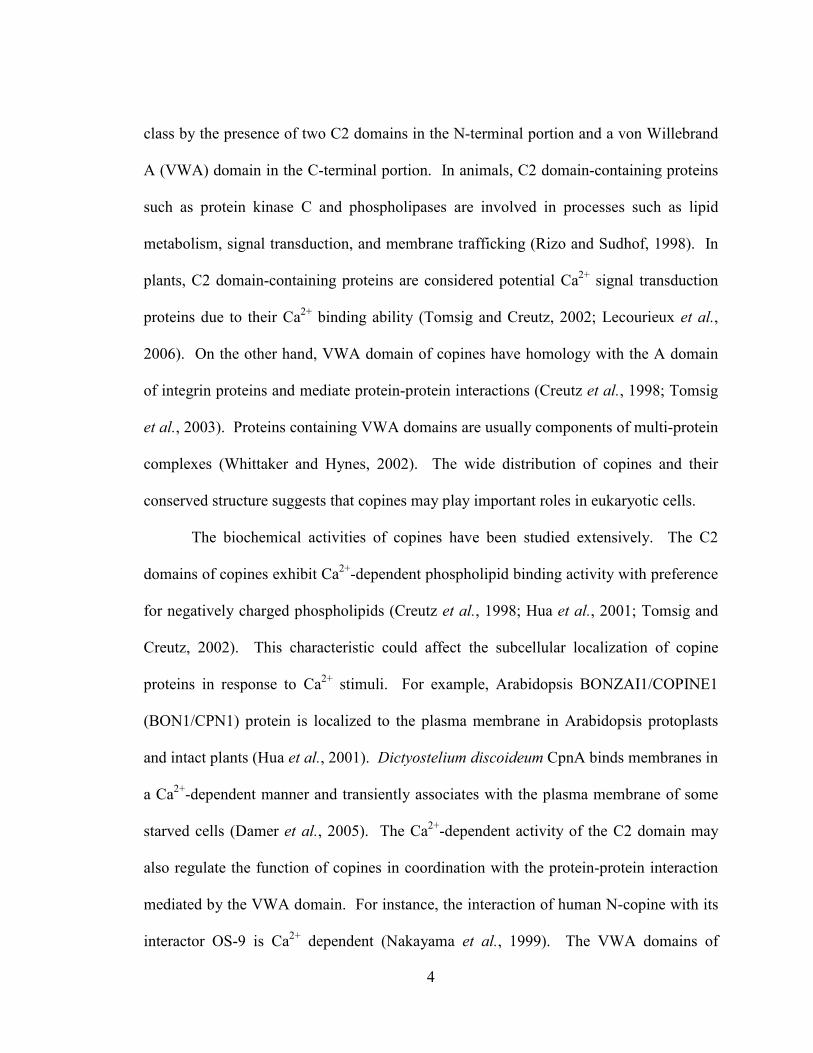
class by the presence of two C2 domains in the N-terminal portion and a von Willebrand
A (VWA) domain in the C-terminal portion. In animals, C2 domain-containing proteins
such as protein kinase C and phospholipases are involved in processes such as lipid
metabolism, signal transduction, and membrane trafficking (Rizo and Sudhof, 1998). In
plants, C2 domain-containing proteins are considered potential Ca2+ signal transduction
proteins due to their Ca2+ binding ability (Tomsig and Creutz, 2002; Lecourieux et al.,
2006). On the other hand, VWA domain of copines have homology with the A domain
of integrin proteins and mediate protein-protein interactions (Creutz et al., 1998; Tomsig
et al., 2003). Proteins containing VWA domains are usually components of multi-protein
complexes (Whittaker and Hynes, 2002). The wide distribution of copines and their
conserved structure suggests that copines may play important roles in eukaryotic cells.
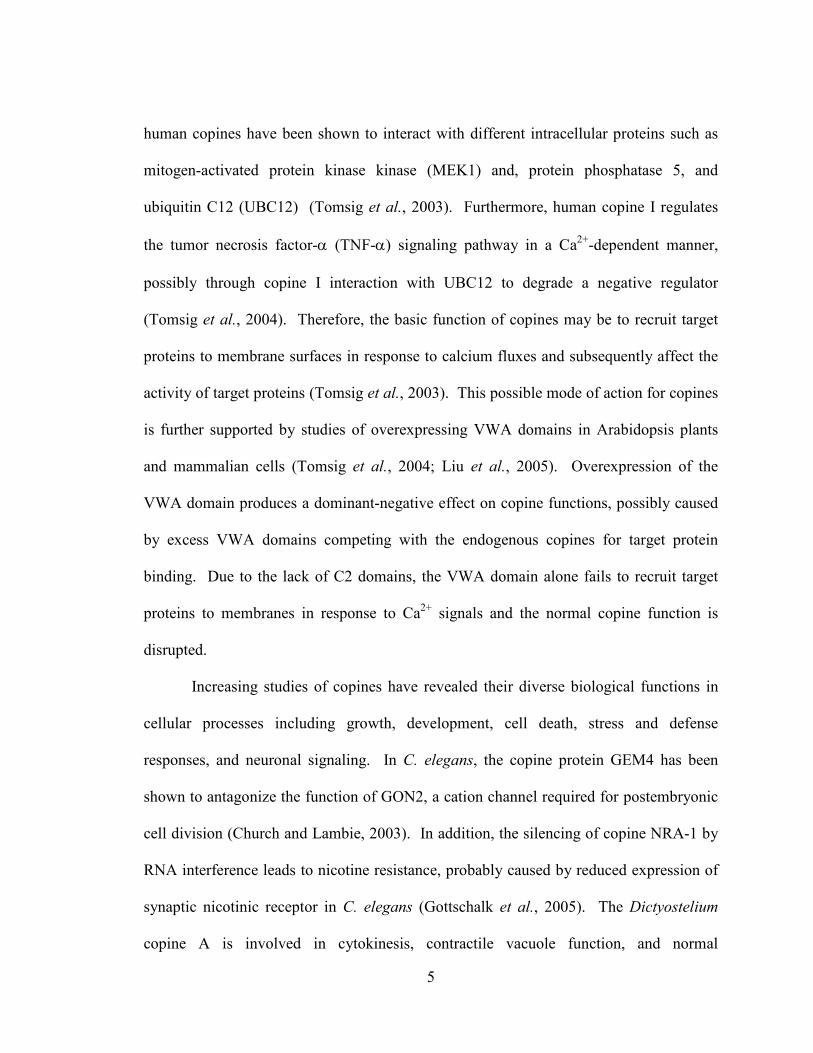
The biochemical activities of copines have been studied extensively. The C2
domains of copines exhibit Ca2+-dependent phospholipid binding activity with preference
for negatively charged phospholipids (Creutz et al., 1998; Hua et al., 2001; Tomsig and
Creutz, 2002). This characteristic could affect the subcellular localization of copine
proteins in response to Ca2+ stimuli. For example, Arabidopsis BONZAI1/COPINE1
(BON1/CPN1) protein is localized to the plasma membrane in Arabidopsis protoplasts
and intact plants (Hua et al., 2001). Dictyostelium discoideum CpnA binds membranes in
a Ca2+-dependent manner and transiently associates with the plasma membrane of some
starved cells (Damer et al., 2005). The Ca2+-dependent activity of the C2 domain may
also regulate the function of copines in coordination with the protein-protein interaction
mediated by the VWA domain. For instance, the interaction of human N-copine with its
interactor OS-9 is Ca2+ dependent (Nakayama et al., 1999). The VWA domains of
5
human copines have been shown to interact with different intracellular proteins such as
mitogen-activated protein kinase kinase (MEK1) and, protein phosphatase 5, and
ubiquitin C12 (UBC12) (Tomsig et al., 2003). Furthermore, human copine I regulates
the tumor necrosis factor-α (TNF-α) signaling pathway in a Ca2+-dependent manner,
possibly through copine I interaction with UBC12 to degrade a negative regulator
(Tomsig et al., 2004). Therefore, the basic function of copines may be to recruit target
proteins to membrane surfaces in response to calcium fluxes and subsequently affect the
activity of target proteins (Tomsig et al., 2003). This possible mode of action for copines
is further supported by studies of overexpressing VWA domains in Arabidopsis plants
and mammalian cells (Tomsig et al., 2004; Liu et al., 2005). Overexpression of the
VWA domain produces a dominant-negative effect on copine functions, possibly caused
by excess VWA domains competing with the endogenous copines for target protein
binding. Due to the lack of C2 domains, the VWA domain alone fails to recruit target
proteins to membranes in response to Ca2+ signals and the normal copine function is
disrupted.
Increasing studies of copines have revealed their diverse biological functions in
cellular processes including growth, development, cell death, stress and defense
responses, and neuronal signaling. In C. elegans, the copine protein GEM4 has been
shown to antagonize the function of GON2, a cation channel required for postembryonic
cell division (Church and Lambie, 2003). In addition, the silencing of copine NRA-1 by
RNA interference leads to nicotine resistance, probably caused by reduced expression of
synaptic nicotinic receptor in C. elegans (Gottschalk et al., 2005). The Dictyostelium
copine A is involved in cytokinesis, contractile vacuole function, and normal
6
development in the later stages prior to culmination (Damer et al., 2007). The human
copine I negatively regulates the TNF-α signaling in human embryonic kidney cells
(Tomsig et al., 2004). Furthermore, a recent study has shown that copine I blocks the
transcriptional activity of NF-κB, a downstream transcriptional factor regulating the
TNF-α-induced gene expression, through directing the proteolytic processing of p65
subunits in NF-κB complex (Ramsey et al., 2008).
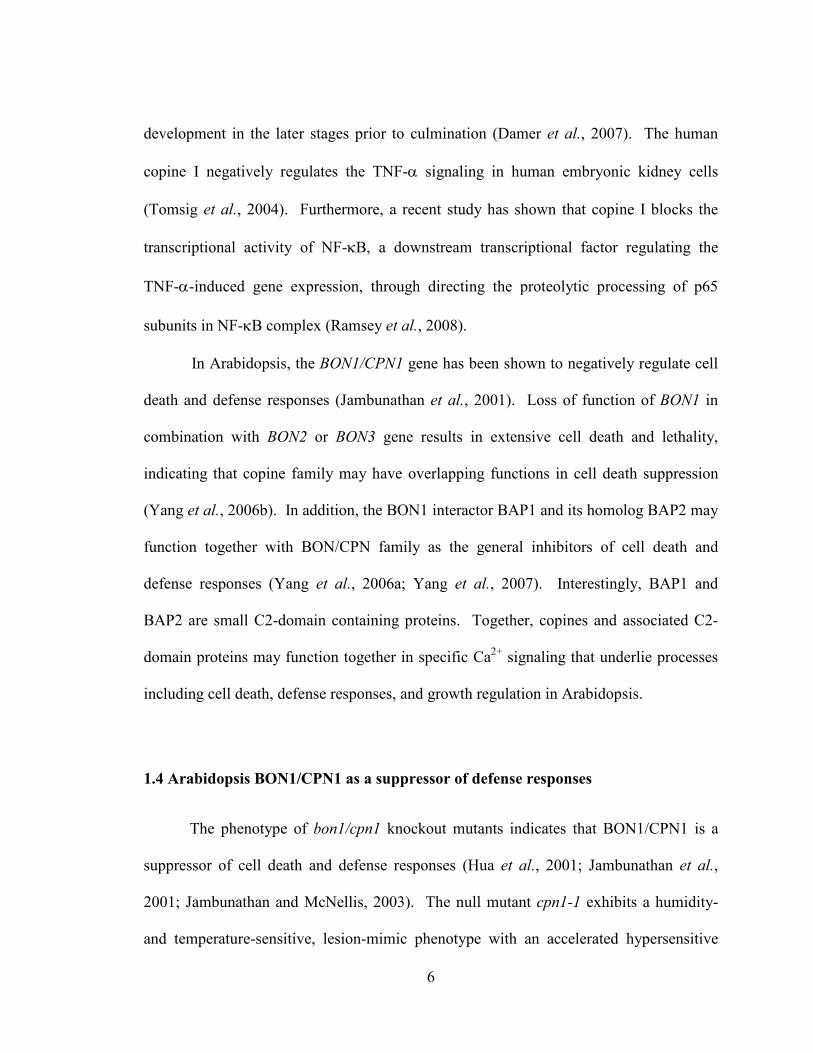
In Arabidopsis, the BON1/CPN1 gene has been shown to negatively regulate cell
death and defense responses (Jambunathan et al., 2001). Loss of function of BON1 in
combination with BON2 or BON3 gene results in extensive cell death and lethality,
indicating that copine family may have overlapping functions in cell death suppression
(Yang et al., 2006b). In addition, the BON1 interactor BAP1 and its homolog BAP2 may
function together with BON/CPN family as the general inhibitors of cell death and
defense responses (Yang et al., 2006a; Yang et al., 2007). Interestingly, BAP1 and
BAP2 are small C2-domain containing proteins. Together, copines and associated C2-
domain proteins may function together in specific Ca2+ signaling that underlie processes
including cell death, defense responses, and growth regulation in Arabidopsis.
1.4 Arabidopsis BON1/CPN1 as a suppressor of defense responses
The phenotype of bon1/cpn1 knockout mutants indicates that BON1/CPN1 is a
suppressor of cell death and defense responses (Hua et al., 2001; Jambunathan et al.,
2001; Jambunathan and McNellis, 2003). The null mutant cpn1-1 exhibits a humidity-
and temperature-sensitive, lesion-mimic phenotype with an accelerated hypersensitive
7
response (HR), constitutive expression of PR genes and increased resistance to a bacterial
and an oomycete pathogen under nonpermissive growth conditions with low humidity
(LH, 35% RH) and low temperature (LT, 21°C) (Jambunathan et al., 2001). These
mutant phenotypes suggest that the BON1/CPN1 protein negatively regulates the plant
defense responses.
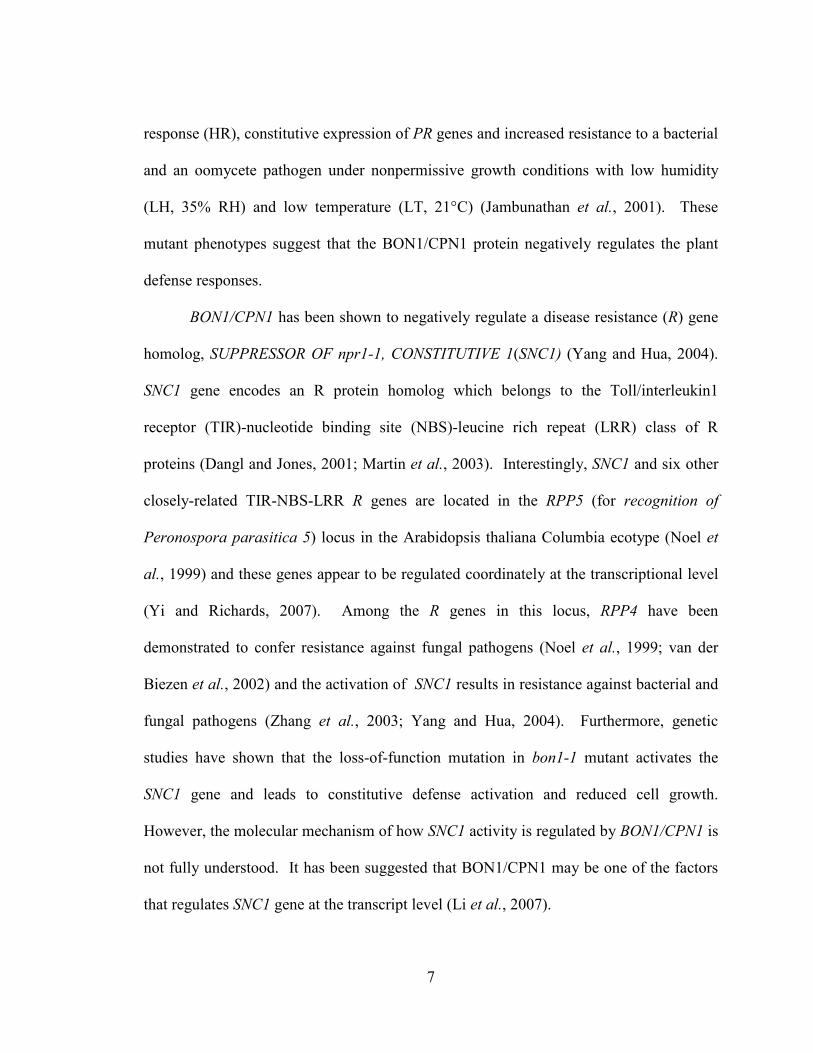
BON1/CPN1 has been shown to negatively regulate a disease resistance (R) gene
homolog, SUPPRESSOR OF npr1-1, CONSTITUTIVE 1(SNC1) (Yang and Hua, 2004).
SNC1 gene encodes an R protein homolog which belongs to the Toll/interleukin1
receptor (TIR)-nucleotide binding site (NBS)-leucine rich repeat (LRR) class of R
proteins (Dangl and Jones, 2001; Martin et al., 2003). Interestingly, SNC1 and six other
closely-related TIR-NBS-LRR R genes are located in the RPP5 (for recognition of
Peronospora parasitica 5) locus in the Arabidopsis thaliana Columbia ecotype (Noel et
al., 1999) and these genes appear to be regulated coordinately at the transcriptional level
(Yi and Richards, 2007). Among the R genes in this locus, RPP4 have been
demonstrated to confer resistance against fungal pathogens (Noel et al., 1999; van der
Biezen et al., 2002) and the activation of SNC1 results in resistance against bacterial and
fungal pathogens (Zhang et al., 2003; Yang and Hua, 2004). Furthermore, genetic
studies have shown that the loss-of-function mutation in bon1-1 mutant activates the
SNC1 gene and leads to constitutive defense activation and reduced cell growth.
However, the molecular mechanism of how SNC1 activity is regulated by BON1/CPN1 is
not fully understood. It has been suggested that BON1/CPN1 may be one of the factors
that regulates SNC1 gene at the transcript level (Li et al., 2007).
8
When the cpn1-1 mutant is grown under permissive conditions with high humidity
(HH, 75% RH) and high temperature (HT, 25°C), the lesion-mimic and enhanced disease
resistance phenotype is abolished and constitutive PR gene expression is suppressed
(Jambunathan et al., 2001; Jambunathan and McNellis, 2003). These results
demonstrated that the cpn1-1 mutant phenotype is sensitive to temperature and humidity.
Interestingly, BON1/CPN1 gene expression is up-regulated in response to non-
permissive, LH or LT growth conditions in wild-type Col-0 plants (Jambunathan and
McNellis, 2003). In addition, BON1/CPN1 expression is up-regulated by pathogen
inoculation in wild-type Col-0 plants. The accumulation of BON1/CPN1 transcript is
induced rapidly and transiently in Col-0 leaves inoculated with an avirulent strain of
Pseudomonas syringae pv. tomato (P. s. t.) carrying the avrRpt2 gene, which is
recognized by the cognate RESISTANCE TO PSEUDOMONAS SYRINGAE2 (RPS2)
gene in Col-0 plants (Jambunathan and McNellis, 2003). This result indicates that the
BON1/CPN1 transcript is up-regulated specifically by gene-for-gene recognition events
in the presence of corresponding R and Avr proteins (Jambunathan and McNellis, 2003)
1.5 Objectives of my thesis research
Based on the conditional phenotype of the cpn1-1 mutant, we speculated that the
activation of PR gene expression in response to low temperature and humidity in cpn1-1
mutant plants may reflect an inappropriate response to fluxes in intracellular Ca2+
concentration in the absence of BON1/CPN1. To test this hypothesis, we examined the
effect of the calcium ionophore A23187 on HH/HT-grown Col-0 and cpn1-1 plants.
9
Next, an anti-BON1/CPN1 antibody was generated to detect the BON1/CPN1 protein
level in wild-type Col-0 plants after bacterial challenge. To investigate how BON1/CPN1
gene expression is regulated, β-glucuronidase (GUS) reporter gene (Jefferson, 1989) was
used to study the spatial expression of BON1/CPN1 and its promoter activity in response
to calcium and pathogen stimuli. Finally, we characterized two BON1/CPN1 T-DNA
insertion mutants which over-accumulate the BON1/CPN1 protein. Our results help to
elucidate the involvement of Ca2+ in BON1/CPN1 function and the regulation of
BON1/CPN1 expression in response to abiotic and biotic stresses.
10
Chapter 2
The role of BON1/CPN1 in calcium signaling specificity
2.1 Summary
We investigated whether perturbations of intracellular Ca2+ levels could play a
role in the development of the cpn1-1 conditional phenotype. Calcium ionophore and
cold treatments triggered strong PR gene expression in cpn1-1 mutant plants under the
permissive growth conditions, whereas Ca2+ chelator EGTA attenuated the calcium
ionophore-induced PR1 expression. Our results indicate that perturbation of intracellular
calcium level activates defense responses in the absence of BON1/CPN1. This suggests
that BON1/CPN1 is required for normal responses to calcium fluxes.
2.2 Background information
One intriguing characteristic of the bon1/cpn1 loss-of-function mutants is the
conditional mutant phenotype. The cpn1-1 mutant shows an aberrant, stunted
morphology with spontaneous cell death and constitutive defense activation under non-
permissive, low humidity and low temperature (LH/LT) growth conditions. When the
cpn1-1 mutant is grown under permissive, high humidity and high temperature (HH/HT)
conditions, the lesion-mimic and enhanced disease resistance phenotypes were abolished
and constitutive PR gene expression was suppressed (Jambunathan et al., 2001;
11
Jambunathan and McNellis, 2003). When considering copines as potential Ca2+ sensors,
we speculated that the cpn1-1 mutant phenotype including cell death activation and
constitutive PR gene expression is due to inappropriate response to calcium fluxes
triggered by low humidity and low temperature in the absence of BON1/CPN1. In this
study, we take advantage of the conditional phenotype of cpn1-1 mutant plants, which
behave like the wild-type Col-0 plants under permissive HH/HT conditions. The effect
of the calcium ionophore A23187 on HH/HT-grown Col-0 and cpn1-1 plants was
investigated by monitoring PR gene expression, which served as a marker for activated
defense responses. A23187 is commonly used to produce a cytosolic Ca2+ perturbation
by allowing extracellular calcium ions released from the cell wall to enter freely into the
cytosol and elevate the cytosolic Ca2+ level (Williams et al., 1990). In addition, several
studies have utilized A23187 to elevate the cytosolic Ca2+ level which in turn induces the
expression of Ca2+-dependent genes or physiological responses to ABA and chilling
temperature (Monroy and Dhindsa, 1995; Sheen, 1996; Sangwan et al., 2001). Our
results indicate that perturbations of intracellular Ca2+ level lead to defense activation in
the absence of BON1/CPN1.
2.3 Materials and methods
2.3.1 Plant materials and growth conditions
All plants were grown in soil-less medium (Redi-Earth Plug and Seedling Mix,
Sun Gro Horticulture) and irrigated with distilled water. For the permissive HH/HT
12
conditions, the Arabidopsis thaliana ecotype Columbia (Col-0) plants and cpn1-1 mutant
plants were grown at 25°C and 75% RH under an 8 h photoperiod with 100 µmol m-2 s
-1
light intensity. 5-week-old plants were used for all experiments.
2.3.2 Chemicals and cold stimuli treatments
For leaf infiltration, the underside of an Arabidopsis leaf was first scratched with
a razor blade, and then infiltrated with chemical solutions using a needle-less syringe
pushed against the leaf surface until the intracellular space of the whole leaf was filled
with the solution. For cell death observations and PR gene expression analysis, 50 µM or
100 µM of calcium ionophore A23187 (Sigma, St. Louis, MO, USA) were used along
with 0.25% or 0.5% DMSO (dimethyl sulfoxide; Sigma) as solvent controls, respectively.
Sterilized water was used as an infiltration control. 10 mM EGTA (Ethylene glycol-
bis(2-aminoethylether)-N,N,N',N'-tetraacetic acid; Sigma) was used alone or in
combinations with 50µM A23187. Cold treatments were administered by placing potted
plants at 4°C for 1 h and then returning them to the original growth chamber for periods
of time as described in Results. Untreated control plants were also included for chemical
and cold stimulus experiments. For cell death observations, results from four replicate
experiments were analyzed by Student’s t-test. For PR gene expression analysis, control
or chemical- or cold-treated leaves were collected at the indicated time points, flash-
frozen in liquid nitrogen, and stored at -80°C prior to RNA isolation.
13
2.3.3 RNA preparation and northern analysis
150mg of frozen Arabidopsis leaf tissues were grounded by pestle and mortar,
and the total RNA was isolated using the RNeasy plant mini kit (Qiagen, Valencia, Ca,
USA). For northern analysis, 5µg of total RNA was separated on 1% agarose gel,
transferred onto a Hybond-N nitrocellulose membrane (GE Healthcare), and probed with
PR1 or PR2 probes using the NorthernMax kit (GE Healthcare). PR1 and PR2 probe
fragments were prepared as described (Liu, 2007) and labeled using the Rediprime II kit
(GE Healthcare).
2.4 Results
2.4.1 Calcium ionophore triggered cell death in cpn1-1 mutant plants
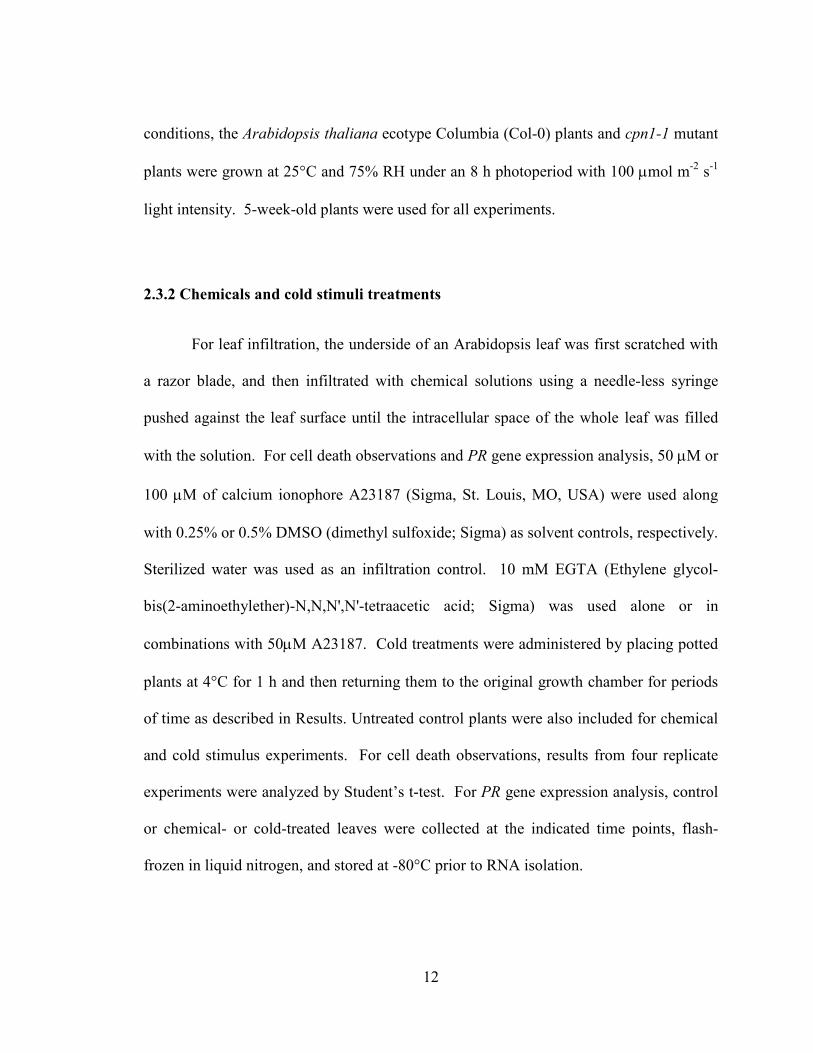
The calcium ionophore A23187 was a potent trigger of cell death in cpn1-1
mutants; in contrast, A23187 triggered a weak cell death response in wild-type plants
(Figure 1 A, upper panel). Leaves of HH/HT-grown cpn1-1 plants usually showed a
visible cell death response with partially or totally collapsed tissues within 24h post
infiltration (hpi) with 50µM A23187 (Figure 1 A, lower panel). The same treatment
usually produced no cell death or only slight collapse in HH/HT-grown Col-0 plants
(Figure 1 A, upper panel). Tissue collapse in A23187-treated cpn1-1 leaves was initially
observed starting at 16 hpi and gradually progressed until around 24 hpi. Water and
0.25% DMSO did not trigger cell death in Col-0 or cpn1-1 plants (Figure 1 A). Both
HH/HT Col-0 and cpn1-1 plants seemed to be more sensitive to environmental stimuli
14
than LH/LT-grown plants, which may contribute to the batch-to-batch variation in
replicate experiments. In general, 50µM A23187 triggered much stronger cell death
response in cpn1-1 plants than in Col-0 plants under the permissive growth conditions.
Around 70% of A23187-treated cpn1-1 leaves displayed visible collapse, while fewer
than 20% of A23187-treated Col-0 leaves showed visible collapse (Figure 1 B). A23187-
induced collapse in wild-type plants, when it occurred, was less extensive than that
observed in cpn1-1 plants (Figure 1 and data not shown).
15
A B
Figure 1: The calcium ionophore A23187 triggered cell death in HH/HT-grown cpn1-1 mutant
plants. A, A wild-type plant grown under permissive conditions and infiltrated in one leaf with
water (infiltration control), a second leaf with 0.25% DMSO (solvent control), and a third leaf
with 50µM A23187 in 0.25% DMSO as indicated by the arrows (upper panel). A cpn1-1 mutant
plant with the same treatments is shown (lower panel). Photographs were taken at 26 hpi. B,
Bar graph comparing percentages of cpn1-1 (black bars) and wild-type (open bars) plant leaves
that showed visible cell death in response to A23187 infiltration. Percentage is the number of
the leaves that showed any visible collapse out of the total number of treated leaves. The results
represent the pooled average of four independent experiments.
16
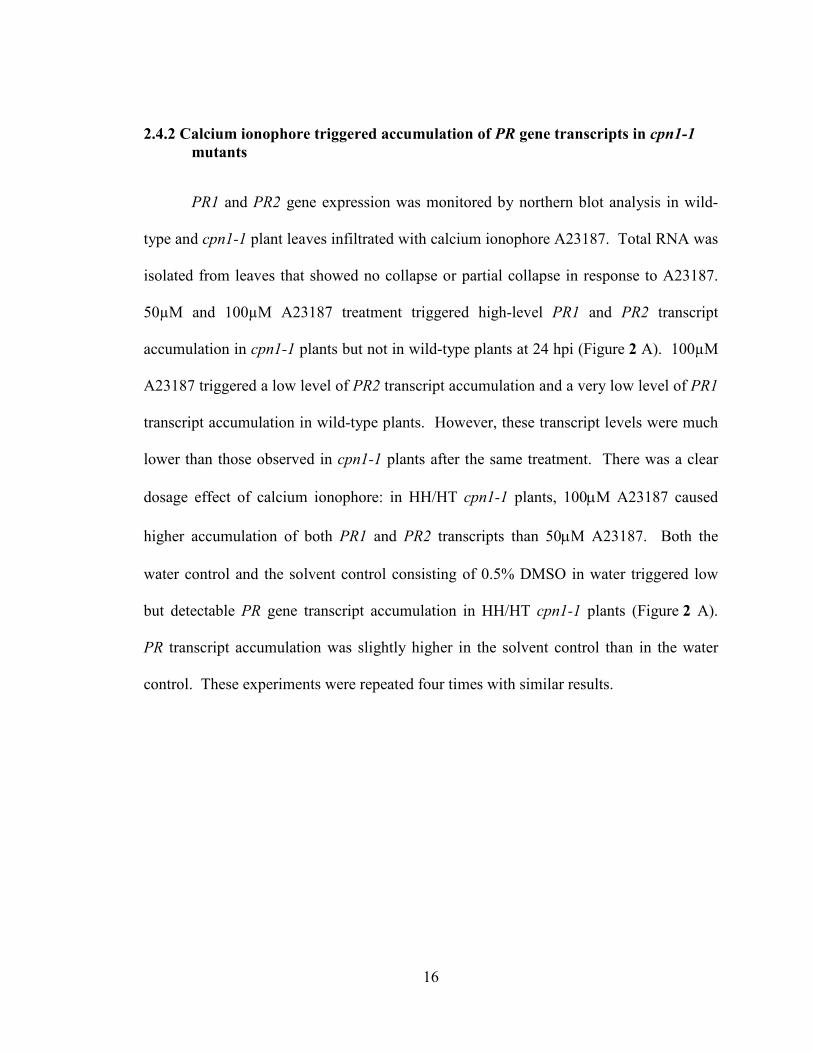
2.4.2 Calcium ionophore triggered accumulation of PR gene transcripts in cpn1-1
mutants
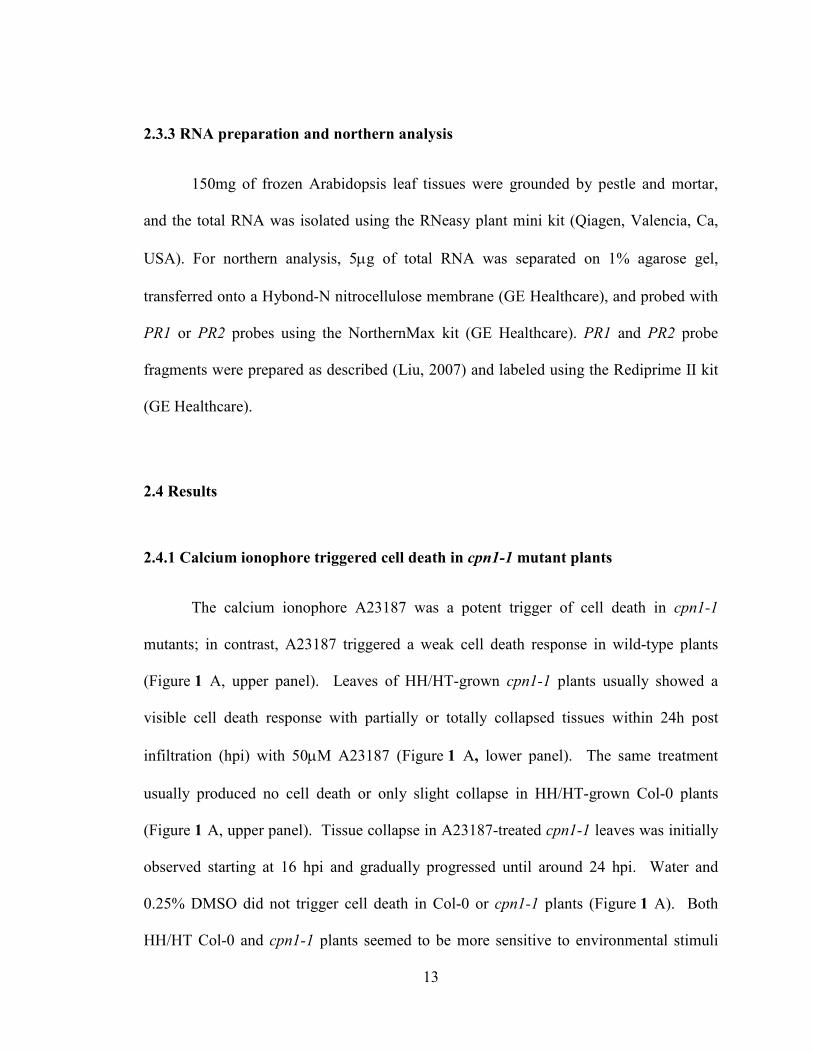
PR1 and PR2 gene expression was monitored by northern blot analysis in wild-
type and cpn1-1 plant leaves infiltrated with calcium ionophore A23187. Total RNA was
isolated from leaves that showed no collapse or partial collapse in response to A23187.
50µM and 100µM A23187 treatment triggered high-level PR1 and PR2 transcript
accumulation in cpn1-1 plants but not in wild-type plants at 24 hpi (Figure 2 A). 100µM
A23187 triggered a low level of PR2 transcript accumulation and a very low level of PR1
transcript accumulation in wild-type plants. However, these transcript levels were much
lower than those observed in cpn1-1 plants after the same treatment. There was a clear
dosage effect of calcium ionophore: in HH/HT cpn1-1 plants, 100µM A23187 caused
higher accumulation of both PR1 and PR2 transcripts than 50µM A23187. Both the
water control and the solvent control consisting of 0.5% DMSO in water triggered low
but detectable PR gene transcript accumulation in HH/HT cpn1-1 plants (Figure 2 A).
PR transcript accumulation was slightly higher in the solvent control than in the water
control. These experiments were repeated four times with similar results.
17
Figure 2: A23187 induced PR gene expression in HH/HT-grown cpn1-1 mutant plants.
Northern blots showing the effect of calcium ionophore A23187 and calcium chelator EGTA on
PR gene transcript accumulation in Col-0 wild-type (WT) and cpn1-1 mutant (M) plants grown
under permissive conditions. A, Effect of A23187 on PR1 and PR2 gene transcript
accumulation. Treatments: water (W, infiltration control), 0.5% DMSO (D), 50 µM A23187 in
0.25% DMSO (50A), or 100µM A23187 in 0.5% DMSO (100A). B, Suppression of calcium
ionophore-induced PR1 gene expression by EGTA. Treatments: water (W, infiltration control),
0.25% DMSO (D, solvent control), 50 µM A23187 in 0.25% DMSO (50A), 10 mM EGTA
(10G), and 10 mM EGTA mixed with 50 µM A23187 (10G+50A). Time, time after treatment in
hours; Un, untreated plant; rRNA, ribosomal RNA stained with methylene blue to show the
relative amount of RNA in each lane. Five µg of total RNA were loaded in each lane.
18
2.4.3 Ca2+ chelator EGTA suppressed A23187-induced PR1 gene expression in cpn1-
1 plants
To determine whether calcium ionophore-induced responses were due to the
influx of extracellular Ca2+, we tested whether chelation of extracellular Ca
2+ could
attenuate the effect of A23187. The Ca2+ chelator EGTA was co-infiltrated with A23187
into leaves of Col-0 and cpn1-1 plants growing under permissive conditions, and the
effect on PR1 transcript accumulation was determined by northern blot. 10mM EGTA
strongly suppressed PR1 transcript accumulation when it was co-infiltrated with 50µM
A23187 (Figure 2 B, compare lanes 50A to 10G+50A in HH/HT cpn1-1). In this
experiment, 50µM A23187 triggered some PR1 transcript accumulation in wild-type
plants; however, the accumulation level was much lower than that observed in cpn1-1
plants receiving the same treatment (Figure 2 B). This result illustrates some of the
variability of our experimental system: A23187 sometimes induced PR gene expression
in wild-type plants as well as in cpn1-1 plants; however, in all cases, A23187-induced PR
gene expression was much higher in cpn1-1 plants than in wild-type plants. Also, 10mM
EGTA largely suppressed A23187-induced PR1 transcript accumulation in wild-type
plants, similar to the pattern observed in cpn1-1 plants. The solvent control (DMSO)
triggered slight PR1 gene transcript accumulation in cpn1-1 plants growing under
permissive conditions (Figure 2, A and B).
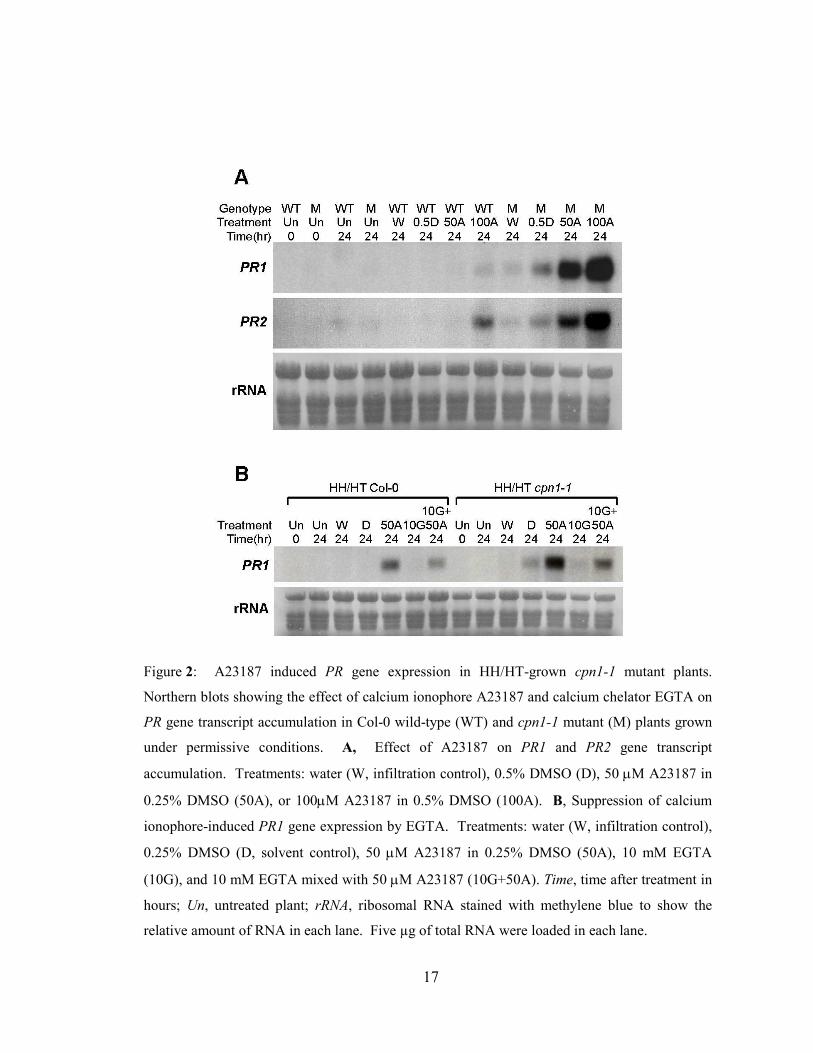
2.4.4 Cold-induced PR gene expression in cpn1-1 plants
19
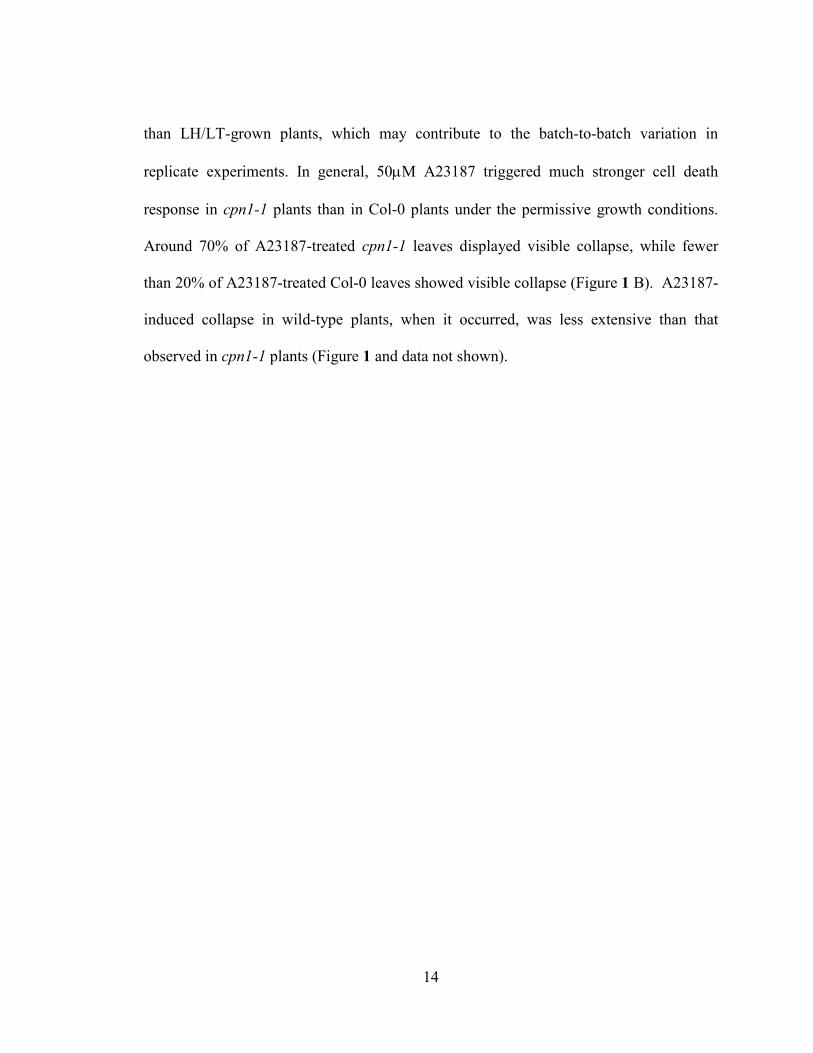
Because the cpn1-1 mutant phenotypes are temperature-sensitive, we decided to
test whether transient cold treatment of HH/HT-grown cpn1-1 plants would also trigger
PR gene transcript accumulation. Wild-type and cpn1-1 plants growing under
permissive, HH/HT conditions were cold-treated at 4ºC for 1 h. PR gene expression was
monitored by northern blots either immediately after the 1h cold treatment period or after
the plants had been returned to 25°C for 23h (Figure 3). No visible cell death response
was observed in any Col-0 or cpn1-1 plants at any point in this experiment. However,
cold treatment specifically triggered the accumulation of PR1 and PR2 gene transcripts in
Figure 3: 1h cold treatment induced PR gene expression in HH/HT cpn1-1 mutant plants. Wild-
type Col-0 and cpn1-1 mutant plants grown under permissive conditions were subjected to 4ºC
for 1h and then returned to their original growth chamber at 25ºC for either 0 or 23 hours. PR
gene transcript levels were monitored by northern analyses. Transcript levels in untreated plants
were monitored at 0h and 24h. Dashed line indicates where two sections of the same RNA blot
were joined together with unnecessary middle lanes removed. rRNA, ribosomal RNA stained
with methylene blue to show the relative amount of RNA in each lane.
20
cpn1-1 plants at 23h after the end of the cold treatment period. No cold-induced PR
transcript accumulation was observed in wild-type plants. In addition, no PR transcript
accumulation was observed in cpn1-1 plants immediately after the end of the 1h cold
treatment.
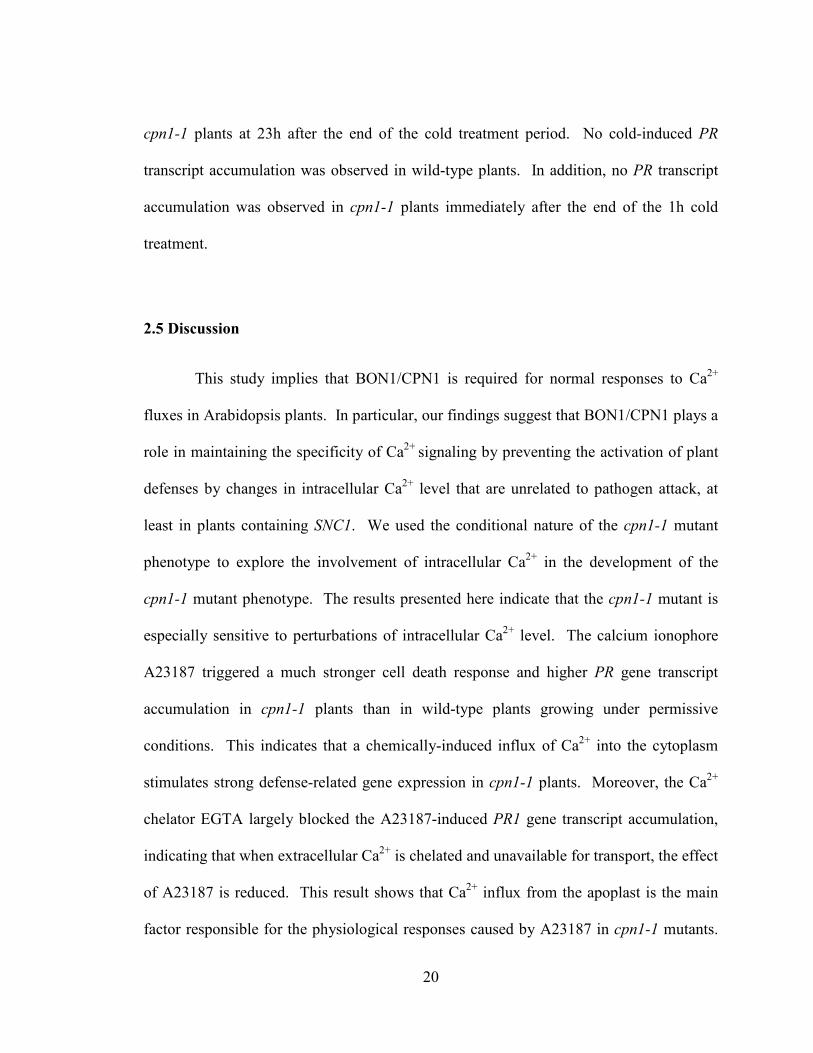
2.5 Discussion
This study implies that BON1/CPN1 is required for normal responses to Ca2+
fluxes in Arabidopsis plants. In particular, our findings suggest that BON1/CPN1 plays a
role in maintaining the specificity of Ca2+
signaling by preventing the activation of plant
defenses by changes in intracellular Ca2+ level that are unrelated to pathogen attack, at
least in plants containing SNC1. We used the conditional nature of the cpn1-1 mutant
phenotype to explore the involvement of intracellular Ca2+ in the development of the
cpn1-1 mutant phenotype. The results presented here indicate that the cpn1-1 mutant is
especially sensitive to perturbations of intracellular Ca2+ level. The calcium ionophore
A23187 triggered a much stronger cell death response and higher PR gene transcript
accumulation in cpn1-1 plants than in wild-type plants growing under permissive
conditions. This indicates that a chemically-induced influx of Ca2+ into the cytoplasm
stimulates strong defense-related gene expression in cpn1-1 plants. Moreover, the Ca2+
chelator EGTA largely blocked the A23187-induced PR1 gene transcript accumulation,
indicating that when extracellular Ca2+ is chelated and unavailable for transport, the effect
of A23187 is reduced. This result shows that Ca2+ influx from the apoplast is the main
factor responsible for the physiological responses caused by A23187 in cpn1-1 mutants.
21
In addition, cold stimulus also triggered the PR gene induction specifically in cpn1-1
mutant plants. Cold treatments cause a transient rise in cytosolic Ca2+ level and changes
of membrane fluidity (Plieth et al., 1999; Orvar et al., 2000). Collectively, our data
showed that perturbation of the cytosolic Ca2+ level, either by cold or A23187, was able
to elicit defense responses in the cpn1-1 mutant.
It appears that BON1/CPN1 is required for normal responses to Ca2+ fluxes in
Arabidopsis plants. In particular, it appears that certain environmental stimuli, such as
LT or LH, may trigger intracellular Ca2+ perturbations that have the potential to activate
cell death and defense responses. Our findings suggest that BON1/CPN1 plays a role in
maintaining the specificity of Ca2+
signaling and preventing the activation of plant
defenses by changes in intracellular Ca2+ level that are unrelated to pathogen attack. Our
results suggest that the cpn1-1 mutant phenotype observed under the non-permissive
growth conditions results from inappropriate defense activation in responses to Ca2+
fluxes triggered by lower temperature and humidity.
It is interesting that DMSO treatment alone triggered slight PR gene transcript
accumulation in cpn1-1 plants but not in wild-type plants. DMSO is commonly used as a
membrane rigidifier that mimics the effects of cold on biological membranes (Orvar et
al., 2000; Sangwan et al., 2001). This result suggests that BON1/CPN1 is also required
for normal responses to changes in membrane fluidity, and that changes in membrane
fluidity may be able to trigger defense responses in the cpn1-1 mutant.
It is notable that 50µM A23187 triggered tissue collapse in wild-type plants
(Figure 1 A), although this response was much weaker than that observed in cpn1-1
mutant plants. The observation is not unexpected, since Ca2+ influx mediated by high
22
concentration of A23187 (15mM) caused cell death in soybean suspension cells (Levine
et al., 1996). Similarly, cytosolic Ca2+ overload can cause cytotoxicity and trigger cell
death in animals (Orrenius et al., 2003). The A23187 concentration we applied was
probably high enough to allow excessive amounts of apoplastic Ca2+ to enter the cytosol,
and therefore caused cell death due to cytosolic Ca2+ overload even in wild-type plants.
Both A23187 and cold induced PR gene expression in cpn1-1 plants, while cell
death was triggered only by A23187. The difference may be related to the degree and
type of Ca2+ perturbation elicited by the two treatments. A brief cold shock induces an
immediate and transient rise in cytosolic Ca2+ level (Knight et al., 1991; Plieth et al.,
1999). Intracellular Ca2+ levels return to baseline level when the temperature reaches a
steady value (Plieth et al., 1999). In contrast A23187 may cause a more sustained
increase in intracellular Ca2+ levels, thus creating a more extensive response.
The findings presented here explain the conditional nature of the cpn1-1 mutant
phenotypes. They are also consistent with the proposed function of copines as Ca2+-
sensitive membrane trafficking proteins and Ca2+-responsive signal transduction proteins.
Finally, the accelerated HR observed in cpn1-1 (Jambunathan et al., 2001) may also be
due to a greater sensitivity to pathogen-induced increases in intracellular Ca2+. Further
work will be required to elucidate the function of BON1/CPN1 in regulating responses to
cytosolic Ca2+ fluctuation.
23
Chapter 3
Generation of anti-BON1/CPN1 antisera and troubleshooting for artifact signals in
western blot analysis
3.1 Summary
Two polyclonal antisera were generated to detect BON1/CPN1 protein in
Arabidopsis. When these antisera were used in western blot analysis, we encountered
problems with artifact bands associated with the β-mercaptoethanol in the protein gel
loading buffer. Here, we demonstrated that lowering the concentration of reducing agent
in the loading buffer, either β-mercaptoethanol or dithiothreitol (DTT), eliminated the
artifact signals and allowed the specific detection of BON1/CPN1 band in plants extracts.
The possible cause of the artifact bands by keratin contamination of protein samples is
discussed.
3.2 Background information
Western blotting involves sodium dodecyl sulfate–polyacrylamide gel electrophoresis
(SDS-PAGE) of proteins (Laemmli, 1970) followed by electrophoretic transfer of the
protein to a solid membrane and detection with antisera (Renart et al., 1979; Towbin et
al., 1979; Burnette, 1981). Western blot analysis is one of the most common
immunoassays for antigen detection, and this technique requires an antibody that can
24
specifically recognize the antigen of interest (Kurien and Scofield, 2003). However, with
the increasing sensitivity of protein detection methods, problems with artifact bands
involved in SDS-PAGE analysis and immunoblotting have been reported (Ochs, 1983;
Tasheva and Dessev, 1983; Shapiro, 1987; Riches et al., 1988; Berube et al., 1994). The
presence of artifact bands between 50-68 kDa is frequently found and correlated with the
use of β-mercaptoethanol as reducing agent in sample preparation. Evidence suggests
that these artifact bands originate from the contamination of human skin protein keratin
in protein samples or SDS-PAGE electrophoresis process, which presents a common
problem for immunoblotting when polyclonal antibodies are used (Ochs, 1983; Berube et
al., 1994).
The Arabidopsis BONZAI1/COPINE1 (BON1/CPN1) protein is a suppressor of
plant cell death and defense responses (Hua et al., 2001; Jambunathan et al., 2001; Yang
et al., 2006b). It belongs to the ubiquitous, highly conserved copine protein family,
whose members appear to be involved in membrane trafficking and protein interactions
(Tomsig and Creutz, 2002). BON1/CPN1 contains two C2 domains at the N-terminus
with calcium-dependent, phospholipid-binding activity, and a von Willebrand A (VWA)
domain at the C-terminus that mediates protein-protein interactions. We set out to
produce polyclonal anti-BON1/CPN1 antibodies in order to monitor the protein presence
and amount in plant tissues during plant disease resistance responses. In this chapter, we
described a problem with artifact bands between 50-75kDa which we encountered in
western analysis using the anti-BON1/CPN1 antisera. Furthermore, we demonstrate that
lower concentrations of reducing agent in the SDS-PAGE loading buffer eliminated the
25
artifact bands possibly caused by keratin contamination, and allowed the specific
detection of BON1/CPN1 protein bands in plant extracts.
3.3 Materials and methods
3.3.1 Plant materials and growth conditions
All plants were grown in soil-less medium (Reid-Earth Plug and Seedling Mix,
Sun Grow Horticulture) and irrigated with distilled water. Wild-type plants were of the
Arabidopsis thaliana ecotype Columbia-0 (Col-0). cpn1-1 mutant plants are BON1/CPN1
null mutants (Jambunathan et al., 2001). cpn1-2 and cpn1-3 are two mutants
(SAIL_865_A09 and SAIL_723_E11, respectively) with T-DNA inserted in the
BON1/CPN1 promoter region from the SAIL T-DNA insertion line collection
(http://www.tmri.org/en/partnership/sail_collection.aspx) (Sessions et al., 2002).
YFP::BON1/CPN1 plants are transgenic lines expressing yellow fluorescence protein
(YFP) fused to the N-terminus of BON1/CPN1 (Liu, 2007). BON1/CPN1::myc plants
are transgenic lines expressing BON1/CPN1 protein with a C-terminal c-myc epitope tag
(Liu, 2007). All plants were grown at 21°C and 35% RH under a 10 h photoperiod with
75 µmol m-2 s-1 light intensity. 5-week-old plants were used for all experiments.
26
3.3.2 Bacterial expression of BON1/CPN1 VWA domain and antibody production
The VWA domain of the Arabidopsis BON1/CPN1 protein (VWABON1/CPN1
) was
expressed in E. coli and purified using the glutathione-S-transferase (GST) expression
system (GE Healthcare, Piscataway, NJ, USA). Sequences encoding the VWA domain
(amino acids 291-578) of BON1/CPN1 were amplified with the following PCR primers:
5´-GAATTCCTTCATTTGGCGGGCCAAGGA-3´ (Forward) and 5´-
CTCGAGTCATGGAGGAATCGGTTTCAT-3´ (Reverse); introduced EcoRI and XhoI
restriction sites are shown in italics. The PCR product was subcloned into the pGEX-6P-
1 vector cut with EcoRI and XhoI so that the VWABON1/CPN1
domain was translationally
fused with the C-terminus of GST. The GST- VWABON1/CPN1
fusion construct was
introduced into protease-deficient E. coli stain BL21 (DE3) pLys (EMD Chemical, Inc.,
Gibbstown, NJ, USA). Purification steps for the bacterial-expressed VWABON1/CPN1
domain were modified from Tomsig and Creutz, 2000. A bacterial culture was seeded
from an overnight culture, grown for 1 h at 37ºC, and then induced with 50 µM IPTG
(Sigma) for 3 h at 30ºC. The cells were then lysed by sonication in ice-cold 1×PBS
containing 10 mg/ml lysozyme (Sigma) and centrifuged at 9,600×g for 10 min. The
pellet was resuspended in 1×PBS buffer containing 5 mM EGTA, 5 mM DTT, 10 mg/ml
PMSF (phenylmethanesulphonylfluoride, Sigma), and 1×protease inhibitor cocktail
(Sigma, catalog #P2714). Proteins in the extract were solubilized with sarkosyl (Sigma)
prepared in 1×PBS to a final concentration of 0.5%. After the mixture was centrifuged at
9,600×g for 15 min, the supernatant was saved, mixed with Triton X-100 (Sigma)
prepared in 1×PBS to a final concentration of 1%, and incubated with glutathione
27
Sepharose 4B beads (GE Healthcare) with gentle shaking at room temperature for 1.5 h.
The beads were then washed with ice-cold 1×PBS 6 times followed by 6 washes in
PreScission Cleavage buffer (50 mM Tris-HCl, 150 mM NaCl, 1 mM EDTA, 1 mM
DTT). VWABON1/CPN1
was then cleaved from the GST moiety by resuspending the beads
in 1×bead volume of PreScission Cleavage buffer, adding 6 units of PreScission protease
(GE Healthcare) per 200µl of beads, and incubating at 4ºC overnight. Cleaved
VWABON1/CPN1
protein was released from beads in 2×SDS loading buffer (126 mM Tris-
HCl pH 6.8, 20% glycerol, 4%SDS, 0.005% bromophenol blue, 2% β-mercaptoethanol)
at 100ºC for 10 min and separated on 10% SDS-PAGE gels. Protein gels were stained
with GelCode Blue stain (Pierce, Rockford, IL, USA), and the 31 kDa VWABON1/CPN1
band was excised. The VWABON1/CPN1
protein fragment was electroeluted into 1×SDS
running buffer (25mM Tris, 192mM glycine, 0.1% SDS) using ElutaTube (Fermentas,
Burlington, Ontario, Canada) according to the manufacturer’s instructions. Eluted
proteins were concentrated using Amicon Ultra-4 centrifugal filter units (molecular
weight cut-off 30 kDa) (Millipore, Billerica, MA, USA). Purified VWABON1/CPN1
protein
was mixed with Titermax adjuvant, and used to immunize two rats following standard
procedures for polyclonal antibody production (Cocalico Biologicals, Inc., Reamstown,
PA, USA).
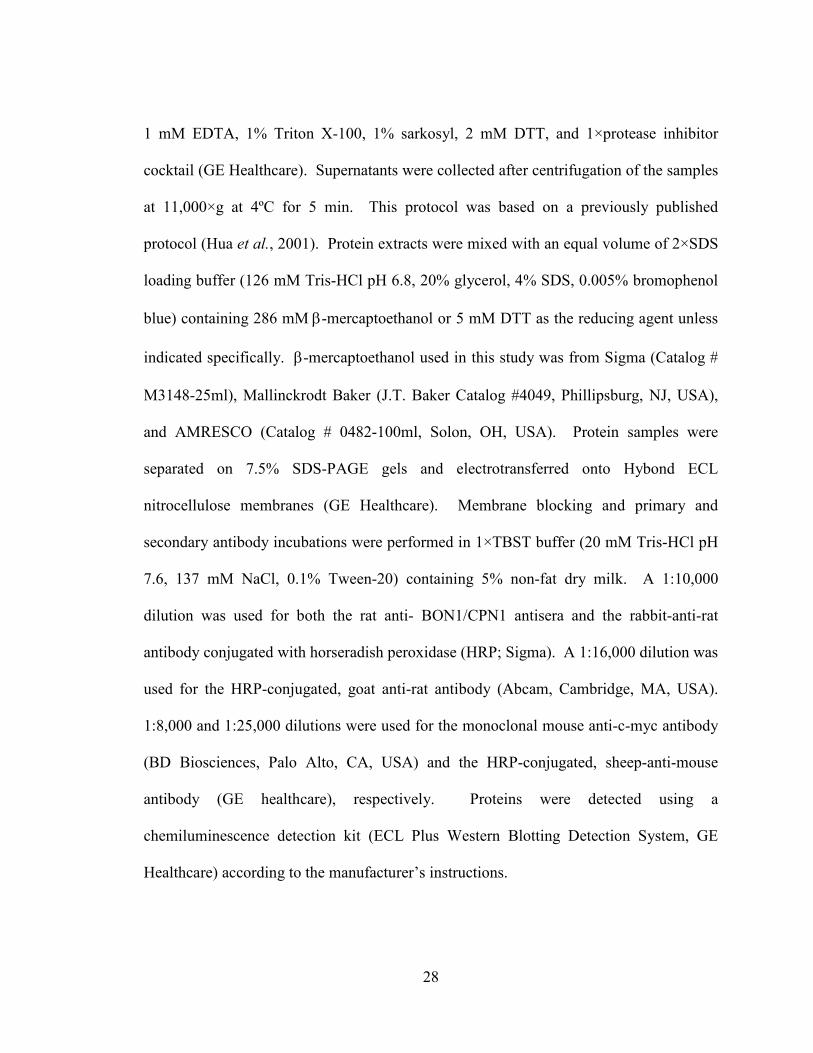
3.3.3 Protein extraction and western blot analysis
Arabidopsis total soluble proteins were isolated by re-suspending frozen,
pulverized tissue in extraction buffer containing 12% sucrose, 100 mM Tris-HCl pH 7.5,
28
1 mM EDTA, 1% Triton X-100, 1% sarkosyl, 2 mM DTT, and 1×protease inhibitor
cocktail (GE Healthcare). Supernatants were collected after centrifugation of the samples
at 11,000×g at 4ºC for 5 min. This protocol was based on a previously published
protocol (Hua et al., 2001). Protein extracts were mixed with an equal volume of 2×SDS
loading buffer (126 mM Tris-HCl pH 6.8, 20% glycerol, 4% SDS, 0.005% bromophenol
blue) containing 286 mM β-mercaptoethanol or 5 mM DTT as the reducing agent unless
indicated specifically. β-mercaptoethanol used in this study was from Sigma (Catalog #
M3148-25ml), Mallinckrodt Baker (J.T. Baker Catalog #4049, Phillipsburg, NJ, USA),
and AMRESCO (Catalog # 0482-100ml, Solon, OH, USA). Protein samples were
separated on 7.5% SDS-PAGE gels and electrotransferred onto Hybond ECL
nitrocellulose membranes (GE Healthcare). Membrane blocking and primary and
secondary antibody incubations were performed in 1×TBST buffer (20 mM Tris-HCl pH
7.6, 137 mM NaCl, 0.1% Tween-20) containing 5% non-fat dry milk. A 1:10,000
dilution was used for both the rat anti- BON1/CPN1 antisera and the rabbit-anti-rat
antibody conjugated with horseradish peroxidase (HRP; Sigma). A 1:16,000 dilution was
used for the HRP-conjugated, goat anti-rat antibody (Abcam, Cambridge, MA, USA).
1:8,000 and 1:25,000 dilutions were used for the monoclonal mouse anti-c-myc antibody
(BD Biosciences, Palo Alto, CA, USA) and the HRP-conjugated, sheep-anti-mouse
antibody (GE healthcare), respectively. Proteins were detected using a
chemiluminescence detection kit (ECL Plus Western Blotting Detection System, GE
Healthcare) according to the manufacturer’s instructions.
29
3.4 Results
3.4.1 GST-VWABON1/CPN1
protein purification and antigen preparation
The GST expression system was employed to express the VWA domain of
BON1/CPN1 protein in E. coli after a failed attempt using the His-tag expression system
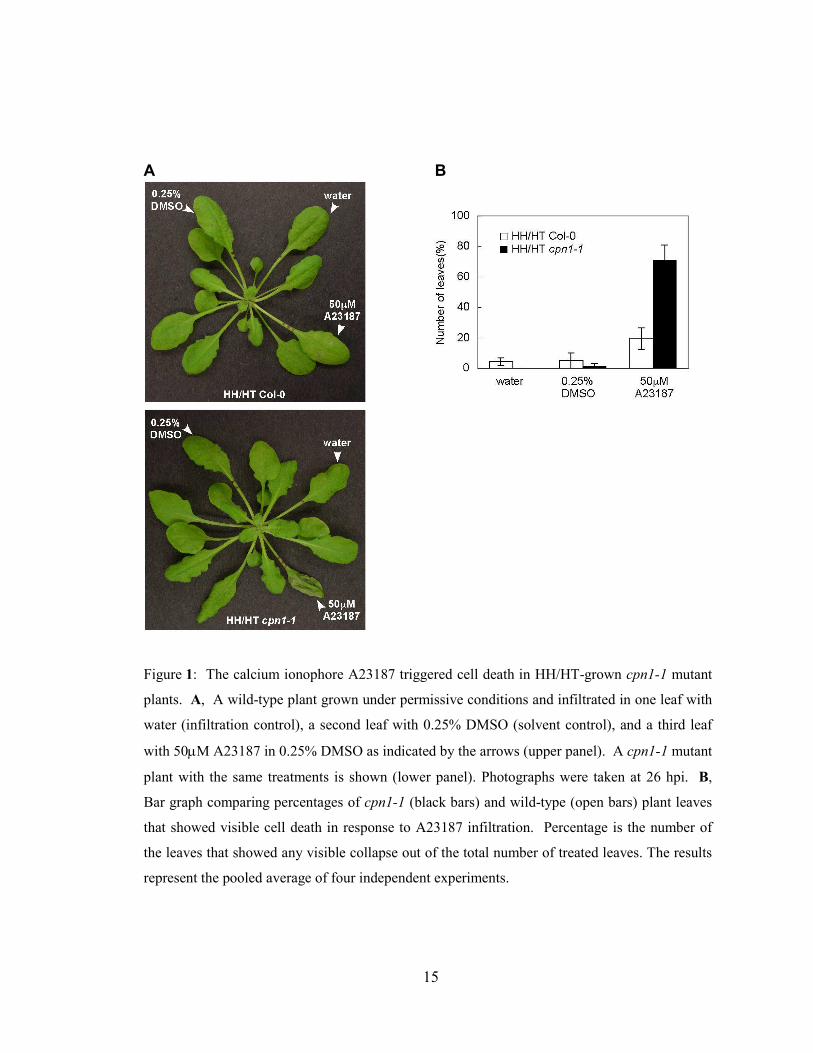
previously (data not shown). Under the inducing condition, we were able to express of
GST-VWABON1/CPN1
fusion protein in bacteria cultures (Figure 4, compare lane 2 and 3).
The GST protein alone was also induced by IPTG in bacteria containing the empty vector
pGEX-6P-1 (Figure 4, lane 1). Two induced protein bands had similar molecular weight
to the 57kDa expected size of GST-VWA BON1/CPN1
protein (Figure 4 , lane 3). The band
with smaller molecular weight may be a partial fusion protein due to proteolysis or
processing in E. coli. Therefore, the band with the bigger molecular weight was
considered as the complete GST-VWA BON1/CPN1
fusion protein and subjected to further
purification. The GST-VWA BON1/CPN1
protein was bound with the glutathione Sepharose
4B beads after incubation with soluble proteins from IPTG-induced bacterial lysate
(Figure 4, lane 5) but not from un-induced bacterial lysate (Figure 4, lane 4). However,
the association of GST-VWA BON1/CPN1
protein was so tight that the fusion protein could
not be eluted using the regular GST elution buffer according to the manufacturer’s
instructions (GE Healthcare). Therefore, we conducted on-matrix protease cleavage,
released the cleaved protein products from beads in 2×SDS loading buffer (Figure 4, lane
6-9), and separated the products on SDS-PAGE gels. Protein gels were stained with
GelCode Blue (Pierce, Rockford, IL, USA), and the 31 kDa VWA domain band was
excised, electroeluted into 1×SDS running buffer (25 mM Tris, 192 mM glycine, 0.1%
30
SDS) using ElutaTube (Fermentas, Burlington, Ontario, Canada), and concentrated using
Amicon Ultra-4 centrifugal filter units (molecular weight cut-off at 30 kDa) (Millipore,
Billerica, MA, USA),. Finally, the purified VWABON1/CPN1
protein band (Figure 5, lane
1) was used as antigen to immunize two rats for polyclonal antibody production
(Cocalico Biologicals, Inc., Reamstown, PA, USA).
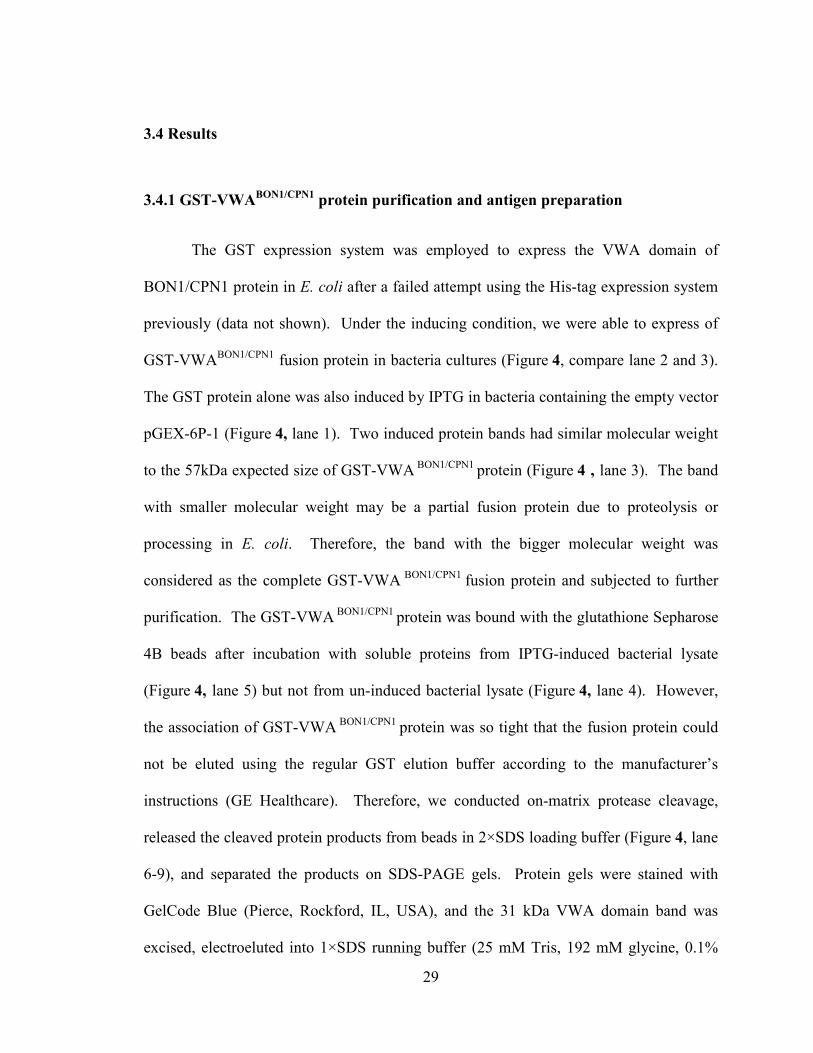
Figure 4: A coomassie-stained SDS-PAGE gel showing bacterial-expressed GST-VWA
BON1/CPN1 fusion protein and protease-cleaved products after electrophoresis. Protein molecular
weight marker sizes are shown in kDa. Arrows indicated the position of protein bands of GST-
VWABON1/CPN1
fusion protein (57kDa), PreScission protease (46kDa), VWABON1/CPN1
portion
(31kDa), and GST protein (26kDa). Protein samples of total bacterial lysate were from bacteria
containing the empty pGEX-6P-1 vector with IPTG induction (lane 1), and bacteria containing
the GST-VWABON1/CPN1
fusion construct without IPTG induction (lane 2) or with IPTG
induction (lane 3). The GST-VWABON1/CPN1
protein associated with the glutathione Sepharose
4B beads after incubation with soluble proteins from IPTG-induced bacterial lysate (lane 5) but
not from un-induced bacterial lysate (lane 4). After 4h or 24h of protease cleavage, only a
small portion of the cleaved VWABON1/CPN1
protein products could be eluted according to the
manufacturer’s instruction (lane 6 and 8, respectively). All bound proteins including the
cleaved VWABON1/CPN1
were released from the matrix in 2×SDS loading buffer (lane 7 and 9).
The 24h of protease cleavage resulted in more complete cleavage of VWABON1/CPN1
from GST
moiety comparing to the 4h cleavage (lane 7 and 9, compare intensity of GST-VWA band).
31
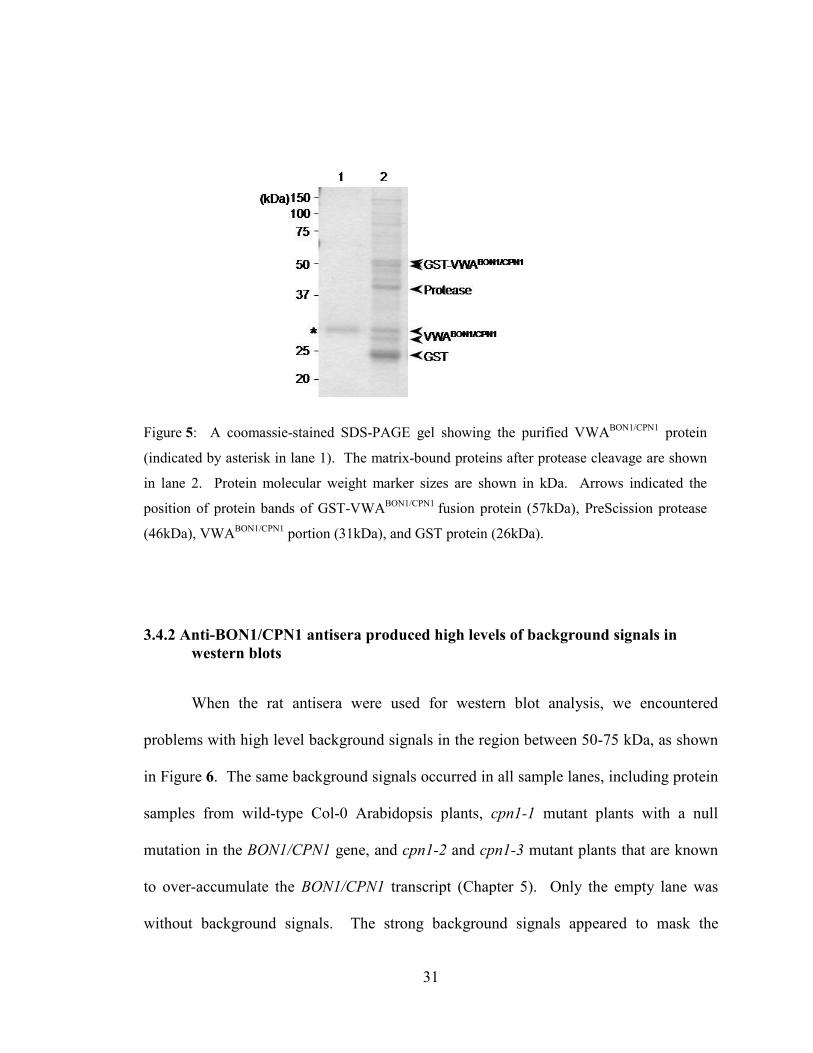
3.4.2 Anti-BON1/CPN1 antisera produced high levels of background signals in
western blots
When the rat antisera were used for western blot analysis, we encountered
problems with high level background signals in the region between 50-75 kDa, as shown
in Figure 6. The same background signals occurred in all sample lanes, including protein
samples from wild-type Col-0 Arabidopsis plants, cpn1-1 mutant plants with a null
mutation in the BON1/CPN1 gene, and cpn1-2 and cpn1-3 mutant plants that are known
to over-accumulate the BON1/CPN1 transcript (Chapter 5). Only the empty lane was
without background signals. The strong background signals appeared to mask the
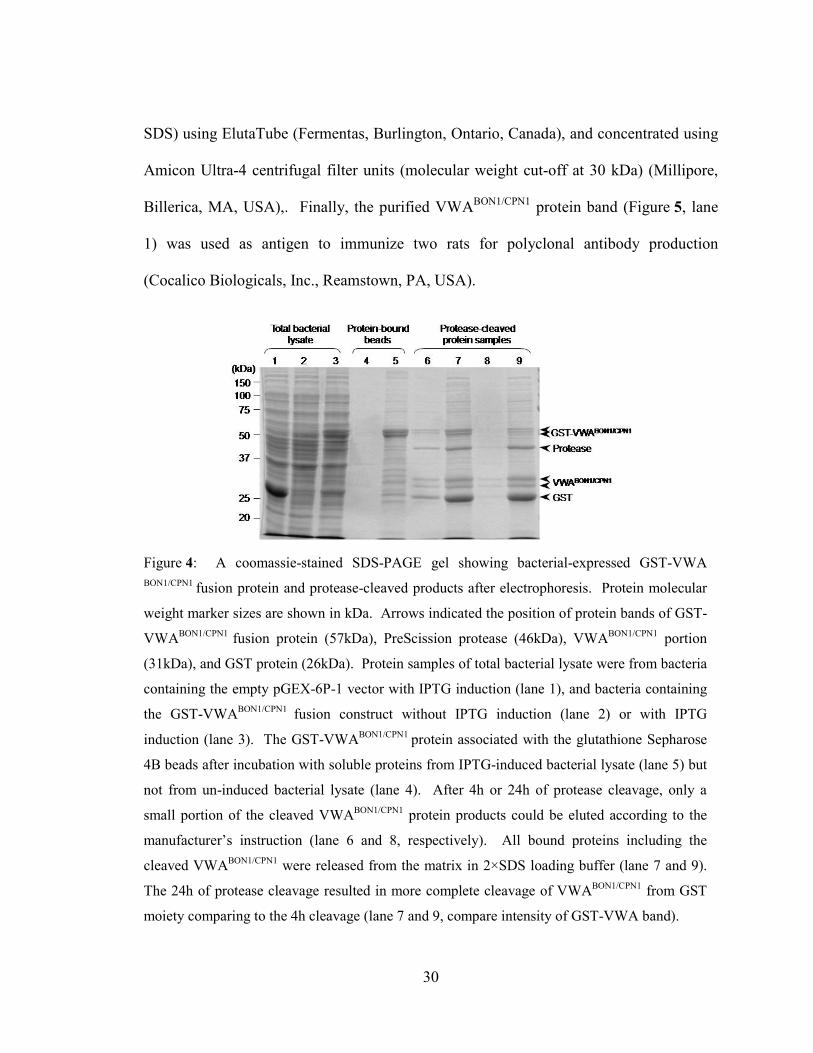
Figure 5: A coomassie-stained SDS-PAGE gel showing the purified VWABON1/CPN1
protein
(indicated by asterisk in lane 1). The matrix-bound proteins after protease cleavage are shown
in lane 2. Protein molecular weight marker sizes are shown in kDa. Arrows indicated the
position of protein bands of GST-VWABON1/CPN1
fusion protein (57kDa), PreScission protease
(46kDa), VWABON1/CPN1
portion (31kDa), and GST protein (26kDa).
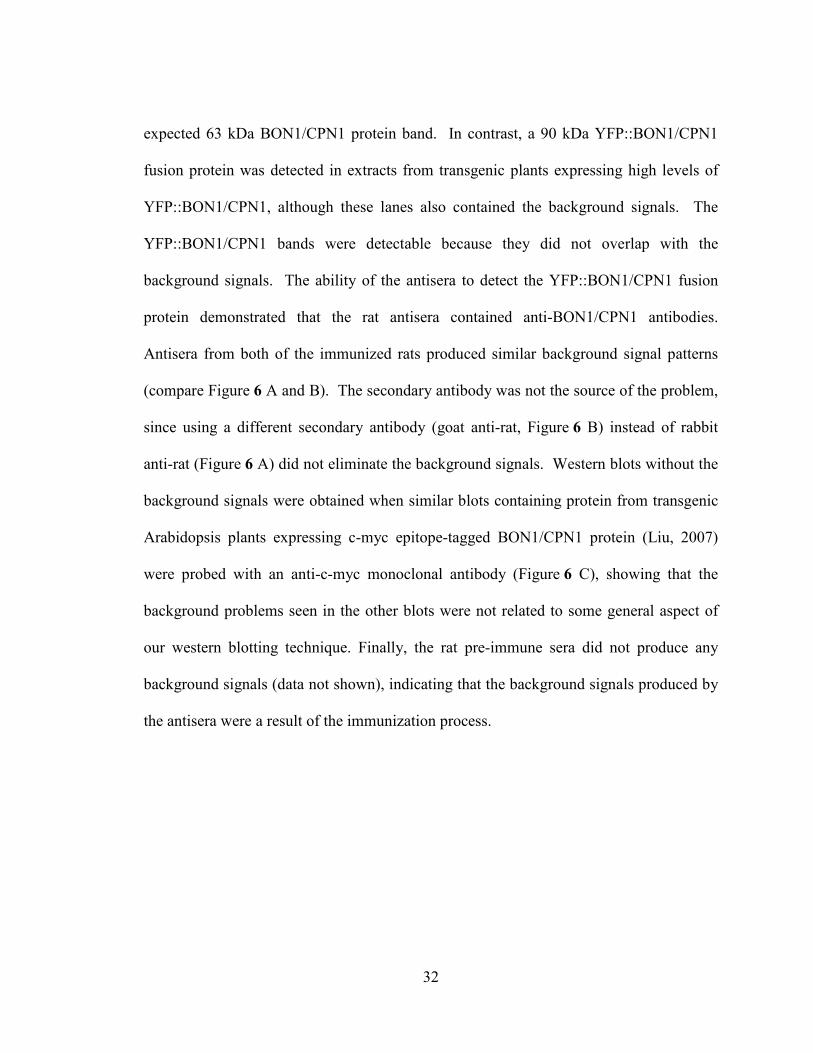
32
expected 63 kDa BON1/CPN1 protein band. In contrast, a 90 kDa YFP::BON1/CPN1
fusion protein was detected in extracts from transgenic plants expressing high levels of
YFP::BON1/CPN1, although these lanes also contained the background signals. The
YFP::BON1/CPN1 bands were detectable because they did not overlap with the
background signals. The ability of the antisera to detect the YFP::BON1/CPN1 fusion
protein demonstrated that the rat antisera contained anti-BON1/CPN1 antibodies.
Antisera from both of the immunized rats produced similar background signal patterns
(compare Figure 6 A and B). The secondary antibody was not the source of the problem,
since using a different secondary antibody (goat anti-rat, Figure 6 B) instead of rabbit
anti-rat (Figure 6 A) did not eliminate the background signals. Western blots without the
background signals were obtained when similar blots containing protein from transgenic
Arabidopsis plants expressing c-myc epitope-tagged BON1/CPN1 protein (Liu, 2007)
were probed with an anti-c-myc monoclonal antibody (Figure 6 C), showing that the
background problems seen in the other blots were not related to some general aspect of
our western blotting technique. Finally, the rat pre-immune sera did not produce any
background signals (data not shown), indicating that the background signals produced by
the antisera were a result of the immunization process.
33
Figure 6: Western blot background problems encountered using two anti-BON1/CPN1 antisera
to detect BON1/CPN1 in Arabidopsis plant protein extracts. Each lane contains 25 µg of protein
except for the empty lane in panel A. Protein molecular weight marker sizes are shown in kDa.
A; The anti-BON1/CPN1 antiserum from the first immunized rat was used to probe a western
blot containing protein extracts from wild-type Col-0 (WT), cpn1-1 null mutant, cpn1-2 mutant,
cpn1-3 mutant, and two YFP::BON1/CPN1 transgenic plants. The secondary antibody used
was an HRP-conjugated, rabbit-anti-rat antibody. An empty lane was included to show the
absence of background signals when nothing was loaded in a lane. The arrow marks the
expected location of the 63 kDa BON1/CPN1 band; the asterisk indicates the expected location
of the 90 kDa YFP::BON1/CPN1 transgenic fusion protein band. B; The anti-BON1/CPN1
antiserum from the second immunized rat was used to probe a western blot containing protein
extracts from wild-type Col-0 (WT) and cpn1-1 null mutant plants. The secondary antibody
used was an HRP conjugated, goat-anti-rat antibody. The arrow marks the expected location of
the 63 kDa BON1/CPN1 band. C; A monoclonal mouse anti-c myc antibody was used to probe
a western blot containing protein extracts from two BON1/CPN1::myc transgenic plants. The
secondary antibody used was an HRP-conjugated, sheep-anti-mouse antibody. The double
asterisk indicates the location of the 63 kDa BON1/CPN1::myc transgenic fusion protein band.
34
3.4.3 ββββ-mercaptoethanol in the loading buffer caused the background problems
We speculated that the background problems might be due to the β-
mercaptoethanol in the loading buffer as suggested in previous study (Tasheva and
Dessev, 1983). To test whether the anti-BON1/CPN1 antibodies cross-reacted with
reagents in the protein gel loading buffer, a western blot was prepared using samples that
contained only loading buffers without protein extracts. One lane contained complete
SDS loading buffer, and the other lanes contained loading buffers with one of each of the
five components omitted. When this blot was probed with anti-BON1/CPN1 antisera, all
of the lanes showed the usual background problems except for the lane containing
loading buffer that was missing β-mercaptoethanol, as shown in Figure 7. This result
showed that β-mercaptoethanol in the loading buffer was associated with the background
signals in the western blots.
In order to rule out the possibility that our β-mercaptoethanol bottle was
contaminated with something that caused the background signals, SDS loading buffers
containing β-mercaptoethanol from five different sources were tested by western blotting.
All of the different sources of β-mercaptoethanol produced the same background patterns
after probing with the anti-BON1/CPN1 antisera (Figure 7 B). Background signals were
not observed in a lane loaded with 1-year-old SDS loading buffer, indicating that storage
of the loading buffer for 1 year at -20°C eliminated the background problems. It was
likely that this was the result of the loss of β-mercaptoethanol from the tube by
evaporation or by chemical breakdown. Finally, a lane containing SDS loading buffer
wherein the β- mercaptoethanol had been substituted with the alternative reducing agent
35
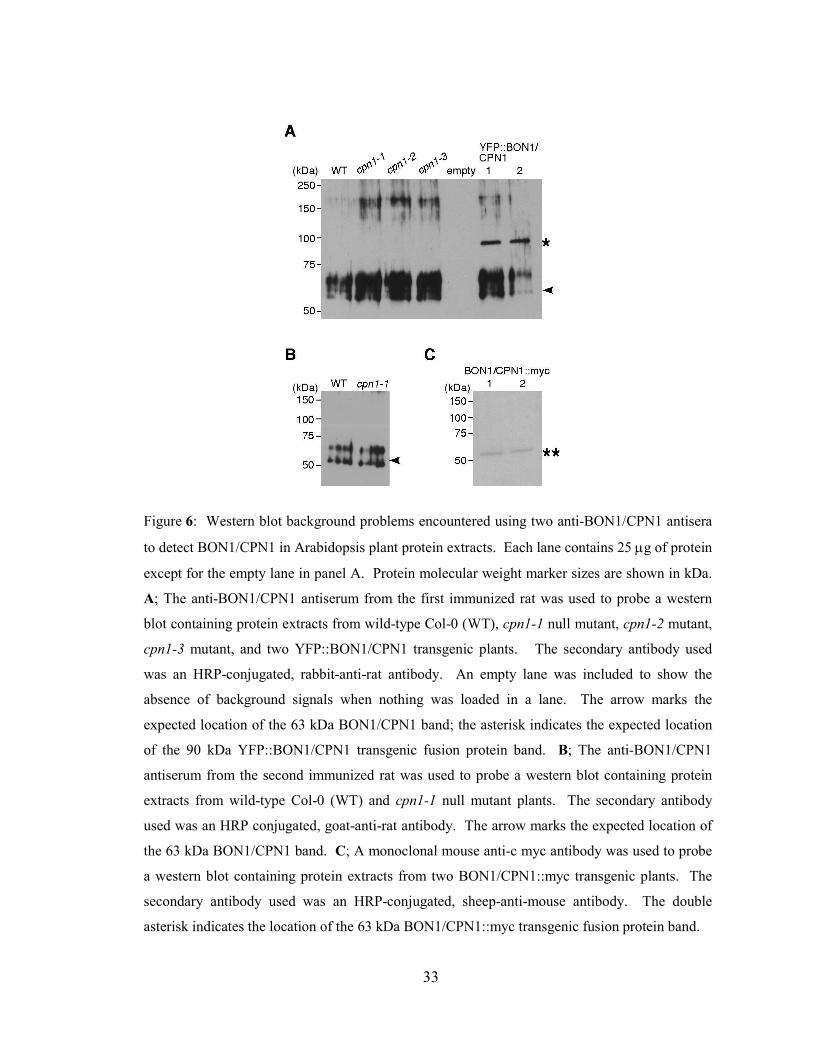
DTT (Cleland, 1964) did not have background signals (Figure 7 B, lane 7). These data
conclusively demonstrate that the background signals were specifically caused by β-
mercaptoethanol in the loading buffer.
Figure 7: β-mercaptoethanol in the loading buffer caused the background signals in western
blotting. Molecular weight marker sizes are shown in kDa. A; Western blot of a gel loaded with
complete 2×SDS loading buffer (lane 1) and 2×SDS loading buffers with one of each of the five
components omitted (lanes 2-6) probed with anti-BON1/CPN1 antisera. Check marks in the
table indicate the presence of individual ingredients. Omitting β-mercaptoethanol from the
loading buffer eliminated the background signal (lane 6). BPB, bromophenol blue; β-ΜΕ, β-
mercaptoethanol. B; Western blot of a gel loaded with a 1-year-old 2×SDS loading buffer made
with 286 mM β-mercaptoethanol (Sigma, Lot 035K0054, lane 1), 2×SDS loading buffers
containing 286 mM β-mercaptoethanol from various sources (lanes 2-6), and 2×SDS loading
buffer with 5 mM DTT instead of 286 mM β- mercaptoethanol (lane 7) probed with anti-
BON1/CPN1 antisera. β-mercaptoethanol was from Sigma (Lot 035K0054, lane 2; Lot
09729MH, lane 3; Lot 39F-060715, lane 4), Mallinckrodt Baker (Lot 1-3350, lane 5), and
AMRESCO (Lot 3078A68, lane 6).
36
3.4.4 Lower concentrations of reducing agent in the loading buffer eliminated the
background signals
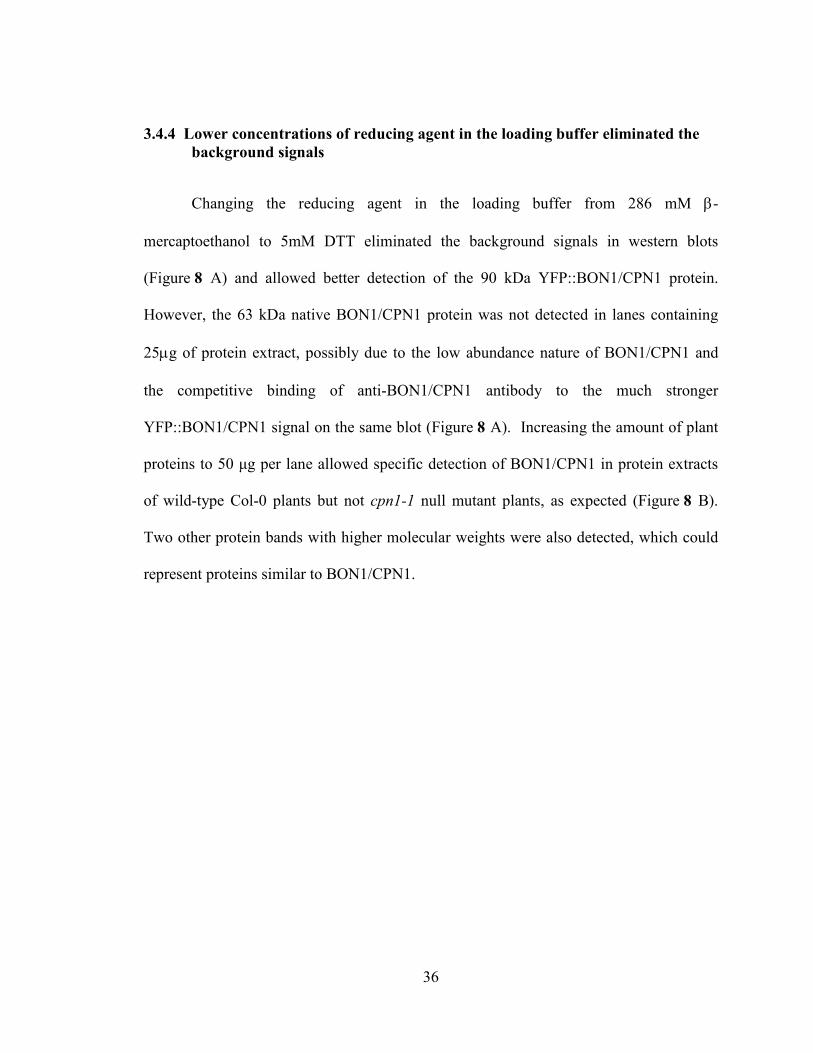
Changing the reducing agent in the loading buffer from 286 mM β-
mercaptoethanol to 5mM DTT eliminated the background signals in western blots
(Figure 8 A) and allowed better detection of the 90 kDa YFP::BON1/CPN1 protein.
However, the 63 kDa native BON1/CPN1 protein was not detected in lanes containing
25µg of protein extract, possibly due to the low abundance nature of BON1/CPN1 and
the competitive binding of anti-BON1/CPN1 antibody to the much stronger
YFP::BON1/CPN1 signal on the same blot (Figure 8 A). Increasing the amount of plant
proteins to 50 µg per lane allowed specific detection of BON1/CPN1 in protein extracts
of wild-type Col-0 plants but not cpn1-1 null mutant plants, as expected (Figure 8 B).
Two other protein bands with higher molecular weights were also detected, which could
represent proteins similar to BON1/CPN1.
37
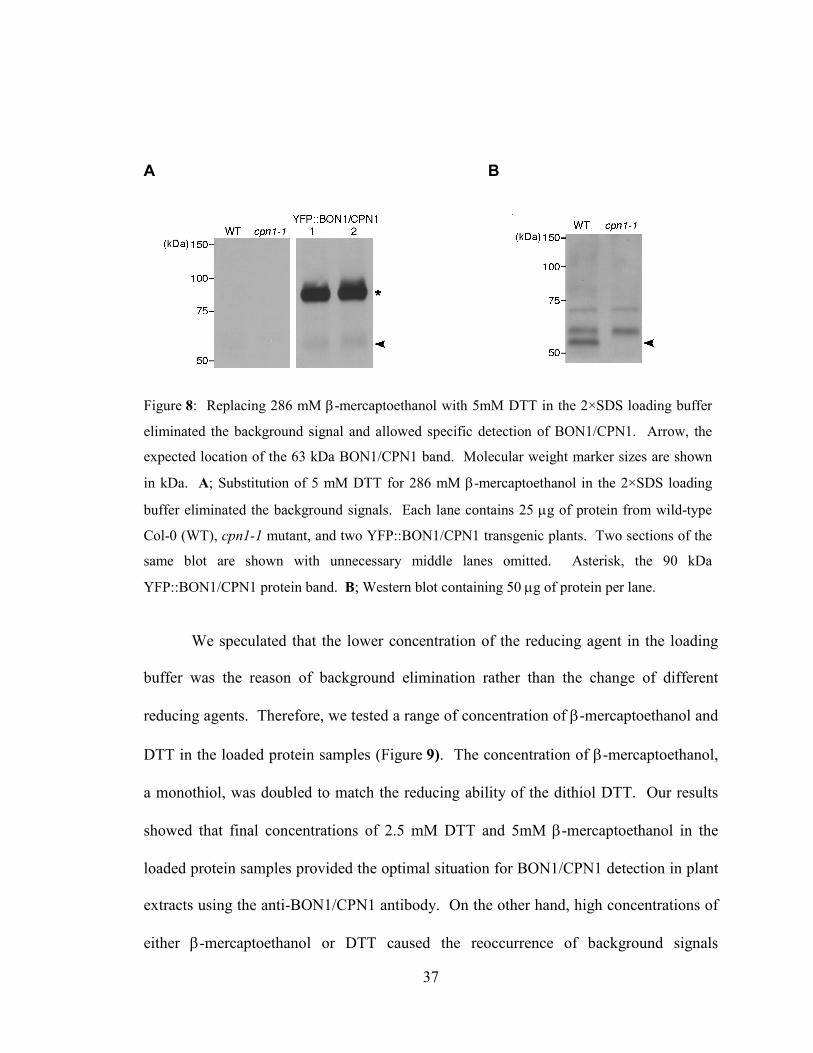
We speculated that the lower concentration of the reducing agent in the loading
buffer was the reason of background elimination rather than the change of different
reducing agents. Therefore, we tested a range of concentration of β-mercaptoethanol and
DTT in the loaded protein samples (Figure 9). The concentration of β-mercaptoethanol,
a monothiol, was doubled to match the reducing ability of the dithiol DTT. Our results
showed that final concentrations of 2.5 mM DTT and 5mM β-mercaptoethanol in the
loaded protein samples provided the optimal situation for BON1/CPN1 detection in plant
extracts using the anti-BON1/CPN1 antibody. On the other hand, high concentrations of
either β-mercaptoethanol or DTT caused the reoccurrence of background signals
A B
Figure 8: Replacing 286 mM β-mercaptoethanol with 5mM DTT in the 2×SDS loading buffer
eliminated the background signal and allowed specific detection of BON1/CPN1. Arrow, the
expected location of the 63 kDa BON1/CPN1 band. Molecular weight marker sizes are shown
in kDa. A; Substitution of 5 mM DTT for 286 mM β-mercaptoethanol in the 2×SDS loading
buffer eliminated the background signals. Each lane contains 25 µg of protein from wild-type
Col-0 (WT), cpn1-1 mutant, and two YFP::BON1/CPN1 transgenic plants. Two sections of the
same blot are shown with unnecessary middle lanes omitted. Asterisk, the 90 kDa
YFP::BON1/CPN1 protein band. B; Western blot containing 50 µg of protein per lane.
38
(Figure 9, lanes with 10mM DTT or 20mM β-ME) as seen in previous experiments
(Figure 6). Reducing agents appear to be essential for better resolution of BON1/CPN1
detection in western analysis, since omitting the reducing agent caused poor detection of
BON1/CPN1 band (Figure 9, no reducing agent lane).
Figure 9: Lower concentrations of reducing agent eliminated the background signals in western
blotting. A western blot was loaded with wild-type Col-0 protein sample prepared with a range
of final β-mercaptoethanol and DTT concentrations, or no reducing agent at all in the loading
buffer. Final concentrations of the reducing agents, the monothiol β-mercaptoethanol and the
dithiol DTT, were shown as pairs with the same reducing ability. The arrow indicates the
BON1/CPN1 band. Molecular weight marker sizes are shown in kDa. Each lane contains 75
µg of protein from the same wild-type plant extract.
3.5 Discussion
Our findings demonstrate that high concentrations of reducing agents in protein
samples can causes the background signals in western blots. The background signals we
39
encountered in western analysis using the polyclonal anti-BON1/CPN1 antibody were
very similar to the keratin contamination reported before (Ochs, 1983; Tasheva and
Dessev, 1983; Shapiro, 1987; Riches et al., 1988; Berube et al., 1994). The presence of
artifact bands between 50 and 68 kDa was first associated with the use of β-
mercaptoethanol for sample preparation under reduced conditions (Tasheva and Dessev,
1983). It was later demonstrated that these artifact bands were caused by the presence of
antibodies that react with the keratin contamination in protein samples or electrophoresis
buffers (Ochs, 1983). Furthermore, purification by pre-absorption of polyclonal
antibodies on keratin was able to improve the artifact problem, indicating the presence of
anti-keratin antibodies in the immunized animal serum (Berube et al., 1994). Along the
same line, there was a high likelihood that anti-keratin antibodies were present in the
anti-BON1/CPN1 sera due to keratin contamination in the gel-eluted antigen. After
being reduced by reducing agents under the electrophoresis conditions, the keratin
contaminant in protein samples was recognized by anti-keratin antibody and caused the
artifact bands in immunoblots.
Several solutions for the keratin artifact problems have been suggested (Shapiro, 1987;
Riches et al., 1988; Berube et al., 1994). The best way to eliminate these artifact bands is
taking extreme caution to avoid any keratin contamination during antigen preparation, sample
preparation, and SDS-PAGE electrophoresis. However, this is difficult to implement when
human handling is involved in the antibody production and immunodetection procedures.
Antibody purification by affinity chromatography also provides a feasible way to solve the
artifact problem. Most importantly, we demonstrated a simple and direct method to eliminate
the artifact background bands in western blotting. It will be useful for researchers to test a

40
range of reducing agent concentrations when trying to eliminate artifact bands from western
blots.
41
Chapter 4
Pathogen regulation of BON1/CPN1 protein level
4.1 Summary
The anti-BON1/CPN1 antisera were used to monitor the BON1/CPN1 protein
level in response to pathogen stimuli. The BON1/CPN1 protein accumulated to a high
level in roots of Col-0 plants. Furthermore, the timing of BON1/CPN1 protein
accumulation in response to avirulent and virulent pathogen challenge correlated with
previously determined BON1/CPN1 transcript accumulation patterns. Finally, the
accumulation of BON1/CPN1 protein was shown to be up-regulated by the activation of
defense signaling responses controlled by two Resistance (R) genes, SNC1 and RPS2.
4.2 Background information
Previous studies have shown that the expression of the Arabidopsis BON1/CPN1
gene is up-regulated by pathogen stimuli (Jambunathan and McNellis, 2003). Leaf
inoculation with avirulent Pseudomonas syringae pv tomato (P. s. t.) DC3000 (avrRpt2)
bacteria specifically triggers a rapid and transient accumulation of BON1/CPN1
transcripts, whereas virulent P. s. t. DC3000 bacterial inoculation triggers a much slower
BON1/CPN1 transcript accumulation in wild-type Col-0 plants (Jambunathan and
McNellis, 2003). Furthermore, in planta expression of the bacterial effector avrRpt2 in
42
the presence of the RPS2 disease resistance gene in the Col-0 background is sufficient to
induce the BON1/CPN1 transcript accumulation (Jambunathan and McNellis, 2003).
Together, these results indicate that stronger and more rapid accumulation of
BON1/CPN1 transcripts is triggered by the gene-for-gene recognition between the RPS2
gene carried by Col-0 plants and its cognate avrRpt2 gene carried by the avirulent strain
of P. s. t. DC3000 (avrRpt2) bacteria compared to that by a compatible reaction (Whalen
et al., 1991; Innes et al., 1993; Kunkel et al., 1993). In other words, rapid accumulation
of BON1/CPN1 transcripts is triggered by RPS2-mediated defense activation following
the RPS2-mediated recognition of avrRpt2.
Since BON1/CPN1 has been shown to negatively regulate the R gene homolog
SNC1 (Yang and Hua, 2004), we were interested in whether BON1/CPN1 transcript or
protein level is also regulated by the activation of SNC1-mediated defense signaling.
However, SNC1 is an orphan R gene due to the unknown cognate Avr-gene product
recognized by wild-type SNC1, which makes the study of wild-type SNC1-mediated
defense signaling not possible. In this study, we take advantage of the suppressor of n-
pr1-1, constitutive 1 (snc1) mutant, which has a dominant, missense mutation in SNC1
that activates the R gene constitutively, and results in constitutive PR gene expression and
enhanced disease resistance to bacterial and oomycete pathogens (Li et al., 2001). The
constitutive activation of SNC1 gene in the snc1 gain-of-function mutant allows us to
study the BON1/CPN1 regulation by SNC1-mediated defense signaling.
In this study, the anti-BON1/CPN1 antisera we generated in Chapter 3 were first
used to examine the tissue distribution of BON1/CPN1 protein. Next, to investigate
whether RPS2 or SNC1 genes affect the abundance of BON1/CPN1, we monitored
43
BON1/CPN1 levels in wild-type Col-0 plants after pathogen challenge and in gain-of-
function snc1 mutant plants. We also monitored BON1/CPN1 protein level in a mutant
with defective RPS2-mediated defense signaling and a mutant defective in a putative
BON1/CPN1 interacting protein. These results provide more information about the
protein and defense signaling pathways that are important for pathogen-regulated
BON1/CPN1 accumulation.
4.3 Materials and methods
4.3.1 Plant materials and growth conditions
All plants were grown in soil-less medium (Reid-Earth Plug and Seedling Mix,
Sun Grow Horticulture) and irrigated with distilled water. Wild-type Col-0 plants and the
various mutant plants were grown at 21°C and 35% RH under a 10 h photoperiod with 75
µmol m-2 s
-1 light intensity. 5-week-old plants were used for all experiments unless
indicated otherwise.
4.3.2 Bacterial inoculations and bacterial growth analysis
Arabidopsis leaves were infiltrated with bacteria using needle-less 1 cc syringes
as described in Chapter 2. P. s. t. DC3000 and P. s. t. DC3000 (avrRpt2) strains of
bacteria were grown at 28°C on Pseudomonas Agar F (PA Sigma) containing only
100µg/mL rifampicin (Sigma) or both 100 µg/mL rifampicin and 25 µg/mL kanamycin
44
(Sigma), respectively. Bacterially-infiltrated plants were returned to their original growth
conditions and leaves were collected at indicated time points for protein extraction.
4.3.3 Plant protein extraction and western analysis
Arabidopsis total soluble proteins were isolated as described in Chapter 3. For
western blot analysis, 75 µg of protein was mixed with an equal volume of 2×SDS
loading buffer (126 mM Tris-HCl pH 6.8, 20% glycerol, 4% SDS, 0.005% bromophenol
blue, 5 mM DTT), separated a 7.5% SDS-PAGE gel, and electrotransferred onto Hybond
ECL nitrocellulose membranes (GE Healthcare) as described (Sambrook and Russell,
2001). Membrane blocking and primary and secondary antibody incubations were
performed in 1×TBST buffer (20 mM Tris-HCl pH 7.6, 137 mM NaCl, 0.1% Tween-20)
containing 5% non-fat dry milk. A 1:6,000 dilution and a 1:8,000 dilution were used for
the rat anti- BON1/CPN1 antisera and the rabbit-anti-rat antibody conjugated with
horseradish peroxidase (Sigma), respectively. Chemiluminescence detection was
performed according to the manufacturer’s instructions (ECL Plus western blotting
detection system, GE Healthcare).
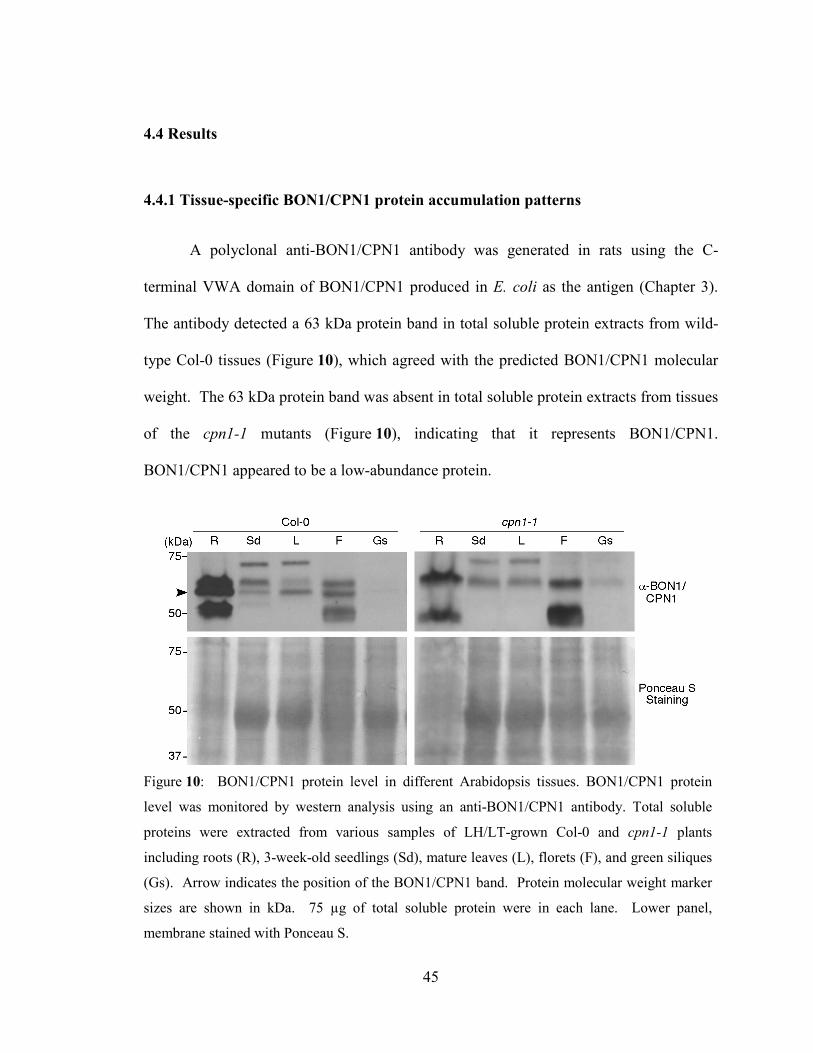
45
4.4 Results
4.4.1 Tissue-specific BON1/CPN1 protein accumulation patterns
A polyclonal anti-BON1/CPN1 antibody was generated in rats using the C-
terminal VWA domain of BON1/CPN1 produced in E. coli as the antigen (Chapter 3).
The antibody detected a 63 kDa protein band in total soluble protein extracts from wild-
type Col-0 tissues (Figure 10), which agreed with the predicted BON1/CPN1 molecular
weight. The 63 kDa protein band was absent in total soluble protein extracts from tissues
of the cpn1-1 mutants (Figure 10), indicating that it represents BON1/CPN1.
BON1/CPN1 appeared to be a low-abundance protein.
Figure 10: BON1/CPN1 protein level in different Arabidopsis tissues. BON1/CPN1 protein
level was monitored by western analysis using an anti-BON1/CPN1 antibody. Total soluble
proteins were extracted from various samples of LH/LT-grown Col-0 and cpn1-1 plants
including roots (R), 3-week-old seedlings (Sd), mature leaves (L), florets (F), and green siliques
(Gs). Arrow indicates the position of the BON1/CPN1 band. Protein molecular weight marker
sizes are shown in kDa. 75 µg of total soluble protein were in each lane. Lower panel,
membrane stained with Ponceau S.
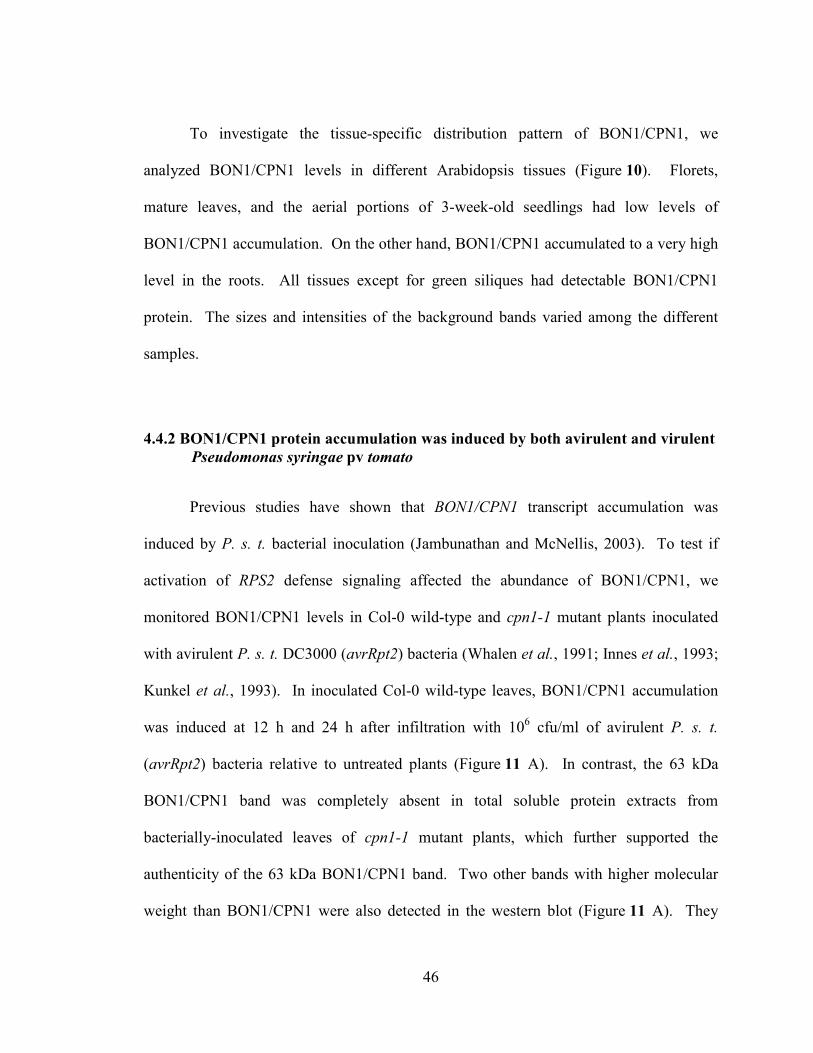
46
To investigate the tissue-specific distribution pattern of BON1/CPN1, we
analyzed BON1/CPN1 levels in different Arabidopsis tissues (Figure 10). Florets,
mature leaves, and the aerial portions of 3-week-old seedlings had low levels of
BON1/CPN1 accumulation. On the other hand, BON1/CPN1 accumulated to a very high
level in the roots. All tissues except for green siliques had detectable BON1/CPN1
protein. The sizes and intensities of the background bands varied among the different
samples.
4.4.2 BON1/CPN1 protein accumulation was induced by both avirulent and virulent
Pseudomonas syringae pv tomato
Previous studies have shown that BON1/CPN1 transcript accumulation was
induced by P. s. t. bacterial inoculation (Jambunathan and McNellis, 2003). To test if
activation of RPS2 defense signaling affected the abundance of BON1/CPN1, we
monitored BON1/CPN1 levels in Col-0 wild-type and cpn1-1 mutant plants inoculated
with avirulent P. s. t. DC3000 (avrRpt2) bacteria (Whalen et al., 1991; Innes et al., 1993;
Kunkel et al., 1993). In inoculated Col-0 wild-type leaves, BON1/CPN1 accumulation
was induced at 12 h and 24 h after infiltration with 106 cfu/ml of avirulent P. s. t.
(avrRpt2) bacteria relative to untreated plants (Figure 11 A). In contrast, the 63 kDa
BON1/CPN1 band was completely absent in total soluble protein extracts from
bacterially-inoculated leaves of cpn1-1 mutant plants, which further supported the
authenticity of the 63 kDa BON1/CPN1 band. Two other bands with higher molecular
weight than BON1/CPN1 were also detected in the western blot (Figure 11 A). They
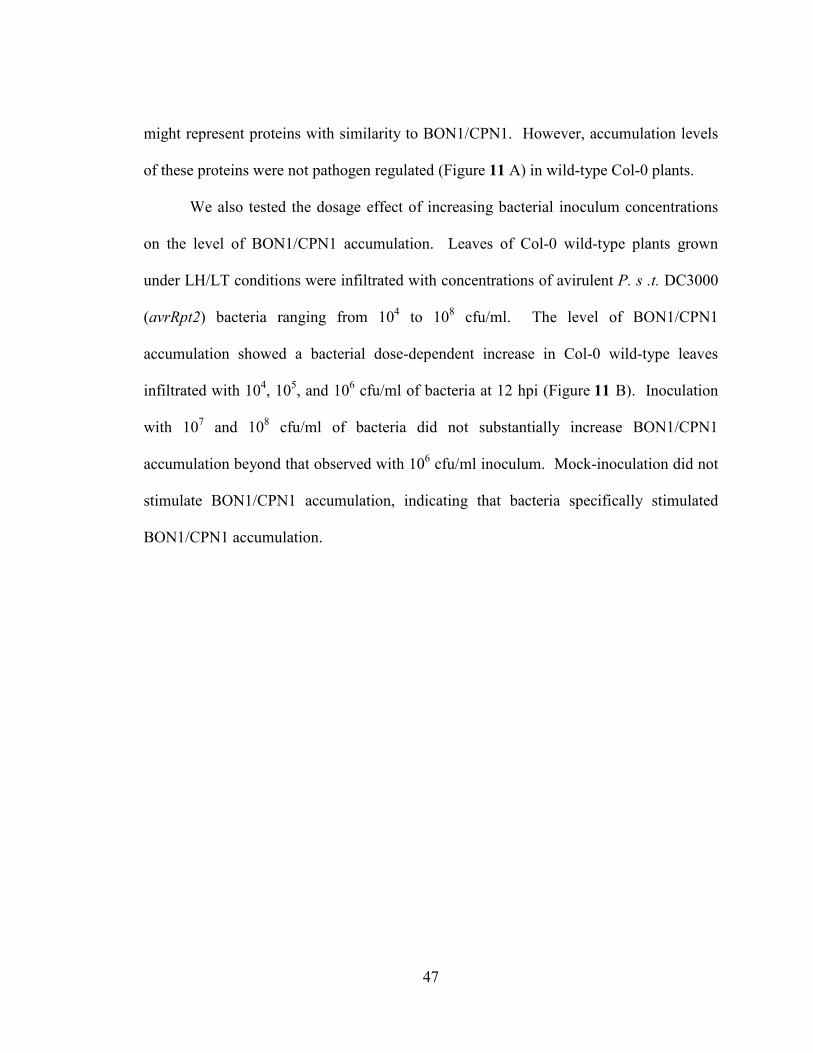
47
might represent proteins with similarity to BON1/CPN1. However, accumulation levels
of these proteins were not pathogen regulated (Figure 11 A) in wild-type Col-0 plants.
We also tested the dosage effect of increasing bacterial inoculum concentrations
on the level of BON1/CPN1 accumulation. Leaves of Col-0 wild-type plants grown
under LH/LT conditions were infiltrated with concentrations of avirulent P. s .t. DC3000
(avrRpt2) bacteria ranging from 104 to 10
8 cfu/ml. The level of BON1/CPN1
accumulation showed a bacterial dose-dependent increase in Col-0 wild-type leaves
infiltrated with 104, 10
5, and 10
6 cfu/ml of bacteria at 12 hpi (Figure 11 B). Inoculation
with 107 and 10
8 cfu/ml of bacteria did not substantially increase BON1/CPN1
accumulation beyond that observed with 106 cfu/ml inoculum. Mock-inoculation did not
stimulate BON1/CPN1 accumulation, indicating that bacteria specifically stimulated
BON1/CPN1 accumulation.
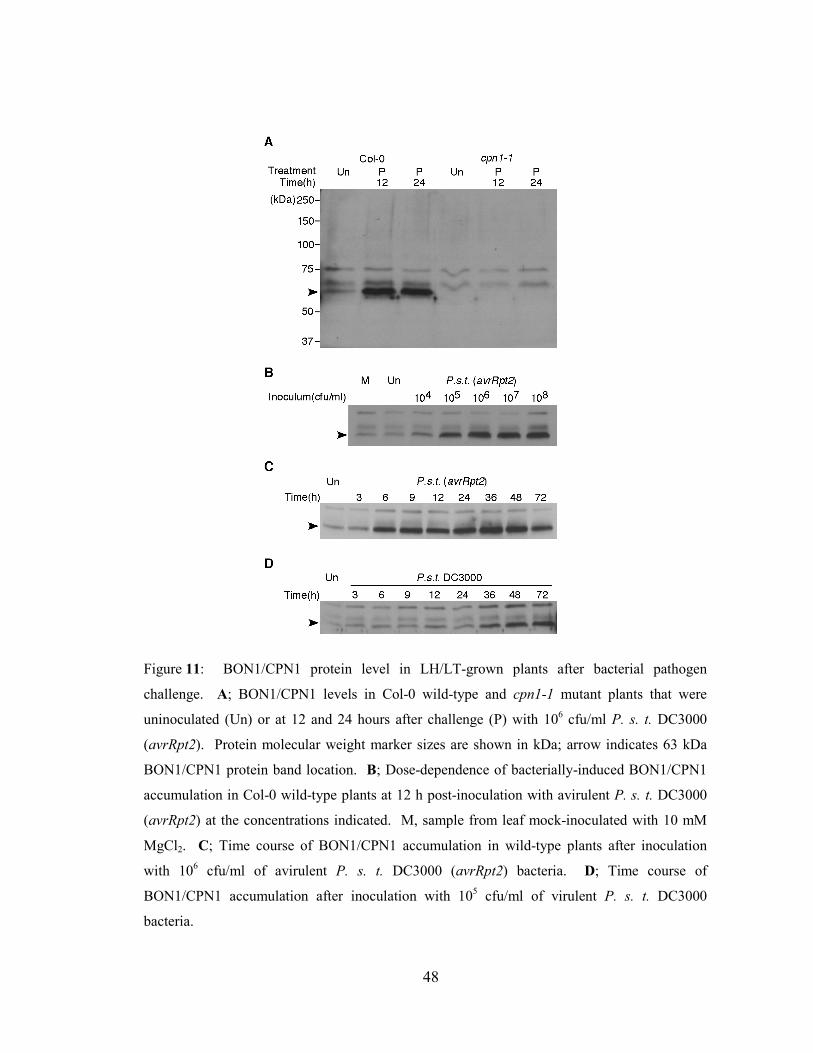
48
Figure 11: BON1/CPN1 protein level in LH/LT-grown plants after bacterial pathogen
challenge. A; BON1/CPN1 levels in Col-0 wild-type and cpn1-1 mutant plants that were
uninoculated (Un) or at 12 and 24 hours after challenge (P) with 106 cfu/ml P. s. t. DC3000
(avrRpt2). Protein molecular weight marker sizes are shown in kDa; arrow indicates 63 kDa
BON1/CPN1 protein band location. B; Dose-dependence of bacterially-induced BON1/CPN1
accumulation in Col-0 wild-type plants at 12 h post-inoculation with avirulent P. s. t. DC3000
(avrRpt2) at the concentrations indicated. M, sample from leaf mock-inoculated with 10 mM
MgCl2. C; Time course of BON1/CPN1 accumulation in wild-type plants after inoculation
with 106 cfu/ml of avirulent P. s. t. DC3000 (avrRpt2) bacteria. D; Time course of
BON1/CPN1 accumulation after inoculation with 105 cfu/ml of virulent P. s. t. DC3000
bacteria.
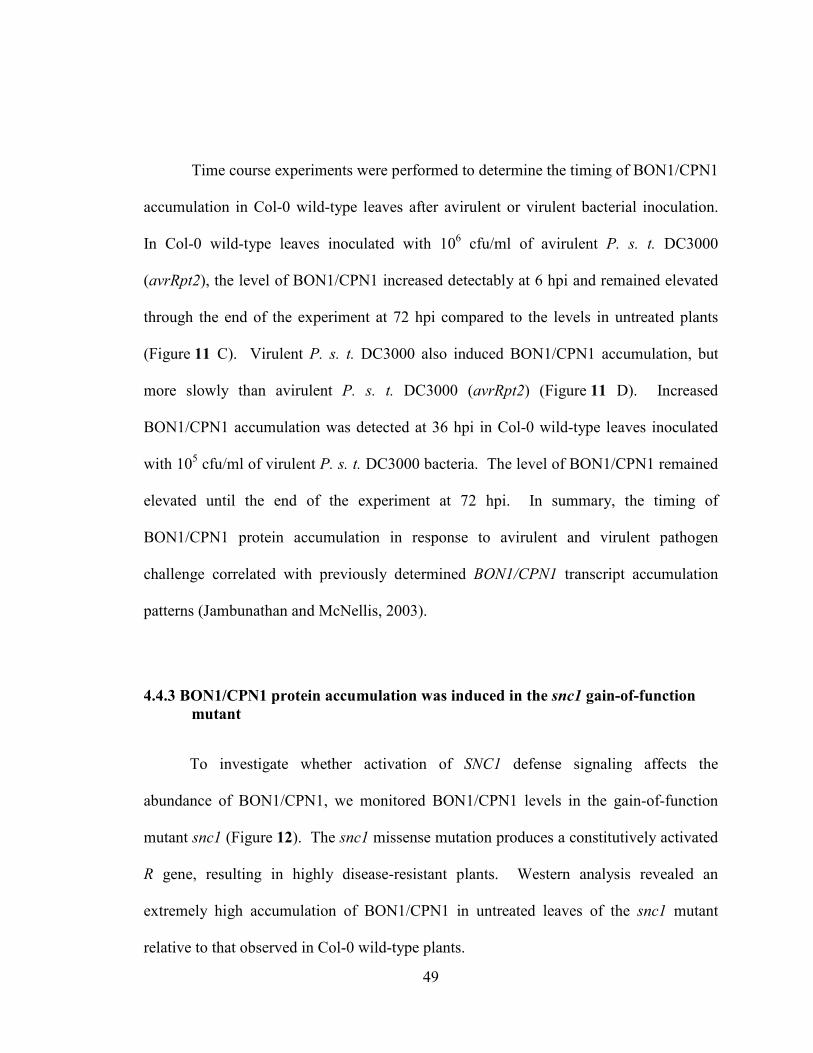
49
Time course experiments were performed to determine the timing of BON1/CPN1
accumulation in Col-0 wild-type leaves after avirulent or virulent bacterial inoculation.
In Col-0 wild-type leaves inoculated with 106 cfu/ml of avirulent P. s. t. DC3000
(avrRpt2), the level of BON1/CPN1 increased detectably at 6 hpi and remained elevated
through the end of the experiment at 72 hpi compared to the levels in untreated plants
(Figure 11 C). Virulent P. s. t. DC3000 also induced BON1/CPN1 accumulation, but
more slowly than avirulent P. s. t. DC3000 (avrRpt2) (Figure 11 D). Increased
BON1/CPN1 accumulation was detected at 36 hpi in Col-0 wild-type leaves inoculated
with 105 cfu/ml of virulent P. s. t. DC3000 bacteria. The level of BON1/CPN1 remained
elevated until the end of the experiment at 72 hpi. In summary, the timing of
BON1/CPN1 protein accumulation in response to avirulent and virulent pathogen
challenge correlated with previously determined BON1/CPN1 transcript accumulation
patterns (Jambunathan and McNellis, 2003).
4.4.3 BON1/CPN1 protein accumulation was induced in the snc1 gain-of-function
mutant
To investigate whether activation of SNC1 defense signaling affects the
abundance of BON1/CPN1, we monitored BON1/CPN1 levels in the gain-of-function
mutant snc1 (Figure 12). The snc1 missense mutation produces a constitutively activated
R gene, resulting in highly disease-resistant plants. Western analysis revealed an
extremely high accumulation of BON1/CPN1 in untreated leaves of the snc1 mutant
relative to that observed in Col-0 wild-type plants.
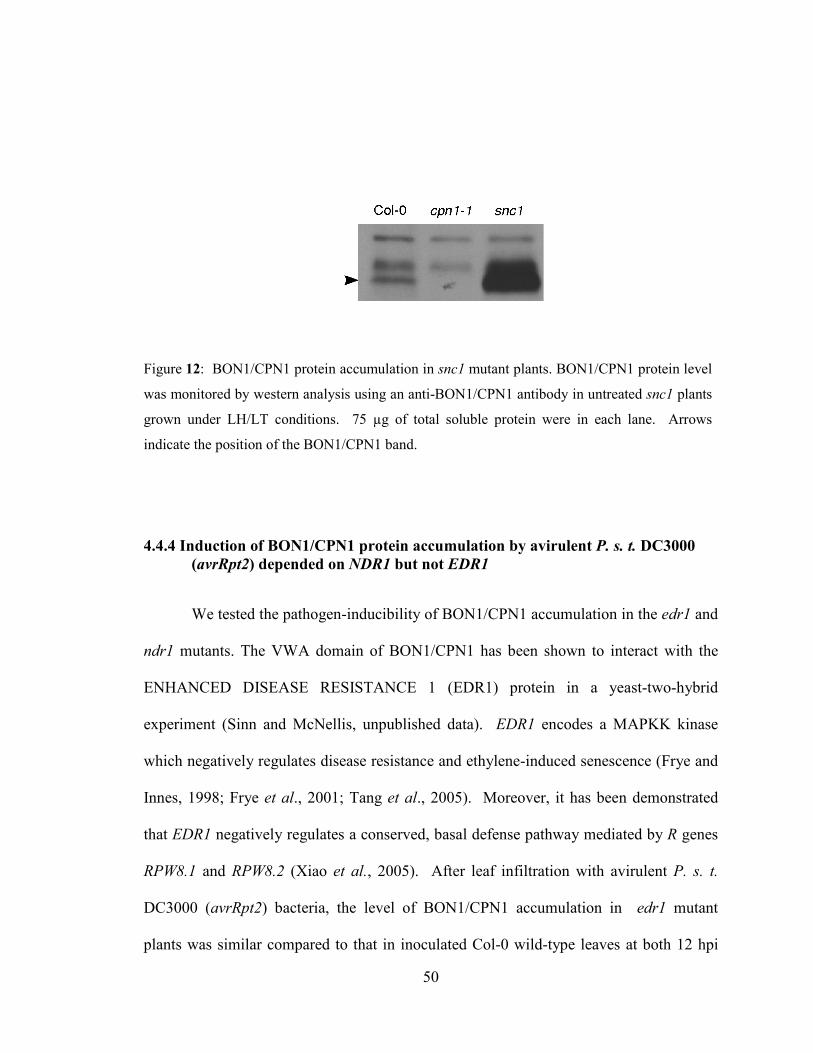
50
4.4.4 Induction of BON1/CPN1 protein accumulation by avirulent P. s. t. DC3000
(avrRpt2) depended on NDR1 but not EDR1
We tested the pathogen-inducibility of BON1/CPN1 accumulation in the edr1 and
ndr1 mutants. The VWA domain of BON1/CPN1 has been shown to interact with the
ENHANCED DISEASE RESISTANCE 1 (EDR1) protein in a yeast-two-hybrid
experiment (Sinn and McNellis, unpublished data). EDR1 encodes a MAPKK kinase
which negatively regulates disease resistance and ethylene-induced senescence (Frye and
Innes, 1998; Frye et al., 2001; Tang et al., 2005). Moreover, it has been demonstrated
that EDR1 negatively regulates a conserved, basal defense pathway mediated by R genes
RPW8.1 and RPW8.2 (Xiao et al., 2005). After leaf infiltration with avirulent P. s. t.
DC3000 (avrRpt2) bacteria, the level of BON1/CPN1 accumulation in edr1 mutant
plants was similar compared to that in inoculated Col-0 wild-type leaves at both 12 hpi
Figure 12: BON1/CPN1 protein accumulation in snc1 mutant plants. BON1/CPN1 protein level
was monitored by western analysis using an anti-BON1/CPN1 antibody in untreated snc1 plants
grown under LH/LT conditions. 75 µg of total soluble protein were in each lane. Arrows
indicate the position of the BON1/CPN1 band.
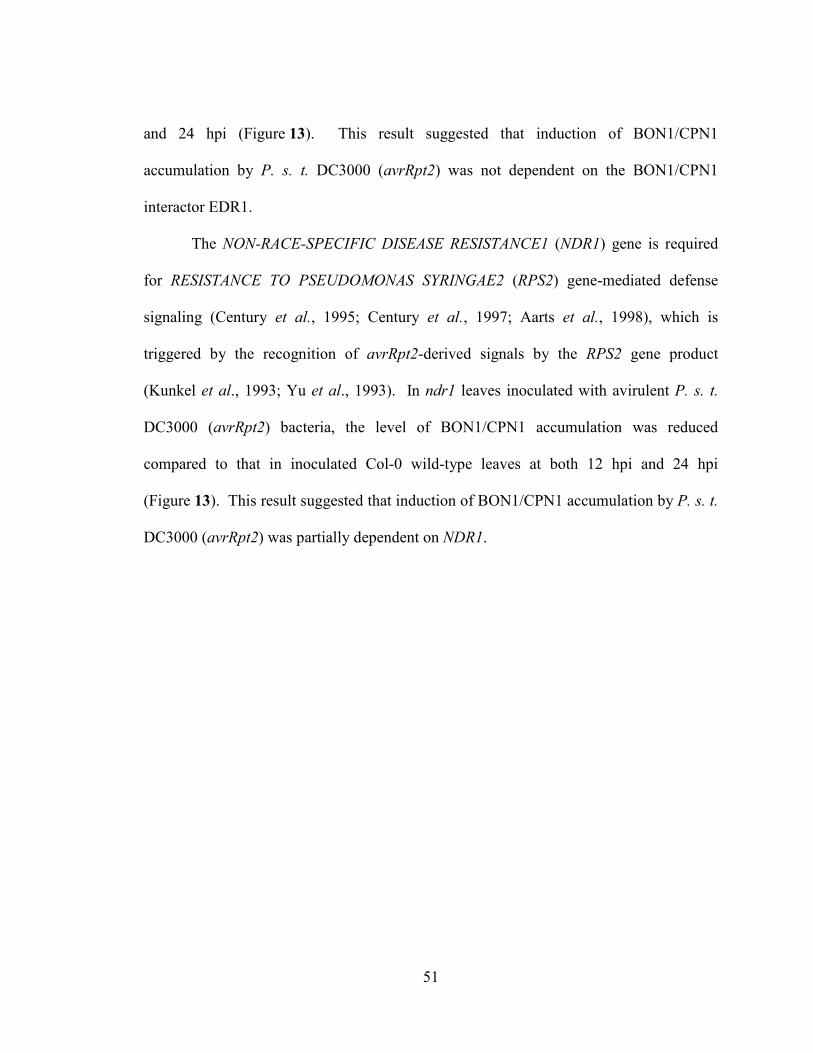
51
and 24 hpi (Figure 13). This result suggested that induction of BON1/CPN1
accumulation by P. s. t. DC3000 (avrRpt2) was not dependent on the BON1/CPN1
interactor EDR1.
The NON-RACE-SPECIFIC DISEASE RESISTANCE1 (NDR1) gene is required
for RESISTANCE TO PSEUDOMONAS SYRINGAE2 (RPS2) gene-mediated defense
signaling (Century et al., 1995; Century et al., 1997; Aarts et al., 1998), which is
triggered by the recognition of avrRpt2-derived signals by the RPS2 gene product
(Kunkel et al., 1993; Yu et al., 1993). In ndr1 leaves inoculated with avirulent P. s. t.
DC3000 (avrRpt2) bacteria, the level of BON1/CPN1 accumulation was reduced
compared to that in inoculated Col-0 wild-type leaves at both 12 hpi and 24 hpi
(Figure 13). This result suggested that induction of BON1/CPN1 accumulation by P. s. t.
DC3000 (avrRpt2) was partially dependent on NDR1.
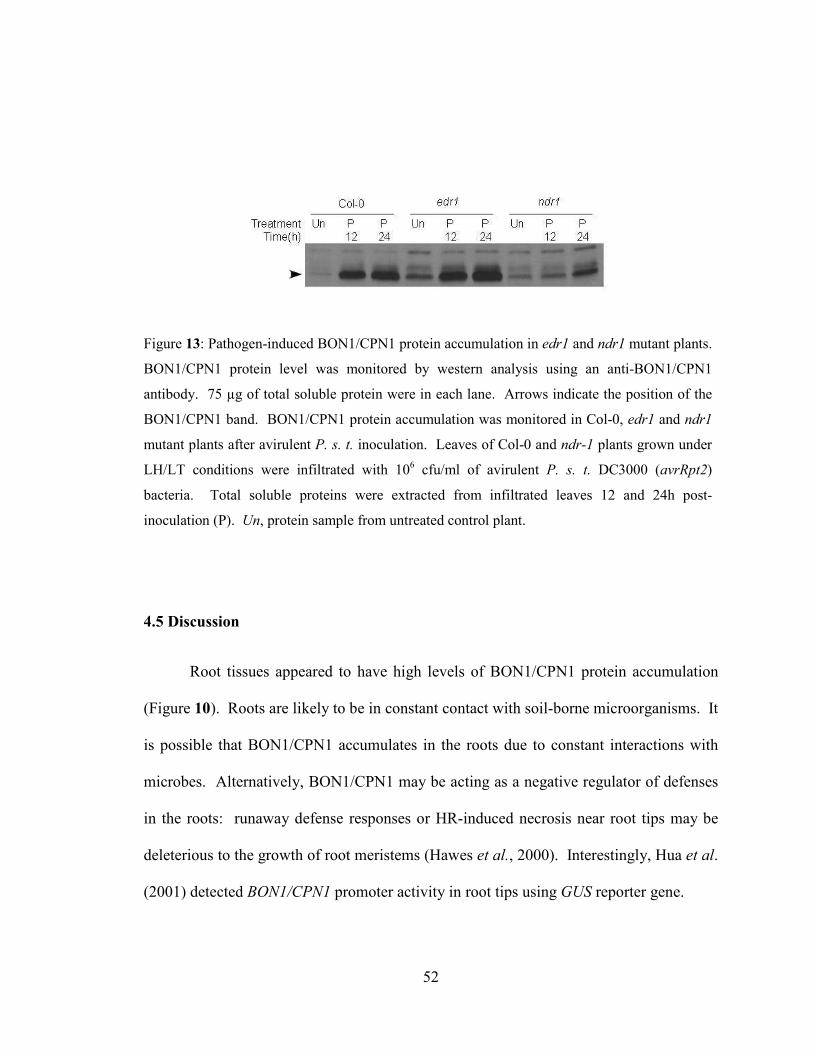
52
4.5 Discussion
Root tissues appeared to have high levels of BON1/CPN1 protein accumulation
(Figure 10). Roots are likely to be in constant contact with soil-borne microorganisms. It
is possible that BON1/CPN1 accumulates in the roots due to constant interactions with
microbes. Alternatively, BON1/CPN1 may be acting as a negative regulator of defenses
in the roots: runaway defense responses or HR-induced necrosis near root tips may be
deleterious to the growth of root meristems (Hawes et al., 2000). Interestingly, Hua et al.
(2001) detected BON1/CPN1 promoter activity in root tips using GUS reporter gene.
Figure 13: Pathogen-induced BON1/CPN1 protein accumulation in edr1 and ndr1 mutant plants.
BON1/CPN1 protein level was monitored by western analysis using an anti-BON1/CPN1
antibody. 75 µg of total soluble protein were in each lane. Arrows indicate the position of the
BON1/CPN1 band. BON1/CPN1 protein accumulation was monitored in Col-0, edr1 and ndr1
mutant plants after avirulent P. s. t. inoculation. Leaves of Col-0 and ndr-1 plants grown under
LH/LT conditions were infiltrated with 106 cfu/ml of avirulent P. s. t. DC3000 (avrRpt2)
bacteria. Total soluble proteins were extracted from infiltrated leaves 12 and 24h post-
inoculation (P). Un, protein sample from untreated control plant.
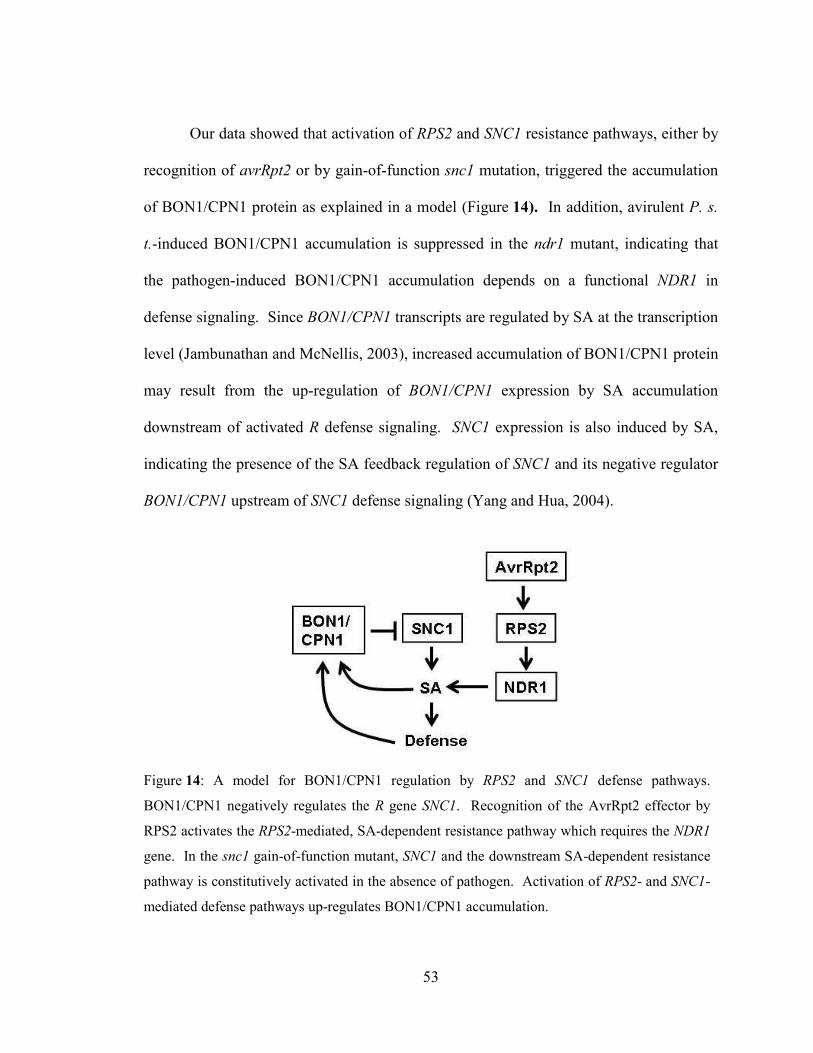
53
Our data showed that activation of RPS2 and SNC1 resistance pathways, either by
recognition of avrRpt2 or by gain-of-function snc1 mutation, triggered the accumulation
of BON1/CPN1 protein as explained in a model (Figure 14). In addition, avirulent P. s.
t.-induced BON1/CPN1 accumulation is suppressed in the ndr1 mutant, indicating that
the pathogen-induced BON1/CPN1 accumulation depends on a functional NDR1 in
defense signaling. Since BON1/CPN1 transcripts are regulated by SA at the transcription
level (Jambunathan and McNellis, 2003), increased accumulation of BON1/CPN1 protein
may result from the up-regulation of BON1/CPN1 expression by SA accumulation
downstream of activated R defense signaling. SNC1 expression is also induced by SA,
indicating the presence of the SA feedback regulation of SNC1 and its negative regulator
BON1/CPN1 upstream of SNC1 defense signaling (Yang and Hua, 2004).
Figure 14: A model for BON1/CPN1 regulation by RPS2 and SNC1 defense pathways.
BON1/CPN1 negatively regulates the R gene SNC1. Recognition of the AvrRpt2 effector by
RPS2 activates the RPS2-mediated, SA-dependent resistance pathway which requires the NDR1
gene. In the snc1 gain-of-function mutant, SNC1 and the downstream SA-dependent resistance
pathway is constitutively activated in the absence of pathogen. Activation of RPS2- and SNC1-
mediated defense pathways up-regulates BON1/CPN1 accumulation.
54
It is interesting that the accumulation of BON1/CPN1, a negative regulator of
defense responses, is induced by defense activation in response to bacterial pathogen
attack. One possible explanation is that increased BON1/CPN1 accumulation is required
for the negative regulation of cell death and defense response to cope with diverse types
of pathogen challenge. In a recent study about tradeoffs between different defense
responses, plants have developed a tight control for cross-talk between SA- and jasmonic
acid (JA)-dependent defenses in a spatial and pathogen-specific fashion (Spoel et al.,
2007). For various types of pathogen attack, SA induces the defense response against
biotrophic pathogens that propagate on living cells, while JA induces the defense
response against necrotrophic pathogens that kill cells and feed on the nutrients of cells.
Their results demonstrates that infection with the biotroph Pseudomonas syringae, which
triggers SA-mediated defense, makes plants more susceptible to the necrotroph
Alternaria brassicicola by suppressing the JA-mediated defense responses. In addition,
the tradeoffs occur only at the adjacent tissues of the initial infection sites but not in a
systemic manner (Spoel et al., 2007). Along the same lines, BON1/CPN1 may
participate in a complex regulation mechanism for controlling programmed cell death
against biotrophic pathogen challenge, and preventing run-away cell death which would
be beneficial for necrotrophic pathogens. Previous study has demonstrated the
accumulation of BON1/CPN1 transcripts in the bacterially-infiltrated leaves and not in
distal leaves after avirulent and virulent pathogen inoculation (Jambunathan and
McNellis, 2003). This result suggests that the function of BON1/CPN1 as cell death
suppressor may be needed more locally near the pathogen infection site than

55
systemically, which agrees with the scenario that local activity of BON1/CPN1 is
important for spatial regulation of defense activation.
56
Chapter 5
Pathogen- and calcium-responsive BON1/CPN1 promoter activity
5.1 Summary
BON1/CPN1 promoter activity was analyzed using the β-glucuronidase (GUS)
reporter gene. A 280 bp portion of the BON1/CPN1 promoter was identified conferring
pathogen- and A23187-inducible GUS expression, which occurred in a localized,
punctate pattern in treated leaves. Characterization of two BON1/CPN1 T-DNA
insertion mutants with T-DNA inserted extremely close to the BON1/CPN1
transcriptional start site showed that they over-accumulated BON1/CPN1 in response to
pathogen challenge. The function of the pathogen-responsive region of the BON1/CPN1
promoter was discussed.
5.2 Background information
The regulation of BON1/CPN1 expression appears to be under complicated
control by multiple factors. The rapid and transient accumulation of BON1/CPN1
transcript as early as 4 h after avirulent P. s. t. challenge demonstrates the tightly
controlled regulation of BON1/CPN1 expression during the early stage of the
incompatible defense response (Jambunathan and McNellis, 2003). In addition, the
57
expression of SNC1 and its negative regulator BON1/CPN1 gene is subjected to feedback
regulation by SA, the signaling molecule for later stage of defense responses like
systemic acquired resistance (Durrant and Dong, 2004). It is not uncommon for R genes
being regulated by feedback amplification. The Arabidopsis RPW8.1 and RPW8.2 genes,
which mediate powdery mildew resistance by inducing hypersensitive response (HR), are
regulated transcriptionally by a SA-dependent feedback circuit (Xiao et al., 2003).
Interestingly, the accumulation of RPW8.1 and RPW8.2 transcript is also induced by
environmental conditions including low temperature and low humidity (Xiao et al.,
2003). These studies suggest that R genes and components in R-mediated defense
signaling may commonly be regulated by mechanisms involved in multiple factors and
feedback regulation at the transcriptional level.
Many genes encoding C2 domain-containing proteins are induced by abiotic and
biotic stresses (Kim et al., 2003; Ouelhadj et al., 2006; Kim et al., 2008). In addition,
their expression is induced by chemically applied Ca2+ stimulus. For example, rice
OsERG1 transcript accumulation was induced by fungal elicitors and A23187 treatment
in rice suspension cells (Kim et al., 2003). The expression of the barley HvC2d1 gene
was transiently induced by heavy metal, reactive oxygen species (ROS), and A23187 leaf
treatments (Ouelhadj et al., 2006). In pepper leaves, the CaSRC2-1 gene was up-
regulated by bacterial and viral pathogen infection, cold and CaCl2 treatments (Kim et al.,
2008). Similarly, BON1/CPN1 and BAP1, which encodes a small C2 domain-containing
protein that interacts with and is a functional partner of BON1/CPN1, are
transcriptionally up-regulated by pathogens, salicylic acid (SA), and low temperatures
(Hua et al., 2001; Jambunathan and McNellis, 2003; Yang et al., 2006a). Taken together,
58
these results suggest that many C2 domain-containing proteins are subject to
transcriptional regulation by Ca2+ stimuli and various abiotic and biotic stresses.
A search for regulatory motifs based on the BON1/CPN1 promoter sequence has
found different putative cis-acting element responsive to abiotic and defense-related
signals (Figure 15). However, experimental analysis is needed to identify whether these
putative regulatory elements are functional or not. To further investigate how
BON1/CPN1 expression is regulated by different stimuli, we conducted a BON1/CPN1
promoter activity analysis using the β-glucuronidase (GUS) reporter gene. Dissection of
the BON1/CPN1 promoter has allowed us to identify a 280 bp promoter region which is
responsive to pathogen and calcium stimuli. Furthermore, we characterized two
BON1/CPN1 T-DNA insertion mutants with altered BON1/CPN1 gene expression.
Although they had T-DNA inserted extremely closed to the BON1/CPN1 transcriptional
start site, these two T-DNA insertion mutants had high, induced levels of BON1/CPN1
transcript and protein accumulation in response to pathogen challenge. This result
suggested the pathogen-responsive region of the BON1/CPN1 promoter may still regulate
BON1/CPN1 expression in a distance across the T-DNA interruption in these two
mutants.
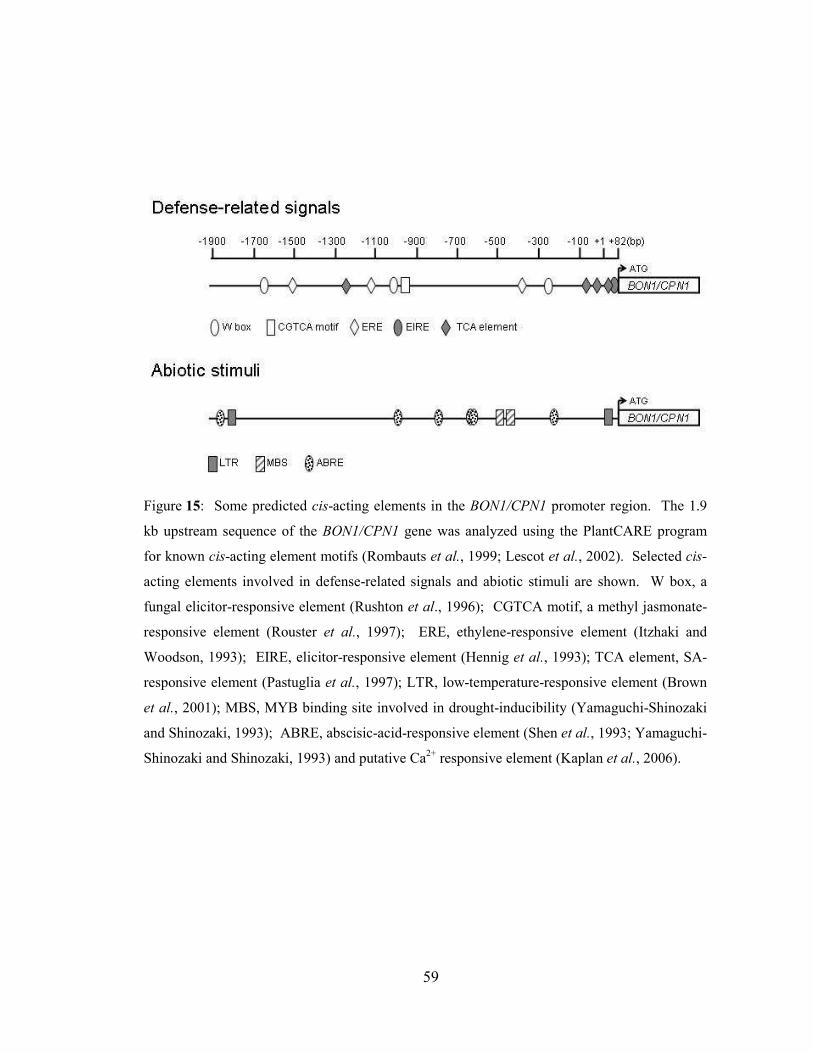
59
Figure 15: Some predicted cis-acting elements in the BON1/CPN1 promoter region. The 1.9
kb upstream sequence of the BON1/CPN1 gene was analyzed using the PlantCARE program
for known cis-acting element motifs (Rombauts et al., 1999; Lescot et al., 2002). Selected cis-
acting elements involved in defense-related signals and abiotic stimuli are shown. W box, a
fungal elicitor-responsive element (Rushton et al., 1996); CGTCA motif, a methyl jasmonate-
responsive element (Rouster et al., 1997); ERE, ethylene-responsive element (Itzhaki and
Woodson, 1993); EIRE, elicitor-responsive element (Hennig et al., 1993); TCA element, SA-
responsive element (Pastuglia et al., 1997); LTR, low-temperature-responsive element (Brown
et al., 2001); MBS, MYB binding site involved in drought-inducibility (Yamaguchi-Shinozaki
and Shinozaki, 1993); ABRE, abscisic-acid-responsive element (Shen et al., 1993; Yamaguchi-
Shinozaki and Shinozaki, 1993) and putative Ca2+ responsive element (Kaplan et al., 2006).
60
5.3 Materials and methods
5.3.1 BON1/CPN1 promoter-GUS fusion constructs and plant transformation
For promoter activity analysis, different lengths of promoter region and the
complete first exon, first intron, and partial second exon (36 bp) of BON1/CPN1 were
translationally fused with the GUS reporter gene. Promoter fragments starting at -1518, -
1118, -718, -318, and -38 relative to the BON1/CPN1 transcriptional start site were
amplified by PCR using following primer pairs. Introduced restriction sites are italicized.
Forward primers were: pF1-1518, 5´-AAGCTTGTTGCTACTCTGGTATGC-3´; pF2-
1118, 5´-AAGCTTCTCACTCTTTCCACCTAC-3´; pF3-718, 5´-
AAGCTTGTGAACCTTACGATTTGT-3´; pF4-318, 5´-
AAGCTTGCTGGAAAGATTATGTCA-3´; and pF5-38, 5´-
AAGCTTGTGGGTCCCATTTACTGC- 3´. The reverse primer used for all constructs
was 5´-TCTAGAGTCGCGGTCTCGCAAATT-3´. PCR fragments were subcloned into
the HindIII-XbaI sites of the binary pBI101 vector. The resulting promoter-GUS fusion
constructs were introduced into wild-type Col-0 plants by Agrobacterium-mediated
transformation using the floral dip method (Clough and Bent, 1998). T2 or T3 plants
from selected transgenic lines were used for histochemical GUS staining experiments.
5.3.2 Bacterial and chemical treatments
Leaf infiltration was performed as described in Chapter 2. For chemical
treatment, leaves of transgenic plants expressing BON1/CPN1 promoter-GUS fusion
61
constructs were infiltrated with 20 µM or 50 µM of calcium ionophore A23187 (Sigma,
St. Louis, MO, USA), and collected at 24 hpi for GUS staining. 0.25% DMSO (dimethyl
sulfoxide; Sigma) was used as the solvent control. For bacterial treatment, 106 cfu/ml of
P. s. t. DC3000 (avrRpt2) strain of bacteria was suspended in 10 mM MgCl2 and used for
leaf infiltration. Mock (10 mM MgCl2) or bacteria-infiltrated leaves were collected 6hpi
or 24 hpi for GUS staining.
5.3.3 Histochemical staining for GUS activity
Leaf samples were fixed in ice-cold 90% acetone on ice for 5 min, then incubated
in a rinse solution containing 50 mM sodium phosphate buffer pH 7.0, 0.5 mM
potassium ferricyanide (Sigma), and 0.5 mM potassium ferrocyanide (Sigma) for 20 min
with gentle shaking at room temperature. Samples were then incubated in 1.5 mM of 5-
bromo-4 chloro-3-indolyl-β-D-glucuronide cyclohexylammonium salt (X-GlcA CHA
salt, Sigma) and 0.05% Triton X-100 prepared in the rinse solution, vacuum infiltrated
for 10 min, and then incubated at 37ºC for 24 h. Stained leaves were washed with 30%
ethanol for 1 h, and then fixed for 1 h in solution containing 50% ethanol, 5% acetic acid,
and 3.7% formaldehyde. Chlorophyll was cleared by several changes of 70% ethanol
following the fixation step.
62
5.3.4 Genomic Southern analysis
Genomic Southern analysis was performed essentially as described previously
(Southern, 1975). Genomic DNA of Col-0, cpn1-2, cpn1-3 mutant plants were digested
with HindIII (New England Biolabs, Ipswich, MA, USA) and separated on a 0.7%
agarose gel. The insert of a plasmid containing the 1.15kb of BON1/CPN1 genomic
fragment starting at -718bp upstream of the BON1/CPN1 transcriptional start site ant
extended 36bp into exon 2 was cut with HindIII-XbaI and used as the probe fragment.
Probe labeling and detection were performed using Phototope-Star Chemiluminescent
Detection Kit (New England Biolabs) according to the manufacturer’s instruction.
5.3.5 Total RNA extraction and semi-quantitative RT-PCR
Total RNA was extracted from Arabidopsis leaf tissues using the RNeasy plant
mini kit (Qiagen, Valencia, Ca, USA). 2 µg of total RNA was used to generate the first-
strand cDNA using the RETROscript kit (Applied Biosystems, Foster City, CA, USA)
following the manufacturer’s instructions. To determine the BON1/CPN1 transcript
abundance in Col-0, cpn1-2, and cpn1-3 mutant plants, PCR primers (5'-
TCTAGAATTATGGGGAATTGTTGCTCCGAT-3' and 5'-
GAATTCTCAATGAAGTTTTTCTAAGTCTGA-3') were used to amplify the
BON1/CPN1 cDNA sequence encoding the C2 domains which produced an 880-bp
product as described (Liu et al., 2005). Introduced XbaI and EcoRI restriction sites are
shown in italics in primer sequences. 18S rRNA primers were used to amplify the 18S
ribosomal RNA as internal standard using the QuantumRNA™ Universal 18S Internal
63
Standard kit (Applied Biosystems). PCR reactions were performed using Advantage® 2
polymerase (Clontech, Mountain View, CA, USA) and the following PCR parameters: 2
min initial denaturation at 95 ºC, 29 cycles of 95 ºC for 30 sec, 58ºC for 30 sec, and 72ºC
for 75 sec. Final extension was at 72ºC for 5 min. RT-PCR products were analyzed by
agarose gel electrophoresis followed by ethidium bromide staining.
5.3.6 In planta bacterial growth analysis
Growth of bacterial culture and bacterial infiltration of Arabidopsis leaves were
conducted as described in Chapter 4. In planta bacterial growth analysis was performed
basically as described (Jambunathan et al., 2001). In short, 105 cfu/ml of P. s. t. DC3000
(avrRpt2) strain of bacteria was suspended in 10mM MgCl2 and used for leaf infiltration.
Bacterially-infiltrated plants were kept at 75% RH conditions for the duration after
bacterial infiltration. Bacteria population in infiltrated leaves was monitored at day 0 and
day 3 after inoculation.
5.4 Results
5.4.1 A 280 bp region of the BON1/CPN1 promoter is required for pathogen-induced
GUS expression
Previous studies have shown that BON1/CPN1 transcript accumulation is
regulated by pathogen stimulus (Jambunathan and McNellis, 2003). To investigate the
pathogen-inducible activity of BON1/CPN1 promoter region and the spatial expression
64
pattern of BON1/CPN1 following pathogen inoculation, we generated a series of
constructs for BON1/CPN1 promoter activity analysis using GUS reporter gene
(Figure 16 A). First of all , for BON1/CPN1 spatial expression analysis, 1.5 kb
BON1/CPN1 promoter fragment, plus the complete first exon, first intron, and partial
second exon (36 bp) of BON1/CPN1, was translationally fused with the GUS reporter
gene (Figure 16 A, construct pF1-1518). The 1.5 kb BON1/CPN1 promoter fragment
extends 177 bp into the 3´ untranslated region of neighboring gene At5g61910. Over 30
independent transgenic Arabidopsis lines carrying the pF1-1518 construct were generated
and analyzed. Of those, 14 lines that showed little or no GUS background activity after
mock inoculation were selected for further experiments. Leaves from these transgenic
plants were infiltrated with 106 cfu/ml of avirulent P. s. t. DC3000 (avrRpt2) bacteria and
histochemically stained for GUS activity at 6 hpi or 24 hpi. The expression of the pF1-
1518 construct was induced by avirulent P. s. t. DC3000 (avrRpt2) as early as 6 hpi in
inoculated leaves (Figure 16 B), which coincided with the timing of BON1/CPN1
transcript accumulation after avirulent bacterial inoculation in previous studies
(Jambunathan and McNellis, 2003). The expression of the pF1-1518 construct was
localized as punctate GUS staining on the inoculated leaves.
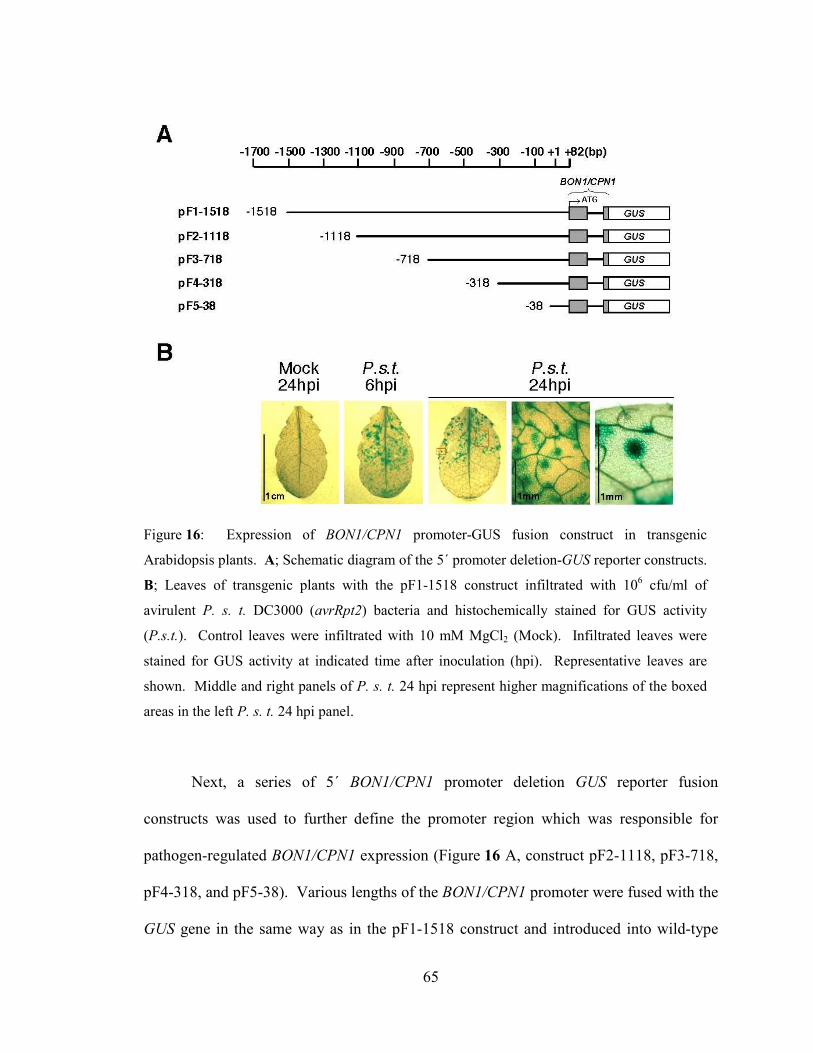
65
Figure 16: Expression of BON1/CPN1 promoter-GUS fusion construct in transgenic
Arabidopsis plants. A; Schematic diagram of the 5´ promoter deletion-GUS reporter constructs.
B; Leaves of transgenic plants with the pF1-1518 construct infiltrated with 106 cfu/ml of
avirulent P. s. t. DC3000 (avrRpt2) bacteria and histochemically stained for GUS activity
(P.s.t.). Control leaves were infiltrated with 10 mM MgCl2 (Mock). Infiltrated leaves were
stained for GUS activity at indicated time after inoculation (hpi). Representative leaves are
shown. Middle and right panels of P. s. t. 24 hpi represent higher magnifications of the boxed
areas in the left P. s. t. 24 hpi panel.
Next, a series of 5´ BON1/CPN1 promoter deletion GUS reporter fusion
constructs was used to further define the promoter region which was responsible for
pathogen-regulated BON1/CPN1 expression (Figure 16 A, construct pF2-1118, pF3-718,
pF4-318, and pF5-38). Various lengths of the BON1/CPN1 promoter were fused with the
GUS gene in the same way as in the pF1-1518 construct and introduced into wild-type
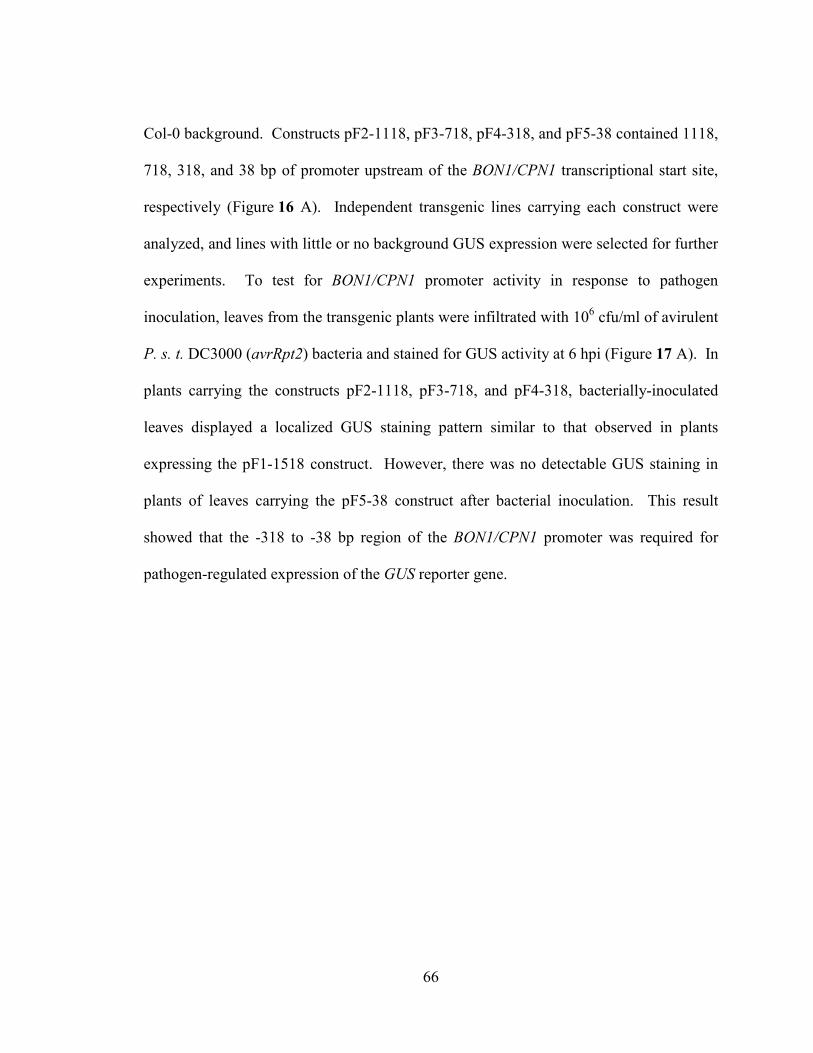
66
Col-0 background. Constructs pF2-1118, pF3-718, pF4-318, and pF5-38 contained 1118,
718, 318, and 38 bp of promoter upstream of the BON1/CPN1 transcriptional start site,
respectively (Figure 16 A). Independent transgenic lines carrying each construct were
analyzed, and lines with little or no background GUS expression were selected for further
experiments. To test for BON1/CPN1 promoter activity in response to pathogen
inoculation, leaves from the transgenic plants were infiltrated with 106 cfu/ml of avirulent
P. s. t. DC3000 (avrRpt2) bacteria and stained for GUS activity at 6 hpi (Figure 17 A). In
plants carrying the constructs pF2-1118, pF3-718, and pF4-318, bacterially-inoculated
leaves displayed a localized GUS staining pattern similar to that observed in plants
expressing the pF1-1518 construct. However, there was no detectable GUS staining in
plants of leaves carrying the pF5-38 construct after bacterial inoculation. This result
showed that the -318 to -38 bp region of the BON1/CPN1 promoter was required for
pathogen-regulated expression of the GUS reporter gene.
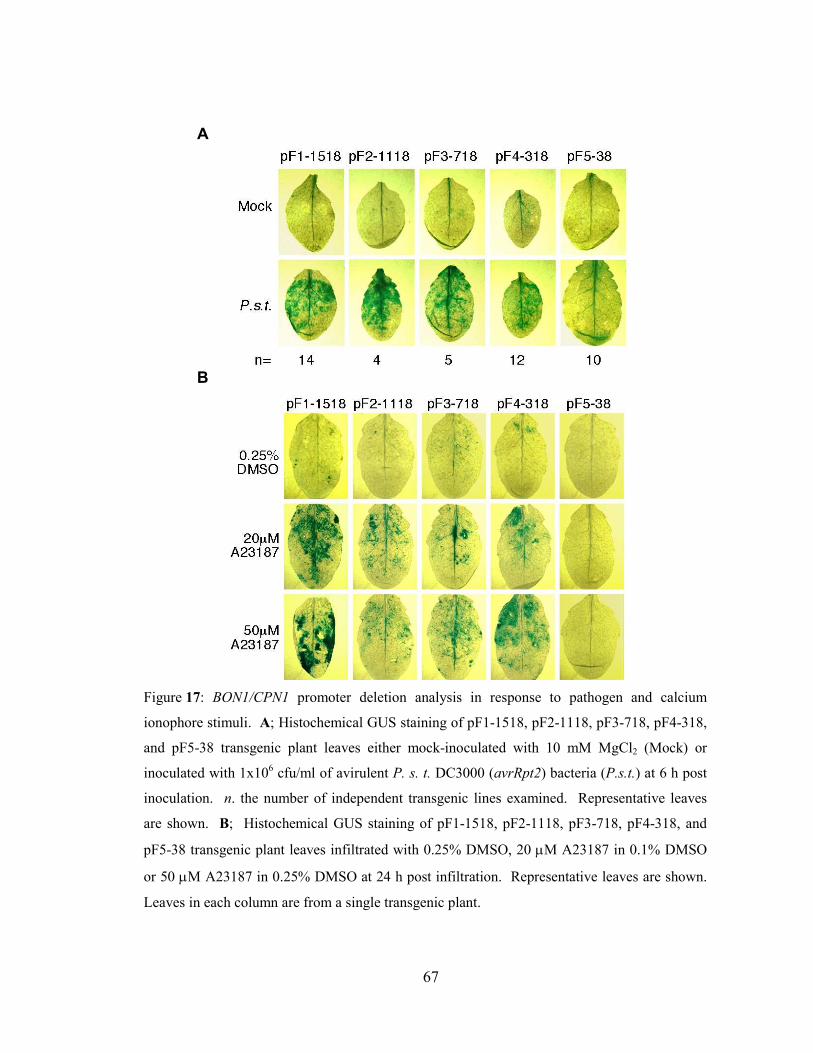
67
A
B
Figure 17: BON1/CPN1 promoter deletion analysis in response to pathogen and calcium
ionophore stimuli. A; Histochemical GUS staining of pF1-1518, pF2-1118, pF3-718, pF4-318,
and pF5-38 transgenic plant leaves either mock-inoculated with 10 mM MgCl2 (Mock) or
inoculated with 1x10⁶ cfu/ml of avirulent P. s. t. DC3000 (avrRpt2) bacteria (P.s.t.) at 6 h post
inoculation. n. the number of independent transgenic lines examined. Representative leaves
are shown. B; Histochemical GUS staining of pF1-1518, pF2-1118, pF3-718, pF4-318, and
pF5-38 transgenic plant leaves infiltrated with 0.25% DMSO, 20 µM A23187 in 0.1% DMSO
or 50 µM A23187 in 0.25% DMSO at 24 h post infiltration. Representative leaves are shown.
Leaves in each column are from a single transgenic plant.
68
5.4.2 A 280 bp region of the BON1/CPN1 promoter is required for calcium
ionophore-induced GUS expression
The presence of putative Ca2+-responsive elements in the BON1/CPN1 promoter
region suggests that expression of BON1/CPN1 might be responsive to Ca2+
stimulus.
We speculated that BON1/CPN1 expression could be regulated by calcium influx. To
test our hypothesis, leaves from transgenic plants carrying the 5´ promoter deletion
reporter constructs described above were infiltrated with 20 µM or 50 µM of calcium
ionophore A23187 and stained for GUS activity at 24 hpi (Figure 17 B). Transgenic
plant leaves showed little or no GUS expression after infiltration with 0.25% DMSO,
which served as the solvent control and contained the same amount of DMSO as 50 µM
A23187. In plants carrying the constructs pF1-1518, pF2-1118, pF3-718, and pF4-318,
leaves showed GUS expression at 24 h after infiltration with A23187. However, there
was no detectable GUS staining in leaves carrying the pF5-38 construct after 20 µM or
50 µM of A23187 treatment. This result shows that BON1/CPN1 promoter-GUS fusion
gene expression was inducible by the calcium ionophore A23187. Furthermore, the -318
to -38 bp region of the BON1/CPN1 promoter was required for calcium ionophore-
induced expression of the GUS reporter gene.
5.4.3 Over-accumulation of BON1/CPN1 in two BON1/CPN1 promoter T-DNA
insertion mutants
In an attempt to isolate mutants with altered BON1/CPN1 gene expression, we
obtained two mutants with T-DNA inserted in the BON1/CPN1 promoter region from the
69
SAIL T-DNA insertion line collection
(http://www.tmri.org/en/partnership/sail_collection.aspx) (Sessions et al., 2002). The
mutants SAIL_865_A09 and SAIL_723_E11 had T-DNA insertions at 348 bp and 38 bp
upstream of the BON1/CPN1 transcriptional start site and were designated as cpn1-2 and
cpn1-3, respectively. Despite the large T-DNAs inserted extremely close to the
BON1/CPN1 transcriptional start site, cpn1-2 and cpn1-3 mutants grew like wild-type
plants under LH/LT conditions (Figure 18 A) and HH/HT conditions (data not shown).
Southern blotting confirmed the presence of T-DNA insertions in the BON1/CPN1
promoter regions of cpn1-2 and cpn1-3 (Figure 18 B and C). The probe hybridized to
different sized HindIII genomic fragments in Col-0 wild-type, cpn1-2 and cpn1-3 mutant
DNA samples due to the introduced internal HindIII site on the T-DNA (Figure 18 C).
These results confirmed the T-DNA locations in cpn1-2 and cpn1-3 relative to the
BON1/CPN1 transcriptional start site. Only one band was detected in the cpn1-2 and
cpn1-3 mutants on the genomic Southern blot, corresponding to the portion of the probe
hybridizing to the BON1/CPN1 transcribed region. No bands corresponding to the
portion of the BON1/CPN1 promoter on the far side of the T-DNA insertions were
observed.
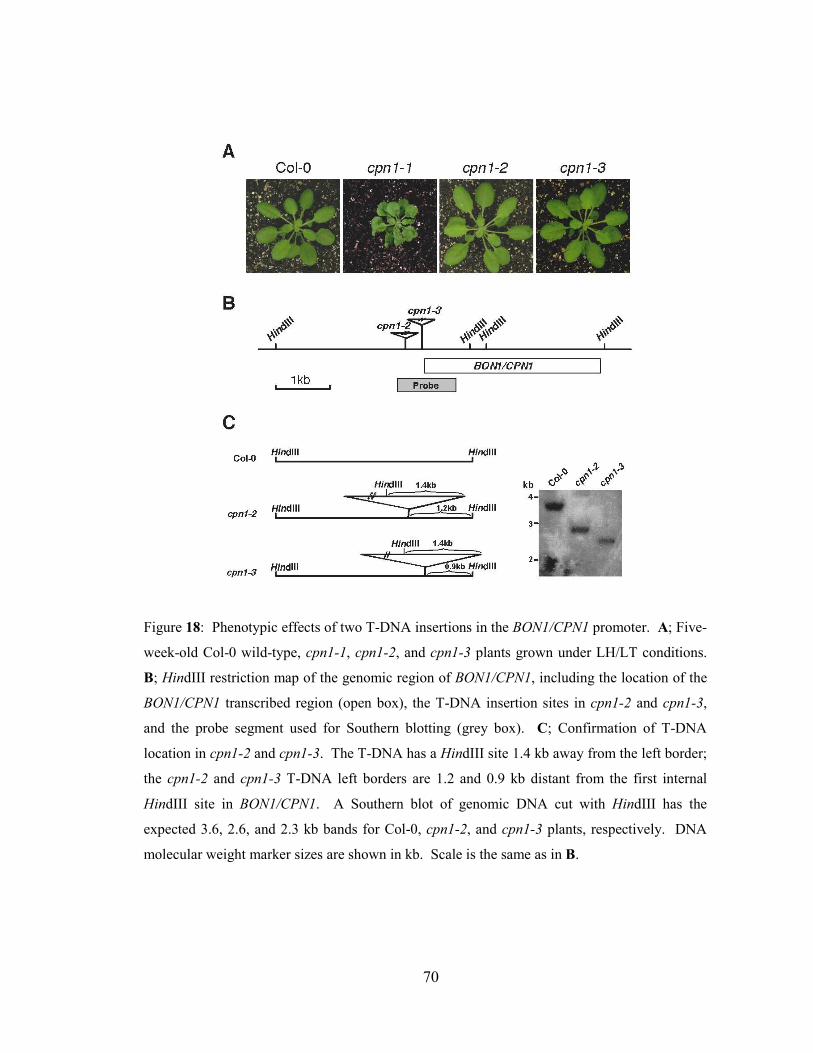
70
Figure 18: Phenotypic effects of two T-DNA insertions in the BON1/CPN1 promoter. A; Five-
week-old Col-0 wild-type, cpn1-1, cpn1-2, and cpn1-3 plants grown under LH/LT conditions.
B; HindIII restriction map of the genomic region of BON1/CPN1, including the location of the
BON1/CPN1 transcribed region (open box), the T-DNA insertion sites in cpn1-2 and cpn1-3,
and the probe segment used for Southern blotting (grey box). C; Confirmation of T-DNA
location in cpn1-2 and cpn1-3. The T-DNA has a HindIII site 1.4 kb away from the left border;
the cpn1-2 and cpn1-3 T-DNA left borders are 1.2 and 0.9 kb distant from the first internal
HindIII site in BON1/CPN1. A Southern blot of genomic DNA cut with HindIII has the
expected 3.6, 2.6, and 2.3 kb bands for Col-0, cpn1-2, and cpn1-3 plants, respectively. DNA
molecular weight marker sizes are shown in kb. Scale is the same as in B.
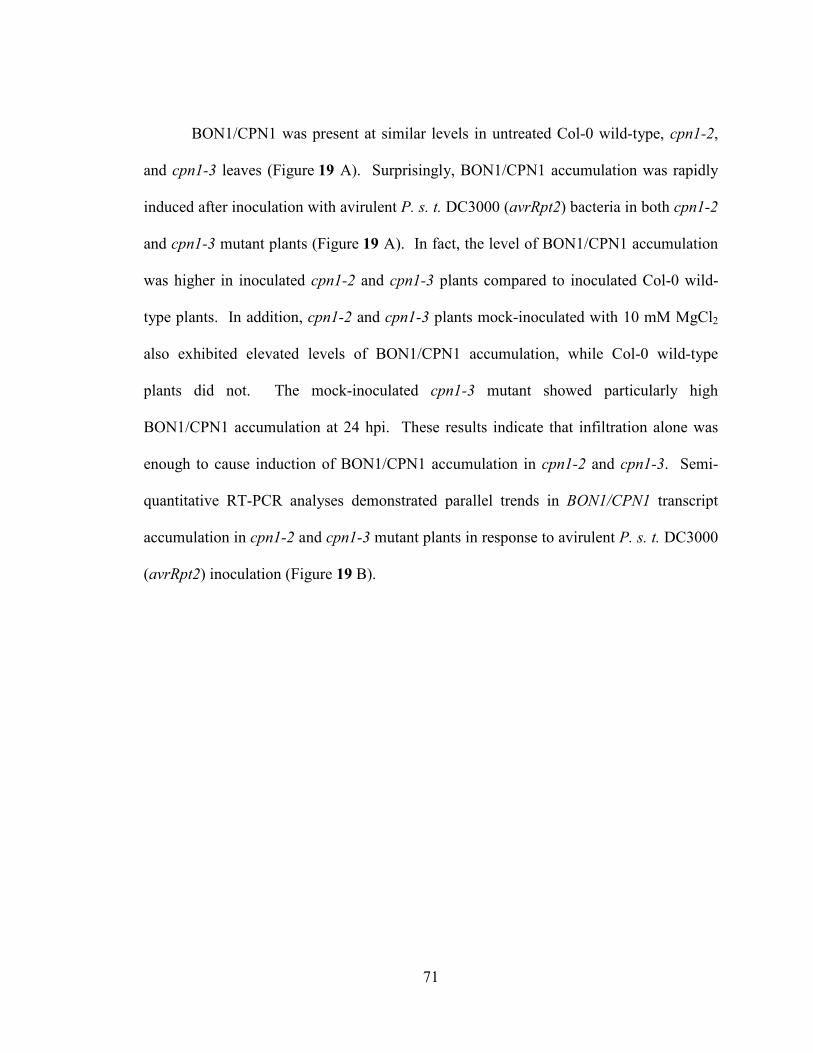
71
BON1/CPN1 was present at similar levels in untreated Col-0 wild-type, cpn1-2,
and cpn1-3 leaves (Figure 19 A). Surprisingly, BON1/CPN1 accumulation was rapidly
induced after inoculation with avirulent P. s. t. DC3000 (avrRpt2) bacteria in both cpn1-2
and cpn1-3 mutant plants (Figure 19 A). In fact, the level of BON1/CPN1 accumulation
was higher in inoculated cpn1-2 and cpn1-3 plants compared to inoculated Col-0 wild-
type plants. In addition, cpn1-2 and cpn1-3 plants mock-inoculated with 10 mM MgCl2
also exhibited elevated levels of BON1/CPN1 accumulation, while Col-0 wild-type
plants did not. The mock-inoculated cpn1-3 mutant showed particularly high
BON1/CPN1 accumulation at 24 hpi. These results indicate that infiltration alone was
enough to cause induction of BON1/CPN1 accumulation in cpn1-2 and cpn1-3. Semi-
quantitative RT-PCR analyses demonstrated parallel trends in BON1/CPN1 transcript
accumulation in cpn1-2 and cpn1-3 mutant plants in response to avirulent P. s. t. DC3000
(avrRpt2) inoculation (Figure 19 B).
72
A
B
C
Figure 19: Overexpression of BON1/CPN1 in cpn1-2 and cpn1-3 mutants. A; BON1/CPN1
accumulation in Col-0, cpn1-2, and cpn1-3 plants that were uninoculated (Un), mock-
inoculated with 10 mM MgCl2 (M), or after inoculation with 106 cfu/ml of avirulent P. s. t.
DC3000 (avrRpt2) bacteria (P), at 6 and 24 h after inoculation. Arrows indicate BON1/CPN1
position. B; Semi-quantitative RT-PCR detection of BON1/CPN1 transcript accumulation in
Col-0 wild-type, cpn1-2, and cpn1-3 plants at 6 and 24 h after infiltration with 10 mM MgCl2
(M) or 106 cfu/ml of avirulent P. s. t. DC3000 (avrRpt2) bacteria (P). 18S, 18S rRNA internal
control. C; Populations of virulent P. s. t. DC3000 bacteria in Col-0, cpn1-1, cpn1-2, and cpn1-
3 plants at 0 and 3 days after infiltration with 105 cfu/ml of virulent P. s. t. DC3000 bacteria.
73
Since BON1/CPN1 is postulated to be a suppressor of plant defense, we
hypothesized that the elevated levels of BON1/CPN1 in cpn1-2 and cpn1-3 mutant plants
might suppress plant disease resistance. The growth of virulent P. s. t. DC3000 bacteria
was monitored in leaves of LH/LT-grown Col-0, cpn1-1, cpn1-2, and cpn1-3 plants on
day 0 and day 3 after inoculation with 105 cfu/ml of bacteria (Figure 19 C). On day 3
post-inoculation, the growth of P. s. t. DC3000 bacteria was reduced by 10 fold in cpn1-1
mutant plants when compared with wild-type Col-0 plants as expected. In contrast, the
growth of P. s. t. DC3000 bacteria in cpn1-2 and cpn1-3 plants was similar to that in
wild-type Col-0 plants. This experiment was repeated several times with similar results,
and was repeated with virulent and avirulent strains of P. s. t. and P. s. pv. maculicola
with similar results.
5.5 Discussion
Our 5´ promoter deletion analysis of BON1/CPN1 revealed a 280 bp promoter
region (-318 bp to -38 bp upstream of the transcription start site) that was required for
pathogen- and calcium-responsive GUS expression. On the other hand, pathogen-
induced BON1/CPN1 protein accumulation was observed in the cpn1-3 mutant despite a
T-DNA inserted at -38 bp upstream of the transcription start site of BON1/CPN1. In
other words, while the 38 bp length of promoter region was not sufficient to direct
pathogen-inducible GUS expression, the T-DNA insertion at -38 did not abolish
pathogen-induced BON1/CPN1 accumulation in cpn1-3. This suggests that the 280 bp
pathogen-responsive portion of the BON1/CPN1 promoter may be able to direct
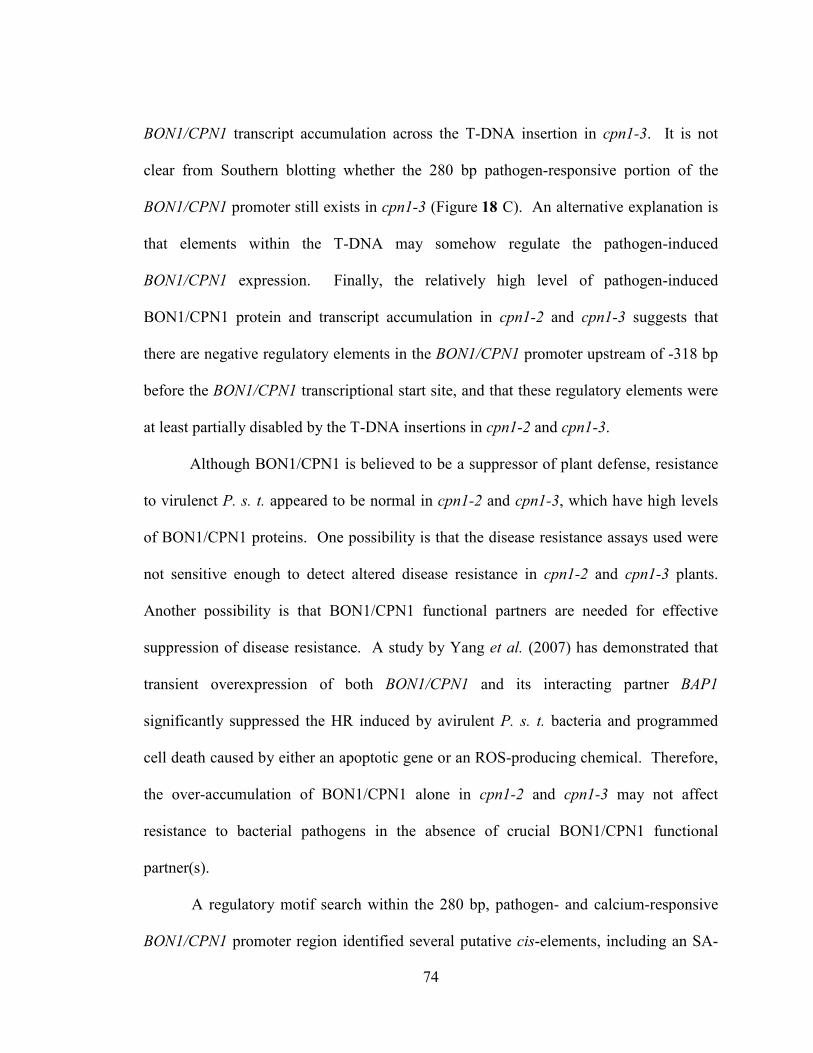
74
BON1/CPN1 transcript accumulation across the T-DNA insertion in cpn1-3. It is not
clear from Southern blotting whether the 280 bp pathogen-responsive portion of the
BON1/CPN1 promoter still exists in cpn1-3 (Figure 18 C). An alternative explanation is
that elements within the T-DNA may somehow regulate the pathogen-induced
BON1/CPN1 expression. Finally, the relatively high level of pathogen-induced
BON1/CPN1 protein and transcript accumulation in cpn1-2 and cpn1-3 suggests that
there are negative regulatory elements in the BON1/CPN1 promoter upstream of -318 bp
before the BON1/CPN1 transcriptional start site, and that these regulatory elements were
at least partially disabled by the T-DNA insertions in cpn1-2 and cpn1-3.
Although BON1/CPN1 is believed to be a suppressor of plant defense, resistance
to virulenct P. s. t. appeared to be normal in cpn1-2 and cpn1-3, which have high levels
of BON1/CPN1 proteins. One possibility is that the disease resistance assays used were
not sensitive enough to detect altered disease resistance in cpn1-2 and cpn1-3 plants.
Another possibility is that BON1/CPN1 functional partners are needed for effective
suppression of disease resistance. A study by Yang et al. (2007) has demonstrated that
transient overexpression of both BON1/CPN1 and its interacting partner BAP1
significantly suppressed the HR induced by avirulent P. s. t. bacteria and programmed
cell death caused by either an apoptotic gene or an ROS-producing chemical. Therefore,
the over-accumulation of BON1/CPN1 alone in cpn1-2 and cpn1-3 may not affect
resistance to bacterial pathogens in the absence of crucial BON1/CPN1 functional
partner(s).
A regulatory motif search within the 280 bp, pathogen- and calcium-responsive
BON1/CPN1 promoter region identified several putative cis-elements, including an SA-
75
responsive TCA element, an elicitor-responsive W box, and an ABRE element which
may be responsive to Ca2+
stimulus (Rushton et al., 1996; Pastuglia et al., 1997; Kaplan
et al., 2006). Our results are in accordance with studies of several plant C2 domain-
containing proteins, which are regulated transcriptionally by calcium signals and various
abiotic and biotic stresses (Kim et al., 2003; Ouelhadj et al., 2006; Kim et al., 2008). The
need for specific regulation of the expression of these C2-domain containing proteins by
stress or pathogen-related stimuli reflects their biological functions as calcium sensors,
which determine the specificity of calcium signaling by perceiving and relaying calcium
signals precisely for the right biological outcome. Certainly, more detailed promoter
analysis will be needed to verify the functional regulatory sequences within the 280 bp
pathogen- and calcium-responsive section of the BON1/CPN1 promoter.
76
Chapter 6
Conclusions and future directions
Based on currently available information about BON1/CPN1, I propose a working
model for BON1/CPN1 function (Figure 20). In wild-type Col-0 plants, BON1/CPN1
negatively regulates SNC1 (Yang and Hua, 2004) by preventing the activation of SNC1
by intracellular Ca2+ fluxes induced by low temperature, A23187, pathogens, and
possibly low humidity. In the absence of BON1/CPN1 (in cpn1-1 mutant plants),
cytosolic Ca2+ perturbations triggered by calcium ionophore A23187, low temperature, or
pathogen inoculation activate SNC1. This model explains the conditional nature of the
cpn1-1 mutant phenotype: the cpn1-1 mutant phenotype observed under non-permissive
growth conditions may result from inappropriate defense activation in response to Ca2+
fluxes triggered by low temperature and possibly by low humidity. This model explains
the ability of calcium ionophore A23187 to trigger PR gene expression in cpn1-1, and the
ability of avirulent pathogens, like P. s. t. DC3000 (avrRpt2) to trigger an accelerated HR
in cpn1-1 (Jambunathan et al., 2001). The model is also consistent with the proposed
function of copines as Ca2+-sensitive membrane trafficking and signal transduction
proteins.
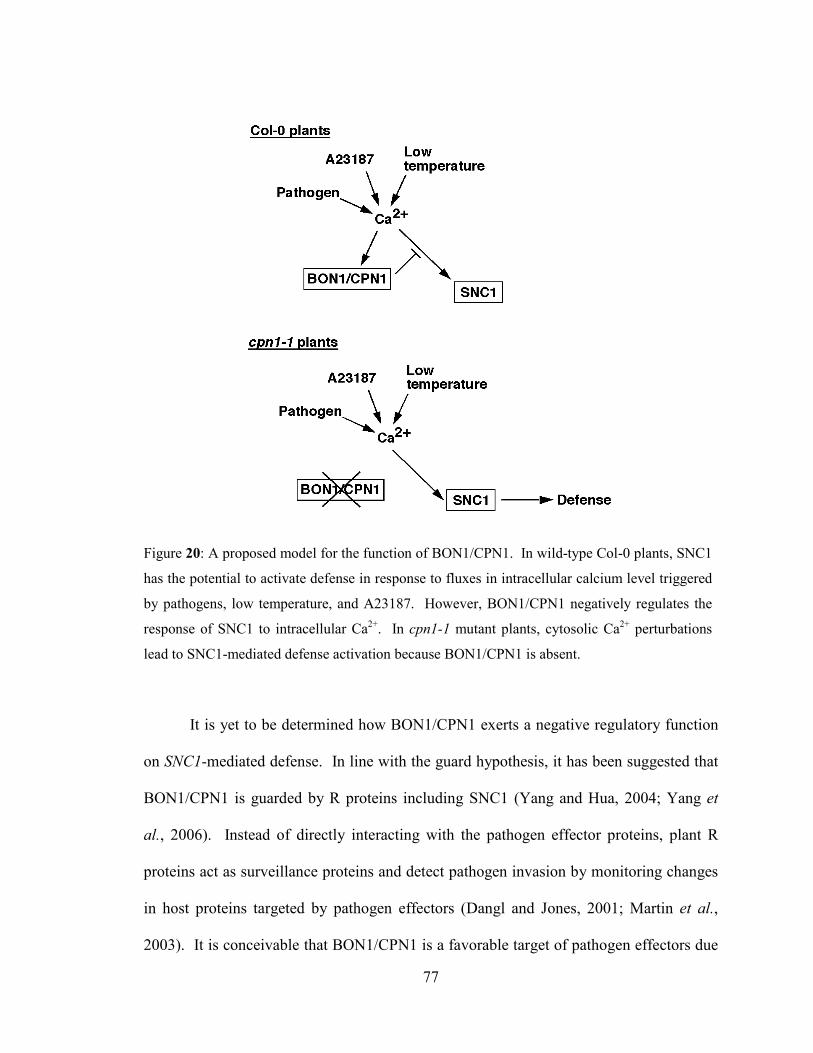
77
Figure 20: A proposed model for the function of BON1/CPN1. In wild-type Col-0 plants, SNC1
has the potential to activate defense in response to fluxes in intracellular calcium level triggered
by pathogens, low temperature, and A23187. However, BON1/CPN1 negatively regulates the
response of SNC1 to intracellular Ca2+. In cpn1-1 mutant plants, cytosolic Ca
2+ perturbations
lead to SNC1-mediated defense activation because BON1/CPN1 is absent.
It is yet to be determined how BON1/CPN1 exerts a negative regulatory function
on SNC1-mediated defense. In line with the guard hypothesis, it has been suggested that
BON1/CPN1 is guarded by R proteins including SNC1 (Yang and Hua, 2004; Yang et
al., 2006). Instead of directly interacting with the pathogen effector proteins, plant R
proteins act as surveillance proteins and detect pathogen invasion by monitoring changes
in host proteins targeted by pathogen effectors (Dangl and Jones, 2001; Martin et al.,
2003). It is conceivable that BON1/CPN1 is a favorable target of pathogen effectors due
78
to its crucial role in cell death regulation and Ca2+ signaling. Among many known host
target proteins, Arabidopsis RIN4 protein is the best characterized "guardee", which is
guarded by at least two R proteins RPM1 and RPS2 (Chisholm et al., 2006).
Phosphorylation or elimination of the RIN4 protein by avirulent (Avr) effectors activate
the RPS2- or RPM1-dependent defense responses (Mackey et al., 2002; Axtell and
Staskawicz, 2003; Mackey et al., 2003). Assuming BON1/CPN1 is a host protein
guarded by SNC1, it is possible that BON1/CPN1 is targeted and modified by pathogen
effector proteins via similar mechanisms such as proteolytic degradation and
phosphorylation. Another possible scenario is that SNC1 monitors the change in the
subcellular localization of BON1/CPN1 protein caused by pathogen effectors as
suggested by BON1/CPN1 localization studies (Appendix B and (Liu, 2007). However,
it will be challenging to investigate the mechanism of SNC1 surveillance of BON1/CPN1
because the cognate Avr protein recognized by SNC1 is not known. Future work to
identify the pathogen effector protein for SNC1 and how BON1/CPN1 is modified will
help to elucidate the functional relationship between BON1/CPN1 and SNC1.
We have identified a 280 bp promoter region that directs the pathogen- and
calcium-inducible BON1/CPN1 promoter activity. Detailed deletion analysis of this
specific region will help to identify the functional regulatory sequences that are responsive
to pathogen and/or calcium signals. On the other hand, our results have provided more
information regarding the transcriptional factors involved in BON1/CPN1 regulation
based on these cis-acting regulatory elements predicted within the 280bp promoter
region. For instance, the elicitor-responsive W box is known to be the binding site for
members of the WRKY family of transcriptional factors (Rushton et al., 1996).
79
Moreover, the ABRE motif has shown to be the binding site of CAMTAs factors, a
newly identified family of calcium-dependent, calmodulin-binding transcriptial factors
(Bouche et al., 2002; Yang and Poovaiah, 2002; Mitsuda et al., 2003; Choi et al., 2005).
A sensible step after defining the pathogen- and calcium-responsive elements in
the BON1/CPN1 promoter region is to identify the transcription factors that specifically
bind with these regulatory sequences. By using yeast one-hybrid system, an in vivo
genetic assay designed for isolating DNA-binding proteins (Li and Herskowitz, 1993),
we will be able to determine the identity of the transcriptional factors that interact with
the pathogen-reponsive cis-acting element on the BON1/CPN1 promoter. Since the
detection of the DNA-protein interaction occurs in vivo while proteins are in their native
configurations, the one-hybrid assay offers high sensitivity to detect protein-DNA
association. Moreover, the genes encoding the DNA-binding proteins can be obtained
quickly after library screening. These results will provide important insights about the
transcriptional regulation of BON1/CPN1 and roles of the transcriptional factors in
defense and Ca2+ signaling.
Another important task in the future will be the identification of the BON1/CPN1
downstream target proteins in Ca2+ signaling. Our data support the proposed function of
Arabidopsis copines as Ca2+-responsive signal transduction proteins that perceive and
relay Ca2+ signals in response to abiotic and biotic stimuli. Since perturbation of
intracellular Ca2+ levels by cold or calcium ionophore leads to defense activation in the
absence of BON1/CPN1, BON1/CPN1 is essential for normal Ca2+ responses and the
maintenance of Ca2+ signaling specificity. Subsequently, the specificity of Ca
2+ signaling
also depends on a specific set of Ca2+ sensors and their target proteins that coordinate and
80
function together in an orderly and timely fashion in the cells.
In order to identify potential interactors of BON1/CPN1, a yeast two-hybrid assay
has been employed in previous studies and the C2-domain containing protein BAP1 was
characterized as interacting with and possibly functioning together with BON1/CPN1
(Hua et al., 2001; Yang et al., 2006a). However, the design of yeast two-hybrid
screening can only detect the interaction between two proteins, hence limiting the ability
to isolate interacting proteins that require the formation of a multi-subunit protein
complex in actual cellular situations. In this case, a pull-down assay by affinity
chromatography which utilizes the anti-BON1/CPN1 antibody we generated will allow us
to isolate BON1/CPN1-interacting proteins/protein complexes which may be present
particularly during incompatible or compatible plant-pathogen interactions. Following
affinity chromatography, protein sequencing by mass spectrometry can determine the
identity of the interacting proteins (Chen et al., 2006; Soo et al., 2007). The advantage of
using the anti-BON1/CPN1 antibody that specifically recognizes BON1/CPN1 in a pull-
down assay is the ability to avoid any artificial effect that could arise due to the
overexpression of epitope-tagged BON1/CPN1 in transgenic plants. Certainly, more
characterization of the interacting mechanism between BON1/CPN1 and its associating
protein/protein complex is needed. The establishment of functional relationships between
BON1/CPN1 and downstream target proteins will help to decipher the corresponding
Ca2+ signaling cascades mediated by BON1/CPN1.
81
Bibliography
Aarts, N., Metz, M., Holub, E., Staskawicz, B.J., Daniels, M.J., and Parker, J.E. (1998). Different requirements for EDS1 and NDR1 by disease resistance genes
define at least two R gene-mediated signaling pathways in Arabidopsis. Proc Natl
Acad Sci U S A 95, 10306-10311.
Axtell, M.J., and Staskawicz, B.J. (2003). Initiation of RPS2-specified disease
resistance in Arabidopsis is coupled to the AvrRpt2-directed elimination of RIN4.
Cell 112, 369-377.
Berg, R.H., and Beachy, R.N. (2008). Fluorescent protein applications in plants.
Methods Cell Biol 85, 153-177.
Berube, B., Coutu, L., Lefievre, L., Begin, S., Dupont, H., and Sullivan, R. (1994).
The elimination of keratin artifacts in immunoblots probed with polyclonal
antibodies. Anal Biochem 217, 331-333.
Beynon, J., and Dickinson, M. (2000). Molecular plant pathology. (SheffieldBoca
Raton, FL: Sheffield Academic Press ;CRC Press).
Bhat, R.A., Miklis, M., Schmelzer, E., Schulze-Lefert, P., and Panstruga, R. (2005).
Recruitment and interaction dynamics of plant penetration resistance components
in a plasma membrane microdomain. Proc Natl Acad Sci U S A 102, 3135-3140.
Borner, G.H., Sherrier, D.J., Weimar, T., Michaelson, L.V., Hawkins, N.D.,
Macaskill, A., Napier, J.A., Beale, M.H., Lilley, K.S., and Dupree, P. (2005).
Analysis of detergent-resistant membranes in Arabidopsis. Evidence for plasma
membrane lipid rafts. Plant Physiol 137, 104-116.
Bouche, N., Scharlat, A., Snedden, W., Bouchez, D., and Fromm, H. (2002). A novel
family of calmodulin-binding transcription activators in multicellular organisms. J
Biol Chem 277, 21851-21861.
Brown, A.P., Dunn, M.A., Goddard, N.J., and Hughes, M.A. (2001). Identification of
a novel low-temperature-response element in the promoter of the barley
(Hordeum vulgare L) gene blt101.1. Planta 213, 770-780.
Burnette, W.N. (1981). "Western blotting": electrophoretic transfer of proteins from
sodium dodecyl sulfate--polyacrylamide gels to unmodified nitrocellulose and
radiographic detection with antibody and radioiodinated protein A. Anal Biochem
112, 195-203.
Century, K.S., Holub, E.B., and Staskawicz, B.J. (1995). NDR1, a locus of
Arabidopsis thaliana that is required for disease resistance to both a bacterial and
a fungal pathogen. Proc Natl Acad Sci U S A 92, 6597-6601.
Century, K.S., Shapiro, A.D., Repetti, P.P., Dahlbeck, D., Holub, E., and
Staskawicz, B.J. (1997). NDR1, a pathogen-induced component required for
Arabidopsis disease resistance. Science 278, 1963-1965.
Chen, Y.M., Ferrar, T.S., Lohmeier-Vogel, E.M., Morrice, N., Mizuno, Y.,
Berenger, B., Ng, K.K., Muench, D.G., and Moorhead, G.B. (2006). The PII
82
signal transduction protein of Arabidopsis thaliana forms an arginine-regulated
complex with plastid N-acetyl glutamate kinase. J Biol Chem 281, 5726-5733.
Chisholm, S.T., Coaker, G., Day, B., and Staskawicz, B.J. (2006). Host-microbe
interactions: shaping the evolution of the plant immune response. Cell 124, 803-
814.
Choi, M.S., Kim, M.C., Yoo, J.H., Moon, B.C., Koo, S.C., Park, B.O., Lee, J.H., Koo,
Y.D., Han, H.J., Lee, S.Y., Chung, W.S., Lim, C.O., and Cho, M.J. (2005).
Isolation of a calmodulin-binding transcription factor from rice (Oryza sativa L.).
J Biol Chem 280, 40820-40831.
Church, D.L., and Lambie, E.J. (2003). The promotion of gonadal cell divisions by the
Caenorhabditis elegans TRPM cation channel GON-2 is antagonized by GEM-4
copine. Genetics 165, 563-574.
Cleland, W.W. (1964). Dithiothreitol, a New Protective Reagent for Sh Groups.
Biochemistry 3, 480-482.
Clough, S.J., and Bent, A.F. (1998). Floral dip: a simplified method for Agrobacterium-
mediated transformation of Arabidopsis thaliana. Plant J 16, 735-743.
Creutz, C.E., Tomsig, J.L., Snyder, S.L., Gautier, M.C., Skouri, F., Beisson, J., and
Cohen, J. (1998). The copines, a novel class of C2 domain-containing, calcium-
dependent, phospholipid-binding proteins conserved from Paramecium to
humans. J Biol Chem 273, 1393-1402.
Curtis, M.D., and Grossniklaus, U. (2003). A gateway cloning vector set for high-
throughput functional analysis of genes in planta. Plant Physiol 133, 462-469.
Damer, C.K., Bayeva, M., Hahn, E.S., Rivera, J., and Socec, C.I. (2005). Copine A, a
calcium-dependent membrane-binding protein, transiently localizes to the plasma
membrane and intracellular vacuoles in Dictyostelium. BMC Cell Biol 6, 46.
Damer, C.K., Bayeva, M., Kim, P.S., Ho, L.K., Eberhardt, E.S., Socec, C.I., Lee,
J.S., Bruce, E.A., Goldman-Yassen, A.E., and Naliboff, L.C. (2007). Copine A
is required for cytokinesis, contractile vacuole function, and development in
Dictyostelium. Eukaryot Cell 6, 430-442.
Dangl, J.L., and Jones, J.D. (2001). Plant pathogens and integrated defence responses to
infection. Nature 411, 826-833.
Davis, S.J., and Vierstra, R.D. (1998). Soluble, highly fluorescent variants of green
fluorescent protein (GFP) for use in higher plants. Plant Mol Biol 36, 521-528.
Dong, X. (1998). SA, JA, ethylene, and disease resistance in plants. Curr Opin Plant Biol
1, 316-323.
Durrant, W.E., and Dong, X. (2004). Systemic acquired resistance. Annu Rev
Phytopathol 42, 185-209.
Flor, H.H. (1971). Current Status of the Gene-For-Gene Concept. Annual Review of
Phytopathology 9, 275-296.
Frye, C.A., and Innes, R.W. (1998). An Arabidopsis mutant with enhanced resistance to
powdery mildew. Plant Cell 10, 947-956.
Frye, C.A., Tang, D., and Innes, R.W. (2001). Negative regulation of defense responses
in plants by a conserved MAPKK kinase. Proc Natl Acad Sci U S A 98, 373-378.
83
Garcia-Brugger, A., Lamotte, O., Vandelle, E., Bourque, S., Lecourieux, D.,
Poinssot, B., Wendehenne, D., and Pugin, A. (2006). Early signaling events
induced by elicitors of plant defenses. Mol Plant Microbe Interact 19, 711-724.
Gottschalk, A., Almedom, R.B., Schedletzky, T., Anderson, S.D., Yates, J.R., 3rd,
and Schafer, W.R. (2005). Identification and characterization of novel nicotinic
receptor-associated proteins in Caenorhabditis elegans. EMBO J 24, 2566-2578.
Greenberg, J.T. (1997). Programmed Cell Death in Plant-Pathogen Interactions. Annu
Rev Plant Physiol Plant Mol Biol 48, 525-545.
Grennan, A.K. (2007). Lipid rafts in plants. Plant Physiol 143, 1083-1085.
Harmon, A.C., Gribskov, M., and Harper, J.F. (2000). CDPKs - a kinase for every
Ca2+ signal? Trends Plant Sci 5, 154-159.
Harper, J.F., Breton, G., and Harmon, A. (2004). Decoding Ca(2+) signals through
plant protein kinases. Annu Rev Plant Biol 55, 263-288.
Hartley, J.L., Temple, G.F., and Brasch, M.A. (2000). DNA cloning using in vitro site-
specific recombination. Genome Res 10, 1788-1795.
Haseloff, J., Siemering, K.R., Prasher, D.C., and Hodge, S. (1997). Removal of a
cryptic intron and subcellular localization of green fluorescent protein are
required to mark transgenic Arabidopsis plants brightly. Proc Natl Acad Sci U S
A 94, 2122-2127.
Hawes, M.C., Gunawardena, U., Miyasaka, S., and Zhao, X. (2000). The role of root
border cells in plant defense. Trends Plant Sci 5, 128-133.
Hennig, J., Dewey, R.E., Cutt, J.R., and Klessig, D.F. (1993). Pathogen, salicylic acid
and developmental dependent expression of a beta-1,3-glucanase/GUS gene
fusion in transgenic tobacco plants. Plant J 4, 481-493.
Hepler, P.K. (2005). Calcium: a central regulator of plant growth and development.
Plant Cell 17, 2142-2155.
Hetherington, A.M., and Brownlee, C. (2004). The generation of Ca(2+) signals in
plants. Annu Rev Plant Biol 55, 401-427.
Hua, J., Grisafi, P., Cheng, S.H., and Fink, G.R. (2001). Plant growth homeostasis is
controlled by the Arabidopsis BON1 and BAP1 genes. Genes Dev 15, 2263-2272.
Innes, R.W., Bent, A.F., Kunkel, B.N., Bisgrove, S.R., and Staskawicz, B.J. (1993).
Molecular analysis of avirulence gene avrRpt2 and identification of a putative
regulatory sequence common to all known Pseudomonas syringae avirulence
genes. J Bacteriol 175, 4859-4869.
Itzhaki, H., and Woodson, W.R. (1993). Characterization of an ethylene-responsive
glutathione S-transferase gene cluster in carnation. Plant Mol Biol 22, 43-58.
Jambunathan, N., and McNellis, T.W. (2003). Regulation of Arabidopsis COPINE 1
gene expression in response to pathogens and abiotic stimuli. Plant Physiol 132,
1370-1381.
Jambunathan, N., Siani, J.M., and McNellis, T.W. (2001). A humidity-sensitive
Arabidopsis copine mutant exhibits precocious cell death and increased disease
resistance. Plant Cell 13, 2225-2240.
Jefferson, R.A. (1989). The GUS reporter gene system. Nature 342, 837-838.
Kaplan, B., Davydov, O., Knight, H., Galon, Y., Knight, M.R., Fluhr, R., and
Fromm, H. (2006). Rapid transcriptome changes induced by cytosolic Ca2+
84
transients reveal ABRE-related sequences as Ca2+-responsive cis elements in
Arabidopsis. Plant Cell 18, 2733-2748.
Kim, C.Y., Koo, Y.D., Jin, J.B., Moon, B.C., Kang, C.H., Kim, S.T., Park, B.O., Lee,
S.Y., Kim, M.L., Hwang, I., Kang, K.Y., Bahk, J.D., and Cho, M.J. (2003).
Rice C2-domain proteins are induced and translocated to the plasma membrane in
response to a fungal elicitor. Biochemistry 42, 11625-11633.
Kim, M.C., Panstruga, R., Elliott, C., Muller, J., Devoto, A., Yoon, H.W., Park,
H.C., Cho, M.J., and Schulze-Lefert, P. (2002). Calmodulin interacts with MLO
protein to regulate defence against mildew in barley. Nature 416, 447-451.
Kim, Y.C., Kim, S.Y., Choi, D., Ryu, C.M., and Park, J.M. (2008). Molecular
characterization of a pepper C2 domain-containing SRC2 protein implicated in
resistance against host and non-host pathogens and abiotic stresses. Planta 227,
1169-1179.
Knight, M.R., Campbell, A.K., Smith, S.M., and Trewavas, A.J. (1991). Transgenic
plant aequorin reports the effects of touch and cold-shock and elicitors on
cytoplasmic calcium. Nature 352, 524-526.
Kunkel, B.N., Bent, A.F., Dahlbeck, D., Innes, R.W., and Staskawicz, B.J. (1993).
RPS2, an Arabidopsis disease resistance locus specifying recognition of
Pseudomonas syringae strains expressing the avirulence gene avrRpt2. Plant Cell
5, 865-875.
Kurien, B.T., and Scofield, R.H. (2003). Protein blotting: a review. J Immunol Methods
274, 1-15.
Laemmli, U.K. (1970). Cleavage of structural proteins during the assembly of the head
of bacteriophage T4. Nature 227, 680-685.
Lecourieux, D., Ranjeva, R., and Pugin, A. (2006). Calcium in plant defence-signalling
pathways. New Phytol 171, 249-269.
Lescot, M., Dehais, P., Thijs, G., Marchal, K., Moreau, Y., Van de Peer, Y., Rouze,
P., and Rombauts, S. (2002). PlantCARE, a database of plant cis-acting
regulatory elements and a portal to tools for in silico analysis of promoter
sequences. Nucleic Acids Res 30, 325-327.
Levine, A., Pennell, R.I., Alvarez, M.E., Palmer, R., and Lamb, C. (1996). Calcium-
mediated apoptosis in a plant hypersensitive disease resistance response. Curr
Biol 6, 427-437.
Li, J.J., and Herskowitz, I. (1993). Isolation of ORC6, a component of the yeast origin
recognition complex by a one-hybrid system. Science 262, 1870-1874.
Li, X., Clarke, J.D., Zhang, Y., and Dong, X. (2001). Activation of an EDS1-mediated
R-gene pathway in the snc1 mutant leads to constitutive, NPR1-independent
pathogen resistance. Mol Plant Microbe Interact 14, 1131-1139.
Li, Y., Yang, S., Yang, H., and Hua, J. (2007). The TIR-NB-LRR gene SNC1 is
regulated at the transcript level by multiple factors. Mol Plant Microbe Interact
20, 1449-1456.
Liu, J. (2007). Analysis of the role of Bonzai 1/ Copine 1 in Arabidopsis defense
responses. Doctoral thesis. Penn State University.
85
Liu, J., Jambunathan, N., and McNellis, T.W. (2005). Transgenic expression of the
von Willebrand A domain of the BONZAI 1/COPINE 1 protein triggers a lesion-
mimic phenotype in Arabidopsis. Planta 221, 85-94.
Luan, S., Kudla, J., Rodriguez-Concepcion, M., Yalovsky, S., and Gruissem, W. (2002). Calmodulins and calcineurin B-like proteins: calcium sensors for specific
signal response coupling in plants. Plant Cell 14 Suppl, S389-400.
Mackey, D., Belkhadir, Y., Alonso, J.M., Ecker, J.R., and Dangl, J.L. (2003).
Arabidopsis RIN4 is a target of the type III virulence effector AvrRpt2 and
modulates RPS2-mediated resistance. Cell 112, 379-389.
Mackey, D., Holt, B.F., 3rd, Wiig, A., and Dangl, J.L. (2002). RIN4 interacts with
Pseudomonas syringae type III effector molecules and is required for RPM1-
mediated resistance in Arabidopsis. Cell 108, 743-754.
Martin, G.B., Bogdanove, A.J., and Sessa, G. (2003). Understanding the functions of
plant disease resistance proteins. Annu Rev Plant Biol 54, 23-61.
Mathur, J. (2007). The illuminated plant cell. Trends Plant Sci 12, 506-513.
Mitsuda, N., Isono, T., and Sato, M.H. (2003). Arabidopsis CAMTA family proteins
enhance V-PPase expression in pollen. Plant Cell Physiol 44, 975-981.
Mongrand, S., Morel, J., Laroche, J., Claverol, S., Carde, J.P., Hartmann, M.A.,
Bonneu, M., Simon-Plas, F., Lessire, R., and Bessoule, J.J. (2004). Lipid rafts
in higher plant cells: purification and characterization of Triton X-100-insoluble
microdomains from tobacco plasma membrane. J Biol Chem 279, 36277-36286.
Monroy, A.F., and Dhindsa, R.S. (1995). Low-temperature signal transduction:
induction of cold acclimation-specific genes of alfalfa by calcium at 25 degrees C.
Plant Cell 7, 321-331.
Nakayama, T., Yaoi, T., Kuwajima, G., Yoshie, O., and Sakata, T. (1999). Ca2(+)-
dependent interaction of N-copine, a member of the two C2 domain protein
family, with OS-9, the product of a gene frequently amplified in osteosarcoma.
FEBS Lett 453, 77-80.
Nimchuk, Z., Eulgem, T., Holt, B.F., 3rd, and Dangl, J.L. (2003). Recognition and
response in the plant immune system. Annu Rev Genet 37, 579-609.
Noel, L., Moores, T.L., van Der Biezen, E.A., Parniske, M., Daniels, M.J., Parker,
J.E., and Jones, J.D. (1999). Pronounced intraspecific haplotype divergence at
the RPP5 complex disease resistance locus of Arabidopsis. Plant Cell 11, 2099-
2112.
Nurnberger, T., and Scheel, D. (2001). Signal transmission in the plant immune
response. Trends Plant Sci 6, 372-379.
Ochs, D. (1983). Protein contaminants of sodium dodecyl sulfate-polyacrylamide gels.
Anal Biochem 135, 470-474.
Orrenius, S., Zhivotovsky, B., and Nicotera, P. (2003). Regulation of cell death: the
calcium-apoptosis link. Nat Rev Mol Cell Biol 4, 552-565.
Orvar, B.L., Sangwan, V., Omann, F., and Dhindsa, R.S. (2000). Early steps in cold
sensing by plant cells: the role of actin cytoskeleton and membrane fluidity. Plant
J 23, 785-794.
86
Ouelhadj, A., Kuschk, P., and Humbeck, K. (2006). Heavy metal stress and leaf
senescence induce the barley gene HvC2d1 encoding a calcium-dependent novel
C2 domain-like protein. New Phytol 170, 261-273.
Pastuglia, M., Roby, D., Dumas, C., and Cock, J.M. (1997). Rapid induction by
wounding and bacterial infection of an S gene family receptor-like kinase gene in
Brassica oleracea. Plant Cell 9, 49-60.
Plant, P.J., Lafont, F., Lecat, S., Verkade, P., Simons, K., and Rotin, D. (2000).
Apical membrane targeting of Nedd4 is mediated by an association of its C2
domain with annexin XIIIb. J Cell Biol 149, 1473-1484.
Plieth, C., Hansen, U.P., Knight, H., and Knight, M.R. (1999). Temperature sensing
by plants: the primary characteristics of signal perception and calcium response.
Plant J 18, 491-497.
Ramsey, C.S., Yeung, F., Stoddard, P.B., Li, D., Creutz, C.E., and Mayo, M.W. (2008). Copine-I represses NF-kappaB transcription by endoproteolysis of p65.
Oncogene.
Reddy, V.S., and Reddy, A.S. (2004). Proteomics of calcium-signaling components in
plants. Phytochemistry 65, 1745-1776.
Renart, J., Reiser, J., and Stark, G.R. (1979). Transfer of proteins from gels to
diazobenzyloxymethyl-paper and detection with antisera: a method for studying
antibody specificity and antigen structure. Proc Natl Acad Sci U S A 76, 3116-
3120.
Riches, P.G., Polce, B., and Hong, R. (1988). Contaminant bands on SDS-
polyacrylamide gel electrophoresis are recognised by antibodies in normal human
serum and saliva. J Immunol Methods 110, 117-121.
Rizo, J., and Sudhof, T.C. (1998). C2-domains, structure and function of a universal
Ca2+-binding domain. J Biol Chem 273, 15879-15882.
Rombauts, S., Dehais, P., Van Montagu, M., and Rouze, P. (1999). PlantCARE, a
plant cis-acting regulatory element database. Nucleic Acids Res 27, 295-296.
Rouster, J., Leah, R., Mundy, J., and Cameron-Mills, V. (1997). Identification of a
methyl jasmonate-responsive region in the promoter of a lipoxygenase 1 gene
expressed in barley grain. Plant J 11, 513-523.
Rushton, P.J., Torres, J.T., Parniske, M., Wernert, P., Hahlbrock, K., and Somssich,
I.E. (1996). Interaction of elicitor-induced DNA-binding proteins with elicitor
response elements in the promoters of parsley PR1 genes. EMBO J 15, 5690-
5700.
Sambrook, J., and Russell, D.W. (2001). Molecular cloning : a laboratory manual.
(Cold Spring Harbor, N.Y.: Cold Spring Harbor Laboratory Press).
Sanders, D., Pelloux, J., Brownlee, C., and Harper, J.F. (2002). Calcium at the
crossroads of signaling. Plant Cell 14 Suppl, S401-417.
Sangwan, V., Foulds, I., Singh, J., and Dhindsa, R.S. (2001). Cold-activation of
Brassica napus BN115 promoter is mediated by structural changes in membranes
and cytoskeleton, and requires Ca2+ influx. Plant J 27, 1-12.
Sessions, A., Burke, E., Presting, G., Aux, G., McElver, J., Patton, D., Dietrich, B.,
Ho, P., Bacwaden, J., Ko, C., Clarke, J.D., Cotton, D., Bullis, D., Snell, J.,
Miguel, T., Hutchison, D., Kimmerly, B., Mitzel, T., Katagiri, F., Glazebrook,
87
J., Law, M., and Goff, S.A. (2002). A high-throughput Arabidopsis reverse
genetics system. Plant Cell 14, 2985-2994.
Shapiro, S.Z. (1987). Elimination of the detection of an artefactual 65 kDa keratin band
from immunoblots. J Immunol Methods 102, 143-146.
Sheen, J. (1996). Ca2+-dependent protein kinases and stress signal transduction in plants.
Science 274, 1900-1902.
Shen, Q., Uknes, S.J., and Ho, T.H. (1993). Hormone response complex in a novel
abscisic acid and cycloheximide-inducible barley gene. J Biol Chem 268, 23652-
23660.
Simons, K., and Ikonen, E. (1997). Functional rafts in cell membranes. Nature 387,
569-572.
Somerville, C. (1995). Direct tests of the role of membrane lipid composition in low-
temperature-induced photoinhibition and chilling sensitivity in plants and
cyanobacteria. Proc Natl Acad Sci U S A 92, 6215-6218.
Soo, P.C., Horng, Y.T., Lai, M.J., Wei, J.R., Hsieh, S.C., Chang, Y.L., Tsai, Y.H.,
and Lai, H.C. (2007). Pirin regulates pyruvate catabolism by interacting with the
pyruvate dehydrogenase E1 subunit and modulating pyruvate dehydrogenase
activity. J Bacteriol 189, 109-118.
Southern, E.M. (1975). Detection of specific sequences among DNA fragments
separated by gel electrophoresis. J Mol Biol 98, 503-517.
Spoel, S.H., Johnson, J.S., and Dong, X. (2007). Regulation of tradeoffs between plant
defenses against pathogens with different lifestyles. Proc Natl Acad Sci U S A
104, 18842-18847.
Staskawicz, B.J., Ausubel, F.M., Baker, B.J., Ellis, J.G., and Jones, J.D. (1995).
Molecular genetics of plant disease resistance. Science 268, 661-667.
Tang, D., Christiansen, K.M., and Innes, R.W. (2005). Regulation of plant disease
resistance, stress responses, cell death, and ethylene signaling in Arabidopsis by
the EDR1 protein kinase. Plant Physiol 138, 1018-1026.
Tasheva, B., and Dessev, G. (1983). Artifacts in sodium dodecyl sulfate-polyacrylamide
gel electrophoresis due to 2-mercaptoethanol. Anal Biochem 129, 98-102.
Tomsig, J.L., and Creutz, C.E. (2002). Copines: a ubiquitous family of Ca(2+)-
dependent phospholipid-binding proteins. Cell Mol Life Sci 59, 1467-1477.
Tomsig, J.L., Snyder, S.L., and Creutz, C.E. (2003). Identification of targets for
calcium signaling through the copine family of proteins. Characterization of a
coiled-coil copine-binding motif. J Biol Chem 278, 10048-10054.
Tomsig, J.L., Sohma, H., and Creutz, C.E. (2004). Calcium-dependent regulation of
tumour necrosis factor-alpha receptor signalling by copine. Biochem J 378, 1089-
1094.
Towbin, H., Staehelin, T., and Gordon, J. (1979). Electrophoretic transfer of proteins
from polyacrylamide gels to nitrocellulose sheets: procedure and some
applications. Proc Natl Acad Sci U S A 76, 4350-4354.
van der Biezen, E.A., Freddie, C.T., Kahn, K., Parker, J.E., and Jones, J.D. (2002).
Arabidopsis RPP4 is a member of the RPP5 multigene family of TIR-NB-LRR
genes and confers downy mildew resistance through multiple signalling
components. Plant J 29, 439-451.
88
Vance, J.E., and Steenbergen, R. (2005). Metabolism and functions of
phosphatidylserine. Prog Lipid Res 44, 207-234.
Whalen, M.C., Innes, R.W., Bent, A.F., and Staskawicz, B.J. (1991). Identification of
Pseudomonas syringae pathogens of Arabidopsis and a bacterial locus
determining avirulence on both Arabidopsis and soybean. Plant Cell 3, 49-59.
White, P.J., and Broadley, M.R. (2003). Calcium in plants. Ann Bot (Lond) 92, 487-
511.
Whittaker, C.A., and Hynes, R.O. (2002). Distribution and evolution of von
Willebrand/integrin A domains: widely dispersed domains with roles in cell
adhesion and elsewhere. Mol Biol Cell 13, 3369-3387.
Williams, D.A., Cody, S.H., Gehring, C.A., Parish, R.W., and Harris, P.J. (1990).
Confocal imaging of ionised calcium in living plant cells. Cell Calcium 11, 291-
297.
Xiao, S., Brown, S., Patrick, E., Brearley, C., and Turner, J.G. (2003). Enhanced
transcription of the Arabidopsis disease resistance genes RPW8.1 and RPW8.2 via
a salicylic acid-dependent amplification circuit is required for hypersensitive cell
death. Plant Cell 15, 33-45.
Xiao, S., Calis, O., Patrick, E., Zhang, G., Charoenwattana, P., Muskett, P., Parker,
J.E., and Turner, J.G. (2005). The atypical resistance gene, RPW8, recruits
components of basal defence for powdery mildew resistance in Arabidopsis. Plant
J 42, 95-110.
Yamaguchi-Shinozaki, K., and Shinozaki, K. (1993). Arabidopsis DNA encoding two
desiccation-responsive rd29 genes. Plant Physiol 101, 1119-1120.
Yang, H., Li, Y., and Hua, J. (2006a). The C2 domain protein BAP1 negatively
regulates defense responses in Arabidopsis. Plant J 48, 238-248.
Yang, H., Yang, S., Li, Y., and Hua, J. (2007). The Arabidopsis BAP1 and BAP2 genes
are general inhibitors of programmed cell death. Plant Physiol 145, 135-146.
Yang, S., and Hua, J. (2004). A haplotype-specific Resistance gene regulated by
BONZAI1 mediates temperature-dependent growth control in Arabidopsis. Plant
Cell 16, 1060-1071.
Yang, S., Yang, H., Grisafi, P., Sanchatjate, S., Fink, G.R., Sun, Q., and Hua, J. (2006b). The BON/CPN gene family represses cell death and promotes cell
growth in Arabidopsis. Plant J 45, 166-179.
Yang, T., and Poovaiah, B.W. (2002). A calmodulin-binding/CGCG box DNA-binding
protein family involved in multiple signaling pathways in plants. J Biol Chem
277, 45049-45058.
Yi, H., and Richards, E.J. (2007). A cluster of disease resistance genes in Arabidopsis is
coordinately regulated by transcriptional activation and RNA silencing. Plant Cell
19, 2929-2939.
Yu, G.L., Katagiri, F., and Ausubel, F.M. (1993). Arabidopsis mutations at the RPS2
locus result in loss of resistance to Pseudomonas syringae strains expressing the
avirulence gene avrRpt2. Mol Plant Microbe Interact 6, 434-443.
Zhang, Y., Goritschnig, S., Dong, X., and Li, X. (2003). A gain-of-function mutation in
a plant disease resistance gene leads to constitutive activation of downstream

89
signal transduction pathways in suppressor of npr1-1, constitutive 1. Plant Cell
15, 2636-2646.
Zielinski, R.E. (1998). Calmodulin and Calmodulin-Binding Proteins in Plants. Annu
Rev Plant Physiol Plant Mol Biol 49, 697-725.
90
Appendix A
Changes in BON1/CPN1 protein level in response to abiotic stimuli
A.1 Background information
Besides biotic stimuli, BON1/CPN1 gene expression is also regulated by abiotic
stimuli including low humidity and low temperature (Hua et al., 2001; Jambunathan and
McNellis, 2003). Accumulation of BON1/CPN1 transcript is increased in wild-type Col-
0 plants grown under low humidity (35-45% RH) or low temperature (21°C±0.5°C)
compared to that in high humidity, high temperature conditions (75-85% RH,
24.5°C±0.5°C) (Jambunathan and McNellis, 2003). A possible explanation for the
temperature- and humidity-regulated BON1/CPN1 expression came from the search of
putative cis-acting element motifs in the BON1/CPN1 promoter regions (Chapter 5).
There are two low temperature-responsive elements (LTR) (Brown et al., 2001) and two
MYB binding sites involved in drought-inducibility (MBS) (Yamaguchi-Shinozaki and
Shinozaki, 1993) in the 1.9kb BON1/CPN1 promoter region. However, experimental analysis
is needed to determine whether these putative regulatory elements are responsible for
BON1/CPN1 expression regulation in response to low temperature and low humidity.
The motif search in the BON1/CPN1 promoter region also identified five putative
abscisic-acid-responsive elements (ABRE) (Shen et al., 1993; Yamaguchi-Shinozaki and
Shinozaki, 1993) which may be responsive to Ca2+ stimulus (Kaplan et al., 2006). This
was further supported by the promoter activity analysis, which demonstrated the induced
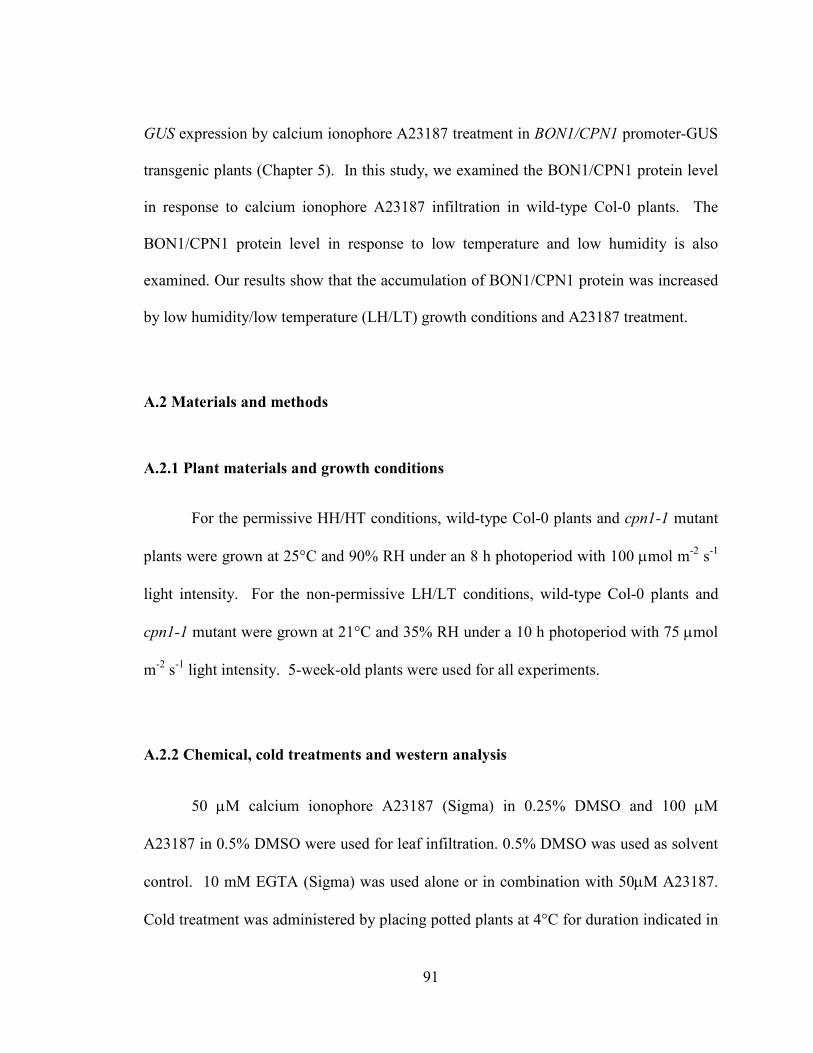
91
GUS expression by calcium ionophore A23187 treatment in BON1/CPN1 promoter-GUS
transgenic plants (Chapter 5). In this study, we examined the BON1/CPN1 protein level
in response to calcium ionophore A23187 infiltration in wild-type Col-0 plants. The
BON1/CPN1 protein level in response to low temperature and low humidity is also
examined. Our results show that the accumulation of BON1/CPN1 protein was increased
by low humidity/low temperature (LH/LT) growth conditions and A23187 treatment.
A.2 Materials and methods
A.2.1 Plant materials and growth conditions
For the permissive HH/HT conditions, wild-type Col-0 plants and cpn1-1 mutant
plants were grown at 25°C and 90% RH under an 8 h photoperiod with 100 µmol m-2 s
-1
light intensity. For the non-permissive LH/LT conditions, wild-type Col-0 plants and
cpn1-1 mutant were grown at 21°C and 35% RH under a 10 h photoperiod with 75 µmol
m-2 s
-1 light intensity. 5-week-old plants were used for all experiments.
A.2.2 Chemical, cold treatments and western analysis
50 µM calcium ionophore A23187 (Sigma) in 0.25% DMSO and 100 µM
A23187 in 0.5% DMSO were used for leaf infiltration. 0.5% DMSO was used as solvent
control. 10 mM EGTA (Sigma) was used alone or in combination with 50µM A23187.
Cold treatment was administered by placing potted plants at 4°C for duration indicated in
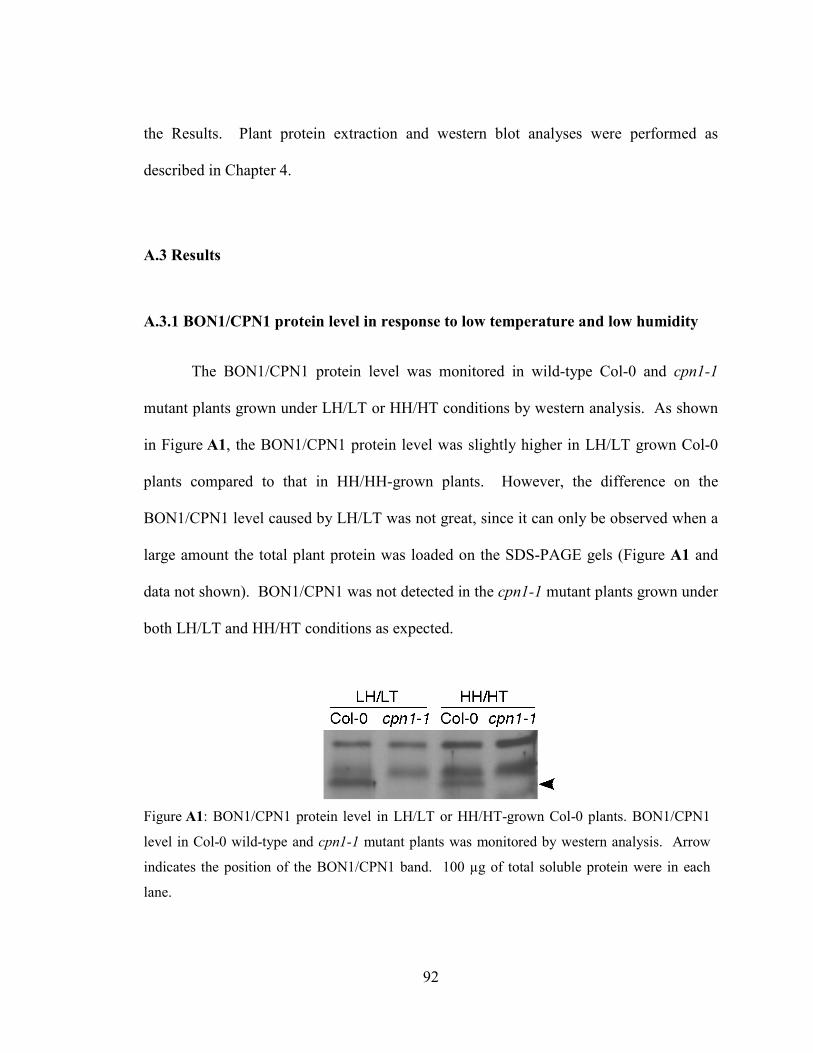
92
the Results. Plant protein extraction and western blot analyses were performed as
described in Chapter 4.
A.3 Results
A.3.1 BON1/CPN1 protein level in response to low temperature and low humidity
The BON1/CPN1 protein level was monitored in wild-type Col-0 and cpn1-1
mutant plants grown under LH/LT or HH/HT conditions by western analysis. As shown
in Figure A1, the BON1/CPN1 protein level was slightly higher in LH/LT grown Col-0
plants compared to that in HH/HH-grown plants. However, the difference on the
BON1/CPN1 level caused by LH/LT was not great, since it can only be observed when a
large amount the total plant protein was loaded on the SDS-PAGE gels (Figure A1 and
data not shown). BON1/CPN1 was not detected in the cpn1-1 mutant plants grown under
both LH/LT and HH/HT conditions as expected.
Figure A1: BON1/CPN1 protein level in LH/LT or HH/HT-grown Col-0 plants. BON1/CPN1
level in Col-0 wild-type and cpn1-1 mutant plants was monitored by western analysis. Arrow
indicates the position of the BON1/CPN1 band. 100 µg of total soluble protein were in each
lane.
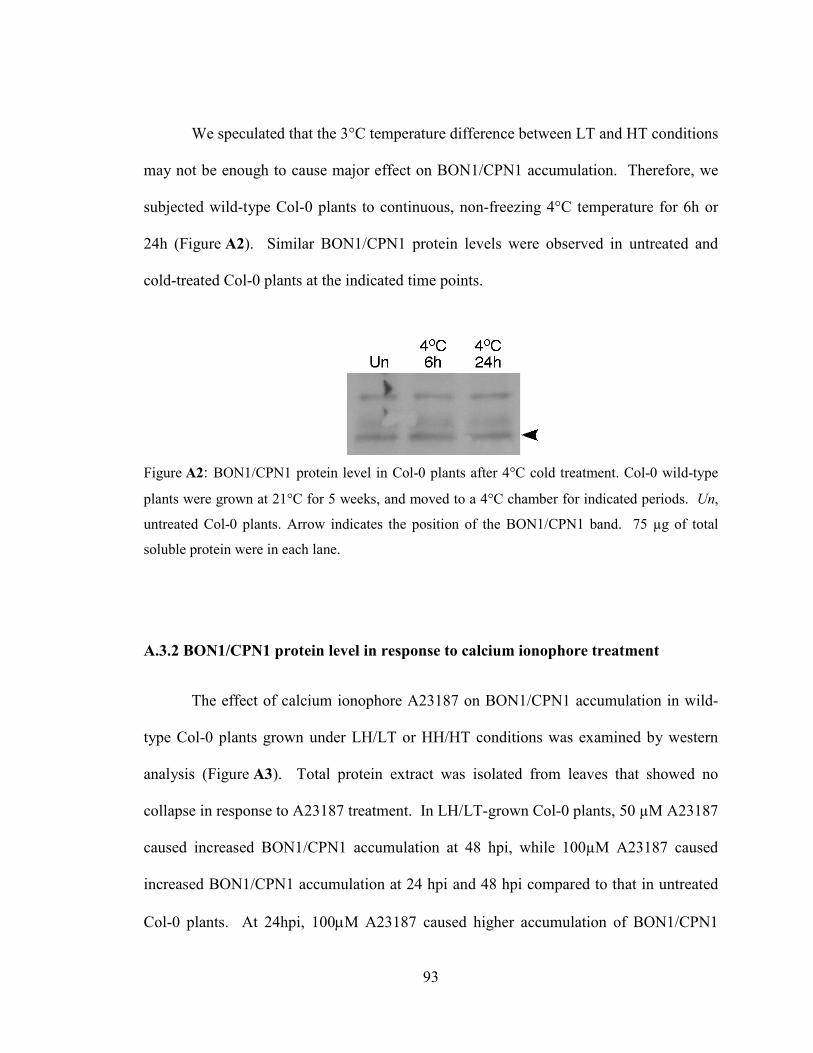
93
We speculated that the 3°C temperature difference between LT and HT conditions
may not be enough to cause major effect on BON1/CPN1 accumulation. Therefore, we
subjected wild-type Col-0 plants to continuous, non-freezing 4°C temperature for 6h or
24h (Figure A2). Similar BON1/CPN1 protein levels were observed in untreated and
cold-treated Col-0 plants at the indicated time points.
A.3.2 BON1/CPN1 protein level in response to calcium ionophore treatment
The effect of calcium ionophore A23187 on BON1/CPN1 accumulation in wild-
type Col-0 plants grown under LH/LT or HH/HT conditions was examined by western
analysis (Figure A3). Total protein extract was isolated from leaves that showed no
collapse in response to A23187 treatment. In LH/LT-grown Col-0 plants, 50 µM A23187
caused increased BON1/CPN1 accumulation at 48 hpi, while 100µM A23187 caused
increased BON1/CPN1 accumulation at 24 hpi and 48 hpi compared to that in untreated
Col-0 plants. At 24hpi, 100µM A23187 caused higher accumulation of BON1/CPN1
Figure A2: BON1/CPN1 protein level in Col-0 plants after 4°C cold treatment. Col-0 wild-type
plants were grown at 21°C for 5 weeks, and moved to a 4°C chamber for indicated periods. Un,
untreated Col-0 plants. Arrow indicates the position of the BON1/CPN1 band. 75 µg of total
soluble protein were in each lane.
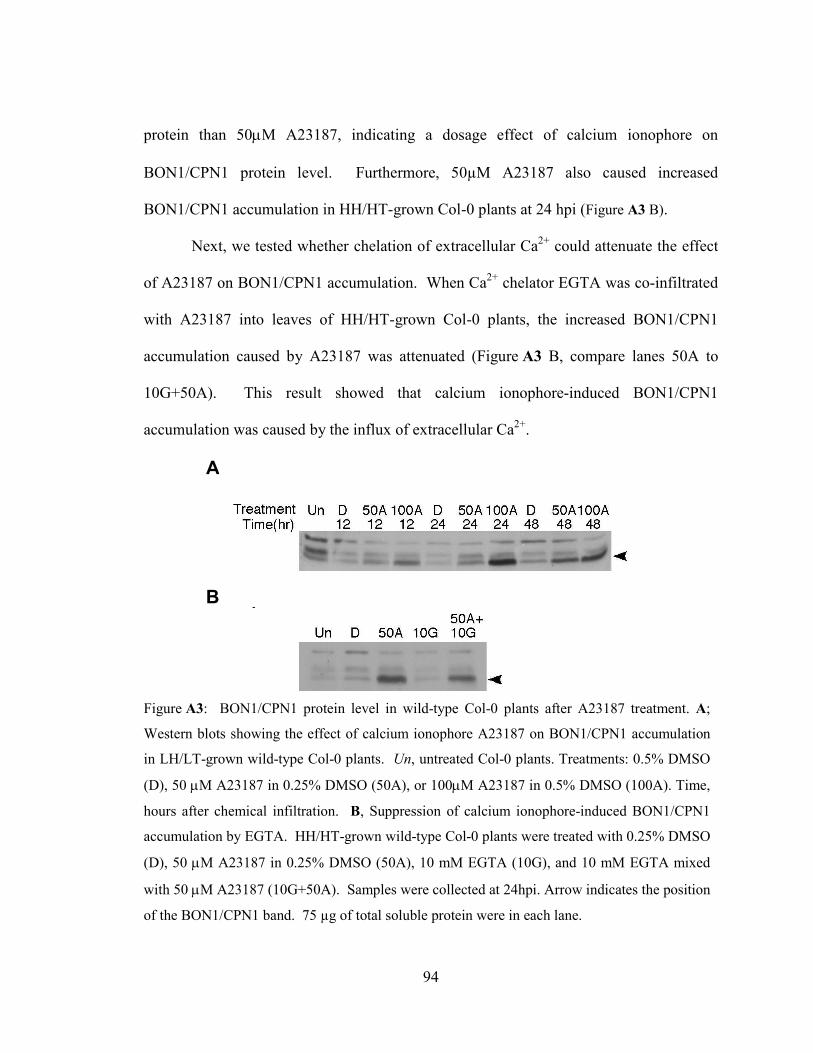
94
protein than 50µM A23187, indicating a dosage effect of calcium ionophore on
BON1/CPN1 protein level. Furthermore, 50µM A23187 also caused increased
BON1/CPN1 accumulation in HH/HT-grown Col-0 plants at 24 hpi (Figure A3 B).
Next, we tested whether chelation of extracellular Ca2+ could attenuate the effect
of A23187 on BON1/CPN1 accumulation. When Ca2+ chelator EGTA was co-infiltrated
with A23187 into leaves of HH/HT-grown Col-0 plants, the increased BON1/CPN1
accumulation caused by A23187 was attenuated (Figure A3 B, compare lanes 50A to
10G+50A). This result showed that calcium ionophore-induced BON1/CPN1
accumulation was caused by the influx of extracellular Ca2+.
A
B
Figure A3: BON1/CPN1 protein level in wild-type Col-0 plants after A23187 treatment. A;
Western blots showing the effect of calcium ionophore A23187 on BON1/CPN1 accumulation
in LH/LT-grown wild-type Col-0 plants. Un, untreated Col-0 plants. Treatments: 0.5% DMSO
(D), 50 µM A23187 in 0.25% DMSO (50A), or 100µM A23187 in 0.5% DMSO (100A). Time,
hours after chemical infiltration. B, Suppression of calcium ionophore-induced BON1/CPN1
accumulation by EGTA. HH/HT-grown wild-type Col-0 plants were treated with 0.25% DMSO
(D), 50 µM A23187 in 0.25% DMSO (50A), 10 mM EGTA (10G), and 10 mM EGTA mixed
with 50 µM A23187 (10G+50A). Samples were collected at 24hpi. Arrow indicates the position
of the BON1/CPN1 band. 75 µg of total soluble protein were in each lane.
95
A.4 Dicussion
Low temperature and low humidity conditions (21°C, 35% RH) caused a slight
increase in BON1/CPN1 accumulation compared to high humidity, high temperature
conditions (21°C, 90% RH). This is in agreement with a previous study which showed
increased BON1/CPN1 transcript accumulation under LH or LT conditions (Jambunathan
and McNellis, 2003).
We suspected the degree of temperature change may contribute to the effect of
low temperature treatment on BON1/CPN1 level. However, when Col-0 plants grown at
25°C were subjected to cold treatment at 4°C for 6 h or 24 h, BON1/CPN1 protein level
remained unchanged compared to that in untreated control plants. It is notable that the
BON1/CPN1 RNA level had a twofold increase when Col-0 plants were shifted from
28°C to 22°C or 28°C to 16°C for 12h (Hua et al., 2001). Thus, the 24h duration of the
cold treatment in our experiment should be long enough to cause changes in BON1/CPN1
transcript or protein level if there are any. It is possible that changes in the BON1/CPN1
transcript level are not reflected on the BON1/CPN1 protein level. Also, unchanged
protein level after 4°C cold treatment may result from significantly reduced metabolic
activities including transcription and translation at such a low temperature.
Our results showed that calcium ionophore A23187 was able to induce
BON1/CPN1 accumulation in wild-type Col-0 plants grown under either LH/LT or
HH/HT conditions, and that EGTA could attenuate the A23187 effect. This result is in
accordance with the A23187-induced GUS expression in BON1/CPN1 promoter-GUS
activity analysis (Chapter 5). However, high concentrations of A23187 sometimes
96
triggered necrotic cell death in LH/LT grown wild-type plants at 24 hpi (data not shown).
Therefore, the secondary effect of cell death caused by high concentration A23187 may
partially account for the increased accumulation of BON1/CPN1. Replacing A23187
with CaCl2 (Kim et al., 2003) or other calcium ionophores for calcium stimulus may help
to elucidate the actual effect of Ca2+ on BON1/CPN1 regulation.
97
Appendix B
Subcellular redistribution of YFP::BON1/CPN1 protein in response to calcium
ionophore and cold stimuli
B.1 Background information
The Arabidopsis BON1/CPN1 has been shown to localize to the plasma
membrane (PM) when expressed in Arabidopsis protoplasts or transgenic plants (Hua et
al., 2001). To further investigate the subcellular localization of BON1/CPN1 protein in
response to various stimuli, transgenic plants expressing a yellow fluorescence protein
(YFP) fused to the N-terminus of BON1/CPN1 were generated and the localization of the
YFP-tagged BON1/CPN1 protein (YFP::BON1/CPN1) was examined by confocal
microscopy (Liu, 2007). Previous study has shown that the YFP::BON1/CPN1 protein
has a focal localization in Arabidopsis epidermal cells after pathogen challenge. Here,
the subcellular localization of YFP::BON1/CPN1 protein was monitored after A23187
and brief cold treatments. Our results showed that A23187 and cold treatments
modulated the subcellular localization of the BON1/CPN1 protein in a manner similar to
that triggered by bacteria pathogen inoculation.
98
B.2 Materials and methods
B.2.1 Plant materials and growth conditions
T2 transgenic Arabidopsis lines expressing YFP::BON1/CPN1 protein were used
in this study (Liu, 2007). In short, the Gateway vector was used to create the plasmid
with YFP fused to the N-terminal of the BON1/CPN1 protein (Hartley et al., 2000; Curtis
and Grossniklaus, 2003). The T2 plants were grown for 4 weeks at 21°C and 35% RH
under a 10h photoperiod with 70 µmol m-2 s
-1 light intensity. 4-week-old plants were
used in the experiments.
B.2.2 Chemical and cold treatments and confocal microscopy
300µM of calcium ionophore A23187 in 1.5% DMSO (Sigma) was used for leaf
infiltration. 1.5% DMSO (Sigma) was used as solvent control. The Pseudomonas
syringae pv tomato DC3000 strain was suspended in sterilized water at a concentration of
1×10⁸ cfu/mL. Sterilized water was used as infiltration control. Leaves were observed
under a confocal microscope after the treatments. For cold stimuli, detached leaves were
subjected to 0ºC with ice water for 1 min and then observed under the confocal
microscope immediately.
For YFP::BON1/CPN1 subcellular localization, the fluorescence of YFP was
observed using a LSM510 META confocal laser scanning microscope (Carl Zeiss
MicroImaging, Inc., Thornwood, NY, USA). The YFP was excited by the 488-nm Argon
laser line and the emitted light was collected for imaging.
99
B.3 Results
To visualize the BON1/CPN1 localization in the plant cells, a yellow fluorescence
protein (YFP)-tagged BON1/CPN1 construct was made and stably expressed in
Arabidopsis plants (Liu, 2007). The YFP::BON1/CPN1 protein was mostly localized to
the cell periphery of epidermal cells in untreated transgenic plants (Figure B1 A). We
investigated the subcellular localization of YFP::BON1/CPN1 in response to various
stimuli including A23187 and cold. There was no distinguishable change in
YFP::BON1/CPN1 localization after water or 1.5% DMSO treatment (Figure B1 B and
C, respectively). Interestingly, YFP::BON1/CPN1 showed a localized accumulation
pattern along the cell periphery after 300µM A23187 treatment (Figure B1 D and E).
The localized accumulation pattern was observed 3 to 4 hpi and persisted until 24 hpi
(data not shown). Close-up views showed that YFP::BON1/CPN1 accumulated
intracellularly along the cell periphery, with substantial focal accumulation at the cell
junctions and lobes of the epidermal cells (Figure B1 F to I).
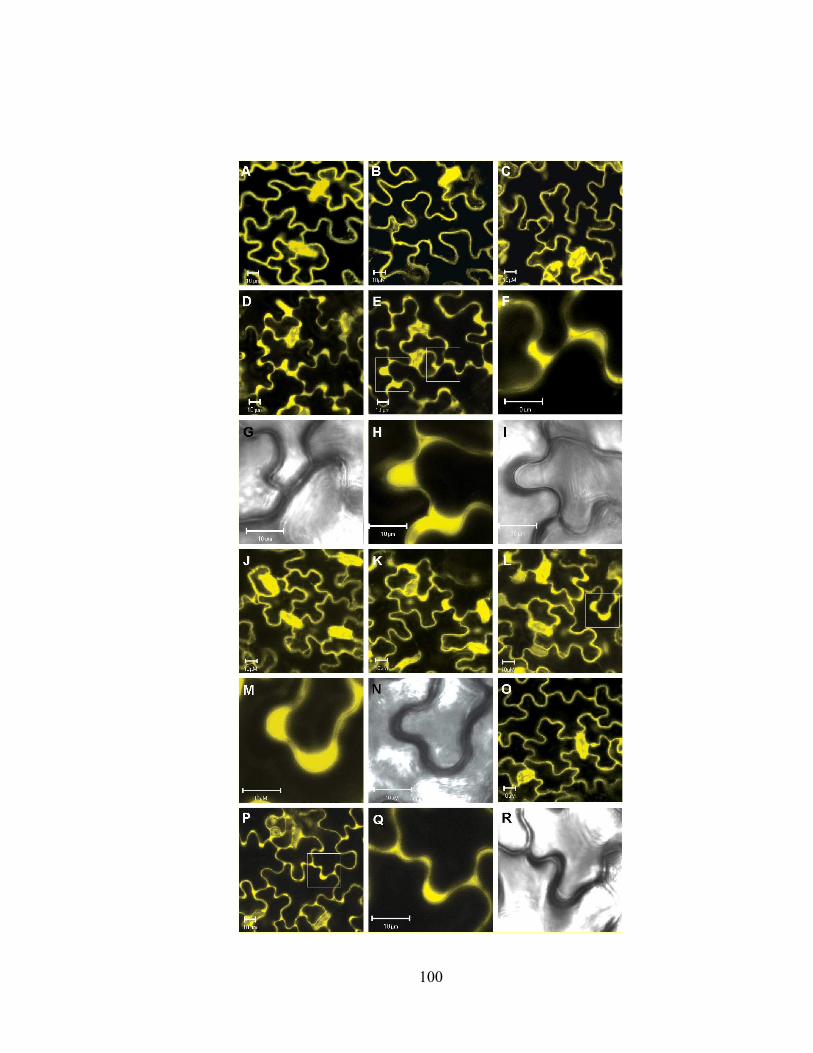
100
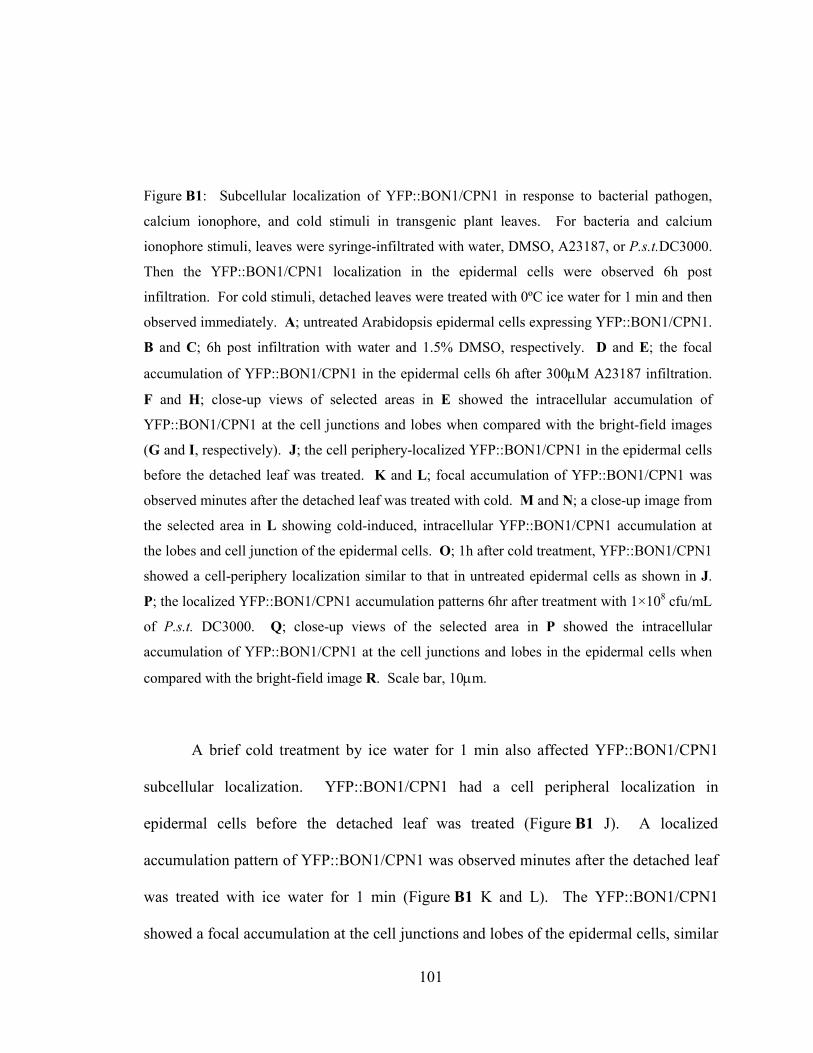
101
A brief cold treatment by ice water for 1 min also affected YFP::BON1/CPN1
subcellular localization. YFP::BON1/CPN1 had a cell peripheral localization in
epidermal cells before the detached leaf was treated (Figure B1 J). A localized
accumulation pattern of YFP::BON1/CPN1 was observed minutes after the detached leaf
was treated with ice water for 1 min (Figure B1 K and L). The YFP::BON1/CPN1
showed a focal accumulation at the cell junctions and lobes of the epidermal cells, similar
Figure B1: Subcellular localization of YFP::BON1/CPN1 in response to bacterial pathogen,
calcium ionophore, and cold stimuli in transgenic plant leaves. For bacteria and calcium
ionophore stimuli, leaves were syringe-infiltrated with water, DMSO, A23187, or P.s.t.DC3000.
Then the YFP::BON1/CPN1 localization in the epidermal cells were observed 6h post
infiltration. For cold stimuli, detached leaves were treated with 0ºC ice water for 1 min and then
observed immediately. A; untreated Arabidopsis epidermal cells expressing YFP::BON1/CPN1.
B and C; 6h post infiltration with water and 1.5% DMSO, respectively. D and E; the focal
accumulation of YFP::BON1/CPN1 in the epidermal cells 6h after 300µM A23187 infiltration.
F and H; close-up views of selected areas in E showed the intracellular accumulation of
YFP::BON1/CPN1 at the cell junctions and lobes when compared with the bright-field images
(G and I, respectively). J; the cell periphery-localized YFP::BON1/CPN1 in the epidermal cells
before the detached leaf was treated. K and L; focal accumulation of YFP::BON1/CPN1 was
observed minutes after the detached leaf was treated with cold. M and N; a close-up image from
the selected area in L showing cold-induced, intracellular YFP::BON1/CPN1 accumulation at
the lobes and cell junction of the epidermal cells. O; 1h after cold treatment, YFP::BON1/CPN1
showed a cell-periphery localization similar to that in untreated epidermal cells as shown in J.
P; the localized YFP::BON1/CPN1 accumulation patterns 6hr after treatment with 1×10⁸ cfu/mL
of P.s.t. DC3000. Q; close-up views of the selected area in P showed the intracellular
accumulation of YFP::BON1/CPN1 at the cell junctions and lobes in the epidermal cells when
compared with the bright-field image R. Scale bar, 10µm.
102
to the patterns triggered by A23187 stimulus (Figure B1 M and N). The effect of cold on
YFP::BON1/CPN1 localization was transient, since the focal accumulation was no longer
detected in the same leaf 1 h after the cold stimulus (Figure B1 O). Consistent with the
results from Liu (2007), YFP::BON1/CPN1 protein exhibited a localized accumulation
pattern along the cell periphery after treated with 1x10⁸ cfu mL
-1 of P.s.t. DC3000
(Figure B1 P to R). The localized accumulation of YFP::BON1/CPN1 was mainly at the
cell junctions and lobes of the epidermal cells (Figure B1 Q), which was first observed
from 3 to 4 hpi and persisted until 24 hpi (data not shown).
B.4 Discussion
Fluorescent proteins (FPs) have been widely used as fusion protein tags to
determine the subcellular localization and behavioral properties of another protein of
interest (Mathur, 2007; Berg and Beachy, 2008). The soluble, free (untargeted) FPs in
plant cells are usually localized in the cytoplasm (Haseloff et al., 1997; Davis and
Vierstra, 1998). However, to verify our results of this study, transgenic Arabidopsis
plants expressing only the YFP protein using the same vectors as other fluorescence
protein construct (Liu, 2007) should be generated. They will be controls for different
treatments along with the YFP::BON1/CPN1 expressing plants.
YFP::BON1/CPN1 exhibited remarkably similar, localized accumulation pattern
in response to A23187, bacterial pathogen, and cold stimuli. This result indicated that
BON1/CPN1 subcellular distribution may be modulated by Ca2+ influx triggered by both
abiotic and biotic stimuli. Interestingly, both A23187 and bacterial pathogen triggered a
103
similar temporal pattern for YFP::BON1/CPN1 accumulation, which was observed at 3 to
4hpi and persisted to 24 hpi. In contrast, a 1 minute-cold treatment triggered a similar
YFP::BON1/CPN1 spatial accumulation but in a much faster and transient manner. The
difference in the YFP::BON1/CPN1 temporal accumulation patterns by pathogen and
cold may be correlated to the unique Ca2+ perturbations triggered by different stimuli
(White and Broadley, 2003). While pathogens generate a relatively slow (hours) and
sustained cytosolic Ca2+ elevation, cold shock generates a immediate, brief spike on
cytosolic Ca2+ level (seconds).
In response to cold and pathogen stimuli, YFP::BON1/CPN1 protein showed a
distinct, focal accumulation at the cell junctions and lobes along the cell periphery of the
epidermal cells. It was unclear whether the accumulation was due to the redistribution of
YFP::BON1/CPN1 from previous cell peripheral locations or the transportation of de
novo-synthesized YFP::BON1/CPN1 to the focal accumulation sites. Therefore, future
experiments using inhibitors for protein synthesis and protein degradation will help to
investigate the origin of these accumulated YFP::BON1/CPN1 proteins.
The other challenge is to determine whether the distinct YFP::BON1/CPN1
accumulation pattern is functionally relevant. There are two possible explanations for the
formation of YFP::BON1/CPN1 accumulation patterns based on the biochemical
properties of copines and other C2-domain containing proteins. First, lipid selectivity of
the C2 domain could contribute to the localized YFP::BON1/CPN1 distribution along the
plasma membrane at the cell periphery. Human copines exhibit Ca2+-dependent lipid
binding with preference for negatively-charged phospholipids like phosphatidylserine
over neutral phospholipids like phosphatidylcholine (Creutz et al., 1998; Tomsig and
104
Creutz, 2002). Besides the structural role in membranes, PS has been shown to
participate in many important biological processes including protein kinase C activation
and apoptosis (Vance and Steenbergen, 2005). Although the physiological importance of
lipid composition is not well understood, studies have shown a change of phospholipid
composition in response to low temperature (Somerville, 1995). Along the same line, it
is possible that other stimuli could also affect the lipid composition by altering the
abundance and distribution of certain phospholipids in membranes. Therefore, the focal
accumulation pattern may result from preferable YFP::BON1/CPN1 binding to certain
part of the plasma membrane where phosphatidylserine is enriched in response to cold or
pathogen stimuli.
The other possible explanation is that YFP::BON1/CPN1 may bind to target
proteins located at certain domains in the membranes. Studies have demonstrated that
Nedd4, a C2-domain containing ubiquitin protein ligase, is localized specifically to the
apical region of epithelial cells where its interacting partner annexin XIII is located in the
presence of Ca2+ (Plant et al., 2000). The authors also showed that Nedd4 associated
with the lipid raft microdomain in a Ca2+ dependent manner. Lipid rafts are specific
membrane domains formed by stable association of certain lipids such as sphingolipids
and cholesterol. In animals and yeast cells, extensive studies have revealed the important
roles of lipid rafts in protein sorting, signal transduction, or pathogen infection (Simons
and Ikonen, 1997). For instance, these rafts may function as sorting platforms for the
attachment of acylated, glycosylphosphatidylinositol-anchored, or palmitoylated
signaling molecules. In higher plants, many recent studies have presented compelling
evidence for the existance of lipid rafts (Mongrand et al., 2004; Borner et al., 2005;
105
Grennan, 2007). In barley epidermal cells, powdery mildew challenge triggers the
formation of a plasma membrane microdomains enriched in plant sterols at pathogen
entry sites (Bhat et al., 2005). Furthermore, the barley mildew resistance locus O (MLO)
protein, which is required for host cell invasion by the powdery mildew fungus, shows a
focal plasma membrane accumulation beneath the fungal penetration sites (Bhat et al.,
2005). Other plant proteins involved in penetration resistance also redistribute to the
fungal entry sites, including a calmodulin that is known to positively regulate the MLO
activity (Kim et al., 2002). Together, the data suggest a scenario where both positive and
negative regulatory components of defense co-localize at the plasma membrane
microdomains that develop at pathogen entry sites. To determine if BON1/CPN1
functions in a similar way to the MLO machinery, it is necessary to identify whether
sterol-rich microdomains occur at the cell junction and lobes where the
YFP::BON1/CPN1 accumulates in response to A23187, cold, and pathogen stimuli.
Another important task will be to investigate the functional relationship of BON1/CPN1
and its interaction partners. It would be interesting to see if any of the BON1/CPN1
interacting proteins are modified with specific lipid groups or located in the lipid
microdomains so they could actually function together with BON1/CPN1 at the
membranes. In conclusion, the link between lipid rafts and the BON1/CPN1 localization
may provide more insights about the possible mode of action of Arabidopsis copines.
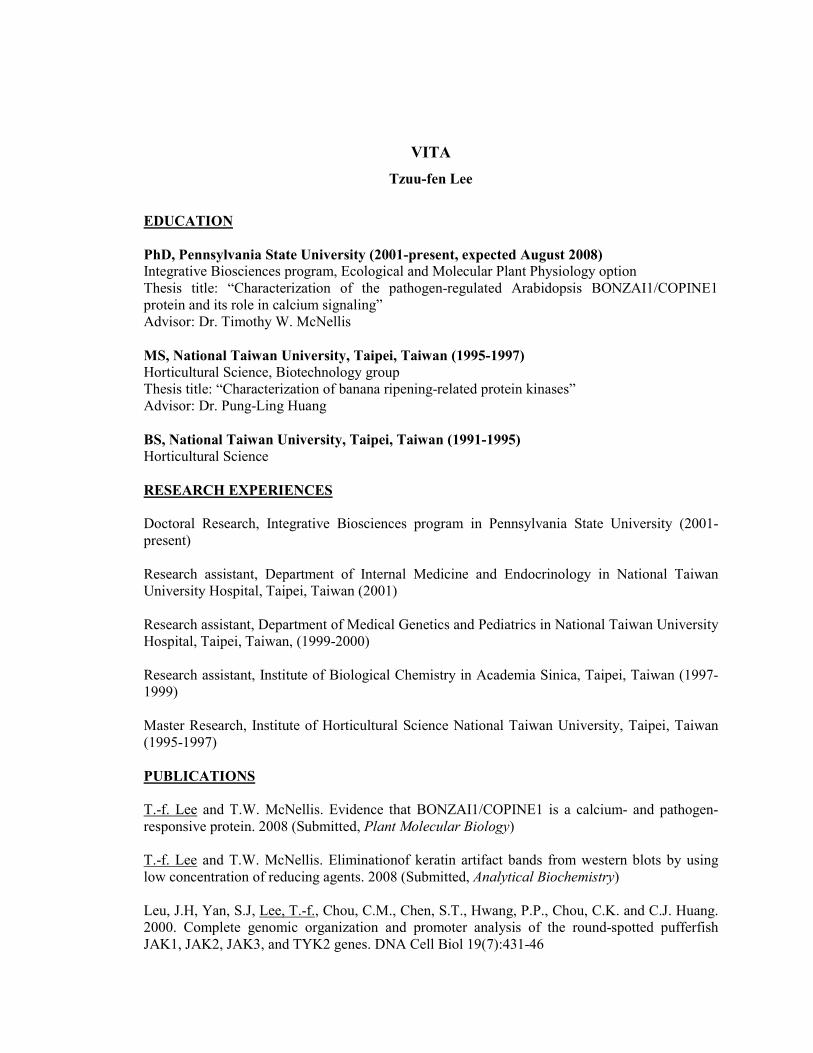
VITA
Tzuu-fen Lee
EDUCATION
PhD, Pennsylvania State University (2001-present, expected August 2008) Integrative Biosciences program, Ecological and Molecular Plant Physiology option
Thesis title: “Characterization of the pathogen-regulated Arabidopsis BONZAI1/COPINE1
protein and its role in calcium signaling”
Advisor: Dr. Timothy W. McNellis
MS, National Taiwan University, Taipei, Taiwan (1995-1997) Horticultural Science, Biotechnology group
Thesis title: “Characterization of banana ripening-related protein kinases”
Advisor: Dr. Pung-Ling Huang
BS, National Taiwan University, Taipei, Taiwan (1991-1995) Horticultural Science
RESEARCH EXPERIENCES
Doctoral Research, Integrative Biosciences program in Pennsylvania State University (2001-
present)
Research assistant, Department of Internal Medicine and Endocrinology in National Taiwan
University Hospital, Taipei, Taiwan (2001)
Research assistant, Department of Medical Genetics and Pediatrics in National Taiwan University
Hospital, Taipei, Taiwan, (1999-2000)
Research assistant, Institute of Biological Chemistry in Academia Sinica, Taipei, Taiwan (1997-
1999)
Master Research, Institute of Horticultural Science National Taiwan University, Taipei, Taiwan
(1995-1997)
PUBLICATIONS
T.-f. Lee and T.W. McNellis. Evidence that BONZAI1/COPINE1 is a calcium- and pathogen-
responsive protein. 2008 (Submitted, Plant Molecular Biology)
T.-f. Lee and T.W. McNellis. Eliminationof keratin artifact bands from western blots by using
low concentration of reducing agents. 2008 (Submitted, Analytical Biochemistry)
Leu, J.H, Yan, S.J, Lee, T.-f., Chou, C.M., Chen, S.T., Hwang, P.P., Chou, C.K. and C.J. Huang.
2000. Complete genomic organization and promoter analysis of the round-spotted pufferfish
JAK1, JAK2, JAK3, and TYK2 genes. DNA Cell Biol 19(7):431-46