Embed Size (px)
Citation preview
Chapter E
Characterization of the Quality of Coals from the Illinois Basin By R.H. Affolter and J.R. Hatch
Chapter E of
Resource Assessment of the Springfield, Herrin, Danville, and Baker Coals in the Illinois Basin Edited by J.R. Hatch and R.H. Affolter
U.S. Geological Survey Professional Paper 1625–D
U.S. Department of the Interior U.S. Geological Survey

Contents
Introduction .......................................................................................................................................... E1 Acknowledgments and Products .................................................................................................... 1 Geologic Framework............................................................................................................................ 1 Stratigraphic Nomenclature............................................................................................................... 1 Methods................................................................................................................................................. 4
U.S. Geological Survey............................................................................................................... 4 Illinois State Geological Survey................................................................................................ 4 Indiana Geological Survey......................................................................................................... 5 Kentucky Geological Survey ..................................................................................................... 5
Explanation of Data Selected for the Illinois Basin Assessment ................................................. 6 Importance of Coal Quality ................................................................................................................. 8 Coal Quality in the Illinois Basin ........................................................................................................ 11
Ash Yield ....................................................................................................................................... 11 Sulfur ............................................................................................................................................. 15 Calorific Value.............................................................................................................................. 15
Element Composition ........................................................................................................................... 19 Conclusion ............................................................................................................................................ 19 References Cited.................................................................................................................................. 23 Appendixes
1. Summary descriptive statistics of proximate and ultimate analyses, calorific values, forms-of-sulfur analyses, and ash-fusion temperatures for all assessed and nonassessed coals in the Illinois Basin........................................ E27
2. Summary descriptive statistics of proximate and ultimate analyses, calorific values, forms-of-sulfur analyses, and ash-fusion temperatures for all assessed and nonassessed coals in the Illinois Basin as analyzed by the Illinois State Geological Survey, Indiana Geological Survey, Kentucky Geological Survey, and U.S. Geological Survey ............................................................................................... 39
3. Summary descriptive statistics of ash yields and contents of selected elements for all assessed and nonassessed coals in the Illinois Basin .................................... 64
4. Summary descriptive statistics of ash yields and contents of selected elements for all assessed and nonassessed coals in the Illinois Basin as analyzed by the Illinois State Geological Survey, Indiana Gelogical Survey, Kentucky Geological Survey, and U.S. Geological Survey ............................................................ 76
5. Minimum, maximum, percentile, and median values of ash yield, sulfur content, calorific value, and elements of environmental concern for assessed and nonassessed coals, grouped by assessed coal or stratigraphic unit in the Illinois Basin ........................................................................................................................ 97
6. Histograms of ash yield, sulfur content, calorific value, and elements of environmental concern for the Springfield, Herrin, and Danville-Baker Coals in the Illinois Basin.............................................................................................................. 114
7. Graduated symbol maps for ash yield, sulfur content, calorific value, and elements of environmental concern for the Springfield, Herrin, and Danville-Baker Coals in the Illinois Basin ....................................................................... 163
8. Explanation of chemical data columns in the U.S. Geological Survey,
EII

Indiana Geological Survey, Kentucky Geological Survey, and Illinois State Geological Survey’s coal database files created for the resource assessment of the Springfield, Herrin, Danville, and Baker Coals in the Illinois Basin ................. 203
Figures
1. Map showing location of the Illinois Basin study area in the United States in relation to other areas assessed during the National Coal Resource Assessment Project.......................................................................................... E2
2. Stratigraphic chart of the Pennsylvanian System in the Illinois Basin, showing major coal members ........................................................................................................... 3
3. Flow diagram of analytical procedures used through September 1990 for the analysis of coal samples from the Illinois Basin assessment...................................... 8
4. Map showing localities of Pennsylvanian samples from assessed coals in the Illinois Basin for which chemical data are available ................................................... 9
5. Map showing localities of Pennsylvanian samples from nonassessed coals in the Illinois Basin for which chemical data are available ............................................. 10
6–11. Graduated-symbol maps: 6. Ash yield of the Danville-Baker Coals in the Illinois Basin ................................ 12 7. Ash yield of the Herrin Coal in the Illinois Basin.................................................. 13 8. Ash yield of the Springfield Coal in the Illinois Basin ......................................... 14 9. Sulfur content of the Danville-Baker Coals in the Illinois Basin........................ 16
10. Sulfur content of the Herrin Coal in the Illinois Basin ......................................... 17 11. Sulfur content of the Springfield Coal in the Illinois Basin................................. 18
12. Diagram showing distribution of sulfate, organic, and pyritic sulfur from the assessed Pennsylvanian Springfield, Herrin, and Danville-Baker Coals in the Illinois Basin .............................................................................................................. 19
13–15. Graduated-symbol maps: 13. Calorific values of the Danville-Baker Coals in
the Illinois Basin .................................................................................................................. 20 14. Calorific values of the Herrin Coal in
the Illinois Basin .................................................................................................................. 21 15. Calorific values of the Springfield Coal in
the Illinois Basin .................................................................................................................. 22
Tables
1. State, coal-bearing stratigraphic unit, coal name of assessed coals, number of samples, data source, and name of ASCII file containing chemical data from coal samples for the Illinois Basin coal assessment .................................. E5
2. State, coal-bearing stratigraphic unit, coal names of nonassessed coals, number of samples, data source, and name of ASCII file containing chemical data from coal samples for the Illinois Basin coal assessment .................................. 6
3. Data source, number of samples analyzed, name of ASCII file containing chemical data, State, coal-bearing stratigraphic unit, and coal names of assessed coals for the regional summaries from the Illinois Basin coal assessment ........................................................................................................................... 7
4. Mean content of elements of environmental concern (1990 Clean Air Act Amendment) for coals from the Illinois Basin coal assessment ................................. 23
5. Comparison of the mean content of elements of environmental concern (1990 Clean Air Act Amendment) for the Illinois Basin assessed coals (Danville, Baker, Herrin, and Springfield Coals only) with coals from the Appalachian Basin, Colorado Plateau coal assessment area, Gulf Coast, and Western United States Tertiary coal ........................................................................ 23
EIII

Characterization of the Quality of Coals from the Illinois Basin By R.H. Affolter1 and J.R. Hatch1
Introduction
The goal of the Illinois Basin Coal Assessment Project is to provide an overview of the geologic setting, distribution, resources, and quality of Pennsylvanian coal in the Illinois Basin. This assessment is part of the U.S. Geological Survey's National Coal Resource Assessment Program (NCRA), which includes, along with the Illinois Basin, the Colorado Plateau, the Northern Rocky Mountains and Northern Great Plains region, the Appalachian Basin, and the Gulf Coast region of the United States (fig. 1). Such studies are of considerable significance because environmental mandates and concerns relating to coal development have become increasingly important to the National interest.
This assessment is different from previous U.S. Geological Survey coal assessments in that the major emphasis is placed on coals that are most likely to be major sources of energy over the next few decades (Gluskoter and others, 1996). Another major difference is that data are being collected and stored in a digital format that can be updated as new information becomes avail-able. In the future, environmental considerations may eventually control which coals will be mined and will determine what preventative procedures will be implemented in order to reduce sulfur and possibly trace element emissions from coal-burning power plants. It is also expected that in the future, emphasis will be placed on coal combustion products and the challenges of disposal and utilization of these products. Therefore, this coal-quality assessment includes not only information on ash, sulfur, and calorific content, but also information on the major-, minor-, and trace-element content of these coals. Characterization of coal quality is an important aspect of the assessment program in that it provides a synthesis and analysis of data that will influence future utilization of this valuable resource.
Acknowledgments and Products
The Illinois Basin coal assessment was completed in cooperation with multidisciplinary groups of scientists, technicians, and computer specialists from the U.S. Geological Survey (USGS), the Indiana Geological Survey (IGS), the Kentucky Geological Survey (KGS), and the Illinois State Geological Survey (ISGS). Together, these three state surveys make up the Illinois Basin Consortium (IBC). The main products of this assessment are digital databases that contain all publicly avail-able point-source data on thickness, depth, and coal quality for the Springfield, Herrin, Danville, and Baker Coals, which are the major mined coals in the basin. From this database, statewide
1U.S. Geological Survey, Mail Stop 939, Box 25046, Denver, CO 80225
maps have been prepared that depict thickness, elevation (structure), mined-out areas, and extents of the principal areas where the coals may potentially be mined at the surface or recovered from underground. This information is available as digital products accessible in a variety of interpretive and interactive forms (see the ArcView section of this publication).
Geologic Framework
The Illinois Basin coal assessment area includes parts of Illinois, southwestern Indiana, and western Kentucky, containing the largest reserve base of bituminous coal of any basin in the United States. Coal production in 2000 was about 88.4 million short tons (Freme, 2001). However, this production level is declining (down from 104 million short tons in 1999) and is expected to decline further as electric utilities switch from high-sulfur Illinois Basin coal to low-sulfur western coal. Assessments of the original and remaining coal resources, coal compositions, and recoverable coal reserves in the Illinois Basin have at least a 100-year history. The last major coal assessment by the U.S. Geological Survey was done in 1974 (Averitt, 1975).
Coal-bearing rocks in the Illinois Basin are part of the East-ern Region of the Interior Coal Province (Trumball, 1960). These rocks are of Pennsylvanian age and were formed between about 325 and 290 million years ago. In the Illinois Basin, the Pennsylvanian rocks are divided into the Raccoon Creek Group, the Carbondale Group or Formation, and the McLeansboro Group. Correlations of these strata across Illinois, southwestern Indiana, and western Kentucky are shown in figure 2.
Stratigraphic Nomenclature
The Raccoon Creek Group, Carbondale Formation, and McLeansboro Group are defined the same in Illinois and western Kentucky (Jacobson and others, 1985), but are defined differently in Indiana (see fig. 2). The main differences are
(1) The Raccoon Creek Group in Illinois and western Kentucky is divided into the Caseyville and Trade-water Formations. The Raccoon Creek Group in Indiana consists of the Mansfield, Brazil, and Staunton Formations.
(2) The Carbondale Formation is recognized in Illinois and Kentucky. The Carbondale Group is recognized in Indiana, where it is divided into the Linton, Petersburg, and Dugger Formations.
(3) In Indiana, the Seelyville Coal Member is at the top of the Staunton Formation of the Raccoon Group, whereas in Illinois and western Kentucky the Seelyville Coal and equivalents are in the Carbondale Formation.
E1

Figure 1. Map showing location of the Illinois Basin study area in the United States in relation to other areas assessed during the National Coal Resource Assessment Project.
(4) The base of the McLeansboro Group and the base of the Shelburn Formation in Illinois and Kentucky are at the top of the Herrin Coal. The base of the Shelburn Formation is at the top of the Danville Coal Member in Indiana.
(5) The Springfield Coal is in the Carbondale Formation in Illinois and western Kentucky and in the Petersburg Formation in Indiana. The Herrin Coal is in the Carbondale Formation in Illinois and western Kentucky and in the Dugger Formation in Indiana; however, the Herrin Coal Member is neither well developed nor mined in Indiana. The Danville Coal Member is in the Shelburn Formation of the McLeansboro Group in Illinois and in the Dugger Formation of the Carbondale Group in Indiana. The Baker coal is in the Shelburn Formation of the McLeansboro Group in western Kentucky.
(6) In Illinois (Hopkins and Simon, 1975) and Indiana (Mastalerz and Harper, 1998), the Springfield, Herrin, and Danville Coal Members, as well as most other coals, are formally recognized stratigraphic members. In western Kentucky, coals are not given that same sta
tus (for example, the Baker coal) (Greb and others, 1992). For this assessment report, when discussing coals in a given State we will follow the stratigraphic nomenclature previously established for that State. When referring to a coal, or coals, in an area that includes parts of States having different stratigraphic nomenclatures, we will list the coal name as the Spring-field Coal, Herrin Coal, Danville Coal, or Baker Coal. When summarizing and comparing the chemistry of the coals, we have chosen to combine the Danville and Baker Coals (Danville-Baker) as stratigraphically equivalent units and also to list them as separate coals for each State.
The primary focus of this chapter is the chemical composition of coals from the Springfield Coal (Illinois No. 5, western Kentucky No. 9, Indiana V), the Herrin Coal (Illinois No. 6, west-ern Kentucky No. 11), the Danville Coal (Illinois No. 7, Indiana VII), and the Baker coal (western Kentucky No. 13). The Spring-field and Herrin Coals are in the Carbondale Formation or Group in all three States. The Danville-Baker Coals are within the McLeansboro Group in Illinois and western Kentucky but within the Carbondale Group in southwestern Indiana. The chemical
E2 Resource Assessment of the Springfield, Herrin, Danville, and Baker Coals in the Illinois Basin

Coal quality in the Illinois B
asin
Figure 2. Stratigraphic chart of the Pennsylvanian system in the Illinois Basin, showing major coal members. Modified from Mastalerz and Harper (1998, fig. 2) and Greb and others (1992, fig. 22). Fm., Formation; Gp, Group; , problematic coal correlations.
E3
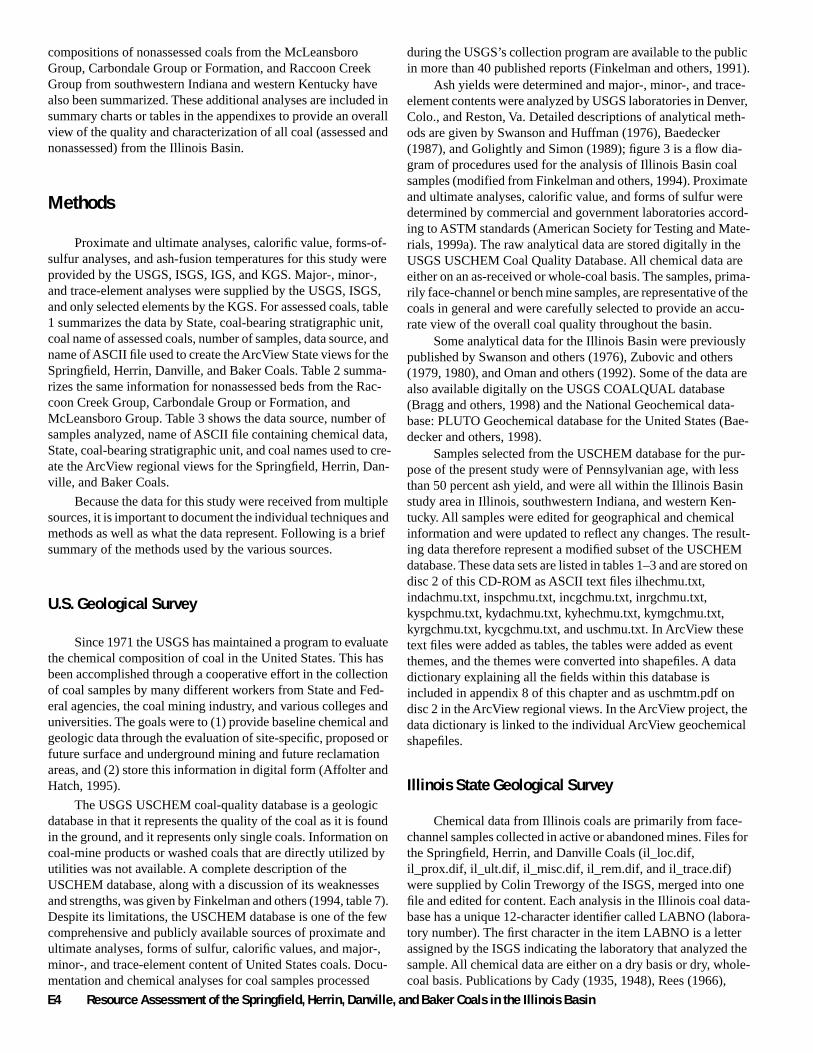
compositions of nonassessed coals from the McLeansboro Group, Carbondale Group or Formation, and Raccoon Creek Group from southwestern Indiana and western Kentucky have also been summarized. These additional analyses are included in summary charts or tables in the appendixes to provide an overall view of the quality and characterization of all coal (assessed and nonassessed) from the Illinois Basin.
Methods
Proximate and ultimate analyses, calorific value, forms-of-sulfur analyses, and ash-fusion temperatures for this study were provided by the USGS, ISGS, IGS, and KGS. Major-, minor-, and trace-element analyses were supplied by the USGS, ISGS, and only selected elements by the KGS. For assessed coals, table 1 summarizes the data by State, coal-bearing stratigraphic unit, coal name of assessed coals, number of samples, data source, and name of ASCII file used to create the ArcView State views for the Springfield, Herrin, Danville, and Baker Coals. Table 2 summarizes the same information for nonassessed beds from the Raccoon Creek Group, Carbondale Group or Formation, and McLeansboro Group. Table 3 shows the data source, number of samples analyzed, name of ASCII file containing chemical data, State, coal-bearing stratigraphic unit, and coal names used to create the ArcView regional views for the Springfield, Herrin, Danville, and Baker Coals.
Because the data for this study were received from multiple sources, it is important to document the individual techniques and methods as well as what the data represent. Following is a brief summary of the methods used by the various sources.
U.S. Geological Survey
Since 1971 the USGS has maintained a program to evaluate the chemical composition of coal in the United States. This has been accomplished through a cooperative effort in the collection of coal samples by many different workers from State and Federal agencies, the coal mining industry, and various colleges and universities. The goals were to (1) provide baseline chemical and geologic data through the evaluation of site-specific, proposed or future surface and underground mining and future reclamation areas, and (2) store this information in digital form (Affolter and Hatch, 1995).
The USGS USCHEM coal-quality database is a geologic database in that it represents the quality of the coal as it is found in the ground, and it represents only single coals. Information on coal-mine products or washed coals that are directly utilized by utilities was not available. A complete description of the USCHEM database, along with a discussion of its weaknesses and strengths, was given by Finkelman and others (1994, table 7). Despite its limitations, the USCHEM database is one of the few comprehensive and publicly available sources of proximate and ultimate analyses, forms of sulfur, calorific values, and major-, minor-, and trace-element content of United States coals. Documentation and chemical analyses for coal samples processed
during the USGS’s collection program are available to the public in more than 40 published reports (Finkelman and others, 1991).
Ash yields were determined and major-, minor-, and trace-element contents were analyzed by USGS laboratories in Denver, Colo., and Reston, Va. Detailed descriptions of analytical methods are given by Swanson and Huffman (1976), Baedecker (1987), and Golightly and Simon (1989); figure 3 is a flow diagram of procedures used for the analysis of Illinois Basin coal samples (modified from Finkelman and others, 1994). Proximate and ultimate analyses, calorific value, and forms of sulfur were determined by commercial and government laboratories according to ASTM standards (American Society for Testing and Mate-rials, 1999a). The raw analytical data are stored digitally in the USGS USCHEM Coal Quality Database. All chemical data are either on an as-received or whole-coal basis. The samples, primarily face-channel or bench mine samples, are representative of the coals in general and were carefully selected to provide an accurate view of the overall coal quality throughout the basin.
Some analytical data for the Illinois Basin were previously published by Swanson and others (1976), Zubovic and others (1979, 1980), and Oman and others (1992). Some of the data are also available digitally on the USGS COALQUAL database (Bragg and others, 1998) and the National Geochemical data-base: PLUTO Geochemical database for the United States (Bae-decker and others, 1998).
Samples selected from the USCHEM database for the purpose of the present study were of Pennsylvanian age, with less than 50 percent ash yield, and were all within the Illinois Basin study area in Illinois, southwestern Indiana, and western Kentucky. All samples were edited for geographical and chemical information and were updated to reflect any changes. The resulting data therefore represent a modified subset of the USCHEM database. These data sets are listed in tables 1–3 and are stored on disc 2 of this CD-ROM as ASCII text files ilhechmu.txt, indachmu.txt, inspchmu.txt, incgchmu.txt, inrgchmu.txt, kyspchmu.txt, kydachmu.txt, kyhechmu.txt, kymgchmu.txt, kyrgchmu.txt, kycgchmu.txt, and uschmu.txt. In ArcView these text files were added as tables, the tables were added as event themes, and the themes were converted into shapefiles. A data dictionary explaining all the fields within this database is included in appendix 8 of this chapter and as uschmtm.pdf on disc 2 in the ArcView regional views. In the ArcView project, the data dictionary is linked to the individual ArcView geochemical shapefiles.
Illinois State Geological Survey
Chemical data from Illinois coals are primarily from face-channel samples collected in active or abandoned mines. Files for the Springfield, Herrin, and Danville Coals (il_loc.dif, il_prox.dif, il_ult.dif, il_misc.dif, il_rem.dif, and il_trace.dif) were supplied by Colin Treworgy of the ISGS, merged into one file and edited for content. Each analysis in the Illinois coal data-base has a unique 12-character identifier called LABNO (laboratory number). The first character in the item LABNO is a letter assigned by the ISGS indicating the laboratory that analyzed the sample. All chemical data are either on a dry basis or dry, whole-coal basis. Publications by Cady (1935, 1948), Rees (1966),
E4 Resource Assessment of the Springfield, Herrin, Danville, and Baker Coals in the Illinois Basin

Table 1. State, coal-bearing stratigraphic unit, coal name of assessed coals, number of samples, data source, and name of ASCII file containing chemical data from coal samples for the Illinois Basin coal assessment.
No. of Data Stratigraphic unit Coal name samples source File nameState
Illinois
Indiana
Kentucky
Shelburn Formation
Carbondale Formation
Dugger Formation
Petersburg Formation
Shelburn Formation
Carbondale Formation
Danville (No. 7) 170 ISGS1 Ildachms.txt
Herrin (No. 6) 77 USGS2 Ilhechmu.txt 2,330 ISGS Ilhechms.txt
Springfield (No. 5) 1,171 ISGS Ilspchms.txt
Danville (VII)
Springfield (V)
Baker Baker (No. 13)
Herrin Herrin (No. 11) SpringfieldSpringfield (No. 9)
115 IGS3 Indachms.txt 19 USGS Indachmu.txt
336 IGS Inspchms.txt 49 USGS Inspchmu.txt
19 KGS4 Kydachms.txt 15 USGS Kydachmu.txt
121 KGS Kyhechms.txt 20 USGS Kyhechmu.txt
259 KGS Kyspchms.txt 31 USGS Kyspchmu.txt
1Illinois State Geological Survey 2U.S. Geological Survey 3Indiana Geological Survey 4Kentucky Geological Survey
Gluskoter and others (1977), and Harvey and others (1983, 1985) ries, therefore resulting in slightly different analytical results. document and list in detail the analytical procedures used by the Also, some location descriptions have been updated. Illinois State Geological Survey for most coal samples. Text files from Hasenmueller and Miller’s 1992 report
Samples from this ISGS file were retrieved if they contained (igschm1l, igschm1c, igschm1r, igschm2l, igschm2c, igschm2r, less than 50 percent ash yield and were within the Illinois part of igschm3l, igschm3c, igschm3r) were merged and modified. the Illinois Basin study area. All samples were edited for geo- Samples from this merged file were retrieved if they contained graphical and chemical information and were updated to reflect less than 50 percent ash yield and were collected within the south-any changes. The resulting data set is therefore a modified subset western Indiana part of the Illinois Basin study area. All samples of the ISGS chemical database. These data sets are listed in tables were edited for geological and chemical information and were 1 and 3 and stored on disc 2 of on this CD-ROM as ASCII text updated to reflect any changes. This resulting data set is therefore files ildachms.txt, ilhechms.txt, ilspchems.txt, and ilchms.txt. In a modified subset of the coal analysis database published by ArcView the text files were added as tables, the tables were added Hasenmueller and Miller (1992). The data are listed in tables 1–3 as event themes, and the themes were converted into shapefiles. A and stored as ASCII text files indachms.txt, inspchms.txt, data dictionary explaining all the fields within this database is incgchms.txt, inrgchms.txt, and inchms.txt on disc 2 of this CD-included in appendix 8 and as ilchmtm.pdf on disc 2 in the Arc- ROM. In ArcView, the text files were added as tables, the tables View regional views. This data dictionary is linked to the indi- were added as event themes, and the themes were converted into vidual ArcView geochemical shapefiles. shapefiles. All chemical data are on an as-received basis and con
tain no major-, minor-, or trace-element data. A data dictionary explaining all the fields within this database is included in appen-
Indiana Geological Survey dix 8 and as inchmtm.pdf on disc 2 in the ArcView regional views. In the ArcView project the data dictionary is linked to the individual ArcView geochemical shapefiles.
Samples from Indiana were collected by the IGS, primarily from face-channels in mines, with some mine tipple and grab samples where no other samples were available. These data were selected from "The Indiana Coal Analysis Database; Computer Kentucky Geological Surveydatabase 1" by Hasenmueller and Miller (1992). Some of these data were also published by Hasenmueller (1994) and Mastalerz Samples from Kentucky are primarily from face channels in and Harper (1998). All analyses were done according to ASTM mines and were collected either by the KGS or by the USGS. standards (American Society for Testing and Materials, 1999a). Files (wky1.xls, wky2.xls, wky3.xls, and wky4.xls) were sup-Some of these analyses were performed on sample splits received plied by Cortland Eble of the KGS, merged into one file, and then from the USGS that were analyzed by several different laborato- edited for content. Samples from this merged file were retrieved
Coal quality in the Illinois Basin E5
Table 2. State, coal-bearing stratigraphic unit, coal names of nonassessed coals, number of samples, data source, and name of ASCII file containing chemical data from coal samples for the Illinois Basin coal assessment.
State Stratigraphic unit Coal names
Indiana Carbondale Group Bucktown, Colchester, Houchin Creek, Hymera, Survant, unnamed Dugger, and unnamed Linton.
Bucktown V-B, Colchester, Houchin Creek IV-A, Hymera VI, Survant IV.
Raccoon Creek Group Blue Creek, Buffaloville, French Lick, Lower Block, Mariah Hill, Minshall, Pinnick, Seelyville, St. Meinrad, unnamed Brazil, unnamed Mansfield, unnamed Staunton, Upper Block
Blue Creek, Buffaloville, Lower Block, Mariah Hill, Seelyville III, St. Meinrad, unnamed Brazil, unnamed Mansfield, unnamed Staunton, Upper Block
Kentucky Carbondale Formation Briar Hill, Dekoven, No. 6, No. 7, No. 8, No. 8B, Schultztown
No. 6, No. 7, No. 8, No. 8B
Raccoon Creek Group Aberdeen, Amos, Amos Rider, Bancroft, Bell, Deanfield, Dunbar, Elm Lick B, Elm Lick C, Foster, Main Nolin, No. 4A, No. 5
Amos, Deanfield, Dunbar, Elm Lick, Elm Lick Zone, Empire, Foster, Hawesville, Lead Creek, No. 1B, No. 4, No. 4A, No. 5, Nolin
McLeansboro Group Coiltown, No. 12, No. 13B split
No. 12, No. 14
1Indiana Geological Survey 2U.S. Geological Survey 3Kentucky Geological Survey
No. of Data File samples source name
313 IGS1 Incgchms.txt
44 USGS2 Incgchmu.txt
586 IGS Inrgchms.txt
106 USGS Inrgchmu.txt
42 KGS3 Kycgchms.txt
42 USGS Kycgchmu.txt
87 KGS Kyrgchms.txt
43 USGS Kyrgchmu.txt
57 KGS Kymgchms.txt
25 USGS Kymgchmu.txt
if they contained less than 50 percent ash yield and were collected kychms.txt on disc 2 of this CD-ROM. In ArcView, the text files within the western Kentucky part of the Illinois Basin study area. were added as tables, the tables were added as event themes, and All samples were edited for geographical and chemical informa- the themes were converted into shapefiles. A data dictionary tion and were updated to reflect any changes. The resulting data explaining all the fields within this database is included in set is therefore a modified subset of the KGS's chemical database. appendix 8 and as kychmtm.pdf on disc 2 in the ArcView All chemical data are on a dry basis or a dry, whole-coal basis and regional views. In the ArcView project, the data dictionary is contain proximate and ultimate analyses, calorific values, and linked to the individual ArcView geochemical shapefiles. only selected major-, minor-, and trace element data; forms of sulfur or ash-fusion temperature data are not included. All proximate and ultimate analyses were done according to ASTM stan- Explanation of Data Selected for the Illinois dards (American Society for Testing and Materials, 1999a). Some Basin Assessment of the data may consist of duplicate analyses from the USGS that were analyzed by different methods. There is limited published The chemical information on the Illinois Basin coals pre-information on the specific analytical methods that were used to sented in this report is a compilation of data that were collected determine KGS coal quality data. Some data were published by during the last 30–50 years by the USGS, ISGS, IGS, and KGS. Currens (1986), and additional information about the samples The coal-quality data are primarily from samples of the Spring-may be obtained from the KGS. field, Herrin, Danville, and Baker Coals (assessed coals), with
Data acquired on Kentucky coals are listed in tables 1–3 and additional samples of coals (nonassessed) from the Raccoon stored as ASCII text files kyspchms.txt, kyhechms.txt, Creek Group, the Carbondale Group or Formation, and the kydachms.txt, kycgchms.txt, kyrgchms.txt, kymgchms.txt, and McLeansboro Group. Figure 4 shows the sample localities for E6 Resource Assessment of the Springfield, Herrin, Danville, and Baker Coals in the Illinois Basin

Table 3. Data source, number of samples analyzed, name of ASCII file containing chemical data, State, coal-bearing stratigraphic unit, and coal names of assessed coals for the regional summaries from the Illinois Basin coal assessment.
Data No. of source samples File name State Stratigraphic unit Coal name
ISGS1 3,671 Ilchms.txt Illinois Shelburn Formation
Carbondale Formation
IGS2 451 Inchms.txt Indiana Dugger Formation Petersburg Formation
KGS3 399 Kychms.txt Kentucky Shelburn Formation
Carbondale Formation
USGS4 211 Uschmu.txt Indiana Dugger Formation Kentucky Shelburn Formation Illinois Carbondale Formation Kentucky Carbondale Formation Indiana Petersburg Formation Kentucky Carbondale Formation
Danville (No. 7)
Herrin (No. 6) Springfield (No. 5)
Danville (VII) Springfield (V)
Baker
Herrin Springfield
Danville (VII) Baker (No. 13) Herrin (No. 6) Herrin (No. 11) Springfield (V) Springfield (No. 9)
1 Illinois State Geological Survey 2 Indiana Geological Survey 3 Kentucky Geological Survey 4 U.S. Geological Survey
the assessed coals in the Illinois Basin, and figure 5 shows the sample localities for nonassessed coals in the Illinois Basin that have been chemically analyzed.
Chemical data for this study were derived from many different sources; hence, they may reflect variations in the quality of analytical results. Analytical procedures have changed through time, with improved detection limits being made possible by new and more precise analytical methods. Because of differences in the precision of various analytical techniques and for consistency, the analytical values in the trace-element summary tables are reported to only two significant figures for most elements. Mercury and cadmium are reported to no more than two decimal places, and antimony and selenium to only one decimal place. Proximate and ultimate analyses and total sulfur are reported to one decimal place. Calorific values are reported to the nearest 10 Btu, ash-fusion temperatures to the nearest 5° F., and forms of sulfur to two decimal places. Also for consistency and meaningful comparison of the chemical composition of these coals, all proximate and ultimate analyses, calorific value, forms of sulfur, and ash-fusion temperatures were calculated to an as-received basis by formula ASTM D3180 (American Society for Testing and Materials, 1999b) (see appendixes 1 and 2). All elements were calculated to an as-received, whole-coal basis and are presented in percent or as parts per million (see appendixes 3 and 4). Because some of these coals show a wide range in values, the mean is not always the best estimate of the average value. There-fore, we have also included the median, which is a better measure of the central tendency when values have large ranges and (or) nonnormal data distributions.
A common problem in statistical summaries of trace-element data arises when element values are below the limits of
analytical detection. This results in a censored distribution. To compute unbiased estimates of censored data for the summary statistics in this report (tables in appendixes 1–4), we adopted the protocol of reducing all “ less than” values by 50 percent before summary statistics were generated. For example, a reported value of 4.0L was changed to 2.0L, which was then used to calculate basic statistics.
The uneven geographic distribution of sample localities precludes a thorough and detailed analysis of all coals within the Illinois Basin assessment area. For comparison across the basin, representative coal samples were carefully selected and restricted to samples containing less than 50 percent ash yield (Wood and others, 1983). Samples were also carefully selected in order to provide a regional and State view of the quality for each coal. In order to adequately characterize these coals, some chemical comparisons were made among individual Illinois Basin coals and also among these coals and other major coals of Pennsylvanian, Cretaceous, and Tertiary ages that make up most of the market-able coal in the United States. Comparison with these other coals allowed us to evaluate and contrast the quality of Illinois Basin coal with other coal mined in the United States.
Appendix 1 consists of 11 tables that show the number of samples and summary statistics for the proximate and ultimate analyses, calorific value, forms-of-sulfur analyses, and ash-fusion temperatures for all coals in the Illinois Basin, presented on a regional basis; appendix 2 consists of 24 tables that show similar data for all coals in the Illinois Basin on a statewide basis. Appendix 3 consists of 11 tables that show the number of samples and summary statistics for ash yield and 38 elements in all coals in the Illinois Basin, on a regional basis; appendix 4 consists of 20 tables that show similar data for all coals in the Illinois Basin,
Coal quality in the Illinois Basin E7

Figure 3. Flow diagram of analytical procedures used through September 1990 for the analysis of coal samples from the Illinois Basin assessment. Modified from Finkelman and others (1994). ASTM, American Society for Testing and Materials, 1999; USGS, United States Geological Survey.
presented on a statewide basis. Tables 1–3 list all ASCII text Importance of Coal Qualitydatabase file names for all coal samples that were used in this study. These files contain all the original (as received from the Hatch and Swanson (1977) suggested four general reasons individual States) compositional data reported on the basis in why coal-quality data are necessary for the proper assessment and which they were received and contains correct significant figures. utilization of coal:Qualified data in these files are indicated by L (less than), B (not (1) Evaluation of environmental impacts of mining of determined), N (not detected), or G (greater than). coal
E8 Resource Assessment of the Springfield, Herrin, Danville, and Baker Coals in the Illinois Basin

Coal quality in the Illinois B
asin
Figure 4. Localities of Pennsylvanian samples from assessed coals in the Illinois Basin for which chemical data are available.
E9

E10Resource A
ssessment of the Springfield, H
errin, Danville, and B
aker Coals in the Illinois Basin
Figure 5. Localities of Pennsylvanian samples from nonassessed coals in the Illinois Basin for which chemical data are available.

(2) Evaluation of the best and most effective technological use of coal (for example, combustion, liquefaction, gasification)
(3) Determination of the potential economic benefits of the extraction of elements such as germanium, selenium, uranium, vanadium, and zinc from the coal
(4) Development of geologic and geochemical models for the interpretation and prediction of coal quality and for relating these factors to the stratigraphic and sedimentological framework
Health issues related to increased utilization of coal, either as a result of mining or combustion, are also important factors. Current coal-quality issues related to coal combustion are now focusing on the release of particulate matter, sulfur, and trace elements, as well as acid-rain and greenhouse-gas effects. The quality of the coal mined and burned impacts air and water quality. It also affects disposal of the solid waste (fly ash desulfurization sludge, washing plant sludge, and bottom ash), recovery of economic coal combustion products (CCP’s), and power plant efficiency.
With emphasis on elements of environmental concern as indicated in the 1990 Clean Air Act Amendment (U.S. Statutes at Large, 1990, Public Law 101–549), there has been concern about the possible health effects of increased coal utilization. This Clean Air Act Amendment has identified several potentially hazardous air pollutants, including antimony, arsenic, beryllium, cadmium, cobalt, lead, manganese, mercury, nickel, selenium, and uranium. Because coal-quality data are an essential component of the USGS resource classification system (Wood and others, 1983), and because utilization of coal may be regulated by its possible effect on the environment, any evaluation of future coal resource potential must and should consider quality as well as quantity.
Coal Quality in the Illinois Basin
The main purpose of this coal-quality study is to list and summarize coal chemical information from the Illinois Basin, illustrating regional trends, and to graphically display the information. Summary tables of regional data (Illinois Basin) and individual State data were compiled. These tables are supplemented with range plots and histograms that compare ash, sulfur, calorific values, and contents of potentially hazardous air pollutants (antimony, arsenic, beryllium, cadmium, chromium, cobalt, lead, manganese, mercury, nickel, selenium, thorium, and uranium). Most of the chemical data listed and summarized for this coal assessment have been previously published and discussed by various authors over the last 30 years.
Appendix 5 consists of diagrams showing minimum, maxi-mum, and median values for ash yield, sulfur content, and calorific value for the Danville-Baker, Herrin, and Springfield Coals. Also included for comparison are the McLeansboro Group, Carbondale Group or Formation, and Raccoon Creek Group Coals. In summarizing and comparing coals on a regional basis, we have chosen to treat the combined Danville and Baker Coals as strati-graphically equivalent coals; they are therefore summarized together as the Danville-Baker Coals. Appendix 6 consists of frequency histograms for ash yield, sulfur content, calorific value,
and elements of environmental concern for the Danville-Baker, Herrin, and Springfield Coals from the Illinois Basin. Appendix 7 consists of graduated-symbol maps for ash yield, sulfur, calorific value, and elements of environmental concern for samples of assessed coal from the Illinois Basin.
Ash Yield
On a regional basis, the assessed coals can be characterized by mean ash yield of 11.9 percent for the Danville-Baker Coals (range 4.2–44.2 percent, fig. 6), 10.9 percent for the Herrin Coal (range 2.4–43.6 percent, fig. 7), and 11.2 percent for the Spring-field Coal (range 2.8–49.7 percent, fig. 8). The mean for these assessed coals is 11.1 percent. Nonassessed coals can be characterized regionally by mean ash yields of 10 percent for coal in the Raccoon Creek Group (range 1.5–48.7 percent), 12.8 percent for coal from the nonassessed Carbondale Group or Formation (range 3.6–48.5 percent), and 14.1 percent for coal from the McLeansboro Group (range 6.0–28.7 percent). The mean for these nonassessed coals is 11.2 percent, which is essentially the same as the ash yield for the assessed coals.
Ash yield is variable within individual coals, both vertically and laterally, and the variability is probably the result of changes in the amounts and composition of the mineral matter in the coals. The mineralogical composition of Illinois Basin coal has been extensively studied by Gluskoter (1965,1967b, 1975), Rao and Gluskoter (1973), and Ward (1977). Based on low-temperature ash techniques on selected coals, the mineralogical composition (Damberger, 1999) of these coals is characterized by clay minerals (Herrin 9.4 percent, Springfield 7.0 percent), quartz (Herrin 2.4 percent, Springfield 2.4 percent), pyrite (Herrin 3.4 percent, Springfield 3.9 percent), and calcite (Herrin 1.3 percent, Springfield 1.6 percent).
Studies of other minerals and elements present in Illinois Basin coals have been reported by Gluskoter and Rees (1964) (chlorine), Gluskoter (1967a) (chlorine), Gluskoter and Ruch (1971) (chlorine and sodium), Bohor and Gluskoter (1973) (boron in illite), and Harvey and others (1983) (detailed studies on the spatial distribution of selected trace-element and mineral-matter associations within the Herrin and Springfield Coals in the Illinois Basin). Most zinc and cadmium in Illinois Basin coals are found in sphalerite (ZnS) and have been reported by Gluskoter and Lindahl (1973) (cadmium), Gluskoter and others (1973) (zinc), Hatch and others (1976) (zinc in sphalerite), Cobb and others (1979) (zinc in sphalerite), and Cobb and others (1980) (zinc and cadmium in sphalerite).
These studies show that the distributions and compositions of minerals within Illinois coals are dependent on many geologic and geochemical factors, including the chemical composition of original plants in the peat swamp, amounts and compositions of the various detrital, diagenetic, and epigenetic minerals, and the temperature and pressures during burial. For example, most zinc and cadmium in Illinois Basin coals are found in sphalerite (ZnS). This sphalerite was introduced into the coals millions of years after peat deposition by hydrothermal fluid-flow systems that were in operation at the end of the Permian (Hatch and others, 1976; Whelan and others, 1988).
Coal quality in the Illinois Basin E11

E12Resource A
ssessment of the Springfield, H
errin, Danville, and B
aker Coals in the Illinois Basin
Figure 6. Graduated-symbol map for ash yield (percent, as-received basis) of the Danville-Baker Coals in the Illinois Basin.

Coal quality in the Illinois B
asin
Figure 7. Graduated-symbol map for ash yield (percent, as-received basis) of the Herrin Coal in the Illinois Basin.
E13

E14Resource A
ssessment of the Springfield, H
errin, Danville, and B
aker Coals in the Illinois Basin
Figure 8. Graduated-symbol map for ash yield (percent, as-received basis) of the Springfield Coal in the Illinois Basin.

One of the characteristics of the Springfield in western Illinois and in the Springfield area (Sangamon, Logan, and Menard Counties of west-central Illinois) is the occurrence of a relatively high number of claystone dikes (“horsebacks”). These dikes cut through the coal seam from top to bottom as well as its roof strata and therefore may seriously influence the ash and sulfur content of the coal and strength of the roof strata.
Sulfur
On a regional basis, the assessed coals can be characterized by mean sulfur content of 2.9 percent for the Danville-Baker Coals (range 0.3–9.7 percent, fig. 9), 3.0 percent for the Herrin Coal (range 0.3–14.5 percent, fig. 10), and 3.5 percent for the Springfield Coal (range 0.5–19.5 percent, fig. 11). The mean is 3.2 percent. Nonassessed coals are characterized regionally by mean sulfur content of 2.9 percent for coal from the Raccoon Creek Group (range 0.1–30.1 percent), 3.2 percent for coal from the nonassessed Carbondale Group or Formation (range 0.3– 28.1 percent), and 3.7 for coal from the McLeansboro Group (range 1.7–8.0 percent). The mean is 3.0 percent, which is similar to the sulfur content of the assessed coals.
Sulfur content has been related to the type of roof rocks that directly overlie the coal. Most of the coals that are overlain by marine rocks, such as black shales or limestone, tend to have higher sulfur content, greater than 2.5 percent. Coals that are overlain by nonmarine gray shales more than 20 ft thick usually contain less than 2.5 percent sulfur (Gluskoter and Simon, 1968). Lower sulfur content in the Herrin and Springfield Coals has been reported for samples located near various sandstone channels (for example, the Walshville channel in the Herrin and the Galatia channel in the Springfield) that may be related to flu-vial splay deposits (Harvey and others, 1983).
In the Illinois Basin, the Springfield Coal is normally over-lain by a 6- to 24-in.-thick, black, fissile shale. However, in a 4-to 10-mi-wide area extending from Gibson County, Ind., to Saline County, Ill., a delta distributary system was active during deposition of peats that formed the Springfield Coal. Within this belt, the coal is absent or irregularly developed and is overlain by the gray, silty Dykersburg Shale Member of the Carbondale Formation (Illinois and Kentucky) or by the Dugger Formation (Indiana) (Hopkins, 1968). In this area, the Springfield Coal is from 5 to 10 ft thick and commonly split by shale partings. Where the Dykersburg Shale Member is thicker than about 20 ft, the coal typically is relatively low in sulfur (1.5–3 percent) (Cady, 1935; Damberger, 1999).
The Herrin Coal of the Dugger Formation (Indiana) or the Carbondale Formation (Illinois and western Kentucky) is normally overlain by as much as 4 ft of black, fissile shale (Anna Shale Member, Dugger Formation in Indiana, Carbondale Formation in Illinois and western Kentucky) or limestone (Brereton Limestone Member of the Dugger Formation in Indiana, Carbondale Formation in Illinois and western Kentucky). However, in parts of southern and central Illinois a delta distributary system (Walshville channel system) was active during deposition of peats that formed the Herrin Coal. Within this belt, the coal is eroded by a channel sandstone as much as 1 mi wide and 60–80 ft thick, or was irregularly developed and overlain by the
silty, gray Energy Shale Member of the Carbondale Formation, which is as much as 100 ft thick (Allgaier and Hopkins, 1975; Nelson, 1983). Where the Energy Shale Member is thick, the coal commonly is relatively low in sulfur. The thick Energy Shale Member overlies the Herrin Coal in four areas: (1) the Franklin-Williamson-Jefferson County area of southeastern Illinois (known as the “Quality Circle” area); (2) northern St. Clair County and adjacent Madison and Clinton Counties, in south-western Illinois; (3) eastern Macoupin County and adjacent Montgomery and Christian Counties, in west-central Illinois; and (4) southern Vermillion County, in east-central Illinois.
The sulfur content of the assessed Illinois Basin coals, which is mostly in the form of pyrite or organic sulfur (fig. 12 and appendixes 1 and 2), is relatively high as compared to other United States coals. The sulfur content of most United States coals was primarily dependent on pH-controlled levels of bacterial activity in the ancestral peat swamps (Cecil and others, 1982). This bacterial activity, along with the general presence of marine shales and carbonates overlying the coal, probably accounts for the high sulfur content of many of the Illinois Basin coals. Sulfur content might also be controlled by the location of the peat swamp. Affolter and Stricker (1989) suggested that the activity of sulfate-reducing bacteria in peat is related to temperature, as indicated by the paleolatitude of the peat swamp, and could affect the sulfur content. A comparison of paleolatitudes as calculated from paleomagnetic poles and sulfur contents of United States coals, indicates that the higher the latitude in which a peat swamp developed, the lower the mean sulfur content of the resulting coal deposit. For example, low-sulfur coals such as those in Cretaceous rocks of the Colorado Plateau formed at higher paleolatitudes (lat >35°), whereas higher sulfur coals such as those in the Pennsylvanian of the Illinois Basin formed at low paleolatitudes (lat 0°–15°).
Calorific Value
On a regional basis, the assessed coals of the Illinois Basin can be characterized by mean calorific values of 10,920 Btu/lb for the Danville-Baker Coals (range 5,800–12,990 Btu/lb, fig. 13), 11,170 Btu/lb for the Herrin Coal (range 5,770–13,420 Btu/ lb, fig. 14), and 11,280 Btu/lb for the Springfield Coal (range 4,810–3,910 Btu/lb, fig. 15). The mean is 11,200 Btu/lb for these assessed coals. The nonassessed coals are characterized region-ally by mean calorific values of 10,920 Btu/lb for coals from the nonassessed Carbondale Group or Formation (range 5,440– 13,200 Btu/lb), 11,190 Btu/lb for coals from the Raccoon Creek Group (range 4,540–13,620 Btu/lb), and 11,260 Btu/lb for coals from the McLeansboro Group (range 9,080–12,660 Btu/lb). The mean is 11,110 Btu/lb for these nonassessed coals.
Calorific values generally increase from the northwestern part of the coal basin to the southeastern part (Cady, 1935, 1948; Damberger, 1971). In western Kentucky, calorific value increases from east to west (Greb and others, 1992). The coal rank in much of the northern part of the basin in Illinois and Indiana is high-volatile-C bituminous coal (Cady, 1935, 1948; Damberger, 1971). In a small area in southeastern Illinois and western Kentucky, coal rank reaches high-volatile-A bituminous coal. These differences in rank were most likely caused by
Coal quality in the Illinois Basin E15

E16Resource A
ssessment of the Springfield, H
errin, Danville, and B
aker Coals in the Illinois Basin
Figure 9. Graduated-symbol map for sulfur content (percent, as-received basis) of the Danville-Baker Coals in the Illinois Basin.

Coal quality in the Illinois B
asin
Figure 10. Graduated-symbol map for sulfur content (percent, as-received basis) of the Herrin Coal in the Illinois Basin. E17

E18Resource A
ssessment of the Springfield, H
errin, Danville, and B
aker Coals in the Illinois Basin
Figure 11. Graduated-symbol map for sulfur content (percent, as-received basis) of the Springfield Coal in the Illinois Basin.

Figure 12. Diagram showing distribution of sulfate, organic, and pyritic sulfur from the assessed Pennsylvanian Springfield, Herrin, and Danville-Baker Coals in the Illinois Basin.
increased depths of burial. The southward increase was caused by increasing depth of burial during the coalification process. However, in the southeastern part of the Illinois Basin, many of the coals are relatively shallow and it has been suggested by Damberger (1971) that the increase in calorific value in that area may be attributed to increased heat flow related to possible plutonic intrusions.
Element Composition
Table 4 lists the mean content of elements of environmental concern (1990 Clean Air Act Amendment) for assessed and non-assessed coals from the Illinois Basin. Table 5 compares the mean content of these elements of environmental concern from the Illinois Basin with selected summaries of coal from the Appalachian Basin, Colorado Plateau, Gulf Coast, and Tertiary regions of the Western United States. Appendix 7 consists of graduated-symbol maps for each element of environmental concern in the assessed coals of the Illinois Basin. Appendix 5 consists of range plots of minimum, maximum, and mean contents of elements of environmental concern for all of the assessed and nonassessed coals. Comparison of elements of environmental concern in the Illinois Basin coals with other coal regions within the United States shows that (1) contents of antimony, arsenic, cadmium, chromium, lead, nickel, selenium, and uranium are generally higher in Illinois Basin coals when compared to either Colorado Plateau Cretaceous coals or western Tertiary coals; (2) contents of antimony, cadmium, chromium, nickel, and uranium in Illinois Basin coals are similar to Appalachian Basin Pennsylvanian age coals; and (3) contents of beryllium, chromium, cobalt, lead, manganese, mercury, selenium, and uranium are generally lower in Illinois Basin coals as compared to Gulf Coast coals.
Conclusion
Differences in the quality of coal result from variations in the total and relative amounts of detrital and authigenic minerals, the elemental composition of these minerals, and the total and relative amounts of any organically bound elements. The chemical form and distribution of a given element are dependent on the geological history of the coal. A partial listing of the factors that might influence element distributions includes (1) chemical composition of the original plant community in the peat swamp; (2) amounts and compositions of the various detrital, diagenetic, and epigenetic minerals; (3) chemical characteristics of the ground waters that come in contact with the coal bed; (4) temperature and pressures during burial; and (5) extent of chemical weathering. As yet, many of these factors have not been fully evaluated in detail for many of the Illinois Basin assessed coals. Thus, the currently available databases are considered inadequate to provide a complete characterization of coal quality throughout the basin.
Currently, the databases represent only a generalized view of Illinois Basin coal quality, based on a limited number of samples. Many of the samples are more than 30 years old and represent coal that has already been mined.
In order to better predict potential environmental impacts resulting from the increased utilization of coal from the region, it will be necessary to identify the modes of occurrence of the various elements within the coal and the nature of the coal combustion products. Accomplishing this would involve collecting additional samples from mines, power plants, and many other localities to obtain essential mineralogical and related data.
More than 92 percent of the United States’ yearly production of coal is consumed in the production of electricity by utilities (U.S. Energy Information Administration, 2001).
Coal quality, composition of stack emissions, and coal combustion byproducts have become major environmental concerns as the rate of coal utilization increases, especially with regard to meeting the requirements of the 1990 Clean Air Act Amendment. With increasing emphasis on environmental issues, information on the quality of coal (which includes ash yield, sulfur content, calorific value, and major-, minor-, and trace-element content) has become almost as important as information on the quantity of the resource.
The future of coal utilization in the Illinois Basin therefore depends on a careful evaluation of coal distribution, resources, coal quality, mining methods, beneficiation costs, transportation, coal combustion byproducts, and waste disposal. Almost 84 per-cent of low-sulfur coal and 61 percent of medium-sulfur coal is found in coal fields in the Western United States. Seventy-one percent of the high-sulfur coal in the United States is from the Interior region (U.S. Energy Information Administration, 1999). Since 1990, production in the Illinois Basin has dropped. This decrease in the demand has primarily been a result of the enactment and implementation of the 1990 Clean Air Act Amendment and increasing price competition from Western United States coal. Because Illinois Basin assessment coals are high in sulfur, and high in many of the elements of environmental concern, these coals may play a much smaller role in supplying future United States energy needs unless technological advances can
Coal quality in the Illinois Basin E19

E20Resource A
ssessment of the Springfield, H
errin, Danville, and B
aker Coals in the Illinois Basin
Figure 13. Graduated-symbol map for calorific values (Btu/lb, as-received basis) of the Danville-Baker Coals in the Illinois Basin.

Coal quality in the Illinois B
asin
Figure 14. Graduated-symbol map for calorific values (Btu/lb, as-received basis) of the Herrin Coal in the Illinois Basin.
E21

E22Resource A
ssessment of the Springfield, H
errin, Danville, and B
aker Coals in the Illinois Basin
Figure 15. Graduated-symbol map for calorific values (Btu/lb, as-received basis) of the Springfield Coal in the Illinois Basin.

Table 4. Mean content of elements of environmental concern (1990 Clean Air Act Amendment) for coals from the Illinois Basin coal assessment.
[All elements are in parts per million (ppm), on a whole-coal basis. Element contents are reported to two significant figures for most elements. However, mercury and cadmium are reported to two decimal places and antimony and selenium are reported to one decimal place. A common problem in statistical summaries of trace-element data arises when element values are below the limits of analytical detection. This results in a censored distribution. To compute unbiased estimates of the means for censored data, we adopted the protocol of reducing all "less than" values by 50 percent before summary statistics were generated.]
Coal name or coal-bearing unit As Be Cd Co Cr Hg Mn Ni Pb Sb Se Th U
Danville 12 3.2 0.40 6.3 19 0.10 55 24 17 2.3 1.3 2.5 1.3
Baker 27 2.2 0.19 5.2 19 0.13 62 36 20 1.5 1.8 2.0 2.5
Danville and Baker 19 2.7 0.30 5.6 19 0.11 59 31 18 1.9 1.5 2.2 1.9
Herrin 5.8 1.6 1.3 4.0 19 0.12 58 17 18 0.8 2.1 2.1 2.0
Springfield 12 1.9 0.60 3.6 16 0.12 43 12 13 1.1 2.5 1.7 2.6
Carbondale Group or Formation 34 3.5 0.45 7.1 20 0.14 51 28 27 1.5 3.3 2.1 3.3
Raccoon Creek Group 20 3.7 0.35 9.2 15 0.12 17 38 24 1.6 3.7 2.2 1.8
McLeansboro Group 9.5 2.2 0.14 5.3 20 0.08 56 20 7.7 0.7 2.1 2.1 1.6
Assessed coals 9.5 1.8 0.99 4.0 18 0.12 52 16 16 1.0 2.2 2.0 2.2
Non-assessed coals 23 3.4 0.35 7.9 17 0.12 35 31 23 1.4 3.4 2.2 2.2
All coals in Illinois Basin 15 2.5 0.70 5.6 17 0.12 45 22 19 1.2 2.7 2.1 2.2
Table 5. Comparison of the mean content of elements of environmental concern (1990 Clean Air Act Amendment) for the Illinois Basin assessed coals (Danville, Baker, Herrin, and Springfield Coals only) with coals from the Appalachian Basin, Colorado Plateau coal assessment area, Gulf Coast, and Western United States Tertiary coal.
[All elements are in parts per million (ppm), on a whole-coal basis.]
Element
Antimony Arsenic Beryllium Cadmium Chromium Cobalt Lead Manganese Mercury Nickel Selenium Uranium
Illinois Basin Assessment
(Danville, Baker,Herrin, and
Springfield Coals)Mean
(n=580)
1.0 9.4 1.8 0.99
18 4.0
16 52 0.12
16 2.2 2.2
Appalachian Basin
Pennsylvanian Mean1
(n=4,700)
1.4 35
2.5 0.10
17 7.2 8.4
29 0.21
17 3.5 1.7
1Finkelman and others, 1994 2Affolter, 2000 3Summarized from Affolter and Hatch, 1993
make them more economically and environmentally competitive with low-sulfur western coal.
References Cited
Affolter, R.H., 2000, Quality characterization of Cretaceous Coal from the Colorado Plateau coal assessment area, in Kirschbaum, M.A, Roberts, L.N.R., and Biewick, L.R.H. eds., Geologic assessment of coal in
Colorado Plateau Coal Assessment
Area Gulf Coast Western United Cretaceous Tertiary States Tertiary
Mean2 Mean1 Mean3
(n=1,265) (n=200) (n=520)
0.5 1.0 0.6 1.6 10 7.4 1.2 2.4 1.1 0.10 0.55 0.10 4.5 24 10 1.5 7.2 3.5 6.5 21 4.2
22 150 60 0.06 0.22 0.12 3.7 13 4.6 1.2 5.7 0.7 1.3 23 1.7
the Colorado Plateau: Arizona, Colorado, New Mexico, and Utah: U.S. Geological Survey Professional Paper 1625–B, Chapter G .
Affolter, R.H., and Hatch, J.R., 1993, Element composition of Rocky Mountain Province Cretaceous coals: Tenth Annual International Pittsburgh Coal Conference, "Coal—Energy and the Environment," Proceedings of the Pittsburgh Coal Conference, v. 10, p. 1038.
Affolter, R.H., and Hatch, J.R., 1995, Cretaceous and Tertiary coals and coal-bearing rocks of the Western United States—A bibliography of U.S. Geological Survey data for resource estimation, quality determi-
Coal quality in the Illinois Basin E23

nation, and reclamation potential evaluation, in Carter, L.M.H., ed., Energy and the environment—Application of geosciences to decision-making, Tenth V.E. McKelvey Forum on Mineral and Energy Resources, 1995: U.S. Geological Survey Circular 1108, p. 44–45.
Affolter, R.H., and Stricker, G.D., 1989, Effects of paleolatitude on coal quality—Model for organic sulfur distribution in United States coal: American Association of Petroleum Geologists Bulletin, v. 73, no. 3, p. 326.
Allgaier, G.J., and Hopkins, H.E., 1975, Reserves of the Herrin (No. 6) Coal in the Fairfield Basin in southeastern Illinois: Illinois State Geological Survey Circular 489, 31 p.
American Society for Testing and Materials, 1999a, Annual book of ASTM standards, section 5, Petroleum products, lubricants and fossil fuels, vol. 05.05, gaseous fuels; coal and coke: Philadelphia, Pa., American Society for Testing and Materials, 584 p.
American Society for Testing and Materials, 1999b, Calculating coal and coke analyses from as-determined to different bases, Designation D3180–89, in Annual book of ASTM standards, section 5, petroleum products, lubricants and fossil fuels, vol. 05.05, gaseous fuels; coal and coke: Philadelphia, Pa., American Society for Testing and Mate-rials, p. 340–342.
Averitt, Paul, 1975, Coal resources of the United States, January 1, 1974: U.S. Geological Survey Bulletin 1412, 131 p.
Baedecker, P.A., ed., 1987, Methods for geochemical analysis: U.S. Geological Survey Bulletin 1700, p. 1n1–1n3.
Baedecker, P.A., Grossman, J.N., and Buttleman, K.P., 1998, National Geochemical Data Base—PLUTO geochemical data base for the United States: U.S. Geological Survey Digital Data Series DDS–47, 1 CD-ROM.
Bohor, B.F., and H.J. Gluskoter, 1973, Boron in illite as a paleosalinity indicator of Illinois coals: Journal of Sedimentary Petrology, v. 43, no. 4, p. 945–956.
Bragg, L.J., Oman, J.K., Tewalt, S.J., Oman, C.L., Rega, N.H., Washington, P.M., and Finkelman, R.B., 1998, U.S. Geological Survey coal quality (COALQUAL) database, version 2.0: U.S. Geological Survey Open-File Report 97–134, 1 CD-ROM.
Cady, G.H., 1935, Classification and selection of Illinois coals: Illinois State Geological Survey Bulletin 62, 354 p.
Cady, G.H., 1948, Analysis of Illinois coals: Illinois State Geological Survey Supplement to Bulletin 62, 77 p.
Cecil, C.B., Stanton, R.W., Dulong, F.T., and Renton, J.J., 1982, Geological factors that control mineral matter in coal: Plenum Press, Proceedings, ANS/ACS Atomic and Nuclear Methods in Fossil Energy Research Symposium, p. 323–336.
Cobb, J.C., Masters, J.M., Treworgy, C.G., and Helfinstine, R.J., 1979, Abundance and recovery of sphalerite and fine coal from mine wastes in Illinois: Illinois State Geological Survey Illinois Mineral Notes 71, 11 p.
Cobb, J.C., Steele, J.D., Treworgy, C.G., and Ashby, J.F., 1980, The abundance of zinc and cadmium in sphalerite-bearing coals of Illinois: Illinois State Geological Survey Illinois Mineral Notes 74, 28 p.
Currens, J.C., 1986, Coal-quality data for the western Kentucky coal field: Kentucky Geological Survey Open-File Report, Series XI, 40 p.
Damberger, H.H., 1971, Coalification pattern of the Illinois Basin: Economic Geology, v. 66, no. 3, p. 488–495.
Damberger, H.H., 1999, Coal geology of Illinois, in 1999 Keystone Coal Industry Manual: Chicago, Ill., Primedia Intertec, p. 582–593.
Finkelman, A.C., Wong, C.J., Cheng, A.C., and Finkelman, R.B., 1991, Bibliography of publications containing major, minor, and trace element data from the National Coal Resources Data System: U.S. Geological Survey Open-File Report 91–123, 19 p.
Finkelman, R.B., Oman, C.L., Bragg, L.J., and Tewalt, S.J., 1994, The U.S. Geological Survey coal quality data base (COALQUAL): U.S. Geological Survey Open-File Report 94–177, 36 p.
Freme, F.L., 2001, U.S. coal supply and demand:—2000 review: U.S. Energy Information Administration, 8 p. Accessed October 12, 2001, at URL http://www.eia.doe.gov/
Gluskoter, H.J., 1965, Electric low temperature ashing of bituminous coal: Fuel, v. 44, no. 4, p. 285–291.
Gluskoter, H.J., 1967a, Chlorine in coals of the Illinois Basin: Transactions, Society of Mining Engineers, American Institute of Mining Engineers, v. 238, p. 373–379.
Gluskoter, H.J., 1967b, Clay minerals in Illinois coals: Journal of Sedimentary Petrology, v. 37, no. 1, p. 205–214.
Gluskoter, H.J., 1975, Mineral matter and trace elements in coal, in Babu, S.P., ed., Trace elements in fuel: American Chemical Society Advances in Chemistry Series, no. 141, p. 1–22.
Gluskoter, H.J., Flores, R.M., Hatch, J.R., Kirschbaum, M.A., Ruppert, L.F., and Warwick, P.D., 1996, Assessing the coal resources of the United States: U.S. Geological Survey Fact Sheet 157–96, 8 p.
Gluskoter, H.J., and Lindahl, P.C.,1973, Cadmium—Mode of occurrence in Illinois coals: Science, v. 181, no. 4096, p. 264–266.
Gluskoter, H.J., Hatch, J.R., and Lindahl, P.C.,1973, Zinc in coals of the Illinois Basin: Geological Society of America Abstracts with Programs, v. 5, no. 7, p. 637.
Gluskoter, H.J., and Rees, O.W., 1964, Chlorine in Illinois coal: Illinois Geological Survey Circular 372, 23 p.
Gluskoter, H.J., and Ruch, R.R.,1971, Chlorine and sodium in Illinois coals as determined by neutron activation analyses: Fuel, v. 50, no. 1, p. 65–76.
Gluskoter, H.J., Ruch, R.R, Miller, W.G., Cahill, R.A., Dreher, G.B., and Kuhn, J.K.,1977, Trace elements in coal—Occurrence and distribution: Illinois State Geological Survey Circular 499, 154 p.
Gluskoter, H.J., and Simon, J.A., 1968, Sulfur in Illinois coals: Illinois State Geological Survey Circular 432, 28 p.
Golightly, D.W., and Simon, F.O., 1989, Methods for sampling and inorganic analysis of coal: U.S. Geological Survey Bulletin 1823, 72 p.
Greb, S. F., Williams, D. A., and Williamson, A. D., 1992, Geology and stratigraphy of the western Kentucky coal field: Kentucky Geological Survey Bulletin 1, Series XI, 77 p.
Harvey, R. D., Cahill, R.A., Chou, C.L., and Steele, J.D., 1983, Mineral matter and trace elements in the Herrin and Springfield Coals—Illinois Basin coal field: Illinois State Geological Survey Contract/Grant Report 1983–4, 162 p.
Harvey, R.D., Kar, Aravinda, Bargh, M.H., and Kohlenberger, L.B., 1985, Information system on chemistry of Illinois coal: Illinois State Geological Survey Contract/Grant Report 1985–5, 20 p.
Hatch, J.R., Gluskoter, H.J., and Lindahl, P.C., 1976, Sphalerite in coals from the Illinois Basin: Economic Geology, v. 71, no. 3, p. 613–624.
Hatch, J.R., and Swanson, V.E., 1977, Trace elements in Rocky Mountain coals, in Murray, D.K., ed., Geology of Rocky Mountain coal—A symposium: Colorado Geological Survey Resource Series 1, p. 143–164.
Hasenmueller, W.A., 1994, The quality of Indiana's coal resources: Indiana Geological Survey Occasional Paper OP63, 45 p.
E24 Resource Assessment of the Springfield, Herrin, Danville, and Baker Coals in the Illinois Basin
Hasenmueller, W.A., and Miller, L.V., 1992, The Indiana coal analysis database—Computer database 1: Bloomington, Indiana Geological Survey, 13 p., 3 data diskettes.
Hopkins, M.E., and Simon, J.A., 1975, Pennsylvanian System, in Willman, H.B., Atherton, E., Bushbach, T.C., Collinson, C., Frye, J.C., Hopkins, M.E., Lineback, J.A., and Simon J.A., eds., Handbook of Illinois stratigraphy: Illinois State Geological Survey Bulletin 95, p.163–201.
Hopkins, M.E., 1968, Harrisburg (No. 5) coal reserves of southeastern Illinois: Illinois State Geological Survey Circular 431, 25 p.
Jacobson, R.J., Trask, C.B., Ault, C.H., Carr, D.D., Gray, H.H., Hasenmeuller, W.A., Williams, D., and Williamson, A.D., 1985, Unifying nomenclature in the Pennsylvanian System of the Illinois Basin: Transactions of the Illinois Academy of Science, v. 78, nos. 1–2, p.1– 11.
Mastalerz, Maria, and Harper, Denver, 1998, Coal in Indiana—A geologic overview: Indiana Geological Survey Special Report 60, 45 p.
Nelson, W.J., 1983, Geologic disturbances in coal seams: Illinois State Geological Survey Circular 530, 47 p.
Oman, C.L., Hassenmueller, W.H., and Bragg, L.J., 1992, Indiana coal and associated rock samples collected from 1975 to 1977: U.S. Geological Survey Open-File Report 93–0111, 133 p.
Rao, C.P., and Gluskoter, H.J., 1973, Occurrences and distribution of minerals in Illinois Coals: Illinois State Geological Survey Circular 476, 56 p.
Rees, O.W., 1966, Chemistry, uses and limitations of coal analyses: Illinois State Geological Survey Report of Investigations 220, 55 p.
Swanson, V.E., and Huffman, Claude, Jr., 1976, Guideline for sample collecting and analytical methods used in the U.S. Geological Survey for determining chemical composition of coal: U.S. Geological Survey Circular 735, 11 p.
Swanson, V.E., Medlin, J.H., Hatch, J.R., Coleman, S.L., Wood, G.H., Woodruff, S.D., and Hildebrand, R.T., 1976, Collection, chemical analysis, and evaluation of coal samples in 1975: U.S. Geological Survey Open-File Report 76–468, 503 p.
Trumbull, James, 1960, Coal fields of the United States, exclusive of Alaska—Sheet 1: U.S. Geological Survey Map, scale 1:5,000,000.
U.S. Energy Information Administration, 1999, U.S. coal reserves—1997 update: Accessed August 16, 2000, at URL http://www.eia.doe.gov/
U.S. Energy Information Administration, 2001, Energy in the United States—1635–2000: Accessed October 12, 2001, at URL http:// www.eia.doe.gov/
U.S. Statutes at Large, 1990, Public Law 101–549. Provisions for attainment and maintenance of national ambient air quality standards. 101st Congress, 2nd Session, 104, Part 4, p. 2353–3358.
Ward, C.R., 1977, Mineral matter in the Springfield-Harrisburg (No. 5) Coal Member in the Illinois Basin: Illinois State Geological Survey Circular 498, 35 p.
Whelan, J.F., Cobb, J.C., and Rye, R.O., 1988, Stable isotope geochemistry of sphalerite and other mineral matter in coal beds of the Illinois and Forest City basins: Economic Geology, v. 83, p. 990–1007.
Wood, G.H., Jr., Kehn, T.M., Carter, M.D., and Culbertson, W.C., 1983, Coal resource classification system of the U.S. Geological Survey: U.S. Geological Survey Circular 891, 63 p.
Zubovic, Peter, Oman, C.L., Bragg, L.J., Coleman, S.L., Rega, N.H., LeMaster, M.E., Rose, H.J., Golightly, D.W., and Puskas, J., 1980, Chemical analysis of 659 coal samples from the Eastern United States: U.S. Geological Survey Open-File Report 80–2003, 513 p.
Zubovic, Peter, Oman, C.L., Coleman, S.L., Bragg, L.J., Kerr, P.T., Kozey, K.M., Simon, F.O., Rowe, J.J., Medlin, J.H., and Walker, F.E., 1979, Chemical analysis of 617 coal samples from the Eastern United States: U.S. Geological Survey Open-File Report 79–665, 452 p.
Coal quality in the Illinois Basin E25
Appendix 1. Summary descriptive statistics of proximate and ultimate analyses, calorific values, forms-of-sulfur analyses, and ash-fusion temperatures for all assessed and nonassessed coals in the Illinois Basin.
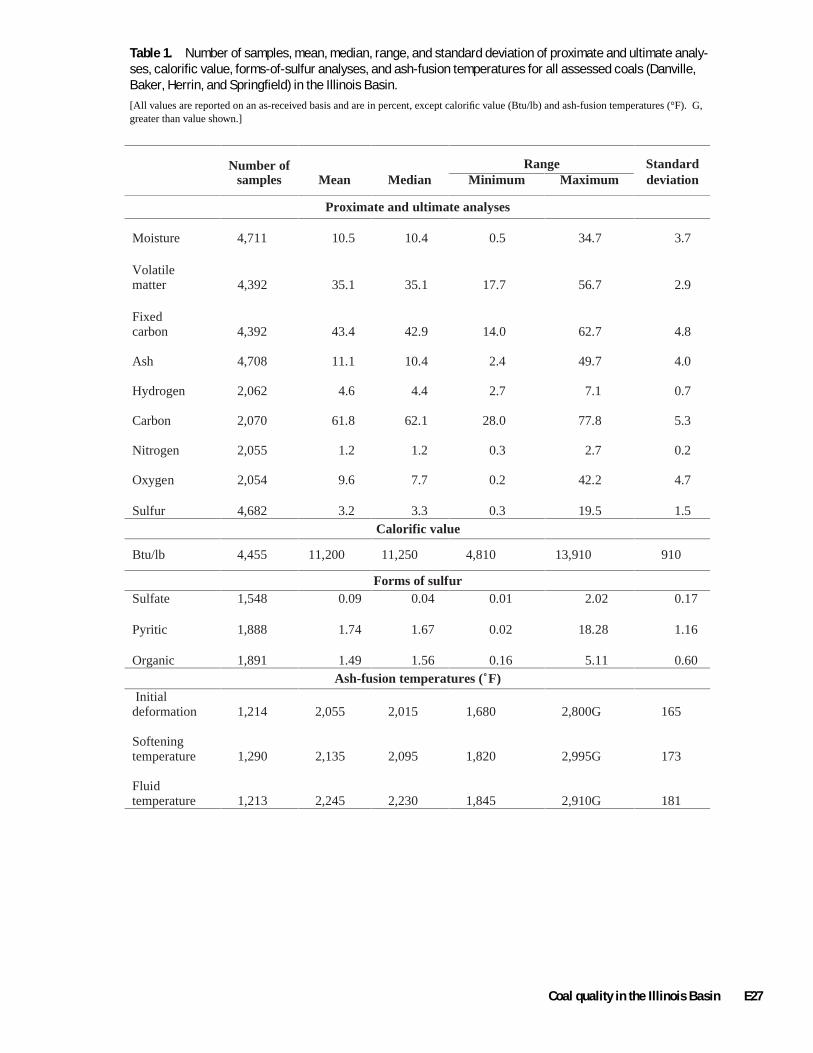
Table 1. Number of samples, mean, median, range, and standard deviation of proximate and ultimate analyses, calorific value, forms-of-sulfur analyses, and ash-fusion temperatures for all assessed coals (Danville, Baker, Herrin, and Springfield) in the Illinois Basin. [All values are reported on an as-received basis and are in percent, except calorific value (Btu/lb) and ash-fusion temperatures (°F). G, greater than value shown.]
Number of Range Standard samples Mean Median Minimum Maximum deviation
Proximate and ultimate analyses
Moisture 4,711 10.5 10.4 0.5 34.7 3.7
Volatile matter 4,392 35.1 35.1 17.7 56.7 2.9
Fixed carbon 4,392 43.4 42.9 14.0 62.7 4.8
Ash 4,708 11.1 10.4 2.4 49.7 4.0
Hydrogen 2,062 4.6 4.4 2.7 7.1 0.7
Carbon 2,070 61.8 62.1 28.0 77.8 5.3
Nitrogen 2,055 1.2 1.2 0.3 2.7 0.2
Oxygen 2,054 9.6 7.7 0.2 42.2 4.7
Sulfur 4,682 3.2 3.3 0.3 19.5 1.5 Calorific value
Btu/lb 4,455 11,200 11,250 4,810 13,910 910
Forms of sulfur Sulfate 1,548 0.09 0.04 0.01 2.02 0.17
Pyritic 1,888 1.74 1.67 0.02 18.28 1.16
Organic 1,891 1.49 1.56 0.16 5.11 0.60 Ash-fusion temperatures (˚F)
Initial deformation 1,214 2,055 2,015 1,680
Softening temperature 1,290 2,135 2,095 1,820
Fluid temperature 1,213 2,245 2,230 1,845
2,800G 165
2,995G 173
2,910G 181
Coal quality in the Illinois Basin E27

Table 2. Number of samples, mean, median, range, and standard deviation of proximate and ultimate analyses, calorific value, forms-of-sulfur analyses, and ash-fusion temperatures for the Danville Coal in the Illinois Basin.
[All values are reported on an as-received basis and are in percent, except calorific value (Btu/lb) and ash-fusion temperatures (°F). G, greater than value shown.]
Number of Range Standard samples Mean Median Minimum Maximum deviation
Proximate and ultimate analyses
Moisture 300 12.2 12.7 1.9 28.2 3.5
Volatile matter 291 35.6 35.8 25.2 56.7 3.5
Fixed carbon 291 40.4 39.7 20.4 52.3 3.9
Ash 300 11.8 10.7 4.2 44.2 4.5
Hydrogen 136 5.3 5.5 3.3 6.3 0.7
Carbon 139 60.5 61.2 36.9 69.5 4.7
Nitrogen 134 1.3 1.3 0.7 1.9 0.2
Oxygen 134 15.4 17.3 4.0 24.4 5.6
Sulfur 301 2.9 3.0 0.3 9.7 1.3 Calorific value
Btu/lb 261 10,820 11,020 5,800 12,630 840
Forms of sulfur Sulfate 65 0.16
Pyritic 74 1.51
Organic 74 1.13
0.08
1.36
1.17
0.01 1.68 0.25
0.03 6.01 1.06
0.22 2.17 0.43 Ash-fusion temperatures (˚F)
Initial deformation 118 2,100 2,045 1,822 2,745 183
Softening temperature 135 2,230 2,200 1,905 2,800G 200
Fluid temperature 118 2,350 2,335 1,935 2,800G 206
E28 Resource Assessment of the Springfield, Herrin, Danville, and Baker Coals in the Illinois Basin

Table 3. Number of samples, mean, median, range, and standard deviation of proximate and ultimate analyses, calorific value, forms-of-sulfur analyses, and ash-fusion temperatures for the Baker coal in the Illinois Basin.
[All values are reported on an as-received basis and are in percent, except calorific value (Btu/lb) and ash-fusion temperatures (°F).]
Number of Range Standard samples Mean Median Minimum Maximum deviation
Proximate and ultimate analyses
Moisture 34 6.7
Volatile matter 34 34.8
Fixed carbon 34 45.9
Ash 34 12.7
Hydrogen 34 4.7
Carbon 34 64.8
Nitrogen 34 1.4
Oxygen 34 9.1
Sulfur 34 3.7
6.6 3.4 10.8 1.4
35.4 25.7 40.8 3.2
46.2 34.5 54.7 4.2
11.7 6.5 27.6 4.4
4.7 3.1 5.6 0.6
65.9 52.7 72.7 4.8
1.4 0.9 1.7 0.2
7.7 3.1 18.1 4.4
3.8 1.5 7.7 1.5 Calorific value
Btu/lb 34 11,670 12,070 9,300 12,990 880
Forms of sulfur Sulfate 15 0.15
Pyritic 15 2.25
Organic 15 1.36
0.13
2.67
1.24
0.01 0.45 0.12
0.69 3.72 0.94
0.57 2.04 0.46 Ash-fusion temperatures (˚F)
Initial deformation 15 2,080 2,030 1,930
Softening temperature 15 2,140 2,080 2,030
Fluid temperature 15 2,310 2,260 2,080
2,610 169
2,710 176
2,800 194
Coal quality in the Illinois Basin E29

Table 4. Number of samples, mean, median, range, and standard deviation of proximate and ultimate analyses, calorific value, forms-of-sulfur analyses, and ash-fusion temperatures for the Danville-Baker Coals in the Illinois Basin.
[All values are reported on an as-received basis and are in percent, except calorific value (Btu/lb) and ash-fusion temperatures (°F). G, greater than value shown.]
Number of Range Standard samples Mean Median Minimum Maximum deviation
Proximate and ultimate analyses
Moisture 334 11.7
Volatile matter 325 35.6
Fixed carbon 325 40.9
Ash 334 11.9
Hydrogen 170 5.2
Carbon 173 61.4
Nitrogen 168 1.3
Oxygen 168 14.1
Sulfur 335 2.9
12.3 1.9 28.2 3.8
35.8 25.2 56.7 3.5
40.0 20.4 54.7 4.3
10.8 4.2 44.2 4.5
5.3 3.1 6.3 0.7
61.9 36.9 72.7 5.0
1.3 0.7 1.9 0.2
15.8 3.1 24.4 5.9
3.0 0.3 9.7 1.4 Calorific value
Btu/lb 295 10,920 11,060 5,800 12,990 880
Forms of sulfur Sulfate 80 0.16
Pyritic 89 1.63
Organic 89 1.17
0.09
1.49
1.24
0.01 1.68 0.23
0.03 6.01 1.07
0.22 2.17 0.44 Ash-fusion temperatures (˚F)
Initial deformation 133 2,095 2,040 1,820
Softening temperature 150 2,220 2,175 1,905
Fluid temperature 133 2,340 2,330 1,935
2,745 181
2,800G 199
2,800G 204
E30 Resource Assessment of the Springfield, Herrin, Danville, and Baker Coals in the Illinois Basin

Table 5. Number of samples, mean, median, range, and standard deviation of proximate and ultimate analyses, calorific value, forms-of-sulfur analyses, and ash-fusion temperatures for the Herrin Coal in the Illinois Basin.
[All values are reported on an as-received basis and are in percent, except calorific value (Btu/lb) and ash-fusion temperatures (°F). G, greater than value shown.]
Number of Range Standard samples Mean Median Minimum Maximum deviation
Proximate and ultimate analyses
Moisture 2,545 10.7
Volatile matter 2,375 34.8
Fixed carbon 2,375 43.7
Ash 2,542 10.9
Hydrogen 939 4.3
Carbon 939 61.5
Nitrogen 935 1.2
Oxygen 935 8.2
Sulfur 2,517 3.0
10.6 1.2 22.2 3.4
34.8 19.5 45.2 2.8
43.2 25.3 58.5 4.6
10.3 2.4 43.6 3.6
4.3 2.9 5.9 0.4
61.4 41.4 73.6 5.4
1.2 0.3 2.7 0.2
7.6 2.3 20.5 2.6
3.2 0.3 14.5 1.5 Calorific value
Btu/lb 2,390 11,170 11,170 5,770 13,420 830
Forms of sulfur Sulfate 860 0.09
Pyritic 1,108 1.62
Organic 1,110 1.46
0.04
1.61
1.52
0.01 2.02 0.17
0.02 8.48 1.08
0.16 5.08 0.64 Ash-fusion temperatures (˚F)
Initial deformation 531 2,100 2,060 1,680
Softening temperature 534 2,160 2,140 1,820
Fluid temperature 530 2,280 2,270 1,860
2,800G 170
2,995G 163
2,910G 160
Coal quality in the Illinois Basin E31
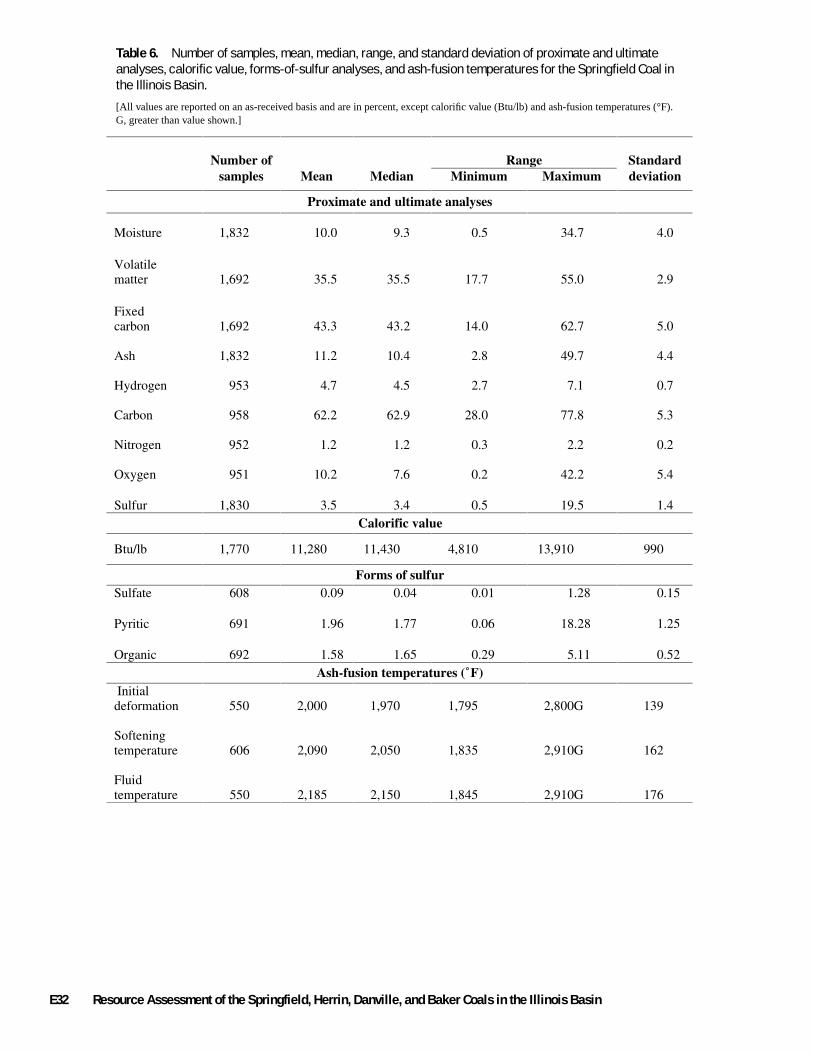
Table 6. Number of samples, mean, median, range, and standard deviation of proximate and ultimate analyses, calorific value, forms-of-sulfur analyses, and ash-fusion temperatures for the Springfield Coal in the Illinois Basin.
[All values are reported on an as-received basis and are in percent, except calorific value (Btu/lb) and ash-fusion temperatures (°F). G, greater than value shown.]
Number of Range Standard samples Mean Median Minimum Maximum deviation
Proximate and ultimate analyses
Moisture 1,832 10.0
Volatile matter 1,692 35.5
Fixed carbon 1,692 43.3
Ash 1,832 11.2
Hydrogen 953 4.7
Carbon 958 62.2
Nitrogen 952 1.2
Oxygen 951 10.2
Sulfur 1,830 3.5
9.3 0.5 34.7 4.0
35.5 17.7 55.0 2.9
43.2 14.0 62.7 5.0
10.4 2.8 49.7 4.4
4.5 2.7 7.1 0.7
62.9 28.0 77.8 5.3
1.2 0.3 2.2 0.2
7.6 0.2 42.2 5.4
3.4 0.5 19.5 1.4 Calorific value
Btu/lb 1,770 11,280 11,430 4,810 13,910 990
Forms of sulfur Sulfate 608 0.09
Pyritic 691 1.96
Organic 692 1.58
0.04
1.77
1.65
0.01 1.28 0.15
0.06 18.28 1.25
0.29 5.11 0.52 Ash-fusion temperatures (˚F)
Initial deformation 550 2,000 1,970 1,795 2,800G 139
Softening temperature 606 2,090 2,050 1,835 2,910G 162
Fluid temperature 550 2,185 2,150 1,845 2,910G 176
E32 Resource Assessment of the Springfield, Herrin, Danville, and Baker Coals in the Illinois Basin
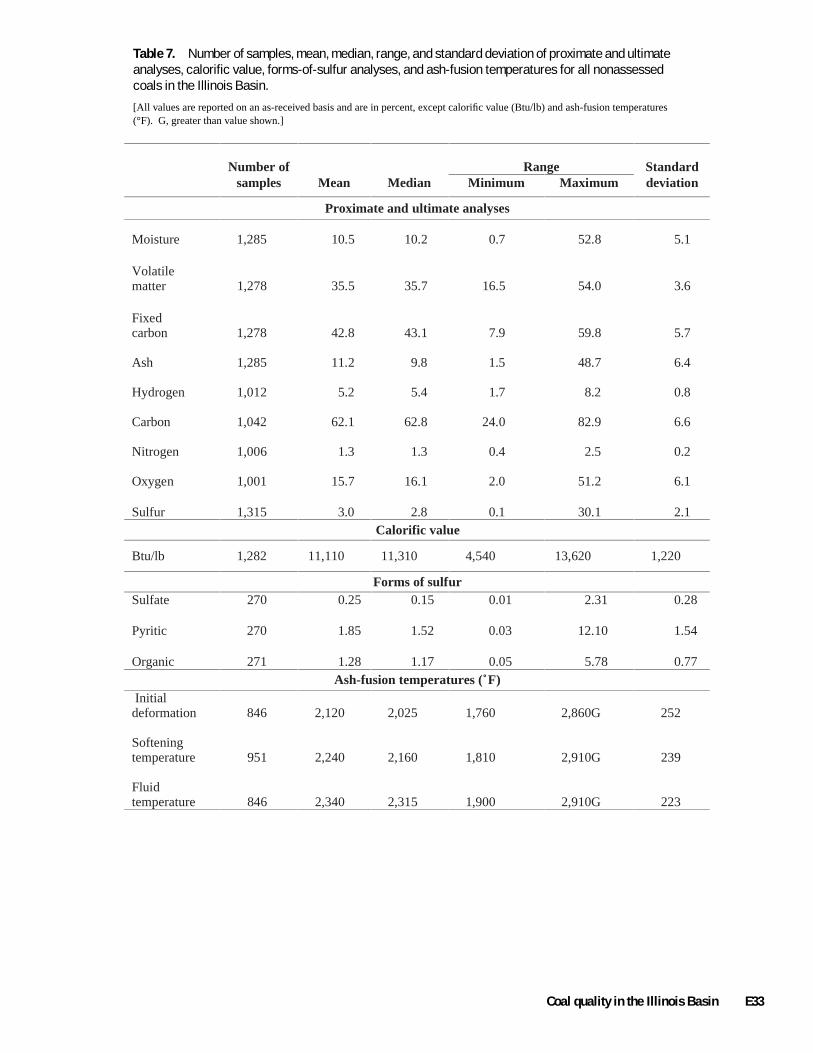
Table 7. Number of samples, mean, median, range, and standard deviation of proximate and ultimate analyses, calorific value, forms-of-sulfur analyses, and ash-fusion temperatures for all nonassessed coals in the Illinois Basin.
[All values are reported on an as-received basis and are in percent, except calorific value (Btu/lb) and ash-fusion temperatures (°F). G, greater than value shown.]
Number of Range Standard samples Mean Median Minimum Maximum deviation
Proximate and ultimate analyses
Moisture 1,285 10.5
Volatile matter 1,278 35.5
Fixed carbon 1,278 42.8
Ash 1,285 11.2
Hydrogen 1,012 5.2
Carbon 1,042 62.1
Nitrogen 1,006 1.3
Oxygen 1,001 15.7
Sulfur 1,315 3.0
10.2 0.7 52.8 5.1
35.7 16.5 54.0 3.6
43.1 7.9 59.8 5.7
9.8 1.5 48.7 6.4
5.4 1.7 8.2 0.8
62.8 24.0 82.9 6.6
1.3 0.4 2.5 0.2
16.1 2.0 51.2 6.1
2.8 0.1 30.1 2.1 Calorific value
Btu/lb 1,282 11,110 11,310 4,540 13,620 1,220
Forms of sulfur Sulfate 270 0.25
Pyritic 270 1.85
Organic 271 1.28
0.15
1.52
1.17
0.01 2.31 0.28
0.03 12.10 1.54
0.05 5.78 0.77 Ash-fusion temperatures (˚F)
Initial deformation 846 2,120 2,025 1,760
Softening temperature 951 2,240 2,160 1,810
Fluid temperature 846 2,340 2,315 1,900
2,860G 252
2,910G 239
2,910G 223
Coal quality in the Illinois Basin E33

Table 8. Number of samples, mean, median, range, and standard deviation of proximate and ultimate analyses, calorific value, forms-of-sulfur analyses, and ash-fusion temperatures for all nonassessed coals from the McLeansboro Group in the Illinois Basin. [All values are reported on an as-received basis and are in percent, except calorific value (Btu/lb) and ash-fusion temperatures (°F).]
Number of Range Standard samples Mean Median Minimum Maximum deviation
Proximate and ultimate analyses
Moisture 82 7.3
Volatile matter 82 35.0
Fixed carbon 82 43.7
Ash 82 14.1
Hydrogen 82 4.4
Carbon 82 62.5
Nitrogen 82 1.3
Oxygen 82 8.9
Sulfur 82 3.7
7.5 3.8 12.6 1.1
34.7 29.7 38.5 2.2
43.2 34.0 50.6 3.8
13.7 6.0 28.7 4.4
4.3 3.0 5.5 0.6
62.7 50.6 70.1 3.9
1.3 0.7 1.6 0.2
7.8 2.1 20.5 3.8
3.5 1.7 8.0 1.2 Calorific value
Btu/lb 82 11,260 11,320 9,080 12,660 710
Forms of sulfur Sulfate 24 0.13
Pyritic 24 1.83
Organic 24 1.42
0.08
1.69
1.51
0.01 0.70 0.17
0.84 4.04 0.89
0.50 1.92 0.43 Ash-fusion temperatures (˚F)
Initial deformation 25 2,145 2,115 1,905
Softening temperature 25 2,240 2,190 2,015
Fluid temperature 25 2,380 2,340 2,130
2,615 153
2,710 153
2,800 172
E34 Resource Assessment of the Springfield, Herrin, Danville, and Baker Coals in the Illinois Basin

Table 9. Number of samples, mean, median, range, and standard deviation of proximate and ultimate analyses, calorific value, forms-of-sulfur analyses, and ash-fusion temperatures for all nonassessed coals from the Carbondale Group or Formation in the Illinois Basin.
[All values are reported on an as-received basis and are in percent, except calorific value (Btu/lb) and ash-fusion temperatures (°F). G, greater than value shown.]
Number of Range Standard samples Mean Median Minimum Maximum deviation
Proximate and ultimate analyses
Moisture 425 9.9
Volatile matter 420 35.9
Fixed carbon 420 41.4
Ash 425 12.8
Hydrogen 348 5.2
Carbon 355 60.6
Nitrogen 342 1.3
Oxygen 340 15.6
Sulfur 432 3.2
10.1 0.8 37.1 4.7
36.2 19.7 44.3 3.4
41.7 8.5 59.8 5.0
10.9 3.6 48.5 6.5
5.3 1.7 6.8 0.7
61.7 24.0 73.6 6.3
1.3 0.4 2.1 0.2
16.6 2.0 32.0 5.3
2.9 0.3 28.1 2.2 Calorific value
Btu/lb 425 10,920 11,170 5,440 13,200 1,150
Forms of sulfur Sulfate 91 0.28
Pyritic 91 2.17
Organic 91 1.45
0.18
1.79
1.33
0.01 1.08 0.28
0.30 12.10 1.65
0.26 5.78 0.82 Ash-fusion temperatures (˚F)
Initial deformation 280 2,050 2,000 1,780
Softening temperature 322 2,175 2,115 1,900
Fluid temperature 280 2,285 2,250 1,930
2,800G 183
2,800G 185
2,805G 187
Coal quality in the Illinois Basin E35
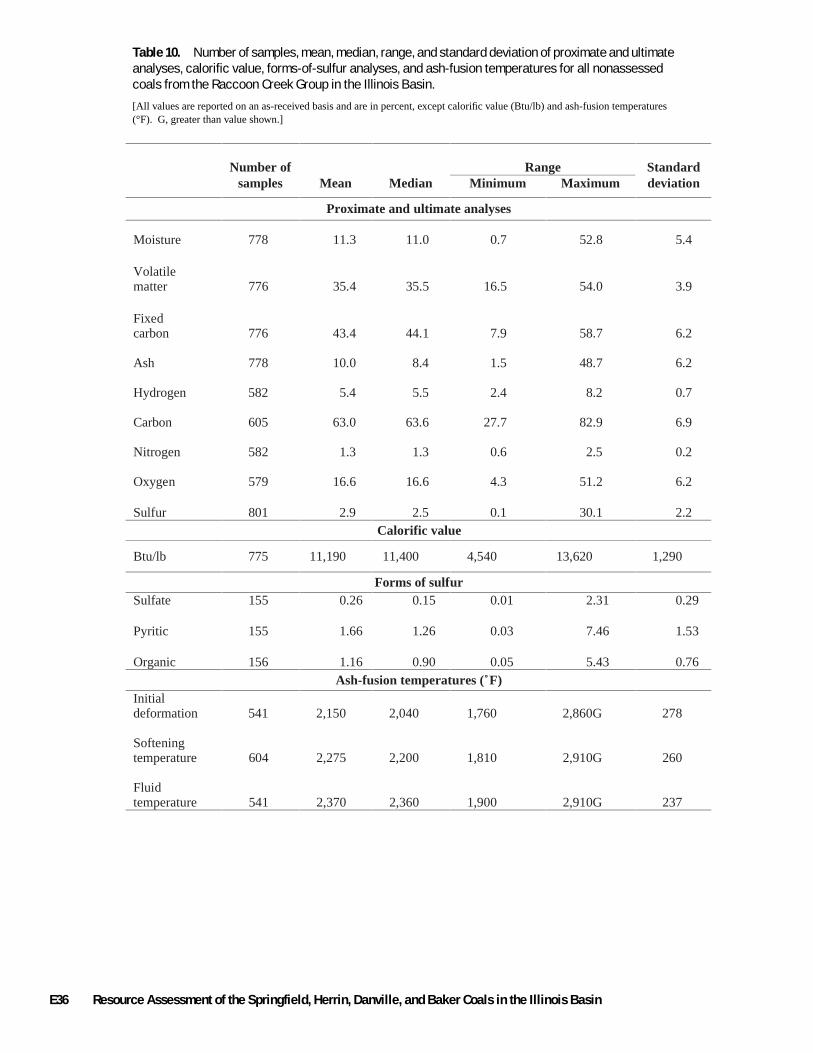
Table 10. Number of samples, mean, median, range, and standard deviation of proximate and ultimate analyses, calorific value, forms-of-sulfur analyses, and ash-fusion temperatures for all nonassessed coals from the Raccoon Creek Group in the Illinois Basin.
[All values are reported on an as-received basis and are in percent, except calorific value (Btu/lb) and ash-fusion temperatures (°F). G, greater than value shown.]
Number of Range Standard samples Mean Median Minimum Maximum deviation
Proximate and ultimate analyses
Moisture 778 11.3
Volatile matter 776 35.4
Fixed carbon 776 43.4
Ash 778 10.0
Hydrogen 582 5.4
Carbon 605 63.0
Nitrogen 582 1.3
Oxygen 579 16.6
Sulfur 801 2.9
11.0 0.7 52.8 5.4
35.5 16.5 54.0 3.9
44.1 7.9 58.7 6.2
8.4 1.5 48.7 6.2
5.5 2.4 8.2 0.7
63.6 27.7 82.9 6.9
1.3 0.6 2.5 0.2
16.6 4.3 51.2 6.2
2.5 0.1 30.1 2.2 Calorific value
Btu/lb 775 11,190 11,400 4,540 13,620 1,290
Forms of sulfur Sulfate 155 0.26
Pyritic 155 1.66
Organic 156 1.16
0.15
1.26
0.90
0.01 2.31 0.29
0.03 7.46 1.53
0.05 5.43 0.76 Ash-fusion temperatures (˚F)
Initial deformation 541 2,150 2,040 1,760
Softening temperature 604 2,275 2,200 1,810
Fluid temperature 541 2,370 2,360 1,900
2,860G 278
2,910G 260
2,910G 237
E36 Resource Assessment of the Springfield, Herrin, Danville, and Baker Coals in the Illinois Basin

Table 11. Number of samples, mean, median, range, and standard deviation of proximate and ultimate analyses, calorific value, forms-of-sulfur analyses, and ash-fusion temperatures for all coals (assessed and nonassessed) in the Illinois Basin.
[All values are reported on an as-received basis and are in percent, except calorific value (Btu/lb) and ash-fusion temperatures (°F). G, greater than value shown.]
Number of Range Standard samples Mean Median Minimum Maximum deviation
Proximate and ultimate analyses
Moisture 5,996 10.5 10.4 0.5 52.8 4.0
Volatile matter 5,670 35.2 35.2 16.5 56.7 3.1
Fixed carbon 5,670 43.2 43.0 7.9 62.7 5.0
Ash 5,993 11.1 10.3 1.5 49.7 4.6
Hydrogen 3,074 4.8 4.6 1.7 8.2 0.8
Carbon 3,112 61.9 62.5 24.0 82.9 5.8
Nitrogen 3,061 1.2 1.3 0.3 2.7 0.2
Oxygen 3,055 11.6 8.6 0.2 51.2 5.9
Sulfur 5,997 3.1 3.2 0.1 30.1 1.6 Calorific value
Btu/lb 5,737 11,180 11,270 4,540 13,910 990
Forms of sulfur Sulfate 1,818 0.12
Pyritic 2,158 1.76
Organic 2,162 1.46
0.04
1.66
1.53
0.01 2.31 0.19
0.02 18.28 1.21
0.05 5.78 0.63 Ash-fusion temperatures (˚F)
Initial deformation 2,060 2,080 2,020 1,680 2,860G 207
Softening temperature 2,241 2,180 2,120 1,810 2,995G 210
Fluid temperature 2,059 2,285 2,260 1,845 2,910G 205
Coal quality in the Illinois Basin E37

Appendix 2. Summary descriptive statistics of proximate and ultimate analyses, calorific values, forms-of-sulfur analyses, and ash-fusion temperatures for all assessed and nonassessed coals in the Illinois Basin as analyzed by the Illinois State Geological Survey, Indiana Geological Survey, Kentucky Geological Survey, and U.S. Geological Survey

Table 1. Number of samples, mean, median, range, and standard deviation of proximate and ultimate analyses, calorific value, forms-of-sulfur analyses, and ash-fusion temperatures for the Danville Coal Member in Illinois as analyzed by the Illinois State Geological Survey.
[All values are reported on an as-received basis and are in percent, except calorific value (Btu/lb) and ash-fusion temperatures (°F).]
Number of Range Standard samples Mean Median Minimum Maximum deviation
Proximate and ultimate analyses
Moisture 170 13.4
Volatile matter 162 35.9
Fixed carbon 162 38.6
Ash 170 12.2
Hydrogen 31 4.5
Carbon 31 60.2
Nitrogen 31 1.1
Oxygen 31 6.6
Sulfur 168 3.1
13.4 5.3 25.0 2.7
36.7 25.2 44.5 3.4
38.8 26.5 48.4 2.8
11.0 4.3 44.2 4.4
4.3 3.6 5.9 0.6
61.3 52.7 67.6 4.0
1.1 0.7 1.4 0.2
6.8 4.0 8.6 1.1
3.1 0.3 9.7 1.2 Calorific value
Btu/lb 131 10,670 11,030 5,800 12,190 870
Forms of sulfur Sulfate 40 0.07
Pyritic 49 1.63
Organic 49 1.19
0.04
1.50
1.25
0.01 0.26 0.07
0.03 6.01 1.14
0.26 2.17 0.40 Ash-fusion temperatures (˚F)
Initial deformation 20 2,075 2,010 1,920
Softening temperature 20 2,185 2,080 1,935
Fluid temperature 20 2,400 2,360 2,005
2,330 120
2,570 197
2,770 231
Coal quality in the Illinois Basin E39

Table 2. Number of samples, mean, median, range, and standard deviation of proximate and ultimate analyses, calorific value, forms-of-sulfur analyses, and ash-fusion temperatures for the Danville Coal Member in Indiana as analyzed by the Indiana Geological Survey.
[All values are reported on an as-received basis and are in percent, except calorific value (Btu/lb) and ash-fusion temperatures (°F). G, greater than value shown.]
Number of Range Standard samples Mean Median Minimum Maximum deviation
Proximate and ultimate analyses
Moisture 115 10.9
Volatile matter 114 35.5
Fixed carbon 114 42.2
Ash 115 11.3
Hydrogen 90 5.5
Carbon 90 60.9
Nitrogen 88 1.4
Oxygen 88 18.1
Sulfur 115 2.5
10.9 1.9 28.2 4.2
35.6 26.0 56.7 3.8
42.1 20.4 51.1 3.9
10.3 4.2 39.7 4.6
5.6 3.3 6.3 0.5
61.2 41.3 69.5 4.0
1.3 1.1 1.9 0.1
18.7 9.4 24.4 3.5
2.6 0.4 6.7 1.3 Calorific value
Btu/lb 115 10,970 10,970 7,400 12,630 790
Forms of sulfur Sulfate 10 0.27
Pyritic 10 1.35
Organic 10 0.99
0.09
1.15
0.84
0.05 1.68 0.50
0.61 2.74 0.70
0.39 1.82 0.44 Ash-fusion temperatures (˚F)
Initial deformation 84 2,095 2,045 1,820
Softening temperature 101 2,240 2,230 1,905
Fluid temperature 84 2,340 2,340 1,935
2,600 192
2,710G 200
2,720G 198
E40 Resource Assessment of the Springfield, Herrin, Danville, and Baker Coals in the Illinois Basin
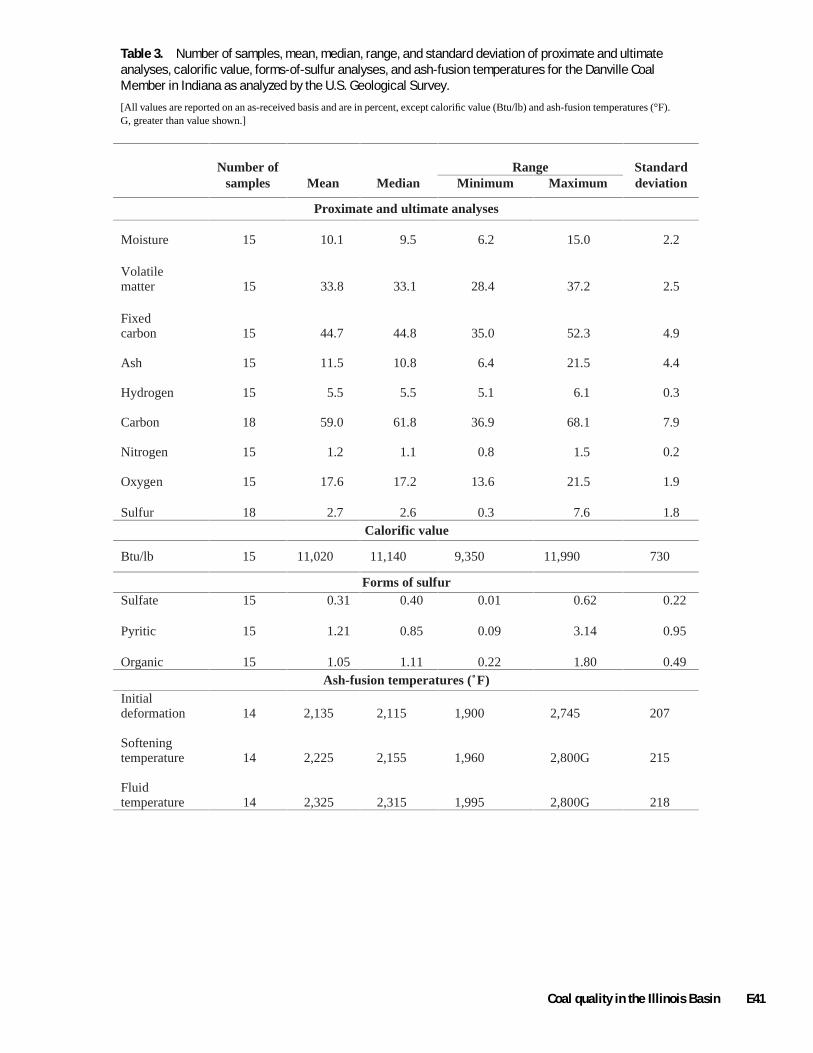
Table 3. Number of samples, mean, median, range, and standard deviation of proximate and ultimate analyses, calorific value, forms-of-sulfur analyses, and ash-fusion temperatures for the Danville Coal Member in Indiana as analyzed by the U.S. Geological Survey.
[All values are reported on an as-received basis and are in percent, except calorific value (Btu/lb) and ash-fusion temperatures (°F). G, greater than value shown.]
Number of Range Standard samples Mean Median Minimum Maximum deviation
Proximate and ultimate analyses
Moisture 15 10.1
Volatile matter 15 33.8
Fixed carbon 15 44.7
Ash 15 11.5
Hydrogen 15 5.5
Carbon 18 59.0
Nitrogen 15 1.2
Oxygen 15 17.6
Sulfur 18 2.7
9.5 6.2 15.0 2.2
33.1 28.4 37.2 2.5
44.8 35.0 52.3 4.9
10.8 6.4 21.5 4.4
5.5 5.1 6.1 0.3
61.8 36.9 68.1 7.9
1.1 0.8 1.5 0.2
17.2 13.6 21.5 1.9
2.6 0.3 7.6 1.8 Calorific value
Btu/lb 15 11,020 11,140 9,350 11,990 730
Forms of sulfur Sulfate 15 0.31
Pyritic 15 1.21
Organic 15 1.05
0.40
0.85
1.11
0.01 0.62 0.22
0.09 3.14 0.95
0.22 1.80 0.49 Ash-fusion temperatures (˚F)
Initial deformation 14 2,135 2,115 1,900
Softening temperature 14 2,225 2,155 1,960
Fluid temperature 14 2,325 2,315 1,995
2,745 207
2,800G 215
2,800G 218
Coal quality in the Illinois Basin E41

--- --- --- ---
--- --- --- ---
--- --- --- ---
--- --- --- ---
--- --- --- ---
--- --- --- ---
--- ---
--- ---
--- ---
--- ---
--- ---
--- ---
Table 4. Number of samples, mean, median, range, and standard deviation of proximate and ultimate analyses, calorific value, forms-of-sulfur analyses, and ash-fusion temperatures for the Baker coal in Kentucky as analyzed by the Kentucky Geological Survey.
[All values are reported on an as-received basis and are in percent, except calorific value (Btu/lb) and ash-fusion temperatures (°F). G, greater than value shown.]
Number of Range Standard samples Mean Median Minimum Maximum deviation
Proximate and ultimate analyses
Moisture 19 6.6
Volatile matter 19 33.8
Fixed carbon 19 46.5
Ash 19 13.2
Hydrogen 19 4.3
Carbon 19 65.3
Nitrogen 19 1.4
Oxygen 19 5.7
Sulfur 19 3.6
6.6 5.2 8.0 0.5
34.1 25.7 37.3 3.0
46.7 34.5 54.7 4.8
11.6 6.5 27.6 5.4
4.5 3.1 4.7 0.4
66.7 52.7 72.7 5.7
1.4 0.9 1.7 0.2
5.5 3.1 8.4 1.6
3.6 1.5 7.7 1.6 Calorific value
Btu/lb 19 11,740 12,150 9,300 12,990 1,050
Forms of sulfur Sulfate
Pyritic
Organic Ash-fusion temperatures (˚F)
Initial deformation
Softening temperature
Fluid temperature
E42 Resource Assessment of the Springfield, Herrin, Danville, and Baker Coals in the Illinois Basin

Table 5. Number of samples, mean, median, range, and standard deviation of proximate and ultimate analyses, calorific value, forms-of-sulfur analyses, and ash-fusion temperatures for the Baker coal in Kentucky as analyzed by the U.S. Geological Survey.
[All values are reported on an as-received basis and are in percent, except calorific value (Btu/lb) and ash-fusion temperatures (°F). G, greater than value shown.]
Number of Range Standard samples Mean Median Minimum Maximum deviation
Proximate and ultimate analyses
Moisture 15 6.9 6.7 3.4
Volatile matter 15 36.0 35.8 31.3
Fixed carbon 15 45.1 44.1 40.0
Ash 15 12.0 11.7 7.9
Hydrogen 15 5.2 5.2 4.8
Carbon 15 64.2 64.8 58.6
Nitrogen 15 1.4 1.4 1.2
Oxygen 15 13.5 13.0 10.2
Sulfur 15 3.7 4.2 1.6
10.8 2.1
40.8 3.0
50.5 3.1
17.9 2.7
5.6 0.2
70.3 3.4
1.7 0.1
18.1 2.3
5.8 1.2 Calorific value
Btu/lb 15 11,590 11,510 10,410 12,660 640
Forms of sulfur Sulfate 15 0.15 0.13 0.01 0.45 0.12
Pyritic 15 2.25 2.67 0.69 3.72 0.94
Organic 15 1.36 1.24 0.57 2.04 0.46 Ash-fusion temperatures (˚F)
Initial deformation 15 2,080 2,030 1,930
Softening temperature 15 2,140 2,080 2,030
Fluid temperature 15 2,310 2,260 2,080
2,610 169
2,710 176
2,800 194
Coal quality in the Illinois Basin E43

Table 6. Number of samples, mean, median, range, and standard deviation of proximate and ultimate analyses, calorific value, forms-of-sulfur analyses, and ash-fusion temperatures for the Herrin Coal Member in Illinois as analyzed by the Illinois State Geological Survey.
[All values are reported on an as-received basis and are in percent, except calorific value (Btu/lb) and ash-fusion temperatures (°F).]
Number of Range Standard samples Mean Median Minimum Maximum deviation
Proximate and ultimate analyses
Moisture 2,330 11.1
Volatile matter 2,160 34.6
Fixed carbon 2,160 43.4
Ash 2,327 10.9
Hydrogen 780 4.2
Carbon 780 60.8
Nitrogen 776 1.2
Oxygen 776 7.5
Sulfur 2,302 2.9
11.0 1.2 22.2 3.2
34.6 19.5 45.2 2.8
42.6 25.3 58.2 4.6
10.4 2.7 43.6 3.6
4.2 3.0 5.5 0.3
60.5 41.4 73.6 5.2
1.1 0.3 2.7 0.2
7.5 3.5 12.2 1.0
3.2 0.3 14.5 1.5 Calorific value
Btu/lb 2,176 11,100 11,120 5,770 13,420 800
Forms of sulfur Sulfate 776 0.07
Pyritic 1,014 1.63
Organic 1,016 1.43
0.03
1.64
1.48
0.01 2.02 0.12
0.04 8.48 1.07
0.16 3.35 0.62 Ash-fusion temperatures (˚F)
Initial deformation 437 2,110 2,080 1,680
Softening temperature 440 2,165 2,150 1,820
Fluid temperature 436 2,290 2,290 1,880
2,700 168
2,995 161
2,700 151
E44 Resource Assessment of the Springfield, Herrin, Danville, and Baker Coals in the Illinois Basin

Table 7. Number of samples, mean, median, range, and standard deviation of proximate and ultimate analyses, calorific value, forms-of-sulfur analyses, and ash-fusion temperatures for the Herrin Coal Member in Illinois as analyzed by the U.S. Geological Survey.
[All values are reported on an as-received basis and are in percent, except calorific value (Btu/lb) and ash-fusion temperatures (°F). G, greater than value shown.]
Number of Range Standard samples Mean Median Minimum Maximum deviation
Proximate and ultimate analyses
Moisture 74 6.4
Volatile matter 74 34.8
Fixed carbon 74 48.1
Ash 74 10.7
Hydrogen 74 5.1
Carbon 74 64.6
Nitrogen 74 1.2
Oxygen 74 14.9
Sulfur 74 3.4
5.8 3.1 12.1 2.5
34.9 27.3 40.9 2.6
48.3 40.1 58.5 3.9
10.2 2.4 24.3 4.1
5.2 4.2 5.9 0.3
65.2 55.1 73.6 4.9
1.2 0.5 1.6 0.2
14.5 10.0 20.5 2.7
3.1 0.5 8.7 1.6 Calorific value
Btu/lb 73 11,500 11,500 9,780 13,090 870
Forms of sulfur Sulfate 64 0.33
Pyritic 74 1.39
Organic 74 1.76
0.20
1.09
1.81
0.01 1.71 0.37
0.02 7.51 1.24
0.34 5.08 0.81 Ash-fusion temperatures (˚F)
Initial deformation 74 2,060 2,035 1,780
Softening temperature 74 2,130 2,125 1,820
Fluid temperature 74 2,210 2,175 1,860
2,800G 168
2,910G 174
2,910G 191
Coal quality in the Illinois Basin E45

--- --- --- ---
--- --- --- ---
--- --- --- ---
--- --- --- ---
--- --- --- ---
--- --- --- ---
--- ---
--- ---
--- ---
--- ---
--- ---
--- ---
Table 8. Number of samples, mean, median, range, and standard deviation of proximate and ultimate analyses, calorific value, forms-of-sulfur analyses, and ash-fusion temperatures for the Herrin coal in Kentucky as analyzed by the Kentucky Geological Survey. [All values are reported on an as-received basis and are in percent, except calorific value (Btu/lb) and ash-fusion temperatures (°F). Leaders (---) indicate no data.]
Number of Range Standard samples Mean Median Minimum Maximum deviation
Proximate and ultimate analyses
Moisture 121 6.5
Volatile matter 121 37.4
Fixed carbon 121 45.7
Ash 121 10.5
Hydrogen 65 4.3
Carbon 65 65.0
Nitrogen 65 1.2
Oxygen 65 7.3
Sulfur 121 3.8
6.5 3.8 9.4 0.9
37.4 32.2 42.5 2.1
45.7 35.8 52.9 3.4
9.8 5.3 24.1 3.6
4.3 2.9 5.0 0.5
65.8 47.8 71.0 4.4
1.3 0.7 1.7 0.2
7.8 2.3 16.7 2.4
3.8 1.0 7.0 1.1 Calorific value
Btu/lb 121 11,990 12,070 9,540 13,100 690
Forms of sulfur Sulfate
Pyritic
Organic Ash-fusion temperatures (˚F)
Initial deformation
Softening temperature
Fluid temperature
E46 Resource Assessment of the Springfield, Herrin, Danville, and Baker Coals in the Illinois Basin

Table 9. Number of samples, mean, median, range, and standard deviation of proximate and ultimate analyses, calorific value, forms-of-sulfur analyses, and ash-fusion temperatures for the Herrin coal in Kentucky as analyzed by the U.S. Geological Survey.
[All values are reported on an as-received basis and are in percent, except calorific value (Btu/lb) and ash-fusion temperatures (°F). G, greater than value shown.]
Number of Range Standard samples Mean Median Minimum Maximum deviation
Proximate and ultimate analyses
Moisture 20 6.0
Volatile matter 20 37.9
Fixed carbon 20 47.0
Ash 20 9.0
Hydrogen 20 5.4
Carbon 20 67.3
Nitrogen 20 1.4
Oxygen 20 13.3
Sulfur 20 3.6
6.2 2.3 9.7 2.0
37.7 30.4 42.7 2.9
47.3 40.7 51.3 3.3
7.5 5.3 24.8 4.9
5.5 4.3 5.8 0.3
68.6 53.5 73.3 4.7
1.4 1.2 1.5 0.1
13.5 8.7 16.8 2.2
3.6 2.9 5.0 0.6 Calorific value
Btu/lb 20 12,240 12,540 9,710 13,390 850
Forms of sulfur Sulfate 20 0.09
Pyritic 20 1.83
Organic 20 1.69
0.07
1.65
1.85
0.01 0.26 0.09
0.77 3.56 0.77
0.51 2.40 0.48 Ash-fusion temperatures (˚F)
Initial deformation 20 2,040 2,015 1,925
Softening temperature 20 2,125 2,085 2,030
Fluid temperature 20 2,250 2,225 2,125
2,770 175
2,800G 163
2,800G 139
Coal quality in the Illinois Basin E47
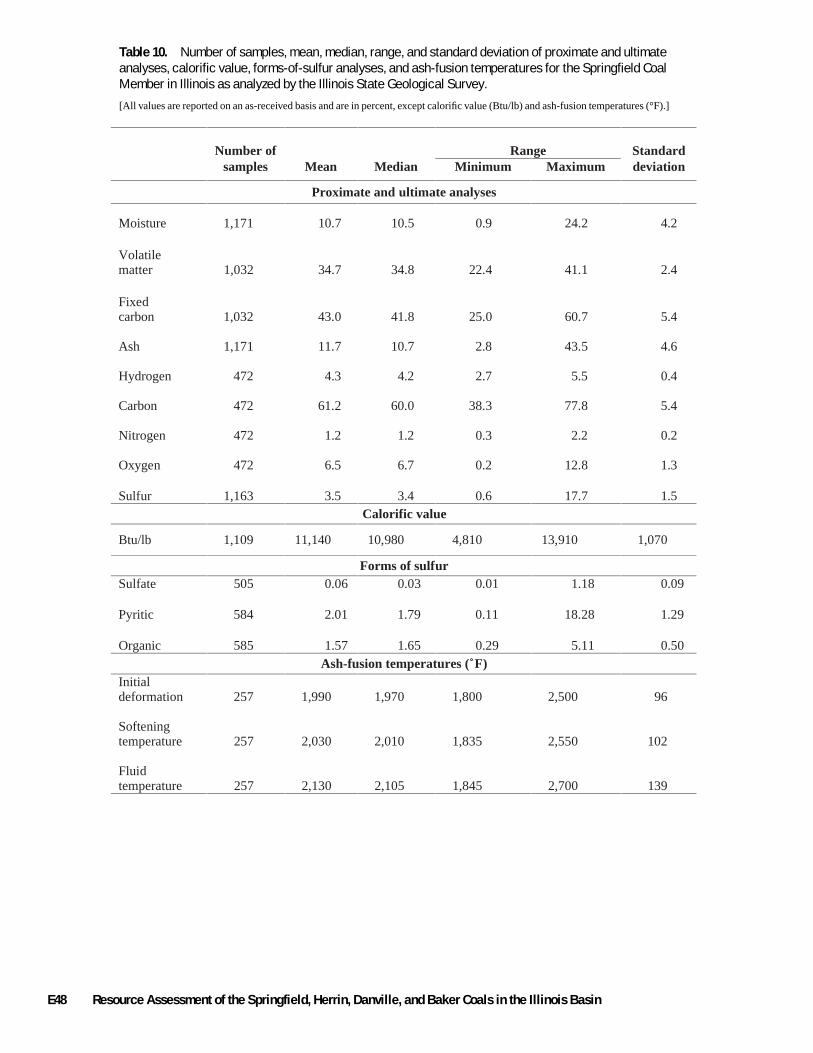
Table 10. Number of samples, mean, median, range, and standard deviation of proximate and ultimate analyses, calorific value, forms-of-sulfur analyses, and ash-fusion temperatures for the Springfield Coal Member in Illinois as analyzed by the Illinois State Geological Survey.
[All values are reported on an as-received basis and are in percent, except calorific value (Btu/lb) and ash-fusion temperatures (°F).]
Number of Range Standard samples Mean Median Minimum Maximum deviation
Proximate and ultimate analyses
Moisture 1,171 10.7
Volatile matter 1,032 34.7
Fixed carbon 1,032 43.0
Ash 1,171 11.7
Hydrogen 472 4.3
Carbon 472 61.2
Nitrogen 472 1.2
Oxygen 472 6.5
Sulfur 1,163 3.5
10.5 0.9 24.2 4.2
34.8 22.4 41.1 2.4
41.8 25.0 60.7 5.4
10.7 2.8 43.5 4.6
4.2 2.7 5.5 0.4
60.0 38.3 77.8 5.4
1.2 0.3 2.2 0.2
6.7 0.2 12.8 1.3
3.4 0.6 17.7 1.5 Calorific value
Btu/lb 1,109 11,140 10,980 4,810 13,910 1,070
Forms of sulfur Sulfate 505 0.06
Pyritic 584 2.01
Organic 585 1.57
0.03
1.79
1.65
0.01 1.18 0.09
0.11 18.28 1.29
0.29 5.11 0.50 Ash-fusion temperatures (˚F)
Initial deformation 257 1,990 1,970 1,800
Softening temperature 257 2,030 2,010 1,835
Fluid temperature 257 2,130 2,105 1,845
2,500 96
2,550 102
2,700 139
E48 Resource Assessment of the Springfield, Herrin, Danville, and Baker Coals in the Illinois Basin

Table 11. Number of samples, mean, median, range, and standard deviation of proximate and ultimate analyses, calorific value, forms-of-sulfur analyses, and ash-fusion temperatures for the Springfield Coal Member in Indiana as analyzed by the Indiana Geological Survey.
[All values are reported on an as-received basis and are in percent, except calorific value (Btu/lb) and ash-fusion temperatures (°F). G, greater than value shown.]
Number of Range Standard samples Mean Median Minimum Maximum deviation
Proximate and ultimate analyses
Moisture 336 9.9
Volatile matter 335 37.0
Fixed carbon 335 42.1
Ash 336 10.9
Hydrogen 274 5.5
Carbon 273 62.0
Nitrogen 273 1.3
Oxygen 272 16.9
Sulfur 336 3.3
10.2 0.5 34.7 4.0
37.3 17.7 55.0 3.9
42.2 14.0 62.7 4.9
9.7 4.3 49.7 5.3
5.6 3.1 7.1 0.5
62.9 34.7 72.5 5.3
1.3 0.7 1.9 0.2
16.9 2.9 42.2 3.9
3.3 0.6 7.4 1.3 Calorific value
Btu/lb 336 11,210 11,400 6,020 13,400 920
Forms of sulfur Sulfate 37 0.20
Pyritic 41 1.51
Organic 41 1.55
0.12
1.25
1.46
0.01 1.19 0.24
0.20 4.66 1.07
0.50 3.92 0.74 Ash-fusion temperatures (˚F)
Initial deformation 237 2,001 1,959 1,795
Softening temperature 293 2,130 2,080 1,860
Fluid temperature 237 2,234 2,200 1,924
2,700G 167
2,810G 186
2,720G 194
Coal quality in the Illinois Basin E49

Table 12. Number of samples, mean, median, range, and standard deviation of proximate and ultimate analyses, calorific value, forms-of-sulfur analyses, and ash-fusion temperatures for the Springfield Coal Member in Indiana as analyzed by the U.S. Geological Survey.
[All values are reported on an as-received basis and are in percent, except calorific value (Btu/lb) and ash-fusion temperatures (°F). G, greater than value shown.]
Number of Range Standard samples Mean Median Minimum Maximum deviation
Proximate and ultimate analyses
Moisture 35 8.8 8.9 4.6
Volatile matter 35 36.1 35.8 22.8
Fixed carbon 35 46.1 46.6 38.7
Ash 35 9.0 8.9 4.2
Hydrogen 35 5.5 5.5 5.1
Carbon 41 62.0 64.2 28.0
Nitrogen 35 1.2 1.2 0.9
Oxygen 35 16.3 16.5 12.0
Sulfur 41 4.2 3.4 0.5
15.3 2.2
42.8 4.1
57.7 3.7
12.5 1.9
5.9 0.2
68.6 7.9
1.6 0.2
22.9 2.4
19.5 3.3 Calorific value
Btu/lb 35 11,603 11,590 10,800 12,460 377
Forms of sulfur Sulfate 35 0.29 0.15 0.01
Pyritic 35 1.51 1.42 0.06
Organic 35 1.68 1.73 0.42
1.28 0.34
3.41 0.83
2.65 0.50 Ash-fusion temperatures (˚F)
Initial deformation 25 2,105 2,035 1,865 2,800 236
Softening temperature 25 2,205 2,145 1,935 2,910G 238
Fluid temperature 25 2,280 2,255 1,985 2,910G 235
E50 Resource Assessment of the Springfield, Herrin, Danville, and Baker Coals in the Illinois Basin

--- --- --- ---
--- --- --- ---
--- --- --- ---
--- --- --- ---
--- --- --- ---
--- --- --- ---
--- ---
--- ---
--- ---
--- ---
--- ---
--- ---
Table 13. Number of samples, mean, median, range, and standard deviation of proximate and ultimate analyses, calorific value, forms-of-sulfur analyses, and ash-fusion temperatures for the Springfield coal in Kentucky as analyzed by the Kentucky Geological Survey.
[All values are reported on an as-received basis and are in percent, except calorific value (Btu/lb) and ash-fusion temperatures (°F). Leaders (---) indicate no data.]
Number of Range Standard samples Mean Median Minimum Maximum deviation
Proximate and ultimate analyses
Moisture 259 7.9 7.9 1.8 12.2 1.7
Volatile matter 259 36.2 36.4 31.6 41.4 1.5
Fixed carbon 259 45.7 45.5 40.0 52.1 2.3
Ash 259 10.2 10.1 5.0 16.4 1.6
Hydrogen 141 4.2 4.3 3.2 4.8 0.4
Carbon 141 65.2 65.4 50.5 72.6 2.4
Nitrogen 141 1.3 1.3 0.8 1.7 0.2
Oxygen 141 7.1 7.2 2.6 19.9 2.0
Sulfur 259 3.5 3.5 2.1 6.2 0.7 Calorific value
Btu/lb 259 11,870 11,820 10,820 13,250 480
Forms of sulfur Sulfate
Pyritic
Organic Ash-fusion temperatures (˚F)
Initial deformation
Softening temperature
Fluid temperature
Coal quality in the Illinois Basin E51

Table 14. Number of samples, mean, median, range, and standard deviation of proximate and ultimate analyses, calorific value, forms-of-sulfur analyses, and ash-fusion temperatures for the Springfield coal in Kentucky as analyzed by the U.S. Geological Survey.
[All values are reported on an as-received basis and are in percent, except calorific value (Btu/lb) and ash-fusion temperatures (°F).]
Number of Range Standard samples Mean Median Minimum Maximum deviation
Proximate and ultimate analyses
Moisture 31 7.2 7.0 2.5
Volatile matter 31 36.9 36.9 34.7
Fixed carbon 31 45.3 45.2 40.8
Ash 31 10.5 10.7 6.7
Hydrogen 31 5.3 5.3 4.8
Carbon 31 65.2 65.4 59.8
Nitrogen 31 1.4 1.4 1.0
Oxygen 31 13.6 13.5 7.6
Sulfur 31 3.9 3.7 2.5
12.4 2.2
39.8 1.3
49.9 2.5
15.2 2.4
5.7 0.2
70.2 2.8
1.6 0.1
20.3 2.7
8.0 1.1 Calorific value
Btu/lb 31 11,840 11,930 10,820 12,770 530
Forms of sulfur Sulfate 31 0.12 0.06 0.01
Pyritic 31 2.09 1.90 0.71
Organic 31 1.74 1.67 1.08
0.53 0.13
4.10 0.85
3.94 0.52 Ash-fusion temperatures (˚F)
Initial deformation 31 2,015 2,015 1,910 2,220 69
Softening temperature 31 2,100 2,105 1,950 2,250 77
Fluid temperature 31 2,205 2,205 2,050 2,360 78
E52 Resource Assessment of the Springfield, Herrin, Danville, and Baker Coals in the Illinois Basin

--- --- --- ---
--- --- --- ---
--- --- --- ---
--- --- --- ---
--- --- --- ---
--- --- --- ---
--- ---
--- ---
--- ---
--- ---
--- ---
--- ---
Table 15. Number of samples, mean, median, range, and standard deviation of proximate and ultimate analyses, calorific value, forms-of-sulfur analyses, and ash-fusion temperatures for nonassessed coals from the McLeansboro Group in Kentucky as analyzed by the Kentucky Geological Survey.
[All values are reported on an as-received basis and are in percent, except calorific value (Btu/lb) and ash-fusion temperatures (°F). Leaders (---) indicate no data.]
Number of Range Standard samples Mean Median Minimum Maximum deviation
Proximate and ultimate analyses
Moisture 57 7.5
Volatile matter 57 34.6
Fixed carbon 57 43.2
Ash 57 14.7
Hydrogen 57 4.0
Carbon 57 62.0
Nitrogen 57 1.3
Oxygen 57 6.7
Sulfur 57 3.8
7.5 7.5 7.5 0.0
34.4 29.8 38.2 2.1
43.0 34.0 50.6 4.0
14.6 6.0 28.7 4.4
4.1 3.0 4.7 0.4
62.2 51.8 69.9 3.9
1.3 0.7 1.6 0.2
7.0 2.1 12.5 2.0
3.6 1.7 8.0 1.3 Calorific value
Btu/lb 57 11,150 11,200 9,300 12,620 710
Forms of sulfur Sulfate
Pyritic
Organic Ash-fusion temperatures (˚F)
Initial deformation
Softening temperature
Fluid temperature
Coal quality in the Illinois Basin E53

Table 16. Number of samples, mean, median, range, and standard deviation of proximate and ultimate analyses, calorific value, forms-of-sulfur analyses, and ash-fusion temperatures for nonassessed coals from the McLeansboro Group in Kentucky as analyzed by the U.S. Geological Survey.
[All values are reported on an as-received basis and are in percent, except calorific value (Btu/lb) and ash-fusion temperatures (°F).]
Number of Range Standard samples Mean Median Minimum Maximum deviation
Proximate and ultimate analyses
Moisture 25 6.7
Volatile matter 25 35.8
Fixed carbon 25 44.9
Ash 25 12.5
Hydrogen 25 5.2
Carbon 25 63.7
Nitrogen 25 1.4
Oxygen 25 13.8
Sulfur 25 3.4
7.0 3.8 12.6 1.9
36.6 29.7 38.5 2.3
45.3 38.7 50.1 3.0
12.8 6.0 24.4 3.8
5.2 4.6 5.5 0.2
64.3 50.6 70.1 3.6
1.4 1.2 1.6 0.1
13.4 11.1 20.5 2.0
3.2 1.8 5.7 1.0 Calorific value
Btu/lb 25 11,530 11,530 9,080 12,660 660
Forms of sulfur Sulfate 24 0.13
Pyritic 24 1.83
Organic 24 1.42
0.08
1.69
1.51
0.01 0.70 0.17
0.84 4.04 0.89
0.50 1.92 0.43 Ash-fusion temperatures (˚F)
Initial deformation 25 2,145 2,115 1,905
Softening temperature 25 2,240 2,190 2,015
Fluid temperature 25 2,380 2,340 2,130
2,615 153
2,710 153
2,800 172
E54 Resource Assessment of the Springfield, Herrin, Danville, and Baker Coals in the Illinois Basin

Table 17. Number of samples, mean, median, range, and standard deviation of proximate and ultimate analyses, calorific value, forms-of-sulfur analyses, and ash-fusion temperatures for nonassessed coals from the Carbondale Group in Indiana as analyzed by the Indiana Geological Survey. [All values are reported on an as-received basis and are in percent, except calorific value (Btu/lb) and ash-fusion temperatures (°F). G, greater than value shown.]
Number of Range Standard samples Mean Median Minimum Maximum deviation
Proximate and ultimate analyses
Moisture 312 10.8
Volatile matter 307 35.8
Fixed carbon 307 40.9
Ash 312 12.5
Hydrogen 235 5.4
Carbon 235 60.2
Nitrogen 229 1.3
Oxygen 228 17.6
Sulfur 312 2.8
11.3 0.8 37.1 5.0
36.2 19.7 43.4 3.5
41.4 8.5 59.8 5.0
10.5 4.7 48.5 6.6
5.5 3.1 6.8 0.6
61.4 32.2 73.6 5.7
1.3 0.9 2.1 0.2
18.1 6.2 32.0 4.5
2.5 0.3 11.1 1.6 Calorific value
Btu/lb 312 10,800 11,100 5,440 13,200 1,170
Forms of sulfur Sulfate 20 0.28
Pyritic 20 1.77
Organic 20 1.55
0.21
1.61
1.24
0.02 1.02 0.28
0.59 3.80 0.92
0.68 5.78 1.21 Ash-fusion temperatures (˚F)
Initial deformation 212 2,045 1,980 1,800
Softening temperature 254 2,180 2,120 1,900
Fluid temperature 212 2,295 2,260 1,930
2,700G 191
2,770G 193
2,805G 193
Coal quality in the Illinois Basin E55

Table 18. Number of samples, mean, median, range, and standard deviation of proximate and ultimate analyses, calorific value, forms-of-sulfur analyses, and ash-fusion temperatures for nonassessed coals from the Carbondale Group in Indiana as analyzed by the U.S. Geological Survey.
[All values are reported on an as-received basis and are in percent, except calorific value (Btu/lb) and ash-fusion temperatures (°F). G, greater than value shown.]
Number of Range Standard samples Mean Median Minimum Maximum deviation
Proximate and ultimate analyses
Moisture 29 9.0 9.1 2.8 15.6 2.6
Volatile matter 29 34.6 34.8 25.0 40.7 3.2
Fixed carbon 29 44.4 44.7 27.3 52.7 4.5
Ash 29 12.0 10.5 6.3 44.9 7.1
Hydrogen 29 5.4 5.4 3.5 6.1 0.5
Carbon 36 59.4 61.5 24.0 69.6 9.1
Nitrogen 29 1.2 1.3 0.5 1.5 0.2
Oxygen 29 16.6 17.1 9.8 21.6 2.5
Sulfur 36 4.1 3.2 1.2 28.1 4.4 Calorific value
Btu/lb 29 11,070 11,090 6,930 12,330 960
Forms of sulfur Sulfate 29
Pyritic 29
Organic 29
0.46 0.49
1.62 1.48
1.06 1.09
0.02 1.08 0.32
0.34 3.34 0.78
0.26 1.92 0.46 Ash-fusion temperatures (˚F)
Initial deformation 26 2,090 2,030 1,885 2,800G 214
Softening temperature 26 2,180 2,120 1,985 2,800G 201
Fluid temperature 26 2,255 2,195 2,020 2,800G 199
E56 Resource Assessment of the Springfield, Herrin, Danville, and Baker Coals in the Illinois Basin

--- --- --- ---
--- --- --- ---
--- --- --- ---
--- --- --- ---
--- --- --- ---
--- --- --- ---
--- ---
--- ---
--- ---
--- ---
--- ---
--- ---
Table 19. Number of samples, mean, median, range, and standard deviation of proximate and ultimate analyses, calorific value, forms-of-sulfur analyses, and ash-fusion temperatures for nonassessed coals from the Carbondale Formation in Kentucky as analyzed by the Kentucky Geological Survey.
[All values are reported on an as-received basis and are in percent, except calorific value (Btu/lb) and ash-fusion temperatures (°F). Leaders (---) indicate no data.]
Number of Range Standard samples Mean Median Minimum Maximum deviation
Proximate and ultimate analyses
Moisture 42 7.5
Volatile matter 42 36.0
Fixed carbon 42 41.5
Ash 42 15.0
Hydrogen 42 4.1
Carbon 42 60.9
Nitrogen 42 1.2
Oxygen 41 7.6
Sulfur 42 3.9
7.5 7.5 7.5 0.0
36.0 26.2 42.5 3.2
41.1 30.4 53.1 4.9
13.8 3.6 30.9 6.4
4.2 1.7 4.8 0.6
62.1 47.0 69.7 5.8
1.3 0.4 1.5 0.2
7.2 2.0 17.7 3.3
3.9 1.8 8.2 1.4 Calorific value
Btu/lb 42 11,070 11,270 8,410 12,570 1,010
Forms of sulfur Sulfate
Pyritic
Organic Ash-fusion temperatures (˚F)
Initial deformation
Softening temperature
Fluid temperature
Coal quality in the Illinois Basin E57

Table 20. Number of samples, mean, median, range, and standard deviation of proximate and ultimate analyses, calorific value, forms-of-sulfur analyses, and ash-fusion temperatures for nonassessed coals from the Carbondale Formation in Kentucky as analyzed by the U.S. Geological Survey.
[All values are reported on an as-received basis and are in percent, except calorific value (Btu/lb) and ash-fusion temperatures (°F).]
Number of Range Standard samples Mean Median Minimum Maximum deviation
Proximate and ultimate analyses
Moisture 42 6.1 6.3 2.4 16.3 2.4
Volatile matter 42 37.6 37.4 32.1 44.3 2.8
Fixed carbon 42 42.9 42.9 33.2 52.2 4.1
Ash 42 13.4 12.3 6.1 27.1 5.1
Hydrogen 42 5.2 5.3 4.0 5.8 0.4
Carbon 42 63.3 63.7 45.5 73.6 6.2
Nitrogen 42 1.4 1.4 1.0 1.6 0.2
Oxygen 42 12.2 12.1 6.5 25.3 2.8
Sulfur 42 4.6 4.0 1.4 15.9 2.6 Calorific value
Btu/lb 42 11,590 11,630 8,950 13,200 1,010
Forms of sulfur Sulfate 42 0.16
Pyritic 42 2.74
Organic 42 1.66
0.11
2.24
1.58
0.01 0.64 0.15
0.30 12.10 2.13
0.64 4.37 0.70 Ash-fusion temperatures (˚F)
Initial deformation 42 2,065 2,035 1,930 2,440 101
Softening temperature 42 2,130 2,105 2,000 2,530 113
Fluid temperature 42 2,255 2,225 2,070 2,650 139
E58 Resource Assessment of the Springfield, Herrin, Danville, and Baker Coals in the Illinois Basin

Table 21. Number of samples, mean, median, range, and standard deviation of proximate and ultimate analyses, calorific value, forms-of-sulfur analyses, and ash-fusion temperatures for nonassessed coals from the Raccoon Creek Group in Indiana as analyzed by the Indiana Geological Survey.
[All values are reported on an as-received basis and are in percent, except calorific value (Btu/lb) and ash-fusion temperatures (°F). G, greater than value shown.]
Number of Range Standard samples Mean Median Minimum Maximum deviation
Proximate and ultimate analyses
Moisture 586 12.0
Volatile Matter 584 35.3
Fixed carbon 584 42.2
Ash 586 10.5
Hydrogen 390 5.6
Carbon 390 61.8
Nitrogen 390 1.3
Oxygen 387 18.3
Sulfur 586 2.9
12.1 0.7 52.8 5.8
35.2 16.5 54.0 3.9
42.9 7.9 58.7 6.1
8.7 1.7 48.7 6.4
5.7 2.4 8.2 0.6
62.8 30.2 75.7 6.3
1.3 0.7 1.8 0.2
17.8 5.7 51.2 5.8
2.6 0.1 14.1 2.0 Calorific value
Btu/lb 583 10,980 11,290 4,540 13,540 1,300
Forms of sulfur Sulfate 50 0.34
Pyritic 50 1.76
Organic 51 1.43
0.27
1.13
1.32
0.02 2.31 0.37
0.15 7.46 1.79
0.05 5.43 1.00 Ash-fusion temperatures (˚F)
Initial deformation 444 2,135 2,020 1,760
Softening temperature 507 2,265 2,200 1,810
Fluid temperature 444 2,360 2,360 1,900
2,860G 275
2,895G 256
2,895G 231
Coal quality in the Illinois Basin E59

Table 22. Number of samples, mean, median, range, and standard deviation of proximate and ultimate analyses, calorific value, forms-of-sulfur analyses, and ash-fusion temperatures for nonassessed coals from the Raccoon Creek Group in Indiana as analyzed by the U.S. Geological Survey.
[All values are reported on an as-received basis and are in percent, except calorific value (Btu/lb) and ash-fusion temperatures (°F). G, greater than value shown.]
Number of Range Standard samples Mean Median Minimum Maximum deviation
Proximate and ultimate analyses
Moisture 62 10.9
Volatile matter 62 33.9
Fixed carbon 62 46.7
Ash 62 8.5
Hydrogen 62 5.6
Carbon 85 62.2
Nitrogen 62 1.1
Oxygen 62 18.4
Sulfur 85 3.1
11.0 2.1 21.4 3.8
34.3 22.4 43.5 4.2
47.3 39.2 57.8 4.0
8.1 2.0 15.0 3.1
5.6 4.8 6.3 0.3
63.3 27.7 82.9 8.0
1.2 0.6 1.6 0.2
18.2 7.9 31.3 4.0
2.5 0.4 30.1 3.5 Calorific value
Btu/lb 62 11,360 11,405 9,020 13,010 730
Forms of sulfur Sulfate 62 0.29
Pyritic 62 1.70
Organic 62 1.09
0.26
1.24
0.93
0.01 0.92 0.26
0.06 6.10 1.50
0.15 2.15 0.53 Ash-fusion temperatures (˚F)
Initial deformation 54 2,215 2,065 1,895
Softening temperature 54 2,305 2,205 1,960
Fluid temperature 54 2,390 2,340 2,000
2,800G 289
2,910G 291
2,910G 276
E60 Resource Assessment of the Springfield, Herrin, Danville, and Baker Coals in the Illinois Basin

--- --- --- ---
--- --- --- ---
--- --- --- ---
--- --- --- ---
--- --- --- ---
--- --- --- ---
--- ---
--- ---
--- ---
--- ---
--- ---
--- ---
Table 23. Number of samples, mean, median, range, and standard deviation of proximate and ultimate analyses, calorific value, forms-of-sulfur analyses, and ash-fusion temperatures for nonassessed coals from the Raccoon Creek Group in Kentucky as analyzed by the Kentucky Geological Survey. [All values are reported on an as-received basis and are in percent, except calorific value (Btu/lb) and ash-fusion temperatures (°F). Leaders (---) indicate no data.]
Number of Range Standard samples Mean Median Minimum Maximum deviation
Proximate and ultimate analyses
Moisture 87 7.5
Volatile matter 87 36.5
Fixed carbon 87 46.9
Ash 87 9.1
Hydrogen 87 4.2
Carbon 87 67.1
Nitrogen 87 1.3
Oxygen 87 8.3
Sulfur 87 2.6
7.5 7.5 7.5 0.0
36.1 24.2 44.9 3.5
47.0 24.4 55.9 5.5
7.6 1.5 43.9 6.9
4.2 2.4 5.1 0.5
68.6 35.9 75.7 7.2
1.4 0.6 1.8 0.3
8.1 4.3 12.8 1.7
2.4 0.6 7.3 1.6 Calorific value
Btu/lb 87 11,960 12,310 6,180 13,620 1,270
Forms of sulfur Sulfate
Pyritic
Organic Ash-fusion temperatures (˚F)
Initial deformation
Softening temperature
Fluid temperature
Coal quality in the Illinois Basin E61

Table 24. Number of samples, mean, median, range, and standard deviation of proximate and ultimate analyses, calorific value, forms-of-sulfur analyses, and ash-fusion temperatures for nonassessed coals from the Raccoon Creek Group in Kentucky as analyzed by the U.S. Geological Survey.
[All values are reported on an as-received basis and are in percent, except calorific value (Btu/lb) and ash-fusion temperatures (°F). G, greater than value shown.]
Number of Range Standard samples Mean Median Minimum Maximum deviation
Proximate and ultimate analyses
Moisture 43 8.9 8.7 4.1
Volatile matter 43 36.5 36.3 30.7
Fixed carbon 43 47.7 47.4 40.4
Ash 43 6.8 6.4 1.5
Hydrogen 43 5.6 5.7 4.7
Carbon 43 67.9 69.0 60.6
Nitrogen 43 1.5 1.4 1.1
Oxygen 43 15.6 15.5 10.4
Sulfur 43 2.5 2.2 0.5
15.2 2.5
42.6 2.6
53.5 3.3
13.9 3.4
6.1 0.3
74.4 3.5
2.5 0.2
21.4 2.8
8.1 1.8 Calorific value
Btu/lb 43 12,220 12,340 10,970 13,330 570
Forms of sulfur Sulfate 43 0.11 0.05 0.01
Pyritic 43 1.49 1.40 0.03
Organic 43 0.95 0.72 0.34
0.45 0.13
4.57 1.23
3.13 0.63 Ash-fusion temperatures (˚F)
Initial deformation 43 2,240 2,120 1,915 2,800G 270
Softening temperature 43 2,325 2,205 2,030 2,800G 262
Fluid temperature 43 2,430 2,350 2,080 2,800G 239
E62 Resource Assessment of the Springfield, Herrin, Danville, and Baker Coals in the Illinois Basin
Appendix 3. Summary descriptive statistics of ash yields and contents of selected elements for all assessed and nonassessed coals in the Illinois Basin.

Table 1. Number of samples, mean, median, range, and standard deviation of ash yield and contents of elements for all assessed coals (Springfield, Herrin, Danville, and Baker Coals) in the Illinois Basin.
[All analyses are in percent or parts per million and are reported on an as-received, whole-coal basis. L, less than value shown. A common problem in statistical summaries of trace-element data arises when element values are below the limits of analytical detection. This results in a censored distribution. To compute unbiased estimates of the means for censored data, we adopted the protocol of reducing all "less than" values by 50 percent before summary statistics were generated.]
Number of samples Mean
Ash 211 12.4 Si 574 2.2 Al 574 1.1 Ca 574 0.52 Mg 575 0.054 Na 587 0.053 K 592 0.18 Fe 574 2.0 Ti 574 0.058
As 400 9.4 B 352 99 Ba 332 100 Be 389 1.8 Cd 370 0.99 Co 566 4.0 Cr 568 18 Cu 355 11 F 345 71 Ge 338 7.8 Hg 368 0.12 La 316 5.8 Li 284 11 Mn 558 52 Mo 335 7.6 Nb 210 1.8 Ni 580 16 P 399 90 Pb 389 16 Sb 399 0.9 Sc 313 2.7 Se 380 2.2 Sr 332 33 Th 334 2.0 U 351 2.2 V 358 24 Y 211 5.6 Yb 299 0.55 Zn 373 170 Zr 346 26
Range Standard Median Minimum Maximum deviation
Percent 11.0 1.9 0.93 0.40 0.043 0.038 0.15 1.7 0.051
2.8 47.0 6.7 0.018 13 1.2 0.17 5.8 0.57 0.015 11 0.62 0.0044L 0.47 0.043 0.0018 0.42 0.049 0.003L 1.4 0.13 0.096 27 1.5 0.004L 0.37 0.03
Parts per million 4.4 0.20L 140 15
89 5.7L 390 48 35 5.5 2,500 280 1.5 0.36L 8.5 1.1 0.16 0.01L 54 4.2 3.3 0.78 17 2.3
14 2.8L 190 16 8.6 2.7 77 8.3
52 10L 600 75 5.8 0.045L 63 8.1 0.09 0.01L 1.2 0.11 5.0 0.84L 31 4.2 7.3 0.94L 89 13
36 0.58 1,200 64 5.0 0.16L 190 12 1.6 0.26L 12 1.4
12 1.0 190 15 45 2.8L 2,200 160 6.3 0.019L 350 30 0.6 0.1 15 1.4 2.3 0.38 16 1.5 1.8 0.4L 13 1.6
23 2.7L 980 60 1.5 0.3L 17 1.7 1.2 0.15L 26 3.1
19 1.2 130 19 4.9 1.1 27 3.3 0.5 0.065L 3.2 0.33
36 3.7 4,500 510 20 0.51L 270 24
E64 Resource Assessment of the Springfield, Herrin, Danville, and Baker

--- --- --- --- --- ---
Table 2. Number of samples, mean, median, range, and standard deviation of ash yield and contents of elements for the Danville Coal Member in Illinois and Indiana.
[All analyses are in percent or parts per million and are reported on an as-received, whole-coal basis. L, less than value shown. G, greater than value shown. A common problem in statistical summaries of trace-element data arises when element values are below the limits of analytical detection. This results in a censored distribution. To compute unbiased estimates of the means for censored data, we adopted the protocol of reducing all "less than" values by 50 percent before summary statistics were generated. Leaders (---) indicate statistics could not be calculated owing to no data or to an insufficient number of analyses above the lower detection limit.]
Number of samples Mean
Ash 19 16.2 Si 22 3.3 Al 22 1.6 Ca 22 0.37 Mg 22 0.12 Na 22 0.075 K 22 0.35 Fe 22 2.0 Ti 22 0.089
As 22 12 B 22 110 Ba 21 67 Be 22 3.2 Cd 22 0.40 Co 22 6.3 Cr 22 19 Cu 22 10 F 22 110 Ge 22 12 Hg 22 0.10 La 21 8.7 Li 21 19 Mn 22 55 Mo 21 2.6 Nb 19 2.9 Ni 22 24 P Pb 22 17 Sb 22 2.3 Sc 21 3.9 Se 22 1.3 Sr 21 35 Th 20 2.5 U 21 1.3
22 25 Y 19 6.8 Yb 21 0.70 Zn 22 250 Zr 21 49
Range Standard Median Minimum Maximum deviation
Percent 13.0 2.2 1.1 0.33 0.079 0.058 0.23 1.7 0.062
6.7 47.0 11 1.4 13 2.7 0.55 5.8 1.2 0.029 1.2 0.34 0.029 0.47 0.10 0.013 0.24 0.061 0.11 1.4 0.33 0.2.0 7.5 1.5 0.044 0.37 0.073
Parts per million 10
110 46 3.2 0.12 6.2
17 9.9
66 14 0.09 6.5
10 48 2.3 2.1
27
13 1.5 3.2 1.2
31 1.8 1.4
20 6.4 0.60
36 29
0.50 43 10 31 190G 40 20 290 62 1.2 6.0 1.2 0.01L 4.5 0.98 2.5 12 2.5 9.5 46 9.5 5.5 24 4.0
22 450 120 1.1L 19 5.5 0.01 0.32 0.07 3.0 26 5.8 5.5 89 20
10 230 48 0.16L 10 2.1 0.61L 12 2.5 5.5 48 15
1.5L 48 15 0.2 15 3.2 1.9 8.9 1.8 0.7 2.1 0.4
13 130 26 1.0 8.3 1.7 0.35L 3.5 0.73
10 85 17 3.3 18 3.5 0.27 1.6 0.39 8.2 3,300 710
13 270 61
Coal quality in the Illinois Basin E65
V
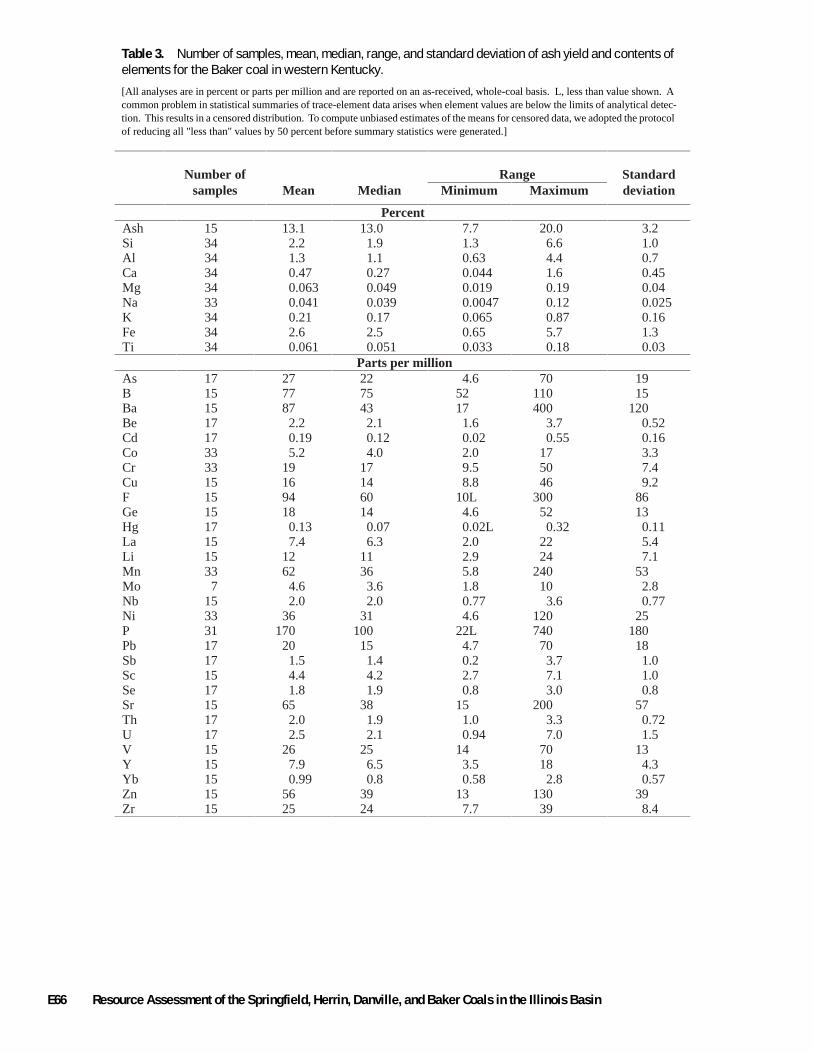
Table 3. Number of samples, mean, median, range, and standard deviation of ash yield and contents of elements for the Baker coal in western Kentucky.
[All analyses are in percent or parts per million and are reported on an as-received, whole-coal basis. L, less than value shown. A common problem in statistical summaries of trace-element data arises when element values are below the limits of analytical detection. This results in a censored distribution. To compute unbiased estimates of the means for censored data, we adopted the protocol of reducing all "less than" values by 50 percent before summary statistics were generated.]
Number of Range Standard samples Mean Median Minimum Maximum deviation
Percent Ash 15 13.1 13.0 7.7 20.0 3.2 Si 34 2.2 1.9 1.3 6.6 1.0 Al 34 1.3 1.1 0.63 4.4 0.7 Ca 34 0.47 0.27 0.044 1.6 0.45 Mg 34 0.063 0.049 0.019 0.19 0.04 Na 33 0.041 0.039 0.0047 0.12 0.025 K 34 0.21 0.17 0.065 0.87 0.16 Fe 34 2.6 2.5 0.65 5.7 1.3 Ti 34 0.061 0.051 0.033 0.18 0.03
Parts per million As 17 27 22 4.6 70 19 B 15 77 75 52 110 15 Ba 15 87 43 17 400 120 Be 17 2.2 2.1 1.6 3.7 0.52Cd 17 0.19 0.12 0.02 0.55 0.16Co 33 5.2 4.0 2.0 17 3.3 Cr 33 19 17 9.5 50 7.4 Cu 15 16 14 8.8 46 9.2 F 15 94 60 10L 300 86 Ge 15 18 14 4.6 52 13 Hg 17 0.13 0.07 0.02L 0.32 0.11La 15 7.4 6.3 2.0 22 5.4 Li 15 12 11 2.9 24 7.1 Mn 33 62 36 5.8 240 53 Mo 7 4.6 3.6 1.8 10 2.8 Nb 15 2.0 2.0 0.77 3.6 0.77Ni 33 36 31 4.6 120 25 P 31 170 100 22L 740 180 Pb 17 20 15 4.7 70 18 Sb 17 1.5 1.4 0.2 3.7 1.0 Sc 15 4.4 4.2 2.7 7.1 1.0 Se 17 1.8 1.9 0.8 3.0 0.8 Sr 15 65 38 15 200 57 Th 17 2.0 1.9 1.0 3.3 0.72U 17 2.5 2.1 0.94 7.0 1.5 V 15 26 25 14 70 13 Y 15 7.9 6.5 3.5 18 4.3 Yb 15 0.99 0.8 0.58 2.8 0.57Zn 15 56 39 13 130 39 Zr 15 25 24 7.7 39 8.4
E66 Resource Assessment of the Springfield, Herrin, Danville, and Baker Coals in the Illinois Basin
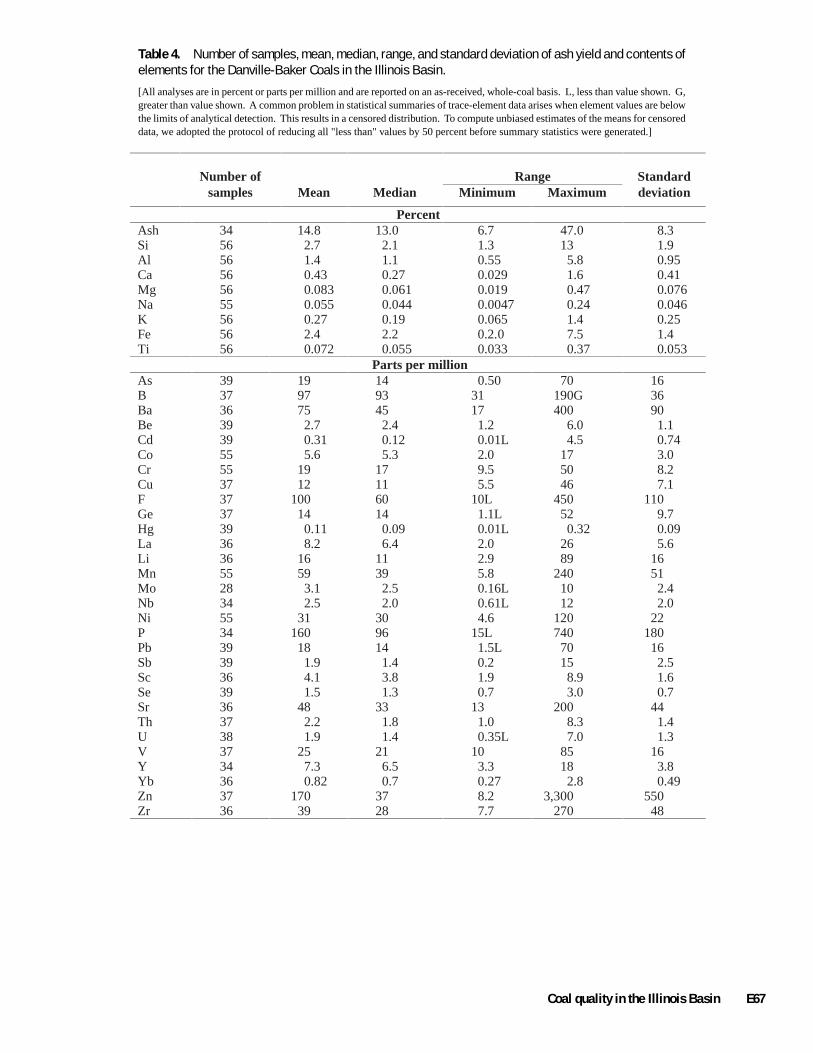
Table 4. Number of samples, mean, median, range, and standard deviation of ash yield and contents of elements for the Danville-Baker Coals in the Illinois Basin.
[All analyses are in percent or parts per million and are reported on an as-received, whole-coal basis. L, less than value shown. G, greater than value shown. A common problem in statistical summaries of trace-element data arises when element values are below the limits of analytical detection. This results in a censored distribution. To compute unbiased estimates of the means for censored data, we adopted the protocol of reducing all "less than" values by 50 percent before summary statistics were generated.]
Number of samples Mean
Ash 34 14.8 Si 56 2.7 Al 56 1.4 Ca 56 0.43 Mg 56 0.083 Na 55 0.055 K 56 0.27 Fe 56 2.4 Ti 56 0.072
As 39 19 B 37 97 Ba 36 75 Be 39 2.7 Cd 39 0.31 Co 55 5.6 Cr 55 19 Cu 37 12 F 37 100 Ge 37 14 Hg 39 0.11 La 36 8.2 Li 36 16 Mn 55 59 Mo 28 3.1 Nb 34 2.5 Ni 55 31 P 34 160 Pb 39 18 Sb 39 1.9 Sc 36 4.1 Se 39 1.5 Sr 36 48 Th 37 2.2 U 38 1.9
37 25 Y 34 7.3 Yb 36 0.82 Zn 37 170 Zr 36 39
Range Standard Median Minimum Maximum deviation
Percent 13.0 6.7 47.0 8.3 2.1 1.3 13 1.9 1.1 0.55 5.8 0.95 0.27 0.029 1.6 0.41 0.061 0.019 0.47 0.076 0.044 0.0047 0.24 0.046 0.19 0.065 1.4 0.25 2.2 0.2.0 7.5 1.4 0.055 0.033 0.37 0.053
Parts per million 14 0.50 70 16 93 31 190G 36 45 17 400 90 2.4 1.2 6.0 1.1 0.12 0.01L 4.5 0.74 5.3 2.0 17 3.0
17 9.5 50 8.2 11 5.5 46 7.1 60 10L 450 110 14 1.1L 52 9.7 0.09 0.01L 0.32 0.09 6.4 2.0 26 5.6
11 2.9 89 16 39 5.8 240 51 2.5 0.16L 10 2.4 2.0 0.61L 12 2.0
30 4.6 120 22 96 15L 740 180 14 1.5L 70 16 1.4 0.2 15 2.5 3.8 1.9 8.9 1.6 1.3 0.7 3.0 0.7
33 13 200 44 1.8 1.0 8.3 1.4 1.4 0.35L 7.0 1.3
21 10 85 16 6.5 3.3 18 3.8 0.7 0.27 2.8 0.49
37 8.2 3,300 550 28 7.7 270 48
Coal quality in the Illinois Basin E67
V

Table 5. Number of samples, mean, median, range, and standard deviation of ash yield and contents of elements for the Herrin Coal in the Illinois Basin.
[All analyses are in percent or parts per million and are reported on an as-received, whole-coal basis. L, less than value shown. A common problem in statistical summaries of trace-element data arises when element values are below the limits of analytical detection. This results in a censored distribution. To compute unbiased estimates of the means for censored data, we adopted the protocol of reducing all "less than" values by 50 percent before summary statistics were generated.]
Number of samples Mean
Ash 97 11.7 Si 269 2.3 Al 269 1.1 Ca 269 0.55 Mg 270 0.055 Na 270 0.071 K 269 0.17 Fe 269 1.8 Ti 269 0.06
As 216 5.8 B 207 110 Ba 201 120 Be 226 1.6 Cd 209 1.3 Co 267 4.0 Cr 268 19 Cu 209 10 F 199 66 Ge 196 6.4 Hg 206 0.12 La 176 5.3 Li 158 12 Mn 256 58 Mo 206 8.4 Nb 97 1.7 Ni 275 17 P 182 110 Pb 226 18 Sb 216 0.8 Sc 190 2.5 Se 214 2.1 Sr 201 33 Th 196 2.1 U 203 2.0 V 213 22 Y 97 5.2 Yb 178 0.5 Zn 209 200 Zr 203 25
Range Standard Median Minimum Maximum deviation
Percent 11.0 2.8 46.0 5.9 1.9 0.46 9.3 1.2 1.0 0.29 4.2 0.54 0.42 0.02 11 0.77 0.045 0.0044L 0.31 0.04 0.054 0.0019 0.42 0.059 0.15 0.003L 0.75 0.098 1.6 0.096 11 1.2 0.054 0.004L 0.20 0.029
Parts per million 3.0 0.2L 140 12
97 22 390 54 36 5.5 2,000 300 1.3 0.36 8.5 1.1 0.14 0.02L 54 5.5 3.2 0.78 17 2.4
15 2.8 190 21 9.0 2.7 58 6.7
51 10L 570 65 3.3 0.045L 63 8.5 0.10 0.01L 0.70 0.09 4.5 0.84L 28 3.8 7.6 0.94L 80 13
39 1.6 1,200 85 5.2 0.42L 190 15 1.4 0.28L 10 1.4
13 1.0 190 17 46 2.8L 2,200 210 5.4 0.019L 350 36 0.4 0.1 7.6 1.0 2.3 0.38 16 1.4 1.7 0.4L 13 1.5
24 2.7L 980 73 1.6 0.35L 17 1.8 0.92 0.15L 26 3.5
18 1.2 110 15 4.5 1.1 27 3.7 0.45 0.065L 3.2 0.28
39 3.7 4,500 600 19 0.51L 110 19
E68 Resource Assessment of the Springfield, Herrin, Danville, and Baker Coals in the Illinois Basin

Table 6. Number of samples, mean, median, range, and standard deviation of ash yield and contents of elements for the Springfield Coal in the Illinois Basin.
[All analyses are in percent or parts per million and are reported on an as-received, whole-coal basis. L, less than value shown. A common problem in statistical summaries of trace-element data arises when element values are below the limits of analytical detection. This results in a censored distribution. To compute unbiased estimates of the means for censored data, we adopted the protocol of reducing all "less than" values by 50 percent before summary statistics were generated.]
Number of samples Mean
Ash 80 12.1 Si 249 1.9 Al 249 0.94 Ca 249 0.5 Mg 249 0.047 Na 262 0.033 K 267 0.16 Fe 249 2.0 Ti 249 0.052
As 145 12 B 108 85 Ba 95 73 Be 124 1.9 Cd 122 0.61 Co 244 3.6 Cr 245 16 Cu 109 10 F 109 71 Ge 105 8.0 Hg 123 0.12 La 104 5.9 Li 90 8.9 Mn 247 43 Mo 101 7.3 Nb 79 1.8 Ni 250 12 P 183 54 Pb 124 13 Sb 144 1.1 Sc 87 2.4 Se 127 2.5 Sr 95 26 Th 101 1.7 U 110 2.6
108 28 Y 80 5.3 Yb 85 0.53 Zn 127 110 Zr 107 23
Range Standard Median Minimum Maximum deviation
Percent 10.0 1.9 0.88 0.4.0 0.04 0.027 0.15 1.8 0.049
5.5 46.0 6.7 0.018 9.0 0.73 0.17 5.8 0.45 0.015 3.9 0.46 0.0047L 0.31 0.03 0.0018 0.2 0.026 0.004 1.3 0.11 0.25 27 1.9 0.022 0.26 0.021
Parts per million 5.9 0.27 130 18
81.5 5.7L 210 35 26 8.3 2,500 280 1.7 0.44 6.0 0.9.0 0.20 0.02L 9.0 1.1 3.3 0.90 12 1.7
13 3.1 86 9.8 7.4 3.5 77 11
50 10L 600 77 7.2 0.43L 38 5.1 0.09 0.01L 1.2 0.13 5.0 1.8 31 4.0 5.8 2.3L 89 11
34 0.58 210 34 5.4 0.76L 46 7.1 1.6 0.26L 4.6 0.94
10 1.8 41 6.6 39 4.2L 740 75 5.7 0.49L 110 20 0.8 0.1 13 1.2 2.1 0.47 12 1.5 2.0 0.9L 13 1.8
18 3.4 160 25 1.3 0.30 10 1.3 1.6 0.17L 15 2.7
19 3.2 130 24 4.8 1.2 13 2.2 0.48 0.19L 1.9 0.27
33 6.5 3,300 310 17 1.8L 130 18
Coal quality in the Illinois Basin E69
V
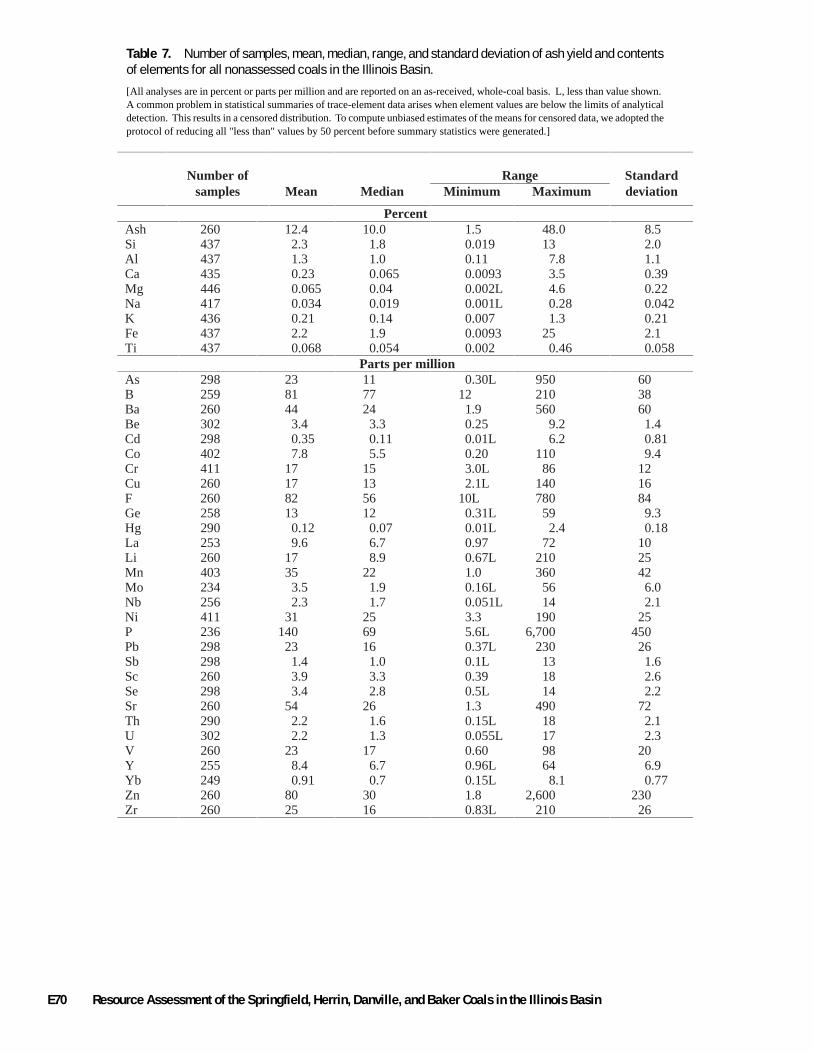
Table 7. Number of samples, mean, median, range, and standard deviation of ash yield and contents of elements for all nonassessed coals in the Illinois Basin.
[All analyses are in percent or parts per million and are reported on an as-received, whole-coal basis. L, less than value shown. A common problem in statistical summaries of trace-element data arises when element values are below the limits of analytical detection. This results in a censored distribution. To compute unbiased estimates of the means for censored data, we adopted the protocol of reducing all "less than" values by 50 percent before summary statistics were generated.]
Number of samples Mean
Ash 260 12.4 Si 437 2.3 Al 437 1.3 Ca 435 0.23 Mg 446 0.065 Na 417 0.034 K 436 0.21 Fe 437 2.2 Ti 437 0.068
As 298 23 B 259 81 Ba 260 44 Be 302 3.4 Cd 298 0.35 Co 402 7.8 Cr 411 17 Cu 260 17 F 260 82 Ge 258 13 Hg 290 0.12 La 253 9.6 Li 260 17 Mn 403 35 Mo 234 3.5 Nb 256 2.3 Ni 411 31 P 236 140 Pb 298 23 Sb 298 1.4 Sc 260 3.9 Se 298 3.4 Sr 260 54 Th 290 2.2 U 302 2.2 V 260 23 Y 255 8.4 Yb 249 0.91 Zn 260 80 Zr 260 25
Range Standard Median Minimum Maximum deviation
Percent 10.0 1.8 1.0 0.065 0.04 0.019 0.14 1.9 0.054
1.5 48.0 8.5 0.019 13 2.0 0.11 7.8 1.1 0.0093 3.5 0.39 0.002L 4.6 0.22 0.001L 0.28 0.042 0.007 1.3 0.21 0.0093 25 2.1 0.002 0.46 0.058
Parts per million 11 0.30L 950 60 77 12 210 38 24 1.9 560 60 3.3 0.25 9.2 1.4 0.11 0.01L 6.2 0.81 5.5 0.20 110 9.4
15 3.0L 86 12 13 2.1L 140 16 56 10L 780 84 12 0.31L 59 9.3 0.07 0.01L 2.4 0.18 6.7 0.97 72 10 8.9 0.67L 210 25
22 1.0 360 42 1.9 0.16L 56 6.0 1.7 0.051L 14 2.1
25 3.3 190 25 69 5.6L 6,700 450 16 0.37L 230 26 1.0 0.1L 13 1.6 3.3 0.39 18 2.6 2.8 0.5L 14 2.2
26 1.3 490 72 1.6 0.15L 18 2.1 1.3 0.055L 17 2.3
17 0.60 98 20 6.7 0.96L 64 6.9 0.7 0.15L 8.1 0.77
30 1.8 2,600 230 16 0.83L 210 26
E70 Resource Assessment of the Springfield, Herrin, Danville, and Baker Coals in the Illinois Basin

Table 8. Number of samples, mean, median, range, and standard deviation of ash yield and contents of elements for all nonassessed coals from the McLeansboro Group in the Illinois Basin.
[All analyses are in percent or parts per million and are reported on an as-received, whole-coal basis. L, less than value shown. A common problem in statistical summaries of trace-element data arises when element values are below the limits of analytical detection. This results in a censored distribution. To compute unbiased estimates of the means for censored data, we adopted the protocol of reducing all "less than" values by 50 percent before summary statistics were generated.]
Number of samples Mean
Ash 25 13.6 Si 82 2.9 Al 82 1.5 Ca 82 0.27 Mg 82 0.073 Na 74 0.038 K 82 0.29 Fe 82 2.3 Ti 82 0.081
As 44 9.5 B 25 86 Ba 25 40 Be 48 2.2 Cd 44 0.14 Co 76 5.3 Cr 81 20 Cu 25 14 F 25 97 Ge 25 4.8 Hg 43 0.09 La 25 8.1 Li 25 14 Mn 81 56 Mo 25 3.1 Nb 25 1.8 Ni 81 20 P 64 160 Pb 44 7.7 Sb 44 0.7 Sc 25 3.3 Se 44 2.1 Sr 25 44 Th 44 2.1 U 48 1.6
25 21 Y 25 6.0 Yb 25 0.70 Zn 25 39 Zr 25 16
Range Standard Median Minimum Maximum deviation
Percent 14.0 8.1 26.0 3.9 3.0 0.028 5.9 1.2 1.5 0.67 2.8 0.45 0.15 0.037 2.4 0.34 0.07 0.015 0.29 0.042 0.022 0.006 0.17 0.035 0.29 0.065 0.81 0.13 2.1 0.0093 6.4 1.2 0.082 0.031 0.14 0.025
Parts per million 3.5 0.30L 65 13
84 55 130 18 35 8.9 98 22 2.0 1.1 5.5 0.96 0.09 0.03 0.65 0.13 4.2 1.6 19 3.2
18 7.8 40 7.2 10 6.7 50 9.6 86 33 260 49 4.0 1.7 14 3.1 0.05 0.01L 0.33 0.09 7.0 2.8 21 4.8
11 6.6 39 7.5 41 7.5 360 64 2.0 0.42 14 3.2 1.7 0.52 5.4 1.1
15 3.6 75 14 110 10L 1,300 180
5.2 2.2 49 7.6 0.3 0.1 3.6 1.0 3.0 1.9 7.9 1.1 2.1 0.7 3.5 0.6
33 14 150 33 2.0 1.0 5.1 0.76 0.98 0.35 7.4 1.3
17 9.8 57 10 5.8 2.0 20 3.8 0.64 0.32 1.4 0.28
32 13 140 30 14 5.5 41 9.3
Coal quality in the Illinois Basin E71
V

Table 9. Number of samples, mean, median, range, and standard deviation of ash yield and contents of elements for all nonassessed coals from the Carbondale Group or Formation in the Illinois Basin.
[All analyses are in percent or parts per million and are reported on an as-received, whole-coal basis. L, less than value shown. G, greater than value shown. A common problem in statistical summaries of trace-element data arises when element values are below the limits of analytical detection. This results in a censored distribution. To compute unbiased estimates of the means for censored data, we adopted the protocol of reducing all "less than" values by 50 percent before summary statistics were generated.]
Number of samples Mean
Ash 86 14.3 Si 128 2.6 Al 128 1.4 Ca 127 0.4 Mg 128 0.11 Na 124 0.043 K 128 0.25 Fe 128 2.8 Ti 128 0.071
As 90 34 B 86 89 Ba 86 41 Be 90 3.5 Cd 90 0.45 Co 121 7.1 Cr 121 20 Cu 86 16 F 86 98 Ge 86 14 Hg 90 0.14 La 84 7.5 Li 86 16 Mn 120 51 Mo 67 6.2 Nb 86 2.6 Ni 121 28 P 74 210 Pb 90 27 Sb 90 1.5 Sc 86 4.2 Se 90 3.3 Sr 86 43 Th 88 2.1 U 90 3.3 V 86 26 Y 86 8.9 Yb 83 1.1 Zn 86 69 Zr 86 28
Range Standard Median Minimum Maximum deviation
Percent 12.0 5.4 48.0 7.6 2.2 0.34 12 1.7 1.2 0.15 6.4 0.88 0.18 0.023 3.5 0.56 0.055 0.009 4.6 0.40 0.033 0.0028 0.22 0.035 0.19 0.027 1.2 0.20 2.5 0.32 25 2.6 0.063 0.005 0.33 0.045
Parts per million 14 0.50L 950 100 88 13 190G 36 30 7.5 170 33 3.3 1.2 7.3 1.3 0.11 0.01L 6.2 1.0 5.4 1.1 110 11
17 4.1 86 12 14 4.4 96 12 60 10L 780 110 13 0.31L 59 11 0.08 0.01L 2.4 0.26 5.4 1.0 55 7.1 9.4 0.76 210 24
37 1.1 220 42 3.0 0.46L 56 9.7 2.4 0.39L 8.6 1.5
24 3.3 190 23 83 20L 6,700 770 17 0.46L 230 35 1.0 0.1L 7.1 1.6 3.5 0.70 18 2.6 2.7 0.5L 12 2.1
25 8.4 300 45 1.7 0.20L 15 1.8 2.1 0.44L 13 2.9
23 3.8 84 17 7.0 0.96L 64 7.7 0.80 0.20L 8.1 1.1
25 1.8 1,100 150 24 3.9 140 21
E72 Resource Assessment of the Springfield, Herrin, Danville, and Baker Coals in the Illinois Basin
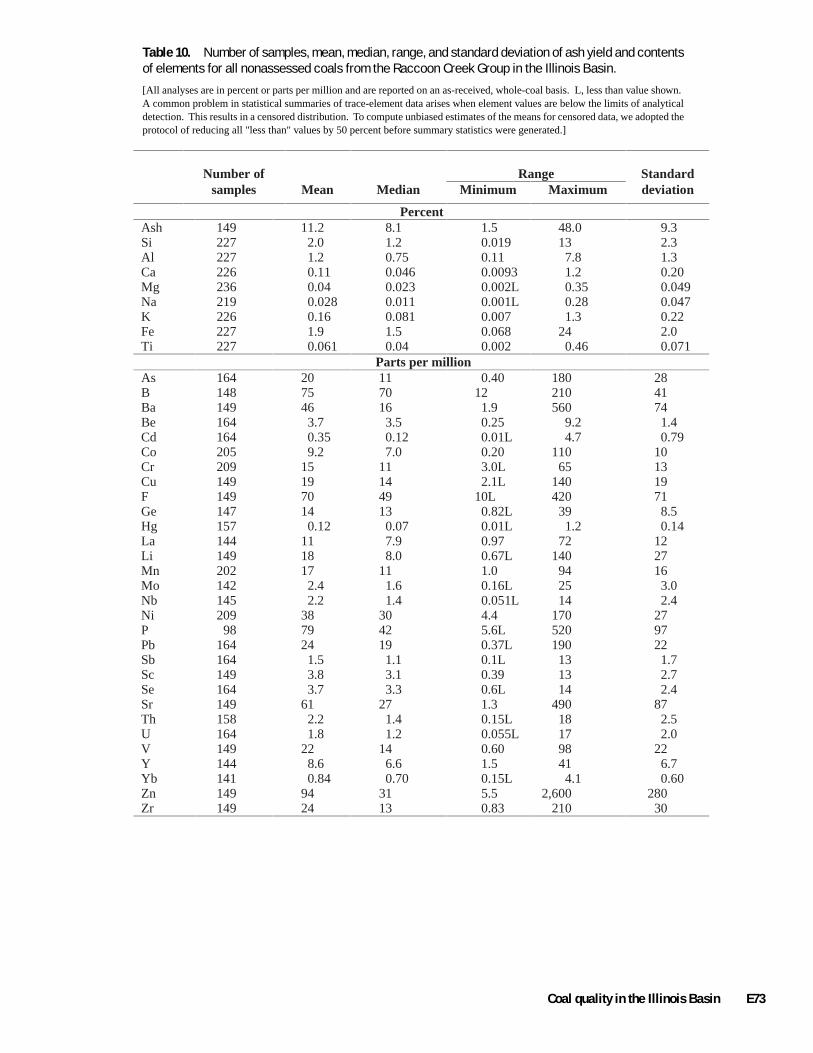
Table 10. Number of samples, mean, median, range, and standard deviation of ash yield and contents of elements for all nonassessed coals from the Raccoon Creek Group in the Illinois Basin.
[All analyses are in percent or parts per million and are reported on an as-received, whole-coal basis. L, less than value shown. A common problem in statistical summaries of trace-element data arises when element values are below the limits of analytical detection. This results in a censored distribution. To compute unbiased estimates of the means for censored data, we adopted the protocol of reducing all "less than" values by 50 percent before summary statistics were generated.]
Number of samples Mean
Ash 149 11.2 Si 227 2.0 Al 227 1.2 Ca 226 0.11 Mg 236 0.04 Na 219 0.028 K 226 0.16 Fe 227 1.9 Ti 227 0.061
As 164 20 B 148 75 Ba 149 46 Be 164 3.7 Cd 164 0.35 Co 205 9.2 Cr 209 15 Cu 149 19 F 149 70 Ge 147 14 Hg 157 0.12 La 144 11 Li 149 18 Mn 202 17 Mo 142 2.4 Nb 145 2.2 Ni 209 38 P 98 79 Pb 164 24 Sb 164 1.5 Sc 149 3.8 Se 164 3.7 Sr 149 61 Th 158 2.2 U 164 1.8
149 22 Y 144 8.6 Yb 141 0.84 Zn 149 94 Zr 149 24
Range Standard Median Minimum Maximum deviation
Percent 8.1 1.2 0.75 0.046 0.023 0.011 0.081 1.5 0.04
1.5 48.0 9.3 0.019 13 2.3 0.11 7.8 1.3 0.0093 1.2 0.20 0.002L 0.35 0.049 0.001L 0.28 0.047 0.007 1.3 0.22 0.068 24 2.0 0.002 0.46 0.071
Parts per million 11 0.40 180 28 70 12 210 41 16 1.9 560 74 3.5 0.25 9.2 1.4 0.12 0.01L 4.7 0.79 7.0 0.20 110 10
11 3.0L 65 13 14 2.1L 140 19 49 10L 420 71 13 0.82L 39 8.5 0.07 0.01L 1.2 0.14 7.9 0.97 72 12 8.0 0.67L 140 27
11 1.0 94 16 1.6 0.16L 25 3.0 1.4 0.051L 14 2.4
30 4.4 170 27 42 5.6L 520 97 19 0.37L 190 22 1.1 0.1L 13 1.7 3.1 0.39 13 2.7 3.3 0.6L 14 2.4
27 1.3 490 87 1.4 0.15L 18 2.5 1.2 0.055L 17 2.0
14 0.60 98 22 6.6 1.5 41 6.7 0.70 0.15L 4.1 0.60
31 5.5 2,600 280 13 0.83 210 30
Coal quality in the Illinois Basin E73
V

Table 11. Number of samples, mean, median, range, and standard deviation of ash yield and contents of elements for all coals (assessed and nonassessed) in the Illinois Basin. [All analyses are in percent or parts per million and are reported on an as-received, whole-coal basis. L, less than value shown. A common problem in statistical summaries of trace-element data arises when element values are below the limits of analytical detection. This results in a censored distribution. To compute unbiased estimates of the means for censored data, we adopted the protocol of reducing all "less than" values by 50 percent before summary statistics were generated.]
Number of samples Mean
Ash 471 Si 1011 Al 1011 Ca 1009 Mg 1021 Na 1004 K 1028 Fe 1011 Ti 1011
As 698 B 611 Ba 592 Be 691 Cd 668 Co 968 Cr 979 Cu 615 F 605 Ge 596 Hg 658 La 569 Li 544 Mn 961 Mo 569 Nb 466 Ni 991
12.4 2.2 1.2 0.39 0.059 0.045 0.19 2.1 0.062
15 91 76 2.5 0.71 5.6
17 14 76 10 0.12 7.5
14 45 5.9 2.1
22
Range Standard Median Minimum Maximum deviation
Percent 10.0 1.5 48.0 7.7 1.9 0.018 13 1.6 0.96 0.11 7.8 0.85 0.24 0.0093 11 0.55 0.042 0.002L 4.6 0.15 0.03 0.001L 0.42 0.047 0.15 0.003L 1.4 0.17 1.8 0.0093L 27 1.8 0.052 0.002L 0.46 0.044
Parts per million 5.9
84 31 2.2 0.13 3.9
14 10
0.20L 950 41 5.7L 390 45 1.9 2,500 220 0.25L 9.2 1.5 0.01L 54 3.2 0.20 110 6.6 2.8L 190 14 2.1L 140 13
54 10L 780 79 7.5 0.045L 63 9.0 0.08 0.01L 2.4 0.15 5.2 0.84L 72 7.7 8.1 0.67L 210 20
29 0.58 1,200 57 3.3 0.16L 190 10 1.7 0.051L 14 1.8
15 1.0 190 21 49 2.8L 6,700 300 9.8 0.019L 350 29 0.7 0.1L 15 1.5 2.6 0.38 18 2.2 2.1 0.4L 14 2.0
24 1.3L 980 66 1.5 0.15L 18 1.9 1.3 0.055L 26 2.8
18 0.60 130 19 5.8 0.96L 64 5.7 0.58 0.065L 8.1 0.6
33 1.8 4,500 420 18 0.51L 270 25
P 635 110 Pb 687 19 Sb 697 1.2 Sc 573 3.2 Se 678 2.7 Sr 592 42 Th 624 2.1 U 653 2.2 V 618 24 Y 466 7.1 Yb 548 0.71 Zn 633 130 Zr 606 25
E74 Resource Assessment of the Springfield, Herrin, Danville, and Baker Coals in the Illinois Basin
Appendix 4. Summary descriptive statistics of ash yields and contents of selected elements for all assessed and non-assessed coals in the Illinois Basin as analyzed by the Illinois State Geological Survey, Indiana Geological Survey, Kentucky Geological Survey, and U.S. Geological Survey.
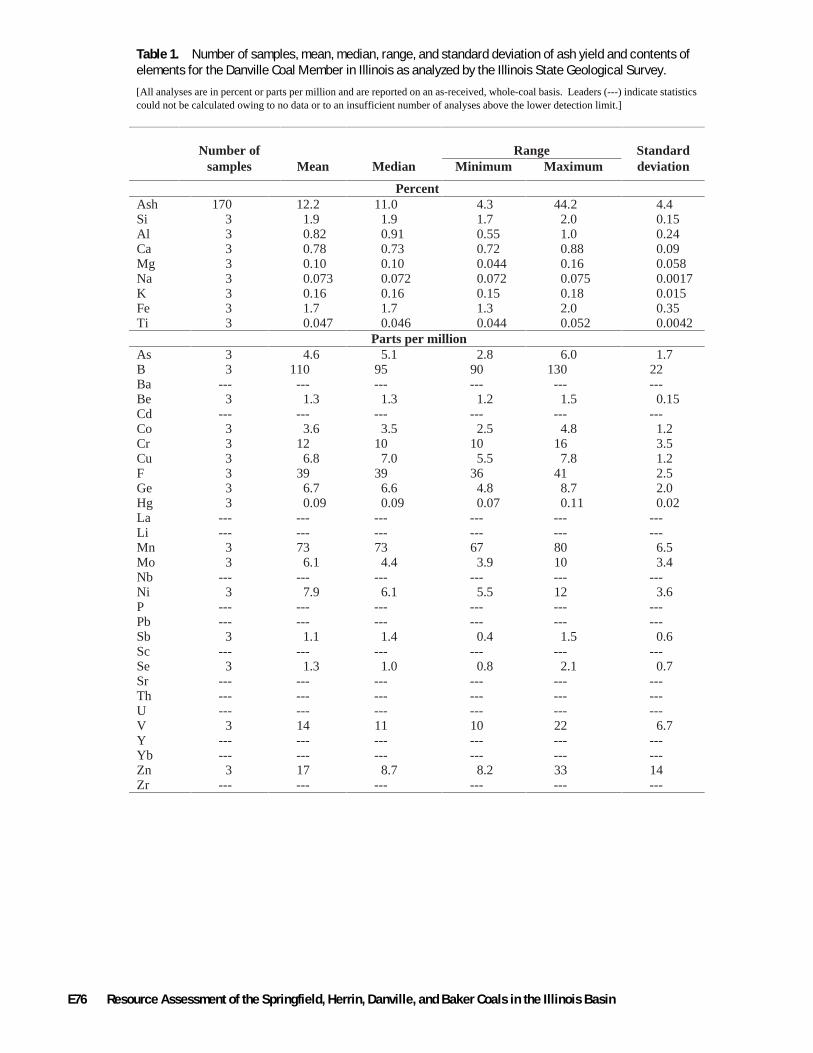
--- --- --- ---
--- --- --- ---
--- --- --- --- --- --- --- ---
--- --- --- ---
--- --- --- --- --- --- --- ---
--- --- --- ---
--- --- --- --- --- --- --- --- --- --- --- ---
--- --- --- --- --- --- --- ---
--- --- --- --- ---
--- ---
--- ---
--- --- --- ---
--- ---
--- --- --- ---
--- ---
--- --- --- --- --- ---
--- --- --- ---
---
Table 1. Number of samples, mean, median, range, and standard deviation of ash yield and contents of elements for the Danville Coal Member in Illinois as analyzed by the Illinois State Geological Survey.
[All analyses are in percent or parts per million and are reported on an as-received, whole-coal basis. Leaders (---) indicate statistics could not be calculated owing to no data or to an insufficient number of analyses above the lower detection limit.]
Number of samples Mean
Ash 170 12.2 Si 3 1.9 Al 3 0.82 Ca 3 0.78 Mg 3 0.10 Na 3 0.073 K 3 0.16 Fe 3 1.7 Ti 3 0.047
As 3 4.6 B 3 110 Ba Be 3 1.3 Cd Co 3 3.6 Cr 3 12 Cu 3 6.8 F 3 39 Ge 3 6.7 Hg 3 0.09La Li Mn 3 73 Mo 3 6.1 Nb Ni 3 7.9 P Pb Sb 3 1.1 Sc Se 3 1.3 Sr Th U V 3 14 Y Yb Zn 3 17 Zr
Range Standard Median Minimum Maximum deviation
Percent 11.0 1.9 0.91 0.73 0.10 0.072 0.16 1.7 0.046
4.3 44.2 4.4 1.7 2.0 0.15 0.55 1.0 0.24 0.72 0.88 0.09 0.044 0.16 0.058 0.072 0.075 0.0017 0.15 0.18 0.015 1.3 2.0 0.35 0.044 0.052 0.0042
Parts per million 5.1
95
1.3
3.5 10 7.0
39 6.6 0.09
73 4.4
6.1
1.4
1.0
11
8.7
2.8 6.0 1.7 90 130 22
1.2 1.5 0.15
2.5 4.8 1.2 10 16 3.5 5.5 7.8 1.2
36 41 2.5 4.8 8.7 2.0 0.07 0.11 0.02
67 80 6.5 3.9 10 3.4
5.5 12 3.6
0.4 1.5 0.6
0.8 2.1 0.7
10 22 6.7
8.2 33 14
E76 Resource Assessment of the Springfield, Herrin, Danville, and Baker Coals in the Illinois Basin

--- --- --- --- --- ---
Table 2. Number of samples, mean, median, range, and standard deviation of ash yield and contents of elements for the Danville Coal Member in Indiana as analyzed by the U.S. Geological Survey.
[All analyses are in percent or parts per million and are reported on an as-received, whole-coal basis. L, less than value shown. G, greater than value shown. A common problem in statistical summaries of trace-element data arises when element values are below the limits of analytical detection. This results in a censored distribution. To compute unbiased estimates of the means for censored data, we adopted the protocol of reducing all "less than" values by 50 percent before summary statistics were generated. Leaders (---) indicate statistics could not be calculated owing to no data or to an insufficient number of analyses above the lower detection limit.]
Number of samples Mean
Ash 19 16.2 Si 19 3.5 Al 19 1.7 Ca 19 0.3 Mg 19 0.12 Na 19 0.075 K 19 0.38 Fe 19 2.0 Ti 19 0.096
As 19 13 B 19 110 Ba 19 67 Be 19 3.5 Cd 19 0.44 Co 19 6.7 Cr 19 20 Cu 19 11 F 19 120 Ge 19 13 Hg 19 0.10 La 19 8.9 Li 19 20 Mn 19 52 Mo 18 2.0 Nb 19 2.9 Ni 19 26 P Pb 19 19 Sb 19 2.4 Sc 19 4.0 Se 19 1.3 Sr 19 36 Th 18 2.6 U 19 1.4
19 26 Y 19 6.8 Yb 19 0.73 Zn 19 280 Zr 19 52
Range Standard Median Minimum Maximum deviation
Percent 13.0 2.5 1.1 0.21 0.072 0.051 0.23 1.7 0.064
6.7 47.0 11 1.4 13 2.8 0.68 5.8 1.3 0.029 1.2 0.32 0.029 0.47 0.11 0.013 0.24 0.066 0.11 1.4 0.35 0.20 7.5 1.6 0.044 0.37 0.077
Parts per million 12
110 44 3.2 0.12 6.7
17 10 72 15 0.09 6.5
12 36 2.2 2.1
30
14 1.5 3.3 1.2
31 1.8 1.4
21 6.4 0.6
44 30
0.50 43 11 31 190G 43 20 290 65 2.0 6.0 1.1 0.01L 4.5 1.1 3.0 12 2.4 9.5 46 9.7 6.6 24 4.0
22 450 120 1.1L 19 5.5 0.01 0.32 0.08 3.0 26 6.0 5.5 89 21
10 230 51 0.16L 4.5 1.2 0.61L 12 2.5 5.6 48 14
1.5 48 15 0.2 15 3.5 2.1 8.9 1.9 0.7 2.0 0.4
13 130 27 1.0 8.3 1.8 0.35 3.5 0.73
11 85 18 3.3 18 3.5 0.30 1.6 0.39 9.2 3,300 760
13 270 63
Coal quality in the Illinois Basin E77
V

--- --- --- --- --- --- --- --- --- --- --- --- --- --- --- --- --- --- --- --- ---
--- --- --- --- --- --- --- --- --- --- --- --- --- --- --- --- --- --- --- --- --- --- --- ---
--- --- --- --- --- --- --- ---
--- --- --- --- --- --- --- --- --- --- --- --- --- --- --- --- --- --- --- --- --- --- --- --- --- --- --- --- --- --- --- --- --- --- --- --- --- --- --- --- --- --- --- ---
--- --- --- --- ---
--- --- --- --- --- --- --- --- ---
--- --- --- --- --- --- --- --- --- --- --- ---
--- --- --- ---
--- --- --- --- --- --- --- --- --- --- --- --- --- --- --- --- --- --- --- --- --- ---
---
Table 3. Number of samples, mean, median, range, and standard deviation of ash yield and contents of elements for the Baker coal in Kentucky as analyzed by the Kentucky Geological Survey.
[All analyses are in percent or parts per million and are reported on an as-received, whole-coal basis. Leaders (---) indicate statistics could not be calculated owing to no data or to an insufficient number of analyses above the lower detection limit.]
Number of samples Mean
Ash 19 13.2 Si 19 2.3 Al 19 1.4 Ca 19 0.39 Mg 19 0.062 Na 18 0.041 K 19 0.22 Fe 19 2.5 Ti 19 0.062
As B Ba Be Cd Co 18 3.8 Cr 18 21 Cu F Ge Hg La Li Mn 18 56 Mo Nb Ni 18 44 P 19 210 Pb Sb Sc Se Sr Th U V Y Yb Zn Zr
Range Standard Median Minimum Maximum deviation
Percent 11.6 1.9 1.1 0.21 0.04 0.037 0.15 2.4 0.049
6.5 27.6 5.4 1.3 6.6 1.3 0.70 4.4 0.88 0.075 1.4 0.38 0.019 0.19 0.049 0.0047 0.12 0.026 0.065 0.87 0.20 0.68 5.7 1.4 0.034 0.18 0.036
Parts per million
3.3 20
34
43 130
2.0 7.7 1.7 11 50 8.7
5.8 140 45
4.6 120 29 27 740 210
E78 Resource Assessment of the Springfield, Herrin, Danville, and Baker Coals in the Illinois Basin

Table 4. Number of samples, mean, median, range, and standard deviation of ash yield and contents of elements for the Baker coal in Kentucky as analyzed by the U.S. Geological Survey.
[All analyses are in percent or parts per million and are reported on an as-received, whole-coal basis. L, less than value shown. A common problem in statistical summaries of trace-element data arises when element values are below the limits of analytical detection. This results in a censored distribution. To compute unbiased estimates of the means for censored data, we adopted the protocol of reducing all "less than" values by 50 percent before summary statistics were generated.]
Number of Samples Mean
Ash 15 13.1 Si 15 2.1 Al 15 1.2 Ca 15 0.56 Mg 15 0.064 Na 15 0.042 K 15 0.20 Fe 15 2.8 Ti 15 0.059
As 15 28 B 15 77 Ba 15 87 Be 15 2.2 Cd 15 0.19 Co 15 6.9 Cr 15 16 Cu 15 16 F 15 94 Ge 15 18 Hg 15 0.14 La 15 7.4 Li 15 12 Mn 15 69 Mo 7 4.6 Nb 15 2.0 Ni 15 26 P 12 110 Pb 15 21 Sb 15 1.5 Sc 15 4.4 Se 15 1.8 Sr 15 65 Th 15 2.0 U 15 2.6
15 26 Y 15 7.9 Yb 15 0.99 Zn 15 56 Zr 15 25
Range Standard Median Minimum Maximum deviation
Percent 13.0 2.1 1.1 0.33 0.053 0.044 0.18 2.9 0.057
7.7 20.0 3.2 1.3 4.1 0.68 0.63 2.2 0.40 0.044 1.6 0.53 0.03 0.11 0.026 0.008 0.11 0.026 0.082 0.45 0.085 0.65 5.4 1.3 0.033 0.12 0.022
Parts per million 22 4.6 70 19 75 52 110 15 43 17 400 120 2.1 1.7 3.7 0.53 0.12 0.02 0.55 0.17 5.6 2.1 17 3.9
16 9.5 26 4.4 14 8.8 46 9.2 60 10L 300 86 14 4.6 52 13 0.10 0.02L 0.32 0.11 6.3 2.0 22 5.4
11 2.9 24 7.1 48 12 240 61 3.6 1.8 10 2.8 2.0 0.77 3.6 0.77
25 5.1 58 15 81 22L 320 95 15 4.7 70 18 1.4 0.2 3.7 1.1 4.2 2.7 7.1 1.0 1.9 0.8 3.0 0.8
38 15 200 57 1.9 1.0 3.3 0.71 2.1 0.94 7.0 1.6
25 14 70 13 6.5 3.5 18 4.3 0.80 0.58 2.8 0.57
39 13 130 39 24 7.7 39 8.4
Coal quality in the Illinois Basin E79
V

--- --- --- --- ---
--- --- --- --- ---
---
---
Table 5. Number of samples, mean, median, range, and standard deviation of ash yield and contents of elements for the Herrin Coal Member in Illinois as analyzed by the Illinois State Geological Survey.
[All analyses are in percent or parts per million and are reported on an as-received, whole-coal basis. L, less than value shown. A common problem in statistical summaries of trace-element data arises when element values are below the limits of analytical detection. This results in a censored distribution. To compute unbiased estimates of the means for censored data, we adopted the protocol of reducing all "less than" values by 50 percent before summary statistics were generated. Leaders (---) indicate statistics could not be calculated owing to no data or to an insufficient number of analyses above the lower detection limit.]
Number of samples Mean
Ash 2,327 10.9 Si 108 2.4 Al 108 1.2 Ca 108 0.7 Mg 108 0.063 Na 114 0.083 K 108 0.17 Fe 108 1.6 Ti 108 0.06
As 107 5.7 B 110 110 Ba 104 90 Be 116 1.3 Cd 100 1.6 Co 107 4.7 Cr 107 18 Cu 112 11 F 102 64 Ge 114 4.4 Hg 100 0.15 La 93 5.3 Li 61 16 Mn 100 78 Mo 116 8.5 Nb Ni 114 16 P 108 73 Pb 116 21 Sb 107 0.7 Sc 93 2.4 Se 107 2.1 Sr 104 29 Th 95 1.9 U 93 1.7 V 116 23 Y Yb 93 0.48 Zn 112 260 Zr 106 28
Range Standard Median Minimum Maximum deviation
Percent 10.4 2.2 1.1 0.61 0.052 0.081 0.15 1.5 0.054
2.7 43.6 3.6 0.46 9.3 1.3 0.33 3.1 0.50 0.045 2.5 0.47 0.0044L 0.31 0.05 0.009 0.42 0.069 0.017 0.75 0.11 0.28 3.8 0.70 0.0089 0.18 0.028
Parts per million 3.4
99 47 1.2 0.17 4.0
15 10 49 2.5 0.12 4.5
13 61 6.5
14 44 11 0.5 2.3 1.8
25 1.6 0.98
20
0.45 51 21
0.36 140 14 33 280 47 5.5 1,300 160 0.36L 3.3 0.55 0.04L 54 6.7 1.0 17 2.9 5.5 54 9.0 3.3 58 6.3
13 570 71 0.045L 23 4.4 0.03 0.47 0.09 0.84 28 3.4 1.7 80 15
11 270 56 0.42L 45 7.5
1.8 84 10 4.1L 740 100 0.32L 170 28 0.1 3.5 0.7 0.89 5.8 0.92 0.8 6.6 1.0 4.2L 220 25 0.46 5.7 0.95 0.20L 26 3.1 3.0 110 15
0.065L 1.4 0.19 4.2 4,500 720 2.8 110 20
E80 Resource Assessment of the Springfield, Herrin, Danville, and Baker Coals in the Illinois Basin

--- --- --- --- --- ---
Table 6. Number of samples, mean, median, range, and standard deviation of ash yield and contents of elements for the Herrin Coal Member in Illinois as analyzed by the U.S. Geological Survey.
[All analyses are in percent or parts per million and are reported on an as-received, whole-coal basis. L, less than value shown. A common problem in statistical summaries of trace-element data arises when element values are below the limits of analytical detection. This results in a censored distribution. To compute unbiased estimates of the means for censored data, we adopted the protocol of reducing all "less than" values by 50 percent before summary statistics were generated. Leaders (---) indicate statistics could not be calculated owing to no data or to an insufficient number of analyses above the lower detection limit.]
Number of Samples Mean
Ash 77 12.2 Si 76 2.2 Al 76 1.0 Ca 76 0.63 Mg 77 0.057 Na 77 0.094 K 76 0.17 Fe 76 1.7 Ti 76 0.06
As 77 5.3 B 77 120 Ba 77 180 Be 77 1.8 Cd 77 1.5 Co 77 3.2 Cr 77 18 Cu 77 9.9 F 77 69 Ge 62 9.4 Hg 77 0.09 La 63 5.1 Li 77 9.7 Mn 77 62 Mo 77 6.4 Nb 77 1.7 Ni 77 14 P Pb 77 19 Sb 77 0.9 Sc 77 2.5 Se 77 2.2 Sr 77 30 Th 69 2.8 U 77 1.9
77 20 Y 77 5.5 Yb 65 0.50 Zn 77 160 Zr 77 23
Range Standard Median Minimum Maximum deviation
Percent 11.0 1.9 0.90 0.38 0.047 0.088 0.14 1.3 0.05
2.8 46.0 6.0 0.46 7.0 1.3 0.29 3.4 0.6 0.02 11 1.3 0.012 0.18 0.037 0.029 0.36 0.049 0.003L 0.59 0.11 0.096 11 1.6 0.004L 0.19 0.034
Parts per million 2.8
110 33 1.3 0.14 2.4
12 8.2
60 5.1 0.07 4.2 6.7
43 3.3 1.4 9.4
4.3 0.3 2.1 1.7
25 2.1 0.75
17 5.0 0.50
26 17
0.20L 44 7.6 22 390 62 6.2 2,000 440 0.40 8.5 1.5 0.02L 30 4.9 0.78 11 2.2 2.8L 190 27 2.7 30 6.0
10L 420 59 0.085L 47 11 0.03 0.39 0.06 1.0L 26 3.8 0.94 69 12 8.4 1,200 140 0.56 43 8.0 0.28L 10 1.5 1.0 67 13
0.64L 350 49 0.1 7.6 1.4 0.38 6.2 1.2 0.4L 13 1.8 8.3 290 32 0.35L 17 2.6 0.15L 20 3.8 1.2 86 16 1.1 27 3.6 0.20L 1.3 0.22 3.7 2,600 460 0.51L 110 18
Coal quality in the Illinois Basin E81
V

--- --- --- --- --- --- --- ---
--- --- --- --- --- --- --- --- --- --- --- ---
--- --- --- --- --- --- --- ---
--- --- --- --- --- --- --- ---
--- --- --- ---
--- --- --- ---
--- --- --- --- --- --- --- --- --- --- --- --- --- --- --- ---
--- --- --- --- ---
--- --- --- ---
--- --- --- --- --- ---
--- --- --- ---
--- --- --- ---
--- ---
--- ---
--- --- --- --- --- --- --- ---
---
Table 7. Number of samples, mean, median, range, and standard deviation of ash yield and contents of elements for the Herrin coal in Kentucky as analyzed by the Kentucky Geological Survey.
[All analyses are in percent or parts per million and are reported on an as-received, whole-coal basis. Leaders (---) indicate statistics could not be calculated owing to no data or to an insufficient number of analyses above the lower detection limit.]
Number of samples Mean
Ash 121 10.5 Si 65 2.2 Al 65 1.1 Ca 65 0.30 Mg 65 0.044 Na 59 0.033 K 65 0.18 Fe 65 2.3 Ti 65 0.061
As 12 6.2 B Ba Be 13 1.7 Cd 12 0.24Co 63 4.0 Cr 64 19 Cu F Ge Hg 9 0.02La Li Mn 59 30 Mo Nb Ni 64 21 P 65 180 Pb 13 3.1 Sb 12 0.2 Sc Se 10 1.3 Sr Th 12 1.2 U 13 1.9 V Y Yb Zn Zr
Range Standard Median Minimum Maximum deviation
Percent 9.8 2.0 1.1 0.21 0.039 0.026 0.16 2.1 0.056
5.3 24.1 3.6 0.95 4.9 0.89 0.51 2.2 0.39 0.028 1.2 0.27 0.019 0.12 0.021 0.0019 0.10 0.022 0.094 0.38 0.066 0.40 5.1 1.0 0.032 0.14 0.022
Parts per million 2.0
1.7 0.10 3.6
18
0.01
27
17 94 2.0 0.1
1.3
1.2 1.8
0.92 52 14
0.46 2.5 0.59 0.04 1.2 0.35 1.4 9.2 1.7 9.9 61 7.9
0.01 0.12 0.04
1.6 100 20
2.9 80 16 2.8 2,200 310 0.019 9.3 2.5 0.1 0.8 0.2
1.0 2.0 0.3
0.95 1.5 0.18 0.83 3.8 1.0
E82 Resource Assessment of the Springfield, Herrin, Danville, and Baker Coals in the Illinois Basin
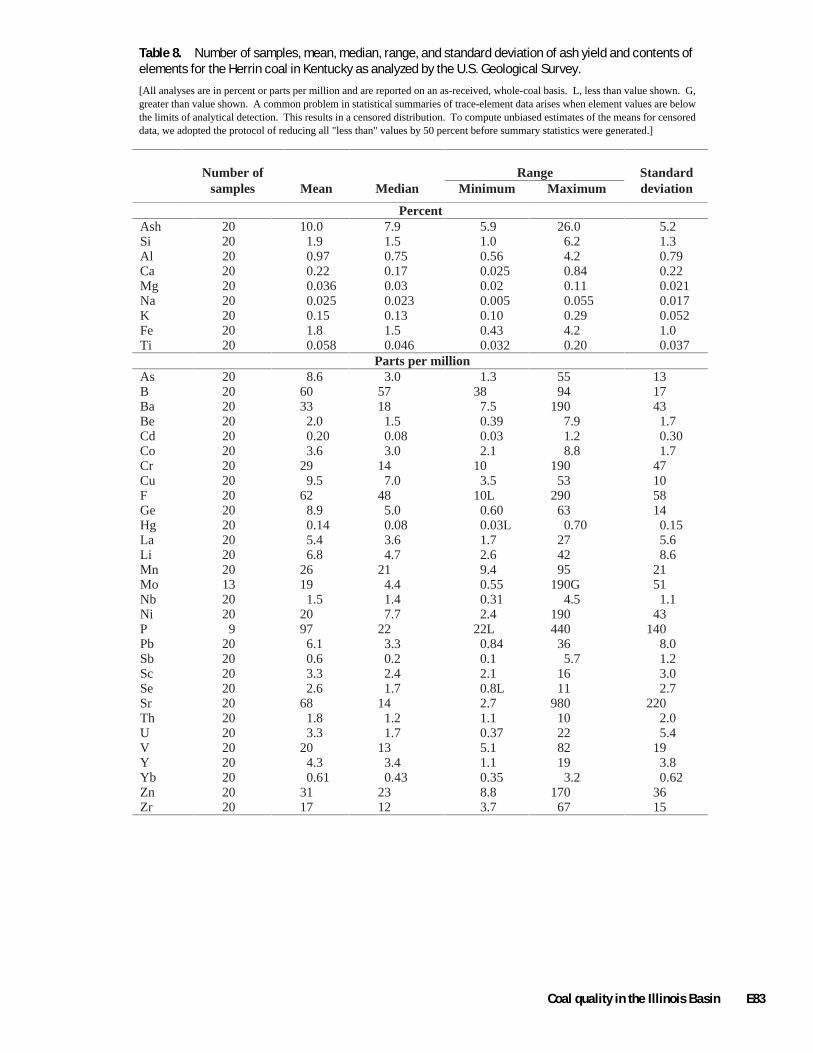
Table 8. Number of samples, mean, median, range, and standard deviation of ash yield and contents of elements for the Herrin coal in Kentucky as analyzed by the U.S. Geological Survey.
[All analyses are in percent or parts per million and are reported on an as-received, whole-coal basis. L, less than value shown. G, greater than value shown. A common problem in statistical summaries of trace-element data arises when element values are below the limits of analytical detection. This results in a censored distribution. To compute unbiased estimates of the means for censored data, we adopted the protocol of reducing all "less than" values by 50 percent before summary statistics were generated.]
Number of samples Mean
Ash 20 10.0 Si 20 1.9 Al 20 0.97 Ca 20 0.22 Mg 20 0.036 Na 20 0.025 K 20 0.15 Fe 20 1.8 Ti 20 0.058
As 20 8.6 B 20 60 Ba 20 33 Be 20 2.0 Cd 20 0.20 Co 20 3.6 Cr 20 29 Cu 20 9.5 F 20 62 Ge 20 8.9 Hg 20 0.14 La 20 5.4 Li 20 6.8 Mn 20 26 Mo 13 19 Nb 20 1.5 Ni 20 20 P 9 97 Pb 20 6.1 Sb 20 0.6 Sc 20 3.3 Se 20 2.6 Sr 20 68 Th 20 1.8 U 20 3.3
20 20 Y 20 4.3 Yb 20 0.61 Zn 20 31 Zr 20 17
Range Standard Median Minimum Maximum deviation
Percent 7.9 1.5 0.75 0.17 0.03 0.023 0.13 1.5 0.046
5.9 26.0 5.2 1.0 6.2 1.3 0.56 4.2 0.79 0.025 0.84 0.22 0.02 0.11 0.021 0.005 0.055 0.017 0.10 0.29 0.052 0.43 4.2 1.0 0.032 0.20 0.037
Parts per million 3.0 1.3 55 13
57 38 94 17 18 7.5 190 43 1.5 0.39 7.9 1.7 0.08 0.03 1.2 0.30 3.0 2.1 8.8 1.7
14 10 190 47 7.0 3.5 53 10
48 10L 290 58 5.0 0.60 63 14 0.08 0.03L 0.70 0.15 3.6 1.7 27 5.6 4.7 2.6 42 8.6
21 9.4 95 21 4.4 0.55 190G 51 1.4 0.31 4.5 1.1 7.7 2.4 190 43
22 22L 440 140 3.3 0.84 36 8.0 0.2 0.1 5.7 1.2 2.4 2.1 16 3.0 1.7 0.8L 11 2.7
14 2.7 980 220 1.2 1.1 10 2.0 1.7 0.37 22 5.4
13 5.1 82 19 3.4 1.1 19 3.8 0.43 0.35 3.2 0.62
23 8.8 170 36 12 3.7 67 15
Coal quality in the Illinois Basin E83
V

--- --- --- --- ---
--- --- --- --- ---
---
---
Table 9. Number of samples, mean, median, range, and standard deviation of ash yield and contents of elements for the Springfield Coal Member in Illinois as analyzed by the Illinois State Geological Survey.
[All analyses are in percent or parts per million and are reported on an as-received, whole-coal basis. L, less than value shown. A common problem in statistical summaries of trace-element data arises when element values are below the limits of analytical detection. This results in a censored distribution. To compute unbiased estimates of the means for censored data, we adopted the protocol of reducing all "less than" values by 50 percent before summary statistics were generated. Leaders (---) indicate statistics could not be calculated owing to no data or to an insufficient number of analyses above the lower detection limit.]
Number of samples Mean
Ash 1,171 11.7 Si 28 2.2 Al 28 1.0 Ca 28 0.77 Mg 28 0.04 Na 50 0.048 K 46 0.15 Fe 28 1.8 Ti 28 0.055
As 50 20 B 28 90 Ba 15 230 Be 28 1.2 Cd 27 0.96 Co 32 5.1 Cr 32 12 Cu 29 9.6 F 29 55 Ge 28 5.2 Hg 28 0.13 La 33 5.4 Li 10 9.7 Mn 32 62 Mo 28 7.8 Nb Ni 29 15 P 28 62 Pb 29 34 Sb 49 1.2 Sc 15 2.2 Se 32 2.1 Sr 15 29 Th 15 1.5 U 15 0.95 V 28 29 Y Yb 15 0.41 Zn 47 210 Zr 27 30
Range Standard Median Minimum Maximum deviation
Percent 10.7 2.1 0.95 0.69 0.036 0.04 0.14 1.8 0.056
2.8 43.5 4.6 1.6 3.6 0.45 0.59 2.5 0.41 0.22 2.1 0.47 0.0047L 0.16 0.031 0.011 0.20 0.041 0.03 0.46 0.069 0.65 3.9 0.64 0.028 0.094 0.013
Parts per million 8.8
82 46 1.1 0.26 4.7
11 8.5
48 4.8 0.11 5.3 7.8
56 6.5
15 46 27 0.8 2.4 1.8
23 1.3 0.94
28
0.38 58 22
0.27 130 26 14 180 40 22 2,500 630 0.58 2.5 0.38 0.05L 6.9 1.4 1.7 12 2.6 6.9 28 5.2 4.1 30 4.9
28 130 23 0.43L 15 3.5 0.03 0.47 0.10 1.8 11 2.4 4.4 27 6.8
18 150 39 1.4L 22 5.1
1.8 28 7.2 4.2L 290 60 3.6 110 30 0.1 13 1.9 1.3 3.4 0.62 0.9 5.5 1.0
13 59 13 1.1 2.9 0.50 0.46L 1.6 0.40 7.0 75 17
0.19 0.57 0.094 9.0 3,300 500 6.5 130 25
E84 Resource Assessment of the Springfield, Herrin, Danville, and Baker Coals in the Illinois Basin
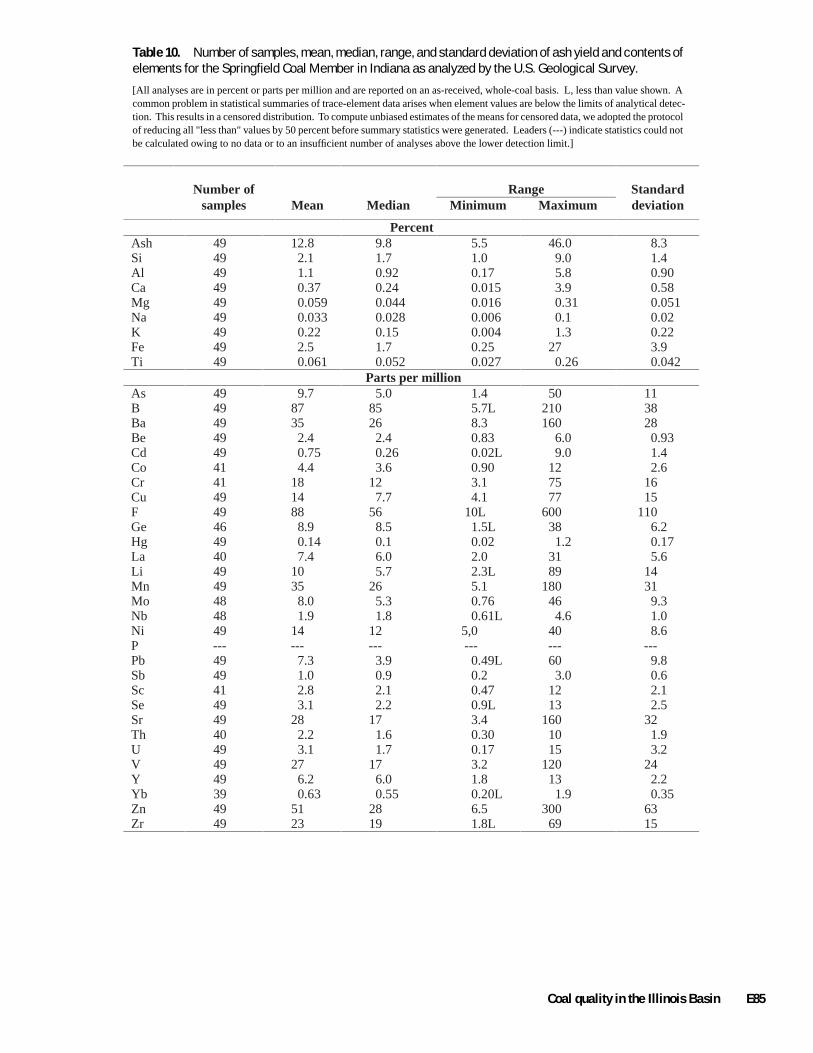
--- ---
Table 10. Number of samples, mean, median, range, and standard deviation of ash yield and contents of elements for the Springfield Coal Member in Indiana as analyzed by the U.S. Geological Survey.
[All analyses are in percent or parts per million and are reported on an as-received, whole-coal basis. L, less than value shown. A common problem in statistical summaries of trace-element data arises when element values are below the limits of analytical detection. This results in a censored distribution. To compute unbiased estimates of the means for censored data, we adopted the protocol of reducing all "less than" values by 50 percent before summary statistics were generated. Leaders (---) indicate statistics could not be calculated owing to no data or to an insufficient number of analyses above the lower detection limit.]
Number of samples Mean
Ash 49 12.8 Si 49 2.1 Al 49 1.1 Ca 49 0.37 Mg 49 0.059 Na 49 0.033 K 49 0.22 Fe 49 2.5 Ti 49 0.061
As 49 9.7 B 49 87 Ba 49 35 Be 49 2.4 Cd 49 0.75 Co 41 4.4 Cr 41 18 Cu 49 14 F 49 88 Ge 46 8.9 Hg 49 0.14 La 40 7.4 Li 49 10 Mn 49 35 Mo 48 8.0 Nb 48 1.9 Ni 49 14 P Pb 49 7.3 Sb 49 1.0 Sc 41 2.8 Se 49 3.1 Sr 49 28 Th 40 2.2 U 49 3.1
49 27 Y 49 6.2 Yb 39 0.63 Zn 49 51 Zr 49 23
Range Standard Median Minimum Maximum deviation
Percent 9.8 1.7 0.92 0.24 0.044 0.028 0.15 1.7 0.052
5.5 46.0 8.3 1.0 9.0 1.4 0.17 5.8 0.90 0.015 3.9 0.58 0.016 0.31 0.051 0.006 0.1 0.02 0.004 1.3 0.22 0.25 27 3.9 0.027 0.26 0.042
Parts per million 5.0
85 26 2.4 0.26 3.6
12 7.7
56 8.5 0.1 6.0 5.7
26 5.3 1.8
1.4 50 11 5.7L 210 38 8.3 160 28 0.83 6.0 0.93 0.02L 9.0 1.4 0.90 12 2.6 3.1 75 16 4.1 77 15
10L 600 110 1.5L 38 6.2 0.02 1.2 0.17 2.0 31 5.6 2.3L 89 14 5.1 180 31 0.76 46 9.3 0.61L 4.6 1.0
12 5,0 40 8.6 --- --- --- ---
3.9 0.49L 60 9.8 0.9 0.2 3.0 0.6 2.1 0.47 12 2.1 2.2 0.9L 13 2.5
17 3.4 160 32 1.6 0.30 10 1.9 1.7 0.17 15 3.2
17 3.2 120 24 6.0 1.8 13 2.2 0.55 0.20L 1.9 0.35
28 6.5 300 63 19 1.8L 69 15
Coal quality in the Illinois Basin E85
V

--- --- --- --- --- --- --- ---
--- --- --- --- --- --- --- --- --- --- --- ---
--- --- --- --- --- --- --- ---
--- --- --- --- --- --- --- ---
--- --- --- ---
--- --- --- ---
--- --- --- --- --- --- --- --- --- --- --- --- --- --- --- ---
--- --- --- --- ---
--- --- --- ---
--- --- --- --- --- ---
--- --- --- ---
--- --- --- ---
--- ---
--- ---
--- --- --- --- --- --- --- ---
---
Table 11. Number of samples, mean, median, range, and standard deviation of ash yield and contents of elements for the Springfield coal in Kentucky as analyzed by the Kentucky Geological Survey.
[All analyses are in percent or parts per million and are reported on an as-received, whole-coal basis. Leaders (---) indicate statistics could not be calculated owing to no data or to an insufficient number of analyses above the lower detection limit.]
Number of samples Mean
Ash 259 10.2 Si 141 1.9 Al 141 0.88 Ca 141 0.47 Mg 141 0.044 Na 132 0.028 K 141 0.15 Fe 141 1.9 Ti 141 0.048
As 15 4.8 B Ba Be 16 1.8 Cd 15 0.27Co 140 3.2 Cr 141 16 Cu F Ge Hg 15 0.02La Li Mn 135 39 Mo Nb Ni 141 10 P 141 52 Pb 15 3.8 Sb 15 1.0 Sc Se 15 2.0 Sr Th 15 1.3 U 15 2.5 V Y Yb Zn Zr
Range Standard Median Minimum Maximum deviation
Percent 10.1 1.9 0.87 0.41 0.041 0.025 0.15 1.9 0.047
5.0 16.4 1.6 0.018 3.1 0.37 0.38 1.4 0.16 0.028 2.0 0.33 0.017 0.10 0.014 0.0018 0.11 0.019 0.064 0.26 0.037 0.69 3.7 0.62 0.022 0.11 0.0097
Parts per million 4.7
1.5 0.17 3.3
14
0.02
35
9.6 37 2.6 0.8
1.9
1.2 1.6
1.8 11 2.5
0.44 4.7 0.96 0.04 0.97 0.27 1.5 5.2 0.80 4.1 86 8.8
0.01 0.03 0.01
0.58 160 24
2.2 41 5.5 4.6 740 80 1.0 9.0 2.5 0.2 2.4 0.7
1.2 3.6 0.7
0.95 2.4 0.45 0.52 9.1 2.3
E86 Resource Assessment of the Springfield, Herrin, Danville, and Baker Coals in the Illinois Basin

Table 12. Number of samples, mean, median, range, and standard deviation of ash yield and contents of elements for the Springfield coal in Kentucky as analyzed by the U.S. Geological Survey.
[All analyses are in percent or parts per million and are reported on an as-received, whole-coal basis. L, less than value shown. G, greater than value shown. A common problem in statistical summaries of trace-element data arises when element values are below the limits of analytical detection. This results in a censored distribution. To compute unbiased estimates of the means for censored data, we adopted the protocol of reducing all "less than" values by 50 percent before summary statistics were generated. Leaders (---) indicate statistics could not be calculated owing to no data or to an insufficient number of analyses above the lower detection limit.]
Number of Samples Mean
Ash 31 11.1 Si 31 1.8 Al 31 0.83 Ca 31 0.63 Mg 31 0.044 Na 31 0.027 K 31 0.14 Fe 31 2.2 Ti 31 0.051
As 31 7.9 B 31 76 Ba 31 58 Be 31 1.8 Cd 31 0.26 Co 31 2.5 Cr 31 13 Cu 31 5.9 F 31 59 Ge 31 9.2 Hg 31 0.14 La 31 4.4 Li 31 6.4 Mn 31 54 Mo 25 5.5 Nb 31 1.5 Ni 31 8.8 P 14 63 Pb 31 5.7 Sb 31 1.0 Sc 31 2.0 Se 31 2.4 Sr 31 21 Th 31 1.3 U 31 2.7
31 30 Y 31 4.0 Yb 31 0.45 Zn 31 45 Zr 31 16
Range Standard Median Minimum Maximum deviation
Percent 11.0 1.8 0.80 0.35 0.037 0.018 0.14 2.0 0.049
7.3 17.0 2.8 1.4 2.3 0.23 0.65 1.1 0.13 0.038 2.3 0.63 0.018 0.23 0.036 0.007 0.072 0.02 0.10 0.22 0.029 0.75 5.8 1.0 0.04 0.069 0.0071
Parts per million 4.9 1.8 37 7.6
71 42 130G 24 18 9.6 1,100 190 1.7 0.56 3.8 0.69 0.14 0.04 1.4 0.31 2.4 1.5 4.2 0.67
11 7.7 35 6.6 5.8 3.5 10 1.5
47 10L 260 44 8.4 3.9 16 3.3 0.13 0.01L 0.39 0.1 4.0 2.8 6.8 0.93 5.8 2.6 16 2.7
31 2.7 210 55 5.2 1.9 13 2.5 1.5 0.26L 3.8 0.78 9.1 2.4 18 4.3
59 22L 180 44 4.2 0.77 17 4.3 0.8 0.2 2.4 0.7 1.9 1.5 3.1 0.4 2.1 1.1 6.3 1.2
18 3.9 81 16 1.2 0.98 2.5 0.29 1.9 0.51 9.8 2.2
13 5.8 130 31 3.9 1.2 7.8 1.5 0.41 0.25 0.71 0.10
27 6.9 390 69 15 5.1 45 8.1
Coal quality in the Illinois Basin E87
V

--- --- --- --- --- --- --- ---
--- --- --- --- --- --- --- --- --- --- --- ---
--- --- --- --- --- --- --- ---
--- --- --- --- --- --- --- ---
--- --- --- ---
--- --- --- ---
--- --- --- --- --- --- --- --- --- --- --- --- --- --- --- ---
--- --- --- --- ---
--- --- --- ---
--- --- --- --- --- ---
--- --- --- ---
--- --- --- ---
--- ---
--- ---
--- --- --- --- --- --- --- ---
---
Table 13. Number of samples, mean, median, range, and standard deviation of ash yield and contents of elements for nonassessed coals from the McLeansboro Group in Kentucky as analyzed by the Kentucky Geological Survey.
[All analyses are in percent or parts per million and are reported on an as-received, whole-coal basis. Leaders (---) indicate statistics could not be calculated owing to no data or to an insufficient number of analyses above the lower detection limit.]
Number of samples Mean
Ash 57 14.7 Si 57 3.0 Al 57 1.5 Ca 57 0.27 Mg 57 0.077 Na 49 0.041 K 57 0.30 Fe 57 2.4 Ti 57 0.081
As 19 9.0 B Ba Be 23 2.1 Cd 19 0.14Co 51 5.3 Cr 56 21 Cu F Ge Hg 18 0.02La Li Mn 56 60 Mo Nb Ni 56 22 P 57 170 Pb 19 6.9 Sb 19 0.8 Sc Se 19 2.0 Sr Th 19 2.0 U 23 1.6 V Y Yb Zn Zr
Range Standard Median Minimum Maximum deviation
Percent 14.6 3.0 1.5 0.13 0.071 0.031 0.29 2.1 0.081
6.0 28.7 4.4 0.028 5.9 1.3 0.67 2.7 0.45 0.037 2.4 0.36 0.015 0.29 0.047 0.0065 0.17 0.037 0.065 0.81 0.14 0.0093 6.4 1.2 0.031 0.14 0.025
Parts per million 3.7
1.9 0.09 4.7
20
0.01
37
18 110
4.8 0.3
2.0
2.0 0.88
0.43 37 10
1.1 5.3 0.83 0.03 0.65 0.16 1.6 15 2.6 7.8 40 7.7
0.01 0.04 0.01
7.5 360 75
3.6 51 14 10 1,300 190 2.2 20 4.8 0.1 3.3 1.0
0.7 3.1 0.6
1.0 3.6 0.70 0.35 7.4 1.6
E88 Resource Assessment of the Springfield, Herrin, Danville, and Baker Coals in the Illinois Basin

Table 14. Number of samples, mean, median, range, and standard deviation of ash yield and contents of elements for nonassessed coals from the McLeansboro Group in Kentucky as analyzed by the U.S. Geological Survey.
[All analyses are in percent or parts per million and are reported on an as-received, whole-coal basis. L, less than value shown. A common problem in statistical summaries of trace-element data arises when element values are below the limits of analytical detection. This results in a censored distribution. To compute unbiased estimates of the means for censored data, we adopted the protocol of reducing all "less than" values by 50 percent before summary statistics were generated.]
Number of samples Mean
Ash 25 13.6 Si 25 2.8 Al 25 1.4 Ca 25 0.27 Mg 25 0.064 Na 25 0.03 K 25 0.28 Fe 25 2.1 Ti 25 0.08
As 25 9.9 B 25 86 Ba 25 40 Be 25 2.3 Cd 25 0.14 Co 25 5.3 Cr 25 16 Cu 25 14 F 25 97 Ge 25 4.8 Hg 25 0.13 La 25 8.1 Li 25 14 Mn 25 48 Mo 25 3.1 Nb 25 1.8 Ni 25 16 P 7 91 Pb 25 8.2 Sb 25 0.7 Sc 25 3.3 Se 25 2.2 Sr 25 44 Th 25 2.1 U 25 1.5
25 21 Y 25 6.0 Yb 25 0.70 Zn 25 39 Zr 25 16
Range Standard Median Minimum Maximum deviation
Percent 14.0 3.0 1.5 0.18 0.069 0.019 0.29 1.8 0.084
8.1 26.0 3.9 0.94 4.9 1.1 0.73 2.8 0.44 0.054 1.4 0.29 0.016 0.14 0.027 0.006 0.15 0.032 0.072 0.59 0.12 0.87 4.6 1.0 0.035 0.14 0.026
Parts per million 3.2 0.30L 65 15
84 55 130 18 35 8.9 98 22 2.1 1.1 5.5 1.1 0.10 0.03 0.49 0.12 3.7 2.5 19 4.2
16 9.2 31 4.5 10 6.7 50 9.6 86 33 260 49 4.0 1.7 14 3.1 0.11 0.03L 0.33 0.09 7.0 2.8 21 4.8
11 6.6 39 7.5 44 18 140 27 2.0 0.42 14 3.2 1.7 0.52 5.4 1.1
12 5.5 75 14 79 22L 260 81 5.2 3.5 49 9.2 0.3 0.1 3.6 1.0 3.0 1.9 7.9 1.1 2.1 1.2 3.5 0.6
33 14 150 33 2.0 1.2 5.1 0.81 0.99 0.49 4.8 1.1
17 9.8 57 10 5.8 2.0 20 3.8 0.64 0.32 1.4 0.28
32 13 140 30 14 5.5 41 9.3
Coal quality in the Illinois Basin E89
V
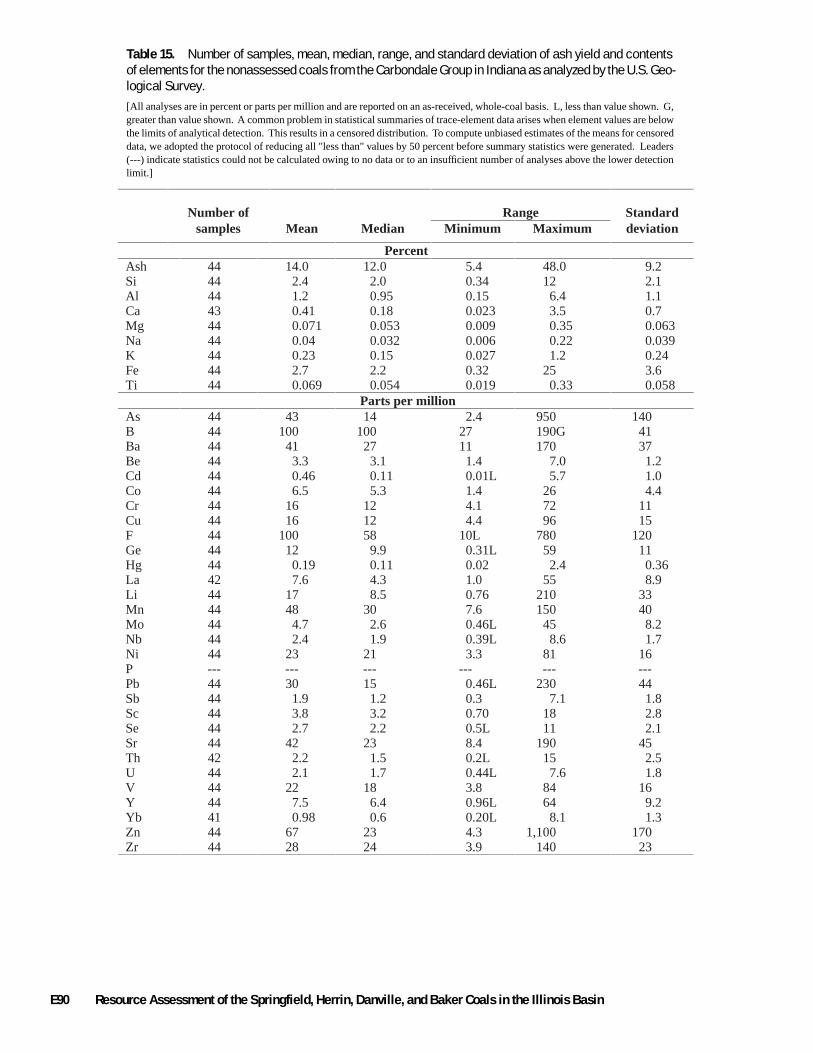
--- --- --- --- --- ---
Table 15. Number of samples, mean, median, range, and standard deviation of ash yield and contents of elements for the nonassessed coals from the Carbondale Group in Indiana as analyzed by the U.S. Geological Survey. [All analyses are in percent or parts per million and are reported on an as-received, whole-coal basis. L, less than value shown. G, greater than value shown. A common problem in statistical summaries of trace-element data arises when element values are below the limits of analytical detection. This results in a censored distribution. To compute unbiased estimates of the means for censored data, we adopted the protocol of reducing all "less than" values by 50 percent before summary statistics were generated. Leaders (---) indicate statistics could not be calculated owing to no data or to an insufficient number of analyses above the lower detection limit.]
Number of samples Mean
Ash 44 14.0 Si 44 2.4 Al 44 1.2 Ca 43 0.41 Mg 44 0.071 Na 44 0.04 K 44 0.23 Fe 44 2.7 Ti 44 0.069
As 44 43 B 44 100 Ba 44 41 Be 44 3.3 Cd 44 0.46 Co 44 6.5 Cr 44 16 Cu 44 16 F 44 100 Ge 44 12 Hg 44 0.19 La 42 7.6 Li 44 17 Mn 44 48 Mo 44 4.7 Nb 44 2.4 Ni 44 23 P Pb 44 30 Sb 44 1.9 Sc 44 3.8 Se 44 2.7 Sr 44 42 Th 42 2.2 U 44 2.1 V 44 22 Y 44 7.5 Yb 41 0.98 Zn 44 67 Zr 44 28
Range Standard Median Minimum Maximum deviation
Percent 12.0 2.0 0.95 0.18 0.053 0.032 0.15 2.2 0.054
5.4 48.0 9.2 0.34 12 2.1 0.15 6.4 1.1 0.023 3.5 0.7 0.009 0.35 0.063 0.006 0.22 0.039 0.027 1.2 0.24 0.32 25 3.6 0.019 0.33 0.058
Parts per million 14
100 27 3.1 0.11 5.3
12 12 58 9.9 0.11 4.3 8.5
30 2.6 1.9
21
15 1.2 3.2 2.2
23 1.5 1.7
18 6.4 0.6
23 24
2.4 950 140 27 190G 41 11 170 37 1.4 7.0 1.2 0.01L 5.7 1.0 1.4 26 4.4 4.1 72 11 4.4 96 15
10L 780 120 0.31L 59 11 0.02 2.4 0.36 1.0 55 8.9 0.76 210 33 7.6 150 40 0.46L 45 8.2 0.39L 8.6 1.7 3.3 81 16
0.46L 230 44 0.3 7.1 1.8 0.70 18 2.8 0.5L 11 2.1 8.4 190 45 0.2L 15 2.5 0.44L 7.6 1.8 3.8 84 16 0.96L 64 9.2 0.20L 8.1 1.3 4.3 1,100 170 3.9 140 23
E90 Resource Assessment of the Springfield, Herrin, Danville, and Baker Coals in the Illinois Basin

--- --- --- --- --- --- --- ---
--- --- --- --- --- --- --- --- --- --- --- ---
--- --- --- --- --- --- --- ---
--- --- --- --- --- --- --- ---
--- --- --- ---
--- --- --- ---
--- --- --- --- --- --- --- --- --- --- --- --- --- --- --- ---
--- --- --- --- ---
--- --- --- ---
--- --- --- --- --- ---
--- --- --- ---
--- --- --- ---
--- ---
--- ---
--- --- --- --- --- --- --- ---
---
Table 16. Number of samples, mean, median, range, and standard deviation of ash yield and contents of elements for nonassessed coals from the Carbondale Formation in Kentucky as analyzed by the Kentucky Geological Survey.
[All analyses are in percent or parts per million and are reported on an as-received, whole-coal basis. Leaders (---) indicate statistics could not be calculated owing to no data or to an insufficient number of analyses above the lower detection limit.]
Number of samples Mean
Ash 42 15.0 Si 42 2.9 Al 42 1.6 Ca 42 0.29 Mg 42 0.19 Na 38 0.054 K 42 0.32 Fe 42 2.6 Ti 42 0.079
As 4 16 B Ba Be 4 2.9 Cd 4 0.33Co 35 4.8 Cr 35 24 Cu F Ge Hg 4 0.02La Li Mn 34 45 Mo Nb Ni 35 26 P 42 280 Pb 4 20 Sb 4 0.9 Sc Se 4 3.1 Sr Th 4 2.2 U 4 2.9
Y Yb Zn Zr
Range Standard Median Minimum Maximum deviation
Percent 13.8 2.5 1.5 0.12 0.081 0.043 0.29 2.6 0.075
3.6 30.9 6.4 0.75 8.6 1.7 0.41 4.5 0.88 0.037 1.9 0.38 0.019 4.6 0.70 0.0028 0.15 0.038 0.065 0.97 0.20 0.46 6.3 1.3 0.021 0.23 0.043
Parts per million 10
2.1 0.26 4.6
22
0.02
32
24 96 18 0.4
2.6
2.4 2.0
3.8 38 15
1.5 5.9 2.1 0.08 0.71 0.28 1.3 11 2.2 5.3 55 12
0.01 0.05 0.02
1.1 140 34
7.4 64 14 20 6,700 1000 11 35 10 0.3 2.4 1.0
2.0 5.1 1.4
1.1 2.9 0.81 1.2 6.3 2.3
Coal quality in the Illinois Basin E91
V

Table 17. Number of samples, mean, median, range, and standard deviation of ash yield and contents of elements for nonassessed coals from the Carbondale Formation in Kentucky as analyzed by the U.S. Geological Survey.
[All analyses are in percent or parts per million and are reported on an as-received, whole-coal basis. L, less than value shown. G, greater than value shown. A common problem in statistical summaries of trace-element data arises when element values are below the limits of analytical detection. This results in a censored distribution. To compute unbiased estimates of the means for censored data, we adopted the protocol of reducing all "less than" values by 50 percent before summary statistics were generated.]
Number of samples Mean
Ash 42 14.7 Si 42 2.4 Al 42 1.3 Ca 42 0.5 Mg 42 0.058 Na 42 0.036 K 42 0.21 Fe 42 3.2 Ti 42 0.065
As 42 27 B 42 78 Ba 42 40 Be 42 3.7 Cd 42 0.45 Co 42 9.6 Cr 42 20 Cu 42 16 F 42 97 Ge 42 16 Hg 42 0.10 La 42 7.3 Li 42 15 Mn 42 59 Mo 23 8.9 Nb 42 2.8 Ni 42 34 P 32 110 Pb 42 25 Sb 42 1.2 Sc 42 4.7 Se 42 3.9 Sr 42 44 Th 42 2.1 U 42 4.6 V 42 31 Y 42 10 Yb 42 1.2 Zn 42 71 Zr 42 28
Range Standard Median Minimum Maximum deviation
Percent 14.0 2.2 1.2 0.34 0.046 0.029 0.18 2.6 0.063
6.2 28.0 5.6 0.87 5.9 1.1 0.51 3.1 0.58 0.037 2.4 0.56 0.015 0.15 0.034 0.009 0.11 0.025 0.051 0.52 0.11 0.67 12 2.2 0.005 0.17 0.03
Parts per million 15 0.50L 130 30 74 13 140G 25 31 7.5 130 28 3.7 1.2 7.3 1.3 0.11 0.02L 6.2 1.1 5.8 1.1 110 17
17 9.7 86 13 15 6.6 33 7.1 65 10L 460 88 15 1.8 41 10 0.08 0.02L 0.45 0.09 6.0 2.0 28 4.7
11 2.7 46 11 50 8.1 220 47 5.3 0.96 56 12 2.6 0.74 6.3 1.4
28 3.7 190 33 74 22L 810 140 20 2.2 120 24 1.0 0.1L 7.1 1.2 4.2 2.0 12 2.2 3.3 1.7 12 2.0
33 9.5 300 46 1.9 0.71 6.4 0.99 3.7 0.59 13 3.4
28 7.8 82 17 9.2 5.1 34 5.5 1.0 0.57 4.4 0.67
29 1.8 670 130 24 9.9 110 18
E92 Resource Assessment of the Springfield, Herrin, Danville, and Baker Coals in the Illinois Basin

--- --- --- --- --- ---
Table 18. Number of samples, mean, median, range, and standard deviation of ash yield and contents of elements for nonassessed coals in the Raccoon Creek Group in Indiana as analyzed by the U.S. Geological Survey.
[All analyses are in percent or parts per million and are reported on an as-received, whole-coal basis. L, less than value shown. A common problem in statistical summaries of trace-element data arises when element values are below the limits of analytical detection. This results in a censored distribution. To compute unbiased estimates of the means for censored data, we adopted the protocol of reducing all "less than" values by 50 percent before summary statistics were generated. Leaders (---) indicate statistics could not be calculated owing to no data or to an insufficient number of analyses above the lower detection limit.]
Number of samples Mean
Ash 106 12.7 Si 105 2.5 Al 105 1.5 Ca 105 0.084 Mg 106 0.05 Na 106 0.036 K 104 0.20 Fe 105 1.9 Ti 105 0.081
As 106 16 B 105 83 Ba 106 59 Be 106 3.7 Cd 106 0.30 Co 106 12 Cr 106 19 Cu 106 22 F 106 79 Ge 104 12 Hg 106 0.13 La 101 13 Li 106 22 Mn 106 18 Mo 106 2.4 Nb 102 2.5 Ni 106 39 P Pb 106 23 Sb 106 1.3 Sc 106 4.4 Se 106 4.2 Sr 106 75 Th 100 2.7 U 106 1.9
106 26 Y 101 9.3 Yb 98 0.92 Zn 106 88 Zr 106 30
Range Standard Median Minimum Maximum deviation
Percent 8.9 1.5 0.89 0.046 0.029 0.012 0.085 1.4 0.047
1.7 48.0 10 0.40 13 2.8 0.14 7.8 1.7 0.018 1.0 0.16 0.002L 0.25 0.055 0.002 0.28 0.06 0.007 1.3 0.28 0.11 24 2.5 0.002 0.46 0.092
Parts per million 9.0
77 23 3.5 0.12 8.8
13 16 55 13 0.08 9.0 8.8
13 1.6 1.5
31
19 1.1 3.5 3.6
33 1.5 1.2
15 6.7 0.70
33 14
0.40 95 17 12 210 45 1.9 560 85 0.25 9.2 1.5 0.01L 3.5 0.57 1.0 110 12 3.1L 65 15 2.1L 140 21
10L 420 80 0.82L 37 8.3 0.01L 1.2 0.16 1.0 72 13 0.67L 140 31 2.2 94 17 0.16L 25 3.1 0.051L 14 2.8 4.4 170 30
0.37L 190 24 0.1 7.4 1.2 0.47 13 3.0 0.6L 14 2.6 2.0 490 99 0.15L 18 3.0 0.055L 17 2.2 0.60 98 25 1.5 41 7.8 0.15L 4.1 0.69 5.5 1,600 210 0.83L 210 34
Coal quality in the Illinois Basin E93
V

--- --- --- --- --- --- --- ---
--- --- --- --- --- --- --- --- --- --- --- ---
--- --- --- --- --- --- --- ---
--- --- --- --- --- --- --- ---
--- --- --- ---
--- --- --- ---
--- --- --- --- --- --- --- --- --- --- --- --- --- --- --- ---
--- --- --- --- ---
--- --- --- ---
--- --- --- --- --- ---
--- --- --- ---
--- --- --- ---
--- ---
--- ---
--- --- --- --- --- --- --- ---
---
Table 19. Number of samples, mean, median, range, and standard deviation of ash yield and contents of elements for nonassessed coals from the Raccoon Creek Group in Kentucky as analyzed by the Kentucky Geological Survey.
[All analyses are in percent or parts per million and are reported on an as-received, whole-coal basis. Leaders (---) indicate statistics could not be calculated owing to no data or to an insufficient number of analyses above the lower detection limit.]
Number of samples Mean
Ash 87 9.1 Si 83 1.7 Al 83 1.0 Ca 82 0.13 Mg 87 0.036 Na 70 0.024 K 83 0.13 Fe 83 1.8 Ti 83 0.047
As 15 26 B Ba Be 15 3.8 Cd 15 0.72Co 56 5.3 Cr 60 13 Cu F Ge Hg 8 0.01La Li Mn 53 14 Mo Nb Ni 60 43 P 83 79 Pb 15 22 Sb 15 2.4 Sc Se 15 2.6 Sr Th 15 1.2 U 15 2.0 V Y Yb Zn Zr
Range Standard Median Minimum Maximum deviation
Percent 7.6 1.1 0.71 0.037 0.019 0.011 0.065 1.6 0.034
1.5 43.9 6.9 0.019 12 1.8 0.11 5.9 0.92 0.0093 1.1 0.21 0.0028 0.35 0.049 0.0019 0.17 0.028 0.0093 1.2 0.18 0.093 5.4 1.3 0.0037 0.29 0.044
Parts per million 11
3.5 0.15 3.7
11
0.01
9.4
40 42 17 1.4
2.0
1.0 1.2
2.0 180 44
2.4 7.3 1.2 0.01 4.4 1.4 0.20 18 4.9 3.2 56 9.0
0.01 0.03 0.01
1 81 15
5.3 120 25 5.6 520 99 6.2 65 16 0.2 13 3.2
1.1 5.1 1.3
0.48 2.7 0.70 0.76 7.8 1.9
E94 Resource Assessment of the Springfield, Herrin, Danville, and Baker Coals in the Illinois Basin
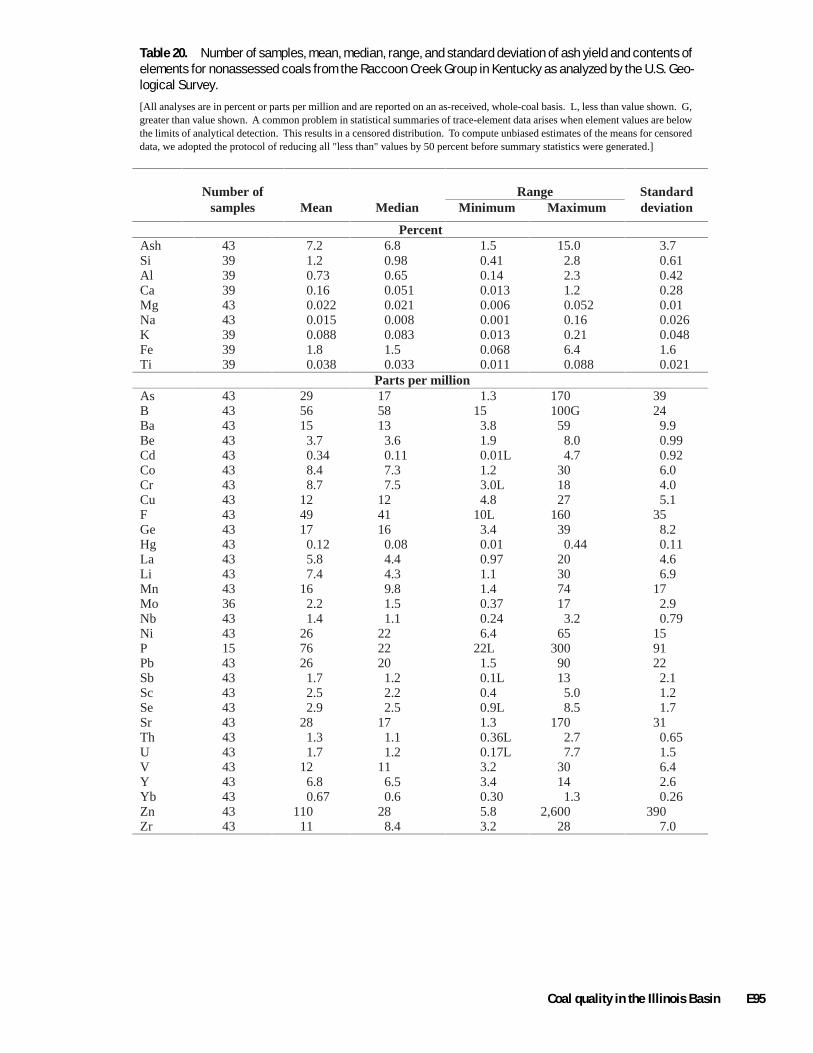
Table 20. Number of samples, mean, median, range, and standard deviation of ash yield and contents of elements for nonassessed coals from the Raccoon Creek Group in Kentucky as analyzed by the U.S. Geological Survey.
[All analyses are in percent or parts per million and are reported on an as-received, whole-coal basis. L, less than value shown. G, greater than value shown. A common problem in statistical summaries of trace-element data arises when element values are below the limits of analytical detection. This results in a censored distribution. To compute unbiased estimates of the means for censored data, we adopted the protocol of reducing all "less than" values by 50 percent before summary statistics were generated.]
Number of samples Mean
Ash 43 7.2 Si 39 1.2 Al 39 0.73 Ca 39 0.16 Mg 43 0.022 Na 43 0.015 K 39 0.088 Fe 39 1.8 Ti 39 0.038
As 43 29 B 43 56 Ba 43 15 Be 43 3.7 Cd 43 0.34 Co 43 8.4 Cr 43 8.7 Cu 43 12 F 43 49 Ge 43 17 Hg 43 0.12 La 43 5.8 Li 43 7.4 Mn 43 16 Mo 36 2.2 Nb 43 1.4 Ni 43 26 P 15 76 Pb 43 26 Sb 43 1.7 Sc 43 2.5 Se 43 2.9 Sr 43 28 Th 43 1.3 U 43 1.7
43 12 Y 43 6.8 Yb 43 0.67 Zn 43 110 Zr 43 11
Range Standard Median Minimum Maximum deviation
Percent 6.8 0.98 0.65 0.051 0.021 0.008 0.083 1.5 0.033
1.5 15.0 3.7 0.41 2.8 0.61 0.14 2.3 0.42 0.013 1.2 0.28 0.006 0.052 0.01 0.001 0.16 0.026 0.013 0.21 0.048 0.068 6.4 1.6 0.011 0.088 0.021
Parts per million 17 1.3 170 39 58 15 100G 24 13 3.8 59 9.9 3.6 1.9 8.0 0.99 0.11 0.01L 4.7 0.92 7.3 1.2 30 6.0 7.5 3.0L 18 4.0
12 4.8 27 5.1 41 10L 160 35 16 3.4 39 8.2 0.08 0.01 0.44 0.11 4.4 0.97 20 4.6 4.3 1.1 30 6.9 9.8 1.4 74 17 1.5 0.37 17 2.9 1.1 0.24 3.2 0.79
22 6.4 65 15 22 22L 300 91 20 1.5 90 22 1.2 0.1L 13 2.1 2.2 0.4 5.0 1.2 2.5 0.9L 8.5 1.7
17 1.3 170 31 1.1 0.36L 2.7 0.65 1.2 0.17L 7.7 1.5
11 3.2 30 6.4 6.5 3.4 14 2.6 0.6 0.30 1.3 0.26
28 5.8 2,600 390 8.4 3.2 28 7.0
Coal quality in the Illinois Basin E95
V

Appendix 5. Minimum, maximum, percentile, and median values of ash yield, sulfur content, calorific value, and elements of environmental concern for assessed and nonassessed coals, grouped by assessed coal or stratigraphic unit in the Illinois Basin.

Figure 1. Minimum, maximum, percentile, and median values for ash yield (percent, as-received basis) of coals, grouped by assessed coal or stratigraphic unit in the Illinois Basin.
Coal quality in the Illinois Basin E97

Figure 2. Minimum, maximum, percentile, and median values for sulfur content (percent, as-received basis) of coals, grouped by assessed coal or stratigraphic unit in the Illinois Basin.
E98 Resource Assessment of the Springfield, Herrin, Danville, and Baker Coals in the Illinois Basin

Figure 3. Minimum, maximum, percentile, and median values for calorific value (Btu/lb, as-received basis) of coals, grouped by assessed coal or stratigraphic unit in the Illinois Basin.
Coal quality in the Illinois Basin E99

Figure 4. Minimum, maximum, percentile, and median values for antimony content (parts per million, as-received, whole-coal basis) of coals, grouped by assessed coal or stratigraphic unit in the Illinois Basin.
E100 Resource Assessment of the Springfield, Herrin, Danville, and Baker Coals in the Illinois Basin

Figure 5. Minimum, maximum, percentile, and median values for arsenic content (parts per million, as-received, whole-coal basis) of coals, grouped by assessed coal or stratigraphic unit in the Illinois Basin.
Coal quality in the Illinois Basin E101

Figure 6. Minimum, maximum, percentile, and median values for beryllium content (parts per million, as-received, whole-coal basis) of coals, grouped by assessed coal or stratigraphic unit in the Illinois Basin.
E102 Resource Assessment of the Springfield, Herrin, Danville, and Baker Coals in the Illinois Basin
Figure 7. Minimum, maximum, percentile, and median values for cadmium content (parts per million, as-received, whole-coal basis) of coals, grouped by assessed coal or stratigraphic unit in the Illinois Basin.
Coal quality in the Illinois Basin E103

Figure 8. Minimum, maximum, percentile, and median values for chromium content (parts per million, as-received, whole-coal basis) of coals, grouped by assessed coal or stratigraphic unit in the Illinois Basin.
E104 Resource Assessment of the Springfield, Herrin, Danville, and Baker Coals in the Illinois Basin

Figure 9. Minimum, maximum, percentile, and median values for cobalt content (parts per million, as-received, whole-coal basis) of coals, grouped by assessed coal or stratigraphic unit in the Illinois Basin.
Coal quality in the Illinois Basin E105

Figure 10. Minimum, maximum, percentile, and median values for lead content (parts per million, as-received, whole-coal basis) of coals, grouped by assessed coal or stratigraphic unit in the Illinois Basin.
E106 Resource Assessment of the Springfield, Herrin, Danville, and Baker Coals in the Illinois Basin

Figure 11. Minimum, maximum, percentile, and median values for manganese content (parts per million, as-received, whole-coal basis) of coals, grouped by assessed coal or stratigraphic unit in the Illinois Basin.
Coal quality in the Illinois Basin E107

Figure 12. Minimum, maximum, percentile, and median values for mercury content (parts per million, as-received, whole-coal basis) of coals, grouped by assessed coal or stratigraphic unit in the Illinois Basin.
E108 Resource Assessment of the Springfield, Herrin, Danville, and Baker Coals in the Illinois Basin

Figure 13. Minimum, maximum, percentile, and median values for nickel content (parts per million, as-received, whole-coal basis) of coals, grouped by assessed coal or stratigraphic unit in the Illinois Basin.
Coal quality in the Illinois Basin E109

Figure 14. Minimum, maximum, percentile, and median values for selenium content (parts per million, as-received, whole-coal basis) of coals, grouped by assessed coal or stratigraphic unit in the Illinois Basin.
E110 Resource Assessment of the Springfield, Herrin, Danville, and Baker Coals in the Illinois Basin

Figure 15. Minimum, maximum, percentile, and median values for thorium content (parts per million, as-received, whole-coal basis) of coals, grouped by assessed coal or stratigraphic unit in the Illinois Basin.
Coal quality in the Illinois Basin E111

Figure 16. Minimum, maximum, percentile, and median values for uranium content (parts per million, as-received, whole-coal basis) of coals, grouped by assessed coal or stratigraphic unit in the Illinois Basin.
E112 Resource Assessment of the Springfield, Herrin, Danville, and Baker Coals in the Illinois Basin
Appendix 6. Histograms of ash yield, sulfur content, calorific value, and elements of environmental concern for the Springfield, Herrin, and Danville-Baker Coals in the Illinois Basin.

Figure 1. Histogram of ash yield (percent, as-received basis) of the Danville-Baker Coals in the Illinois Basin. Intervals on the x-axis are shown in parentheses.
E114 Resource Assessment of the Springfield, Herrin, Danville, and Baker Coals in the Illinois Basin

Figure 2. Histogram of sulfur content (percent, as-received basis) of the Danville-Baker Coals in the Illinois Basin. Intervals on the x-axis are shown in parentheses.
Coal quality in the Illinois Basin E115

E116 Resource Assessment of the Springfield, Herrin, Danville, and Baker Coals in the Illinois Basin
Median = 11,060
n = 295
Figure 3.
Histogram of calorific values (Btu/lb, as-received basis) of the Danville-Baker Coals in the Illinois Basin. on the x-axis are shown in parentheses
Intervals

Coal quality in the Illinois Basin
Median = 1.4
n = 39
Figure 4.
Histogram of antimony content (parts per million, as-received, whole-coal basis) of the Danville-Baker Coals in the Illinois Basin.
E117
(as-received, whole-coal basis)
Intervals on the x-axis are shown in parentheses.

E118 Resource Assessment of the Springfield, Herrin, Danville, and Baker Coals in the Illinois Basin
Median = 14
n = 39
Figure 5.
Histogram of arsenic content (parts per million, as-received, whole-coal basis) of the Danville-Baker Coals in the Illinois Basin.
(as-received, whole-coal basis)
Intervals on the x-axis are shown in parentheses.

Coal quality in the Illinois Basin
Median = 2.4
n = 39
Figure 6.
Histogram of beryllium content (parts per million, as-received, whole-coal basis) of the Danville-Baker Coals in the Illinois Basin.
E119
(as-received, whole-coal basis)
Intervals on the x-axis are shown in parentheses.

E120 Resource Assessment of the Springfield, Herrin, Danville, and Baker Coals in the Illinois Basin
Median = 0.12
n = 39
Figure 7.
Histogram of cadmium content (parts per million, as-received, whole-coal basis) of the Danville-Baker Coals in the Illinois Basin.
(as-received, whole-coal basis)
Intervals on the x-axis are shown in parentheses.

Coal quality in the Illinois Basin
Median = 17
n = 55
Figure 8.
Histogram of chromium content (parts per million, as-received, whole-coal basis) of the Danville-Baker Coals in the Illinois Basin.
E121
(as-received, whole-coal basis)
Intervals on the x-axis are shown in parentheses.
E122 Resource Assessment of the Springfield, Herrin, Danville, and Baker Coals in the Illinois Basin
Median = 5.3
n = 55
Figure 9.
Histogram of cobalt content (parts per million, as-received, whole-coal basis) of the Danville-Baker Coals in the Illinois Basin.
(as-received, whole-coal basis)
Intervals on the x-axis are shown in parentheses.

Coal quality in the Illinois Basin
Median = 14
n = 39
Figure 10
. Histogram of lead content (parts per million, as-received, whole-coal basis) of the Danville-Baker Coals in the Illinois Basin.
E123
(as-received, whole-coal basis)
Intervals on the x-axis are shown in parentheses.

E124 Resource Assessment of the Springfield, Herrin, Danville, and Baker Coals in the Illinois Basin
Median = 39
n = 55
Figure 11.
Histogram of manganese content (parts per million, as-received, whole-coal basis) of the Danville-Baker Coals in the Illinois Basin.
(as-received, whole-coal basis)
Intervals on the x-axis are shown in parentheses.

Figure 12. Histogram of mercury content (parts per million, as-received, whole-coal basis) of the Danville-Baker Coals in the Illinois Basin. Intervals on the x-axis are shown in parentheses.
Coal quality in the Illinois Basin E125

Figure 13. Histogram of nickel content (parts per million, as-received, whole-coal basis) of the Danville-Baker Coals in the Illinois Basin. Intervals on the x-axis are shown in parentheses.
E126 Resource Assessment of the Springfield, Herrin, Danville, and Baker Coals in the Illinois Basin

Figure 14. Histogram of selenium content (parts per million, as-received, whole-coal basis) of the Danville-Baker Coals in the Illinois Basin. Intervals on the x-axis are shown in parentheses.
Coal quality in the Illinois Basin E127

Figure 15. Histogram of thorium content (parts per million, as-received, whole-coal basis) of the Danville-Baker Coals in the Illinois Basin. Intervals on the x-axis are shown in parentheses.
E128 Resource Assessment of the Springfield, Herrin, Danville, and Baker Coals in the Illinois Basin

Figure 16. Histogram of uranium content (parts per million, as-received, whole-coal basis) of the Danville-Baker Coals in the Illinois Basin. Intervals on the x-axis are shown in parentheses.
Coal quality in the Illinois Basin E129

Figure 17. Histogram of ash yield (percent, as-received basis) of the Herrin Coal in the Illinois Basin. Intervals on the x-axis are shown in parentheses.
E130 Resource Assessment of the Springfield, Herrin, Danville, and Baker Coals in the Illinois Basin

Figure 18. Histogram of sulfur content (percent, as-received basis) of the Herrin Coal in the Illinois Basin. Intervals on the x-axis are shown in parentheses.
Coal quality in the Illinois Basin E131

Figure 19. Histogram of calorific values (Btu/lb, as-received basis) of the Herrin Coal in the Illinois Basin. Intervals on the x-axis are shown in parentheses.
E132 Resource Assessment of the Springfield, Herrin, Danville, and Baker Coals in the Illinois Basin

Figure 20. Histogram of antimony content (parts per million, as-received, whole-coal basis) of the Herrin Coal in the Illinois Basin. Intervals on the x-axis are shown in parentheses.
Coal quality in the Illinois Basin E133

Figure 21. Histogram of arsenic content (parts per million, as-received, whole-coal basis) of the Herrin Coal in the Illinois Basin. Intervals on the x-axis are shown in parentheses.
E134 Resource Assessment of the Springfield, Herrin, Danville, and Baker Coals in the Illinois Basin

Figure 22. Histogram of beryllium content (parts per million, as-received, whole-coal basis) of the Herrin Coal in the Illinois Basin. Intervals on the x-axis are shown in parentheses.
Coal quality in the Illinois Basin E135

Figure 23. Histogram of cadmium content (parts per million, as-received, whole-coal basis) of the Herrin Coal in the Illinois Basin. Intervals on the x-axis are shown in parentheses.
E136 Resource Assessment of the Springfield, Herrin, Danville, and Baker Coals in the Illinois Basin

Figure 24. Histogram of chromium content (parts per million, as-received, whole-coal basis) of the Herrin Coal in the Illinois Basin. Intervals on the x-axis are shown in parentheses.

Figure 25. Histogram of cobalt content (parts per million, as-received, whole-coal basis) of the Herrin Coal in the Illinois Basin. Intervals on the x-axis are shown in parentheses.

Figure 26. Histogram of lead content (parts per million, as-received, whole-coal basis) of the Herrin Coal in the Illinois Basin. Intervals on the x-axis are shown in parentheses.
Coal quality in the Illinois Basin E139

Figure 27. Histogram of manganese content (parts per million, as-received, whole-coal basis) of the Herrin Coal in the Illinois Basin. Intervals on the x-axis are shown in parentheses.
E140 Resource Assessment of the Springfield, Herrin, Danville, and Baker Coals in the Illinois Basin

Figure 28. Histogram of mercury content (parts per million, as-received, whole-coal basis) of the Herrin Coal in the Illinois Basin. Intervals on the x-axis are shown in parentheses.
Coal quality in the Illinois Basin E141

Figure 29. Histogram of nickel content (parts per million, as-received, whole-coal basis) of the Herrin Coal in the Illinois Basin. Intervals on the x-axis are shown in parentheses.
E142 Resource Assessment of the Springfield, Herrin, Danville, and Baker Coals in the Illinois Basin

Figure 30. Histogram of selenium content (parts per million, as-received, whole-coal basis) of the Herrin Coal in the Illinois Basin. Intervals on the x-axis are shown in parentheses.
Coal quality in the Illinois Basin E143
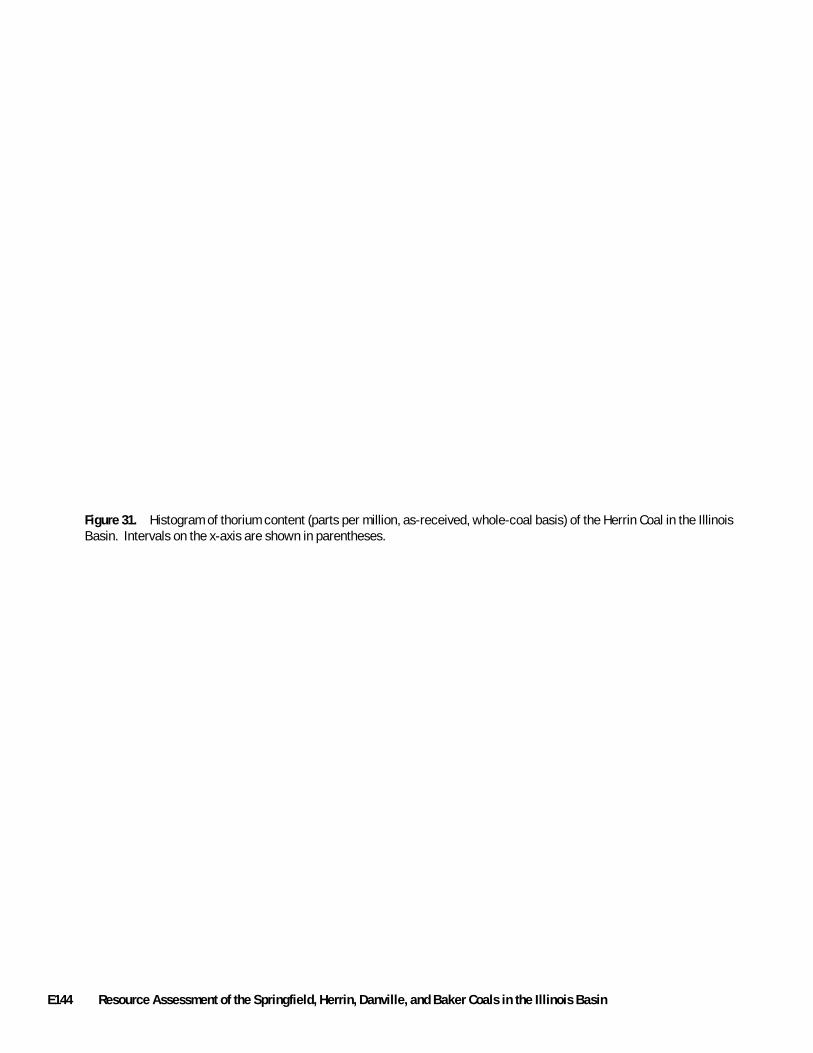
Figure 31. Histogram of thorium content (parts per million, as-received, whole-coal basis) of the Herrin Coal in the Illinois Basin. Intervals on the x-axis are shown in parentheses.
E144 Resource Assessment of the Springfield, Herrin, Danville, and Baker Coals in the Illinois Basin

Figure 32. Histogram of uranium content (parts per million, as-received, whole-coal basis) of the Herrin Coal in the Illinois Basin. Intervals on the x-axis are shown in parentheses.
Coal quality in the Illinois Basin E145

Figure 33. Histogram of ash yield (percent, as-received basis) of the Springfield Coal in the Illinois Basin. Intervals on the x-axis are shown in parentheses.
E146 Resource Assessment of the Springfield, Herrin, Danville, and Baker Coals in the Illinois Basin

Figure 34. Histogram of sulfur content (percent, as-received basis) of the Springfield Coal in the Illinois Basin. Intervals on the x-axis are shown in parentheses.
Coal quality in the Illinois Basin E147

Figure 35. Histogram of calorific values (Btu/lb, as-received basis) of the Springfield Coal in the Illinois Basin. Intervals on the x-axis are shown in parentheses.
E148 Resource Assessment of the Springfield, Herrin, Danville, and Baker Coals in the Illinois Basin

Figure 36. Histogram of antimony content (parts per million, as-received, whole-coal basis) of the Springfield Coal in the Illinois Basin. Intervals on the x-axis are shown in parentheses.
Coal quality in the Illinois Basin E149

Figure 37. Histogram of arsenic content (parts per million, as-received, whole-coal basis) of the Springfield Coal in the Illinois Basin. Intervals on the x-axis are shown in parentheses.
E150 Resource Assessment of the Springfield, Herrin, Danville, and Baker Coals in the Illinois Basin

Figure 38. Histogram of beryllium content (parts per million, as-received, whole-coal basis) of the Springfield Coal in the Illinois Basin. Intervals on the x-axis are shown in parentheses.
Coal quality in the Illinois Basin E151
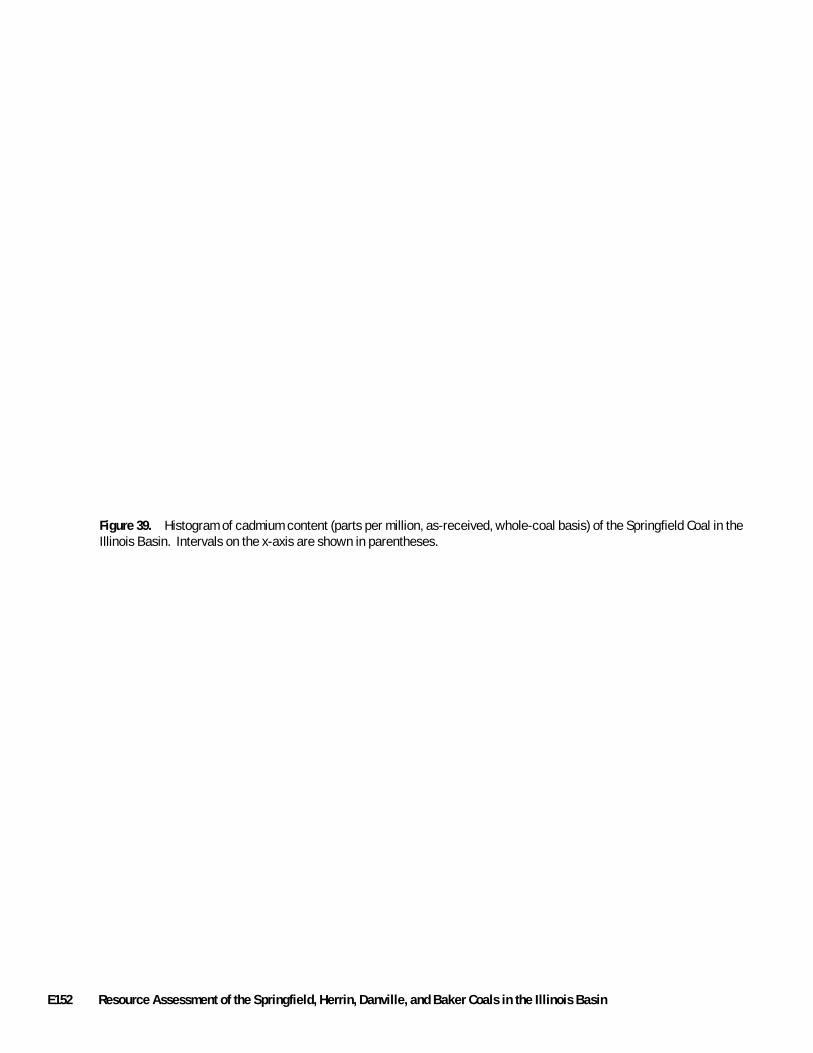
Figure 39. Histogram of cadmium content (parts per million, as-received, whole-coal basis) of the Springfield Coal in the Illinois Basin. Intervals on the x-axis are shown in parentheses.
E152 Resource Assessment of the Springfield, Herrin, Danville, and Baker Coals in the Illinois Basin
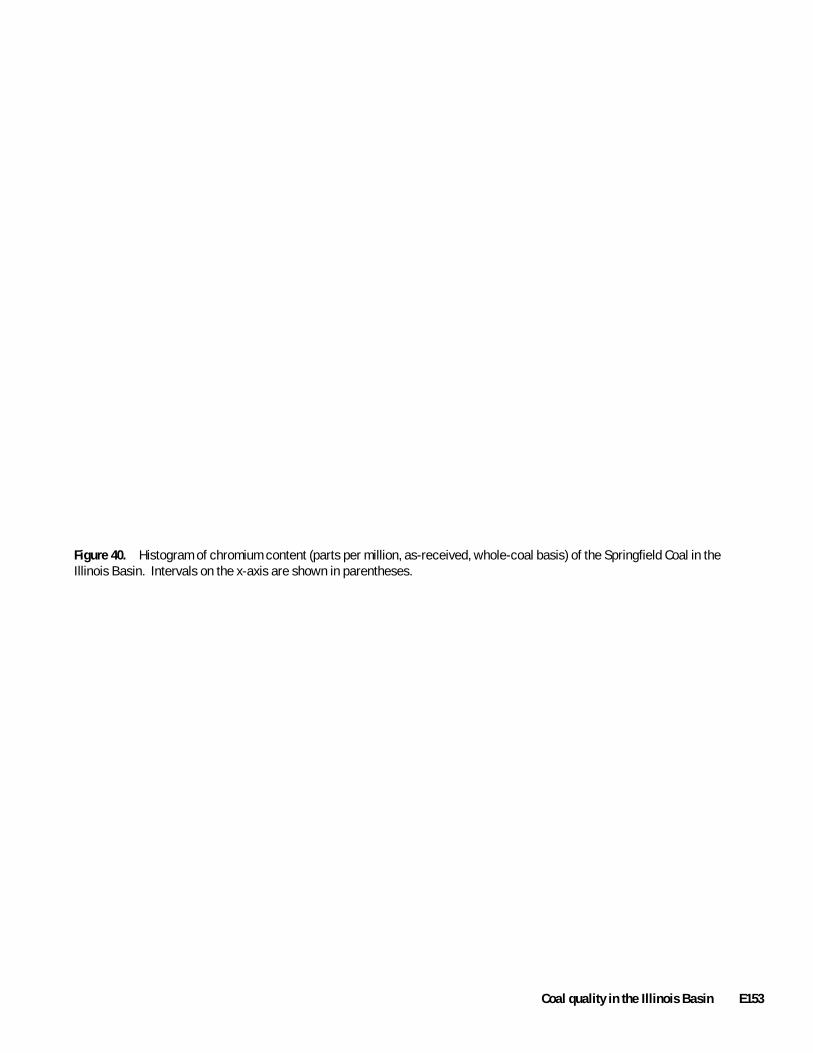
Figure 40. Histogram of chromium content (parts per million, as-received, whole-coal basis) of the Springfield Coal in the Illinois Basin. Intervals on the x-axis are shown in parentheses.
Coal quality in the Illinois Basin E153

Figure 41. Histogram of cobalt content (parts per million, as-received, whole-coal basis) of the Springfield Coal in the Illinois Basin. Intervals on the x-axis are shown in parentheses.
E154 Resource Assessment of the Springfield, Herrin, Danville, and Baker Coals in the Illinois Basin

Figure 42. Histogram of lead content (parts per million, as-received, whole-coal basis) of the Springfield Coal in the Illinois Basin. Intervals on the x-axis are shown in parentheses.
Coal quality in the Illinois Basin E155

Figure 43. Histogram of manganese content (parts per million, as-received, whole-coal basis) of the Springfield Coal in the Illinois Basin. Intervals on the x-axis are shown in parentheses.
E156 Resource Assessment of the Springfield, Herrin, Danville, and Baker Coals in the Illinois Basin

Figure 44. Histogram of mercury content (parts per million, as-received, whole-coal basis) of the Springfield Coal in the Illinois Basin. Intervals on the x-axis are shown in parentheses.
Coal quality in the Illinois Basin E157

Figure 45. Histogram of nickel content (parts per million, as-received, whole-coal basis) of the Springfield Coal in the Illinois Basin. Intervals on the x-axis are shown in parentheses.
E158 Resource Assessment of the Springfield, Herrin, Danville, and Baker Coals in the Illinois Basin
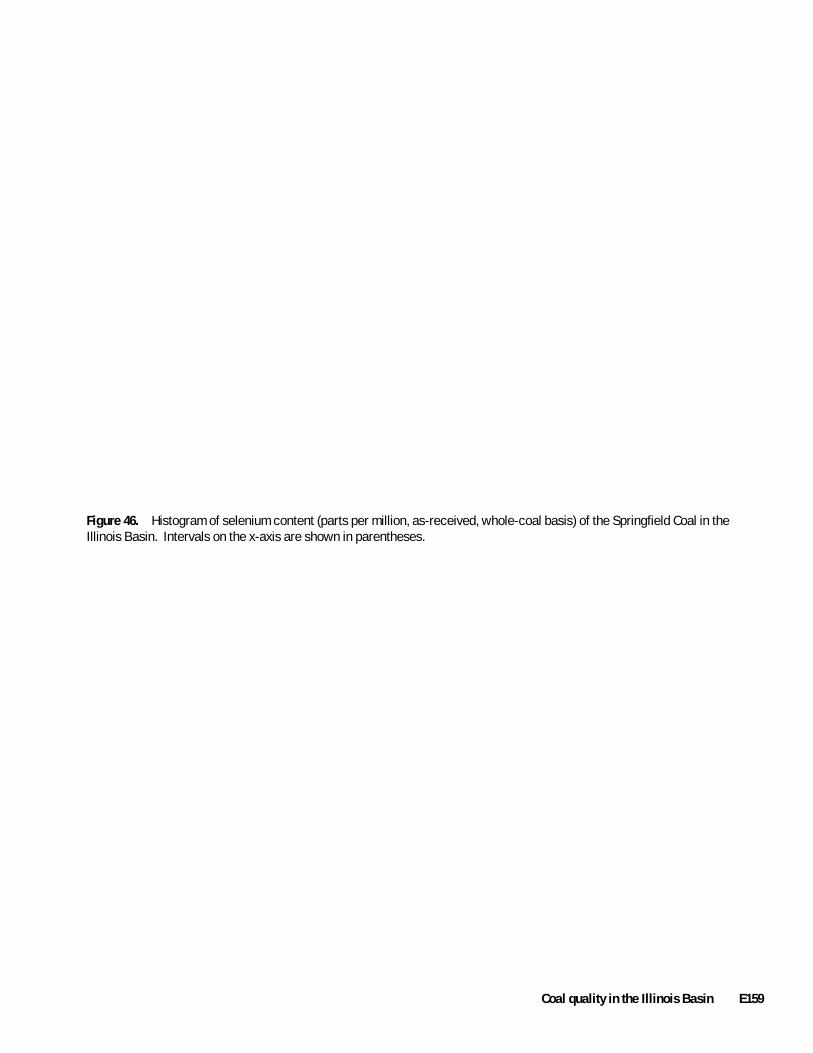
Figure 46. Histogram of selenium content (parts per million, as-received, whole-coal basis) of the Springfield Coal in the Illinois Basin. Intervals on the x-axis are shown in parentheses.
Coal quality in the Illinois Basin E159

Figure 47. Histogram of thorium content (parts per million, as-received, whole-coal basis) of the Springfield Coal in the Illinois Basin. Intervals on the x-axis are shown in parentheses.
E160 Resource Assessment of the Springfield, Herrin, Danville, and Baker Coals in the Illinois Basin

Figure 48. Histogram of uranium content (parts per million, as-received, whole-coal basis) of the Springfield Coal in the Illinois Basin. Intervals on the x-axis are shown in parentheses.
Coal quality in the Illinois Basin E161
Appendix 7. Graduated-symbol maps for ash yield, sulfur con-tent, calorific value, and elements of environmental concern for the Springfield, Herrin, and Danville-Baker Coals in the Illinois Basin.

Coal quality in the Illinois Basin
Figure 1. Graduated-symbol map for ash yield (percent, as-received basis) of the Danville-Baker Coals in the Illinois Basin. E163

E164Resource A
ssessment of the Springfield, H
errin, Danville, and B
aker Coals in the Illinois Basin
Figure 2. Graduated-symbol map for sulfur content (percent, as-received basis) of the Danville-Baker Coals in the Illinois Basin.

Coal quality in the Illinois Basin Figure 3. Graduated-symbol map for calorific values (Btu/lb, as-received basis) of the Danville-Baker Coals in the
Illinois Basin. E165

E166Resource A
ssessment of the Springfield, H
errin, Danville, and B
aker Coals in the Illinois Basin
Figure 4. Graduated-symbol map for antimony content (parts per million, as-received, whole-coal basis) of the Danville-Baker Coals in the Illinois Basin.

Coal quality in the Illinois Basin Figure 5. Graduated-symbol map for arsenic content (parts per million, as-received, whole-coal basis) of the
Danville-Baker Coals in the Illinois Basin. E167

E168Resource A
ssessment of the Springfield, H
errin, Danville, and B
aker Coals in the Illinois Basin
Figure 6. Graduated-symbol map for beryllium content (parts per million, as-received, whole-coal basis) of the Danville-Baker Coals in the Illinois Basin.

Coal quality in the Illinois Basin Figure 7. Graduated-symbol map for cadmium content (parts per million, as-received, whole-coal basis) of the
Danville-Baker Coals in the Illinois Basin. E169

E170Resource A
ssessment of the Springfield, H
errin, Danville, and B
aker Coals in the Illinois Basin
Figure 8. Graduated-symbol map for chromium content (parts per million, as-received, whole-coal basis) of the Danville-Baker Coals in the Illinois Basin.

Coal quality in the Illinois Basin Figure 9. Graduated-symbol map for cobalt content (parts per million, as-received, whole-coal basis) of the
Danville-Baker Coals in the Illinois Basin.
E171

E172Resource A
ssessment of the Springfield, H
errin, Danville, and B
aker Coals in the Illinois Basin
Figure 10. Graduated-symbol map for lead content (parts per million, as-received, whole-coal basis) of the Danville-Baker Coals in the Illinois Basin.

Coal quality in the Illinois Basin Figure 11. Graduated-symbol map for manganese content (parts per million, as-received, whole-coal basis) of the
Danville-Baker Coals in the Illinois Basin.
E173

E174Resource A
ssessment of the Springfield, H
errin, Danville, and B
aker Coals in the Illinois Basin
Figure 12. Graduated-symbol map for mercury content (parts per million, as-received, whole-coal basis) of the Danville-Baker Coals in the Illinois Basin.

Coal quality in the Illinois Basin Figure 13. Graduated-symbol map for nickel content (parts per million, as-received, whole-coal basis) of the
Danville-Baker Coals in the Illinois Basin. E175

E176Resource A
ssessment of the Springfield, H
errin, Danville, and B
aker Coals in the Illinois Basin
Figure 14. Graduated-symbol map for selenium content (parts per million, as-received, whole-coal basis) of the Danville-Baker Coals in the Illinois Basin.

Coal quality in the Illinois Basin Figure 15. Graduated-symbol map for thorium content (parts per million, as-received, whole-coal basis) of the Danville-Baker Coals in the
Illinois Basin.
E177

E178Resource A
ssessment of the Springfield, H
errin, Danville, and B
aker Coals in the Illinois Basin
Figure 16. Graduated-symbol map for uranium content (parts per million, as-received, whole-coal basis) of the Danville-Baker Coals in the Illinois Basin.

Coal quality in the Illinois Basin
Figure 17. Graduated-symbol map for ash yield (percent, as-received basis) of the Herrin Coal in the Illinois Basin.
E179

E180Resource A
ssessment of the Springfield, H
errin, Danville, and B
aker Coals in the Illinois Basin
Figure 18. Graduated-symbol map for sulfur content (percent, as-received basis) of the Herrin Coal in the Illinois Basin.

Coal quality in the Illinois Basin Figure 19. Graduated-symbol map for calorific values (Btu/lb, as-received basis) of the Herrin Coal in the
Illinois Basin. E181

E182Resource A
ssessment of the Springfield, H
errin, Danville, and B
aker Coals in the Illinois Basin
Figure 20. Graduated-symbol map for antimony content (parts per million, as-received, whole-coal basis) of the Herrin Coal in the Illinois Basin.

Coal quality in the Illinois Basin Figure 21. Graduated-symbol map for arsenic content (parts per million, as-received, whole-coal basis) of the
Herrin Coal in the Illinois Basin. E183

E184Resource A
ssessment of the Springfield, H
errin, Danville, and B
aker Coals in the Illinois Basin
Figure 22. Graduated-symbol map for beryllium content (parts per million, as-received, whole-coal basis) of the Herrin Coal in the Illinois Basin.

Coal quality in the Illinois Basin Figure 23. Graduated-symbol map for cadmium content (parts per million, as-received, whole-coal basis) of the Herrin
Coal in the Illinois Basin.
E185

E186Resource A
ssessment of the Springfield, H
errin, Danville, and B
aker Coals in the Illinois Basin
Figure 24. Graduated-symbol map for chromium content (parts per million, as-received, whole-coal basis) of the Herrin Coal in the Illinois Basin.

Coal quality in the Illinois Basin Figure 25. Graduated-symbol map for cobalt content (parts per million, as-received, whole-coal basis) of the
Herrin Coal in the Illinois Basin. E187

E188Resource A
ssessment of the Springfield, H
errin, Danville, and B
aker Coals in the Illinois Basin
Figure 26. Graduated-symbol map for lead content (parts per million, as-received, whole-coal basis) of the Herrin Coal in the Illinois Basin.

Coal quality in the Illinois Basin Figure 27. Graduated-symbol map for manganese content (parts per million, as-received, whole-coal basis) of the
Herrin Coal in the Illinois Basin.
E189

E190Resource A
ssessment of the Springfield, H
errin, Danville, and B
aker Coals in the Illinois Basin
Figure 28. Graduated-symbol map for mercury content (parts per million, as-received, whole-coal basis) of the Herrin Coal in the Illinois Basin.

Coal quality in the Illinois Basin Figure 29. Graduated-symbol map for nickel content (parts per million, as-received, whole-coal basis) of the
Herrin Coal in the Illinois Basin. E191

E192Resource A
ssessment of the Springfield, H
errin, Danville, and B
aker Coals in the Illinois Basin
Figure 30. Graduated-symbol map for selenium content (parts per million, as-received, whole-coal basis) of the Herrin Coal in the Illinois Basin.

Coal quality in the Illinois Basin Figure 31. Graduated-symbol map for thorium content (parts per million, as-received, whole-coal basis) of the
Herrin Coal in the Illinois Basin. E193

E194Resource A
ssessment of the Springfield, H
errin, Danville, and B
aker Coals in the Illinois Basin
Figure 32. Graduated-symbol map for uranium content (parts per million, as-received, whole-coal basis) of the Herrin Coal in the Illinois Basin.

Coal quality in the Illinois Basin Figure 33. Graduated-symbol map for ash yield (percent, as-received basis) of the Springfield Coal in the Illinois Basin.
E195

E196Resource A
ssessment of the Springfield, H
errin, Danville, and B
aker Coals in the Illinois Basin
Figure 34. Graduated-symbol map for sulfur content (percent, as-received basis) of the Springfield Coal in the Illinois Basin.

Coal quality in the Illinois Basin Figure 35. Graduated-symbol map for calorific values (Btu/lb, as-received basis) of the Springfield Coal in the
Illinois Basin.
E197

E198Resource A
ssessment of the Springfield, H
errin, Danville, and B
aker Coals in the Illinois Basin
Figure 36. Graduated-symbol map for antimony content (parts per million, as-received, whole-coal basis) of the Springfield Coal in the Illinois Basin.

Coal quality in the Illinois Basin Figure 37. Graduated-symbol map for arsenic content (parts per million, as-received, whole-coal basis) of the
Springfield Coal in the Illinois Basin.
E199

E200Resource A
ssessment of the Springfield, H
errin, Danville, and B
aker Coals in the Illinois Basin
Figure 38. Graduated-symbol map for beryllium content (parts per million, as-received, whole-coal basis) of the Springfield Coal in the Illinois Basin.

Coal quality in the Illinois Basin Figure 39. Graduated-symbol map for cadmium content (parts per million, as-received, whole-coal basis) of the
Springfield Coal in the Illinois Basin. E201

E202Resource A
ssessment of the Springfield, H
errin, Danville, and B
aker Coals in the Illinois Basin
Figure 40. Graduated-symbol map for chromium content (parts per million, as-received, whole-coal basis) of the Springfield Coal in the Illinois Basin.

Coal quality in the Illinois Basin Figure 41. Graduated-symbol map for cobalt content (parts per million, as-received, whole-coal basis) of the
Springfield Coal in the Illinois Basin. E203

E204Resource A
ssessment of the Springfield, H
errin, Danville, and B
aker Coals in the Illinois Basin
Figure 42. Graduated-symbol map for lead content (parts per million, as-received, whole-coal basis) of the Springfield Coal in the Illinois Basin.

Coal quality in the Illinois Basin Figure 43. Graduated-symbol map for manganese content (parts per million, as-received, whole-coal basis) of the
Springfield Coal in the Illinois Basin. E205

E206Resource A
ssessment of the Springfield, H
errin, Danville, and B
aker Coals in the Illinois Basin
Figure 44. Graduated-symbol map for mercury content (parts per million, as-received, whole-coal basis) of the Springfield Coal in the Illinois Basin.

Coal quality in the Illinois Basin Figure 45. Graduated-symbol map for nickel content (parts per million, as-received, whole-coal basis) of the
Springfield Coal in the Illinois Basin. E207

E208Resource A
ssessment of the Springfield, H
errin, Danville, and B
aker Coals in the Illinois Basin
Figure 46. Graduated-symbol map for selenium content (parts per million, as-received, whole-coal basis) of the Springfield Coal in the Illinois Basin.

Coal quality in the Illinois Basin Figure 47. Graduated-symbol map for thorium content (parts per million, as-received, whole-coal basis) of the
Springfield Coal in the Illinois Basin. E209

E210Resource A
ssessment of the Springfield, H
errin, Danville, and B
aker Coals in the Illinois Basin
Figure 48. Graduated-symbol map for uranium content (parts per million, as-received, whole-coal basis) of the Springfield Coal in the Illinois Basin.

Appendix 8. Explanation of chemical data columns in the U.S. Geological Survey, Indiana Geological Survey, Kentucky Geological Survey, and Illinois State Geological Survey coal database files created for the resource assessment of the Springfield, Herrin, Danville, and Baker Coals in the Illinois Basin.

Table 1. Explanation of chemical data columns in the U.S. Geological Survey’s chemical files created for the resource assessment of the Springfield, Herrin, Danville, and Baker Coals in the Illinois Basin.
[This is a simplified data dictionary showing Field Name, Type, and Description for all the columns in the ASCII files ilhechmu.txt, indachmu.txt, inspchmu.txt, incgchmu.txt, inrgchmu.txt, kyspchmu.txt, kydachmu.txt, kyhechmu.txt, kyrgchmu.txt, kycgchmu.txt, and uschmu.txt. These text files and this file were created by R.H. Affolter ([email protected]) of the U.S. Geological Survey from the USGS USCHEM database and were used to create the ArcView chemical data shapefiles for the assessed Springfield, Herrin, Danville, and Baker Coals, and the nonassessed Carbondale Group or Formation, Raccoon Creek Group, and McLeansboro Group coals in the Illinois Basin. Column definitions were modified from Bragg and others, 1998. All columns_Q in these files are used for the qualified data values and are indicated by L (less than), B (not determined), N (not detected), or G (greater than). For detailed descriptions of U.S. Geological Survey analytical methods, see Swanson and Huffman (1976), Baedecker (1987), and Golightly and Simon (1989), or see the related metadata files for USGS chemical data. For limitations of the coal quality, data see Finkelman and others (1994). All columns except DLAT and DLONG are in text to preserve significant figures.]
Field Name Type Description
SAMPID TEXT Analysis Identification Number.
STATE TEXT Name of State where sample was collected.
COUNTY TEXT Name of county in State where sample was collected.
DLAT REAL Decimal Latitude coordinate for point source location of coal sample.
DLONG REAL Decimal Longitude coordinate for point source location of coal sample.
CFORMATN TEXT Formation Name—Stratigraphic formation name specified by the collector of the sample.
CGROUP TEXT Group Name—Stratigraphic group name specified by the collector of the sample.
CBED TEXT Bed Name—Stratigraphic bed name specified by the collector of the sample.
DEPTH TEXT Depth from the surface of the earth to the top of the sample if the sample is part of a drill core. If samples are not drill cores, but samples are benched, then depth is a measure from the top of the uppermost bench to the top of the next sample in the benched series. (Depth is measured in inches).
SAMPTHK TEXT Thickness of the sample, measured in inches.
COMMENTS TEXT Used as a comment field to describe the mine name, the drill hole identified, or other miscellaneous information about the sample.
SYSTEM TEXT System designates a fundamental unit of the sample's geologic age.
POINTID TEXT The field number assigned by the collector or submitter of the sample.
MOISTR TEXT (as-received basis) Moisture content in percent as determined by ASTM method D-3173.
E212 Resource Assessment of the Springfield, Herrin, Danville, and Baker Coals in the Illinois Basin

Table 1. Explanation of chemical data columns in the U.S. Geological Survey’s chemical files created for the resource assessment of the Springfield, Herrin, Danville, and Baker Coals in the Illinois Basin—Continued.
Field Name Type Description
VOLMAT TEXT (as-received basis) Volatile matter content in percent as determined by ASTM method D-3175.
FIXEDC TEXT (as-received basis) Fixed Carbon content in percent as determined by ASTM method D-3172.
STDASH TEXT (as-received basis) Ash yield in percent as determined by ASTM method D-3174 (ash obtained at 750 degrees Centigrade).
HYDRGN TEXT (as-received basis) Hydrogen content in percent as determined by ASTM method D-3178.
CARBON TEXT (as-received basis) Carbon content in percent as determined by ASTM method D-3178.
NITRGN TEXT (as-received basis) Nitrogen content in percent as determined by ASTM method D-3179.
OXYGEN TEXT (as-received basis) Oxygen content in percent as determined by ASTM method D-3176.
SULFUR TEXT (as-received basis) Sulfur content in percent as determined by ASTM method D-3177.
BTU TEXT (as-received basis) Gross calorific value of the coal sample expressed in British Thermal Units (BTU/lb) as determined by ASTM method D-2015.
SLFATE TEXT (as-received basis) Sulfate content in percent as determined by ASTM method D-2492.
SLFPYR TEXT (as-received basis) Pyritic Sulfur content in percent as determined by ASTM method D-2492.
SLFORG TEXT (as-received basis) Organic Sulfur content in percent as determined by ASTM method D-2492.
ASHDEF TEXT (as-received basis) Ash Deformation temperature in degrees Fahrenheit as determined by ASTM method D1857 in reducing atmosphere.
ASHSOF TEXT (as-received basis) Ash Softening temperature in degrees Fahrenheit as determined by ASTM method D1857 in reducing atmosphere.
ASHFLD TEXT (as-received basis) Ash Fluid temperature in degrees Fahrenheit as determined by ASTM method D1857 in reducing atmosphere.
FRESWL TEXT (as-received basis) Free-Swelling index as determined by ASTM method D-720.
ADLOSS TEXT (as-received basis) Air-Dried loss content in percent as determined by ASTM method D-2013.
GSASH TEXT Ash yield in percent as determined by USGS laboratories (ash obtained at 525 degrees Centigrade).
Coal quality in the Illinois Basin E213

Table 1. Explanation of chemical data columns in the U.S. Geological Survey’s chemical files created for the resource assessment of the Springfield, Herrin, Danville, and Baker Coals in the Illinois Basin—Continued.
Field Name Type Description
SI_E TEXT (as-received, whole-coal basis) Silicon (Si) content in percent converted from content as determined on coal ash by USGS laboratories using X-ray fluorescence analysis (ash obtained at 525 degrees Centigrade)—May be converted from SiO2 content in percent which was determined by the same method.
AL_E TEXT (as-received, whole-coal basis) Aluminum (Al) content in percent converted from content as determined on coal ash by USGS laboratories using X-ray fluorescence analysis (ash obtained at 525 degrees Centigrade)—May be converted from Al2O3
content in percent which was determined by the same method.
CA_E TEXT (as-received, whole-coal basis) Calcium (Ca) content in percent converted from content as determined on coal ash by USGS laboratories using X-ray fluorescence analysis (ash obtained at 525 degrees Centigrade)—May be converted from CaO content in percent which was determined by the same method.
MG_E TEXT (as-received, whole-coal basis) Magnesium (Mg) content in percent converted from content as determined on coal ash by USGS laboratories using wet chemistry analysis (atomic absorption: ash obtained at 525 degrees Centigrade)—May be converted from MgO content in percent which was determined by the same method.
NA_E TEXT (as-received, whole-coal basis) Sodium (Na) content in percent converted from content as determined on coal ash by USGS laboratories using wet chemistry analysis (atomic absorption: ash obtained at 525 degrees Centigrade)—May be converted from Na2O content in percent which was determined by the same method.
K_E TEXT (as-received, whole-coal basis) Potassium (K) content in percent converted from content as determined on coal ash by USGS laboratories using X-ray fluorescence analysis (ash obtained at 525 degrees Centigrade)—May be converted from K2O content in percent which was determined by the same method.
FE_E TEXT (as-received, whole-coal basis) Iron (Fe) content in percent converted from content as determined on coal ash by USGS laboratories using X-ray fluorescence analysis (ash obtained at 525 degrees Centigrade)—May be converted from Fe2O3 content in percent which was determined by the same method.
TI_E TEXT (as-received, whole-coal basis) Titanium (Ti) content in percent converted from content as determined on coal ash by USGS laboratories using X-ray fluorescence analysis (ash obtained at 525 degrees Centigrade)—May be converted from TiO2 content in percent which was determined by the same method.
AS_E TEXT (as-received, whole-coal basis) Arsenic (As) content in parts per million as determined on whole-coal by USGS laboratories using either wet chemistry analysis or Instrumental Neutron Activation Analysis (INAA).
B_E TEXT (as-received, whole-coal basis) Boron (B) content in parts per million converted from content determined on coal ash by USGS laboratories using either 6-Step emission spectrographic analysis for older samples or automatic plate reading computer-assisted emission spectrographic analysis (ash obtained at 525 degrees Centigrade).
E214 Resource Assessment of the Springfield, Herrin, Danville, and Baker Coals in the Illinois Basin

Table 1. Explanation of chemical data columns in the U.S. Geological Survey’s chemical files created for the resource assessment of the Springfield, Herrin, Danville, and Baker Coals in the Illinois Basin—Continued.
Field Name Type Description
BA_E TEXT (as-received, whole-coal basis) Barium (Ba) content in parts per million converted from content determined on coal ash by USGS laboratories using either 6-Step emission spectrographic analysis for older samples or automatic plate reading computer-assisted emission spectrographic analysis (ash obtained at 525 degrees Centigrade).
BE_E TEXT (as-received, whole-coal basis) Beryllium (Be) content in parts per million converted from content determined on coal ash by USGS laboratories using either 6-Step emission spectrographic analysis for older samples or automatic plate reading computer-assisted emission spectrographic analysis (ash obtained at 525 degrees Centigrade).
CD_E TEXT (as-received, whole-coal basis) Cadmium (Cd) content in parts per million converted from content determined on coal ash by USGS laboratories using wet chemistry analysis (atomic absorption—ash obtained at 525 degrees Centigrade).
CO_E TEXT (as-received, whole-coal basis) Cobalt (Co) content in parts per million converted from content determined on coal ash by USGS laboratories using either semi-quantitative 6-Step emission spectrographic analysis or automatic plate reading computer-assisted emission spectrographic analysis (ash obtained at 525 degrees Centigrade) or on a whole-coal basis using Instrumental Neutron Activation Analysis (INAA).
CR_E TEXT (as-received, whole-coal basis) Chromium (Cr) content in parts per million converted from content determined on coal ash by USGS laboratories using either semi-quantitative 6-Step emission spectrographic analysis for older samples or automatic plate reading computer-assisted emission spectrographic analysis (ash obtained at 525 degrees Centigrade) or on a whole-coal basis using Instrumental Neutron Activation Analysis.
CU_E TEXT (as-received, whole-coal basis) Copper (Cu) content in parts per million converted from content determined on coal ash by USGS laboratories using wet chemistry analysis (atomic absorption—ash obtained at 525 degrees Centigrade).
F_E TEXT (as-received, whole-coal basis) Fluorine (F) content in parts per million as determined on whole-coal by USGS laboratories using wet chemistry analysis (ion-selective electrode).
GA_E TEXT (as-received, whole-coal basis) Gallium (Ga) content in parts per million converted from content determined on coal ash by USGS laboratories using either 6-Step emission spectrographic analysis for older samples or automatic plate reading computer-assisted emission spectrographic analysis (ash obtained at 525 degrees Centigrade).
GE_E TEXT (as-received, whole-coal basis) Germanium (Ge) content in parts per million converted from content determined on coal ash by USGS laboratories using either 6-Step emission spectrographic analysis for older samples or automatic plate reading computer-assisted emission spectrographic analysis (ash obtained at 525 degrees Centigrade).
Coal quality in the Illinois Basin E215

Table 1. Explanation of chemical data columns in the U.S. Geological Survey’s chemical files created for the resource assessment of the Springfield, Herrin, Danville, and Baker Coals in the Illinois Basin—Continued.
Field Name Type Description
HG_E TEXT (as-received, whole-coal basis) Mercury (Hg) content in parts per million as determined on whole-coal by USGS laboratories using wet chemistry analysis (cold-vapor atomic absorption).
LA_E TEXT (as-received, whole-coal basis) Lanthanum (La) content in parts per million converted from content determined on coal ash by USGS laboratories using either 6-Step emission spectrographic analysis for older samples or automatic plate reading computer-assisted emission spectrographic analysis (ash obtained at 525 degrees Centigrade) or on a whole-coal basis using Instrumental Neutron Activation Analysis (INAA).
LI_E TEXT (as-received, whole-coal basis) Lithium (Li) content in parts per million converted from content determined on coal ash by USGS laboratories using wet chemistry analysis (atomic absorption—ash obtained at 525 degrees Centigrade).
MN_E TEXT (as-received, whole-coal basis) Manganese (Mn) content in parts per million converted from content determined on coal ash by USGS laboratories using either 6-Step emission spectrographic analysis for older samples or automatic plate reading computer-assisted emission spectrographic analysis (ash obtained at 525 degrees Centigrade) and later using wet chemistry analysis (atomic absorption on the ash).
MO_E TEXT (as-received, whole-coal basis) Molybdenum (Mo) content in parts per million converted from content determined on coal ash by USGS laboratories using either 6-Step emission spectrographic analysis for older samples or automatic plate reading computer-assisted emission spectrographic analysis (ash obtained at 525 degrees Centrigrade).
NB_E TEXT (as-received, whole-coal basis) Niobium (Nb) content in parts per million converted from content determined on coal ash by USGS laboratories using either 6-Step emission spectrographic analysis for older samples or automatic plate reading computer-assisted emission spectrographic analysis (ash obtained at 525 degrees Centrigrade).
NI_E TEXT (as-received, whole-coal basis) Nickel (Ni) content in parts per million converted from content determined on coal ash by USGS laboratories using either 6-Step emission spectrographic analysis for older samples or automatic plate reading computer-assisted emission spectrographic analysis (ash obtained at 525 degrees Centrigrade).
P_E TEXT (as-received, whole-coal basis) Phosphorus (P) content in parts per million as determined on the coal ash or whole-coal by USGS laboratories using X-ray fluorescence analysis (ash obtained at 525 degrees Centigrade)—May be converted from P2O5 content in percent which was determined by the same method.
PB_E TEXT (as-received, whole-coal basis) Lead (Pb) content in parts per million converted from content determined on coal ash by USGS laboratories using wet chemistry analysis (atomic absorption—ash obtained at 525 degrees Centigrade).
SB_E TEXT (as-received, whole-coal basis) Antimony (Sb) content in parts per million as determined on whole-coal by USGS laboratories using wet chemistry analysis (Rhodamine B) or on Instrumental Neutron Activation Analysis (INAA).
E216 Resource Assessment of the Springfield, Herrin, Danville, and Baker Coals in the Illinois Basin

Table 1. Explanation of chemical data columns in the U.S. Geological Survey’s chemical files created for the resource assessment of the Springfield, Herrin, Danville, and Baker Coals in the Illinois Basin—Continued.
Field Name Type Description
SC_E TEXT (as-received, whole-coal basis) Scandium (Sc) content in parts per million converted from content determined on coal ash by USGS laboratories using either 6-Step emission spectrographic analysis for older samples or automatic plate reading computer-assisted emission spectrographic analysis (ash obtained at 525 degrees Centigrade) or on a whole-coal basis using Instrumental Neutron Activation Analysis (INAA).
SE_E TEXT (as-received, whole-coal basis) Selenium (Se) content in parts per million as determined on whole-coal basis by USGS laboratories using Xray-fluorescence or on a whole-coal basis using Instrumental Neutron Activation Analysis (INAA).
SR_E TEXT (as-received, whole-coal basis) Strontium (Sr) content in parts per million converted from content determined on coal ash by USGS laboratories using either 6-Step emission spectrographic analysis for older samples or automatic plate reading computer-assisted emission spectrographic analysis (ash obtained at 525 degrees Centigrade).
TH_E TEXT (as-received, whole-coal basis) Thorium (Th) content in parts per million as determined on whole-coal basis by USGS laboratories using Delayed Neutron Analysis (DNA) for older samples and Instrumental Neutron Activation analysis (INAA).
U_E TEXT (as-received, whole-coal basis) Uranium (U) content in parts per million as determined on whole-coal basis by USGS laboratories using Delayed Neutron Analysis (DNA).
V_E TEXT (as-received, whole-coal basis) Vanadium (V) content in parts per million converted from content determined on coal ash by USGS laboratories using either 6-Step emission spectrographic analysis for older samples or automatic plate reading computer-assisted emission spectrographic analysis (ash obtained at 525 degrees Centigrade).
Y_E TEXT (as-received, whole-coal basis) Yttrium (Y) content in parts per million converted from content determined on coal ash by USGS laboratories using either 6-Step emission spectrographic analysis for older samples or automatic plate reading computer-assisted emission spectrographic analysis (ash obtained at 525 degrees Centigrade).
YB_E TEXT (as-received, whole-coal basis) Ytterbium (Yb) content in parts per million converted from content determined on coal ash by USGS laboratories using either 6-Step emission spectrographic analysis for older samples or automatic plate reading computer-assisted emission spectrographic analysis (ash obtained at 525 degrees Centigrade) or on a whole-coal basis using Instrumental Neutron Activation Analysis (INAA).
ZN_E TEXT (as-received, whole-coal basis) Zinc (Zn) content in parts per million converted from content determined on coal ash by USGS laboratories using wet chemistry analysis (atomic absorption ash obtained at 525 degrees Centigrade).
ZR_E TEXT (as-received, whole-coal basis) Zirconium (Zr) content in parts per million converted from content determined on coal ash by USGS laboratories using either 6-Step emission spectrographic analysis for older samples or automatic plate reading omputer-assisted emission spectrographic analysis (ash obtained at 525 degrees Centigrade).
Coal quality in the Illinois Basin E217

Table 2. Explanation of chemical data columns in the Indiana coal analysis database files created for the resource assessment of the Springfield, Herrin, Danville, and Baker Coals in the Illinois Basin.
[This is a simplified data dictionary showing Field Name, Value, and Description for all the columns in the ASCII files indachms.txt, inspchms.txt, incgchms.txt, inrgchms.txt, and inchms.txt. These text files and this file were created by R.H. Affolter ([email protected]) of the U.S. Geological Survey from “The Indiana coal analysis database; Computer database I,” 1992, by Walter A. Hasenmueller and Louis V. Miller, and were used to create the ArcView chemical data shape files of the Springfield, Danville, Carbondale Group, and Raccoon Creek Group coals for the Illinois Basin resource assessment. The purpose of this file is to briefly explain the abbreviations used in the Indiana coal analysis database published by the Indiana Geological Survey (IGS). Each record in this file represents a coal sample and comprises the variables de-fined below in the order they appear in the database. For detailed information on field names, values, and descriptions see Hasenmueller ([email protected]) and Miller (1992). For additional information see the related metadata files for the Indiana chemical data. All columns except Lat-dd and Long-dd are in text to preserve the original numbers.]
Field Name Type Description
Smpnme Text Coal sample number
Cnty Text County name
Cvltwp Text Civil township name
Clctr Text Collector(s) of coal and associated samples and the recorder(s) of sample-site description including the sample-site stratigraphic section.
Smpsrc Text Source of the sample.
Smptyp Text Sample type
Moist Text Visual estimate of the moisture condition of the sample made when the sample was collected.
Cond Text Weathering condition of the sampled coal. Sample can be assumed to be freshly exposed coal when this field is blank. "Weathered" indicates that the coal had a weathered appearance.
Strnme Text Stratigraphic name for the sampled coal bed.
Altnme Text Alternate names for the sampled coal bed, or commonly used unofficial names for a coal bed.
Date Text Date sample was collected and recorded in the form MM/DD/YY where MM = month, DD = day, and YY last two digits of year.
Wdth Text Width of channel cut or diameter of drill core in decimal feet.
Dpth Text Depth of channel cut in decimal feet.
Twp Text Township number followed by "N" for north and "S" for south of Buckingham’s Base Line.
E218 Resource Assessment of the Springfield, Herrin, Danville, and Baker Coals in the Illinois Basin

Table 2. Explanation of chemical data columns in the Indiana coal analysis database files created for the resource assessment of the Springfield, Herrin, Danville, and Baker Coals in the Illinois Basin—Continued.
Field Name Type Description
Rng Text Range number followed by "W" or "E" to designate west or east of the Second Principal Meridian.
Sec Text Section number or equivalent. Three alpha characters followed by a "." indicate the type of land subdivision, which is followed by the two- or three-digit integer number of that subdivision.
Qtr Text Subdivisions of sections. Abbreviations for quarter, half, and center are separated by commas and listed in the normal order, i.e., smallest to the largest quarter.
Lat-dd Real Latitude in decimal degrees.
Long-dd Real Longitude in decimal degrees.
Spe Text State plane easting coordinate.
Spn Text State plane northing coordinate.
Utme Text Universal transverse Mercator easting coordinate.
Utmn Text Universal transverse Mercator northing coordinate.
Quad Text U.S. Geological Survey 71/2-minute quadrangle map name.
Comp Text Name of the company operating the mine from which a sample was collected or the name of the company operating the drill rig that cut the core from which the sample was collected.
Mine Text Name of the mine or drill hole from which a sample was collected.
Cmnt Text Comment field.
Analdate Text Date analysis was completed and recorded in the form MM/DD/YY, where MM = month, DD = date, and YY = last two digits of year.
Analyst Text Chemist who analyzed the coal sample.
Adl Text Air dried loss.
Moar Text Moisture on the as-received basis.
Ashar Text Ash on the as-received basis.
Volar Text Volatile matter on the as-received basis.
Fixar Text Fixed carbon on the as-received basis.
Car Text Ultimate carbon on the as-received basis.
Coal quality in the Illinois Basin E219

Table 2. Explanation of chemical data columns in the Indiana coal analysis database files created for the resource assessment of the Springfield, Herrin, Danville, and Baker Coals in the Illinois Basin—Continued.
Field Name Type Description
Har Text
Nar Text
Oar Text
Sar Text
Btuar Text
S04ar Text
Pyrar Text
Orgar Text
Ashmf Text
Volmf Text
Fixmf Text
Cmf Text
Hmf Text
Nmf Text
Omf Text
Smf Text
Btumf Text
S04mf Text
Pyrmf Text
Orgmf Text
Volmaf Text
Fixmaf Text
Cmaf Text
Hmaf Text
Nmaf Text
Omaf Text
Smaf Text
Ultimate hydrogen on the as-received basis.
Ultimate nitrogen on the as-received basis.
Ultimate oxygen on the as-received basis.
Ultimate sulfur on the as-received basis.
Heating value on the as-received basis (Btu/Ib).
Sulfate sulfur on the as-received basis.
Pyritic sulfur on the as-received basis.
Organic sulfur on the as-received basis.
Ash on the moisture-free basis.
Volatile matter on the moisture-free basis.
Fixed carbon on the moisture-free basis.
Ultimate carbon on the moisture-free basis.
Ultimate hydrogen on the moisture-free basis.
Ultimate nitrogen on the moisture-free basis.
Ultimate oxygen on the moisture-free basis.
Ultimate sulfur on the moisture-free basis.
Heating value on the moisture-free basis (Btu/Ib).
Sulfate sulfur on the moisture-free basis.
Pyritic sulfur on the moisture-free basis.
Organic sulfur on the moisture-free basis.
Volatile matter on the moisture and ash-free basis.
Fixed carbon on the moisture and ash-free basis.
Ultimate carbon on the moisture and ash-free basis.
Ultimate hydrogen on the moisture and ash-free basis.
Ultimate nitrogen on the moisture and ash-free basis.
Ultimate oxygen on the moisture and ash-free basis.
Ultimate sulfur on the moisture and ash-free basis.
E220 Resource Assessment of the Springfield, Herrin, Danville, and Baker Coals in the Illinois Basin

Table 2. Explanation of chemical data columns in the Indiana coal analysis database files created for the resource assessment of the Springfield, Herrin, Danville, and Baker Coals in the Illinois Basin—Continued.
Field Name Type Description
Btumaf Text Heating value on the moisture and ash-free basis (Btu/Ib).
S04maf Text Sulfate sulfur on the moisture and ash-free basis.
Pyrmaf Text Pyritic sulfur on the moisture and ash-free basis.
Orgmaf Text Organic sulfur on the moisture and ash-free basis.
Agi Text Agglomerating index.
Id Text Initial deformation temperature in the fusibility of coal ash test. The temperature in degrees Fahrenheit at which the first rounding of the apex of the ash cone occurs in a reducing atmosphere.
Id + Text A plus sign in this field indicates that the sample had not yet undergone initial deformation at the temperature recorded in the Id field. This field is blank when the Id temperature represents a precise measurement.
Heqw Text Height-equals-width temperature in the fusibility of coal-ash test. The temperature in degrees Fahrenheit at which the height of the ash cone equals its width in a reducing atmosphere.
Heqw + Text A plus sign in this field indicates that the sample had not yet reached the height-equals-width condition at the temperature recorded in the Heqw field. This field is blank when the Heqw temperature represents a precise measurement.
Heqhw Text Height equals one-half width temperature in the fusibility of coal-ash test. Temperature in degrees Fahrenheit at which height of ash cone equals one-half the width in a reducing atmosphere.
Heqhw+ Text A plus sign in the field indicates that the sample had not yet reached the height-equals-half width condition at the temperature recorded in the Heqhw field. This field is blank when the Heqhw temperature represents a precise measurement.
Fluid Text Fluid temperature in the fusibility of coal-ash test. Temperature in degrees Fahrenheit at which ash becomes fluid in a reducing atmosphere.
Fluid+ Text A plus sign in this field indicates that the sample had not yet reached a fluid condition at the temperature recorded in the Fluid field. This field is blank when the Fluid temperature represents a precise measurement.
Coal quality in the Illinois Basin E221

Table 3. Explanation of chemical data columns in the Kentucky coal chemistry database files created for the resource assessment of the Springfield, Herrin, Danville, and Baker Coals in the Illinois Basin.
[This is a simplified data dictionary showing Field Name, Type, and Description for all the columns in the ASCII files kyspchms.txt, kyhechms.txt, kydachms.txt, kycgchms.txt, kyrgchms.txt, kymgchms.txt, and kychms.txt. These text files and this file were created by R.H. Affolter ([email protected]) of the U.S. Geological Survey from selected parts of several files that were received from Cortland Eble ([email protected]) of the Kentucky Geological Survey and were used to create the ArcView chemical data shapefiles of the Springfield, Baker, Herrin, Carbondale Formation, Raccoon Creek Group, and the McLeansboro Group coals for the Illinois Basin resource assessment. For additional information, see the related metadata files for the Kentucky chemical data. Currently, there is no information on published reports detailing the analytical method used for this Kentucky data. For additional information about analytical methodology, contact Cortland Eble (KGS) or see the related metadata files for Kentucky chemical data. All columns except NORTH_LATITUDE and WEST_LONGITUDE are in text to preserve the original numbers.]
Field Name Type Description
FOREIGN_LAB_ID TEXT Laboratory ID
ANALYZING_LAB TEXT Name of laboratory
ANALYSIS_NAME TEXT Type of analysis
ANALYSIS_TYPE TEXT Portion of bed analyzed
ANALYSIS_NUMBER TEXT Analysis number
COAL_NUMBER TEXT Coal number—Kentucky coals are arranged by group with the first 3 numbers representing the group and the last 3 digits reflecting the named coal that was collected. Any code with an XXX199 or XXX999 means the coal zone was identified, but not the individual coal name.
COAL_NAME TEXT Coal name
NORTH_LATITUDE TEXT Decimal degrees north latitude
WEST_LONGITUDE TEXT Decimal degrees west longitude
RESERVE_DISTRICT TEXT Reserve district
COUNTY_NAME TEXT County name
QUADRANGLE_NAME TEXT 7.5 minute quadrangle name
TOTAL_COAL TEXT Total coal thickness in inches
TOTAL_PARTING TEXT Total parting thickness in inches
COAL_ELEVATION TEXT Elevation of coal in feet
Si_wc TEXT (dry, whole-coal basis) silicon content in percent converted from SiO2 content in percent.
Al_wc TEXT (dry, whole-coal basis) aluminum content in percent converted from Al2O3 content in percent.
E222 Resource Assessment of the Springfield, Herrin, Danville, and Baker Coals in the Illinois Basin

Table 3. Explanation of chemical data columns in the Kentucky coal chemistry database files created for the resource assessment of the Springfield, Herrin, Danville, and Baker Coals in the Illinois Basin—Continued.
Field Name Type Description
Ca_wc TEXT
Na_wc TEXT
Mg_wc TEXT
Fe_wc TEXT
K_wc TEXT
Ti_wc TEXT
P_wc TEXT
As_wc TEXT
Be_wc TEXT
Cd_wc TEXT
Co_wc TEXT
Cr_wc TEXT
Hg_wc TEXT
Mn_wc TEXT
Ni_wc TEXT
Pb_wc TEXT
Sb_wc TEXT
(dry, whole-coal basis) calcium content in percent converted from CaO content in percent.
(dry, whole-coal basis) sodium content in percent converted from Na2O content in percent.
(dry, whole-coal basis) magnesium content in percent converted from MgO content in percent.
(dry, whole-coal basis) iron content in percent converted from Fe2O3 content in percent.
(dry, whole-coal basis) potassium content in percent converted from K2O content in percent.
(dry, whole-coal basis) titanium content in percent converted from TiO2 content in percent.
(dry, whole-coal basis) phosphorous content in parts per million converted from P2O5 content in percent.
(dry, whole-coal basis) arsenic content in parts per million
(dry, whole-coal basis) beryllium content in parts per million
(dry, whole-coal basis) cadmium content in parts per million
(dry, whole-coal basis) cobalt content in parts per million
(dry, whole-coal basis) chromium content in parts per million
(dry, whole-coal basis) mercury content in parts per million
(dry, whole-coal basis) manganese content in parts per million
(dry, whole-coal basis) nickel content in parts per million
(dry, whole-coal basis) lead content in parts per million
(dry, whole-coal basis) antimony content in parts per million
Coal quality in the Illinois Basin E223

Table 3. Explanation of chemical data columns in the Kentucky coal chemistry database files created for the resource assessment of the Springfield, Herrin, Danville, and Baker Coals in the Illinois Basin—Continued.
Field Name Type Description
Se_wc TEXT (dry, whole-coal basis) selenium content in parts per million
Th_wc TEXT (dry, whole-coal basis) thorium content in parts per million
U_wc TEXT (dry, whole-coal basis) uranium content in parts per million
TOTAL_MOISTURE TEXT (as-received basis) total moisture in percent
DRY_ASH TEXT (dry basis) ash yield in percent
DRY_VOLATILE_MATTER TEXT (dry basis) volatile matter content in percent
DRY_FIXED_CARBON TEXT (dry basis) fixed carbon content in percent
DRY_TOTAL_SULFUR TEXT (dry basis) total sulfur content in percent
DRY_COMPLIANCE TEXT Compliance sulfur is calculated by the following formula: (% total S *19,500) / Calorific Value in BTU/lb. The resulting number is in lbs S02 / MM
DRY_BTU TEXT (dry basis) Gross calorific value of the coal sample expressed in British Thermal Units (BTU/lb)
DRY_CARBON TEXT (dry basis) carbon content in percent
DRY_HYDROGEN TEXT (dry basis) hydrogen content in percent
DRY_NITROGEN TEXT (dry basis) nitrogen content in percent
DRY_OXYGEN TEXT (dry basis) oxygen content in percent
E224 Resource Assessment of the Springfield, Herrin, Danville, and Baker Coals in the Illinois Basin
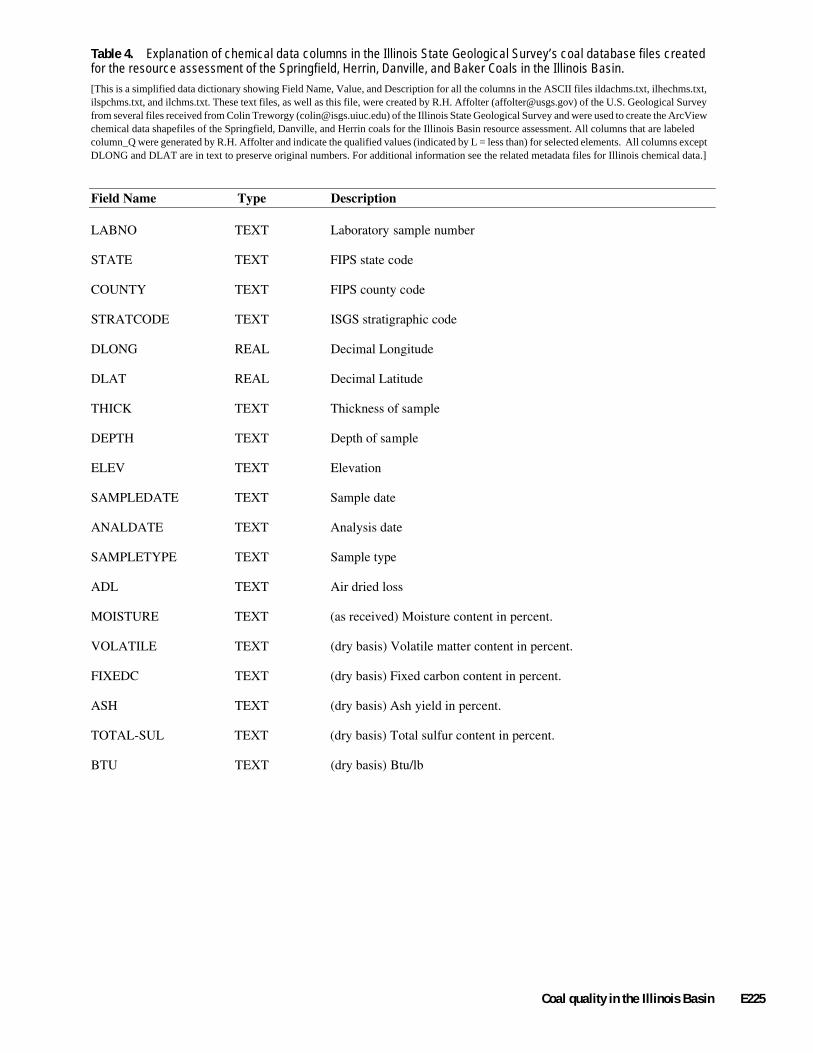
Table 4. Explanation of chemical data columns in the Illinois State Geological Survey’s coal database files created for the resource assessment of the Springfield, Herrin, Danville, and Baker Coals in the Illinois Basin. [This is a simplified data dictionary showing Field Name, Value, and Description for all the columns in the ASCII files ildachms.txt, ilhechms.txt, ilspchms.txt, and ilchms.txt. These text files, as well as this file, were created by R.H. Affolter ([email protected]) of the U.S. Geological Survey from several files received from Colin Treworgy ([email protected]) of the Illinois State Geological Survey and were used to create the ArcView chemical data shapefiles of the Springfield, Danville, and Herrin coals for the Illinois Basin resource assessment. All columns that are labeled column_Q were generated by R.H. Affolter and indicate the qualified values (indicated by L = less than) for selected elements. All columns except DLONG and DLAT are in text to preserve original numbers. For additional information see the related metadata files for Illinois chemical data.]
Field Name Type Description
LABNO TEXT Laboratory sample number
STATE TEXT FIPS state code
COUNTY TEXT FIPS county code
STRATCODE TEXT ISGS stratigraphic code
DLONG REAL Decimal Longitude
DLAT REAL Decimal Latitude
THICK TEXT Thickness of sample
DEPTH TEXT Depth of sample
ELEV TEXT Elevation
SAMPLEDATE TEXT Sample date
ANALDATE TEXT Analysis date
SAMPLETYPE TEXT Sample type
ADL TEXT Air dried loss
MOISTURE TEXT (as received) Moisture content in percent.
VOLATILE TEXT (dry basis) Volatile matter content in percent.
FIXEDC TEXT (dry basis) Fixed carbon content in percent.
ASH TEXT (dry basis) Ash yield in percent.
TOTAL-SUL TEXT (dry basis) Total sulfur content in percent.
BTU TEXT (dry basis) Btu/lb
Coal quality in the Illinois Basin E225

Table 4. Explanation of chemical data columns in the Illinois State Geological Survey’s coal database files created for the resource assessment of the Springfield, Herrin, Danville, and Baker Coals in the Illinois Basin— Continued.
Field Name Type Description
CARBON TEXT
HYDROGEN TEXT
NITROGEN TEXT
OXYGEN TEXT
ORGANIC-SUL TEXT
PYRITIC-SUL TEXT
SULFATE-SUL TEXT
FSI TEXT
TOT-CHLOR TEXT
AFUSION-INIT TEXT
AFUSION-SOFT TEXT
AFUSION-HEMI TEXT
AFUSION-FLUID TEXT
EQM TEXT
COMMENT TEXT
TYPE TEXT
MINE TEXT
SI TEXT
AL TEXT
FE TEXT
MG TEXT
CA TEXT
NA TEXT
(dry basis) Carbon content in percent.
(dry basis) Hydrogen content in percent.
(dry basis) Nitrogen content in percent.
(dry basis) Oxygen content in percent.
(dry basis) Organic sulfur content in percent.
(dry basis) Pyritic sulfur content in percent.
(dry basis) Sulfate sulfur content in percent.
Free swelling index
(dry basis) Total chlorine content in percent.
(dry basis) Initial ash fusion temperature in degrees Fahrenheit.
(dry basis) softening temperature in degrees Fahrenheit.
(dry basis) Hemi ash fusion temperature in degrees Fahrenheit.
(dry basis) Fluid ash fusion temperature in degrees Fahrenheit.
Equilibrium moisture
Comments
Type of sample
Mine name
(dry, whole-coal basis) Silicon content in percent converted from Silicon content in parts per million.
(dry, whole-coal basis) Aluminum content in percent. converted from Aluminum content in parts per million.
(dry, whole-coal basis) Iron content in percent converted from Iron content in parts per million.
(dry, whole-coal basis) Magnesium content in percent converted from Magnesium content in parts per million.
(dry, whole-coal basis) Calcium content in percent converted from Calcium content in parts per million.
(dry, whole-coal basis) Sodium content in percent converted from Sodium content in parts per million.
E226 Resource Assessment of the Springfield, Herrin, Danville, and Baker Coals in the Illinois Basin

Table 4. Explanation of chemical data columns in the Illinois State Geological Survey’s coal database files created for the resource assessment of the Springfield, Herrin, Danville, and Baker Coals in the Illinois Basin—Continued.
Field Name Type Description
K TEXT (dry, whole-coal basis) Potassium content in percent converted from Potassium content in parts per million.
TI TEXT (dry, whole-coal basis) Titanium content in percent converted from Titanium content in parts per million.
P TEXT (dry, whole-coal basis) Phosphorus content in parts per million.
AS TEXT (dry, whole-coal basis) Arsenic content in parts per million.
B TEXT (dry, whole-coal basis) Boron content in parts per million.
BA TEXT (dry, whole-coal basis) Barium content in parts per million.
BE TEXT (dry, whole-coal basis) Beryllium content in parts per million.
CD TEXT (dry, whole-coal basis) Cadmium content in parts per million.
CO TEXT (dry, whole-coal basis) Cobalt content in parts per million.
CR TEXT (dry, whole-coal basis) Chromium content in parts per million.
CU TEXT (dry, whole-coal basis) Copper content in parts per million.
F TEXT (dry, whole-coal basis) Fluorine content in parts per million.
GA TEXT (dry, whole-coal basis) Gallium content in parts per million.
GE TEXT (dry, whole-coal basis) Germanium content in parts per million.
HG TEXT (dry, whole-coal basis) Mercury content in parts per million.
LA TEXT (dry, whole-coal basis) Lanthanum content in parts per million.
TEXT (dry, whole-coal basis) Lithium content in parts per million.
MN TEXT (dry, whole-coal basis) Manganese content in parts per million.
MO TEXT (dry, whole-coal basis) Molybdenum content in parts per million.
NI TEXT (dry, whole-coal basis) Nickel content in parts per million.
PB TEXT (dry, whole-coal basis) Lead content in parts per million.
SB TEXT (dry, whole-coal basis) Antimony content in parts per million.
SC TEXT (dry, whole-coal basis) Scandium content in parts per million.
SE TEXT (dry, whole-coal basis) Selenium content in parts per million.
Coal quality in the Illinois Basin E227
LI

Table 4. Explanation of chemical data columns in the Illinois State Geological Survey’s coal database files created for the resource assessment of the Springfield, Herrin, Danville, and Baker Coals in the Illinois Basin—Continued.
Field Name Type Description
SR TEXT (dry, whole-coal basis) Strontium content in parts per million.
TH TEXT (dry, whole-coal basis) Thorium content in parts per million.
U TEXT (dry, whole-coal basis) Uranium content in parts per million.
V TEXT (dry, whole-coal basis) Vanadium content in parts per million.
YB TEXT (dry, whole-coal basis) Ytterbium content in parts per million.
ZN TEXT (dry, whole-coal basis) Zinc content in parts per million.
ZR TEXT (dry, whole-coal basis) Zirconium content in parts per million.
GENERAL COMMENTS
The following information was received from Colin Treworgy (ISGS) and helps to clarify the Illinois State Geological Survey chemical data descriptions.
Each analysis in the Illinois coal quality database has a unique 12-character identifier called LABNO (laboratory number). The first character in the item LABNO is a letter assigned by the ISGS indicating the laboratory that analyzed the sample. The 11 characters following the letter are, in most cases, the identifier assigned by the original laboratory. If the laboratory number is unknown, the company drill hole number is used.
Letter Laboratory
A USBM analyses, prior to ISGS "C" lab numbers, old ASTM methods B ISGS analyses of oil field brinesC ISGS analyses of coal or coal-related materialD ISGS isotopic analyses (e.g. carbon-14) E AMAX MIDWEST AREA LAB analyses of coal or coal-related materialG ISGS analyses of gas L COALFIELD RESEARCH, INC. analyses of coal or coal-related materialM CDM-Acculabs analyses of coal or coal-related materialO ISGS analyses of oil or oil-related samples R ISGS analyses of rocks, soil, and other non-coal sediments S ISGS analyses of Devonian black shalesT COMMERCIAL TESTING & ENGINEERING analyses of coal or coal-related materialU Unknown laboratoryV SUNNYVALE MINERALS analyses of coal or coal-related materialW ISGS analyses of water X BLOOMINGTON EXPLORATION analyses of coal or coal-related material
Selected Stratigraphic Codes
2490 Danville Coal 2660 Herrin Coal 2790 Springfield Coal
E228 Resource Assessment of the Springfield, Herrin, Danville, and Baker Coals in the Illinois Basin
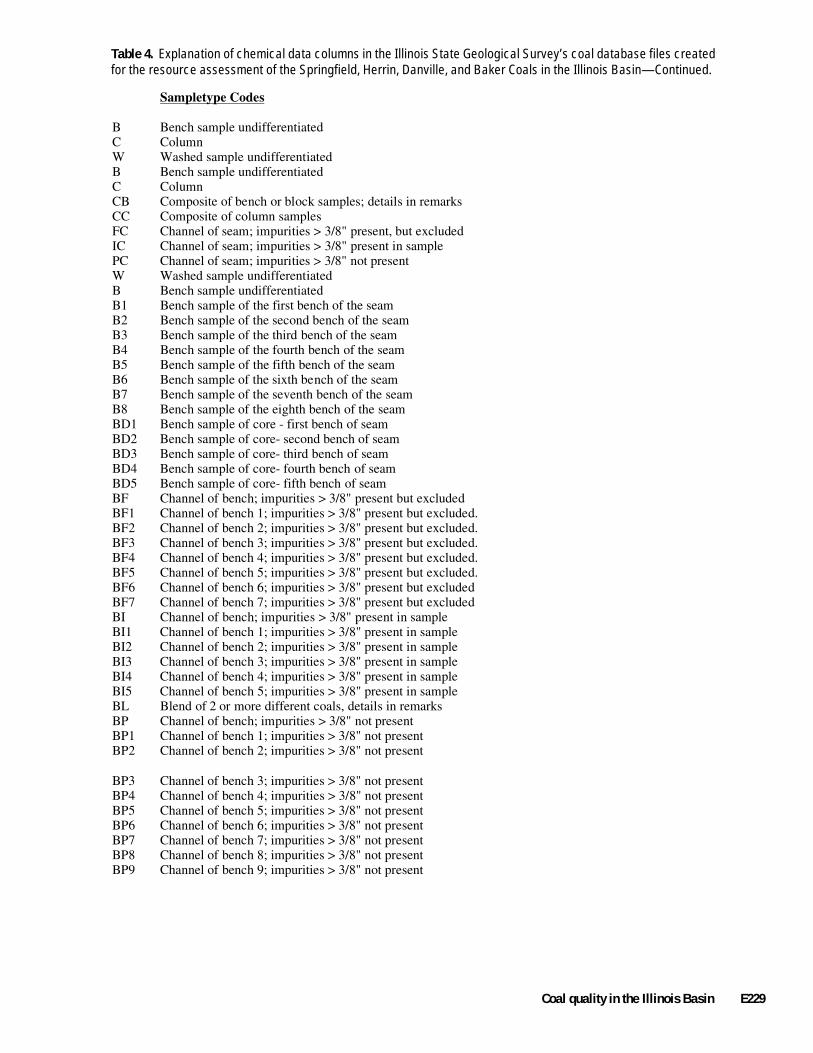
1234567
Table 4. Explanation of chemical data columns in the Illinois State Geological Survey’s coal database files created for the resource assessment of the Springfield, Herrin, Danville, and Baker Coals in the Illinois Basin—Continued.
Sampletype Codes
B Bench sample undifferentiated•C Column•W Washed sample undifferentiated•B Bench sample undifferentiated•C Column•CB Composite of bench or block samples; details in remarks •CC Composite of column samples•FC Channel of seam; impurities > 3/8" present, but excluded•IC Channel of seam; impurities > 3/8" present in sample•PC Channel of seam; impurities > 3/8" not present •W Washed sample undifferentiated•B Bench sample undifferentiated•B1 Bench sample of the first bench of the seam•B2 Bench sample of the second bench of the seam•B3 Bench sample of the third bench of the seam•B4 Bench sample of the fourth bench of the seam•B5 Bench sample of the fifth bench of the seam•B6 Bench sample of the sixth bench of the seam•B7 Bench sample of the seventh bench of the seam•B8 Bench sample of the eighth bench of the seam•BD1 Bench sample of core - first bench of seam•BD2 Bench sample of core- second bench of seam•BD3 Bench sample of core- third bench of seam•BD4 Bench sample of core- fourth bench of seam•BD5 Bench sample of core- fifth bench of seam•BF Channel of bench; impurities > 3/8" present but excluded•BF Channel of bench 1; impurities > 3/8" present but excluded.•BF Channel of bench 2; impurities > 3/8" present but excluded.•BF Channel of bench 3; impurities > 3/8" present but excluded.•BF Channel of bench 4; impurities > 3/8" present but excluded.•BF Channel of bench 5; impurities > 3/8" present but excluded.•BF Channel of bench 6; impurities > 3/8" present but excluded•BF Channel of bench 7; impurities > 3/8" present but excluded•BI Channel of bench; impurities > 3/8" present in sample•BI1 Channel of bench 1; impurities > 3/8" present in sample•BI2 Channel of bench 2; impurities > 3/8" present in sample•BI3 Channel of bench 3; impurities > 3/8" present in sample•BI4 Channel of bench 4; impurities > 3/8" present in sample•BI5 Channel of bench 5; impurities > 3/8" present in sample•BL Blend of 2 or more different coals, details in remarks •BP Channel of bench; impurities > 3/8" not present •BP1 Channel of bench 1; impurities > 3/8" not present •BP2 Channel of bench 2; impurities > 3/8" not present •
BP3 Channel of bench 3; impurities > 3/8" not present •BP4 Channel of bench 4; impurities > 3/8" not present•BP5 Channel of bench 5; impurities > 3/8" not present •BP6 Channel of bench 6; impurities > 3/8" not present •BP7 Channel of bench 7; impurities > 3/8" not present •BP8 Channel of bench 8; impurities > 3/8" not present •BP9 Channel of bench 9; impurities > 3/8" not present •
Coal quality in the Illinois Basin E229

Table 4. Explanation of chemical data columns in the Illinois State Geological Survey’s coal database files created for the resource assessment of the Springfield, Herrin, Danville, and Baker Coals in the Illinois Basin—Continued.
Sampletype Codes
C ColumnCB Composite of bench or block samples CC Composite of column samplesCDC Composite of drill core samples CFC Composite channel samples; impurities > 3/8" present but excludedCGD Composite of composited samples collected on grids CIC Composite of channel samples; impurities > 3/8" present in sampleCPC Composite of channel samples; impurities > 3/8" not presentD C Drill coreDC Drill coreDF Drill core of bench; impurities > 3/8" present, but excludedDFC Drill core of seamDI Drill core of bench; impurities > 3/8" present in sampleDIC Drill core of seamDP Drill core of bench; impurities > 3/8" not present DP1 Drill core of bench 1; impurities > 3/8" not present DP2 Drill core of bench 2; impurities > 3/8" not present DP3 Drill core of bench 3; impurities > 3/8" not present DPC Drill core of seamFC Channel of seam; impurities > 3/8" present, but excludedGB Grab sample, details in remarks Bn Grab sample of strata 1..n (1 = top)GD Grid sample, composite of individual samples collected on a gridIC Channel of seam; impurities > 3/8" present in sampleLAB Laboratory generated sample, details in remarks PC Channel of seam; impurities > 3/8" not present RM Run of mine, details in remarks RP Run of preparation plant, details in remarks SP Special sample, details in remarks SZ A particle size fraction; feed sample noted elsewhere.UNN Unknown type of sample, details in remarks W Washed sample undifferentiatedW1 Washed sample- first bench of seamW2 Washed sample- second bench of seamW3 Washed sample- third bench of seamCDS Calculated composite of sized core samples
The following publications document the analytical procedures used for most Illinois State samples.
Rees, O. W., 1966, Chemistry, Uses and Limitations of Coal Analyses: Illinois State Geological Survey Report of Investigations 220, 55 p. (This publication documents the proximate, ultimate, etc. analysis methodology)
Gluskoter, H. J., Ruch, R. R., Miller, W. G., Cahill, R. A., Dreher, G. B., and Kuhn, J. K., 1977, Trace Elements in Coal: Occurrences and Distribution: Illinois State Geological Survey Circular 499, 154 p. (The appendix at the end of this publication details element analyses methodology).
E230 Resource Assessment of the Springfield, Herrin, Danville, and Baker Coals in the Illinois Basin