Embed Size (px)
Citation preview
CHARACTERIZATION OF THREE STORMWATER PONDS
Betty Rushton, Ph.D. Dwayne Huneycutt
Kara Teague
DEP Contract No. WM 716
Revision of 1999 report including new data September 2004
Southwest Florida Water Management District 2379 Broad Street
Brooksville, FL 34604-6899 (352) 796-7211 ext 4276
E-mail [email protected]

_________________________________________________________________________________ Southwest Florida Water Management District, Resource Management Dept. 250 -2-
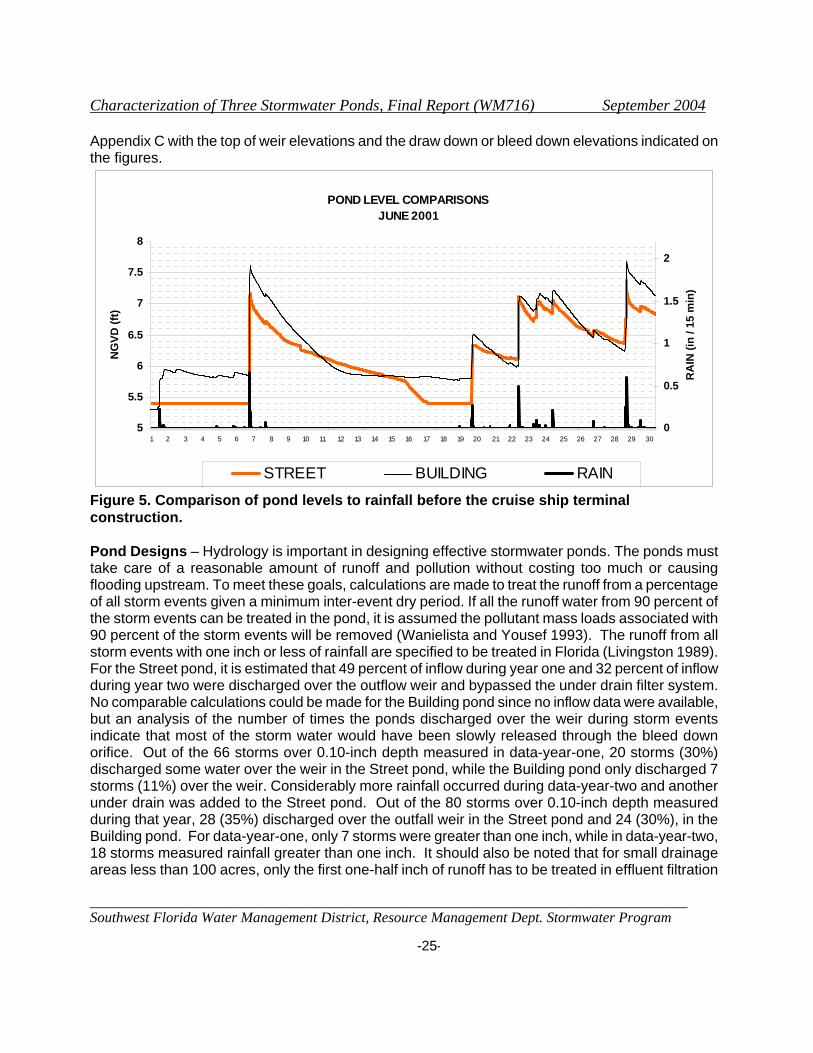
Characterization of Three Stormwater Ponds, Final Report (WM716) September 2004
______________________________________________________________________________ Southwest Florida Water Management District, Resource Management Dept. Stormwater Program -iii-
ACKNOWLEDGEMENTS
This project, including the preparation of this report, is being funded in part by a Section 319 Nonpoint source Management Program grant from the U. S. Environmental Protection Agency (US EPA) through a contract with the Stormwater/Nonpoint Source Management Section of the Florida Department of Environmental Protection. The total estimated cost of the monitoring project and education program is $303,082 and $181,575 was provided by the US EPA. This is one of three reports published under this contract. Eric Livingston and David Worley at FDEP provide support and guidance.
The Southwest Florida Water Management District laboratory staff was indispensable in carefully analyzing water quality samples that can never be collected on a pre-determined schedule. Allen Yarbrough and Patti Twardosky designed the site plans. Our Finance Department and especially Jan Smith tracked our budget, submitted invoices, and kept us informed about our expenditures.
Matt Dooris conducted a macroinvertebrate study when he was an intern at the District, and Dr. Doug Leeper was a great help in editing Matt's report. Other interns have collected samples, entered data, installed equipment, decommissioned sites and located references. Their help is greatly appreciated. Michelle Rowden worked on the project for over one year and much of the data and some of the verbiage is the result of her efforts.
Special recognition goes to Tom Happel of Suntree Technologies, Inc who was responsible for the skimmer box inserts, to Tom Levin at Ekistics Design who came up with the design of the diversion structure, to Julia Stack at the Aquarium for her help and to John McGee of Hillsborough County's Adopt-A-Pond program who made arrangements to clean out the pond sediments and cattails.

Characterization of Three Stormwater Ponds, Final Report (WM716) September 2004
______________________________________________________________________________ Southwest Florida Water Management District, Resource Management Dept. Stormwater Program -iv-
Characterization of Three Stormwater Ponds, Final Report (WM716) September 2004
______________________________________________________________________________ Southwest Florida Water Management District, Resource Management Dept. Stormwater Program -v-
TABLE OF CONTENTS EXECUTIVE SUMMARY ..............................................................................................ix CONCLUSIONS.......................................................................................................... xiii INTRODUCTION........................................................................................................... 1 SITE DESCRIPTION......................................................................................................3
The Street Pond ..........................................................................................................3 The Building Pond.......................................................................................................3 The Parking Lot Pond................................................................................................. 6
METHODS .....................................................................................................................9
INTENSIVE STORM MONITORING STUDY .............................................................9 Rainfall Measurements ............................................................................................9 Outflow Hydrology Measurements ...........................................................................9 Underdrain Hydrology Flows .................................................................................10 Water Quality Sampling .........................................................................................10
POND CHARACTERIZATION COMPARISONS ......................................................10 Field Parameters....................................................................................................10 Sediment Samples .................................................................................................10 Invertebrate Sampling............................................................................................14 Water Quality Samples...........................................................................................16 Comparison to State Standards .............................................................................16
POND IMPROVEMENT TECHNIQUES ...................................................................16 Drop Box Samples .................................................................................................16 Diversion Structure................................................................................................17 Biocultures ............................................................................................................17
RESULTS AND DISCUSSION.....................................................................................19
INTENSIVE STORMWATER MONITORING STUDY...............................................19 Hydrology Measurements .....................................................................................19
Amount of Rain ..................................................................................................19 Water Levels ......................................................................................................23 Pond Designs.....................................................................................................25
Water Quality Measurements................................................................................26 Overflow Weir Storm Water ................................................................................26 General Trends ..................................................................................................29 Under Drain Samples .........................................................................................31
Characterization of Three Stormwater Ponds, Final Report (WM716) September 2004
______________________________________________________________________________ Southwest Florida Water Management District, Resource Management Dept. Stormwater Program -vi-
POND CHARACTERIZATION COMPARISONS ......................................................34 Field Parameters...................................................................................................34
Daily Fluctuations ..............................................................................................36 Dissolved Oxygen ..............................................................................................36 The pH ...............................................................................................................36 Rainfall Effects...................................................................................................36 Conductivity.......................................................................................................37 Oxidation Reduction Potential............................................................................37
Sediment Samples ................................................................................................37 Particle Size Analysis.........................................................................................38 Percent Organic Matter ......................................................................................38 Nutrients ............................................................................................................39 Metals ................................................................................................................41 Organic Pollutants .............................................................................................42 Pesticides ..........................................................................................................42
Fish Survey ...........................................................................................................44 Macroinvertebrate Study .......................................................................................46
Parking Lot Pond ...............................................................................................47 Street Pond ........................................................................................................48 Building Pond ....................................................................................................49 Conclusion.........................................................................................................50
Water Quality Comparisons ..................................................................................51 Nutrient concentrations .....................................................................................51 Metal concentrations..........................................................................................52
Comparison to State Standards ............................................................................53 Summary ...........................................................................................................55
POND IMPROVEMENTS .........................................................................................55
Skimmer Box Inserts .............................................................................................56 Water Quality Samples .......................................................................................56 Gross solids samples.........................................................................................59 Conclusions.......................................................................................................61
Diversion structure ................................................................................................61 MAINTENANCE PRACTICES ..................................................................................63
Algicide Treatment .............................................................................................63 Biocultures ........................................................................................................64 Barley Straw.......................................................................................................69 Pond Maintenance .............................................................................................70
SUMMARY OF RESULTS ...........................................................................................72
Characterization of Three Stormwater Ponds, Final Report (WM716) September 2004
______________________________________________________________________________ Southwest Florida Water Management District, Resource Management Dept. Stormwater Program -vii-
REFERENCES.............................................................................................................76 APPENDIX A .............................................................................................................. 82 Quality Assurance Information APPENDIX B .............................................................................................................. 98 Rainfall Characteristics APPENDIX C ............................................................................................................ 104 Water Level Plotted with Rainfall APPENDIX D ............................................................................................................ 134 Surface Water Quality APPENDIX E ............................................................................................................ 142 Metal Concentrations vs Metal WQ Standards APPENDIX F............................................................................................................. 150 Under Drain Water Quality APPENDIX G ............................................................................................................ 158 Field Parameters APPENDIX H ............................................................................................................ 170 Sediment Samples APPENDIX I .............................................................................................................. 176 Macroinvertebrates APPENDIX J ............................................................................................................. 182 Skimmer Box Gross Solids APPENDIX K ............................................................................................................ 201 Skimmer Box Water Quality APPENDIX L............................................................................................................. 213 Biocultures - "Living Soils" APPENDIX M ............................................................................................................ 217 Biocultures - "Healthy Ponds" APPENDIX N ............................................................................................................ 223 Pictures of the Ponds

Characterization of Three Stormwater Ponds, Final Report (WM716) September 2004
______________________________________________________________________________ Southwest Florida Water Management District, Resource Management Dept. Stormwater Program -viii-
Characterization of Three Stormwater Ponds, Final Report (WM716) September 2004
______________________________________________________________________________ Southwest Florida Water Management District, Resource Management Dept. Stormwater Program -ix-
EXECUTIVE SUMMARY
When it rains, stormwater runoff travels across the land and down streets, ditches, swales, and storm drains and eventually ends up in our lakes, rivers, and bays. The streets look cleaner because all of the oil, grease, trash and sediments are now accumulating in the runoff water. For this reason, runoff from rain events has been identified as a major pollution source to Florida's rivers, lakes and estuaries. One of the most common methods for treating stormwater pollution is to direct runoff to some type of constructed pond. Three stormwater ponds discharging directly into Tampa Bay formed the centerpiece of a monitoring project developed to inform the public about stormwater problems and to test methods to help remove stormwater pollution. The three types of ponds are an effluent filtration system, a wet detention pond and a pond used for the final treatment of a low impact parking lot design. Although most of the low impact parking lot was destroyed to construct a cruise ship terminal, enough preliminary data had been collected to compare to the two ponds that were monitored in more detail. The techniques tested to try and improve the performance of the ponds included pre-treatment grate inlet skimmer boxes (drop box inserts) installed in the seven storm drain catch basins that discharged to the wet detention pond, a diversion wall to increase storm travel time for runoff through the wet detention pond, biocultures to improve the aesthetics of the ponds, additional plants to help take up nutrients and barley straw for algae control. The project was divided into three divisions. 1) An Intensive study was conducted for two years that collected hydrology and flow weighted water quality samples during storm events for two ponds. 2) A study comparing five years of data characterized conditions in three types of stormwater systems and looked at trends. 3) Several improvement and maintenance practices were tested and the results monitored. The purpose was to compare the stormwater systems by monitoring storm events, collecting sediment samples, identifying macroinvertebrates and fish, and tracking field parameters (dissolved oxygen, pH, temperature and conductivity). POND DESCRIPTIONS The ponds represent three types of stormwater systems and are named to describe the type of runoff each receives. The Street pond is an effluent filtration system that treats runoff from a well-traveled urban thoroughfare and parking garages. This effluent filtration system uses an artificial side drain packed in aggregate to treat stormwater after runoff has passed through a sedimentation basin. The Building pond has been modified to act as a wet detention system and collects the runoff from the Aquarium roof, sidewalks, a delivery receiving dock and garden areas. The Parking Lot pond was the final treatment for a parking lot that used a low impact design. RAINFALL The two years of data for the intensive study showed considerable differences in rainfall amounts. During the first year of the study (ten months), the area experienced a drought and

Characterization of Three Stormwater Ponds, Final Report (WM716) September 2004
______________________________________________________________________________ Southwest Florida Water Management District, Resource Management Dept. Stormwater Program -x-
rainfall was considerably below normal (26 inches) compared to the long-term average (44 inches). During the ten months of construction activity, summer tropical storms made up for the below average rainfall at the site and was 39 inches compared to 37 inches for the historic record. During the ten months of data collected in the second year to compare with the first year, El Nino conditions increased rainfall at the site to above average levels (58 inches) compared to the long-term average (44 inches). FLOW The effluent filtration stormwater pond (Street pond) and the wet detention pond (Building pond) have similar responses to rainfall showing the filter system is still operational after seven years and is slowly releasing flow after storm events at about the same rate as the wet detention pond (Building pond). The Parking Lot pond only discharged once during the year it was monitored demonstrating that the low impact design was an excellent choice for reducing storm runoff and protecting the receiving waters. WATER QUALITY Flow weighted water quality samples were collected during storm events at the outflow of the two ponds during the intensive study. These concentrations were compared to concentrations measured in the under drain pipes and in rainfall to analyze concentrations at different locations in the system and to evaluate how well water quality met state of Florida Class III standards. Field parameters of pH, dissolved oxygen, temperature and conductivity were also compared to understand processes taking place in the ponds. Nutrient concentrations are a concern since they cause the growth of noxious water weeds and can create odor problems. When data for year one (2001) are compared. Nitrate was measured at the highest concentrations in rainfall (median value of 0.2 mg/L) when compared to the outflow of the Building and Street ponds (0.05 and 0.02 mg/L respectively). Although ammonia was measured at high concentrations in rainfall (0.12 mg/l), the highest concentrations measured were in the under drain pipes (0.258 mg/L). Anaerobic conditions in the pipes partially explain these results. Dissolved oxygen levels also explain the higher ammonia concentrations measured in the surface discharge from the often duckweed covered Building Pond (0.13 mg/L) compared to the discharge water of the well-oxygenated Street Pond (0.02 mg/L). Soluble phosphorus was also measured at higher concentrations in the under drain pipes. Ortho-phosphorus concentrations were over twice as high in the pipes compared to discharge water from the ponds (0.105 mg/L compared to 0.043 mg/L for the Building Pond and 0.127 mg/L compared to 0.042 mg/L for the Street Pond). Higher concentrations of inorganic nitrogen and phosphorus have also been reported from other studies of under drain systems. Heavy metals measured at the outflow in both the ponds and in the under drain pipes were measured at low levels and were often below the laboratory detection limit. Suspended
Characterization of Three Stormwater Ponds, Final Report (WM716) September 2004
______________________________________________________________________________ Southwest Florida Water Management District, Resource Management Dept. Stormwater Program -xi-
solids were also measured at low levels indicating that the stormwater systems are effective for removing these constituents. During the first year of data collected for the intensive study, the pond discharge waters were in non-compliance of standards only five times in the 180 samples collected and even lower concentrations in the under drain pipes never exceeded standards indicating the ponds are effectively treating stormwater. These good results for the surface water in the ponds were not seen in preliminary data collected at the site, which detected numerous exceedances of standards of as much as 50 percent for copper and 30 percent for lead. The high copper values were caused by algicide treatment. Physical water quality parameters are relevant to understanding the processes that influence constituent cycling in natural waters. During this study, dissolved oxygen (DO), pH, temperature and conductivity were periodically measured with recording sensors, which took readings every hour for an extended peiod (usually about a week). The units were deployed about once a month when there was enough water in the ponds to take measurements. The most striking differences between ponds occurred for dissolved oxygen and conductivity. Conductivity was much higher in the Building Pond as a result of activities in the Aquarium and in the Parking Lot pond as a result of berm breeches causing contamination by water from Ybor channel. Dissolved oxygen was often measured near zero in the Building Pond, which was caused by a dense layer of floating macrophytes. The Street Pond, which is a productive eutrophic phytoplankton dominated system, exhibited widely fluctuating diurnal values of dissolved oxygen and pH. The State of Florida Class III water quality standards were sometimes exceeded for pH with values above 9.5. SEDIMENT SAMPLES Sediment samples were collected three times over the five years of monitoring at the site. A dramatic increase in constituent concentrations was measured in 2003 with especially high concentrations in the Building pond. Concentrations of potentially toxic pollutants were measured at much higher concentrations in the Building Pond compared to the Street Pond. Particle sizes for the sediments in both ponds had the highest percentage (30 to 40%) of samples measured in an intermediate size range (0.125 to 0.250 mm) described as medium sand. The smallest particle size (less than 0.063 mm) was also well represented especially at the outfall of the Street Pond and at both stations in the Building Pond. Since small particle sizes also provide greater attachment sites for metal ions, this may help explain the higher metal concentrations measured in the surface sediments at this site and the low concentrations of metals measured in the water column. Organic matter improves soil structure and provides conditions conducive to healthy soil microbes and solids settling. The Street Pond measured only low concentrations of organic matter (0.5 to 1%), although some increase was seen (2%) near the outfall. In contrast, the Building Pond measured higher concentrations (6 to 8%) probably a result of the considerable vegetation that continually died back and rained detritus in the pond. This was reduced to 4.5 percent after the maintenance provided by Hillsborough County Adopt-A-Pond program.
Characterization of Three Stormwater Ponds, Final Report (WM716) September 2004
______________________________________________________________________________ Southwest Florida Water Management District, Resource Management Dept. Stormwater Program -xii-
Total Kjeldahl nitrogen (TKN) is a combination of organic nitrogen and ammonia. The sediment sample concentrations in the Street pond were measured much lower than the Building pond. For the final year, TKN concentrations had increased in the sediments of the Street pond from less than 1600 mg/kg in 1997 to greater than 20,000 mg/kg in 2003 and in the Building pond to greater than 180,000 mg/kg. This demonstrates the large amount of nitrogen that can build up in the sediments in ponds with a high concentration of floating macrophytes. Concentrations were measured at much lower concentrations in the sediments 4 inches below the surface and although the Street pond had concentrations slightly less than the Building pond they were not much less. Phosphorus concentrations followed much the same pattern as TKN with higher concentrations in the Building pond but phosphorus was not necessarily that much less in the deeper sediments indicating the possibility of migration into the deeper strata. Concentrations of phosphorus in the Street pond in 2003 were about 20,000 mg/kg compared to about 70,000 mg/kg in the Building pond. Metals were also measured at higher concentrations in the Building Pond compared to the Street Pond. Both copper and zinc exceeded sediment guidelines and concentrations were in a range where they were probably toxic to biota in year 2000, but had been reduced to below toxic levels after the maintenance clean out of the pond. Polycyclic aromatic hydrocarbons (PAHs) were a problem in both ponds: in the Street pond PAH detections increased from 17 percent of samples in 2000 to 63 percent in 2003; and in the Building pond from 28 percent to 75 percent. Of some concern is the fact that measurable levels of PAHs were detected in the Building pond and that acenaphthene, anthracene, phenanthrene and benzo(a)anthracene may exceed toxic levels. Pesticides may be a problem in the sediments. Chlordane, DDE and DDD were detected in both ponds. Since these are serious contaminants, toxic to wildlife and bioaccumulate in organisms, they need more study. None of the pesticides were detected in the water column samples. Biota. The macroinvertebrate and fish studies showed all the taxa reported were those highly tolerant of polluted conditions. In areas where sediments had measured possibly toxic levels of pollutants there were much lower abundance of species and individuals than in other areas. Indications also suggest that the aggressive fish Gambusia affinis may be further reducing species diversity. POND IMPROVEMENTS Skimmer Box Inserts collected 15 cubic feet per year of gross solids from the 5.67-acre

Characterization of Three Stormwater Ponds, Final Report (WM716) September 2004
______________________________________________________________________________ Southwest Florida Water Management District, Resource Management Dept. Stormwater Program -xiii-
drainage basin before it could travel by sediment transport into the pond. The skimmer box inserts also appeared to improve inflow water quality. The diversion structure increased the travel time of the treatment volume and appeared to greatly reduce the concentration of constituents discharged from the Building pond for the eight storms that were measured compared to concentrations before it was installed. Algicide treatment in the ponds greatly increased the toxic levels of copper in the sediments and in the water discharged from the pond. It also appeared to increase nitrate concentrations. Biocultures may reduce organic nitrogen concentrations but did not improve the problem with floating nuisance vegetation. Sediment removal as a pond maintenance technique reduced levels of copper in the sediments and reduced organic nitrogen and organic matter in the water column, but did not permanently improve the problems with floating vegetation.
CONCLUSIONS Stormwater ponds greatly reduce pollution to our rivers, lakes and streams, but problems exist and toxic levels of metals and high levels of nutrients are still being discharged. Even under the best projections current rules allow 20 percent more pollutants to be added to our receiving waters each year. One method to reduce these pollutant loads is to design with more opportunities in the drainage basin for infiltration by using some treatment train techniques. The Parking Lot pond is an example of how pollutant loads can be reduced using these methods. Stormwater was discharged from that basin only once during the year it was studied compared to the 20 to 40 times a year for traditional stormwater ponds. On the other hand, more study is needed to test infiltration effects. Higher soluble nitrogen and phosphorus were measured in flow that had passed through the under drain filters in the effluent filtration system than in the surface stormwater discharged. Of some concern are the toxic levels of metals, pesticides and PAHs being sequestered in the sediments of stormwater systems with no plans for their disposal or the long-term effect on water quality and wildlife. Also ponds treated with algicides are probably increasing copper and nitrogen discharged to receiving waters.

Characterization of Three Stormwater Ponds, Final Report (WM716) September 2004
______________________________________________________________________________ Southwest Florida Water Management District, Resource Management Dept. Stormwater Program -1-
INTRODUCTION
In a typical urban environment, where a variety of impervious surfaces now cover much of the land, the water that runs off during and after rainstorms is greatly increased and degraded. Instead of seeping into the soil, the rain flows rapidly off roads and roofs. In the process, it picks up oil, grease, heavy metals, trash, sediment, pesticides and fertilizers. Storm drains often channel this heavily polluted water directly to streams, rivers, lakes and bays, thus degrading our natural systems. This diffuse source of pollution is termed non-point source or stormwater runoff and is considered one of the major pollution problems for natural water bodies. Non-point sources include atmospheric deposition, surface runoff that immediately follows rainfall, low-flow longer-duration base flow, and the residual chemicals and sediments that release pollutants to the water column over a longer time period. Environmental directives to clean up this pollution source have resulted in rules for stormwater treatment. In the Tampa Bay area this responsibility has been delegated to the Southwest Florida Water Management District (District or SWFWMD).
Several stormwater ponds permitted by the District when the Florida Aquarium was built in downtown Tampa provided an opportunity to study various aspects of stormwater management and coordinate our results with the Aquarium educational program. Besides characterizing several types of stormwater systems, emphasis was placed on investigating some of the problems associated with pond maintenance, educating the public about runoff pollution and developing strategies to make stormwater systems an attractive landscape amenity. Another purpose of the project was to test methods to improve the quality of the storm discharge water and the final year of the monitoring program tested the results of some of these efforts.
This report presents the results of the stormwater monitoring effort at the Aquarium for over
four years and also looked at some stormwater management alternatives. Data were collected characterizing three types of stormwater ponds from November 1996 until monitoring was terminated in November 2003. During that time period one of the ponds was obliterated to make space for a cruise ship terminal and changes were made to the remaining ponds for a downtown trolley installation.
The results of the study are divided into three major sections: 1) Two years of intensive
storm event sampling using automatic equipment to collect flow and water quality data at the outflow of two stormwater systems, 2) Four years of water quality data, which included both grab and flow-weighted storm water samples, biological monitoring, and sediment analysis for three types of stormwater management systems, and 3) An analysis of some stormwater improvement techniques including skimmer box inserts installed in one drainage basin and a diversion weir to increase travel time in one of the ponds. Two companion reports are also available that provide detailed data on two of the stormwater management systems: a low impact parking lot (Rushton and Hastings 2001) and an effluent filtration system (Teague and Rushton 2005).
Characterization of Three Stormwater Ponds, Final Report (WM716) September 2004
______________________________________________________________________________ Southwest Florida Water Management District, Resource Management Dept. Stormwater Program -2-
Characterization of Three Stormwater Ponds, Final Report (WM716) September 2004
______________________________________________________________________________ Southwest Florida Water Management District, Resource Management Dept. Stormwater Program -3-
SITE DESCRIPTION
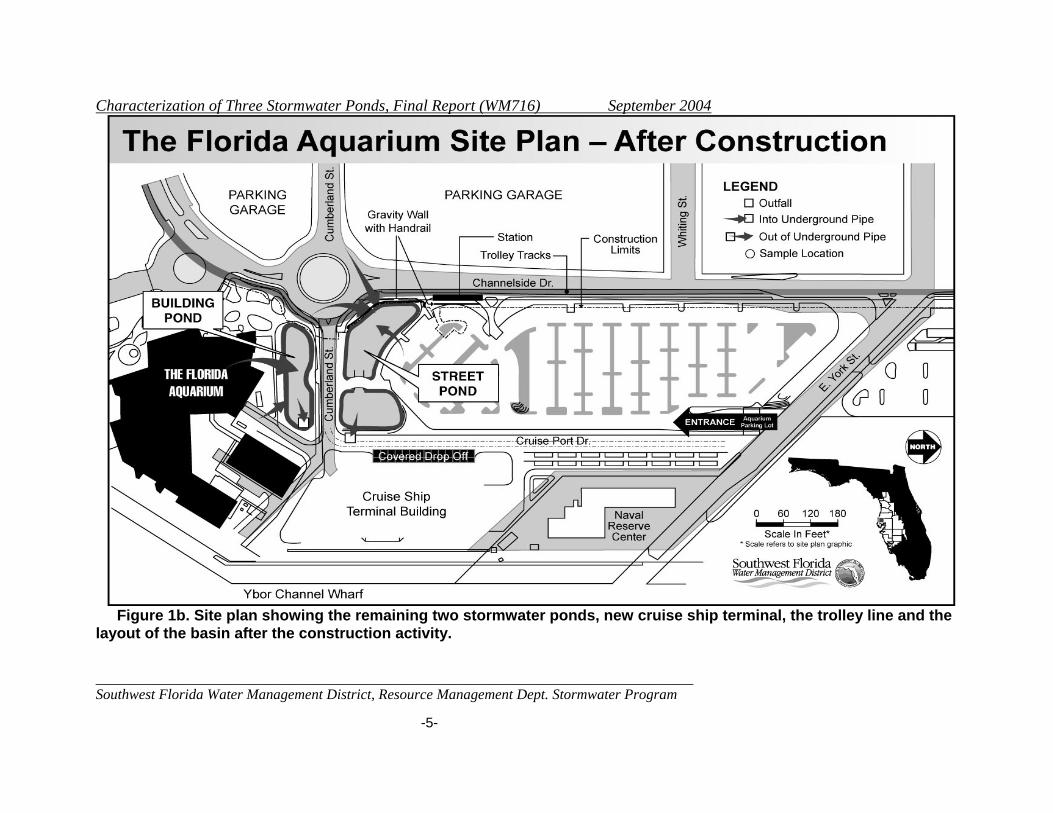
The site at the Florida Aquarium is located at 701 Channelside Drive, Tampa, Hillsborough County (Section 19, Township 29, Range 19). The stormwater systems treat storm runoff from a parking lot, an urban street, and Aquarium buildings. The ponds discharge to Ybor Channel which leads directly to Tampa Bay, an estuary of national significance, included in the National Estuary program, and identified as a water body in need of attention. The wet ponds in this study are quite different from each other and were named to designate the principal type of runoff each pond receives (Figures 1a - 1b and Table 1).
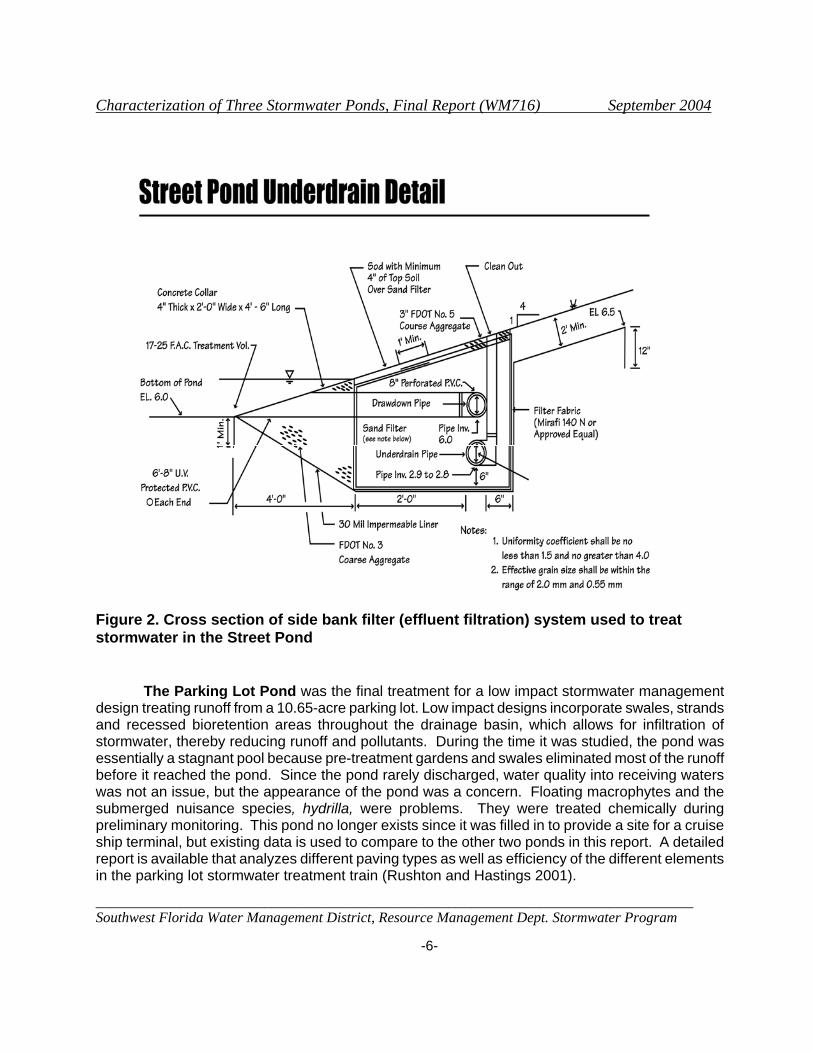
The Street Pond collects runoff from a well-traveled downtown thoroughfare and a large parking garage. The pond is designed to treat 10.4 acres of street and urban runoff. It is an effluent filtration system that uses artificial side drains packed in aggregate to treat stormwater. Filter systems direct low flows through this media to pipes, which in this case, discharge to the drop box at the outflow. High flows are still discharged over the outfall weir. A diagram of the side bank filter is shown in Figure 2. The shape of the filtration pond was altered during construction of the cruise ship terminal and an additional side bank filter was installed on the east side of the pond.
Flow-weighted composite samples were also collected at regular intervals in the under drain pipes to compare with the pond water. The under-drain pipes flow continuously, which is probably caused by intercepting the surrounding water table. The Street Pond has two pools, connected in the middle with an equalizer pipe. The first pool was designed to act as a sedimentation basin and the second pool is the filtration system with under-ground side bank filters located on the south and east sides of the pond. Maintenance of filter systems is an important component in keeping effluent filtration systems functional, but unfortunately this is rarely done. This pond is no exception and the draw down pipes are clogged with debris and the screening material is in disrepair. A whole pond study was conducted for this one pond to evaluate the water quality and quantity for all the flows into and out of the system. More complete results of this one pond were published in a separate report (Teague and Rushton 2005) but the outflow water quality is evaluated here to compare to the other ponds.
The Building Pond collects excess runoff from 5.67 acres of rooftop, sidewalks, garden areas, loading docks, driveways and a plant nursery. This pond is a failed effluent filtration system modified to function as a wet-detention pond. A bleed-down orifice creates a fluctuating pool designated in SWFWMD rules as the treatment volume, where runoff is stored after storm events and slowly released over a five-day period. During the second year of the intensive study, this pond has been the subject of several alterations to try to improve the water quality discharged from the pond. In July 2002, seven grate inlet skimmer box inserts were installed in the drainage basin to intercept gross solids before they reached the pond. Another problem with the pond was the short travel time once storm water entered the pond because the inflow pipes were located near the outfall weir. To try to correct this problem the treatment volume was re-routed so that it travels through the littoral zone.

Characterization of Three Stormwater Ponds, Final Report (WM716) September 2004
______________________________________________________________________________ Southwest Florida Water Management District, Resource Management Dept. Stormwater Program
-4-
Figure 1a. Site plan showing the three stormwater ponds and the layout of the whole basin stormwater system used for he Parking Lot Pond.
Characterization of Three Stormwater Ponds, Final Report (WM716) September 2004
______________________________________________________________________________ Southwest Florida Water Management District, Resource Management Dept. Stormwater Program
-5-
Figure 1b. Site plan showing the remaining two stormwater ponds, new cruise ship terminal, the trolley line and the layout of the basin after the construction activity.
Characterization of Three Stormwater Ponds, Final Report (WM716) September 2004
______________________________________________________________________________ Southwest Florida Water Management District, Resource Management Dept. Stormwater Program -6-
Figure 2. Cross section of side bank filter (effluent filtration) system used to treat stormwater in the Street Pond
The Parking Lot Pond was the final treatment for a low impact stormwater management
design treating runoff from a 10.65-acre parking lot. Low impact designs incorporate swales, strands and recessed bioretention areas throughout the drainage basin, which allows for infiltration of stormwater, thereby reducing runoff and pollutants. During the time it was studied, the pond was essentially a stagnant pool because pre-treatment gardens and swales eliminated most of the runoff before it reached the pond. Since the pond rarely discharged, water quality into receiving waters was not an issue, but the appearance of the pond was a concern. Floating macrophytes and the submerged nuisance species, hydrilla, were problems. They were treated chemically during preliminary monitoring. This pond no longer exists since it was filled in to provide a site for a cruise ship terminal, but existing data is used to compare to the other two ponds in this report. A detailed report is available that analyzes different paving types as well as efficiency of the different elements in the parking lot stormwater treatment train (Rushton and Hastings 2001).
Characterization of Three Stormwater Ponds, Final Report (WM716) September 2004
______________________________________________________________________________ Southwest Florida Water Management District, Resource Management Dept. Stormwater Program -7-
Thick algae mats and floating vegetation of several plant species, collectively referred to in
this report as "duckweed", proved to be a recurring problem in all three ponds. Although a small portion of this floating vegetation gets washed out with rain events, much of it is held back by the aluminum skimmers installed to intercept surface water pollution such as oils and greases. Barley hay bales and biocultures were tried in an attempt to inhibit the floating macrophyte growth. Also littoral zone vegetation was planted in the Street Pond to try to remove excess nutrients. The result of these attempts and other alterations made to try to improve the aesthetics of the ponds are discussed in the report.
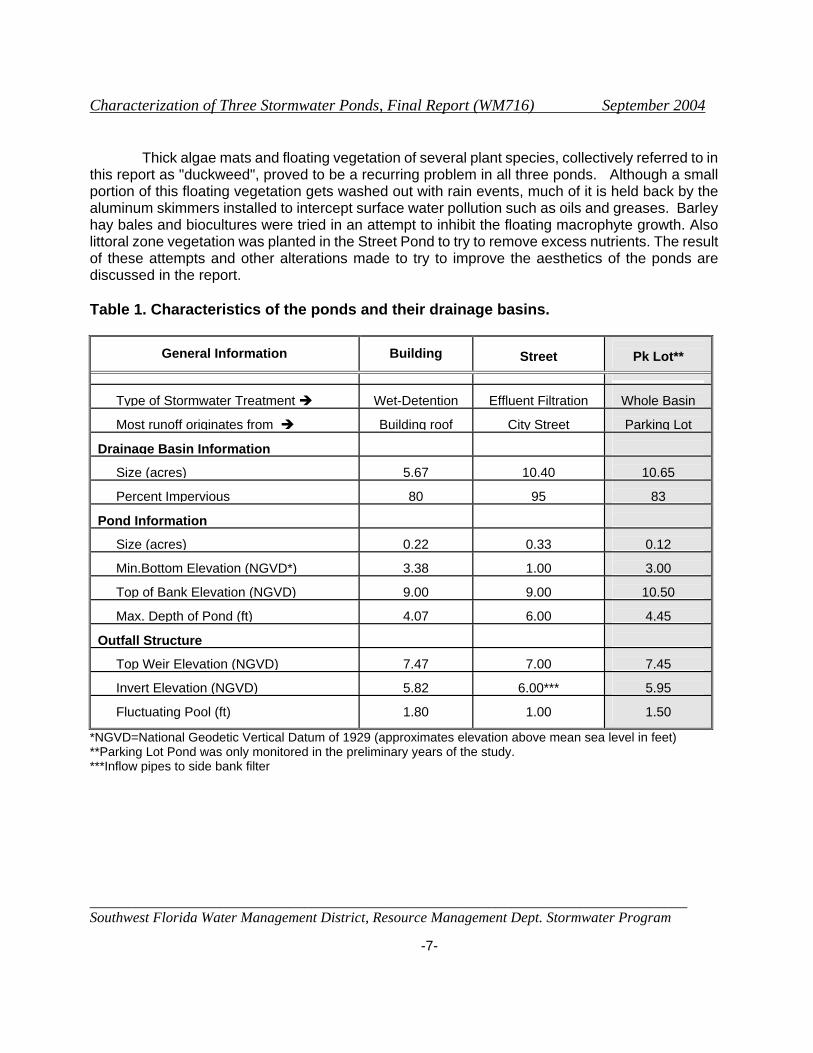
Table 1. Characteristics of the ponds and their drainage basins.
General Information Building
Street
Pk Lot**
Type of Stormwater Treatment Wet-Detention Effluent Filtration
Whole Basin
Most runoff originates from Building roof City Street
Parking Lot
Drainage Basin Information
Size (acres) 5.67 10.40
10.65
Percent Impervious 80 95
83
Pond Information
Size (acres) 0.22 0.33
0.12
Min.Bottom Elevation (NGVD*) 3.38 1.00
3.00
Top of Bank Elevation (NGVD) 9.00 9.00
10.50
Max. Depth of Pond (ft) 4.07 6.00
4.45
Outfall Structure
Top Weir Elevation (NGVD) 7.47 7.00
7.45
Invert Elevation (NGVD) 5.82 6.00***
5.95
Fluctuating Pool (ft)
1.80
1.00
1.50
*NGVD=National Geodetic Vertical Datum of 1929 (approximates elevation above mean sea level in feet) **Parking Lot Pond was only monitored in the preliminary years of the study. ***Inflow pipes to side bank filter

Characterization of Three Stormwater Ponds, Final Report (WM716) September 2004
______________________________________________________________________________ Southwest Florida Water Management District, Resource Management Dept. Stormwater Program -8-
Characterization of Three Stormwater Ponds, Final Report (WM716) September 2004
______________________________________________________________________________ Southwest Florida Water Management District, Resource Management Dept. Stormwater Program -9-
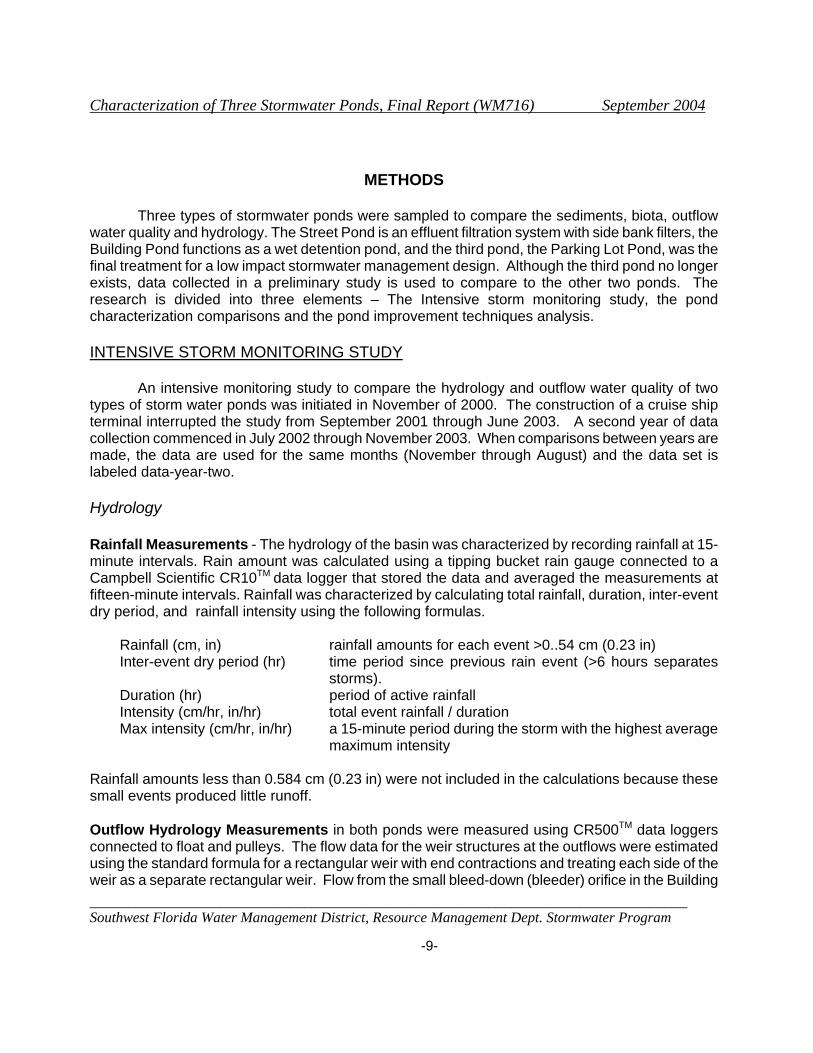
METHODS
Three types of stormwater ponds were sampled to compare the sediments, biota, outflow water quality and hydrology. The Street Pond is an effluent filtration system with side bank filters, the Building Pond functions as a wet detention pond, and the third pond, the Parking Lot Pond, was the final treatment for a low impact stormwater management design. Although the third pond no longer exists, data collected in a preliminary study is used to compare to the other two ponds. The research is divided into three elements – The Intensive storm monitoring study, the pond characterization comparisons and the pond improvement techniques analysis.
INTENSIVE STORM MONITORING STUDY
An intensive monitoring study to compare the hydrology and outflow water quality of two
types of storm water ponds was initiated in November of 2000. The construction of a cruise ship terminal interrupted the study from September 2001 through June 2003. A second year of data collection commenced in July 2002 through November 2003. When comparisons between years are made, the data are used for the same months (November through August) and the data set is labeled data-year-two. Hydrology Rainfall Measurements - The hydrology of the basin was characterized by recording rainfall at 15-minute intervals. Rain amount was calculated using a tipping bucket rain gauge connected to a Campbell Scientific CR10TM data logger that stored the data and averaged the measurements at fifteen-minute intervals. Rainfall was characterized by calculating total rainfall, duration, inter-event dry period, and rainfall intensity using the following formulas.
Rainfall (cm, in) rainfall amounts for each event >0..54 cm (0.23 in) Inter-event dry period (hr) time period since previous rain event (>6 hours separates
storms). Duration (hr) period of active rainfall Intensity (cm/hr, in/hr) total event rainfall / duration Max intensity (cm/hr, in/hr) a 15-minute period during the storm with the highest average
maximum intensity Rainfall amounts less than 0.584 cm (0.23 in) were not included in the calculations because these small events produced little runoff. Outflow Hydrology Measurements in both ponds were measured using CR500TM data loggers connected to float and pulleys. The flow data for the weir structures at the outflows were estimated using the standard formula for a rectangular weir with end contractions and treating each side of the weir as a separate rectangular weir. Flow from the small bleed-down (bleeder) orifice in the Building
Characterization of Three Stormwater Ponds, Final Report (WM716) September 2004
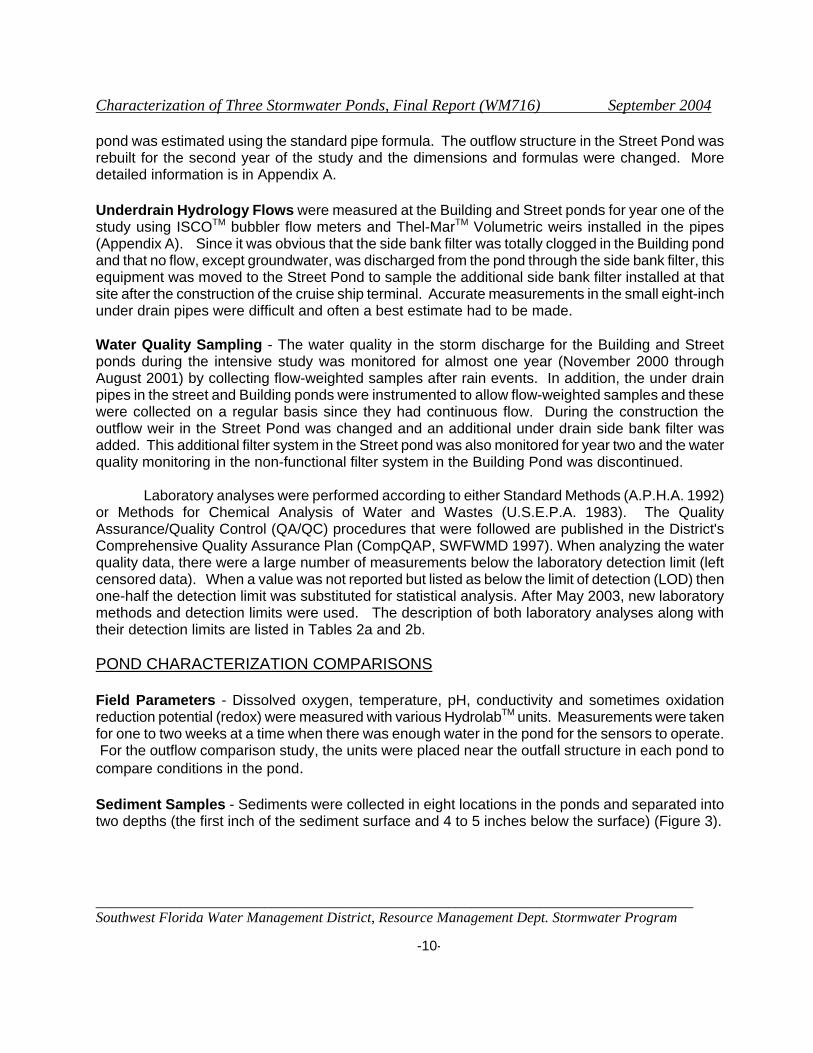
______________________________________________________________________________ Southwest Florida Water Management District, Resource Management Dept. Stormwater Program -10-
pond was estimated using the standard pipe formula. The outflow structure in the Street Pond was rebuilt for the second year of the study and the dimensions and formulas were changed. More detailed information is in Appendix A. Underdrain Hydrology Flows were measured at the Building and Street ponds for year one of the study using ISCOTM bubbler flow meters and Thel-MarTM Volumetric weirs installed in the pipes (Appendix A). Since it was obvious that the side bank filter was totally clogged in the Building pond and that no flow, except groundwater, was discharged from the pond through the side bank filter, this equipment was moved to the Street Pond to sample the additional side bank filter installed at that site after the construction of the cruise ship terminal. Accurate measurements in the small eight-inch under drain pipes were difficult and often a best estimate had to be made. Water Quality Sampling - The water quality in the storm discharge for the Building and Street ponds during the intensive study was monitored for almost one year (November 2000 through August 2001) by collecting flow-weighted samples after rain events. In addition, the under drain pipes in the street and Building ponds were instrumented to allow flow-weighted samples and these were collected on a regular basis since they had continuous flow. During the construction the outflow weir in the Street Pond was changed and an additional under drain side bank filter was added. This additional filter system in the Street pond was also monitored for year two and the water quality monitoring in the non-functional filter system in the Building Pond was discontinued. Laboratory analyses were performed according to either Standard Methods (A.P.H.A. 1992) or Methods for Chemical Analysis of Water and Wastes (U.S.E.P.A. 1983). The Quality Assurance/Quality Control (QA/QC) procedures that were followed are published in the District's Comprehensive Quality Assurance Plan (CompQAP, SWFWMD 1997). When analyzing the water quality data, there were a large number of measurements below the laboratory detection limit (left censored data). When a value was not reported but listed as below the limit of detection (LOD) then one-half the detection limit was substituted for statistical analysis. After May 2003, new laboratory methods and detection limits were used. The description of both laboratory analyses along with their detection limits are listed in Tables 2a and 2b. POND CHARACTERIZATION COMPARISONS Field Parameters - Dissolved oxygen, temperature, pH, conductivity and sometimes oxidation reduction potential (redox) were measured with various HydrolabTM units. Measurements were taken for one to two weeks at a time when there was enough water in the pond for the sensors to operate. For the outflow comparison study, the units were placed near the outfall structure in each pond to compare conditions in the pond. Sediment Samples - Sediments were collected in eight locations in the ponds and separated into two depths (the first inch of the sediment surface and 4 to 5 inches below the surface) (Figure 3).

Characterization of Three Stormwater Ponds, Final Report (WM716) September 2004
______________________________________________________________________________ Southwest Florida Water Management District, Resource Management Dept. Stormwater Program -11-
Table 2. Description of laboratory analyses for parameters measured in stormwater study. References refer to sections in Standard Methods (APHA 1992) or (US EPA 1983) where more detailed descriptions can be found. When values were below the laboratory detection limit, one-half the detection limit was substituted for statistical analysis. After May 2003 the methods and detection limits changed (Table 3) Laboratory methods before May 2003. Parameter
Method
Det. Limit
Reference.
Total Suspended Solids
Total filterable residue dried at 103-105o C
0.05 mg/l
SM 2540
Total lead
Electrothermal atomic absorption spectrometry
0.001 mg/l
SM 3113 B
Total copper
Electrothermal atomic absorption spectrometry
0.001 mg/l
SM 3113 B
Total cadmium
Electrothermal atomic absorption spectrometry
0.0003 mg/l
SM 3113 B
Total zinc
Direct aspiration into air-acetylene flame
0.015 mg/l
SM 3111 B
Total iron
Direct aspiration into air-acetylene flame
0.025 mg/l
SM 3111 B
Ammonia-N
Automated phenate
0.1 mg/l
SM4500
Organic nitrogen
Semi Automatic Block Digestor
0.01 mg/l
EPA 351.2
Nitrate-nitrite-N
Cadmium reduction
0.01 mg/l
EPA 353.2
Total Phosphorus
0.01 mg/l
EPA 365.1
Ortho-phosphorus
Colorimetric automated block digester
0.01 mg/l SM 4500-P
Calcium
Flame/furnace atomic absorption
0.04 mg/l
EPA 200.7
Magnesium
Flame/furnace atomic absorption
0.006 mg/l
EPA 200.7
Table 3. Description of laboratory analyses for parameters measured in stormwater

Characterization of Three Stormwater Ponds, Final Report (WM716) September 2004
______________________________________________________________________________ Southwest Florida Water Management District, Resource Management Dept. Stormwater Program -12-
study. References refer to sections in Standard Methods (APHA 1992) or (US EPA 1983), where more detailed descriptions can be found. When values were below the laboratory detection limit, one-half the detection limit was substituted for statistical analysis. Laboratory methods and detection limits after May 2003 Parameter
Method after May 2003
Det. Limit
Reference.
Total Suspended Solids
Total filterable residue dried at 103-105o C
0.5 mg/l
SM 2540 D
Total and dissolved lead
ICP-OES
0.010 mg/l
EPA 200.7
Total & dissolved copper
ICP-OES
0.003 mg/l
EPA 200.7
Total cadmium
ICP-OES
0.001 mg/l
EPA 200.7
Total and dissolved zinc
ICP-OES
0.002 mg/l
EPA 200.7
Total and dissolved iron
ICP-OES
0.0125 mg/l
EPA 200.7
Ammonia-N
Automated phenate
0.005 mg/l
SM4500 NH3-H
Total nitrogen
Potassium persulfate auto clave
0.03 mg/l
EPA 353.2 SM4500 MC
Nitrate-nitrite-N
Cadmium reduction
0.0025 mg/l
EPA 353.2
Total Phosphorus
0.01 mg/l
EPA 365.1
Ortho-phosphorus
Ammonium persulfate auto clave
0.01 mg/l
SM 4500-P-F
Calcium
ICP-OES
0.25 mg/l
EPA 200.7
Magnesium
ICP-OES
0.25 mg/l
EPA 200.7
QAPP Appendix_AR_TABELS

Characterization of Three Stormwater Ponds, Final Report (WM716) September 2004
______________________________________________________________________________ Southwest Florida Water Management District, Resource Management Dept. Stormwater Program -13-
Samples were taken near the inflow and outflow of each pond and the Street Pond was divided into both its parts with samples collected at the inflow and outflow before the equalizer pipes (pond 3) and again after entering the filtration pond (pond 4). Sampling equipment was prepared in advance and both the procedure for cleaning the equipment and collecting the samples followed the protocol listed in the District’s Comprehensive Quality Assurance Plan (SWFWMD 1998). A hand driven two-inch acrylic corer was used to collect sample for nutrients, particle size analysis and metals. These were well mixed in a stainless steel basin using stainless steel implements. Four to six replicate cores were required to obtain an adequate sample for analysis. These were mixed using the four-corner method (SWFWMD 1998). Priority pollutant samples were collected with a stainless steel spoon and the sediments were taken for comparable depths and area as the other sediment samples. Samples were placed in EPA approved ICHEM glass jars supplied by the Department of Environmental Protection (FDEP) and analyzed in the FDEP laboratory in Tallahassee following EPA approved methods. Figure 3. Location of sediment and macroinvertebrate sampling sites.
Characterization of Three Stormwater Ponds, Final Report (WM716) September 2004
______________________________________________________________________________ Southwest Florida Water Management District, Resource Management Dept. Stormwater Program -14-
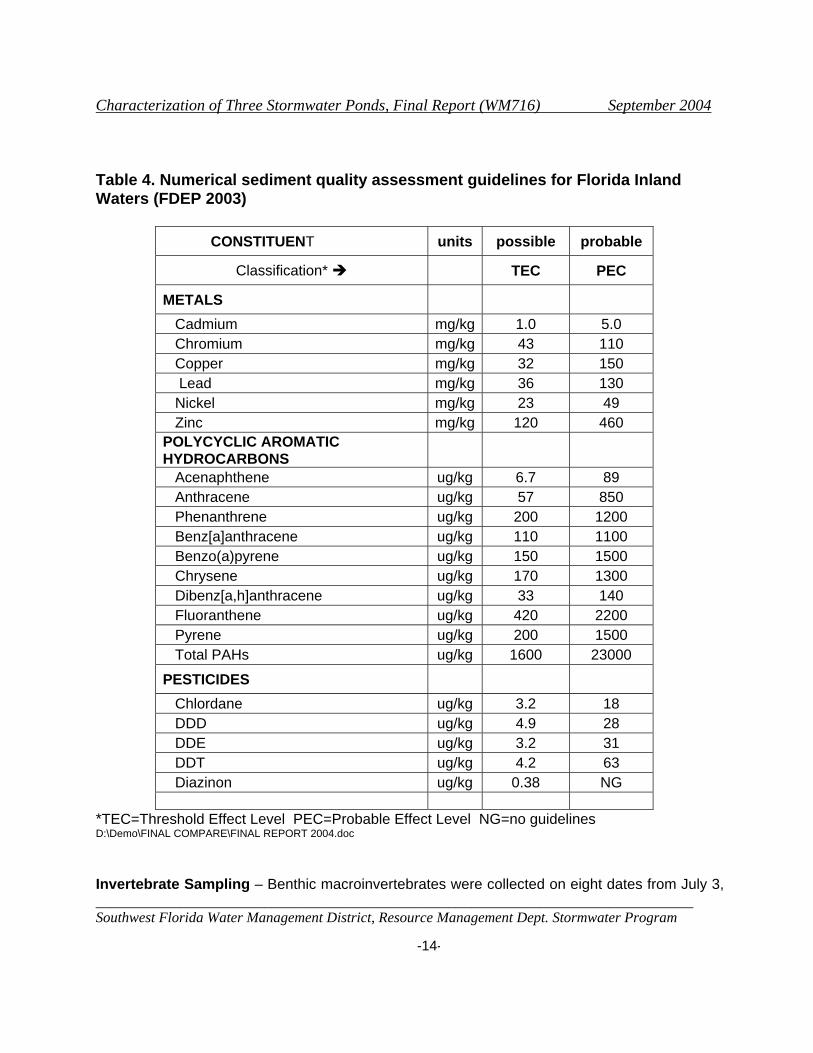
Table 4. Numerical sediment quality assessment guidelines for Florida Inland Waters (FDEP 2003)
CONSTITUENT units possible probable
Classification* TEC PEC
METALS
Cadmium mg/kg 1.0 5.0 Chromium mg/kg 43 110 Copper mg/kg 32 150 Lead mg/kg 36 130 Nickel mg/kg 23 49 Zinc mg/kg 120 460 POLYCYCLIC AROMATIC HYDROCARBONS
Acenaphthene ug/kg 6.7 89 Anthracene ug/kg 57 850 Phenanthrene ug/kg 200 1200 Benz[a]anthracene ug/kg 110 1100 Benzo(a)pyrene ug/kg 150 1500 Chrysene ug/kg 170 1300 Dibenz[a,h]anthracene ug/kg 33 140 Fluoranthene ug/kg 420 2200 Pyrene ug/kg 200 1500 Total PAHs ug/kg 1600 23000
PESTICIDES
Chlordane ug/kg 3.2 18 DDD ug/kg 4.9 28 DDE ug/kg 3.2 31 DDT ug/kg 4.2 63 Diazinon ug/kg 0.38 NG
*TEC=Threshold Effect Level PEC=Probable Effect Level NG=no guidelines D:\Demo\FINAL COMPARE\FINAL REPORT 2004.doc Invertebrate Sampling – Benthic macroinvertebrates were collected on eight dates from July 3,

Characterization of Three Stormwater Ponds, Final Report (WM716) September 2004
______________________________________________________________________________ Southwest Florida Water Management District, Resource Management Dept. Stormwater Program -15-
1997 through August 21, 1997 at eight sites where sediments were sampled. Samples were collected with a 6-inch by 6-inch Ekman dredge and sieved in the field using a #30(250 um) standard testing sieve. The organisms retained were placed into 4-liter Nalgene bottles, preserved with 10 percent formalin, and stained with rose Bengal. In the laboratory, organisms were sorted win white enamel pans and idenfitied to genus and species using a variety of taxonomic keys (Ashe, 1983; Brinkhurst, 1986; Klemm, 1982; Milligan, 1997; Pennak, 1989; Thorp and Covich, 1991).
Macroinvertebrate assemblages were evaluated using tha Shannon-Weaver diversity Index and the equitability measurement. Diversity indices provide information on the effects of environmental stresses on biological communities, and values calculated for macroinvertebrate assemblages are often used to characterize water or sediment quality (USEPA 1973). The Sannon Weaver Diversity Index is based on information theory and takes into consideration the number of species (or taxa) present and the relative abundance of each species (or taxon). Species diversity can be calculated according to:
S H= -Σ(pi)(log2 pi)
i = 1
where H = the diversity index s = the observed species i = the species number pi = proportion of individuals of the total
sample belonging to the ith species
The Shannon-Weaver Diversity Index has been used to determine diversity in polluted and unpolluted bodies of water. It has been estimated that unpolluted water typically has a diversity index between 3 and 4 and where in polluted water diversity measure is less than 2 in polluted water (Wilhm 1970).
The equitability measurement is used to describe the component of diversity which may be
attributed to the "evenness" of the distribution of the total number of individuals among the species (or taxa) present. A measure of equitability, which is calculated as:
E' = H/HM
where E’ = equitability
H =the observed species diversity. HM =the maximum species diversity based on the number of species in the sample.
The equitability measurement is more sensitive to pollution than the Shannon-Weaver
Diversity measurement (EPA 1973) and usually ranges from 0 to 1. The equitability measurement ranges from 0.6 to 0.8 in unpolluted streams and 0.0 to 0.3 in polluted streams (Odum, 1983).
Characterization of Three Stormwater Ponds, Final Report (WM716) September 2004
______________________________________________________________________________ Southwest Florida Water Management District, Resource Management Dept. Stormwater Program -16-
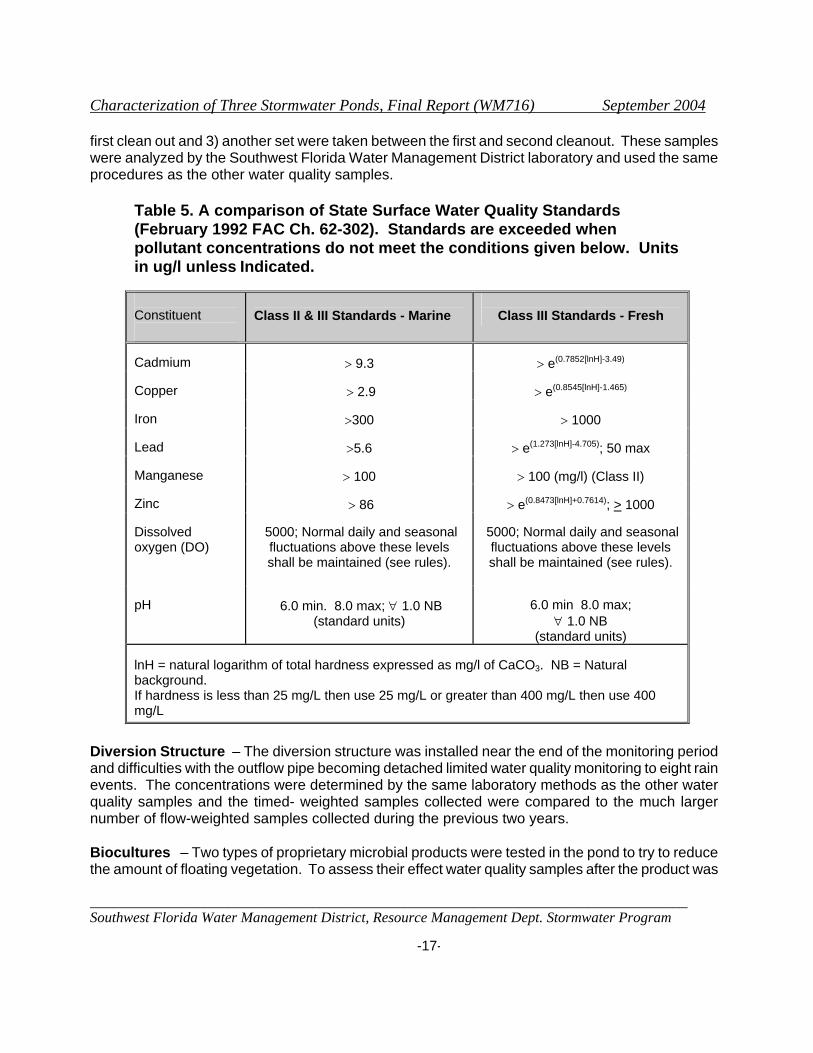
The Wilcoxon Rank Sum test (Mann-Whitney U test) was used to evaluate significant differences in macroinvertebrate abundance among sites. The Wilcoxon Rank Sum test is a nonparametric test for comparing two independent groups (Helsel and Hirsch, 1995). Water Quality Samples – In addition to the storm event samples collected in the intensive two-year study, storm event grab samples collected over a four-year period were also compared. Water quality samples have been collected at the Florida Aquarium during and after storm events since 1997, but the early samples were grab samples and the later samples were flow-weighted taken using automated equipment. Since the storm samples in this study only compare concentrations at the outflow of the pond it was theorized that by the time water was discharged, it would be well mixed and perhaps there would be no statistical difference between samples. To test this theory grab samples were compared to the results of composite samples for 21 rain event in the Building pond and for 13 storm events in the Street pond (Appendix A). Almost all samples measured significantly higher concentrations at the outflow with grab samples (Mann Whitney test, alpha=0.10). The exceptions were ammonia and total nitrogen, which showed no significant differences. The data for this test can be found in Appendix A-2 to A-5. Even though differences were noted, concentrations for the four years were compared to each other and to State Water Quality Standards. Comparison to State Standards - Water quality concentrations were compared to State of Florida Water Quality Standards (Ch 62-302 FS) to determine percent exceedances (non-compliance) of standards. Data were compared to both Class II and Class III standards since both seemed appropriate for the site. Class II standards apply to levels considered safe for shellfish propagation or harvesting and since waters at the site discharge to an estuary it is desirable for water quality to meet these standards. Class III standards for marine waters are essentially the same as Class II marine waters for the parameters measured and are included with them in Table 5. In addition, water quality was compared with the Class III fresh water standards, which are the levels deemed detrimental for recreation and the propagation and maintenance of a healthy, well-balanced population of fish and wildlife. For metals, these standards are based on water hardness and a unique standard was calculated for each water sample. Standards for the parameters tested are listed in Table 3. POND IMPROVEMENT TECHNIQUES Drop Box Samples – The gross pollutants collected in the grate inlet skimmer box inserts at time of clean-out were analyzed by Columbia Laboratory for particle size using the dry sieve method. Representative aliquots of the material from the seven skimmer boxes were mixed together on a volume-weighted basis and two samples were extracted from the mixed material to send to the laboratory for analysis. Five different ranges of particle sizes were analyzed for selected metals, polycyclic hydrocarbons, organic matter, nitrogen and phosphorus. More detailed information about how samples were collected and combined can be found in Appendix A. Sample locations are in Figure 4. Water quality samples were taken using a peristolic pump to determine the concentrations of constituents in storm water in the bottom of the drop boxes. A set of samples was taken 1) before the skimmer box inserts were installed, 2) during the period after they were installed and before the
Characterization of Three Stormwater Ponds, Final Report (WM716) September 2004
______________________________________________________________________________ Southwest Florida Water Management District, Resource Management Dept. Stormwater Program -17-
first clean out and 3) another set were taken between the first and second cleanout. These samples were analyzed by the Southwest Florida Water Management District laboratory and used the same procedures as the other water quality samples.
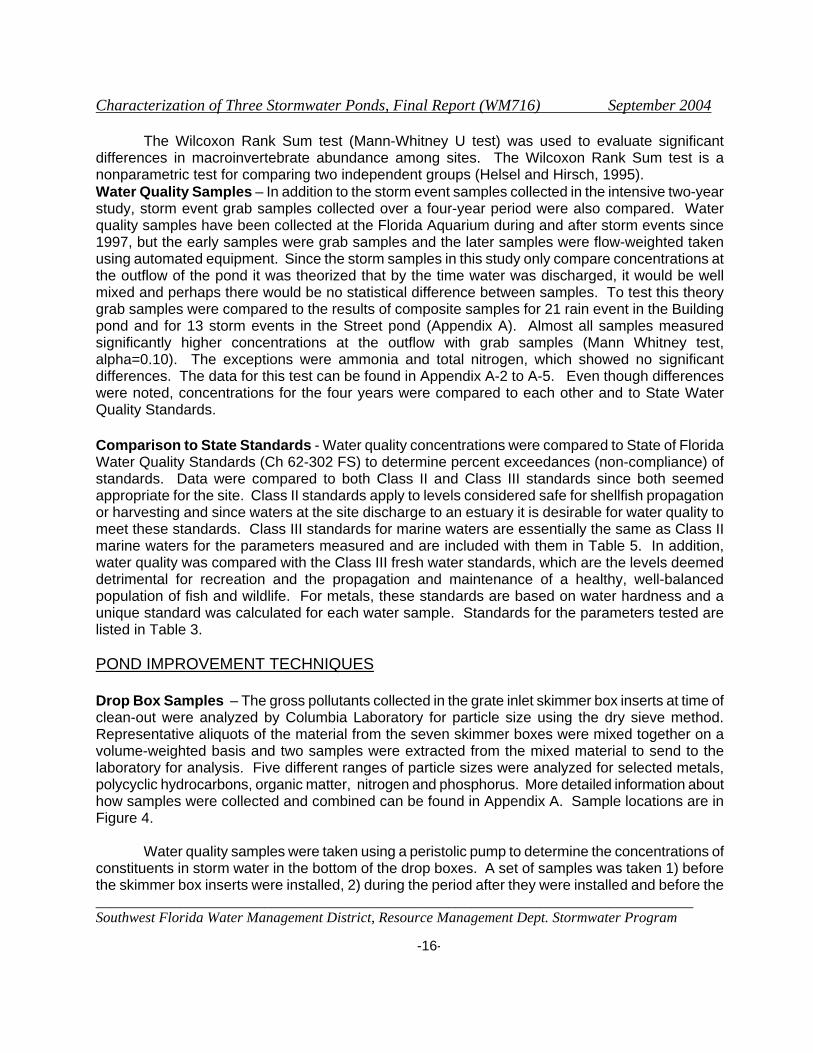
Table 5. A comparison of State Surface Water Quality Standards (February 1992 FAC Ch. 62-302). Standards are exceeded when pollutant concentrations do not meet the conditions given below. Units in ug/l unless Indicated. Constituent
Class II & III Standards - Marine
Class III Standards - Fresh
Cadmium
> 9.3
> e(0.7852[lnH]-3.49)
Copper
> 2.9
> e(0.8545[lnH]-1.465)
Iron
>300
> 1000
Lead
>5.6
> e(1.273[lnH]-4.705); 50 max
Manganese
> 100
> 100 (mg/l) (Class II)
Zinc
> 86
> e(0.8473[lnH]+0.7614); > 1000
Dissolved oxygen (DO)
5000; Normal daily and seasonal
fluctuations above these levels shall be maintained (see rules).
5000; Normal daily and seasonal
fluctuations above these levels shall be maintained (see rules).
pH
6.0 min. 8.0 max; ∀ 1.0 NB
(standard units)
6.0 min 8.0 max;
∀ 1.0 NB (standard units)
lnH = natural logarithm of total hardness expressed as mg/l of CaCO3. NB = Natural background. If hardness is less than 25 mg/L then use 25 mg/L or greater than 400 mg/L then use 400 mg/L
Diversion Structure – The diversion structure was installed near the end of the monitoring period and difficulties with the outflow pipe becoming detached limited water quality monitoring to eight rain events. The concentrations were determined by the same laboratory methods as the other water quality samples and the timed- weighted samples collected were compared to the much larger number of flow-weighted samples collected during the previous two years. Biocultures – Two types of proprietary microbial products were tested in the pond to try to reduce the amount of floating vegetation. To assess their effect water quality samples after the product was
Characterization of Three Stormwater Ponds, Final Report (WM716) September 2004
______________________________________________________________________________ Southwest Florida Water Management District, Resource Management Dept. Stormwater Program -18-
introduced were compared to samples taken before the treatment. Hydrolab measurements of dissolved oxygen, pH, temperature and conductivity were also measured.
Figure 4. Location of drop boxes that drain into the pipe system that discharges into the Building pond. The skimmer box inserts were installed in these drop
Characterization of Three Stormwater Ponds, Final Report (WM716) September 2004
______________________________________________________________________________ Southwest Florida Water Management District, Resource Management Dept. Stormwater Program -19-
boxes.
RESULTS AND DISCUSSION
This study was designed to compare three different types of stormwater wet ponds -- an effluent filtration system (Street pond), a wet detention pond (Building pond), and a low impact parking lot design (Parking Lot pond). The ponds were named for the major type of runoff they received. The report is divided into three sections: 1) The intensive study evaluates storm event sampling in the Building and Street ponds for two years using automatic monitoring equipment. The Parking Lot pond had been eliminated to build a cruise ship terminal. 2) The pond characterization study compares water quality, sediments, field parameters and the biota covering a four-year period for the three ponds. 3) The pond improvement study evaluated methods to enhance stormwater treatment and pond aesthetics.
INTENSIVE STORMWATER MONITORING STUDY
Although data were collected at the site between November 1996 and November 2003, only
the 2001 and 2003 years represented an intensive monitoring effort. The two years of data in this section place special emphasis on comparing the hydrology and water quality at the outflow of two types of stormwater management systems. Once automatic equipment was installed, the complete hydrology measured in 15-minute increments was recorded and flow-weighted water quality samples could be collected. For storm events, the data are compared in two ways: 1) Year one and year two are divided by the construction period, and 2) Data-year-one and data-year-two are for comparable 10-month periods (November through August). In addition, rainfall characteristics and outflow data were analyzed for storm events.
Construction activities complicated some of the measurements and also interrupted data
collection for an eight-month period. For year one, the outflow and the under drains in both the Street and Building ponds were compared, and for year two, the monitoring in the under drain in the failed filtration system of the Building pond was discontinued and monitoring was initiated in a new under drain installed in the Street pond. The control elevations of the outfall weirs, the bleed down pipe and the under-drain pipe are shown in Appendix C to compare with pond levels. The storms with water quality data are numbered for easy cross-reference with other data. Although some water quality samples have been collected in the ponds for over five years, only the water quality and flow data from November 2000 through August 2001 (year one) and July 2002 through November 2004 (year two) are presented in this section and water quality data for four years, which include both composite and grab samples, are compared later.
Hydrology Measurements Continuous hydrology measurements were made of rainfall, pond elevations and water levels in the underdrain pipes to analyze rainfall characteristics, pond levels and flow amounts. Amount of Rain - Florida normally has wet and dry seasons with sixty percent of all rainfall
Characterization of Three Stormwater Ponds, Final Report (WM716) September 2004
______________________________________________________________________________ Southwest Florida Water Management District, Resource Management Dept. Stormwater Program -20-
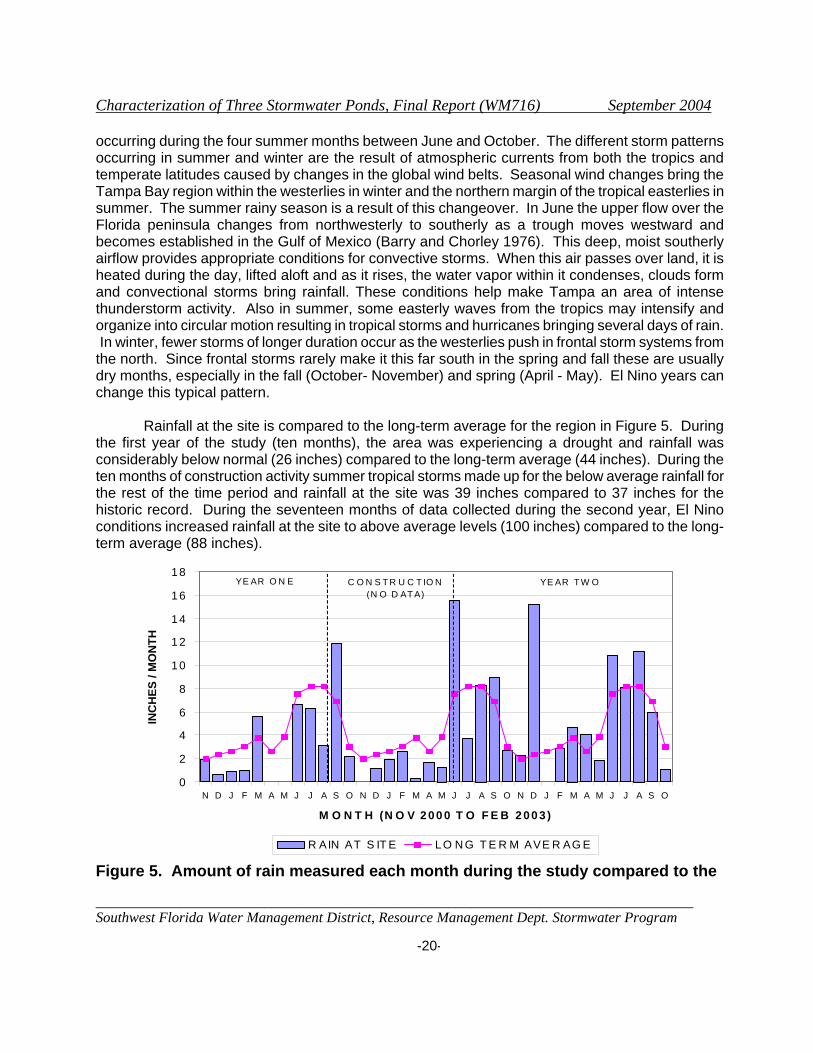
occurring during the four summer months between June and October. The different storm patterns occurring in summer and winter are the result of atmospheric currents from both the tropics and temperate latitudes caused by changes in the global wind belts. Seasonal wind changes bring the Tampa Bay region within the westerlies in winter and the northern margin of the tropical easterlies in summer. The summer rainy season is a result of this changeover. In June the upper flow over the Florida peninsula changes from northwesterly to southerly as a trough moves westward and becomes established in the Gulf of Mexico (Barry and Chorley 1976). This deep, moist southerly airflow provides appropriate conditions for convective storms. When this air passes over land, it is heated during the day, lifted aloft and as it rises, the water vapor within it condenses, clouds form and convectional storms bring rainfall. These conditions help make Tampa an area of intense thunderstorm activity. Also in summer, some easterly waves from the tropics may intensify and organize into circular motion resulting in tropical storms and hurricanes bringing several days of rain. In winter, fewer storms of longer duration occur as the westerlies push in frontal storm systems from the north. Since frontal storms rarely make it this far south in the spring and fall these are usually dry months, especially in the fall (October- November) and spring (April - May). El Nino years can change this typical pattern. Rainfall at the site is compared to the long-term average for the region in Figure 5. During the first year of the study (ten months), the area was experiencing a drought and rainfall was considerably below normal (26 inches) compared to the long-term average (44 inches). During the ten months of construction activity summer tropical storms made up for the below average rainfall for the rest of the time period and rainfall at the site was 39 inches compared to 37 inches for the historic record. During the seventeen months of data collected during the second year, El Nino conditions increased rainfall at the site to above average levels (100 inches) compared to the long-term average (88 inches).
0
2
4
6
8
10
12
14
16
18
N D J F M A M J J A S O N D J F M A M J J A S O N D J F M A M J J A S O
M O N T H (N O V 2 00 0 T O F E B 2 00 3 )
INC
HES
/ M
ON
TH
R AIN AT S IT E LO N G T E R M AVE R AG E
YE AR O N E C O N S T R U C T IO N (N O D AT A)
YE AR T W O
Figure 5. Amount of rain measured each month during the study compared to the
Characterization of Three Stormwater Ponds, Final Report (WM716) September 2004
______________________________________________________________________________ Southwest Florida Water Management District, Resource Management Dept. Stormwater Program -21-
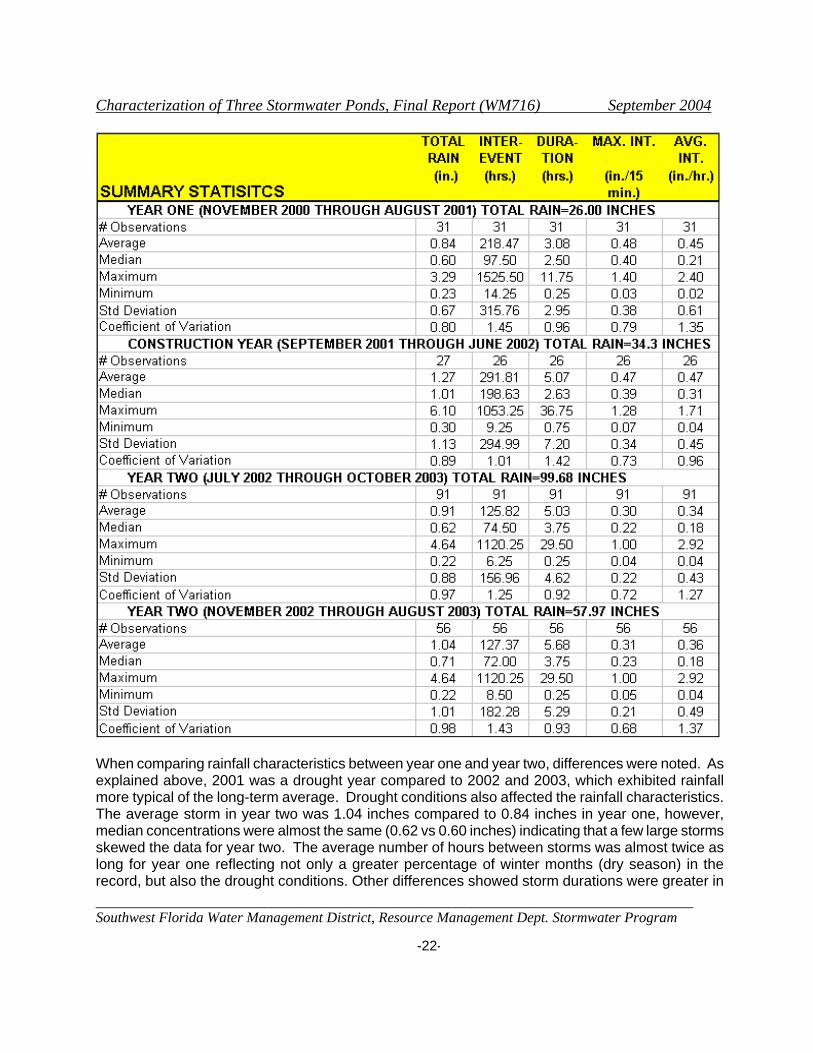
long-term rainfall average for the region. Rainfall Characteristics - The intensity and duration of rain events are relevant to water quantity concerns by causing flooding and elevated peak discharges, especially in urban areas where much of the ground surface has been covered in concrete. The increase in impervious area also intensifies runoff problems by increasing pollutants and decreasing infiltration. Rainfall characteristics are summarized in Table 5 and all the data are recorded in Appendix B. Table 5. A summary of rainfall characteristics measured for most rain events that produced flow (rain > 0.23 inches). All the data are in Appendix B.
Characterization of Three Stormwater Ponds, Final Report (WM716) September 2004
______________________________________________________________________________ Southwest Florida Water Management District, Resource Management Dept. Stormwater Program -22-
When comparing rainfall characteristics between year one and year two, differences were noted. As explained above, 2001 was a drought year compared to 2002 and 2003, which exhibited rainfall more typical of the long-term average. Drought conditions also affected the rainfall characteristics. The average storm in year two was 1.04 inches compared to 0.84 inches in year one, however, median concentrations were almost the same (0.62 vs 0.60 inches) indicating that a few large storms skewed the data for year two. The average number of hours between storms was almost twice as long for year one reflecting not only a greater percentage of winter months (dry season) in the record, but also the drought conditions. Other differences showed storm durations were greater in
Characterization of Three Stormwater Ponds, Final Report (WM716) September 2004
______________________________________________________________________________ Southwest Florida Water Management District, Resource Management Dept. Stormwater Program -23-
year two while storms were more intense in year one. When two comparable ten-month periods were evaluated almost twice as many storms were measured for data-year-two, which also had greater rain amounts (1.04 vs 0.84 inches), half the average inter-event dry period and longer storm durations with less rainfall intensity (Table 5). Rainfall characteristics influence pollutant concentrations and removal efficiencies in several ways. Antecedent conditions (inter-event dry period) and rainfall intensity increase pollutant concentrations by providing time for accumulation on land surfaces as well as the rain energy to dislodge soil particles and other pollutants from the watershed. The size of the rain event also affects receiving waters. Small rain events account for 50 to 70 percent of all storms in our region, but produce only 10 to 20 percent of the runoff volume (Burton and Pitt 2002). The authors further explained that medium-sized events (from 0.5 inches to several inches in depth) contribute the majority of runoff volume and mass pollutant discharges. Therefore, the medium sized storms are likely responsible for most of the biological effects in the receiving waters (especially habitat destruction and sediment contamination). In addition, the few large storms (greater than several inches) also have a greater effect with the ability to flush out a stormwater system. This is especially true for discharging floating algae mats, phytoplankton and other organic matter from wet ponds into the receiving waters as well as depositing large amounts of pollution into the pond. Also wet and dry years affect input and output concentrations by changing subsurface flow and evapotranspiration. Some researchers have found that precipitation tends to contain contaminants at higher concentrations in short storms and when precipitation is infrequent (Mitsch and Gosselink 1993). This suggests that the washout effect, with rainfall purifying the air, is prevalent in short storms, while longer rainfall events dilute stormwater with better quality water. Water Levels - The purpose of the data collection effort in this section was to compare two types of wet ponds used for stormwater treatment. The water levels at the outflow of the ponds for all the data are compared in Appendix C. The figures in Appendix C show the response of the ponds to specific amounts of rainfall and how pond levels relate to their weir configurations. For the Street pond (the effluent filtration system) the control elevation is the bottom of the draw down pipes (6.00 ft NGVD) and the overflow elevation is the top of the weir (6.99 for year 1 and 7.17 for year 2). A diagram of the underground filter system is in Figure 2. For the Building pond (a wet detention pond) the control elevation of the bleed down orifice is shown on the graphs as 5.83 and the over flow weir elevation is 7.49. More exact measurements for weir levels can be found in Appendix A. The figures in Appendix C were useful in making more precise measurements for elevations in relation to our measuring devices and they also provide a record of problems with the recording sensors. Water levels are also useful for comparing the reaction of the two different types of ponds to storm events. A comparison of the water levels in the two ponds indicate similar responses to rainfall, although the smaller wet detention pond with a bleed down pipe (Building pond) fluctuates more widely than the effluent filtration system with under drains (Street pond) Figure 6. The pond levels in Figure 6 indicate that a level of 7.50 NGVD looks reasonable for the top of the overflow weir in the Building Pond and 7.17 is reasonable for the over flow weir in the Street Pond. The control elevation for the under drain system in the Street pond is 6.00 NGVD, but it appears that flow into the under drains slows considerably at 6.5 NGVD. In general the bleed down structure in the Building pond discharges water at a slightly more rapid rate than the under drain pipes in the Street

Characterization of Three Stormwater Ponds, Final Report (WM716) September 2004
______________________________________________________________________________ Southwest Florida Water Management District, Resource Management Dept. Stormwater Program -24-
pond. The levels indicate that the under drain system in the Street pond is still operational after seven years, even though it has received no maintenance, although it may have been cleaned out during cruise ship terminal construction and the installation of an additional underdrain system on the north side of the pond.
POND LEVELSSEPTEMBER 2002
5
5.5
6
6.5
7
7.5
8
1 2 3 4 5 6 7 8 9 10 11 12 13 14 15 16 17 18 19 20 21 22 23 24 25 26 27 28 29 30
NG
VD (f
t)
0
0.2
0.4
0.6
0.8
1
1.2
1.4
1.6
1.8
2
2.2
RA
IN (i
n / 1
5 m
in)
STREET POND BUILDLING POND RAIN
Figure 6. Comparison of pond levels in response to rainfall after the cruise ship terminal construction. Since the outfall structure was changed and an additional under drain had been installed for the water levels described above. The same water level analysis was applied to data collected before the cruise terminal construction (Figure 7). The Building pond was not altered by the cruise ship terminal construction, but the Street pond outfall structure was rebuilt. The shape of the filtration pond and the outfall weir were altered to accommodate an access road, while an additional under drain system was installed on the north side of the outfall weir structure (see Figure 1b). Before construction the over flow weir for the Street pond was at 7.04 NGVD and this level looks reasonable from the behavior of the water level in the pond. The decline in water levels through the under drain pipes show water discharge out of the pond but the flow decreases at about 6.3 NGVD even though the bottom of the under drain pipes are at 6.00 NGVD. The water level sensor in the Street pond is located at 5.4 NGVD and the bottom of the pond level where the water level is measured is at 5.8 NGVD explaining the flat line for the lower water level readings and the steep decline after water in the stilling well went below the bottom of the pond on June 16th. Once again, the water levels indicate the under drain pipes are functioning. As in the previous analysis, the Building pond shows slightly wider variations than the Street pond. The control elevation for the bleed down orifice for the Building pond is located at 5.8 NGVD, which is also indicated by the change in water levels. All the water level information for each month of the project is shown in
Characterization of Three Stormwater Ponds, Final Report (WM716) September 2004
______________________________________________________________________________ Southwest Florida Water Management District, Resource Management Dept. Stormwater Program -25-
Appendix C with the top of weir elevations and the draw down or bleed down elevations indicated on the figures.
POND LEVEL COMPARISONSJUNE 2001
5
5.5
6
6.5
7
7.5
8
1 2 3 4 5 6 7 8 9 10 11 12 13 14 15 16 17 18 19 20 21 22 23 24 25 26 27 28 29 30
NG
VD (f
t)
0
0.5
1
1.5
2
RA
IN (i
n / 1
5 m
in)
STREET BUILDING RAIN
Figure 5. Comparison of pond levels to rainfall before the cruise ship terminal construction. Pond Designs – Hydrology is important in designing effective stormwater ponds. The ponds must take care of a reasonable amount of runoff and pollution without costing too much or causing flooding upstream. To meet these goals, calculations are made to treat the runoff from a percentage of all storm events given a minimum inter-event dry period. If all the runoff water from 90 percent of the storm events can be treated in the pond, it is assumed the pollutant mass loads associated with 90 percent of the storm events will be removed (Wanielista and Yousef 1993). The runoff from all storm events with one inch or less of rainfall are specified to be treated in Florida (Livingston 1989). For the Street pond, it is estimated that 49 percent of inflow during year one and 32 percent of inflow during year two were discharged over the outflow weir and bypassed the under drain filter system. No comparable calculations could be made for the Building pond since no inflow data were available, but an analysis of the number of times the ponds discharged over the weir during storm events indicate that most of the storm water would have been slowly released through the bleed down orifice. Out of the 66 storms over 0.10-inch depth measured in data-year-one, 20 storms (30%) discharged some water over the weir in the Street pond, while the Building pond only discharged 7 storms (11%) over the weir. Considerably more rainfall occurred during data-year-two and another under drain was added to the Street pond. Out of the 80 storms over 0.10-inch depth measured during that year, 28 (35%) discharged over the outfall weir in the Street pond and 24 (30%), in the Building pond. For data-year-one, only 7 storms were greater than one inch, while in data-year-two, 18 storms measured rainfall greater than one inch. It should also be noted that for small drainage areas less than 100 acres, only the first one-half inch of runoff has to be treated in effluent filtration
Characterization of Three Stormwater Ponds, Final Report (WM716) September 2004
______________________________________________________________________________ Southwest Florida Water Management District, Resource Management Dept. Stormwater Program -26-
systems, but one inch of runoff still has to be treated in wet-detention pond. Although reducing runoff volume is important in protecting receiving waters, the pollution in runoff is also of concern. Water Quality Measurements Constituent chemical concentrations in rainfall and in storm water discharge over outfall weirs were analyzed to determine effects on receiving waters. Overflow Weir Storm Water - A comparison of water quality concentrations measured in rainfall and at the outflow of the ponds demonstrates differences between the two ponds and between years (Figure 8 and Appendix D). This section compares water quality discharged from the two ponds over the bypass outfall structures. The discharge through the under drain systems are discussed in a later section and more complete information about the entire effluent filtration system is available in a companion report (Teague and Rushton 2005). Nitrogen – The various forms of nitrogen exhibit a complex cycle where different chemical states are continually involved in transformations and other processes. A simplified explanation might describe the cycle as an organic carbon source providing the energy for use by organisms to transform nitrogen by ammonification, nitrification, denitrification, fixation and assimilation. Natural systems have developed over time to balance the cycle, but anthropogenic nitrogen concentrations discharged by modern technology have increased nutrients in storm runoff far beyond the levels that natural systems have adapted to. These nitrogen sources include agriculture, automobiles, power plants, urban yards and many industries. Nitrogen compounds are of great concern in stormwater ponds because of their role in eutrophication and their effect on the oxygen content of receiving waters. On the other hand, nitrogen is an essential nutrient for plant growth, which in turn is utilized by wild life. Striking the correct nutrient balance before water is discharged from stormwater ponds is the goal of management, but achieving these reduced nitrogen levels often results in rampant plant growth in stormwater ponds, which is objectionable to some people. Concentrations of nitrogen are a reflection of pond conditions (Figure 8). Ammonium nitrogen is the preferred form for plant growth, and it is formed by the decomposition of dead plant material, which under anaerobic conditions, is microbially converted to nitrates (Kadlec and Knight 1996). Low levels are considered 0.05 to 0.10 mg/l and plant growth increases as more ammonium is added. These low concentrations were measured in the discharge water in the Street pond, but higher levels than these were measured in the Building pond and in rainfall.

Characterization of Three Stormwater Ponds, Final Report (WM716) September 2004
______________________________________________________________________________ Southwest Florida Water Management District, Resource Management Dept. Stormwater Program -27-
AMMONIA (mg/l)
0.00
0.05
0.10
0.15
0.20
0.25
0.30
0.35
RAIN BUILDING STREET
YEAR ONE YEAR TWO
NITRATE+NITRITE (mg/l)
0.00
0.05
0.10
0.15
0.20
0.25
0.30
RAIN BUILDING STREET
YEAR ONE YEAR TWO
ORTHO PHOSPHORUS (mg/l)
0.00
0.01
0.02
0.03
0.04
0.05
0.06
0.07
RAIN BUILDING STREET
YEAR ONE YEAR TWO
TOTAL PHOSPHORUS (mg/l)
0.00
0.02
0.04
0.06
0.08
0.10
0.12
0.14
0.16
0.18
RAIN BUILDING STREET
YEAR ONE YEAR TWO
TOTAL SUSPENDED SOLIDS (mg/l)
0
2
4
6
8
10
12
BUILDING STREET
YEAR ONE YEAR TWO
ORGANIC NITROGEN (mg/l)
0.00
0.10
0.20
0.30
0.40
0.50
0.60
0.70
0.80
RAIN BUILDING STREET
YEAR ONE YEAR TWO
Figure 8. Nutrients measured in rainfall and discharge water over the outflow weir. It includes averaged data from November to August for both year one and year two.

Characterization of Three Stormwater Ponds, Final Report (WM716) September 2004
______________________________________________________________________________ Southwest Florida Water Management District, Resource Management Dept. Stormwater Program -28-
Nitrate is usually measured at low levels of about 0.10 mg/l in natural wetlands since conditions of the necessary carbon source and anoxic conditions favor denitrification (Kadlec and Knight 1996). Nitrate was measured higher than this level in rainfall and during the second year of the study in the Building pond, but concentrations measured in the discharge water at the overflow weir were well below 0.10 mg/l for both years in the Street pond. Organic nitrogen is formed in wetlands as a product of biomass decomposition, which degrades to ammonium nitrogen (Kadlec and Knight 1996). In natural wetlands, the result is a low concentration of organic nitrogen concentration of approximately 1 to 2 mg/l. Organic nitrogen was measured at much lower levels than that in the Florida Aquarium ponds. Phosphorus – The introduction of even trace amounts of phosphorus into receiving waters can have a profound effect on the structure of aquatic systems. Although phosphorus is a required nutrient for plant growth, even small increases can upset the balance of aquatic systems. In inland waters, it is often a limiting factor and small concentration increases can cause a shift in the trophic state of receiving waters. Unlike nitrogen, rainfall is not a significant source for phosphorus, but phosphorus is introduced into the pond environment by soil erosion, construction activities, fertilizers, cleaning products, and vegetation cycling. Pathways for the removal of phosphorus in the water column are sedimentation and the sorption of phosphorus to soil particles. Unlike nitrogen, which has a gaseous phase, phosphorus is bound up in the sedimentary cycle and is released back into the water column by low dissolved oxygen as part of the redox cycle. Although phosphorus is not directly altered by changes in redox as are nitrogen, iron, manganese, and sulfur, it is indirectly released from soils and sediments by its association with these elements, especially iron. In fact, the buffer capacity of the sediment, which determines how much phosphate can be adsorbed or desorbed is determined by the concentration of iron oxides, which in turn are dependent on oxygen. In highly productive (eutrophic) systems such as storm water ponds, phosphorus can be sorbed during the day when dissolved oxygen is high only to be released by sediment organisms at night in response to anoxic conditions (Hamelink et al. 1994). Even in oxygen rich sediments, once soil attachment sites are occupied, they are no longer available for phosphate removal. Also, if phosphorus is bound up in the plankton, it may subsequently decompose to release soluble phosphorus. Phosphorus was measured at relatively low concentrations at the outfall of both stormwater ponds at the Florida Aquarium (Figure 8). Most pristine natural wetlands have total phosphorus concentrations less than 0.1 mg/l, although some oligotrophic wetlands such as the Florida Everglades are adapted to much lower levels (0.01 mg/l) (Kadlec and Knight 1996). The total phosphorus concentrations for the first year in both ponds were measured either near or below 0.1 mg/l, but these concentrations had increased to greater than 0.14 mg/l in the second year. Rainfall TP can range from 0.01 to 0.05 mg/l depending on land use with average values more commonly 0.02 to 0.04 mg/l (Kadlec and Knight 1996). These levels are consistent with the concentrations measured in rainfall at the Florida Aquarium.
Total Suspended Solids (TSS) – The term suspended solids is descriptive of the organic and inorganic particulate matter which is of a size and type that allows the particles to stay suspended in water. Suspended sediments decrease light penetration and photosysthesis, clog gills and filtering systems of aquatic organisms, reduce prey capture, reduce spawning, reduce survival of sensitive species, and carry adsorbed pollutants (Burton and Pitt 2002). Most suspended particles measured
Characterization of Three Stormwater Ponds, Final Report (WM716) September 2004
______________________________________________________________________________ Southwest Florida Water Management District, Resource Management Dept. Stormwater Program -29-
in stormwater are less than 45 um in size (Stahre and Urbonas 1990). TSS is of importance in understanding stormwater pollution since it is believed that most pollutants appear to have a strong affinity to suspended solids, but there are exceptions especially for dissolved and soluble constituents (Stahre and Urbonas 1990).
The total suspended solids in the Aquarium ponds were measured at reasonably low levels
(4 to 10 mg/l) (Figure 8). High TSS concentrations are more easily reduced than low concentrations, and a lower limit of 10 to 20 mg/l has been estimated as the boundary when no further sedimentation occurs (Stahre and Urbonas 1990). Low concentrations of suspended solids (average values less than 5 mg/l for year one and less than 10 mg/l for year two) measured at the outflow of these two ponds are consistent with other research results which have shown that stormwater ponds are effective for removing suspended solids. General Trends - Some general trends in nutrient concentrations measured for storm events in the Aquarium ponds were shown in Figure 8. These include: 1) average constituent concentrations measured higher in the Building pond than in the Street pond, 2) higher average concentrations of nutrient and suspended solid during the second year in both ponds, 3) higher concentrations of ammonia and nitrate are usually measured in rainfall than at the outflow of the ponds, and 4) concentrations in rainfall were measured much lower during the second year. Some explanations for these results are discussed below.
The higher concentrations measured in the Building pond resulted from the fact that the three inflow pipes discharged near the outflow weir and pollution did not have an opportunity to travel through the littoral zone at the far end of the pond. In fact, stormwater was discharged almost as soon as it entered the pond for the higher flows. A diversion wall to direct flow into the littoral zone was installed near the end of the monitoring period, and these results will be discussed in a later section. Another reason for elevated nutrient levels in the Building pond was the different type of drainage basins. The Building pond received runoff from a plant nursery, garden areas and a delivery loading dock, all of which contribute nutrients. In addition, the loading dock has a sump pump, which discharges directly into the pond during high water levels. This water has everything from garbage, cleaning supplies, fish food, and much more. Although street runoff contains high levels of oils, greases, metals and sediments, the only nutrients it receives are from rainfall, which resulted in lower nutrient concentrations entering the Street pond. The sources of these solids are primarily from dry deposition, roadways, construction, and erosion. The higher concentrations measured during the second year of the study indicate the more intensive use of the land during year two. Year one represented pollution from construction activity, but year two included more traffic, more people and additional activities with the opening of the cruise ship terminal and better access to the Aquarium. Also year one was a drought year and the ponds experienced longer inter-event dry periods (on average 218 hours compared to 127 hours in year two (See Table 5). The longer average time water stays in ponds before being flushed out with another storm event, the more time pond processes have to reduce pollutant concentrations. Not all constituents increased in the ponds during the second year. The lower organic nitrogen measured in the Building pond was the result of the Hillsborough County Adopt-A-Pond
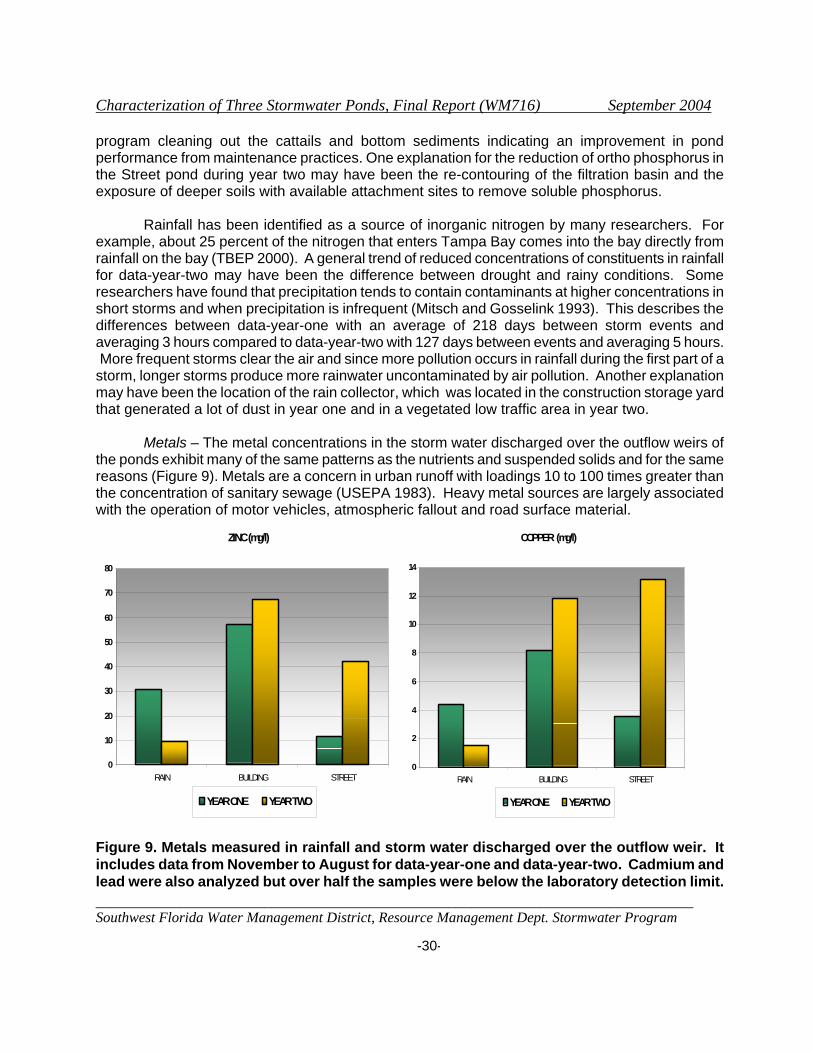
Characterization of Three Stormwater Ponds, Final Report (WM716) September 2004
______________________________________________________________________________ Southwest Florida Water Management District, Resource Management Dept. Stormwater Program -30-
program cleaning out the cattails and bottom sediments indicating an improvement in pond performance from maintenance practices. One explanation for the reduction of ortho phosphorus in the Street pond during year two may have been the re-contouring of the filtration basin and the exposure of deeper soils with available attachment sites to remove soluble phosphorus. Rainfall has been identified as a source of inorganic nitrogen by many researchers. For example, about 25 percent of the nitrogen that enters Tampa Bay comes into the bay directly from rainfall on the bay (TBEP 2000). A general trend of reduced concentrations of constituents in rainfall for data-year-two may have been the difference between drought and rainy conditions. Some researchers have found that precipitation tends to contain contaminants at higher concentrations in short storms and when precipitation is infrequent (Mitsch and Gosselink 1993). This describes the differences between data-year-one with an average of 218 days between storm events and averaging 3 hours compared to data-year-two with 127 days between events and averaging 5 hours. More frequent storms clear the air and since more pollution occurs in rainfall during the first part of a storm, longer storms produce more rainwater uncontaminated by air pollution. Another explanation may have been the location of the rain collector, which was located in the construction storage yard that generated a lot of dust in year one and in a vegetated low traffic area in year two.
Metals – The metal concentrations in the storm water discharged over the outflow weirs of the ponds exhibit many of the same patterns as the nutrients and suspended solids and for the same reasons (Figure 9). Metals are a concern in urban runoff with loadings 10 to 100 times greater than the concentration of sanitary sewage (USEPA 1983). Heavy metal sources are largely associated with the operation of motor vehicles, atmospheric fallout and road surface material.
ZINC (mg/l)
0
10
20
30
40
50
60
70
80
RAIN BUILDING STREET
YEAR ONE YEAR TWO
COPPER (mg/l)
0
2
4
6
8
10
12
14
RAIN BUILDING STREET
YEAR ONE YEAR TWO
Figure 9. Metals measured in rainfall and storm water discharged over the outflow weir. It includes data from November to August for data-year-one and data-year-two. Cadmium and lead were also analyzed but over half the samples were below the laboratory detection limit.
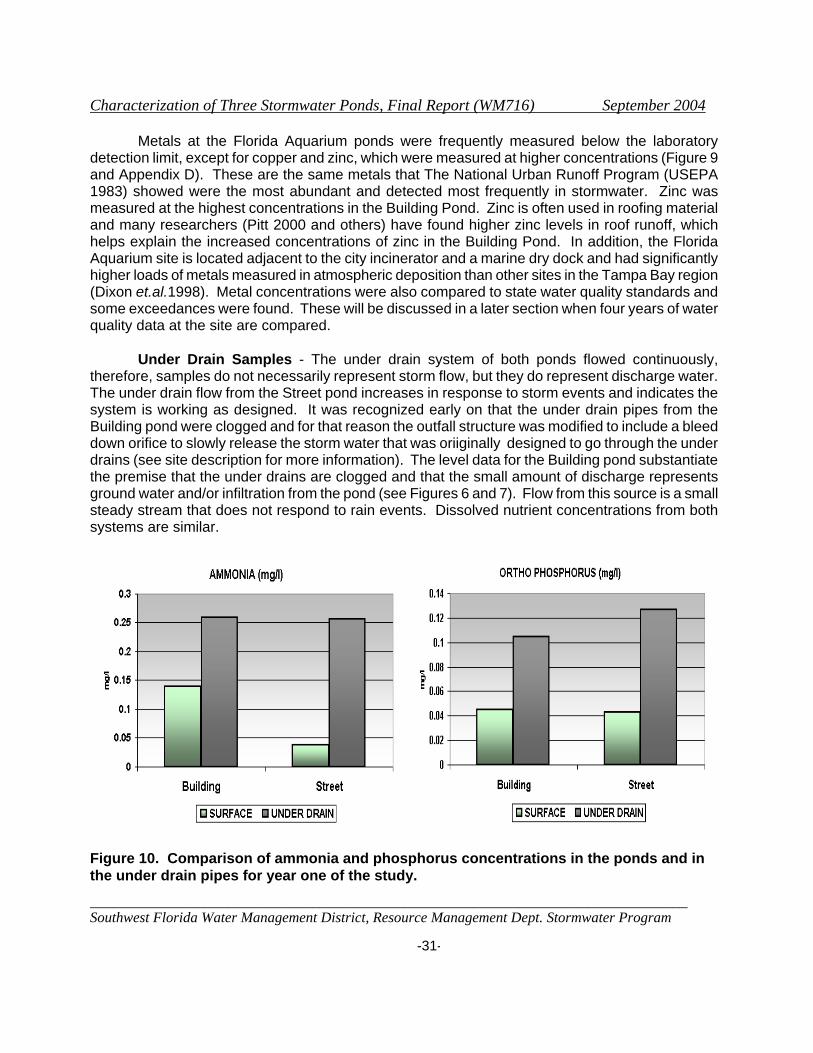
Characterization of Three Stormwater Ponds, Final Report (WM716) September 2004
______________________________________________________________________________ Southwest Florida Water Management District, Resource Management Dept. Stormwater Program -31-
Metals at the Florida Aquarium ponds were frequently measured below the laboratory detection limit, except for copper and zinc, which were measured at higher concentrations (Figure 9 and Appendix D). These are the same metals that The National Urban Runoff Program (USEPA 1983) showed were the most abundant and detected most frequently in stormwater. Zinc was measured at the highest concentrations in the Building Pond. Zinc is often used in roofing material and many researchers (Pitt 2000 and others) have found higher zinc levels in roof runoff, which helps explain the increased concentrations of zinc in the Building Pond. In addition, the Florida Aquarium site is located adjacent to the city incinerator and a marine dry dock and had significantly higher loads of metals measured in atmospheric deposition than other sites in the Tampa Bay region (Dixon et.al.1998). Metal concentrations were also compared to state water quality standards and some exceedances were found. These will be discussed in a later section when four years of water quality data at the site are compared.
Under Drain Samples - The under drain system of both ponds flowed continuously, therefore, samples do not necessarily represent storm flow, but they do represent discharge water. The under drain flow from the Street pond increases in response to storm events and indicates the system is working as designed. It was recognized early on that the under drain pipes from the Building pond were clogged and for that reason the outfall structure was modified to include a bleed down orifice to slowly release the storm water that was oriiginally designed to go through the under drains (see site description for more information). The level data for the Building pond substantiate the premise that the under drains are clogged and that the small amount of discharge represents ground water and/or infiltration from the pond (see Figures 6 and 7). Flow from this source is a small steady stream that does not respond to rain events. Dissolved nutrient concentrations from both systems are similar.
Figure 10. Comparison of ammonia and phosphorus concentrations in the ponds and in the under drain pipes for year one of the study.

Characterization of Three Stormwater Ponds, Final Report (WM716) September 2004
______________________________________________________________________________ Southwest Florida Water Management District, Resource Management Dept. Stormwater Program -32-
Samples were collected from the under drains of both pipes during the first year of the study and the results provide some insight into the effect of ground water infiltration (Figure 10 and Appendix E). The under drains in the Street pond collect infiltration from ground water as well as direct flow from ground water through the system. It is believed that most of the water discharged from the Building pond under drains is from ground water that has been transported through the filter. The water flowing from the Street pond when the pond level was below the drawdown pipes probably represents groundwater and no storm flow. The surface water represents storm flows and the under drain water quality measures the averaged values for continuous flow (Figure 10). Much higher concentrations of ammonia and ortho- phosphorus are measured discharging through the filters than measured in storm water.
One explanation for this discrepancy was found when a complete water budget was constructed for the Street pond and an analysis of constituent concentrations was evaluated dependent on the level of the pond. The water budget for the Street pond during storm events estimated that 20 percent of flow was discharged over the outfall weir, 77 percent exited through the under drains and 3 percent was lost by evapotranspiration. It was also estimated that about 9 percent more water left the pond than was measured entering at the inflow. An analysis of the data for the Street pond, which divided the under drain discharge into storm flow and flow discharged when the water level in the pond was below the level of the draw down pipe substantiates some of the differences measured in the two under drain systems. The concentrations of ammonia and ortho-phospphorus are much higher when the level of the pond was measured below the level of the draw down pipes (Figure 11). A more complete analysis of the water budget and concentrations measured in the Street pond is available in a companion report (Teague and Rushton 2005).
Figure 11. Box plots of under drain flow for ammonia and ortho-phosphorous during different pond levels. Key: storm event—STORM (blue), above the bottom of the under drain pipe (ABOVE (orange), and below the bottom of the under drain pipe—BELOW (green) (adapted from Teague and Rushton 2005).

Characterization of Three Stormwater Ponds, Final Report (WM716) September 2004
______________________________________________________________________________ Southwest Florida Water Management District, Resource Management Dept. Stormwater Program -33-
Other studies have also measured higher levels of dissolved nitrogen and phosphorus in the under drain pipes of effluent filtration systems. For example, in the Lake Tohopekaliga Demonstration Project, Cullum and Dierberg (1990) measured concentrations of ammonia, nitrate, and soluble reactive phosphorus higher in the under drain outflows than in water within the pond. Harper and Herr (1993) also observed that concentrations of both ammonia and nitrate increased substantially during migration through the filter media at the DeBary detention with filtrations site. They also found increases of over 200% for outflow concentrations of ortho phosphorus through the filter media. Trapped organic particles of N and P on the filter media were listed as probable causes. It is this filterable form of pollutant that has a greater potential for affecting aquifers and is also the most difficult to control using conventional stormwater methods that rely on sedimentation principles (Pitt 1996).
Figure 12. Comparison of copper, zinc, iron and sulfate concentrations measured in storm water compared to the discharge water of the under drain pipes.
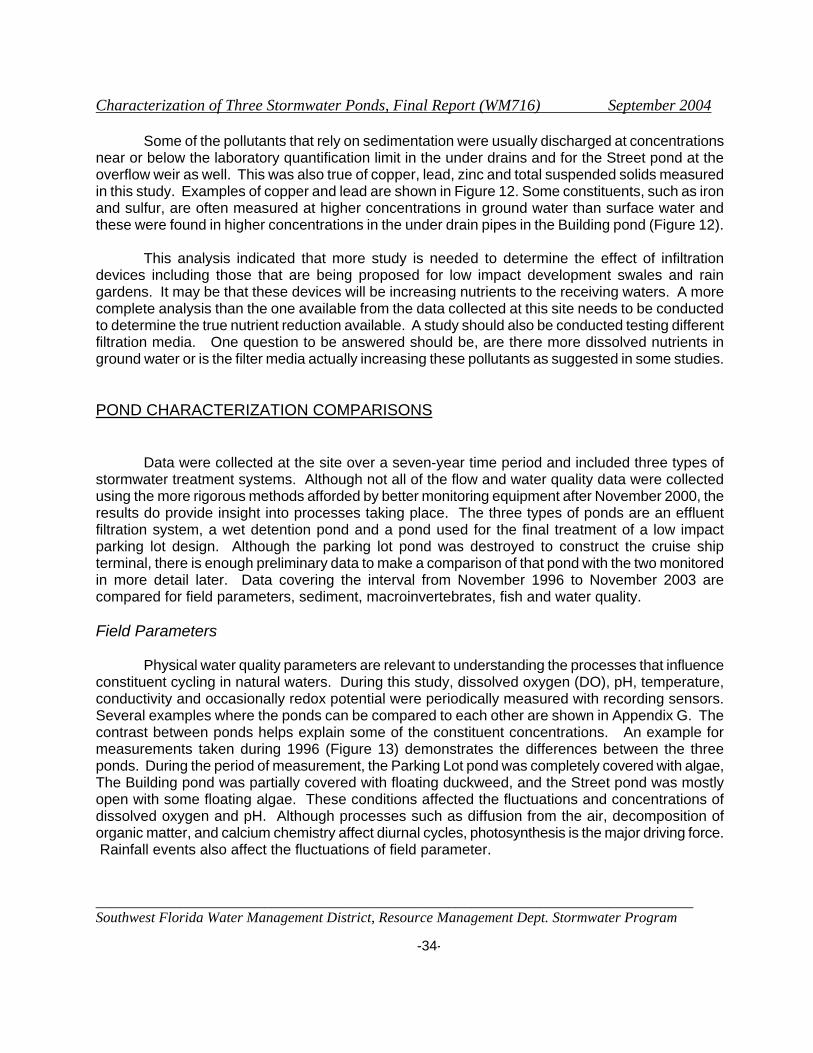
Characterization of Three Stormwater Ponds, Final Report (WM716) September 2004
______________________________________________________________________________ Southwest Florida Water Management District, Resource Management Dept. Stormwater Program -34-
Some of the pollutants that rely on sedimentation were usually discharged at concentrations near or below the laboratory quantification limit in the under drains and for the Street pond at the overflow weir as well. This was also true of copper, lead, zinc and total suspended solids measured in this study. Examples of copper and lead are shown in Figure 12. Some constituents, such as iron and sulfur, are often measured at higher concentrations in ground water than surface water and these were found in higher concentrations in the under drain pipes in the Building pond (Figure 12).
This analysis indicated that more study is needed to determine the effect of infiltration
devices including those that are being proposed for low impact development swales and rain gardens. It may be that these devices will be increasing nutrients to the receiving waters. A more complete analysis than the one available from the data collected at this site needs to be conducted to determine the true nutrient reduction available. A study should also be conducted testing different filtration media. One question to be answered should be, are there more dissolved nutrients in ground water or is the filter media actually increasing these pollutants as suggested in some studies. POND CHARACTERIZATION COMPARISONS
Data were collected at the site over a seven-year time period and included three types of stormwater treatment systems. Although not all of the flow and water quality data were collected using the more rigorous methods afforded by better monitoring equipment after November 2000, the results do provide insight into processes taking place. The three types of ponds are an effluent filtration system, a wet detention pond and a pond used for the final treatment of a low impact parking lot design. Although the parking lot pond was destroyed to construct the cruise ship terminal, there is enough preliminary data to make a comparison of that pond with the two monitored in more detail later. Data covering the interval from November 1996 to November 2003 are compared for field parameters, sediment, macroinvertebrates, fish and water quality.
Field Parameters
Physical water quality parameters are relevant to understanding the processes that influence constituent cycling in natural waters. During this study, dissolved oxygen (DO), pH, temperature, conductivity and occasionally redox potential were periodically measured with recording sensors. Several examples where the ponds can be compared to each other are shown in Appendix G. The contrast between ponds helps explain some of the constituent concentrations. An example for measurements taken during 1996 (Figure 13) demonstrates the differences between the three ponds. During the period of measurement, the Parking Lot pond was completely covered with algae, The Building pond was partially covered with floating duckweed, and the Street pond was mostly open with some floating algae. These conditions affected the fluctuations and concentrations of dissolved oxygen and pH. Although processes such as diffusion from the air, decomposition of organic matter, and calcium chemistry affect diurnal cycles, photosynthesis is the major driving force. Rainfall events also affect the fluctuations of field parameter.
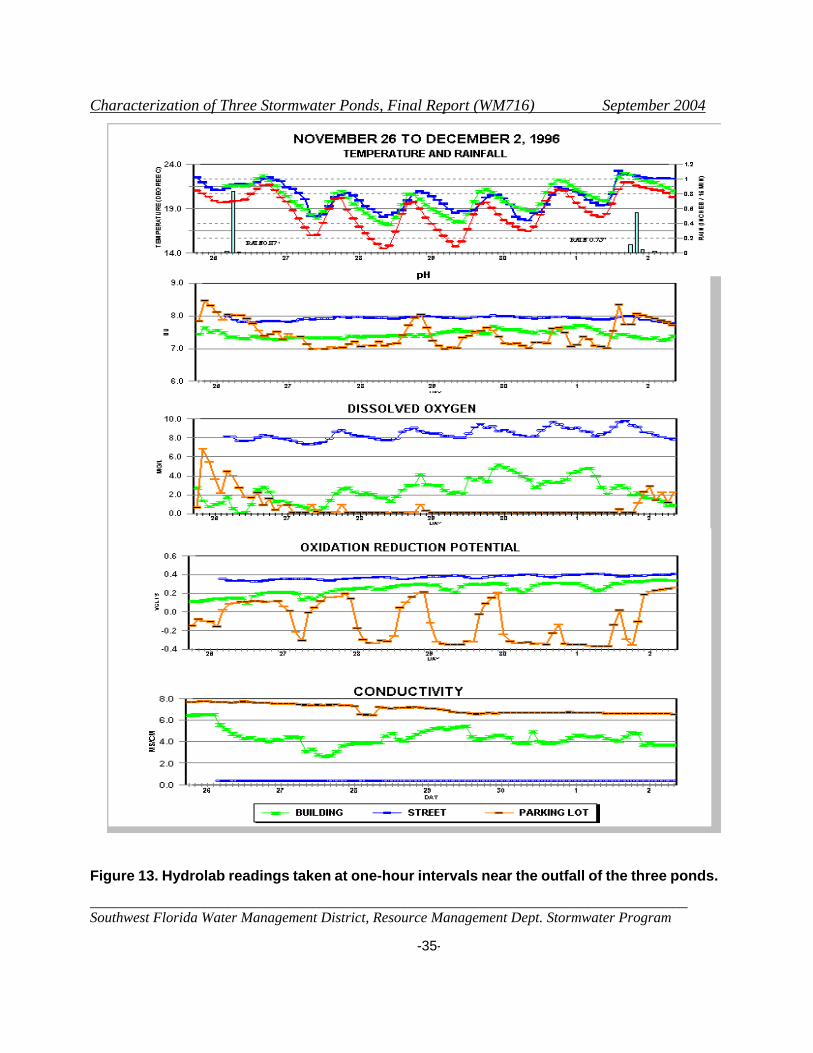
Characterization of Three Stormwater Ponds, Final Report (WM716) September 2004
______________________________________________________________________________ Southwest Florida Water Management District, Resource Management Dept. Stormwater Program -35-
Figure 13. Hydrolab readings taken at one-hour intervals near the outfall of the three ponds.
Characterization of Three Stormwater Ponds, Final Report (WM716) September 2004
______________________________________________________________________________ Southwest Florida Water Management District, Resource Management Dept. Stormwater Program -36-
Daily Fluctuations - Oxygen is the byproduct of photosynthesis, where green plants convert sunlight into chemical energy and give off oxygen during the day while both plants and animals consume oxygen through respiration at night. In aquatic environments, this is seen as the daytime increase and the nighttime disappearance of dissolved oxygen. In winter these fluctuations are dampened because of reduced sunlight and the dormant state of plants. Other conditions that suppress dirurnal fluctuations are floating vegetation or algae mats. These are the conditions shown in Figure 13 where the Parking Lot pond is covered with floating algae mats and winter conditions have dampened the fluctuations in the other two ponds. Dissolved Oxygen - In productive (eutrophic) lakes and ponds in summer the cycle for dissolved oxygen and pH is quite pronounced indicating an abundance of biological activity is taking place and this is the pattern most often seen for the Street pond and sometimes when floating mats of vegetation are not present in the other two ponds (Appendix G). Since the process of photosynthesis requires sunlight for algal photosynthesis, it is suppressed in ponds with dense covers of floating vegetation. Anoxic conditions release phosphorous and metals from the sediments and aerobic organisms are more efficient transformers of pollutants, therefore, the State of Florida water quality standards set the minimum level for any 24-hour period at 5.0 mg/L with 4.0 mg/L as the absolute minimum. These low oxygen levels may have been one reason why higher concentrations of pollutants were discharged from the Building pond than from the Street pond. pH of the Street pond exhibits the same diurnal cycle as oxygen because pH is also driven by photosynthesis. Photosynthesis during the day utilizes carbon dioxide and produces oxygen, thereby shifting the carbonate-bicarbonate-carbon dioxide equilibria to a higher pH. The cycle is reversed at night when respiration uses oxygen and gives off carbon dioxide. Diurnal pH fluctuations are not evident in systems covered in floating vegetation, which explains the much more moderated level in the Building pond. The pH is important because many treatment bacteria are not able to exist outside of certain ranges. This explains one reason the State of Florida has set a range between 6.5 SU to 8.5 SU for its water quality standard for pH unless natural conditions such as peat bogs exist. Denitrifiers operate best in the range 6.5< pH <7.5, and nitrifiers prefer pH = 7.2 (Kadlec and Knight 1996). In addition to controlling various biological processes, pH is also a determinant of several important chemical reactions affecting aluminum, iron, phosphate and ammonium. The Aquarium ponds usually meet state standards for pH, except during the summer when afternoon pH sometimes goes above 9.5 SU. Rainfall Effects – Storms altered the pattern for all the field parameters measured. For the Street pond, which had wide diurnal fluctuations, storms depressed readings, but the Building pond exhibited a different pattern and often showed increases in pH and dissolved oxygen (Appendix G). The increase in dissolved oxygen and pH in the Building pond can be explained because rain carries DO and promotes mixing. It also reduces the amount of floating vegetation as some of this is swept over the outfall weir or sinks to the bottom of the pond. The sag curve for pH seen in the Street pond after rain events is partially caused by dilution from rainfall, which has much lower pH than the pond water. Also oxygen depletion after rain events in the Street pond may be caused by an influx of organic nutrients, which increases bacterial respiration rates, thus exerting a biochemical oxygen demand and reducing oxygen concentrations (Burton and Pitt 2002).
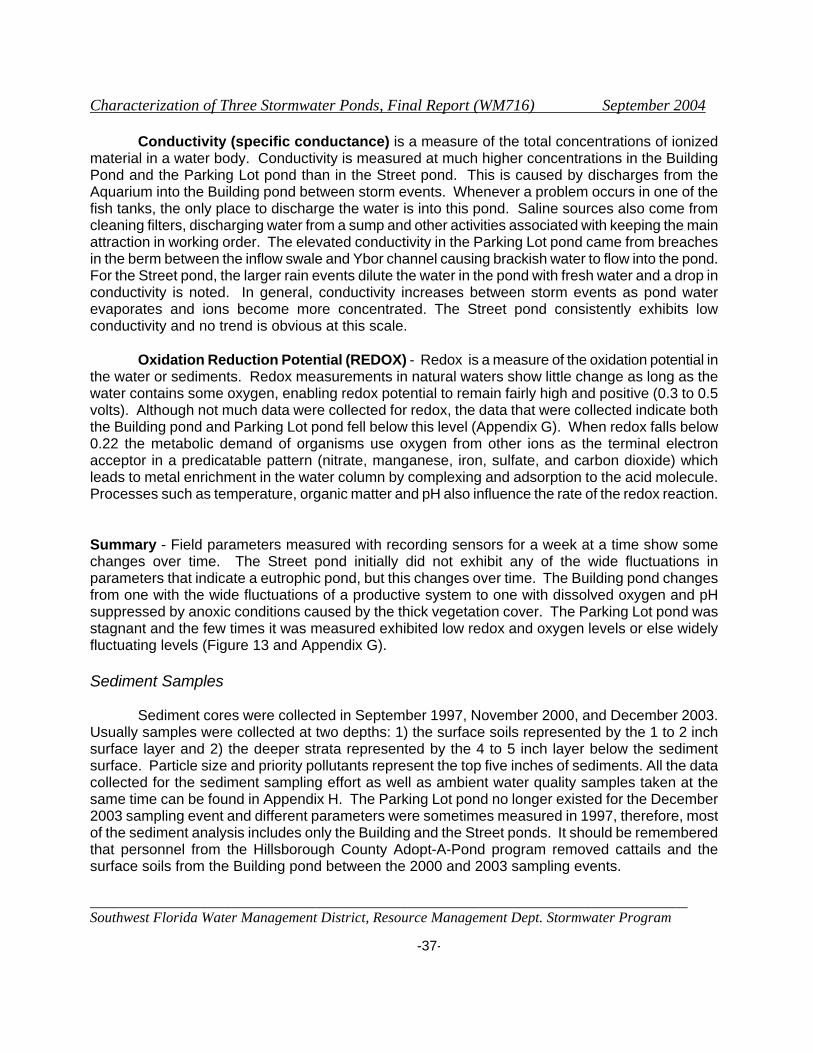
Characterization of Three Stormwater Ponds, Final Report (WM716) September 2004
______________________________________________________________________________ Southwest Florida Water Management District, Resource Management Dept. Stormwater Program -37-
Conductivity (specific conductance) is a measure of the total concentrations of ionized material in a water body. Conductivity is measured at much higher concentrations in the Building Pond and the Parking Lot pond than in the Street pond. This is caused by discharges from the Aquarium into the Building pond between storm events. Whenever a problem occurs in one of the fish tanks, the only place to discharge the water is into this pond. Saline sources also come from cleaning filters, discharging water from a sump and other activities associated with keeping the main attraction in working order. The elevated conductivity in the Parking Lot pond came from breaches in the berm between the inflow swale and Ybor channel causing brackish water to flow into the pond. For the Street pond, the larger rain events dilute the water in the pond with fresh water and a drop in conductivity is noted. In general, conductivity increases between storm events as pond water evaporates and ions become more concentrated. The Street pond consistently exhibits low conductivity and no trend is obvious at this scale. Oxidation Reduction Potential (REDOX) - Redox is a measure of the oxidation potential in the water or sediments. Redox measurements in natural waters show little change as long as the water contains some oxygen, enabling redox potential to remain fairly high and positive (0.3 to 0.5 volts). Although not much data were collected for redox, the data that were collected indicate both the Building pond and Parking Lot pond fell below this level (Appendix G). When redox falls below 0.22 the metabolic demand of organisms use oxygen from other ions as the terminal electron acceptor in a predicatable pattern (nitrate, manganese, iron, sulfate, and carbon dioxide) which leads to metal enrichment in the water column by complexing and adsorption to the acid molecule. Processes such as temperature, organic matter and pH also influence the rate of the redox reaction. Summary - Field parameters measured with recording sensors for a week at a time show some changes over time. The Street pond initially did not exhibit any of the wide fluctuations in parameters that indicate a eutrophic pond, but this changes over time. The Building pond changes from one with the wide fluctuations of a productive system to one with dissolved oxygen and pH suppressed by anoxic conditions caused by the thick vegetation cover. The Parking Lot pond was stagnant and the few times it was measured exhibited low redox and oxygen levels or else widely fluctuating levels (Figure 13 and Appendix G). Sediment Samples
Sediment cores were collected in September 1997, November 2000, and December 2003. Usually samples were collected at two depths: 1) the surface soils represented by the 1 to 2 inch surface layer and 2) the deeper strata represented by the 4 to 5 inch layer below the sediment surface. Particle size and priority pollutants represent the top five inches of sediments. All the data collected for the sediment sampling effort as well as ambient water quality samples taken at the same time can be found in Appendix H. The Parking Lot pond no longer existed for the December 2003 sampling event and different parameters were sometimes measured in 1997, therefore, most of the sediment analysis includes only the Building and the Street ponds. It should be remembered that personnel from the Hillsborough County Adopt-A-Pond program removed cattails and the surface soils from the Building pond between the 2000 and 2003 sampling events.

Characterization of Three Stormwater Ponds, Final Report (WM716) September 2004
______________________________________________________________________________ Southwest Florida Water Management District, Resource Management Dept. Stormwater Program -38-
Particle Size Analysis - Soil particles are composed of widely varying sizes and shapes,
which influence their sedimentation rate. The size of sediment particles also affects the removal of pollutants in stormwater runoff by sedimentation. Usually the smaller the particle size, the greater the attachment of metal ions to the soil particle and the longer it takes for it to settle out of suspension in the water column. For all ponds, the highest percentage (25 to 40%) of the sediment sample was measured in an intermediate size range (0.125 to 0.25 mm) described as medium sand (Figure 14). The smallest particle size (less than 0.063 mm) was also well represented especially in the Building and Parking Lot ponds and since small particle sizes also provide greater attachment sites for metal ions, this may help explain the higher metal concentrations measured in the surface sediments in the Building Pond as will be discussed later.
Figure 14. Particle size measured in the sediments for two different years.
Percent Organic Matter - Organic matter improves soil structure and provides conditions
favored by soil microbes. These microbes are important for transformation and degradation processes that remove pollutants. Also the behavior of metals in aquatic ecosystems is connected to the role of organic matter in processes such as sorption and/or the chelation/complexation of metals. Once metals are bound with organic and inorganic compounds they can settle rapidly and become incorporated in the sediments removing them from the water column and possible transport out of the system.
The Street Pond measured only low concentrations of organic matter (1 to 2%). In contrast,
the Building Pond measured higher concentrations (5 to 8%), probably a result of the considerable floating vegetation that covered the pond and periodically died and sank to the bottom. Since
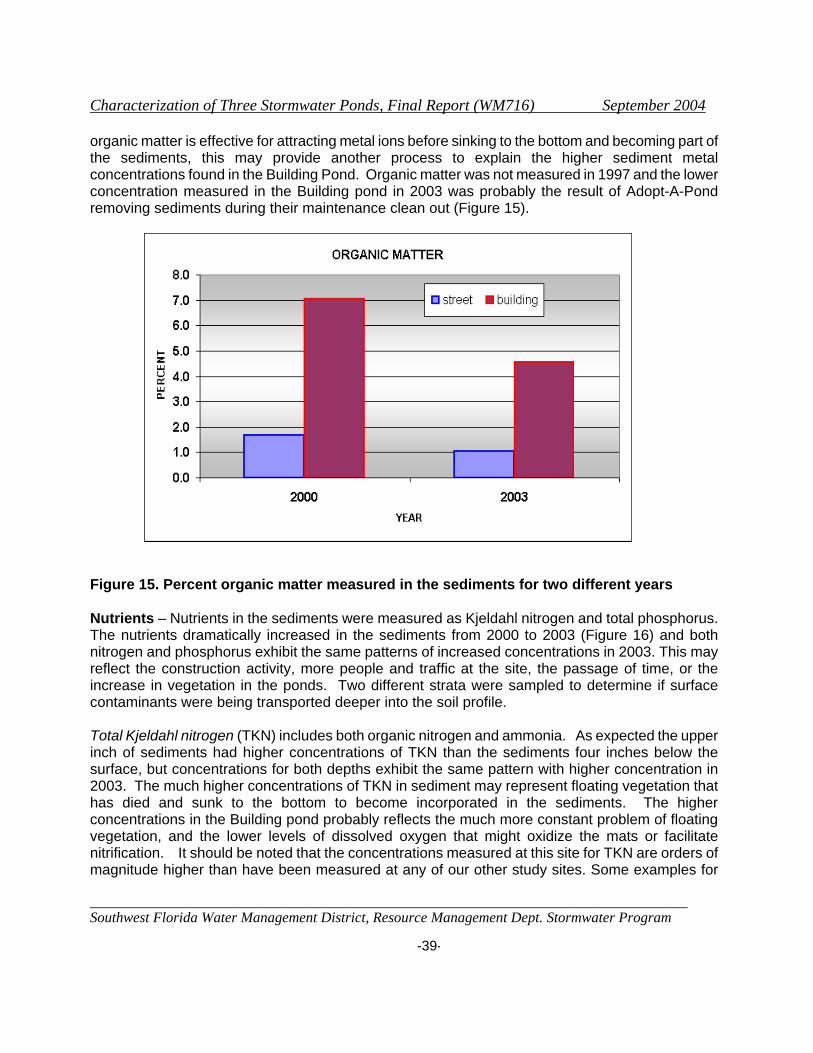
Characterization of Three Stormwater Ponds, Final Report (WM716) September 2004
______________________________________________________________________________ Southwest Florida Water Management District, Resource Management Dept. Stormwater Program -39-
organic matter is effective for attracting metal ions before sinking to the bottom and becoming part of the sediments, this may provide another process to explain the higher sediment metal concentrations found in the Building Pond. Organic matter was not measured in 1997 and the lower concentration measured in the Building pond in 2003 was probably the result of Adopt-A-Pond removing sediments during their maintenance clean out (Figure 15).
Figure 15. Percent organic matter measured in the sediments for two different years Nutrients – Nutrients in the sediments were measured as Kjeldahl nitrogen and total phosphorus. The nutrients dramatically increased in the sediments from 2000 to 2003 (Figure 16) and both nitrogen and phosphorus exhibit the same patterns of increased concentrations in 2003. This may reflect the construction activity, more people and traffic at the site, the passage of time, or the increase in vegetation in the ponds. Two different strata were sampled to determine if surface contaminants were being transported deeper into the soil profile. Total Kjeldahl nitrogen (TKN) includes both organic nitrogen and ammonia. As expected the upper inch of sediments had higher concentrations of TKN than the sediments four inches below the surface, but concentrations for both depths exhibit the same pattern with higher concentration in 2003. The much higher concentrations of TKN in sediment may represent floating vegetation that has died and sunk to the bottom to become incorporated in the sediments. The higher concentrations in the Building pond probably reflects the much more constant problem of floating vegetation, and the lower levels of dissolved oxygen that might oxidize the mats or facilitate nitrification. It should be noted that the concentrations measured at this site for TKN are orders of magnitude higher than have been measured at any of our other study sites. Some examples for
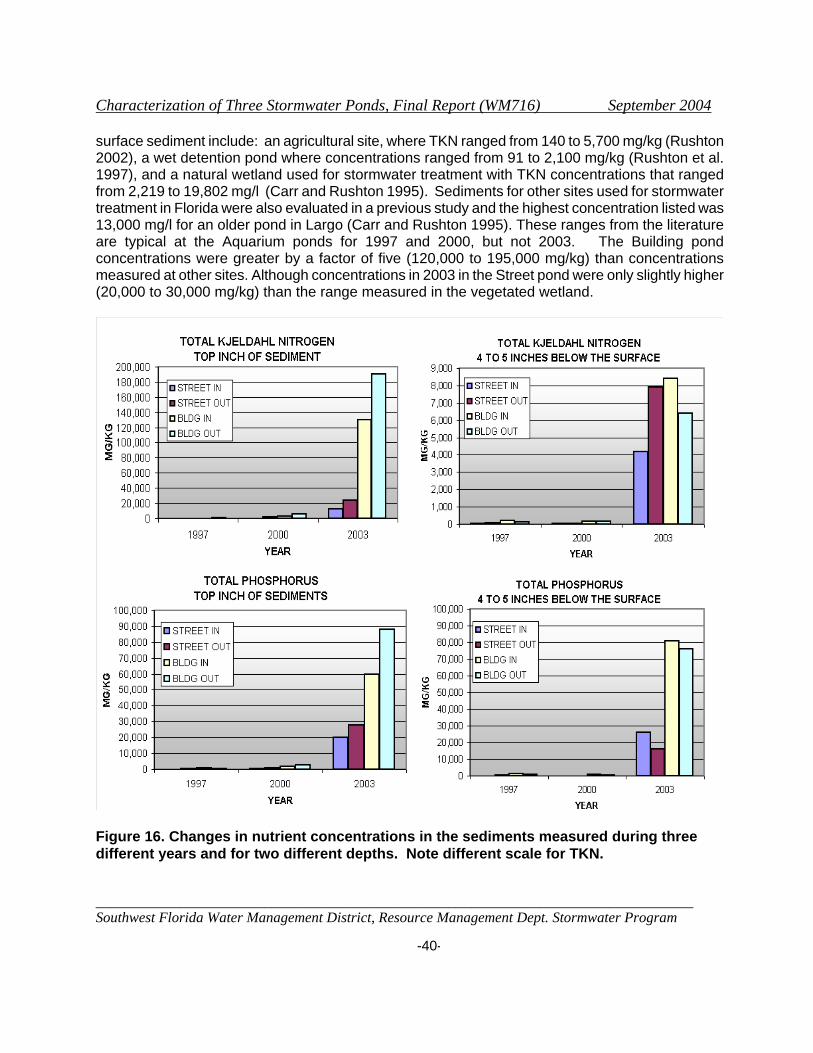
Characterization of Three Stormwater Ponds, Final Report (WM716) September 2004
______________________________________________________________________________ Southwest Florida Water Management District, Resource Management Dept. Stormwater Program -40-
surface sediment include: an agricultural site, where TKN ranged from 140 to 5,700 mg/kg (Rushton 2002), a wet detention pond where concentrations ranged from 91 to 2,100 mg/kg (Rushton et al. 1997), and a natural wetland used for stormwater treatment with TKN concentrations that ranged from 2,219 to 19,802 mg/l (Carr and Rushton 1995). Sediments for other sites used for stormwater treatment in Florida were also evaluated in a previous study and the highest concentration listed was 13,000 mg/l for an older pond in Largo (Carr and Rushton 1995). These ranges from the literature are typical at the Aquarium ponds for 1997 and 2000, but not 2003. The Building pond concentrations were greater by a factor of five (120,000 to 195,000 mg/kg) than concentrations measured at other sites. Although concentrations in 2003 in the Street pond were only slightly higher (20,000 to 30,000 mg/kg) than the range measured in the vegetated wetland.
Figure 16. Changes in nutrient concentrations in the sediments measured during three different years and for two different depths. Note different scale for TKN.

Characterization of Three Stormwater Ponds, Final Report (WM716) September 2004
______________________________________________________________________________ Southwest Florida Water Management District, Resource Management Dept. Stormwater Program -41-
Total Phosphorus – Phosphorus also shows a sharp increase in the sediments in 2003 (Figure 16) and these concentrations were also much higher than measured in other studies, although, for samples collected in 1997 and 2000 the range was comparable to other studies. Unlike TKN, the concentrations in the deeper sediments were about the same or slightly higher than in the surface sediments. This may indicate that phosphorus is being transported to the deeper strata. Water quality samples for total phosphorus taken during storm events were measured at reasonable levels (0.08 to 0.14 mg/l), so sedimentation must have been an important pathway for its removal (see Figure 8). Concentrations for storms did increase by about 0.07 mg/l from year one to year two indicating that the sediments may lose some of their ability to adsorb more phosphorus over time. More studies need to follow the change in stormwater ponds over a long period of time. Metals – The sediments were tested for nine metals, but only a few were measured in concentrations that might cause problems to biota in the ponds (Appendix H). Two of these were Copper and zinc, where concentrations in the surface sediments were much higher in 2000 than in any other year and demonstrated a large increase from concentrations in 1997, especially in the Building pond.
Figure 17. Concentrations of copper and zinc measured in the sediments for three different years and two different strata (Note different scales).
Characterization of Three Stormwater Ponds, Final Report (WM716) September 2004
______________________________________________________________________________ Southwest Florida Water Management District, Resource Management Dept. Stormwater Program -42-
Although concentrations were less in 2003 they were still not reduced to the 1997 levels. Concentrations in the deeper strata were much less than surface sediments and many were below the laboratory detection limit in the Street pond. When concentrations are compared to standards considered a problem for aquatic organisms, the Street pond rarely had concentrations high enough to cause toxicity problems, but the Building pond frequently exceeded the level where organisms could be affected. In fact, copper, lead and zinc exceeded levels where concentrations are probably toxic (see Table 3). The reduction of copper and zinc in the Building pond in 2003 is the result of the removal of surface sediments by the Adopt-A-Pond maintenance activity. However, both copper and zinc still exceeded the concentrations where the surface sediments were probably toxic to organisms (150 mg/kg for copper and 460 mg/kg for zinc). Organic Pollutants - Polycyclic Aromatic Hydrocarbons,s (PAHs) are a product of modern technology, and the increasing dependence of today's society on products derived from organic chemicals has led to widespread hydrocarbon pollution in stormwater runoff. Some of the many pathways available for PAHs to enter the environment are air pollution, exhausts from vehicles, and from asphalt paving material (ATSDR 2001). PAHs do not easily dissolve in water and those present in air as vapors and stuck to the surfaces of small solid particles settle to the bottoms of rivers or lakes. Breakdown in soil and water generally takes weeks to months and is caused primarily by the actions of microorganisms (ATSDR 2001). This emphasizes the importance of keeping conditions in pond sediments suitable for a healthy assortment of biota.
Sediment samples were tested for more than 100 organic pollutants but only those listed in Table 6 were detected at the site. It is difficult to evaluate PAH concentrations since many of the guideline concentrations listed in Table 4 are below the laboratory detection limit. In order to evaluate trends, the percentage of times the PAH was detected in each pond are recorded in Table 6. The data showed that there were no PAHs detected in the Street Pond except at the inflow in 2000 and it was estimated that only 17 percent of the samples tested detected PAHs. By 2003 this ratio had changed dramatically and 63 percent of the samples analyzed detected PAHs and they were detected at all four stations in the surface sediments. Some of these were above the detection limit and indicated a possible toxicity problem. The Building pond also detected more PAHs in 2003 than in 2000, but of some interest is the fact that a significant amount of the detections were in the deeper soils. For those constituents above the laboratory detection limit with listed toxic levels for fresh water (see Table 3), many were above the possibly toxic levels while acenaphthene, anthracene, and phenanthrene exceeded the probably toxic level in the deeper sediment at the outflow of the Building pond.
Pesticides - Pesticides measured in the sediments identified chlordane, diazinon, chlorphyifos ethyl and DDT derivatives with concentrations above the laboratory quantification limit. Of these, chlordane was measured above the probably toxic level and DDE was detected in possibly toxic range (See Table 3). The other pesticides with concentrations that could be quantified did not have toxic levels listed. Most of the pesticides were only measured in the surface sediments and more were detected in the Building pond than the Street pond. There appeared to be no trend to indicate that pesticides were increasing in the sediments over time. Diazinon is one of the most often detected pesticides measured in stormwater studies (Waller et al. 1994) and it was found at both the
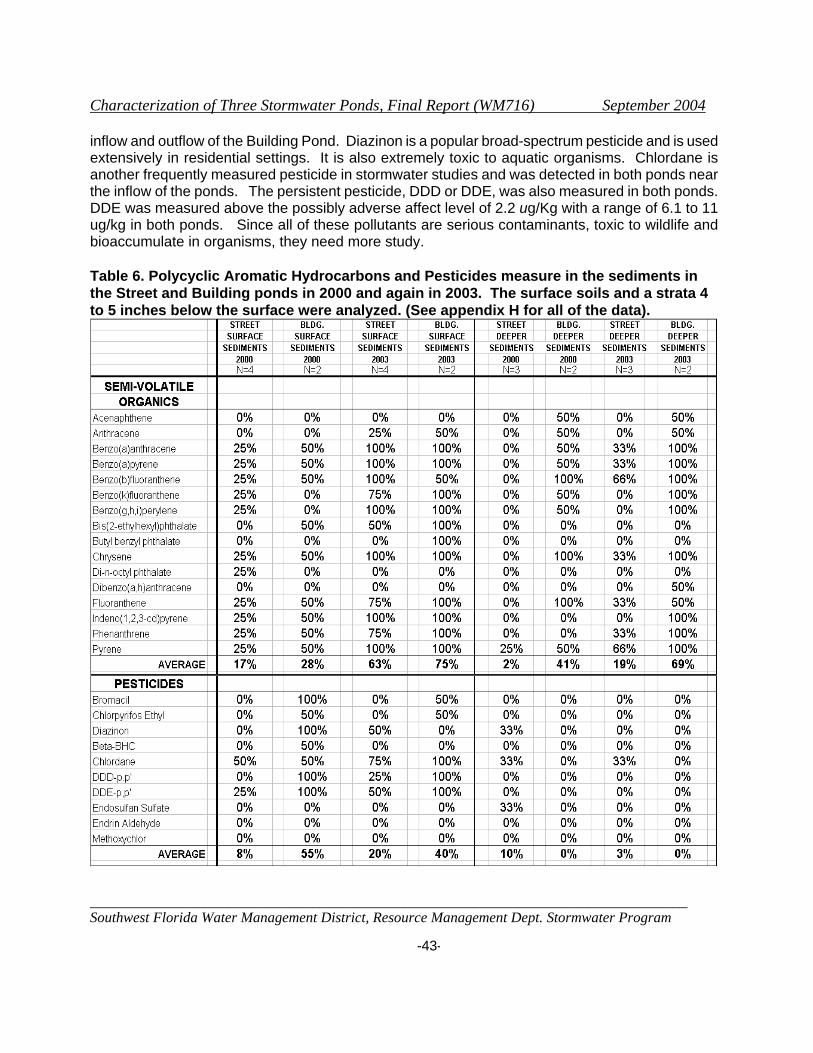
Characterization of Three Stormwater Ponds, Final Report (WM716) September 2004
______________________________________________________________________________ Southwest Florida Water Management District, Resource Management Dept. Stormwater Program -43-
inflow and outflow of the Building Pond. Diazinon is a popular broad-spectrum pesticide and is used extensively in residential settings. It is also extremely toxic to aquatic organisms. Chlordane is another frequently measured pesticide in stormwater studies and was detected in both ponds near the inflow of the ponds. The persistent pesticide, DDD or DDE, was also measured in both ponds. DDE was measured above the possibly adverse affect level of 2.2 ug/Kg with a range of 6.1 to 11 ug/kg in both ponds. Since all of these pollutants are serious contaminants, toxic to wildlife and bioaccumulate in organisms, they need more study. Table 6. Polycyclic Aromatic Hydrocarbons and Pesticides measure in the sediments in the Street and Building ponds in 2000 and again in 2003. The surface soils and a strata 4 to 5 inches below the surface were analyzed. (See appendix H for all of the data).
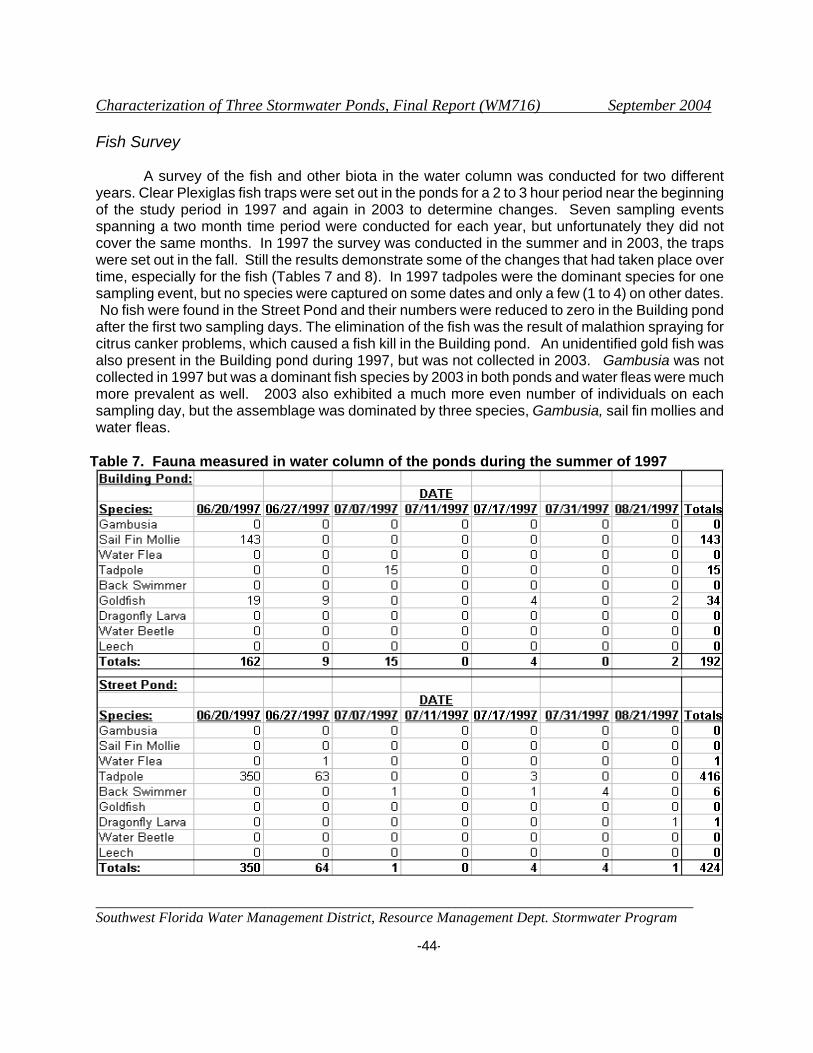
Characterization of Three Stormwater Ponds, Final Report (WM716) September 2004
______________________________________________________________________________ Southwest Florida Water Management District, Resource Management Dept. Stormwater Program -44-
Fish Survey A survey of the fish and other biota in the water column was conducted for two different years. Clear Plexiglas fish traps were set out in the ponds for a 2 to 3 hour period near the beginning of the study period in 1997 and again in 2003 to determine changes. Seven sampling events spanning a two month time period were conducted for each year, but unfortunately they did not cover the same months. In 1997 the survey was conducted in the summer and in 2003, the traps were set out in the fall. Still the results demonstrate some of the changes that had taken place over time, especially for the fish (Tables 7 and 8). In 1997 tadpoles were the dominant species for one sampling event, but no species were captured on some dates and only a few (1 to 4) on other dates. No fish were found in the Street Pond and their numbers were reduced to zero in the Building pond after the first two sampling days. The elimination of the fish was the result of malathion spraying for citrus canker problems, which caused a fish kill in the Building pond. An unidentified gold fish was also present in the Building pond during 1997, but was not collected in 2003. Gambusia was not collected in 1997 but was a dominant fish species by 2003 in both ponds and water fleas were much more prevalent as well. 2003 also exhibited a much more even number of individuals on each sampling day, but the assemblage was dominated by three species, Gambusia, sail fin mollies and water fleas.
Table 7. Fauna measured in water column of the ponds during the summer of 1997
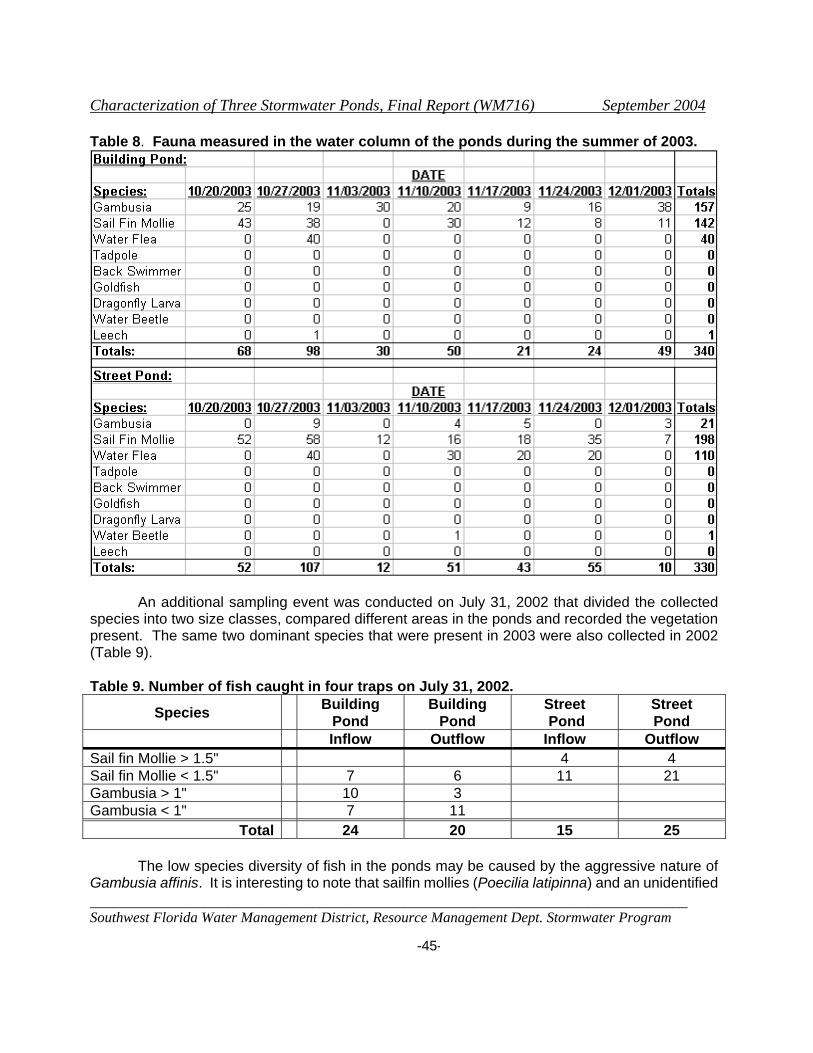
Characterization of Three Stormwater Ponds, Final Report (WM716) September 2004
______________________________________________________________________________ Southwest Florida Water Management District, Resource Management Dept. Stormwater Program -45-
Table 8. Fauna measured in the water column of the ponds during the summer of 2003.
An additional sampling event was conducted on July 31, 2002 that divided the collected species into two size classes, compared different areas in the ponds and recorded the vegetation present. The same two dominant species that were present in 2003 were also collected in 2002 (Table 9). Table 9. Number of fish caught in four traps on July 31, 2002.
Species Building Pond
Building Pond
Street Pond
Street Pond
Inflow Outflow Inflow Outflow Sail fin Mollie > 1.5" 4 4 Sail fin Mollie < 1.5" 7 6 11 21 Gambusia > 1" 10 3 Gambusia < 1" 7 11
Total 24 20 15 25
The low species diversity of fish in the ponds may be caused by the aggressive nature of Gambusia affinis. It is interesting to note that sailfin mollies (Poecilia latipinna) and an unidentified

Characterization of Three Stormwater Ponds, Final Report (WM716) September 2004
______________________________________________________________________________ Southwest Florida Water Management District, Resource Management Dept. Stormwater Program -46-
gold fish were quite prevalent in the Building pond until the aerial spraying with malathion to kill the insect causing citrus canker in 1997. This resulted in a massive fish kill in the Building pond (the only pond with fish in 1997) and few fish were found in the collection after June during 1997. Also there were no Gambusia present in 1997. By 2003 both Gambusia and sailfin mollies were present in both ponds, but more sailfins and fewer Gambusia were measured in the Street pond compared to the Building pond. Also in the one sampling event in 2002, there was no Gambusia in the Street Pond, but a good assemblage of Sail fin Mollies, while the Building pond had only small mollies and fewer individuals. The ichthyological community has viewed the introduction of Gambusia into non-native habitats with alarm, because of real and potential damage to these ecosystems (Rupp 2004). The first complaint is that Gambusia species are not really that effective in mosquito control and better control has been achieved with native species (Courtenay and Meffe 1989). They further explain that Gambusia are far too aggressive and predatory to be indiscriminately spread throughout the world without recognition of dangers to native biota and an international ban on their use as a control agent is biologically appropriate and warranted. Bottom sediments contaminated with metals and PAHs may also have caused the low species colonization. More studies need to be conducted to determine a satisfactory fish population for stormwater ponds that can control mosquitoes and still maintain diversity. Macroinvertebrate Study1 The assessment of macroinvertebrate abundance and diversity is useful for determining the ecological integrity of water bodies (Rosenberg and Resh, 1993). The large number of macroinvertebrate species present in any given region, their general sedentary nature, and their high reproductive rates make them excellent indicators of environmental conditions. As essential components of many aquatic food webs, their abundance is also closely tied to a system of productivity and consumer diversity. Thousands of stormwater ponds are being built to treat stormwater runoff. These impoundments are often characterized by poor water quality, high sediment loading, and high concentrations of pollutants. The effects of these and other environmental factors in natural aquatic systems suggest that stormwater ponds provide poor macroinvertebrate habitat, yet few studies of stormwater macroinvertebrates have been conducted. Free and Mulamootil (1983) demonstrated that only a few tolerant species persist in stormwater systems. In contrast, Rushton et al (1997) found that a relatively new impoundment harbored a diverse collection of benthic invertebrates, including some species reported intolerant of pollution. However, the assemblage found in the newly constructed pond may not have been representative, because water quality in the pond was much better than that found in older systems.
Poor water quality in stormwater ponds can be the result of several environmental and chemical factors. Low dissolved oxygen levels and high concentrations of organic contaminants and toxic metals can impact benthic macroinvertebrate abundance (Rosenberg and Resh, 1993). Numerous 1 Matt Dooris conducted the macroinvertebrate study when he was an intern at SWFWMD. This section was written by him and edited by Dr. Doug Leeper of SWFWD who has had experience with macroinvertebrates.
Characterization of Three Stormwater Ponds, Final Report (WM716) September 2004
______________________________________________________________________________ Southwest Florida Water Management District, Resource Management Dept. Stormwater Program -47-
studies have shown that environmental factors, such as water hardness, salinity, and alkalinity can influence metal toxicity (e.g. Chadwick et al., 1986; Clements et al., 1988; LaPoint et al., 1984; Moore and Ramamoorthy, 1984; Winner et al., 1975; Winner and Gauss, 1986). Stormwater ponds are generally not considered to be viable freshwater systems. Nevertheless, their frequency in the landscape, and the biotic assemblages found in some ponds (Rushton et al. 1977) suggest that they may serve as important aquatic habitat in an increasingly urbanized landscape. The macroinvertebrate assemblages of the three stormwater ponds at the Florida Aquarium are discussed in this section along with environmental factors influencing their diversity and abundance (Appendix I). Parking Lot Pond- The Parking Lot pond is a highly eutrophic water body with relatively high levels of nutrients and organic materials in the bottom sediment and water column. Extensive growth of hydrilla and emergent vegetation in the littoral zone cause wide fluctuations in dissolved oxygen and pH due to changes in photosynthetic rates throughout the day (see previous section). The Parking Lot pond contained the highest macroinvertebrate diversity of all ponds. A total of 2000 individuals from 8 macroinvertebrate taxa were collected (Figure 18 and Appendix I). Species diversity and equitability, based on samples across all dates, were 1.77 and 0.59, respectively. Macroinvertebrate abundance at site 1 (1663 individuals) was significantly greater (Wilcoxon Rank Sum Test, p<0.001) than at site 2 (337 individuals), and diversity index values were also greater (1.68 at site 1 versus 1.35 at site 2). Much higher concentrations of copper, lead, zinc, and DDE in the sediments of site 2 may have contributed to the low macroinvertebrate diversity (See Appendix H-1). Clements (1988) demonstrated predictable changes in a stream macroinvertebrate community structure based on laboratory bioassay data and in site concentrations of heavy metals. He also provided evidence that certain species of oligochaetes (Limnodrilus hoffmeisteri and Tubifex tubifex) are more tolerant of heavy metal contamination than many other macroinvertebrate taxa. High concentrations of aluminum in site 2 sediments may have moderated the toxicity of metal contaminants. Aluminum forms complexes with OH-, F-, and SO4
2- (Roberson and Hem, 1967), which can combine with phosphorus, suspended solids, and heavy metals. The stable compounds formed remain inactive and are deposited in the sediment. The rate of complex formation is dependent upon many factors including pH, temperature, concentrations of complexing ligands, ionic strength, and the concentration of aluminum. Basic conditions (pH>8) increases the solubility of aluminum making it more accessible for biogeochemical transformations (Harper, 1990). The pH in the pond often exceeded 9 standard units.
The gastropod, Planorbella duryi, and the tubificid, Limnodrilus hoffmeisteri, dominated the macroinvertebrate assemblage in the Parking Lot pond, each species accounting for over 40% of the individuals collected. Both species were much more abundant at site 1 than at site 2, the abundance of Limnodrilus hoffmeisteri differing by nearly an order of magnitude between the sites. Less abundant taxa, including the gastropods, Physella hendersoni hendersoni and Physella heterostropha heterostropha, and the amphipod, Hyallela azteca, were also more abundant at site 1.
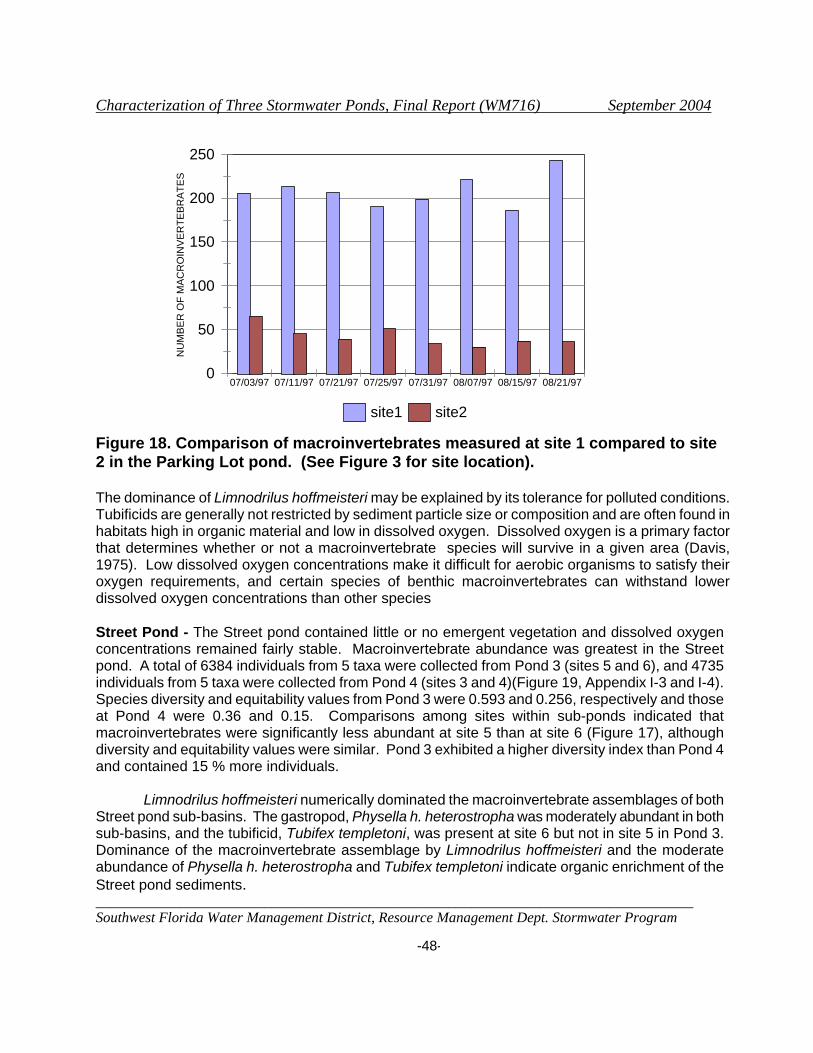
Characterization of Three Stormwater Ponds, Final Report (WM716) September 2004
______________________________________________________________________________ Southwest Florida Water Management District, Resource Management Dept. Stormwater Program -48-
0
50
100
150
200
250 N
UM
BE
R O
F M
AC
RO
INV
ER
TEB
RA
TES
07/03/97 07/11/97 07/21/97 07/25/97 07/31/97 08/07/97 08/15/97 08/21/97
site1 site2
Figure 18. Comparison of macroinvertebrates measured at site 1 compared to site 2 in the Parking Lot pond. (See Figure 3 for site location). The dominance of Limnodrilus hoffmeisteri may be explained by its tolerance for polluted conditions. Tubificids are generally not restricted by sediment particle size or composition and are often found in habitats high in organic material and low in dissolved oxygen. Dissolved oxygen is a primary factor that determines whether or not a macroinvertebrate species will survive in a given area (Davis, 1975). Low dissolved oxygen concentrations make it difficult for aerobic organisms to satisfy their oxygen requirements, and certain species of benthic macroinvertebrates can withstand lower dissolved oxygen concentrations than other species Street Pond - The Street pond contained little or no emergent vegetation and dissolved oxygen concentrations remained fairly stable. Macroinvertebrate abundance was greatest in the Street pond. A total of 6384 individuals from 5 taxa were collected from Pond 3 (sites 5 and 6), and 4735 individuals from 5 taxa were collected from Pond 4 (sites 3 and 4)(Figure 19, Appendix I-3 and I-4). Species diversity and equitability values from Pond 3 were 0.593 and 0.256, respectively and those at Pond 4 were 0.36 and 0.15. Comparisons among sites within sub-ponds indicated that macroinvertebrates were significantly less abundant at site 5 than at site 6 (Figure 17), although diversity and equitability values were similar. Pond 3 exhibited a higher diversity index than Pond 4 and contained 15 % more individuals.
Limnodrilus hoffmeisteri numerically dominated the macroinvertebrate assemblages of both Street pond sub-basins. The gastropod, Physella h. heterostropha was moderately abundant in both sub-basins, and the tubificid, Tubifex templetoni, was present at site 6 but not in site 5 in Pond 3. Dominance of the macroinvertebrate assemblage by Limnodrilus hoffmeisteri and the moderate abundance of Physella h. heterostropha and Tubifex templetoni indicate organic enrichment of the Street pond sediments.
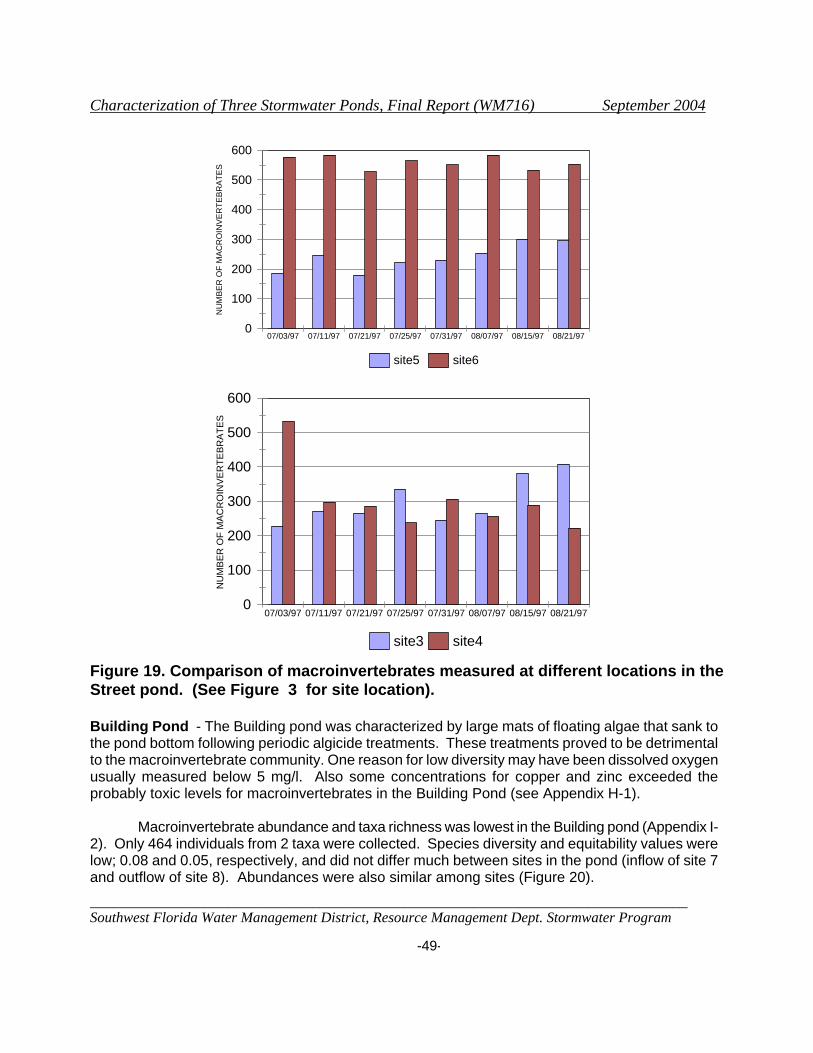
Characterization of Three Stormwater Ponds, Final Report (WM716) September 2004
______________________________________________________________________________ Southwest Florida Water Management District, Resource Management Dept. Stormwater Program -49-
0
100
200
300
400
500
600
NU
MB
ER
OF
MA
CR
OIN
VE
RTE
BR
ATE
S
07/03/97 07/11/97 07/21/97 07/25/97 07/31/97 08/07/97 08/15/97 08/21/97
site5 site6
0
100
200
300
400
500
600
NU
MBE
R O
F M
ACR
OIN
VER
TEBR
ATES
07/03/97 07/11/97 07/21/97 07/25/97 07/31/97 08/07/97 08/15/97 08/21/97
site3 site4
Figure 19. Comparison of macroinvertebrates measured at different locations in the Street pond. (See Figure 3 for site location). Building Pond - The Building pond was characterized by large mats of floating algae that sank to the pond bottom following periodic algicide treatments. These treatments proved to be detrimental to the macroinvertebrate community. One reason for low diversity may have been dissolved oxygen usually measured below 5 mg/l. Also some concentrations for copper and zinc exceeded the probably toxic levels for macroinvertebrates in the Building Pond (see Appendix H-1).
Macroinvertebrate abundance and taxa richness was lowest in the Building pond (Appendix I-
2). Only 464 individuals from 2 taxa were collected. Species diversity and equitability values were low; 0.08 and 0.05, respectively, and did not differ much between sites in the pond (inflow of site 7 and outflow of site 8). Abundances were also similar among sites (Figure 20).
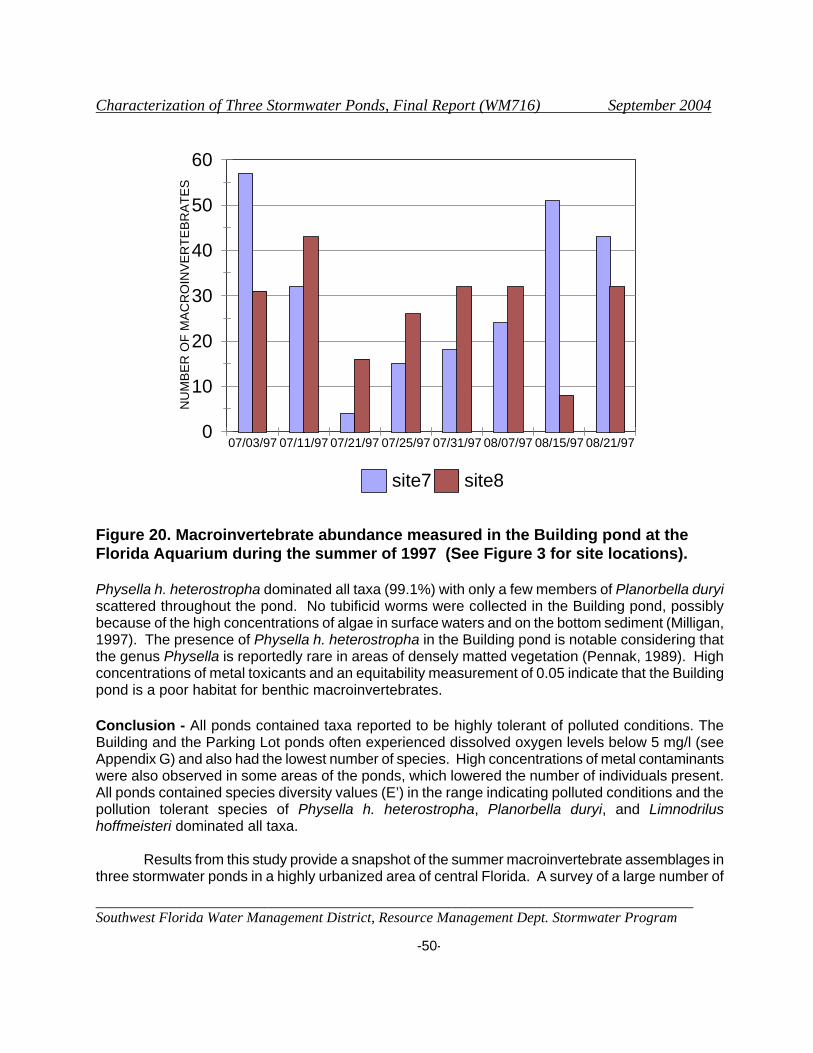
Characterization of Three Stormwater Ponds, Final Report (WM716) September 2004
______________________________________________________________________________ Southwest Florida Water Management District, Resource Management Dept. Stormwater Program -50-
0
10
20
30
40
50
60 N
UM
BE
R O
F M
AC
RO
INV
ER
TEB
RA
TES
07/03/97 07/11/97 07/21/97 07/25/97 07/31/97 08/07/97 08/15/97 08/21/97
site7 site8
Figure 20. Macroinvertebrate abundance measured in the Building pond at the Florida Aquarium during the summer of 1997 (See Figure 3 for site locations). Physella h. heterostropha dominated all taxa (99.1%) with only a few members of Planorbella duryi scattered throughout the pond. No tubificid worms were collected in the Building pond, possibly because of the high concentrations of algae in surface waters and on the bottom sediment (Milligan, 1997). The presence of Physella h. heterostropha in the Building pond is notable considering that the genus Physella is reportedly rare in areas of densely matted vegetation (Pennak, 1989). High concentrations of metal toxicants and an equitability measurement of 0.05 indicate that the Building pond is a poor habitat for benthic macroinvertebrates.
Conclusion - All ponds contained taxa reported to be highly tolerant of polluted conditions. The Building and the Parking Lot ponds often experienced dissolved oxygen levels below 5 mg/l (see Appendix G) and also had the lowest number of species. High concentrations of metal contaminants were also observed in some areas of the ponds, which lowered the number of individuals present. All ponds contained species diversity values (E’) in the range indicating polluted conditions and the pollution tolerant species of Physella h. heterostropha, Planorbella duryi, and Limnodrilus hoffmeisteri dominated all taxa.
Results from this study provide a snapshot of the summer macroinvertebrate assemblages in three stormwater ponds in a highly urbanized area of central Florida. A survey of a large number of

Characterization of Three Stormwater Ponds, Final Report (WM716) September 2004
______________________________________________________________________________ Southwest Florida Water Management District, Resource Management Dept. Stormwater Program -51-
ponds from a broader range of settings during different seasons will be required to adequately characterize stormwater pond macroinvertebrate assemblages of the region. Water Quality Comparisons Water quality was discussed in some detail in a previous section when the composite storm sample results were presented. This section is meant to be a brief summary comparing the results for four years of data collection. The first two years, 1997 and 1998 represent grab samples taken within a day after rain events, while for the 2001 and 2002 sampling years flow-weighted composite samples over the entire hydrograph were analyzed. Since the pond should be well mixed by the time water is discharged at the outflow, we thought both types of samples might be comparable (see the Method Section and Appendix A for statistical analysis of grab vs composite samples). Although grab samples taken after rain events were shown to be significantly higher than flow weighted samples for some constituents, an inspection of the data indicates that with a large data set, errors may average out. With this caveat, the storm water quality data are summarized in Figures 21 and 22. Be aware that once the Parking Lot pond was eliminated to build the cruise ship terminal that pond could no longer be studied, but two years of data were available. Nutrient concentrations measured a few difference between ponds (Figure 21). For one, the concentration of ammonia and nitrate exhibit a sharp increase in 2003 in the Building pond. Several factors may have caused this result. The runoff from the plant nursery discharges to this drainage basin and this could represent fertilizer runoff. Also slow release fertilizer pellets were observed in one of the drop boxes in a garden area in 2003 indicating landscaping practices may have contributed extra nutrients. In addition, 2003 had much more rainfall and the sump at the loading dock was frequently pumped directly into the pond near the outfall. The necessity to pump this water into the pond increased after the construction of the cruise ship terminal in 2001. Even though the cruise ship terminal is not part of the drainage basin, it was noted that irrigation water and tests from a pump station were discharged into one of the drop boxes draining to the Building pond. Increased ammonia concentrations could also be the result of anoxic conditions in the Building pond, which increased after 2000 (see Appendix G). Another difference between ponds was the elevated levels of organic nitrogen and phosphorus in the Parking Lot pond, especially in 1997. High concentrations of phosphorus were also measured in the sediments in 1997 and these may be leaching out because of low dissolved oxygen levels in the pond. Except for these few higher values, most nutrients were measured at about average concentrations when compared to other stormwater ponds and they fluctuated within a narrow range between years. Although the Parking Lot pond had higher concentrations of organic nitrogen and phosphorus, this pond rarely discharged and pollution loads to the receiving waters was not an issue.
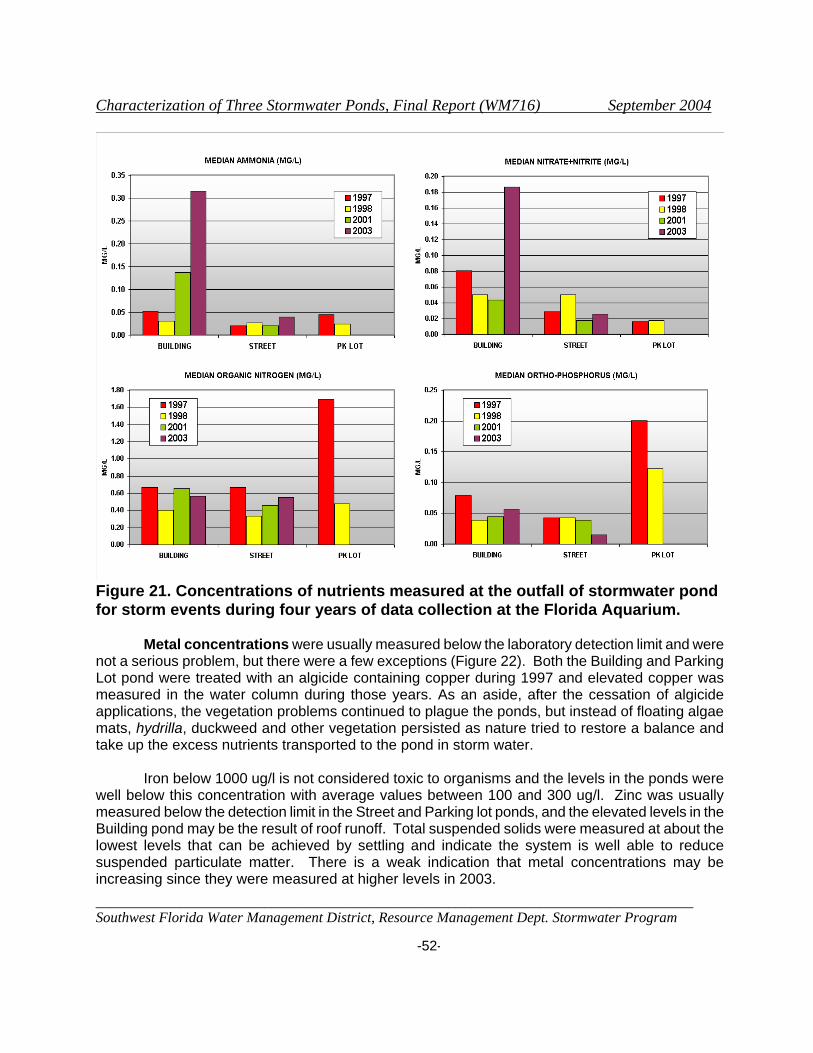
Characterization of Three Stormwater Ponds, Final Report (WM716) September 2004
______________________________________________________________________________ Southwest Florida Water Management District, Resource Management Dept. Stormwater Program -52-
Figure 21. Concentrations of nutrients measured at the outfall of stormwater pond for storm events during four years of data collection at the Florida Aquarium.
Metal concentrations were usually measured below the laboratory detection limit and were not a serious problem, but there were a few exceptions (Figure 22). Both the Building and Parking Lot pond were treated with an algicide containing copper during 1997 and elevated copper was measured in the water column during those years. As an aside, after the cessation of algicide applications, the vegetation problems continued to plague the ponds, but instead of floating algae mats, hydrilla, duckweed and other vegetation persisted as nature tried to restore a balance and take up the excess nutrients transported to the pond in storm water. Iron below 1000 ug/l is not considered toxic to organisms and the levels in the ponds were well below this concentration with average values between 100 and 300 ug/l. Zinc was usually measured below the detection limit in the Street and Parking lot ponds, and the elevated levels in the Building pond may be the result of roof runoff. Total suspended solids were measured at about the lowest levels that can be achieved by settling and indicate the system is well able to reduce suspended particulate matter. There is a weak indication that metal concentrations may be increasing since they were measured at higher levels in 2003.

Characterization of Three Stormwater Ponds, Final Report (WM716) September 2004
______________________________________________________________________________ Southwest Florida Water Management District, Resource Management Dept. Stormwater Program -53-
Figure 22. Concentrations of metals and TSS measured at the outfall of stormwater pond for storm events during four years of data collection at the Florida Aquarium.
Comparison to State Standards
Metal concentrations were compared to State Water Quality Class III Standards to
determine if the levels discharging from the site were detrimental to the biota. State standards for metals in fresh water systems are based on formulas that calculate a unique standard for each individual sample using the natural logarithm of water hardness (see Table 5). The concentration of each sample is listed with its unique standard in Appendix E and summary data are reported in Figure 23 and Appendix E-7. Although water hardness is not a pollutant of concern in stormwater, soft water makes pollutants more toxic to wild life therefore, the toxicity of metals for fresh water Class III standards is related to water hardness. A summary of results showing the percentage of samples that failed to meet standards for each pond for each year indicates more problems in the early years (Figure 23).
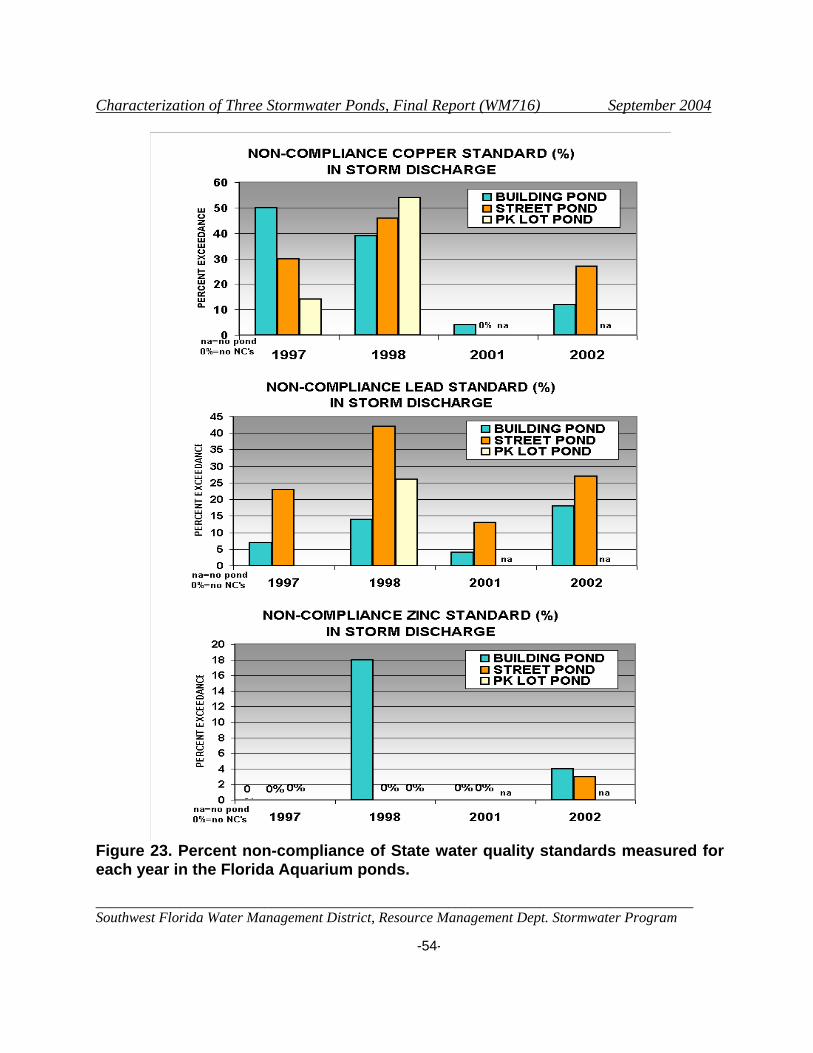
Characterization of Three Stormwater Ponds, Final Report (WM716) September 2004
______________________________________________________________________________ Southwest Florida Water Management District, Resource Management Dept. Stormwater Program -54-
Figure 23. Percent non-compliance of State water quality standards measured for each year in the Florida Aquarium ponds.
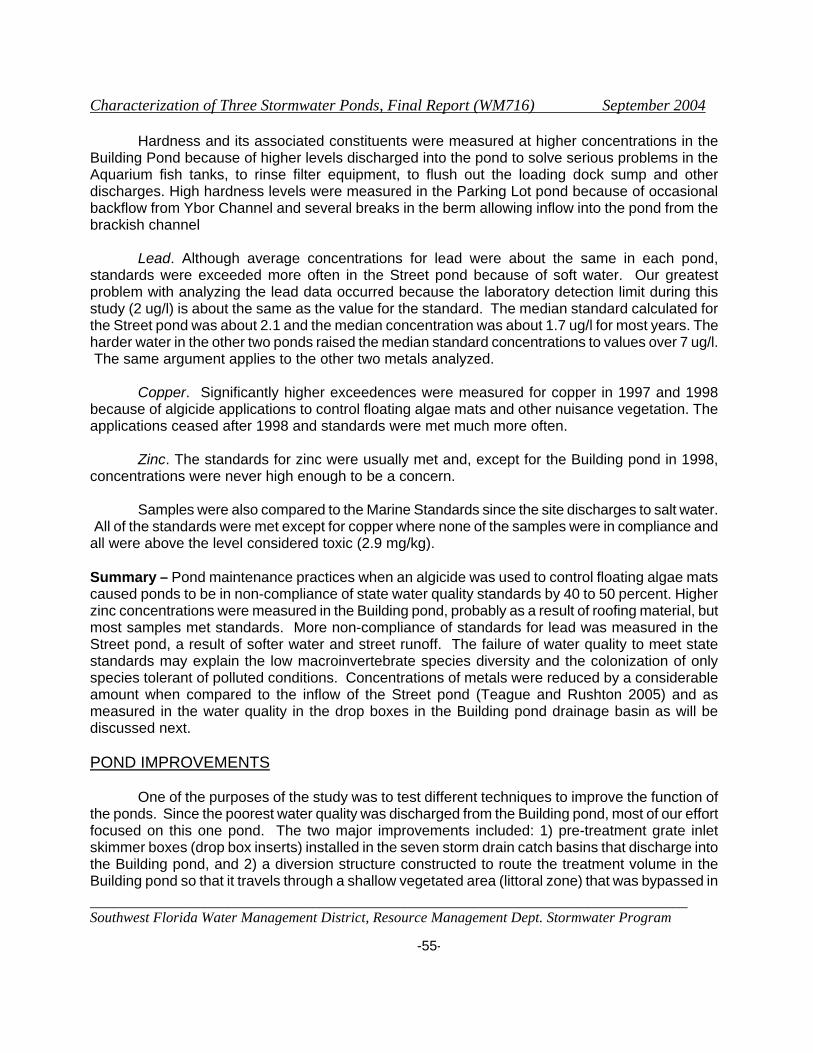
Characterization of Three Stormwater Ponds, Final Report (WM716) September 2004
______________________________________________________________________________ Southwest Florida Water Management District, Resource Management Dept. Stormwater Program -55-
Hardness and its associated constituents were measured at higher concentrations in the Building Pond because of higher levels discharged into the pond to solve serious problems in the Aquarium fish tanks, to rinse filter equipment, to flush out the loading dock sump and other discharges. High hardness levels were measured in the Parking Lot pond because of occasional backflow from Ybor Channel and several breaks in the berm allowing inflow into the pond from the brackish channel
Lead. Although average concentrations for lead were about the same in each pond, standards were exceeded more often in the Street pond because of soft water. Our greatest problem with analyzing the lead data occurred because the laboratory detection limit during this study (2 ug/l) is about the same as the value for the standard. The median standard calculated for the Street pond was about 2.1 and the median concentration was about 1.7 ug/l for most years. The harder water in the other two ponds raised the median standard concentrations to values over 7 ug/l. The same argument applies to the other two metals analyzed. Copper. Significantly higher exceedences were measured for copper in 1997 and 1998 because of algicide applications to control floating algae mats and other nuisance vegetation. The applications ceased after 1998 and standards were met much more often. Zinc. The standards for zinc were usually met and, except for the Building pond in 1998, concentrations were never high enough to be a concern. Samples were also compared to the Marine Standards since the site discharges to salt water. All of the standards were met except for copper where none of the samples were in compliance and all were above the level considered toxic (2.9 mg/kg). Summary – Pond maintenance practices when an algicide was used to control floating algae mats caused ponds to be in non-compliance of state water quality standards by 40 to 50 percent. Higher zinc concentrations were measured in the Building pond, probably as a result of roofing material, but most samples met standards. More non-compliance of standards for lead was measured in the Street pond, a result of softer water and street runoff. The failure of water quality to meet state standards may explain the low macroinvertebrate species diversity and the colonization of only species tolerant of polluted conditions. Concentrations of metals were reduced by a considerable amount when compared to the inflow of the Street pond (Teague and Rushton 2005) and as measured in the water quality in the drop boxes in the Building pond drainage basin as will be discussed next. POND IMPROVEMENTS One of the purposes of the study was to test different techniques to improve the function of the ponds. Since the poorest water quality was discharged from the Building pond, most of our effort focused on this one pond. The two major improvements included: 1) pre-treatment grate inlet skimmer boxes (drop box inserts) installed in the seven storm drain catch basins that discharge into the Building pond, and 2) a diversion structure constructed to route the treatment volume in the Building pond so that it travels through a shallow vegetated area (littoral zone) that was bypassed in

Characterization of Three Stormwater Ponds, Final Report (WM716) September 2004
______________________________________________________________________________ Southwest Florida Water Management District, Resource Management Dept. Stormwater Program -56-
the original design. Skimmer Box Inserts
Grate inlet skimmer inserts capture gross pollutants such as leaves, sediments and trash and
hold them in a skimmer tray above the water level in the catch basin instead of letting the solids travel by sediment transport into the wet detention pond. Skimmer boxes require maintenance and should be cleaned out about every three to six months when installed in urban locations. A schematic of the grate inlet skimmer box is shown in Figure 24.
Figure 24. Diagram of drop box insert (Source: Suntree Technologies, Inc.) Water Quality Samples were taken in the bottom of the drop boxes before the skimmer
boxes were installed, in the period between installation and the first cleanout, and between the first and second cleanout period to note any differences in water quality before and after the installation (Figure 25a, 25b and Appendix K). In almost all cases the average concentrations were much higher before the skimmer boxes were installed.
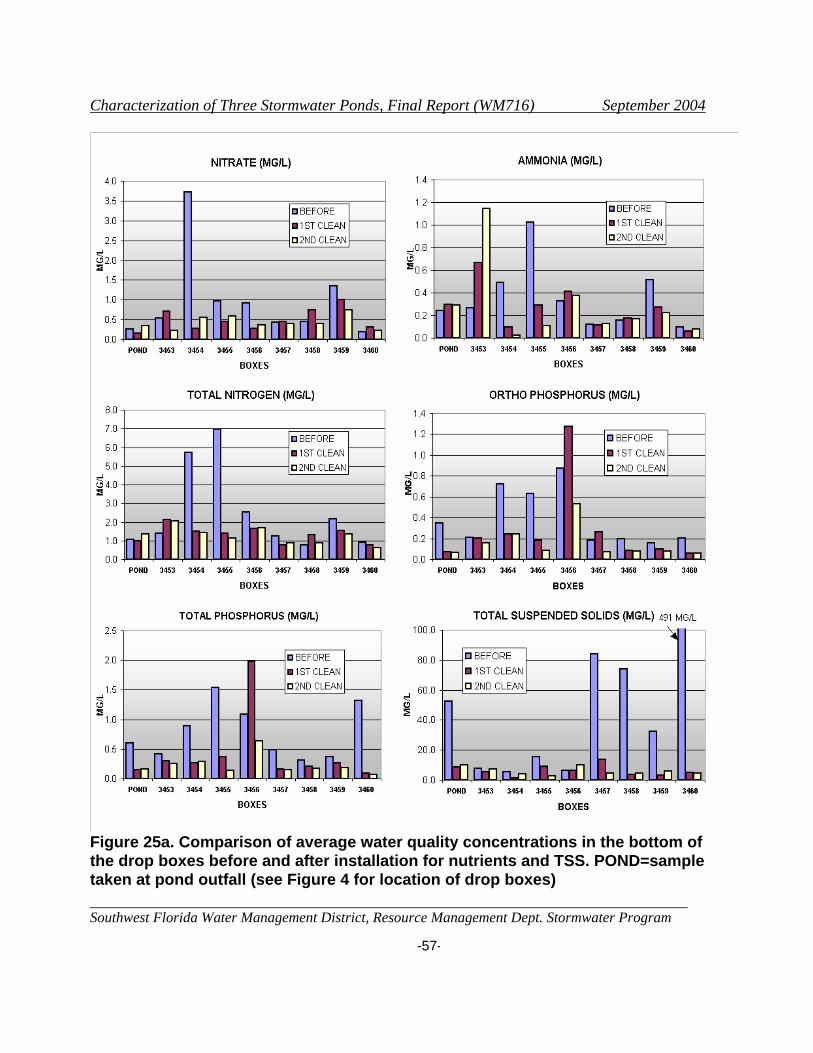
Characterization of Three Stormwater Ponds, Final Report (WM716) September 2004
______________________________________________________________________________ Southwest Florida Water Management District, Resource Management Dept. Stormwater Program -57-
Figure 25a. Comparison of average water quality concentrations in the bottom of the drop boxes before and after installation for nutrients and TSS. POND=sample taken at pond outfall (see Figure 4 for location of drop boxes)

Characterization of Three Stormwater Ponds, Final Report (WM716) September 2004
______________________________________________________________________________ Southwest Florida Water Management District, Resource Management Dept. Stormwater Program -58-
Figure 25b. Comparison of water quality in the bottom of the drop boxes before and after installation for metals (see Figure 4 for site locations).
Some of the higher values (especially TSS) were undoubtedly caused by construction
activity, but even the drop boxes not affected by the construction (3453 through 3456) had higher average values before the installation of the drop boxes (see Figure 4 for location of the skimmer box inserts). Higher phosphorus was measured in boxes draining the garden areas (3454-3456), higher nitrogen from the garden areas (3454-3456) and plant nursery (3459), higher metals, especially lead from drop boxes in streets (3458 and 3460), the loading dock (3457) and often from a maintenance area inside the aquarium (3455). Other confounding factors were the wide range of water quality concentrations measured in the drop boxes both before and after the installation and the small number of samples analyzed. Another problem was unmeasured flow into the pipe system, which was not the result of surface runoff through the boxes, but came from places unknown. In all cases, the pond seemed to reduce concentrations before discharge to receiving waters (pond discharge is designated as pond in the figures). High concentration spikes are often measured and a more careful study needs to be conducted to determine how much pollution reduction in the flow stream is possible using drop box inserts. One thing is certain – the skimmer boxes were effective in collecting a large amount of gross solids.
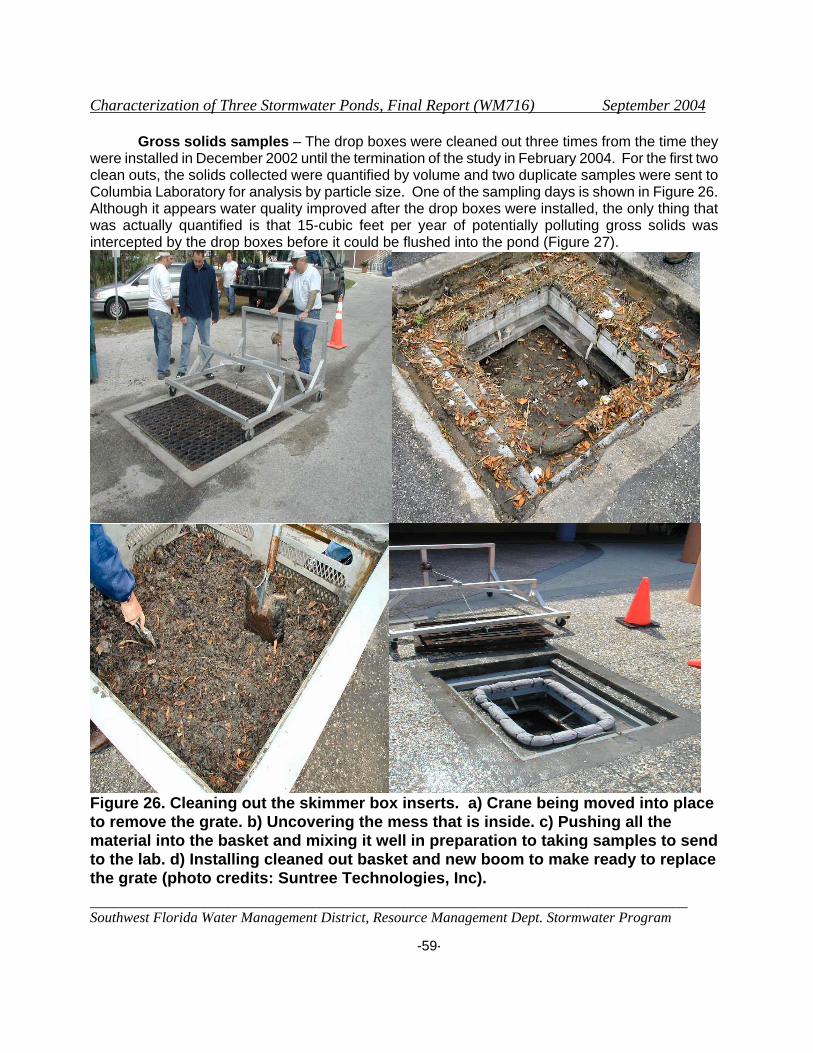
Characterization of Three Stormwater Ponds, Final Report (WM716) September 2004
______________________________________________________________________________ Southwest Florida Water Management District, Resource Management Dept. Stormwater Program -59-
Gross solids samples – The drop boxes were cleaned out three times from the time they were installed in December 2002 until the termination of the study in February 2004. For the first two clean outs, the solids collected were quantified by volume and two duplicate samples were sent to Columbia Laboratory for analysis by particle size. One of the sampling days is shown in Figure 26. Although it appears water quality improved after the drop boxes were installed, the only thing that was actually quantified is that 15-cubic feet per year of potentially polluting gross solids was intercepted by the drop boxes before it could be flushed into the pond (Figure 27).
Figure 26. Cleaning out the skimmer box inserts. a) Crane being moved into place to remove the grate. b) Uncovering the mess that is inside. c) Pushing all the material into the basket and mixing it well in preparation to taking samples to send to the lab. d) Installing cleaned out basket and new boom to make ready to replace the grate (photo credits: Suntree Technologies, Inc).
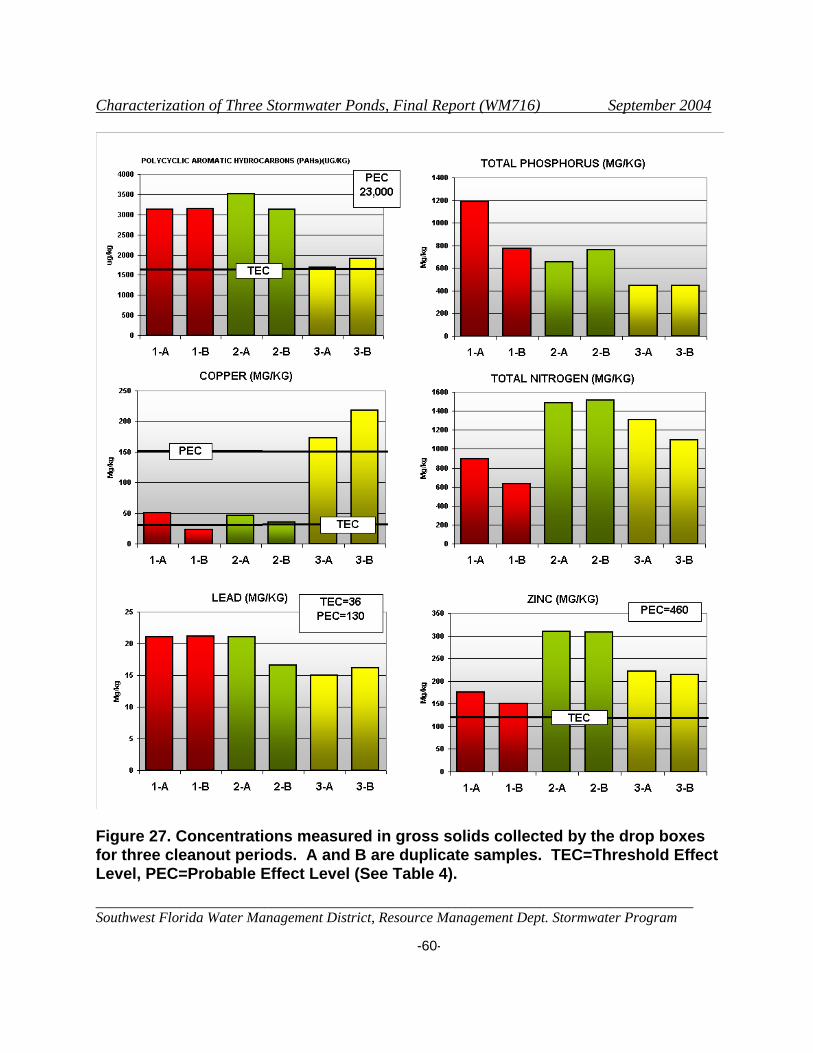
Characterization of Three Stormwater Ponds, Final Report (WM716) September 2004
______________________________________________________________________________ Southwest Florida Water Management District, Resource Management Dept. Stormwater Program -60-
Figure 27. Concentrations measured in gross solids collected by the drop boxes for three cleanout periods. A and B are duplicate samples. TEC=Threshold Effect Level, PEC=Probable Effect Level (See Table 4).

Characterization of Three Stormwater Ponds, Final Report (WM716) September 2004
______________________________________________________________________________ Southwest Florida Water Management District, Resource Management Dept. Stormwater Program -61-
The material collected by the skimmer box inserts were compared to sediment samples collected in the Building pond. Samples had concentrations higher than were measured in the surface sediments of the pond in 1997, but not as high as measured in later years (see Figure 16 and Appendix H). The concentrations in the drop boxes were also higher than measured in the deeper sediments (4 to 5 inch depth) for all years. The same pattern was seen for the metals of concern. Phosphorus was measured at much lower concentrations in the drop boxes than measured for both soil strata in the sediments of the pond. Samples were also compared to concentrations considered detrimental to the pond biota and although concentrations were often measured above the threshold effect level (TEC) where a damaging effect might be seen, only copper during 2003 reached concentrations that were above the probable effect level (PEC) where they would be toxic.
Conclusions – Drop box inserts are effective for collecting coarse solids from the stormwater
flow stream. The skimmer box inserts removed about 15 cubic feet of material per year from this 5.67-acre drainage basin. Although the smallest particle size had the highest concentrations of pollutants, the larger particle sizes contributed a greater mass of pollutants. Of some concern is that sieving samples into separate particle size ranges is changing the concentration of pollutants measured in samples. More detailed information from the study is presented in Appendix J.
Diversion structure
Since all three of the pipes that delivered stormwater to the pond were located near the
discharge weir, a diversion structure was installed to flush the treatment volume through the littoral zone. This flow had previously gone through the bleed down orifice in the outfall weir structure. Figure 28 is a picture of the diversion structure and Figure 29 shows the site plan with the location of the structure and the new planting.
Figure 28. Diversion structure being installed (left) and once it has been completed (right). Note thick covering of duckweed.
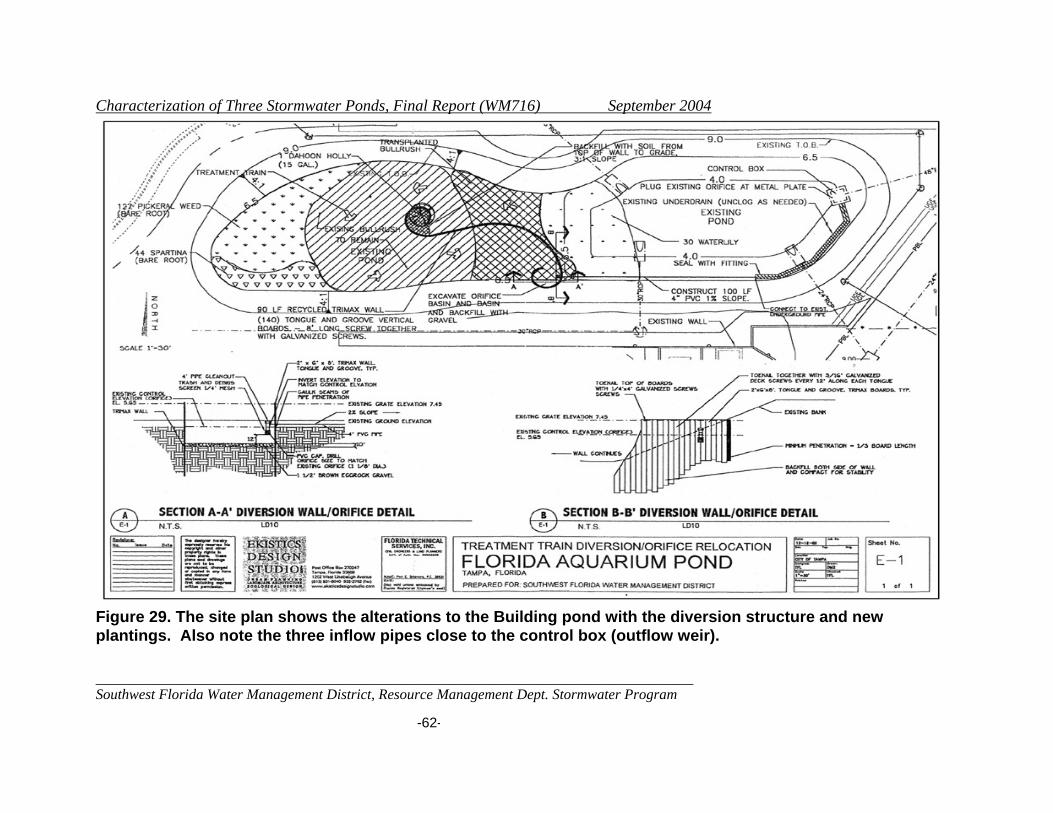
Characterization of Three Stormwater Ponds, Final Report (WM716) September 2004
______________________________________________________________________________ Southwest Florida Water Management District, Resource Management Dept. Stormwater Program
-62-
Figure 29. The site plan shows the alterations to the Building pond with the diversion structure and new plantings. Also note the three inflow pipes close to the control box (outflow weir).
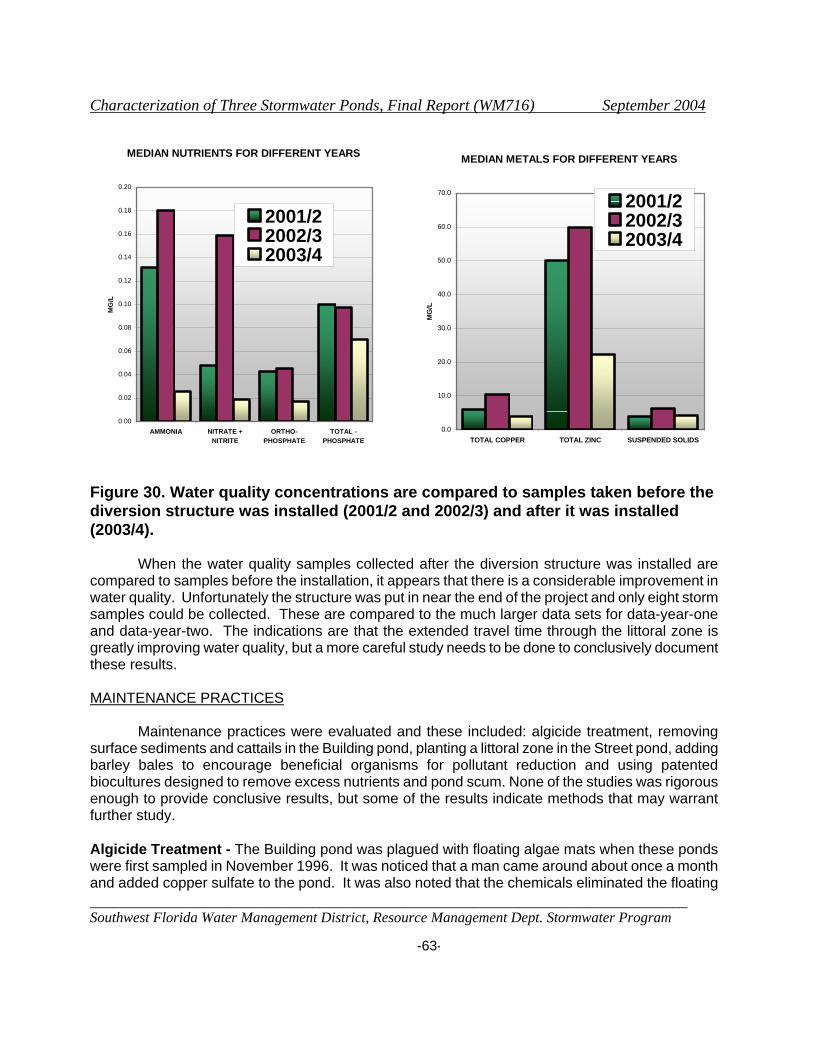
Characterization of Three Stormwater Ponds, Final Report (WM716) September 2004
______________________________________________________________________________ Southwest Florida Water Management District, Resource Management Dept. Stormwater Program -63-
MEDIAN NUTRIENTS FOR DIFFERENT YEARS
0.00
0.02
0.04
0.06
0.08
0.10
0.12
0.14
0.16
0.18
0.20
AMMONIA NITRATE +NITRITE
ORTHO-PHOSPHATE
TOTAL -PHOSPHATE
MG
/L
2001/22002/32003/4
MEDIAN METALS FOR DIFFERENT YEARS
0.0
10.0
20.0
30.0
40.0
50.0
60.0
70.0
TOTAL COPPER TOTAL ZINC SUSPENDED SOLIDSM
G/L
2001/22002/32003/4
Figure 30. Water quality concentrations are compared to samples taken before the diversion structure was installed (2001/2 and 2002/3) and after it was installed (2003/4).
When the water quality samples collected after the diversion structure was installed are
compared to samples before the installation, it appears that there is a considerable improvement in water quality. Unfortunately the structure was put in near the end of the project and only eight storm samples could be collected. These are compared to the much larger data sets for data-year-one and data-year-two. The indications are that the extended travel time through the littoral zone is greatly improving water quality, but a more careful study needs to be done to conclusively document these results.
MAINTENANCE PRACTICES
Maintenance practices were evaluated and these included: algicide treatment, removing
surface sediments and cattails in the Building pond, planting a littoral zone in the Street pond, adding barley bales to encourage beneficial organisms for pollutant reduction and using patented biocultures designed to remove excess nutrients and pond scum. None of the studies was rigorous enough to provide conclusive results, but some of the results indicate methods that may warrant further study.
Algicide Treatment - The Building pond was plagued with floating algae mats when these ponds were first sampled in November 1996. It was noticed that a man came around about once a month and added copper sulfate to the pond. It was also noted that the chemicals eliminated the floating
Characterization of Three Stormwater Ponds, Final Report (WM716) September 2004
______________________________________________________________________________ Southwest Florida Water Management District, Resource Management Dept. Stormwater Program -64-
mats, but that the surface waters were quickly re-colonized with more mats. What appeared to happen was that the chemical dose killed the existing algae, causing the dead and decaying material to sink to the bottom of the pond and decompose, releasing nutrients back into the water column thus supplying the nutrients for more algae growth, more chemicals and more cycling. Although our research effort was designed to test pond discharge water for storm events and was not designed to test for chemical treatment, the data suggested a boom and bust cycle caused by algicide treatment (Figure 31). Nitrate and to some extent organic nitrogen appear to spike in response to increase copper concentrations. It should be noted that nitrogen also spikes in response to large rain event, especially after a long dry period. There were no more spikes in copper after the treatment stopped and all the nitrogen spikes appear to be related to rain events. Besides eliminating a toxic source of copper, the cessation of treatment may have had other benefits. It has also been documented that long-term algicide treatment may be counter productive. Other studies have found that copper application was successful in suppressing algal growth but that after long term applications it is no longer effective (Duvall et al. 2001). These researchers theorized that the algal species became acclimatized or selected for copper resistant species. Their study also found increased algal production with increased nutrients when chemical treatment was continued. Another result occurs with chemical treatment over many years, a toxic layer can form on the bottom of the pond and eventually kill the pond by making it sterile and unable to support macroinvertebrates or fish. This probably accounts for the low invertebrate species diversity when that was measured in 1997 (see Figure 20). Other detrimental effects that were noted included the Parking Lot pond turning pea green like thick soup. Algicide treatment also explains the high copper concentrations measured in the sediments of the Building pond during the year 2000 sediment sampling event (see Figure 17). Copper concentrations were significantly reduced in 2003 after the surface sediments had been removed during maintenance by Adopt-A-Pond. Another change that occurred after the cessation of copper treatments, was a change in the type of vegetation. Instead of floating algae mats, a thick mat of duckweed and associated species covered the Building pond and hyrilla choked the Parking Lot pond. Some proprietary products that use bacteria and enzymes are currently on the market to control vegetation by competing for the nutrients, these were tried to determine if this could help with the vegetation problems. Biocultures – Microbial products or Biocultures are proprietary blends of highly specialized microorganisms, which are reported to reduce nutrients and odors and to accelerate the breakdown of sludge and organic wastes in water bodies. The treatments add enzymes and bacteria to ponds in order to stimulate or augment existing populations of bacteria, which then consume organic debris and dissolved nutrients. Since copper-based chemicals had already been shown as ineffective in controlling plant growth while at the same time they increased toxicity in the Aquarium ponds, a bioculture was thought to be a possible alternative solution. Biocultures were reported to reduced nutrients in the water column, and were introduced in an effort to reduced rampant weedy plant growth. Biocultures from two different vendors were tested at two different times, to see if these products would improve conditions in the Aquarium ponds.

Characterization of Three Stormwater Ponds, Final Report (WM716) September 2004
______________________________________________________________________________ Southwest Florida Water Management District, Resource Management Dept. Stormwater Program -65-
0
2
4
6
8
10
INC
HES
/DA
Y
N D J F M A M J J A S O N D J F M A M J J A S OMONTH
RAINFALL NOV 1996 TO NOV 1998FLORIDA AQUARIUM 3-POND STUDY
0
0.2
0.4
0.6
0.8
1
1.2
1.4
mg/
L
35380 35745 month/year
Building
TOTAL ORGANIC NITROGENFlorida Aquarium (1996-98)
Nov 96 - Nov 97 Nov 97 - Nov 98
0
0.1
0.2
0.3
0.4
mg/
L
35380 35745 month/year
Building
NITRATE CONCENTRATIONSFlorida Aquarium (1996-98)
Nov 96 - Nov 97 Nov 97 - Nov 98
0
100
200
300
400
ug/L
35380 35745
Building
TOTAL COPPERFlorida Aquarium (1996-98)
Nov 96 - Nov 97 Nov 97 - Nov 98
Figure 31. Changes in copper, organic nitrogen and nitrate when copper applications were stopped about September of 1997
Characterization of Three Stormwater Ponds, Final Report (WM716) September 2004
______________________________________________________________________________ Southwest Florida Water Management District, Resource Management Dept. Stormwater Program -66-
"Living Soils"- This trial took place in June of 1998 and was introduced by a company called Living Soils, Inc. The product was reported to be composed of nature's compounds and to extract ammonia, nitrites, nitrates, phosphates and toxic chemicals from the water. Microbes are used to scarify the water of nutrients and to digest organic material, such as dead algae and leaves. The reactants were reported to be an ultra violet compound, which bonds sulfuric acid (from Violet 49) and sodium carbonate (from Blue 9) to produce a molecule, which is activated in the presence of 200-nanometer of light. The products are hydrogen sulfide that evaporates, ammonium sulfide that precipitates and falls to the bottom, while excess oxygen and carbon dioxide are released into the water column. The reaction is supposed to raise oxygen levels substantially throughout the water body after treatment. The treatment is a two-stage process where a product called SU 200 is added to remove nutrients and about five days later microbial organic digesters identified as AQ2 are introduced (Figure 32 and Appenidx L). Since the treatment is not especially effective for reducing macrophytes, as much duckweed as possible was skimmed from the surface of the Building pond before the ponds were treated with SU200 on June 18, 1998. On June 25, 1998, the AQ2, a microbial digester was added to the ponds. Unfortunately two large rain events occurred between the two treatments that confound the results. Also this was the beginning of the rainy season and only one rain event (0.56 inches) had occurred in June, although several large rain events were recorded in May. After the trial began, both ponds exhibited a large reduction in organic nitrogen and in the Parking Lot pond a reduction in phosphorus and copper. Most of the other changes in the Building pond can be explained by rainfall, but it should be noted that concentrations were already low because the floating duckweed does a pretty effective job of reducing nutrient concentrations in the water column. The Parking Lot pond measured higher concentrations, and the different flora types and flow regimes may explain the different results. The Building pond is a flashy system and rainfall rapidly flows through the pond and is discharged; and probably the introduced compounds were discharged as well. The Parking Lot pond was dominated by phytoplankton in the water column and in addition it was stagnant because it hardly ever discharged water out of the pond. This experiment may show that floating plants also reduce inorganic nutrients as well as microbial additions and that ponds dominated by phytoplankton and floating algae with high water column nutrient levels could benefit from bioculture treatment. Field parameters were also measured and no changes were noted for either treatment. The pattern of widely fluctuating levels typical of highly productive ponds persisted (Appendix K). If the ponds had been anoxic with low dissolved oxygen levels the results might have been different and higher DO measured. The bad news was that the ponds still looked a mess one month after treatment. The Building Pond was covered 100 percent with duckweed and the Parking Lot Pond had shifted from a system dominated by phytoplankton to one dominated by hydrilla. "Healthy Pond" - A bioculture labeled "Healthy Ponds" was introduced into the Street pond in August of 2003. It is reported to be a biological treatment, which uses special bacteria to reduce the amount of nutrients and organic matter in a pond. When the bacteria are added to the water, they produce enzymes that break down complex organic matter into simple nutrients, and then they consume these excess nutrients. Since it may take several weeks for the bacteria to break down the organic matter and excess nutrients, a special dispensing system was used to continuously release bacteria over a period of about 30 days (Figure 33).
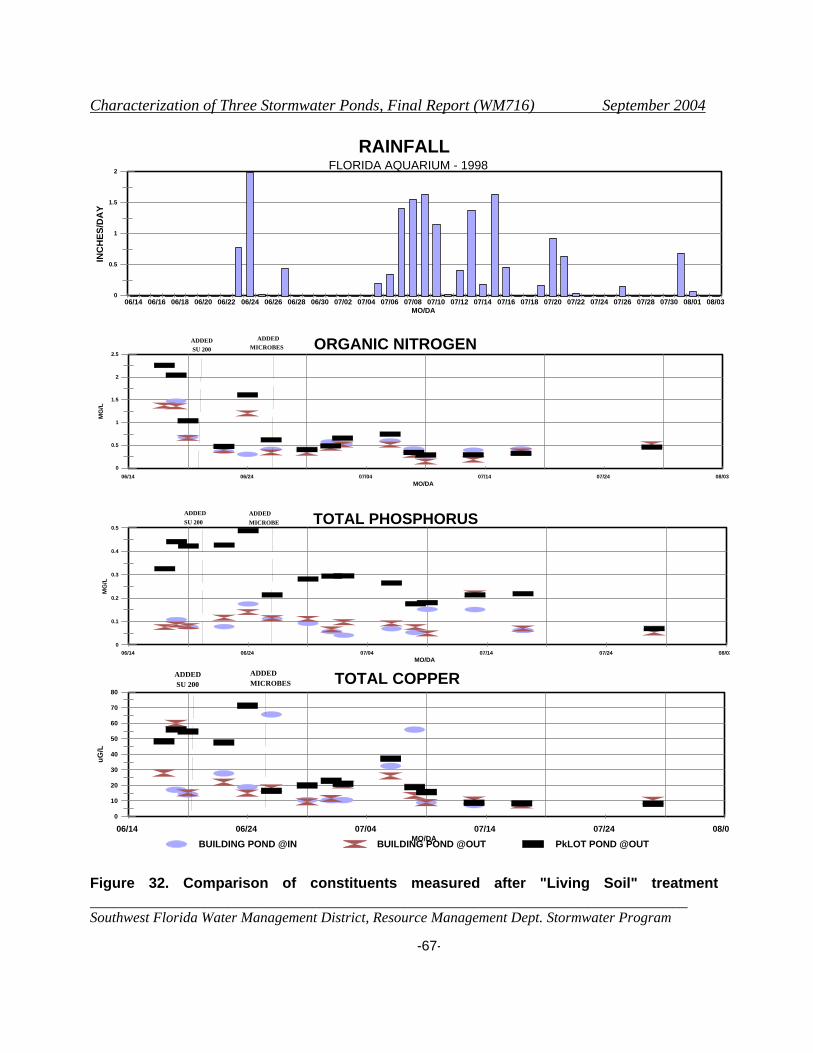
Characterization of Three Stormwater Ponds, Final Report (WM716) September 2004
______________________________________________________________________________ Southwest Florida Water Management District, Resource Management Dept. Stormwater Program -67-
0
0.5
1
1.5
2
INC
HES
/DA
Y
06/14 06/16 06/18 06/20 06/22 06/24 06/26 06/28 06/30 07/02 07/04 07/06 07/08 07/10 07/12 07/14 07/16 07/18 07/20 07/22 07/24 07/26 07/28 07/30 08/01 08/03MO/DA
RAINFALLFLORIDA AQUARIUM - 1998
0
0.5
1
1.5
2
2.5
MG
/L
06/14 06/24 07/04 07/14 07/24 08/03 MO/DA
ORGANIC NITROGENADDEDSU 200
ADDEDMICROBES
0
0.1
0.2
0.3
0.4
0.5
MG
/L
06/14 06/24 07/04 07/14 07/24 08/03MO/DA
TOTAL PHOSPHORUSADDEDSU 200
ADDEDMICROBE
0
10
20
30
40
50
60
70
80
uG/L
06/14 06/24 07/04 07/14 07/24 08/0MO/DABUILDING POND @IN BUILDING POND @OUT PkLOT POND @OUT
TOTAL COPPERADDEDSU 200
ADDEDMICROBES
Figure 32. Comparison of constituents measured after "Living Soil" treatment
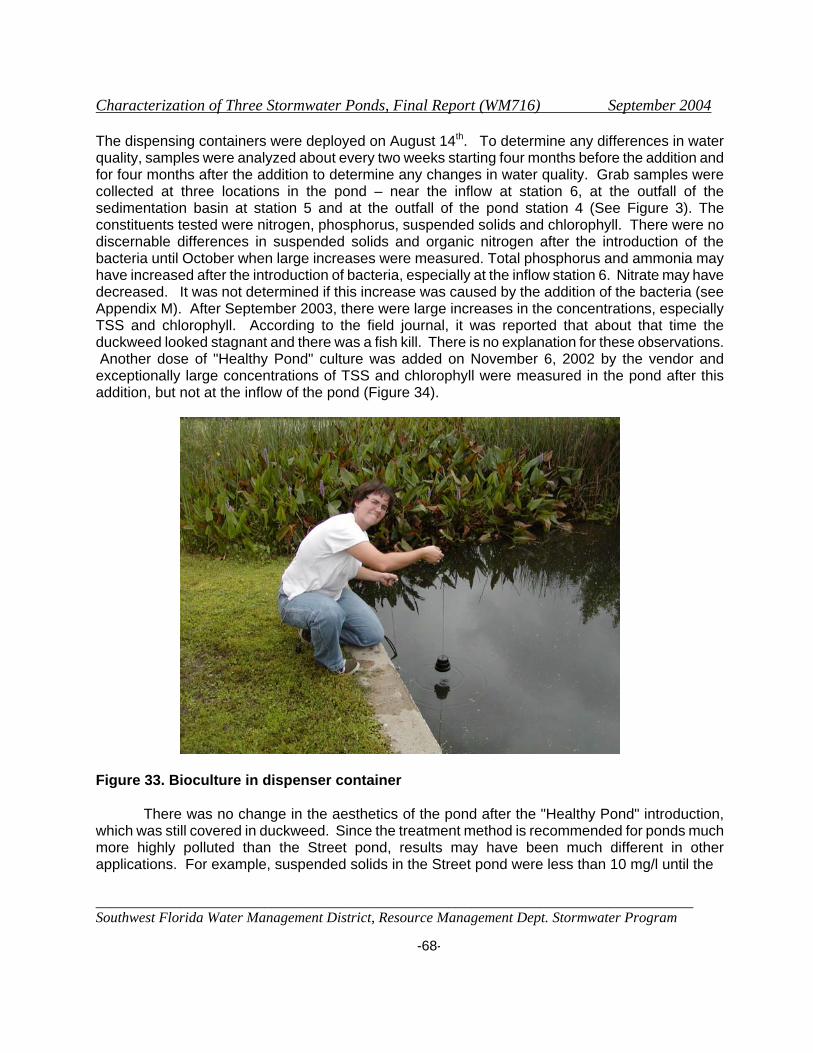
Characterization of Three Stormwater Ponds, Final Report (WM716) September 2004
______________________________________________________________________________ Southwest Florida Water Management District, Resource Management Dept. Stormwater Program -68-
The dispensing containers were deployed on August 14th. To determine any differences in water quality, samples were analyzed about every two weeks starting four months before the addition and for four months after the addition to determine any changes in water quality. Grab samples were collected at three locations in the pond – near the inflow at station 6, at the outfall of the sedimentation basin at station 5 and at the outfall of the pond station 4 (See Figure 3). The constituents tested were nitrogen, phosphorus, suspended solids and chlorophyll. There were no discernable differences in suspended solids and organic nitrogen after the introduction of the bacteria until October when large increases were measured. Total phosphorus and ammonia may have increased after the introduction of bacteria, especially at the inflow station 6. Nitrate may have decreased. It was not determined if this increase was caused by the addition of the bacteria (see Appendix M). After September 2003, there were large increases in the concentrations, especially TSS and chlorophyll. According to the field journal, it was reported that about that time the duckweed looked stagnant and there was a fish kill. There is no explanation for these observations. Another dose of "Healthy Pond" culture was added on November 6, 2002 by the vendor and exceptionally large concentrations of TSS and chlorophyll were measured in the pond after this addition, but not at the inflow of the pond (Figure 34).
Figure 33. Bioculture in dispenser container There was no change in the aesthetics of the pond after the "Healthy Pond" introduction, which was still covered in duckweed. Since the treatment method is recommended for ponds much more highly polluted than the Street pond, results may have been much different in other applications. For example, suspended solids in the Street pond were less than 10 mg/l until the
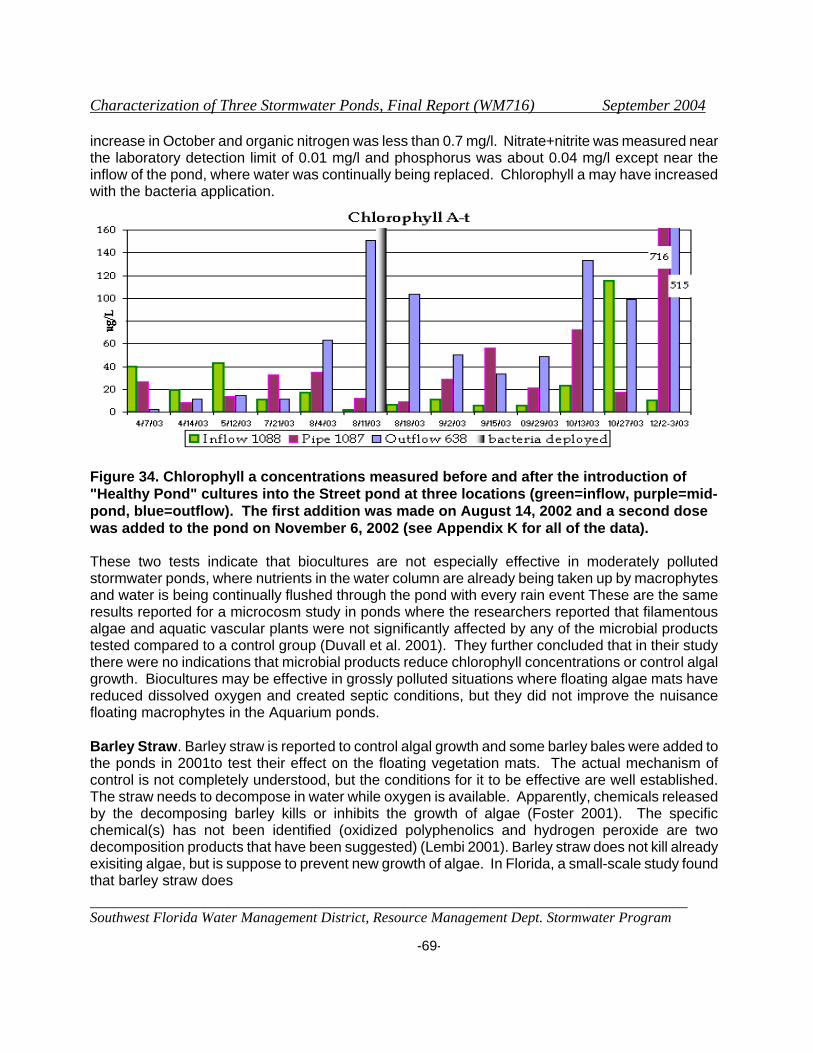
Characterization of Three Stormwater Ponds, Final Report (WM716) September 2004
______________________________________________________________________________ Southwest Florida Water Management District, Resource Management Dept. Stormwater Program -69-
increase in October and organic nitrogen was less than 0.7 mg/l. Nitrate+nitrite was measured near the laboratory detection limit of 0.01 mg/l and phosphorus was about 0.04 mg/l except near the inflow of the pond, where water was continually being replaced. Chlorophyll a may have increased with the bacteria application.
Figure 34. Chlorophyll a concentrations measured before and after the introduction of "Healthy Pond" cultures into the Street pond at three locations (green=inflow, purple=mid-pond, blue=outflow). The first addition was made on August 14, 2002 and a second dose was added to the pond on November 6, 2002 (see Appendix K for all of the data). These two tests indicate that biocultures are not especially effective in moderately polluted stormwater ponds, where nutrients in the water column are already being taken up by macrophytes and water is being continually flushed through the pond with every rain event These are the same results reported for a microcosm study in ponds where the researchers reported that filamentous algae and aquatic vascular plants were not significantly affected by any of the microbial products tested compared to a control group (Duvall et al. 2001). They further concluded that in their study there were no indications that microbial products reduce chlorophyll concentrations or control algal growth. Biocultures may be effective in grossly polluted situations where floating algae mats have reduced dissolved oxygen and created septic conditions, but they did not improve the nuisance floating macrophytes in the Aquarium ponds. Barley Straw. Barley straw is reported to control algal growth and some barley bales were added to the ponds in 2001to test their effect on the floating vegetation mats. The actual mechanism of control is not completely understood, but the conditions for it to be effective are well established. The straw needs to decompose in water while oxygen is available. Apparently, chemicals released by the decomposing barley kills or inhibits the growth of algae (Foster 2001). The specific chemical(s) has not been identified (oxidized polyphenolics and hydrogen peroxide are two decomposition products that have been suggested) (Lembi 2001). Barley straw does not kill already exisiting algae, but is suppose to prevent new growth of algae. In Florida, a small-scale study found that barley straw does
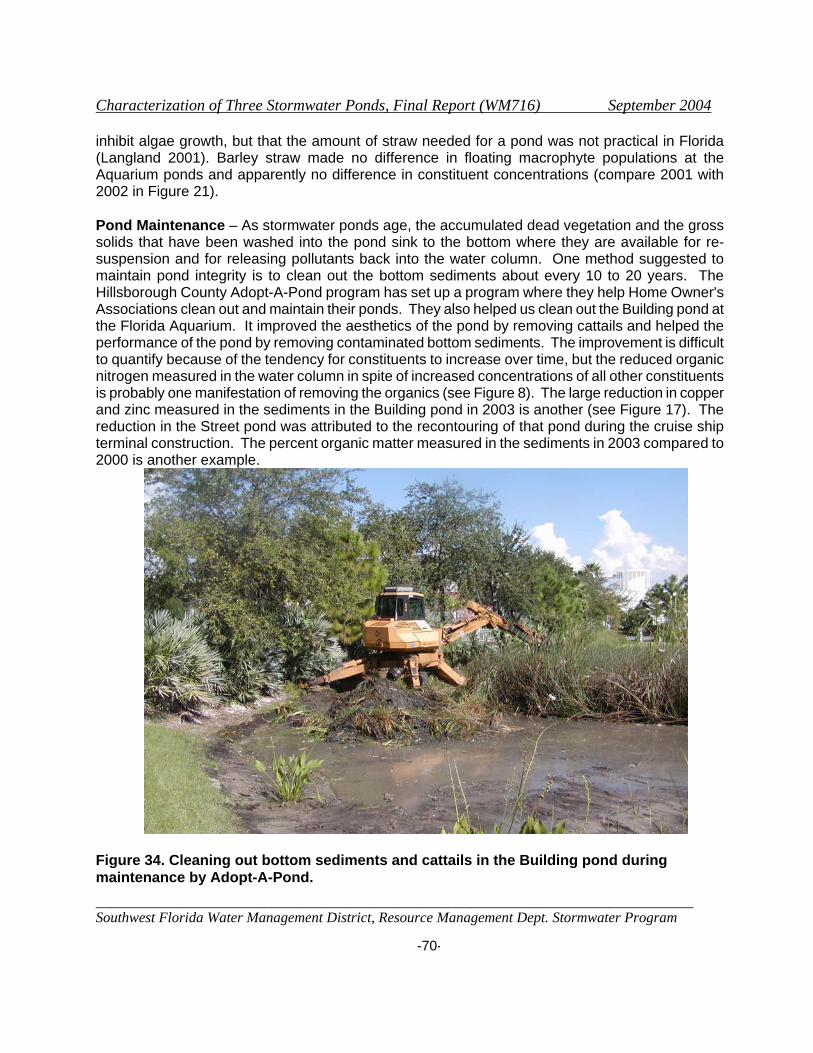
Characterization of Three Stormwater Ponds, Final Report (WM716) September 2004
______________________________________________________________________________ Southwest Florida Water Management District, Resource Management Dept. Stormwater Program -70-
inhibit algae growth, but that the amount of straw needed for a pond was not practical in Florida (Langland 2001). Barley straw made no difference in floating macrophyte populations at the Aquarium ponds and apparently no difference in constituent concentrations (compare 2001 with 2002 in Figure 21). Pond Maintenance – As stormwater ponds age, the accumulated dead vegetation and the gross solids that have been washed into the pond sink to the bottom where they are available for re-suspension and for releasing pollutants back into the water column. One method suggested to maintain pond integrity is to clean out the bottom sediments about every 10 to 20 years. The Hillsborough County Adopt-A-Pond program has set up a program where they help Home Owner's Associations clean out and maintain their ponds. They also helped us clean out the Building pond at the Florida Aquarium. It improved the aesthetics of the pond by removing cattails and helped the performance of the pond by removing contaminated bottom sediments. The improvement is difficult to quantify because of the tendency for constituents to increase over time, but the reduced organic nitrogen measured in the water column in spite of increased concentrations of all other constituents is probably one manifestation of removing the organics (see Figure 8). The large reduction in copper and zinc measured in the sediments in the Building pond in 2003 is another (see Figure 17). The reduction in the Street pond was attributed to the recontouring of that pond during the cruise ship terminal construction. The percent organic matter measured in the sediments in 2003 compared to 2000 is another example.
Figure 34. Cleaning out bottom sediments and cattails in the Building pond during maintenance by Adopt-A-Pond.

Characterization of Three Stormwater Ponds, Final Report (WM716) September 2004
______________________________________________________________________________ Southwest Florida Water Management District, Resource Management Dept. Stormwater Program -71-
Characterization of Three Stormwater Ponds, Final Report (WM716) September 2004
______________________________________________________________________________ Southwest Florida Water Management District, Resource Management Dept. Stormwater Program -72-
SUMMARY OF RESULTS
INTENSIVE STORMWATER MONITORING STUDY Two stormwater ponds were compared to each other for storm events for two years using automatic monitoring equipment. The same ten-month period each year was used for the comparisons.
• Comparable data show data-year-one was a drought year with significantly less rainfall (26 inches) when compared to data-year-two (58 inches) and the long-term average (44 inches) (Figure 5 and Table 5).
• The two pond levels show similar responses to rainfall, although the smaller Building pond
exhibits slightly wider fluctuations (Figures 5 and 6). The levels indicate the filters in the effluent filtration stormwater wet pond (Street pond) are still operational and are slowly releasing flow after storm events at about the same rate as the bleed down orifice in the wet detention pond (Building pond), indicating they are still working as designed.
• Higher concentrations of pollutants were usually measured in the Building pond compared to
the Street pond for both years (Figures 8 and 9).
• Lower concentrations of constituents were measured in rainfall during the second year compared to year one, which is attributed to the increased rainfall amount in year 2 or the location of the rainfall collector in year 1 (Figures 8 and 9).
• More ammonia and nitrate are usually measured in the rainfall than measured in the
discharge water from the ponds indicating, these nutrients need to be cleaned up at the source by reducing air pollution (Figure 8) and that ponds are effective in reducing their concentration.
• The samples collected from the under drains had concentrations over twice as high for
ammonia and ortho-phosphorus than measured in the pond discharge water and this concentration in the under drains is measured even higher between storm events (Figures 10 and 11).
POND CHARACTERIZATION COMPARISONS Data have been collected at the site over a seven-year time period comparing three types of stormwater treatment systems.
• Field parameters of temperature, pH, dissolved oxygen, and conductivity reflect the conditions of the pond at time of measurement, which shifts from highly productive with wide fluctuations to anoxic conditions with suppressed values caused by floating vegetation covering the pond (Figure 13 and Appendix G).
Characterization of Three Stormwater Ponds, Final Report (WM716) September 2004
______________________________________________________________________________ Southwest Florida Water Management District, Resource Management Dept. Stormwater Program -73-
• Field conditions are affected by rainfall and photosynthesis (Figure 13).
• A dramatic increase in sediment nutrient concentrations was measured in 2003 with values
much higher than have been measured in other stormwater studies (Figure 16).
• Metals in the surface sediments in the Building pond exceeded the probably toxic levels of 150 mg/l for copper and 460 mg/l for zinc (Figure 17).
• Both the Building and Street ponds show a large increase in polycyclic aromatic
hydrocarbons measured in the sediments from 2000 to 2003 and many were above the possibly toxic level and some above the probably toxic level (Table 6 and Appendix H).
• Pesticides were measured in the sediments. Chlordane was above the probably toxic level
and DDE was detected in the possibly toxic range (Appendix H).
• Fish and other aquatic biota showed a great increase from 1997 to 2003 especially for Gambusia and water fleas. A reduction in some fish species may be attributed to the aggressive nature of Gambusia, which is viewed as an undesirable species by many ichthyologist unless it is native to the region (Tables 7, 8 and 9).
• In a macroinvertebrate study conducted in 1997, all the taxa reported were those highly
tolerant of polluted conditions. Low abundance of even these species was reported in locations where possibly toxic concentrations of pollutants had been measured in the sediments (Figures 18, 19 and 20 for inverts; and Table 17 and Appendix H for sediments).
• The concentrations measured at the outflow for four years show fairly even concentrations
except for a few instances (Figure 21 and 22). Increases in inorganic nitrogen in the Building pond was traced to some fertilizer practices, the high values in copper in 1997 were attributed to algicide applications, high concentrations in the Parking Lot pond resulted from contamination by Ybor channel inflows and the higher values for zinc in the Building pond could have come from roof runoff.
• Most water quality concentrations for metals were near the laboratory limit of detection or in
the case of TSS values were less than can be removed by sedimentation indicating the ponds are doing a good job of reducing most pollutants (Figure 22).
• Exceptions were copper in the early years where 30 to 50 percent of samples failed to meet
the copper standard probably caused by algicide applications; and lead in the Street pond where 12 to 40 percent of samples failed to meet standards (Figure 23).
POND IMPROVEMENTS One of the purposes of the study was to test different techniques to improve the function of the
Characterization of Three Stormwater Ponds, Final Report (WM716) September 2004
______________________________________________________________________________ Southwest Florida Water Management District, Resource Management Dept. Stormwater Program -74-
ponds. Since the poorest water quality was discharged from the Building pond, most of our efforts focused on this one pond.
• Skimmer box inserts reduced concentrations of pollutants by a large amount for water quality samples collected before they were installed and samples collected after installation (Figure 25a and 25b).
• The skimmer box inserts removed 15 cubic feet of gross solids contaminated with potentially
toxic pollution from the drainage basin (5.67 acres) before it could contaminate the pond sediments during the first year after installation (Figure 27 and Appendix J).
• A diversion structure installed to increase the travel time of the treatment volume in the
Building pond decreased concentrations in the discharge water by a considerable amount (Figure 30).
MAINTENANCE PRACTICES Various treatments were tested to determine if they would improve the aesthetics of the ponds.
• Algicide treatment for eliminating floating algae mats was being used in 1997. Data suggest that this was increasing both copper and nitrogen in the pond discharge water (Figure 31); and also increasing copper in the sediments to toxic levels (Figure 17).
• Biocultures indicate that they may reduce organic nitrogen and phosphorus, but did not
improve the aesthetics of the pond (Figure 32).
• Barley straw made no difference in the water quality of the pond or the aesthetics.
• Scraping out the bottom sediments of the pond and removing nuisance vegetation removed toxic levels of copper and reduced organic nitrogen and organic matter, but did not permanently improve the problems with floating vegetation.
SEE EXECUTIVE SUMMARY FOR CONCLUSIONS
Characterization of Three Stormwater Ponds, Final Report (WM716) September 2004
______________________________________________________________________________ Southwest Florida Water Management District, Resource Management Dept. Stormwater Program -75-

APPENDIX A Quality Assurance Information
______________________________________________________________________________ Southwest Florida Water Management District, Resource Management Dept. Stormwater Program
-76-
REFERENCES
Agency for Toxic Substances and Disease Registry (ATSDR). 2001. Polycyclic Aromatic
Hydrocarbons (PAHs). http://www.atsdr.cdc.gov/ToxProfiles/phs8806.html. American Public Health Association, American Water Works Association, and Water Pollution
Control Federation (APHA). 1985. Standard Methods for the Examination of Water and Wastewater, 17th Edition. American Public Health Association, Washington, DC.
Ashe, P.1983. A Catalogue of Chironomid genera and Subgenera of the World Including
synonyms (Diptera:Chironomidae). Ent. Scand.Suppl. 17:1-68. Barry, R. G. and R. J. Chorley. 1978. Atmosphere, Weather and Climate, Third Edition.
Methuen & C Ltd. Boyd, C. E. 1995. Bottom Soils, Sediment, and Pond Aquaculture. Chapman & Hall, New
York, NY. Burton, G. A., Jr. and R. E. Pitt. Stormwater Effects Handbook:Atoolbox for Watershed
Managers, Scientists, and Engineers. Lewis Publishers. CRC Press. New York. Brinkhurst, R.O.1986. Guide to the Freshwater Aquatic Microdrile Oligochaetes of North
America. Canadian Journal of fisheries and Aquatic Sciences. 84:259. Carr, D. W. and B. T. Rushton. 1995. Integrating a Native Herbaceous Wetland into
Stormwater Management. Southwest Florida Water Management District, 2379 Broad Street, Brooksville, FL 34604.
Chadwick, J.W., S.P.Canton, and R.L.Dent. 1986. Recovery of Benthic Invertebrate
Communities in Silver Bow Creek, Montana, Following Improved Metal Mine Wastewater Treatment. Water Air Soil Pollution. 28:427-438.
Clements, W.H..,D.S.Cheery, and J.Cairns, Jr. 1988. Heavy Metals on Insect Communities
in Streams. Canadian Journal of Fisheries and Aquatic Sciences 45:2017-2025. Courtenay, W. R. Jr. and G. K. Meffe. 1989. Small fishes in strange places: AQ review of
introduced poeciliids. In: G.K. Meffe and F. F. Snelson, Jr., (eds). Ecology and Evolution of Livebearing Fishes. Englewood Cliffs, NJ:Prentice Hall, pp 301-331.
Cullum, M. G. and Dierberg, F. E. 1990. Evaluation of a Dry Detention with Filtration
Stormwater Management System Which Receives Runoff from a Mixed Urban Land Use. South Florida Water Management District, West Palm Beach, Fl.
Davis, J.C. 1975. Minimal Dissolved Oxygen Requirements of Aquatic Life with Emphasis on
Canadian Species: A Review. Journal of Fish Res Bd Can 32:2295-2332 Dixon, L.K., M.G.Geyl, and S. Murray. 1998. Interpretation of Bulk Atmospheric Deposition
and Stormwater Quality Data in the Tampa Bay Region. Mote Marine Laboratory Technical Report No. 602. Tampa Bay Estuary Program, Mail Station I-1/NEP, St.
APPENDIX A Quality Assurance Information
______________________________________________________________________________ Southwest Florida Water Management District, Resource Management Dept. Stormwater Program
-77-
Petresburg, FL 33701. Duvall, R.J., L.W.J. Anderson, and C.R.Goldman. 2001. Pond Enclosure Evaluations of
Microbial Products and Chemical Algicides Used in Lake Management. J. Aquatic Plant Management 39:99-106.
Florida Department of Environmental Protection (FDEP) 2003 Development and evaluation
of Numerical Sediment Quality assessment Guidelines for Florida Inland Waters.Technical Report http://www.dep.state.fl.us/water/monitoring/docs/seds/SQAGs_for_Florida_Inland_Waters_01_03.PDF
Florida Department of Environmental Protection (FDEP). 1992. Standard Operating
Procedures for laboratory Operations and Sample Collection. Tallahassee, Florida. FDEP-QA-001/92, Quality Assurance Section, Tallahassee, Florida.
Foster, Johnny. Barley Straw for Natural Algae Control.
http://www.fosterlake.com/barleystraw.html Free, B.M. and G.G.Mulamoottil. 1983. The Limnology of Lake Wabukayne, a Stormwater
Impoundment. Water resources Bulletin. 19:821-827. Harper,H.H. 1990. Long-Term Performance Evaluation of the Alum Stormwater Treatment
System at Lake Ella, Florida. FDER Project WM339. Environmental Research & Design, Inc. Orlando, Florida.
Harper, H.H. and J.L.Herr. 1993. Treatment Efficiencies of Detention with Filtration Systems.
Final Report for SJRWMD Contract No. 90B103. Environmental research & Design, Inc. Orlando, FL.
Hammelink, J. L., P. F. Landrum, H. L. Bergman, W. H. Benson. 1994. Bioavailability:
Physical, Chemical, and Biological Interactions. Lewis Publishers. Boca Raton. http://www.fishbase.org/Summary/Species Summary.cfm http://www.nanfa.org/articles/Acmosquito.htm
Helsel, D.R. and R.M.Hirsch. 1995. Statistical Methods in Water resources. Elsevier Science
Publishers B.V.Amsterdam, The Netherlands. Kadlec, R. H. and R. L. Knight. 1996. Treatment Wetlands. Lewis Publishers, CRC Press,
New York Kehoe, M. J. 1993. Water Quality Survey of Twenty-Four Stormwater Wet-Detention Ponds.
Southwest Florida Water Management District, 2379 Broad Street, Brockville, FL 34609.
King, S. 1996. Managing the Blooming Algae. The IPM Practitioner. July:1-11. Klemm, D.J. 1982. Leeches (Annelida:Hirudinea) of North America. EPA-600/3-82-025. US
EPA, Washington DC.

APPENDIX A Quality Assurance Information
______________________________________________________________________________ Southwest Florida Water Management District, Resource Management Dept. Stormwater Program
-78-
Krebs, C.J. 1978. Ecology: The Experimental analysis of distribution and abundance, 2nd edition, Harper and Row, Publishers, New York, 678 pp.
Langeland, K.A. Barley Straw. Center for Aquatic Plants, Gainesville, FL 32606. LaPoint, T.W., W.M.McLancan and M.K.Morris. 1984. Relationships Among Observed Metal
Concentrations, Criteria, and Benthic Structural Community Responses in 15 Streams. J. Water Pollution control Fed. 56:1030-1038.
Lembi, C. A. 2001. Barley straw for Algae Control. Botany and Plant Pathology, Purdue
University http://www.agcom.purdue.edu/AgCom/Pubs Livingston, Eric. 1989. State Perspectives on Water Quality Criteria. In Design of Urban
Runoff Quality Controls. Roesner, L.A., Roesner, Urbonas, B. and Sonnen M. G. (eds) ASCE 345 E. 47th St. New York, NY 10017-2398.
Long, E. R., D. D. MacDonald, S. L. Smith, F. D. Calder 1995. Incidence of Adverse
Biological Effects Within Ranges of Chemical Concentrations in Marine and Estuarine Sediments. Environmental Management 19:81-97
Long, E. R., D.A. Wolfe, R.S. Carr, K.J. Scott, G. B. Thursby, H. L. Windom, R. Lee, F. D.
Calder, G. M. Sloane, and T. Seal. 1994. Magnitude and Extent of Sediment Toxicity in Tampa Bay, Florida. NOAA, Technical Memorandum NOS ORCA 78, 1305 East-West Highway, Silver Spring, MD 20910.
Marble, A. D. 1992. A Guide to Wetland Functional Design. Lewis Publishers, Boca Raton,
FL Milligan,M.R. 1997. Identification Manual for the Aquatic Oligochaeta of Florida Southwest
Florida Water Management District, Tampa, FL Mitsch, W.J. and J.G. Gosselink. 1993. Wetlands. Van Nostrand Reinhold, New York, NY> Moore,J.W. and S.Ramamoorthy. 1984. Heavy Metals in Natural Waters: Applied Monitoring
and Impact Assessment. Springer-Verlag, New Yourk, NY. Mueller, D.K., Hamilton, P.A., Helsel, D.R., Hitt, J.K., and Ruddy, B.C. 1995. Nutrients in
Ground Water and Surface Water of the United States: An Analysis of Data Through 1992. Water-Resources Investigations Report 95-4031. U.S. Geological Survey, Denver, CO
Murray, J. W. 1987. Mechanisms Controlling the Distribution of Trace Elements in Oceans
and Lakes. In Sources and Fates of Aquatic Pollutants, R.A. Hites and S. J. Eisenreich (eds). Advances in Chemistry Series 216, American Chemical Society, Washington, DC
O'Connor, P. O., K. D. Kostas, J. L. Hyland, J. F. Hyland, J. F. Paul, and J. K. Summers.
1998. Comparisons of Sediment Toxicity with Predictions Based on Chemical Guidelines.
APPENDIX A Quality Assurance Information
______________________________________________________________________________ Southwest Florida Water Management District, Resource Management Dept. Stormwater Program
-79-
Odum, H.T. 1983. Systems Ecology:An Introduction. John Wiley & Sons, Inc. New York, NY Page, L. M. and B. M. Burr. 1991. Gambusia affinis mosquito fish. Environmental Toxicology
and Chemistry, 17(3):468-471. Pennak, R.W. 1989. Fresh-Water Invertebrates of the United States, 3rdED, John wiley
&Sons, Inc., New York,NY Pitt, R. 2000. Source Characterization. In Innovative Urban Wet-Weather Flow Management
Systems, R. Field, J.P. Heaney and R.Pitt (eds). Technomic Publishing Co., Inc. http://www.epa.gov/ednnrmmrl/book/epa-600
Roberson, J.P. and J.D.Hem. 1967. Solubility of Aluminum in the Presence of Hydroxide,
Floride and Sulfate. U.S.Geologic Survey Water-Supply, Tampa, Florida. Rosenberg, D. M. and V.H.Ressh. 1993. Freshwater Biomonitoring and Benthic
Macroinvertebrates. Chapman and Hall, Inc. < New York, NY. Rupp, H. R. 2004 Adverse Assessments of Gambusia affinis. Rushton, B. T. 2002. Treatment of Stormwater Runoff from an Agricultural Basin by a Wet-
Detention Pond in Ruskin, Florida. Southwest Florida Water Management District, 2379 Broad Street, Brooksville, FL 34604.
Rushton, B. T. C.Miller, C. Hull and J. Cunningham. 1997. Three Design Alternatives for
Stormwater Detention Ponds. Southwest Florida Water Management District, 2379 Broad Street, Brooksville, FL 34604.
Rushton, B.T. and R. Hastings. 2001. Florida Aquarium Parking Lot: A Treatment Train
Approach to Stormwater Management., Southwest Florida Water Management District, 2379 Broad Street, Brooksville, FL 34604.
Southwest Florida Water Management District (SWFWMD) 1998. Water Management
Monthly, Volume VIII, Issue IX, February 1998. Stahre, P. and B. Urbonas. 1990. Stormwater Detention. Prentice Hall, Englewood Cliffs, NJ
07632. Steel, R. G. D. and J. H. Torrie. 1960. Principles and Procedures of Statistics. McGraw-Hill
Book Company, Inc. New York, NY. Stumm, W. and J. J. Morgan. 1981. Aquatic Chemistry: An Introduction Emphasizing
Chemical Equilibria in Natural Waters. John Wiley & Sons, New York, NY. Tampa Bay Estuary Program. 2000. Estimates of Total Nitrogen, Total Phosphorus, Total
Suspended Solids, and Biochemical Oxygen Demand Loadings to Tampa Bay, Florida. 100 8th Avenue SE, St. Petersburg, Florida 33701. Prepared by Janicki Environmental, Inc.
Teague, Kara, and B. T. Rushton. 2005. Stormwater Runoff Treatment by a Filtration
APPENDIX A Quality Assurance Information
______________________________________________________________________________ Southwest Florida Water Management District, Resource Management Dept. Stormwater Program
-80-
System and Wet Pond in Tampa, Florida. Final Report. Southwest Florida Water Management District, 2379 Broad Street, Brooksville, FL 34604.
Thorp, J.H. and A.P. Covich. 1991. Ecology and Classification of North American freshwater
Invertebrates. Academic Press, Inc. San Diego, CA. United States Environmental Protection Agency (USEPA). 1973. Biological Field and
Laboratory Methods for Measuring the Quality of surface Waters and Effluents, Report 670/4-73-001. U.S.EPA, Washington, D.C.
United State Environmental Protection Agency (USEPA). 1986. Quality Criteria for Water
1986. Washington, D.C., U. S. Environmental Protection Agency Report 440/586001, Office of Water Resources, Washington, DC.
United States Environmental Protection Agency. 1983. National Urban Runoff Program, Vol
I, NTIS PB84-185552, U.S.EPA, Washington, D.C. Urbonas, B. R. 1999. Design of Sand Filter for Stormwater Quality Enhancement. Water
Environment Research 71(1):102-112. Wanielista, M. P. and Y. A. Yousef. 1993. Stormwater Management. John Wiley & sons, Inc.
New York. Wilhm, J.L. 1979. Range of Diversity Index in Benthic Macroinvertebrate Populations.
Journal of the Water Pollution Control Federation, 42:R221-R224. Winner, R.W., J.S.VanDyke, N.Caris, and M.P.Farrel. 1975. Response of the
Macroinvertebrate Fauna to a Copper Gradient in an Experimentally-Polluted Stream. Journal of Applied Limnology. 19:2121-2127.
Winner, R.W.and J.D.Gauss. 1986. Relationship Between Chronic toxicity and
Bioaccumulation of Copper, Cadmium, and Zinc as affected by Water Hardness and Humic Acid. Journal of Aquatic Toxicology. 8:149-161.
Yousef, Y. A., T. Hvitved-Jacobsen, M. P. Wanielista, R. D. Tolbert. 1986. Nutrient
Transformation in Retention/Detention Ponds Receiving Highway Runoff. Journal Water Pollution Control Federation 58(8):838-843.

APPENDIX A Quality Assurance Information
______________________________________________________________________________ Southwest Florida Water Management District, Resource Management Dept. Stormwater Program
-81-

APPENDIX A Quality Assurance Information
______________________________________________________________________________ Southwest Florida Water Management District, Resource Management Dept. Stormwater Program
-82-
APPENDIX A
Quality Assurance Information
Weir Diagrams and Formulas Comparison of Grab and Composite Samples
Water Quality Test

APPENDIX A Quality Assurance Information
______________________________________________________________________________ Southwest Florida Water Management District, Resource Management Dept. Stormwater Program
-83-
X 6.99
X X 7.49
O 7.57
O
O 7.12
Outfall elevation 7.51 Outfall elevation 6.99
at staff gauge
Original data: Excel: Demo/Grabs and Word: Demo/ Flow Calculation Setup FLOW CALCULATION SET UP FOR BUILDING POND AND STREET POND AT
THE FLORIDA AQUARIUM X = LOCATION WHERE WATER FLOWS OVER WEIR FIRST O = LOCATION WHERE WATER FLOWS OVER WEIR LAST Standard formula for rectangular weir with end contractions: Q=K*(L-(0.2 * H))*(H^1.5) Q = flow in cubic feet per second (cfs) K = constant of 3.33 L = length of weir H = head (depth of water over weir) BUILDING POND ELEVATION vs. FLOW:
There is a 1.0-inch (0.08 ft) difference in elevation between the southeast corner where the water flows first and the northwest corner where the water flows last. Flow calculations begin at pond level (at pond level 7.51, head is 0.0). For pond levels 7.51 ft. thru 7.56 ft. (head 0.0 ft. thru 0.04 ft.), flow calculations should be done utilizing only one long side of the outfall box (H=head):
3.33 * (8.50 – (0.2 * H)) * (H^1.5)) + 2 * (3.33 * (3.67 – (0.2 * H)) * (H^1.5))
YEAR ONE STREET POND ELEVATION vs. FLOW:
There is a 1.5-inch (0.13 ft.) difference in elevation between the northwest corner where the water flows first and the southeast corner where the water flows last. Flow calculations begin at 6.99 NGVD. At pond level 7.04, head is 0.0. Between pond levels 6.99 and 7.06, flow calculations should be done utilizing only one long side of the outfall box
3.33* (8.50 – (0.2 * H))*(H^1.5) Between pond levels above 7.06 thru 7.49 (head 0.07 ft. thru 0.50 ft.), flow calculations should be done utilizing all four sides of the outfall box:
2 * (3.33 * (8.50 – (0.2 * H)) * (H^1.5) + 2 * (3.33 * (3.04 – (0.2 * H)) * (H^1.5))
YEAR TWO STREET POND ELEVATION vs. FLOW: Flow calculations begin at 7.17 NGVD. At pond level 7.17, head is 0.0. Between pond levels 7.17
BUILDING POND OUTFALL
STREET POND OUTFALL
OLD
STREET POND OUTFALL
NEW
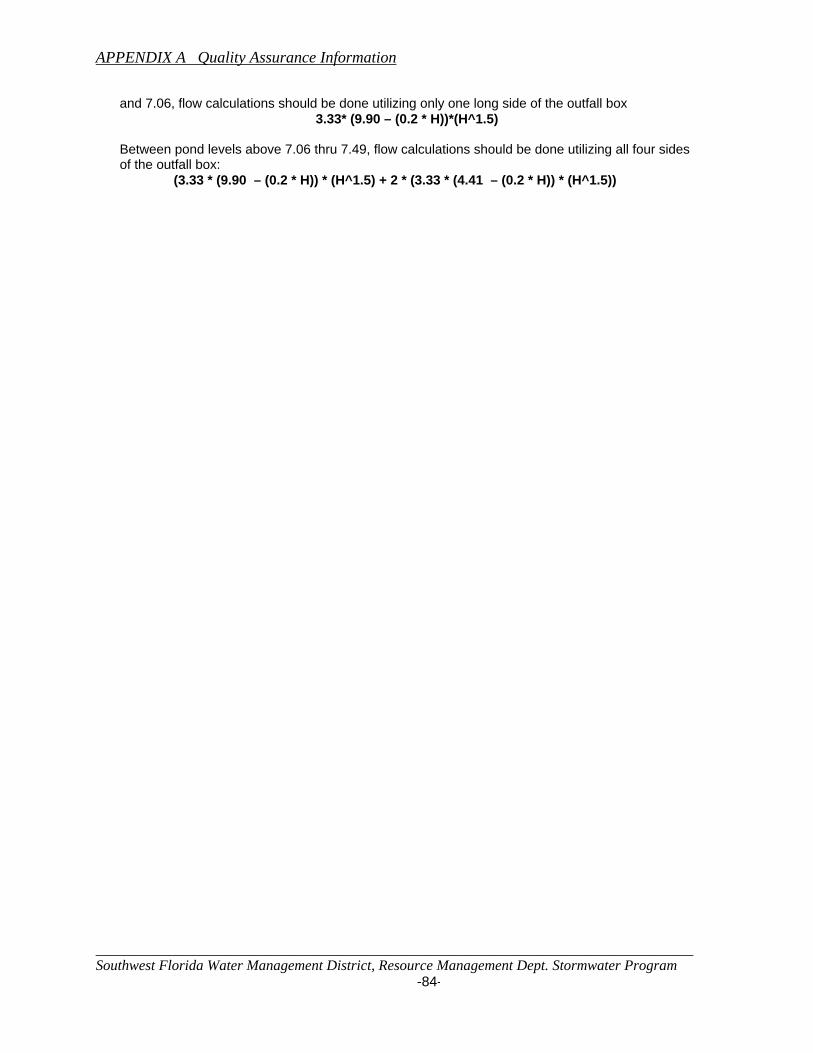
APPENDIX A Quality Assurance Information
______________________________________________________________________________ Southwest Florida Water Management District, Resource Management Dept. Stormwater Program
-84-
and 7.06, flow calculations should be done utilizing only one long side of the outfall box 3.33* (9.90 – (0.2 * H))*(H^1.5)
Between pond levels above 7.06 thru 7.49, flow calculations should be done utilizing all four sides of the outfall box:
(3.33 * (9.90 – (0.2 * H)) * (H^1.5) + 2 * (3.33 * (4.41 – (0.2 * H)) * (H^1.5))
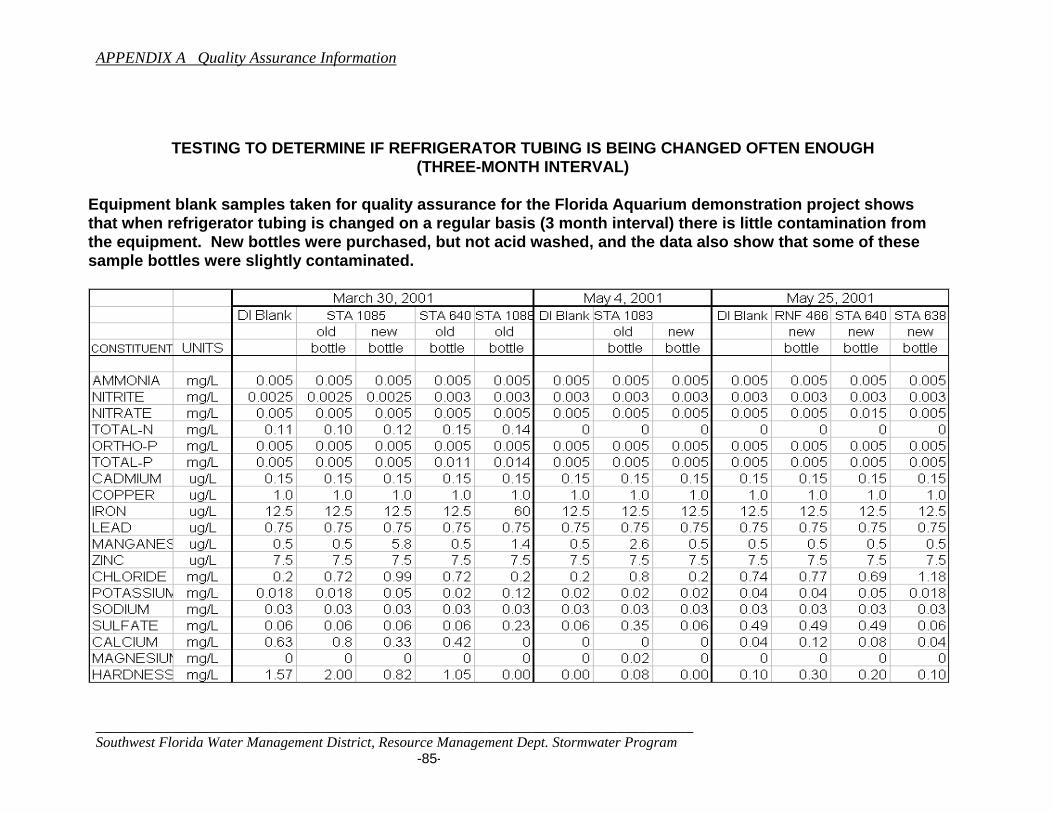
APPENDIX A Quality Assurance Information
______________________________________________________________________________ Southwest Florida Water Management District, Resource Management Dept. Stormwater Program -85-
TESTING TO DETERMINE IF REFRIGERATOR TUBING IS BEING CHANGED OFTEN ENOUGH
(THREE-MONTH INTERVAL) Equipment blank samples taken for quality assurance for the Florida Aquarium demonstration project shows that when refrigerator tubing is changed on a regular basis (3 month interval) there is little contamination from the equipment. New bottles were purchased, but not acid washed, and the data also show that some of these sample bottles were slightly contaminated.

APPENDIX A Quality Assurance Information
______________________________________________________________________________ Southwest Florida Water Management District, Resource Management Dept. Stormwater Program -86-
Table A-2. Testing tubing and bottles with DI water for quality assurance.

APPENDIX A Quality Assurance Information
______________________________________________________________________________ Southwest Florida Water Management District, Resource Management Dept. Stormwater Program -87-
Table A-3. Testing tubing and bottles with DI water for quality assurance.
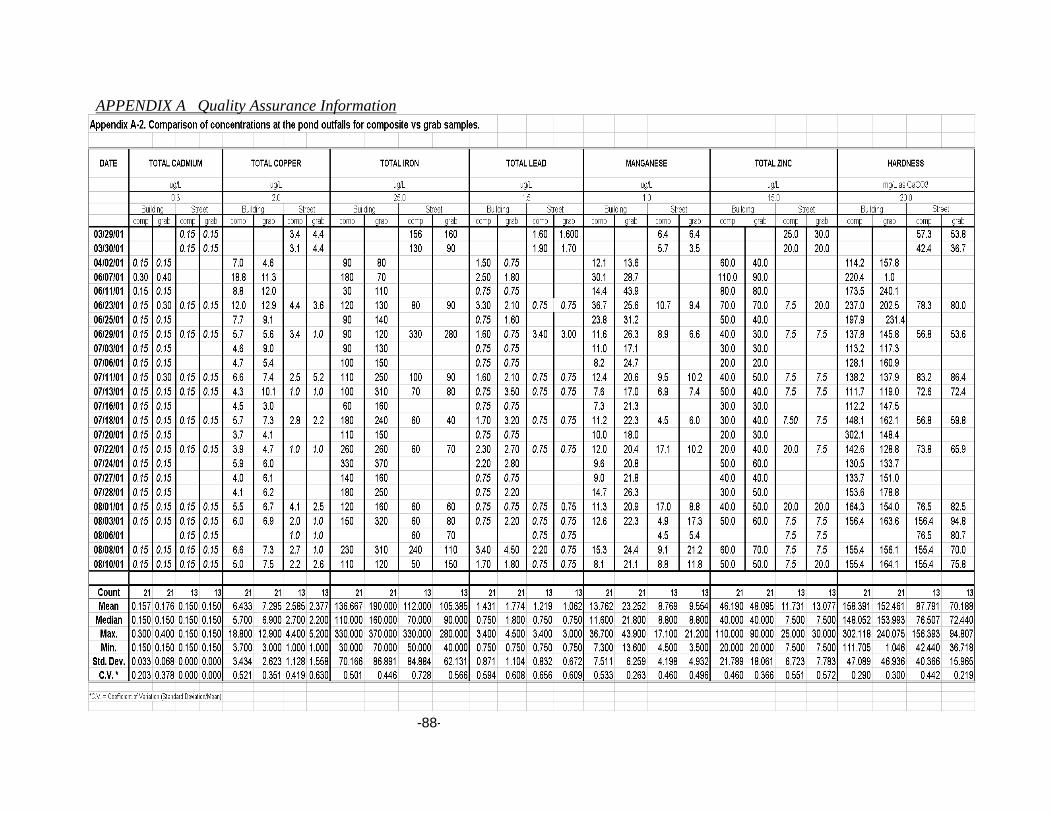
APPENDIX A Quality Assurance Information
______________________________________________________________________________ Southwest Florida Water Management District, Resource Management Dept. Stormwater Program
-88-
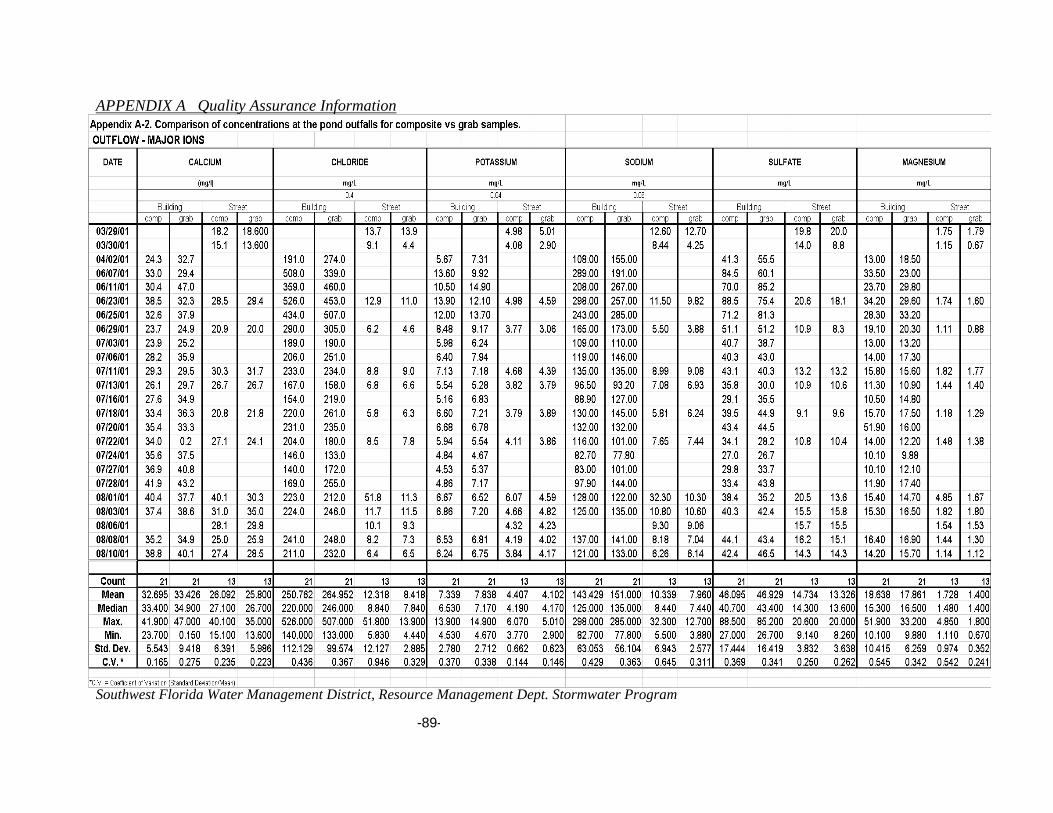
APPENDIX A Quality Assurance Information
______________________________________________________________________________ Southwest Florida Water Management District, Resource Management Dept. Stormwater Program
-89-

APPENDIX B Rainfall Characteristics
______________________________________________________________________________ Southwest Florida Water Management District, Resource Management Dept. Stormwater Program -90-
0
0.1
0.2
0.3
0.4
0.5
0.6
1 2 3 4 5 6 7 8 9 10 11 12 13 14 15 16 17 18 19 20 21
composite grab
ammonia (mg/l)Not different alpha=0.10 (0.38)
0
0.05
0.1
0.15
0.2
0.25
0.3
1 2 3 4 5 6 7 8 9 10 11 12 13 14 15 16 17 18 19 20 21
composite grab
nitrate (mg/l)Is different alpha=0.10 (0.024)
0
0.5
1
1.5
2
2.5
1 2 3 4 5 6 7 8 9 10 11 12 13 14 15 16 17 18 19 20 21
composite grab
total nitrogen (mg/l)Not different alpha=0.10 (0.669)
0 2 4 6 8
10 12 14
1 2 3 4 5 6 7 8 9 10 11 12 13 14 15 16 17 18 19 20 21
composite grab
suspended solids (mg/l)Is different alpha=0.10 (0.038)
0
0.02
0.04
0.06
0.08
0.1
0.12
1 2 3 4 5 6 7 8 9 10 11 12 13 14 15 16 17 18 19 20 21
composite grab
ortho phosphorus (mg/l)Is different alpha=0.10 (0.08)
0 0.05 0.1
0.15 0.2
0.25 0.3
0.35 0.4
1 2 3 4 5 6 7 8 9 10 11 12 13 14 15 16 17 18 19 20 21
composite grab
total phosphorus (mg/l)Is different alpha=0.10 (0.0543)
0 50
100 150 200 250 300 350 400
1 2 3 4 5 6 7 8 9 10 11 12 13 14 15 16 17 18 19 20 21
composite grab
total iron (ug/l)Is different alpha=0.10 (0.028)
2 4 6 8
10 12 14 16 18 20
1 2 3 4 5 6 7 8 9 10 11 12 13 14 15 16 17 18 19 20 21
composite grab
total copper (ug/l)Is different alpha=0.10 (0.068)
Figure A-2. Composite samples taken at the outflow of the Building Pond compared to grab samples taken when the samples were retrieved. Differences were tested with Mann-Whitney statistical test. Differences are noted at the alpha=0.10 level and the actual significance level is given in parentheses. The x-axis represents the individual storm events and y-axis represents concentrations. Except for nitrates, the grab samples usually measured higher concentrations than the composite samples. Storms 1 and 2 were exceptions to this conclusion.
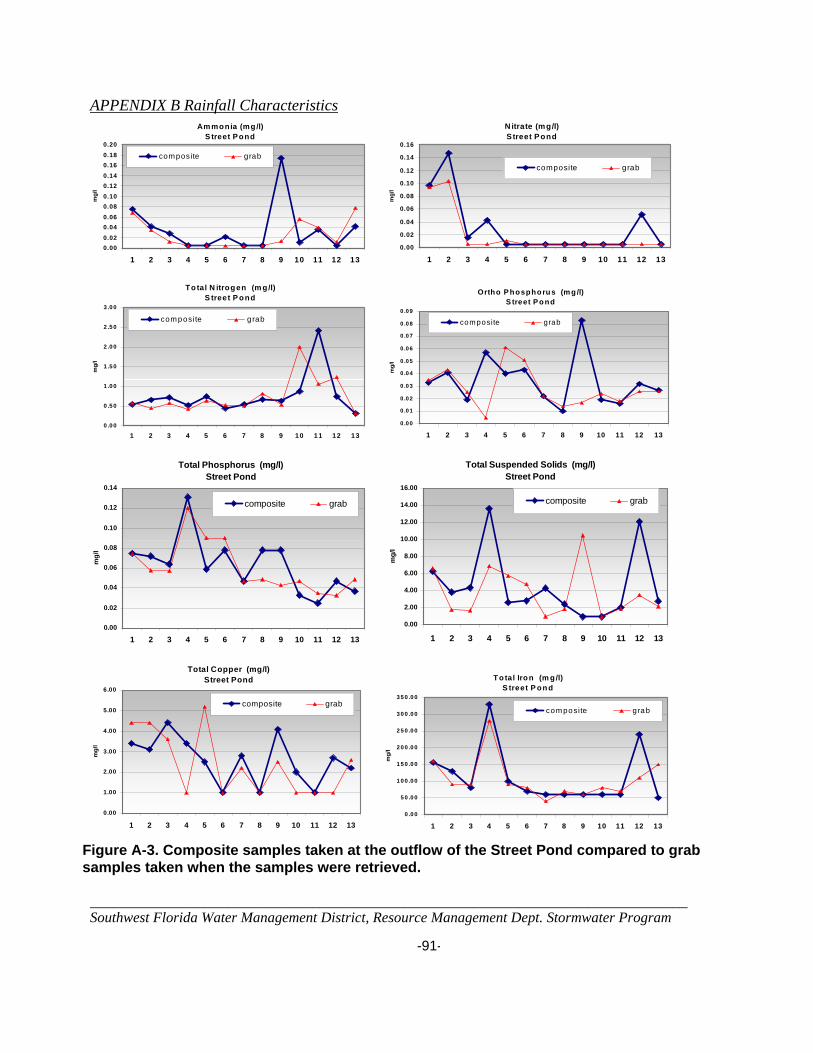
APPENDIX B Rainfall Characteristics
______________________________________________________________________________ Southwest Florida Water Management District, Resource Management Dept. Stormwater Program -91-
Ammonia (mg/l)S treet Pond
0.000.020.040.060.080.100.120.140.160.180.20
1 2 3 4 5 6 7 8 9 10 11 12 13
mg/
l
composite grab
N itrate (mg/l)S treet Pond
0.00
0.02
0.04
0.06
0.08
0.10
0.12
0.14
0.16
1 2 3 4 5 6 7 8 9 10 11 12 13
mg/
l
composite grab
Total N itrogen (m g/l)
S treet P ond
0.00
0 .50
1 .00
1 .50
2 .00
2 .50
3 .00
1 2 3 4 5 6 7 8 9 10 11 12 13
mg/
l
composite grab
Ortho P hosphorus (m g /l)S treet P ond
0.0 0
0 .0 1
0 .0 2
0 .0 3
0 .0 4
0 .0 5
0 .0 6
0 .0 7
0 .0 8
0 .0 9
1 2 3 4 5 6 7 8 9 10 11 12 13
mg/
l
composite grab
Total Phosphorus (mg/l)
Street Pond
0.00
0.02
0.04
0.06
0.08
0.10
0.12
0.14
1 2 3 4 5 6 7 8 9 10 11 12 13
mg/
l
composite grab
Total Suspended Solids (mg/l)Street Pond
0.00
2.00
4.00
6.00
8.00
10.00
12.00
14.00
16.00
1 2 3 4 5 6 7 8 9 10 11 12 13
mg/
l
composite grab
Total Copper (mg/l)
Street Pond
0.00
1.00
2.00
3.00
4.00
5.00
6.00
1 2 3 4 5 6 7 8 9 10 11 12 13
mg/
l
composite grab
T o tal Iro n (m g/l)S treet P on d
0 .0 0
5 0 .0 0
1 0 0 .0 0
1 5 0 .0 0
2 0 0 .0 0
2 5 0 .0 0
3 0 0 .0 0
3 5 0 .0 0
1 2 3 4 5 6 7 8 9 10 11 12 13
mg/
l
com posite grab
Figure A-3. Composite samples taken at the outflow of the Street Pond compared to grab samples taken when the samples were retrieved.
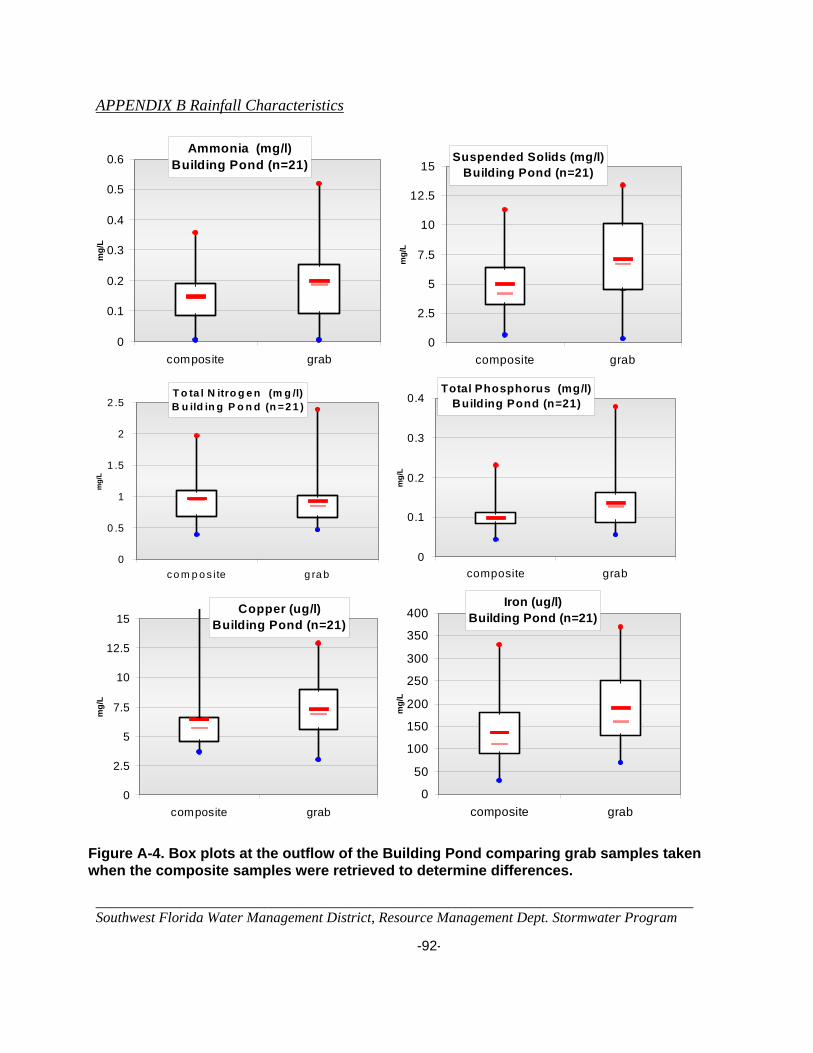
APPENDIX B Rainfall Characteristics
______________________________________________________________________________ Southwest Florida Water Management District, Resource Management Dept. Stormwater Program -92-
Ammonia (mg/l)
Building Pond (n=21)
0
0.1
0.2
0.3
0.4
0.5
0.6
composite grab
mg/
L
Suspended Solids (mg/l)Building Pond (n=21)
0
2.5
5
7.5
10
12.5
15
composite grab
mg/
L
T o ta l N itro g e n (m g /l)B u ild in g P o n d (n =2 1 )
0
0 .5
1
1 .5
2
2 .5
co m p o s ite g ra b
mg/
L
Total Phosphorus (mg/l)Building Pond (n=21)
0
0.1
0.2
0.3
0.4
composite grab
mg/
L
Copper (ug/l)Building Pond (n=21)
0
2.5
5
7.5
10
12.5
15
composite grab
mg/
L
Iron (ug/l)Building Pond (n=21)
0
50
100
150
200
250
300
350
400
composite grab
mg/
L
Figure A-4. Box plots at the outflow of the Building Pond comparing grab samples taken when the composite samples were retrieved to determine differences.

APPENDIX B Rainfall Characteristics
______________________________________________________________________________ Southwest Florida Water Management District, Resource Management Dept. Stormwater Program -93-
Ammonia (mg/l)Street Pond (n=13)
0
0.05
0.1
0.15
0.2
composite grab
mg/
L
Suspended Solids (mg/l)Street Pond (n=13)
0
5
10
15
20
composite grabm
g/L
Total Nitrogen (mg/l)
Street Pond (n=13)
0
0.4
0.8
1.2
1.6
2
2.4
2.8
composite grab
mg/
L
Total Phosphorus (mg/l)Street Pond (n=13)
0
0.02
0.04
0.06
0.08
0.1
0.12
0.14
com pos ite grab
mg/
L
C o p p e r (u g /lS tre e t P o n d (n =1 3 ))
0
1
2
3
4
5
6
c om pos ite grab
ug/L
Iro n (u g /l)S tre e t P o n d (n = 1 3 )
0
50
1 00
1 50
2 00
2 50
3 00
3 50
c o m p os ite g rab
ug/L
Figure A-5. Box plots at the outflow of the Street Pond comparing grab samples taken when the composite samples were retrieved to determine differences.
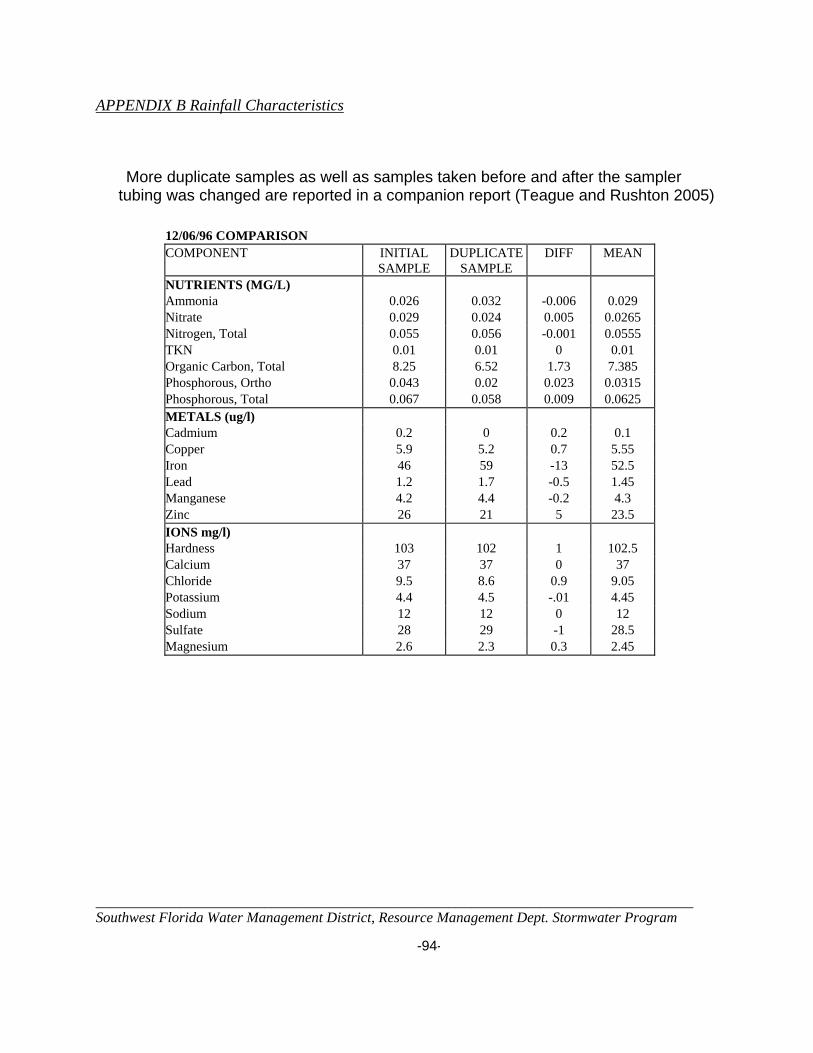
APPENDIX B Rainfall Characteristics
______________________________________________________________________________ Southwest Florida Water Management District, Resource Management Dept. Stormwater Program -94-
More duplicate samples as well as samples taken before and after the sampler tubing was changed are reported in a companion report (Teague and Rushton 2005)
12/06/96 COMPARISON COMPONENT INITIAL
SAMPLE DUPLICATE
SAMPLE DIFF MEAN
NUTRIENTS (MG/L) Ammonia 0.026 0.032 -0.006 0.029 Nitrate 0.029 0.024 0.005 0.0265 Nitrogen, Total 0.055 0.056 -0.001 0.0555 TKN 0.01 0.01 0 0.01 Organic Carbon, Total 8.25 6.52 1.73 7.385 Phosphorous, Ortho 0.043 0.02 0.023 0.0315 Phosphorous, Total 0.067 0.058 0.009 0.0625 METALS (ug/l) Cadmium 0.2 0 0.2 0.1 Copper 5.9 5.2 0.7 5.55 Iron 46 59 -13 52.5 Lead 1.2 1.7 -0.5 1.45 Manganese 4.2 4.4 -0.2 4.3 Zinc 26 21 5 23.5 IONS mg/l) Hardness 103 102 1 102.5 Calcium 37 37 0 37 Chloride 9.5 8.6 0.9 9.05 Potassium 4.4 4.5 -.01 4.45 Sodium 12 12 0 12 Sulfate 28 29 -1 28.5 Magnesium 2.6 2.3 0.3 2.45

APPENDIX B Rainfall Characteristics
______________________________________________________________________________ Southwest Florida Water Management District, Resource Management Dept. Stormwater Program -95-
Appendix A-3
SEDIMENT SAMPLING PREPARATION PROCEDURE AHEAD OF TIME Have meeting with all the people involved in the sediment sampling and assign jobs
Get the FedEx or UPS account # from Gwen to send sediment samples to the Lab on
collection day. Get name of lab, address, telephone number, and contact person of the laboratory doing
our sediment analyses from SWFWMD (Mark Rials). Order bottles from the laboratory for BNA, pesticides, TKN, total phosphorus,
sediment size analysis, and any other analyses that are going to be done. Also check that chain of custody sheets will arrive with bottles.
Find out from the Mail Room what time is the latest we can have the coolers there to be shipped PRIORITY OVERNIGHT- this will determine how we ship the coolers - if I remember correctly UPS is later than FedEx - get at least 9 PRIORITY OVERNIGHT shipping labels and plastic covers for whichever carrier we will be using (they are in the cabinet over the typewriter by Josie)
Make copies (both sides) of chain of custody sheets - you need enough to log each type of sample on a separate line (each site will take up 4 lines) - be sure to have extras
Get chain of custody forms and new stickers from lab Get stickers for bottles Plastic gloves and a box of paper towels and 6 lab pads - for cleaning sediment
sampling equipment in the field Make sure we have enough markers, pens, and pencils and a pad of paper Make sample sets for each of the 7 sites and 2 sets for duplicates.
1 - DEP Sediment analysis jar (1 qt) 1 - DEP Sediment size jar (8 oz ?) 2 - DEP Pesticide bottles (lg. Amber glass) 2? - DEP BNA bottles (lg. Amber glass) ? - DEP jars for sediment samples 5 - district WQ sample bottles (standard set)
Put 2 sets of bottles in each cooler - if you can’t get 2 complete sets in a cooler, pack sediment and WQ separately
Have 2 empty coolers for ice (extra coolers in the environmental storage room if there are not enough in lab storage room)
Have 3 empty coolers to sort full bottles Get a drink cooler (rm. B or storage rm.) Reserve a hydrolab - on Quincy’s calendar Get sediment corer (there should also be 2 scoops for mixing in the corer box)
APPENDIX B Rainfall Characteristics
______________________________________________________________________________ Southwest Florida Water Management District, Resource Management Dept. Stormwater Program -96-
and at least 8 feet of extensions (I think these are 5-6 ft extensions, so about 2 will be needed. Make certain you have the bolt to attach it to the corer). Corer is in room B in 2 wood carrying cases and extensions are in environmental storage room out back (or Keith’s storage room)
Get 2 stainless steel mixing pans & 4" hand shovel in room B Get 2 glass mixing pans and small hand shovel in stormwater cabinet Make sure you have the two pipe wrenches that are usually in the truck. Take a 12" ruler to measure depth of sample. Get 2 squirt bottles full of Ethanol -
Bottles should be in room B someplace - Fill in Lab - be sure you know where they keep the Ethanol in the lab - we will probably need to refill the bottles Taking the sediment core:
Put corer together and insert stainless steel or plastic tube (some Vaseline may make disassembling the corer easier)
Select spot to sample and don't muck up the bottom too much because you will have to take several cores if you are taking two depths (top 1" and 4 to 5 ")
Send someone ahead with the hydrolab to take readings and WQ samples at the sites selected for the sediment samples.
Scrape away a little off the top of soil where you intend to take the sample. Position corer and measure how deep it will have to go into the ground to take five
inches of sample. Gently twist and rock corer into the sediments. Only twist in direction to make fitting
tighter. When the corer is deep enough, hold down suction on top of corer and gently rock to
remove from sediments. As soon as free from sediments turn sideways in case the core wants to slide out. When retrieved lift suction and carefully pour water out of the top end of the corer. Remove tube and take plunger to push the sample out and into a stainless steel or glass
tray. Have three pans waiting.
For entire core For the top inch of sediment (remove vegetation or sticks, etc) For four to five inch depth (throw away the part not used in the middle)
Repeat until there is enough sample for analysis Mix the separate layers separately in their pans. Mix thoroughly using four-corner method or any other (this usually results in a soupy
mixture. Put into appropriate bottles Rinse equipment with DI water Record time and other notes into field journal. Repeat procedure at next site until all are sampled
APPENDIX B Rainfall Characteristics
______________________________________________________________________________ Southwest Florida Water Management District, Resource Management Dept. Stormwater Program -97-
Take a duplicate sample for each 10 sites sampled. The procedure is simpler if only taking sample of top four inches of sediments, but
tasks are essentially the same.
Wash all sediment sampling equipment: dredge, corer, scoops, pans, and shovels (all parts of corer except extensions)
Wash Liquinox and rinse well Rinse thoroughly with Ethanol Drain on lab pads Wrap corer and parts in lab pads - return to cases Put Ekman dredge in a clean plastic bag and return to case Put lab pad between the pans so they don’t stick - put them in a clean plastic bag - they can go in one of the extra “sorting” coolers for transporting. DAY AHEAD OF TIME - (there may be additions to this list) 1. REMEMBER TO CANCEL YOUR TRUCK TODAY IF YOU DON’T NEED IT ! 2. Calibrate and charge hydrolab and put your name on it on a full sheet of paper so no one else
takes it 3. Fill several DI bottles (the ones with the hoses work best) 4. Load supplies 5. Confirm reservation for truck SAMPLING DAY(S) P.M. - (there may be additions to this list) 6. Pack and ship DEP samples 7. Fill out chain of custody forms and double check 8. Turn in District WQ samples 9. Refill supplies as needed
D:\Demo\sediments\Procedure.doc
APPENDIX B Rainfall Characteristics
______________________________________________________________________________ Southwest Florida Water Management District, Resource Management Dept. Stormwater Program -98-
APPENDIX B
Rainfall Characteristics for All Rain Events >0.23 Intensive Study 200-2003
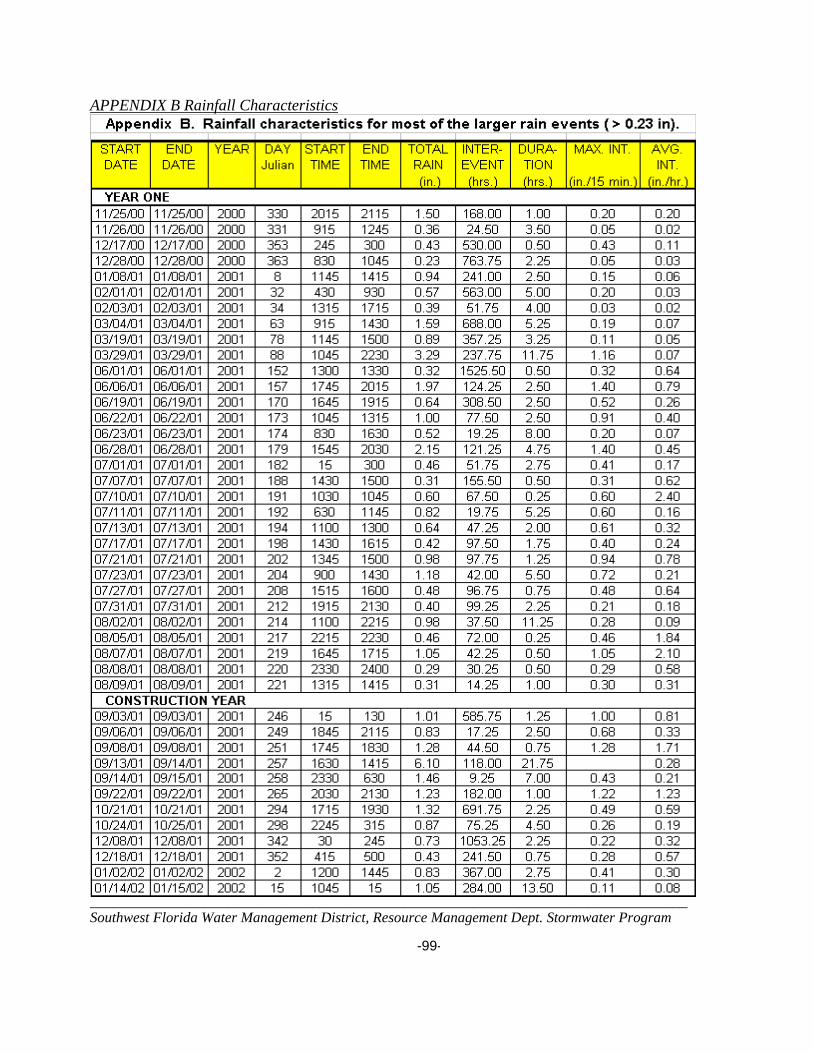
APPENDIX B Rainfall Characteristics
______________________________________________________________________________ Southwest Florida Water Management District, Resource Management Dept. Stormwater Program -99-

APPENDIX B Rainfall Characteristics
______________________________________________________________________________ Southwest Florida Water Management District, Resource Management Dept. Stormwater Program -100
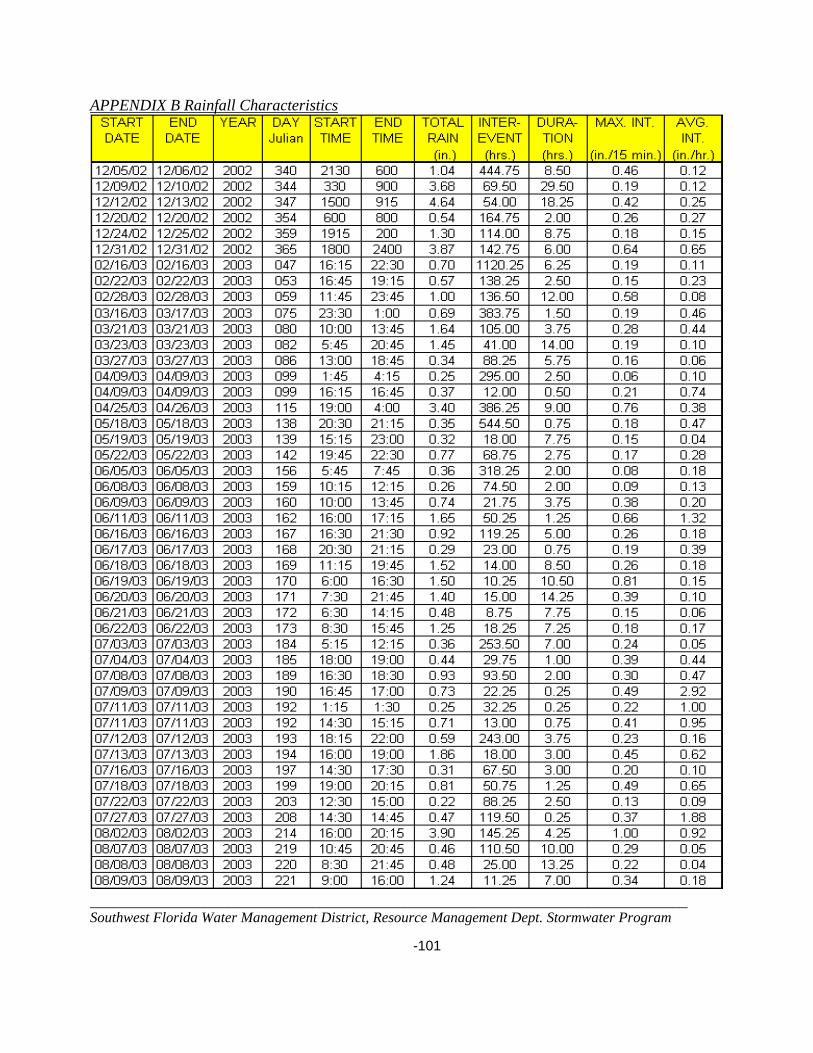
APPENDIX B Rainfall Characteristics
______________________________________________________________________________ Southwest Florida Water Management District, Resource Management Dept. Stormwater Program -101
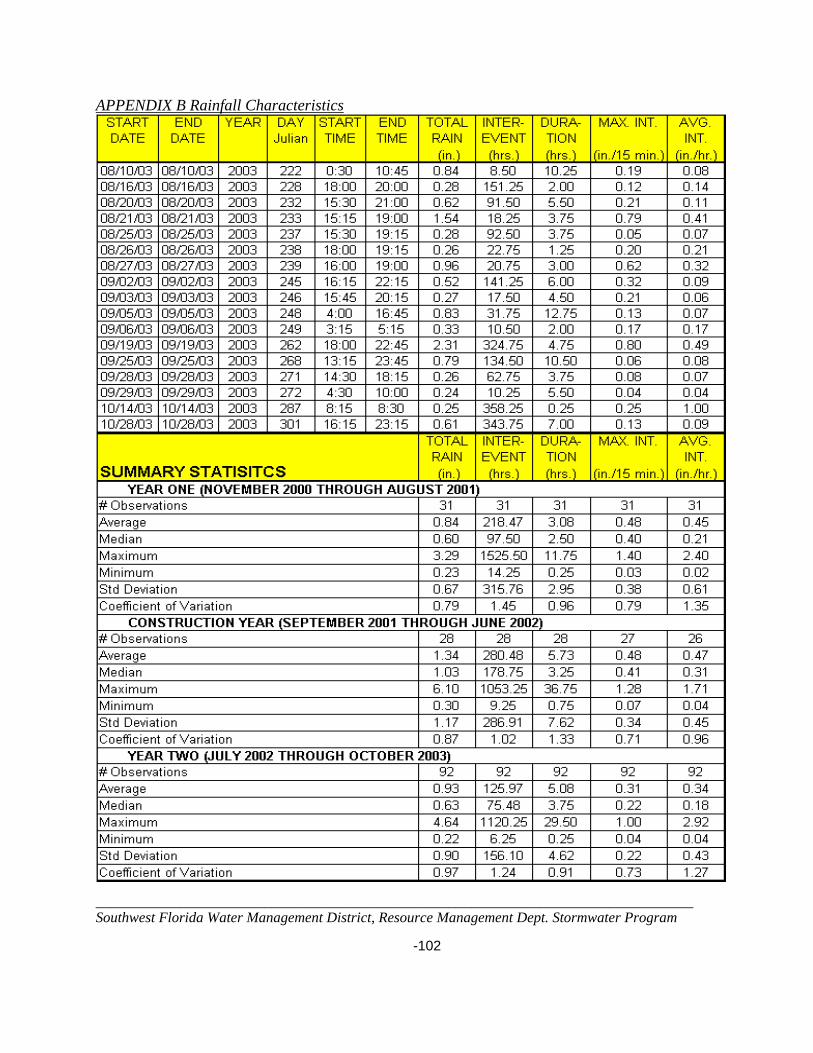
APPENDIX B Rainfall Characteristics
______________________________________________________________________________ Southwest Florida Water Management District, Resource Management Dept. Stormwater Program -102

APPENDIX B Rainfall Characteristics
______________________________________________________________________________ Southwest Florida Water Management District, Resource Management Dept. Stormwater Program -103
APPENDIX C Water Level Plotted with Rainfall
______________________________________________________________________________ Southwest Florida Water Management District, Resource Management Dept. Stormwater Program -104
APPENDIX C
Water Level Plotted with Rainfall Intensive Study 2000-2003
3Plevel2 Last printed August 24, 2005 4:02 PM
APPENDIX C Water Level Plotted with Rainfall
______________________________________________________________________________ Southwest Florida Water Management District, Resource Management Dept. Stormwater Program -105
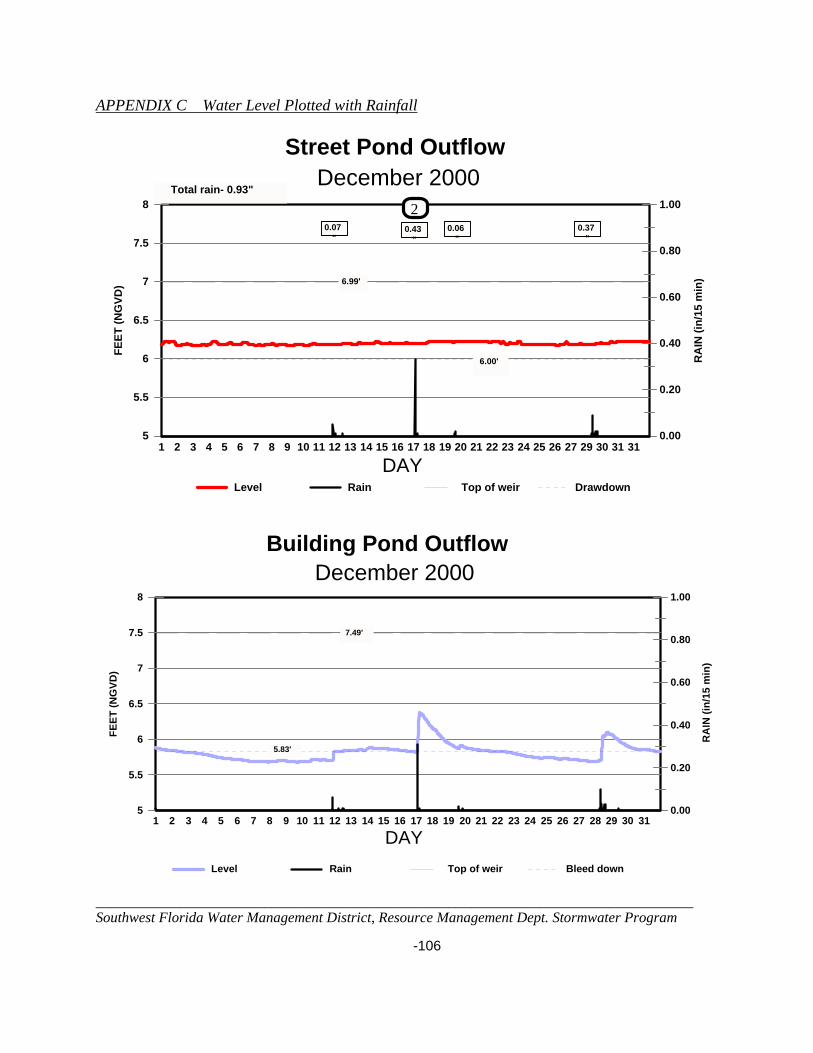
APPENDIX C Water Level Plotted with Rainfall
______________________________________________________________________________ Southwest Florida Water Management District, Resource Management Dept. Stormwater Program -106
5
5.5
6
6.5
7
7.5
8
FEET
(NG
VD)
0.00
0.20
0.40
0.60
0.80
1.00
RA
IN (i
n/15
min
)
1 2 3 4 5 6 7 8 9 10 11 12 13 14 15 16 17 18 19 20 21 22 23 24 25 26 27 29 30 31 31
DAYLevel Rain Top of weir Drawdown
Street Pond OutflowDecember 2000
Total rain- 0.93"
6.99'
6.00'
0.07"
0.06"
0.43"
0.37"
2
5
5.5
6
6.5
7
7.5
8
FEET
(NG
VD)
0.00
0.20
0.40
0.60
0.80
1.00
RA
IN (i
n/15
min
)
1 2 3 4 5 6 7 8 9 10 11 12 13 14 15 16 17 18 19 20 21 22 23 24 25 26 27 28 29 30 31
DAYLevel Rain Top of weir Bleed down
Building Pond OutflowDecember 2000
7.49'
5.83'
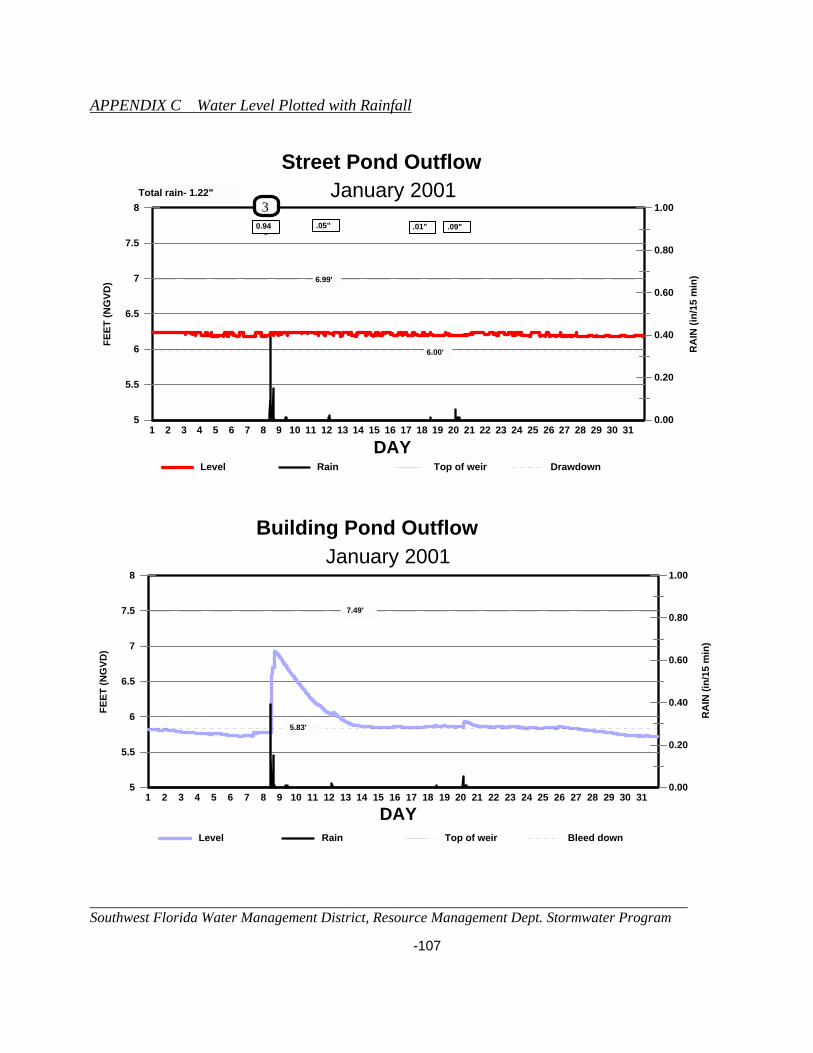
APPENDIX C Water Level Plotted with Rainfall
______________________________________________________________________________ Southwest Florida Water Management District, Resource Management Dept. Stormwater Program -107
5
5.5
6
6.5
7
7.5
8
FEET
(NG
VD)
0.00
0.20
0.40
0.60
0.80
1.00
RA
IN (i
n/15
min
)
1 2 3 4 5 6 7 8 9 10 11 12 13 14 15 16 17 18 19 20 21 22 23 24 25 26 27 28 29 30 31
DAYLevel Rain Top of weir Drawdown
Street Pond OutflowJanuary 2001Total rain- 1.22"
6.99'
6.00'
0.94"
.05" .01" .09"
3
5
5.5
6
6.5
7
7.5
8
FEET
(NG
VD)
0.00
0.20
0.40
0.60
0.80
1.00
RA
IN (i
n/15
min
)
1 2 3 4 5 6 7 8 9 10 11 12 13 14 15 16 17 18 19 20 21 22 23 24 25 26 27 28 29 30 31
DAYLevel Rain Top of weir Bleed down
Building Pond OutflowJanuary 2001
7.49'
5.83'
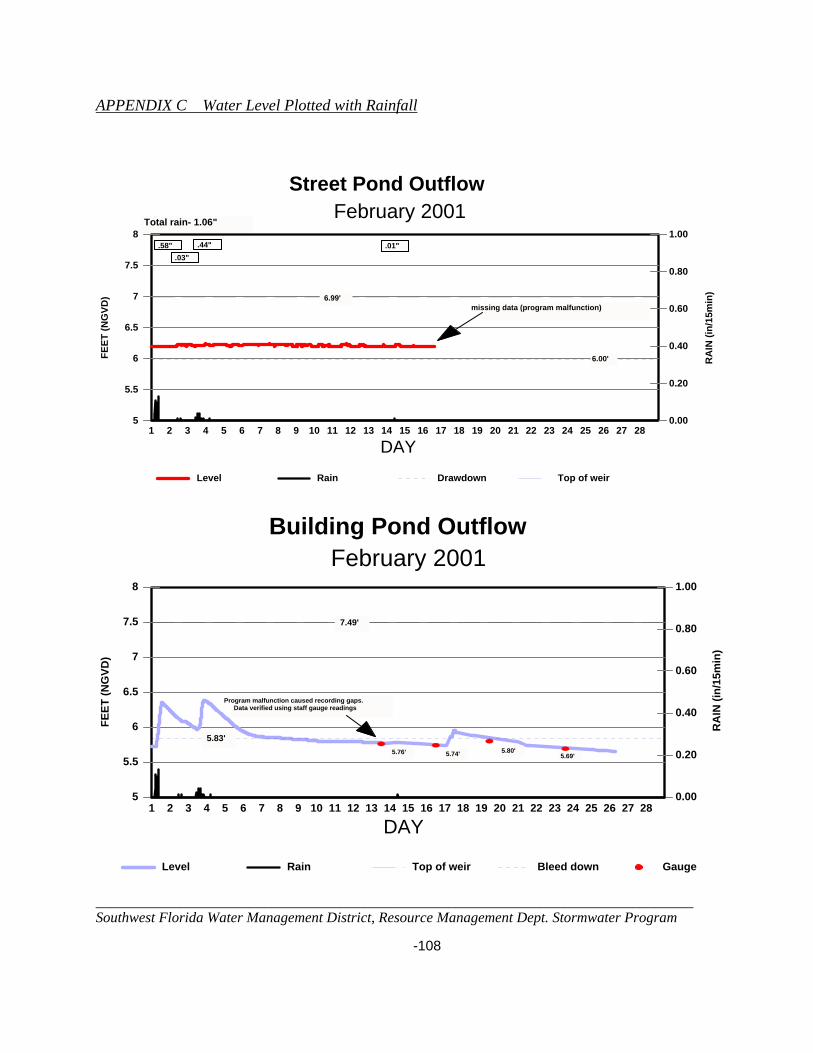
APPENDIX C Water Level Plotted with Rainfall
______________________________________________________________________________ Southwest Florida Water Management District, Resource Management Dept. Stormwater Program -108
5
5.5
6
6.5
7
7.5
8
FEET
(NG
VD)
0.00
0.20
0.40
0.60
0.80
1.00
RA
IN (i
n/15
min
)
1 2 3 4 5 6 7 8 9 10 11 12 13 14 15 16 17 18 19 20 21 22 23 24 25 26 27 28
DAYLevel Rain Drawdown Top of weir
Street Pond OutflowFebruary 2001
Total rain- 1.06"
missing data (program malfunction)6.99'
6.00'
.03".44".58" .01"
5
5.5
6
6.5
7
7.5
8
FEET
(NG
VD)
0.00
0.20
0.40
0.60
0.80
1.00
RA
IN (i
n/15
min
)
1 2 3 4 5 6 7 8 9 10 11 12 13 14 15 16 17 18 19 20 21 22 23 24 25 26 27 28
DAY
Level Rain Top of weir Bleed down Gauge
Building Pond OutflowFebruary 2001
7.49'
5.83'5.76' 5.74' 5.80'
5.69'
Program malfunction caused recording gaps.Data verified using staff gauge readings

APPENDIX C Water Level Plotted with Rainfall
______________________________________________________________________________ Southwest Florida Water Management District, Resource Management Dept. Stormwater Program -109
5
5.5
6
6.5
7
7.5
8
FEET
(NG
VD)
0.00
0.20
0.40
0.60
0.80
1.00
RA
IN (i
n/15
min
)
1 2 3 4 5 6 7 8 9 10 11 12 13 14 15 16 17 18 19 20 21 22 23 24 25 26 27 28 29 30 31
DAYLevel Rain Top of weir Drawdown Gauge
Street Pond Outflow March 2001
Program set to 5.98'
6.99'
6.00'
Program set to 6.11'
1.59" 0.72" 3.61"
Total rain- 6.47"
.01" .09" .14" .04"
4 5 6
5
5.5
6
6.5
7
7.5
8
FEET
(NG
VD)
0.00
0.20
0.40
0.60
0.80
1.00
RA
IN (i
n/15
min
)
1 2 3 4 5 6 7 8 9 10 11 12 13 14 15 16 17 18 19 20 21 22 23 24 25 26 27 28 29 30 31
DAYLevel Rain Top of weir Bleed down Gauge
Building Pond Outflow March 2001
totalrain-
6.47 "
5.83'
7.49'
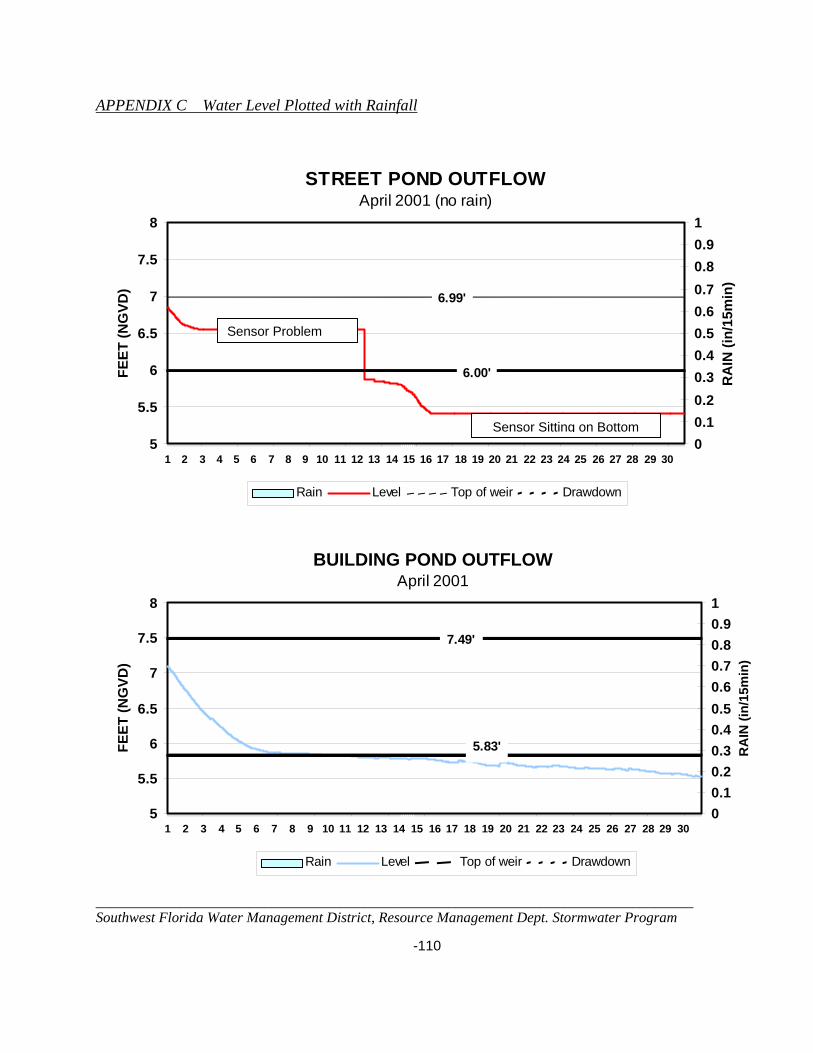
APPENDIX C Water Level Plotted with Rainfall
______________________________________________________________________________ Southwest Florida Water Management District, Resource Management Dept. Stormwater Program -110
STREET POND OUTFLOWApril 2001 (no rain)
5
5.5
6
6.5
7
7.5
8
1 2 3 4 5 6 7 8 9 10 11 12 13 14 15 16 17 18 19 20 21 22 23 24 25 26 27 28 29 30
FEET
(NG
VD)
00.10.20.30.40.50.60.70.80.91
RA
IN (i
n/15
min
)
Rain Level Top of weir Drawdown
6.99'
6.00'
BUILDING POND OUTFLOWApril 2001
5
5.5
6
6.5
7
7.5
8
1 2 3 4 5 6 7 8 9 10 11 12 13 14 15 16 17 18 19 20 21 22 23 24 25 26 27 28 29 30
FEET
(NG
VD)
00.10.20.30.40.50.60.70.80.91
RA
IN (i
n/15
min
)
Rain Level Top of weir Drawdown
7.49'
5.83'
Sensor Problem
Sensor Sitting on Bottom
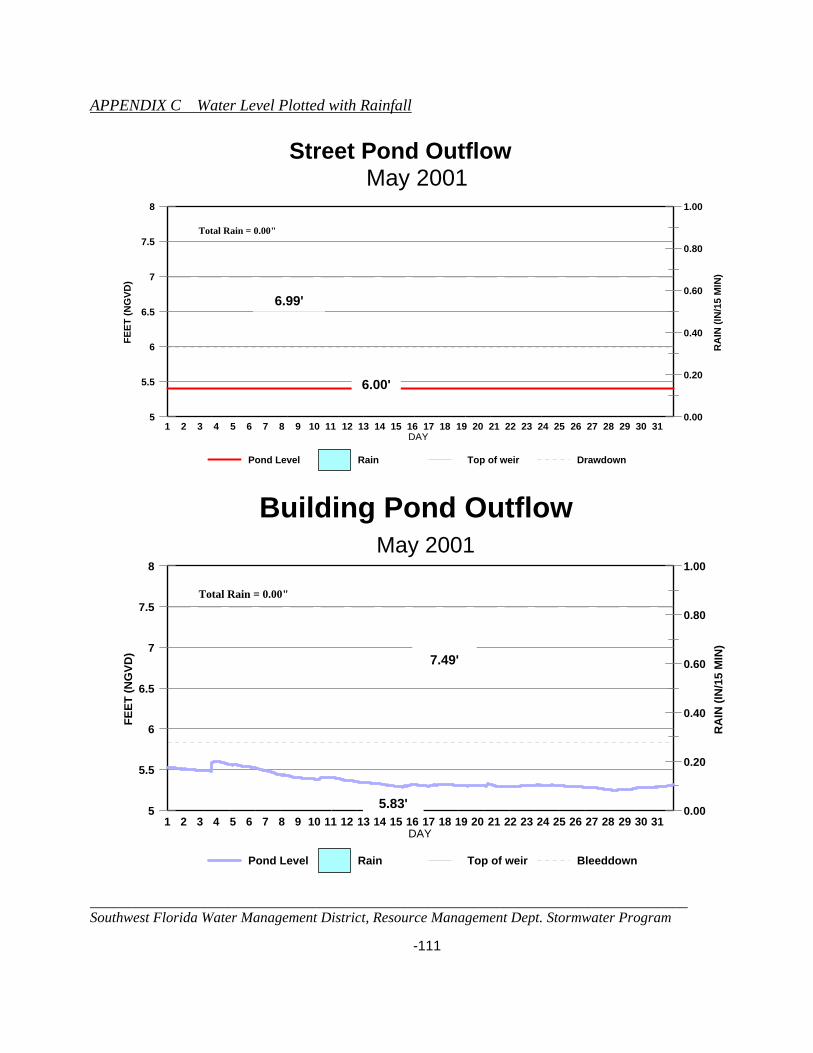
APPENDIX C Water Level Plotted with Rainfall
______________________________________________________________________________ Southwest Florida Water Management District, Resource Management Dept. Stormwater Program -111
5
5.5
6
6.5
7
7.5
8
FEET
(NG
VD)
0.00
0.20
0.40
0.60
0.80
1.00
RA
IN (I
N/1
5 M
IN)
1 2 3 4 5 6 7 8 9 10 11 12 13 14 15 16 17 18 19 20 21 22 23 24 25 26 27 28 29 30 31DAY
Pond Level Rain Top of weir Drawdown
Street Pond OutflowMay 2001
Total Rain = 0.00"
5
5.5
6
6.5
7
7.5
8
FEET
(NG
VD)
0.00
0.20
0.40
0.60
0.80
1.00
RA
IN (I
N/1
5 M
IN)
1 2 3 4 5 6 7 8 9 10 11 12 13 14 15 16 17 18 19 20 21 22 23 24 25 26 27 28 29 30 31DAY
Pond Level Rain Top of weir Bleeddown
Building Pond OutflowMay 2001
Total Rain = 0.00"
6.99'
6.00'
7.49'
5.83'
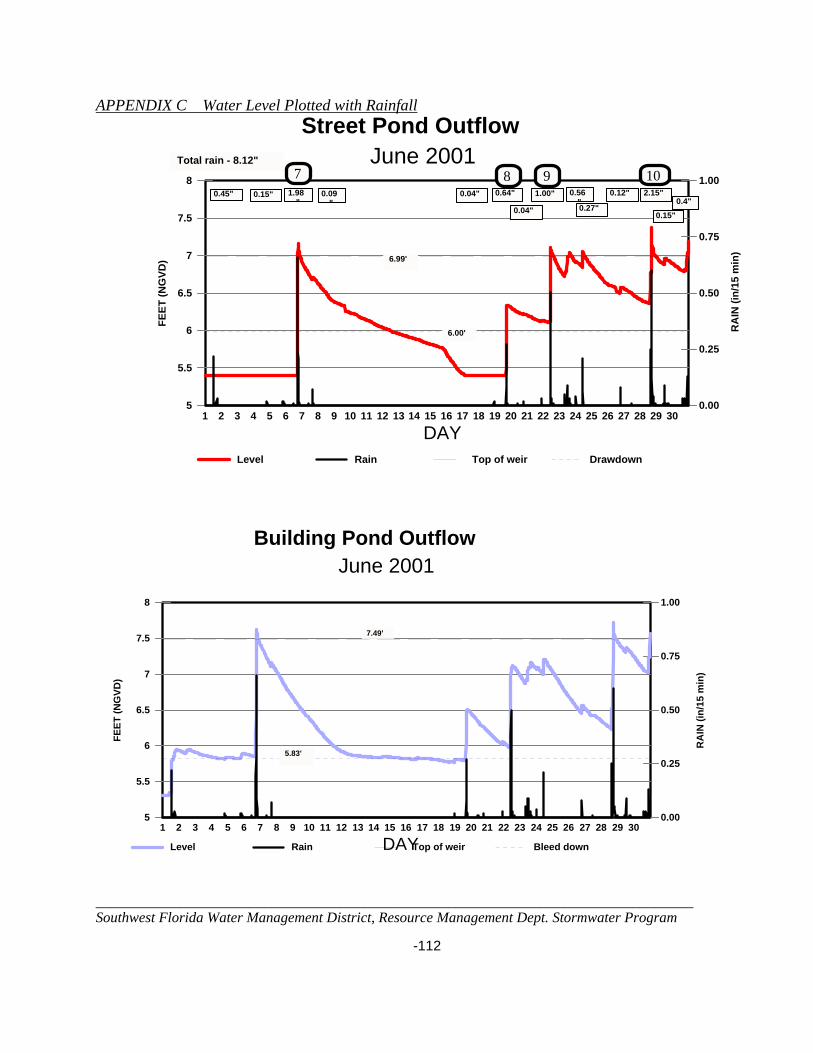
APPENDIX C Water Level Plotted with Rainfall
______________________________________________________________________________ Southwest Florida Water Management District, Resource Management Dept. Stormwater Program -112
5
5.5
6
6.5
7
7.5
8
FEET
(NG
VD)
0.00
0.25
0.50
0.75
1.00
RA
IN (i
n/15
min
)
1 2 3 4 5 6 7 8 9 10 11 12 13 14 15 16 17 18 19 20 21 22 23 24 25 26 27 28 29 30
DAYLevel Rain Top of weir Drawdown
Street Pond OutflowJune 2001
6.99'
6.00'
0.45" 0.15" 1.98"
0.64" 1.00" 0.56"
0.12" 2.15"
7 9 1080.04"
0.27"0.4"
Total rain - 8.12"
0.09"
0.04" 0.15"
5
5.5
6
6.5
7
7.5
8
FEET
(NG
VD)
0.00
0.25
0.50
0.75
1.00
RA
IN (i
n/15
min
)
1 2 3 4 5 6 7 8 9 10 11 12 13 14 15 16 17 18 19 20 21 22 23 24 25 26 27 28 29 30
DAYLevel Rain Top of weir Bleed down
Building Pond OutflowJune 2001
5.83'
7.49'

APPENDIX C Water Level Plotted with Rainfall
______________________________________________________________________________ Southwest Florida Water Management District, Resource Management Dept. Stormwater Program -113
5
5.5
6
6.5
7
7.5
8
FEET
(NG
VD)
0.00
0.20
0.40
0.60
0.80
1.00
RA
IN (i
n/15
min
)
1 2 3 4 5 6 7 8 9 10 11 12 13 14 15 16 17 18 19 20 21 22 23 24 25 26 27 28 29 30 31DAY
Level Rain Top of weir Drawdown
Street Pond OutflowJuly 2001
6.99'
6.00'
Total rain- 8.55"
0.82"
0.64" 0.98" 1.18" 0.48" 0.26"0.46" 0.07" 0.23"
0.33" 0.23"
11
0.83"
12 1413 15
0.13"
0.16"
0.46"0.07"
0.22" 0.41"
5
5.5
6
6.5
7
7.5
8
FEET
(NG
VD)
0.00
0.20
0.40
0.60
0.80
1.00
RA
IN (i
n/15
min
)
1 2 3 4 5 6 7 8 9 10 11 12 13 14 15 16 17 18 19 20 21 22 23 24 25 26 27 28 29 30 31DAY
Pond Level Rain Top of weir Bleed down
Building Pond OutflowJuly 2001
7.49'
5.83'
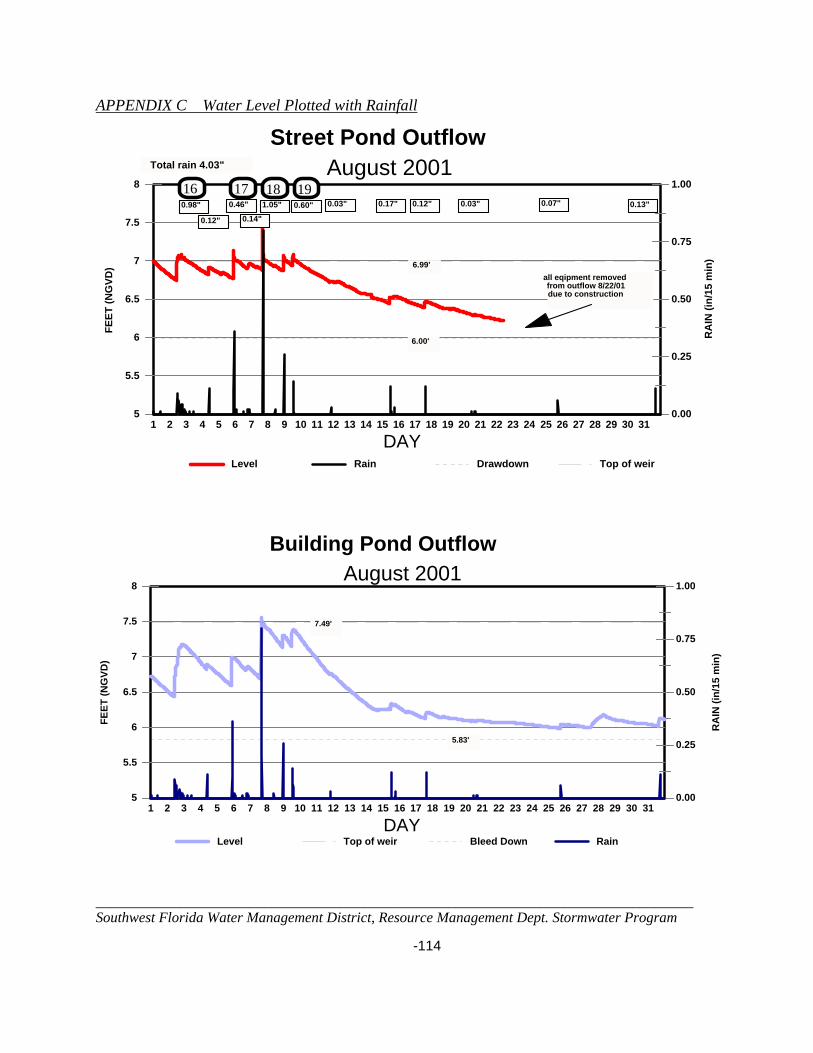
APPENDIX C Water Level Plotted with Rainfall
______________________________________________________________________________ Southwest Florida Water Management District, Resource Management Dept. Stormwater Program -114
5
5.5
6
6.5
7
7.5
8
FEET
(NG
VD)
0.00
0.25
0.50
0.75
1.00
RA
IN (i
n/15
min
)
1 2 3 4 5 6 7 8 9 10 11 12 13 14 15 16 17 18 19 20 21 22 23 24 25 26 27 28 29 30 31
DAYLevel Rain Drawdown Top of weir
Street Pond OutflowAugust 2001Total rain 4.03"
all eqipment removedfrom outflow 8/22/01due to construction
6.99'
6.00'
0.98" 0.46" 0.60"1.05"
16 17 18 19
0.12" 0.14"
0.03" 0.17" 0.12" 0.03" 0.07" 0.13"
5
5.5
6
6.5
7
7.5
8
FEET
(NG
VD)
0.00
0.25
0.50
0.75
1.00
RA
IN (i
n/15
min
)
1 2 3 4 5 6 7 8 9 10 11 12 13 14 15 16 17 18 19 20 21 22 23 24 25 26 27 28 29 30 31
DAYLevel Top of weir Bleed Down Rain
Building Pond OutflowAugust 2001
7.49'
5.83'

APPENDIX C Water Level Plotted with Rainfall
______________________________________________________________________________ Southwest Florida Water Management District, Resource Management Dept. Stormwater Program -115
APPENDIX C Water Level Plotted with Rainfall
______________________________________________________________________________ Southwest Florida Water Management District, Resource Management Dept. Stormwater Program -116
APPENDIX B
YEAR TWO

APPENDIX C Water Level Plotted with Rainfall
______________________________________________________________________________ Southwest Florida Water Management District, Resource Management Dept. Stormwater Program -117
ST R EET POND LEVELJU NE 2002
5
5.5
6
6.5
7
7.5
8
1 2 3 4 5 6 7 8 9 10 11 12 13 14 15 16 17 18 29 20 21 22 23 24 25 26 27 28 29 30
DAY
NG
VD (f
t)
0
0 .1
0.2
0.3
0.4
0.5
0.6
0.7
0.8
0.9
1
RA
IN (i
n/15
min
)7 .04'
6.00
Monitoring equipment re-installed after construction, but still some problems.
0.15" 0.17"0.84"
0.60"
0.83"
2.67"
0.30"
3.26"
1.64"
2.73"
1.21"
0.11"
BUILDING POND LEVELJUNE 2002
5
5.5
6
6.5
7
7.5
8
1 2 3 4 5 6 7 8 9 10 11 12 13 14 15 16 17 18 29 20 21 22 23 24 25 26 27 28 29 30
DAY
NG
VD (f
t)
0
0.1
0.2
0.3
0.4
0.5
0.6
0.7
0.8
0.9
1
RA
IN (i
n/15
min
)
7.49'
5.83'
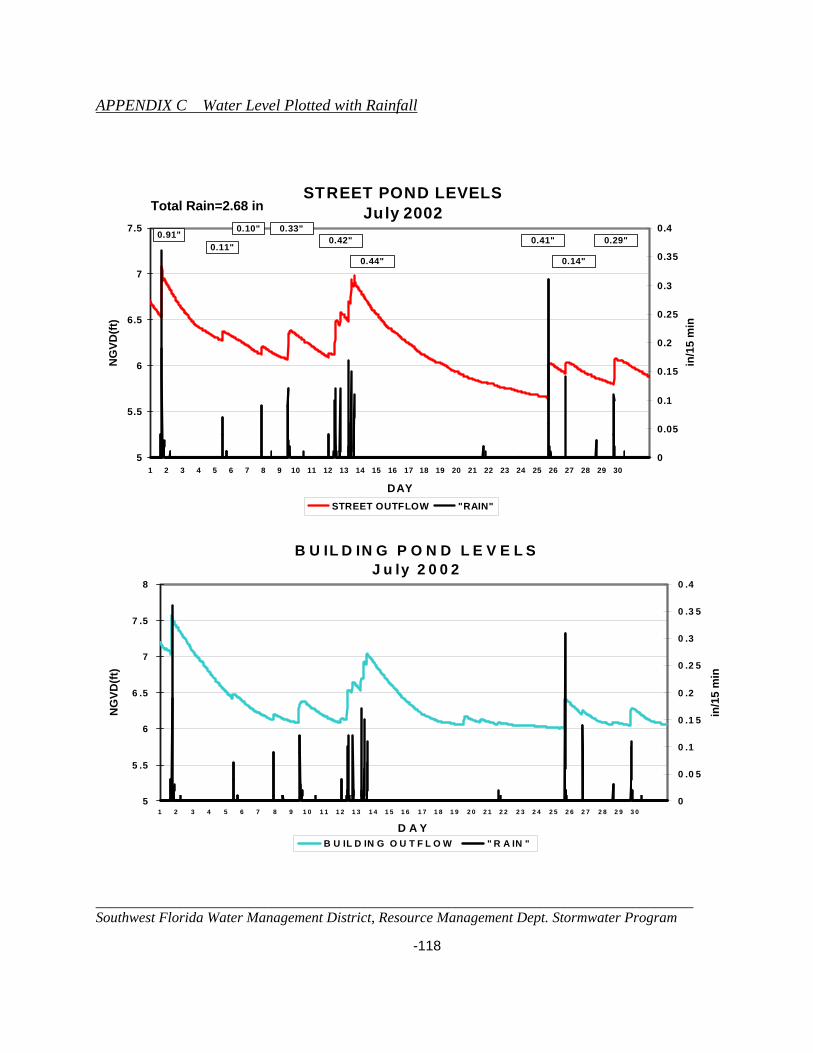
APPENDIX C Water Level Plotted with Rainfall
______________________________________________________________________________ Southwest Florida Water Management District, Resource Management Dept. Stormwater Program -118
STREET POND LEVELSJuly 2002
5
5.5
6
6.5
7
7.5
1 2 3 4 5 6 7 8 9 10 11 12 13 14 15 16 17 18 19 20 21 22 23 24 25 26 27 28 29 30
DAY
NG
VD(ft
)
0
0.05
0.1
0.15
0.2
0.25
0.3
0.35
0.4
in/1
5 m
in
STREET OUTFLOW "RAIN"
0.11"0.91" 0.33"
0.42"0.10"
0.44"
0.41"
0.14"
0.29"
B U IL D IN G P O N D L E V E L SJ u ly 2 0 0 2
5
5 .5
6
6 .5
7
7 .5
8
1 2 3 4 5 6 7 8 9 1 0 1 1 1 2 1 3 1 4 1 5 1 6 1 7 1 8 1 9 2 0 2 1 2 2 2 3 2 4 2 5 2 6 2 7 2 8 2 9 3 0
D A Y
NG
VD(ft
)
0
0 .0 5
0 .1
0 .1 5
0 .2
0 .2 5
0 .3
0 .3 5
0 .4
in/1
5 m
in
B U IL D IN G O U T F L O W " R A IN "
Total Rain=2.68 in
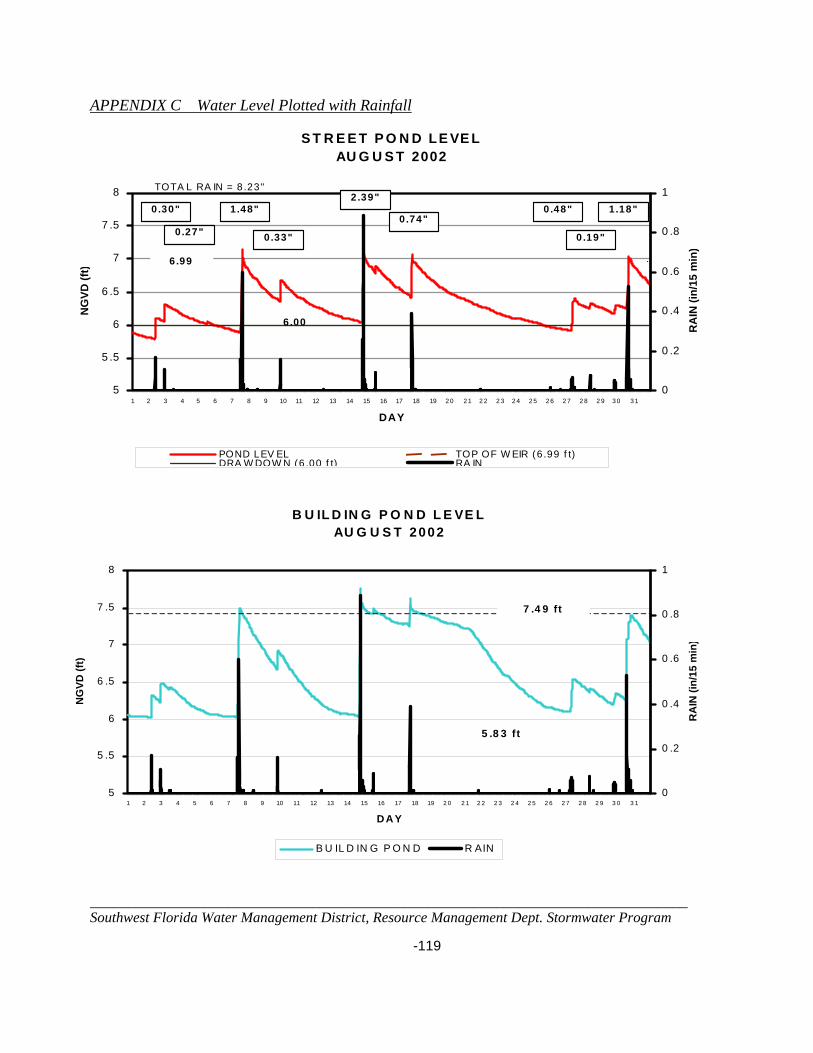
APPENDIX C Water Level Plotted with Rainfall
______________________________________________________________________________ Southwest Florida Water Management District, Resource Management Dept. Stormwater Program -119
S T R E E T P O N D LE VE LAU G U S T 2002
5
5 .5
6
6 .5
7
7 .5
8
1 2 3 4 5 6 7 8 9 10 11 12 13 14 15 16 17 18 19 2 0 2 1 2 2 2 3 2 4 2 5 2 6 2 7 2 8 2 9 3 0 3 1
DAY
NG
VD (f
t)
0
0 .2
0 .4
0 .6
0 .8
1
RA
IN (i
n/15
min
)
POND LEV EL TOP OF W EIR (6.99 f t)DRA W DOW N (6.00 f t) RA IN
TOTA L RA IN = 8 .23"
6.99
6.00
0.30"
0.27"
1.48"
0.33"
2.39"
0.74"0.48"
0.19"
1.18"
B U IL D IN G P O N D L E VE LAU G U S T 2002
5
5 .5
6
6 .5
7
7 .5
8
1 2 3 4 5 6 7 8 9 10 11 12 13 14 15 16 17 18 19 2 0 2 1 2 2 2 3 2 4 2 5 2 6 2 7 2 8 2 9 3 0 3 1
D A Y
NG
VD (f
t)
0
0 .2
0 .4
0 .6
0 .8
1
RA
IN (i
n/15
min
)
B U IL D IN G P O N D R AIN
7 .4 9 ft
5 .8 3 ft
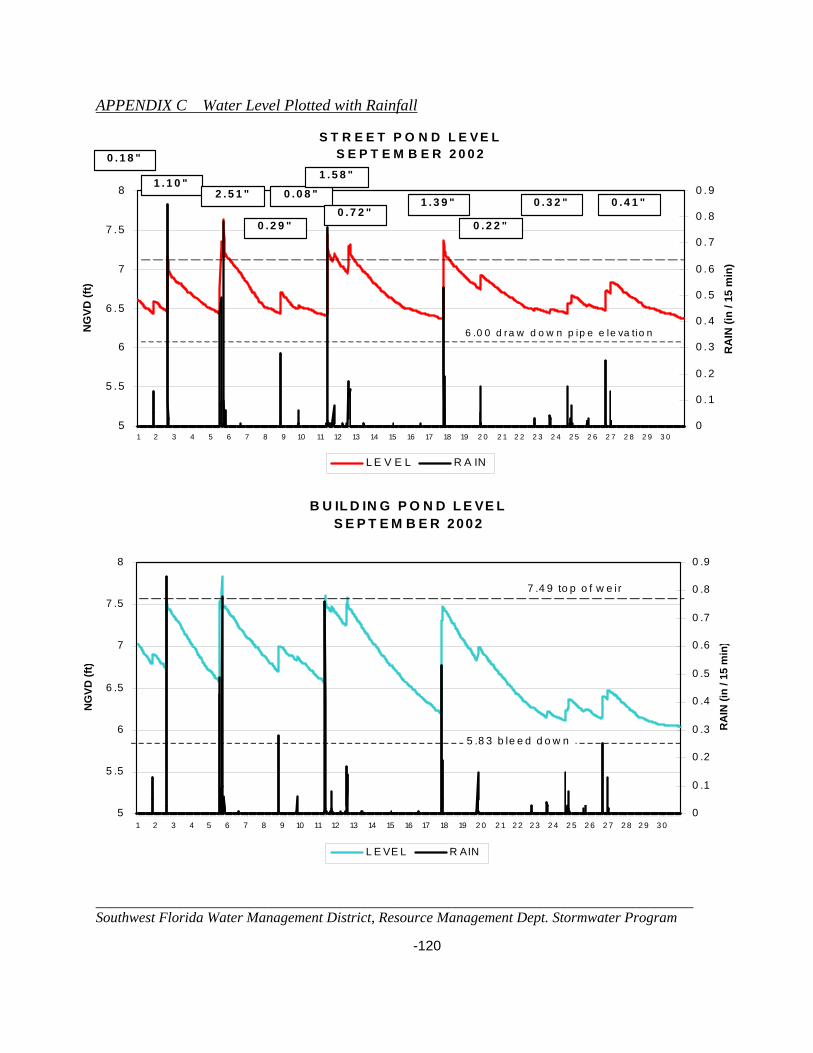
APPENDIX C Water Level Plotted with Rainfall
______________________________________________________________________________ Southwest Florida Water Management District, Resource Management Dept. Stormwater Program -120
S T R E E T P O N D L E V E LS E P T E M B E R 2 0 0 2
5
5 . 5
6
6 . 5
7
7 . 5
8
1 2 3 4 5 6 7 8 9 10 11 12 13 14 15 16 17 18 19 2 0 2 1 2 2 2 3 2 4 2 5 2 6 2 7 2 8 2 9 3 0
NG
VD (f
t)
0
0 . 1
0 . 2
0 . 3
0 . 4
0 . 5
0 . 6
0 . 7
0 . 8
0 . 9
RA
IN (i
n / 1
5 m
in)
L E V E L R A IN
6 .0 0 d ra w d o w n p ip e e le va tio n
0 . 1 8 "
1 . 1 0 "2 . 5 1 "
0 . 2 9 "
0 . 0 8 "
1 . 5 8 "
0 . 7 2 "1 . 3 9 "
0 . 2 2 "
0 . 3 2 " 0 . 4 1 "
B U IL D IN G P O N D L E VE LS E P T E M B E R 2002
5
5 .5
6
6 .5
7
7 .5
8
1 2 3 4 5 6 7 8 9 10 11 12 13 14 15 16 17 18 19 2 0 2 1 2 2 2 3 2 4 2 5 2 6 2 7 2 8 2 9 3 0
NG
VD (f
t)
0
0 .1
0 .2
0 .3
0 .4
0 .5
0 .6
0 .7
0 .8
0 .9
RA
IN (i
n / 1
5 m
in)
L E VE L R AIN
7 .4 9 to p o f w e i r
5 .8 3 b le e d d o w n
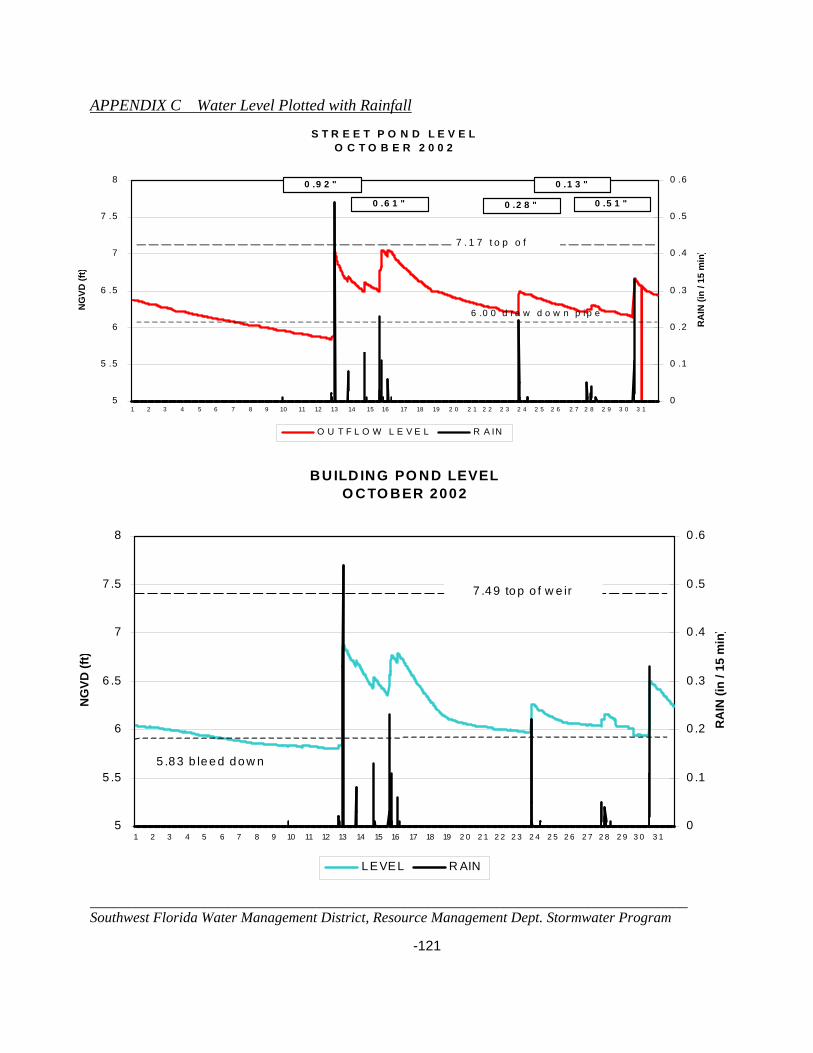
APPENDIX C Water Level Plotted with Rainfall
______________________________________________________________________________ Southwest Florida Water Management District, Resource Management Dept. Stormwater Program -121
S T R E E T P O N D L E V E LO C T O B E R 2 0 0 2
5
5 .5
6
6 .5
7
7 .5
8
1 2 3 4 5 6 7 8 9 10 11 12 13 14 15 16 17 18 19 2 0 2 1 2 2 2 3 2 4 2 5 2 6 2 7 2 8 2 9 3 0 3 1
NG
VD (f
t)
0
0 .1
0 .2
0 .3
0 .4
0 .5
0 .6
RA
IN (i
n / 1
5 m
in)
O U T F L O W L E V E L R A IN
6 .0 0 d r a w d o w n p i p e
7 . 1 7 t o p o f
0 .9 2 "
0 .6 1 " 0 .5 1 "
0 .1 3 "
0 .2 8 "
BUILD ING PO ND LEVELO C TO BER 2002
5
5 .5
6
6 .5
7
7 .5
8
1 2 3 4 5 6 7 8 9 10 11 12 13 14 15 16 17 18 19 2 0 2 1 2 2 2 3 2 4 2 5 2 6 2 7 2 8 2 9 3 0 3 1
NG
VD (f
t)
0
0 .1
0 .2
0 .3
0 .4
0 .5
0 .6
RA
IN (i
n / 1
5 m
in)
L EVEL R AIN
5 .8 3 b le e d d o w n
7 .4 9 to p o f w e ir
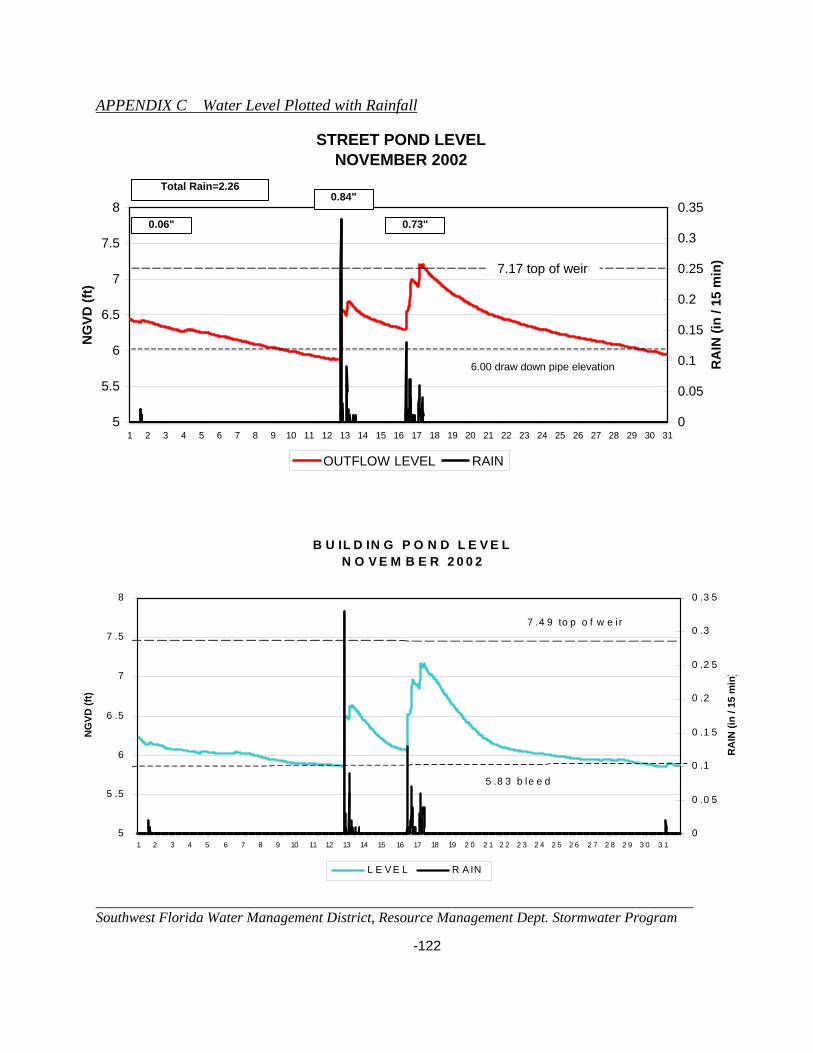
APPENDIX C Water Level Plotted with Rainfall
______________________________________________________________________________ Southwest Florida Water Management District, Resource Management Dept. Stormwater Program -122
STREET POND LEVELNOVEMBER 2002
5
5.5
6
6.5
7
7.5
8
1 2 3 4 5 6 7 8 9 10 11 12 13 14 15 16 17 18 19 20 21 22 23 24 25 26 27 28 29 30 31
NG
VD (f
t)
0
0.05
0.1
0.15
0.2
0.25
0.3
0.35
RA
IN (i
n / 1
5 m
in)
OUTFLOW LEVEL RAIN
6.00 draw down pipe elevation
7.17 top of weir
0.06"
0.84"
0.73"
Total Rain=2.26
B U IL D IN G P O N D L E V E LN O V E M B E R 2 0 0 2
5
5 .5
6
6 .5
7
7 .5
8
1 2 3 4 5 6 7 8 9 10 11 12 13 14 15 16 17 18 19 2 0 2 1 2 2 2 3 2 4 2 5 2 6 2 7 2 8 2 9 3 0 3 1
NG
VD (f
t)
0
0 .0 5
0 .1
0 .1 5
0 .2
0 .2 5
0 .3
0 .3 5
RA
IN (i
n / 1
5 m
in)
L E V E L R A IN
7 .4 9 to p o f w e i r
5 .8 3 b le e d
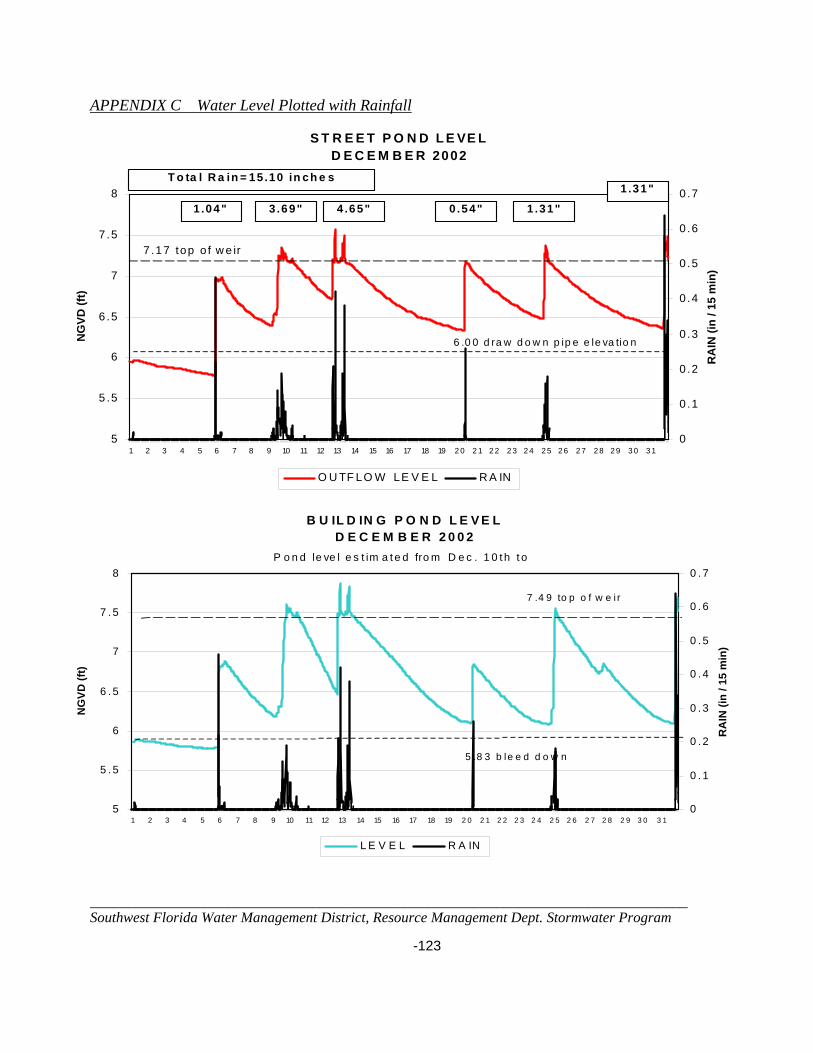
APPENDIX C Water Level Plotted with Rainfall
______________________________________________________________________________ Southwest Florida Water Management District, Resource Management Dept. Stormwater Program -123
S T R E E T P O N D L E VE LD E C E M B E R 2002
5
5 .5
6
6 .5
7
7 .5
8
1 2 3 4 5 6 7 8 9 10 11 12 13 14 15 16 17 18 19 2 0 2 1 2 2 2 3 2 4 2 5 2 6 2 7 2 8 2 9 3 0 3 1
NG
VD (f
t)
0
0 .1
0 .2
0 .3
0 .4
0 .5
0 .6
0 .7
RA
IN (i
n / 1
5 m
in)
O U TF LO W LE V E L R A IN
6 .0 0 d ra w d o w n p ip e e le va tio n
7 .17 top o f w e ir
1 .04" 3 .69" 4 .65" 0 .54" 1 .31"
1 .31"T o ta l R a in = 15 .10 in ch e s
B U IL D IN G P O N D L E V E LD E C E M B E R 2 0 0 2
5
5 . 5
6
6 . 5
7
7 . 5
8
1 2 3 4 5 6 7 8 9 10 11 12 13 14 15 16 17 18 19 2 0 2 1 2 2 2 3 2 4 2 5 2 6 2 7 2 8 2 9 3 0 3 1
NG
VD (f
t)
0
0 . 1
0 . 2
0 . 3
0 . 4
0 . 5
0 . 6
0 . 7
RA
IN (i
n / 1
5 m
in)
L E V E L R A IN
7 .4 9 to p o f w e i r
5 .8 3 b le e d d o w n
P o n d le ve l e s t im a t e d fro m D e c . 1 0 t h t o
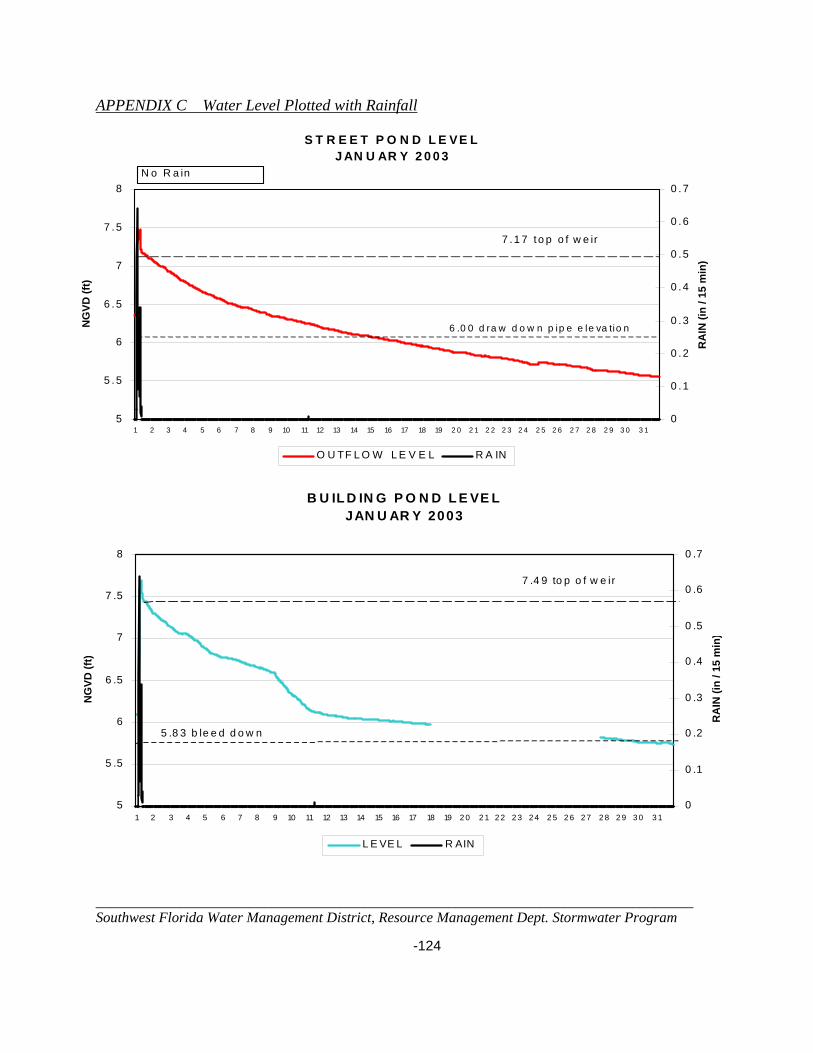
APPENDIX C Water Level Plotted with Rainfall
______________________________________________________________________________ Southwest Florida Water Management District, Resource Management Dept. Stormwater Program -124
S T R E E T P O N D L E VE LJ AN U AR Y 2 0 0 3
5
5 .5
6
6 .5
7
7 .5
8
1 2 3 4 5 6 7 8 9 10 11 12 13 14 15 16 17 18 19 2 0 2 1 2 2 2 3 2 4 2 5 2 6 2 7 2 8 2 9 3 0 3 1
NG
VD (f
t)
0
0 .1
0 .2
0 .3
0 .4
0 .5
0 .6
0 .7
RA
IN (i
n / 1
5 m
in)
O U TF L O W L E V E L R A IN
6 .0 0 d ra w d o w n p ip e e le va tio n
7 .1 7 t o p o f w e ir
N o R a in
B U IL D IN G P O N D L E VE LJAN U AR Y 2003
5
5 .5
6
6 .5
7
7 .5
8
1 2 3 4 5 6 7 8 9 10 11 12 13 14 15 16 17 18 19 2 0 2 1 2 2 2 3 2 4 2 5 2 6 2 7 2 8 2 9 3 0 3 1
NG
VD (f
t)
0
0 .1
0 .2
0 .3
0 .4
0 .5
0 .6
0 .7
RA
IN (i
n / 1
5 m
in)
L E VE L R AIN
7 .4 9 to p o f w e ir
5 .8 3 b le e d d o w n
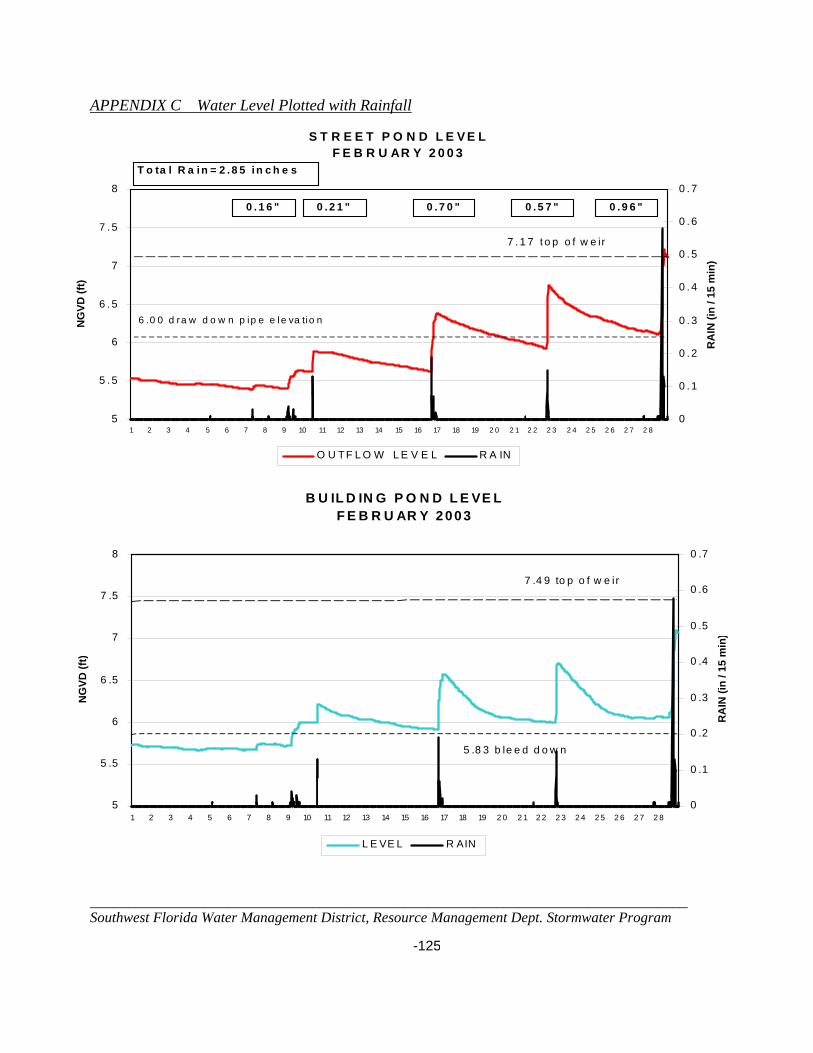
APPENDIX C Water Level Plotted with Rainfall
______________________________________________________________________________ Southwest Florida Water Management District, Resource Management Dept. Stormwater Program -125
S T R E E T P O N D L E V E LF E B R U AR Y 2 0 0 3
5
5 . 5
6
6 . 5
7
7 . 5
8
1 2 3 4 5 6 7 8 9 10 11 12 13 14 15 16 17 18 19 2 0 2 1 2 2 2 3 2 4 2 5 2 6 2 7 2 8
NG
VD (f
t)
0
0 . 1
0 . 2
0 . 3
0 . 4
0 . 5
0 . 6
0 . 7
RA
IN (i
n / 1
5 m
in)
O U TF L O W L E V E L R A IN
6 .0 0 d ra w d o w n p ip e e le va tio n
7 . 1 7 t o p o f w e ir
0 . 1 6 " 0 . 2 1 " 0 . 7 0 " 0 . 5 7 " 0 . 9 6 "
T o ta l R a i n = 2 . 8 5 i n c h e s
B U IL D IN G P O N D L E VE LF E B R U AR Y 2 00 3
5
5 .5
6
6 .5
7
7 .5
8
1 2 3 4 5 6 7 8 9 10 11 12 13 14 15 16 17 18 19 2 0 2 1 2 2 2 3 2 4 2 5 2 6 2 7 2 8
NG
VD (f
t)
0
0 .1
0 .2
0 .3
0 .4
0 .5
0 .6
0 .7
RA
IN (i
n / 1
5 m
in)
L E VE L R AIN
7 .4 9 to p o f w e i r
5 .8 3 b le e d d o w n
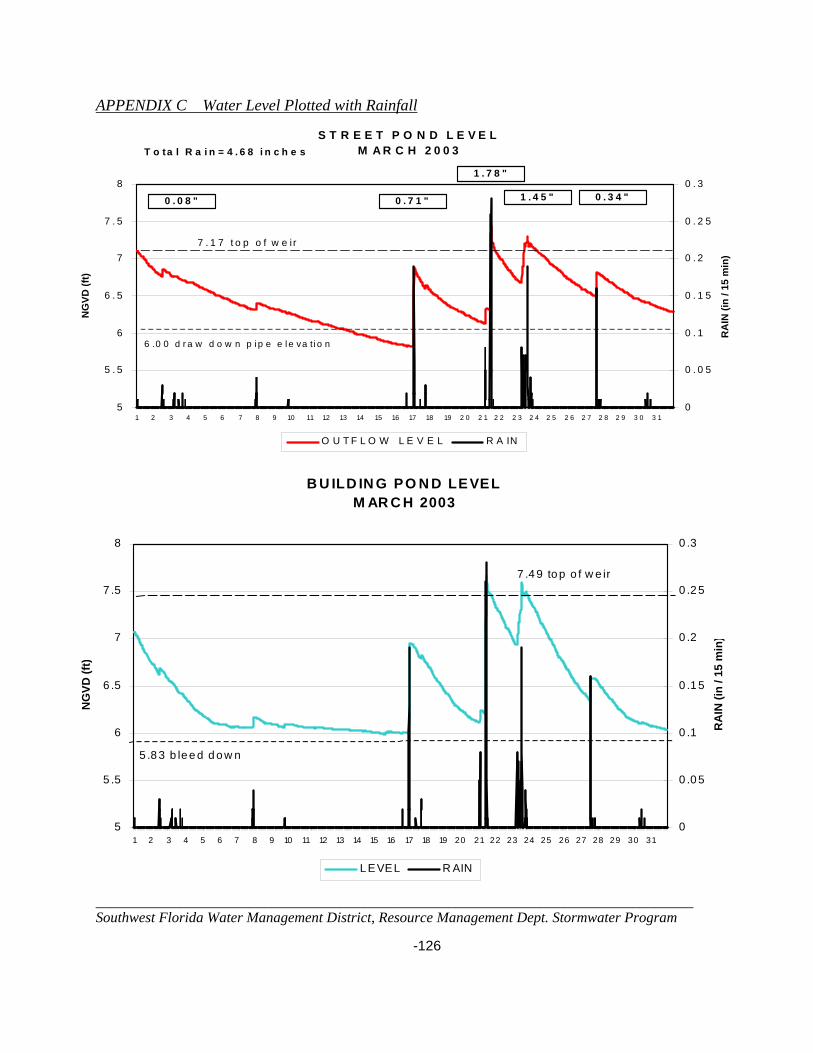
APPENDIX C Water Level Plotted with Rainfall
______________________________________________________________________________ Southwest Florida Water Management District, Resource Management Dept. Stormwater Program -126
S T R E E T P O N D L E V E LM A R C H 2 0 0 3
5
5 . 5
6
6 . 5
7
7 . 5
8
1 2 3 4 5 6 7 8 9 10 11 12 13 14 15 16 17 18 19 2 0 2 1 2 2 2 3 2 4 2 5 2 6 2 7 2 8 2 9 3 0 3 1
NG
VD (f
t)
0
0 . 0 5
0 . 1
0 . 1 5
0 . 2
0 . 2 5
0 . 3
RA
IN (i
n / 1
5 m
in)
O U T F L O W L E V E L R A IN
6 .0 0 d r a w d o w n p i p e e l e va t i o n
7 . 1 7 t o p o f w e i r
0 . 0 8 " 0 . 7 1 "
1 . 7 8 "
1 . 4 5 " 0 . 3 4 "
T o ta l R a i n = 4 . 6 8 i n c h e s
B U ILD IN G PO N D LEVELM AR C H 2003
5
5 .5
6
6 .5
7
7 .5
8
1 2 3 4 5 6 7 8 9 10 11 12 13 14 15 16 17 18 19 20 21 22 23 24 25 26 27 28 29 30 31
NG
VD (f
t)
0
0 .0 5
0 .1
0 .1 5
0 .2
0 .2 5
0 .3
RA
IN (i
n / 1
5 m
in)
L EVEL R AIN
7 .4 9 to p o f w e ir
5 .8 3 b le e d d o w n

APPENDIX C Water Level Plotted with Rainfall
______________________________________________________________________________ Southwest Florida Water Management District, Resource Management Dept. Stormwater Program -127
S T R E E T P O N D L E V E LA P R IL 2 0 0 3
5
5 . 5
6
6 . 5
7
7 . 5
8
1 2 3 4 5 6 7 8 9 10 11 12 13 14 15 16 17 18 19 2 0 2 1 2 2 2 3 2 4 2 5 2 6 2 7 2 8 2 9 3 0
NG
VD (f
t)
0
0 . 1
0 . 2
0 . 3
0 . 4
0 . 5
0 . 6
0 . 7
0 . 8
RA
IN (i
n / 1
5 m
in)
O U T F L O W L E V E L R A IN
6 .0 0 d r a w d o w n p i p e e l e va t i o n
7 . 1 7 t o p o f w e i r
0 . 0 7 "
0 . 2 5 "
0 . 3 7 "
3 . 4 0 "T o ta l R a i n = 4 . 1 0
B U IL D IN G P O N D L E V E LAP R IL 2 0 0 3
5
5 .5
6
6 .5
7
7 .5
8
NG
VD (f
t)
0
0 .1
0 .2
0 .3
0 .4
0 .5
0 .6
0 .7
0 .8
RA
IN (i
n / 1
5 m
in)
L E V E L R A IN
7 .4 9 to p o f w e i r
5 .8 3 b le e d d o w n
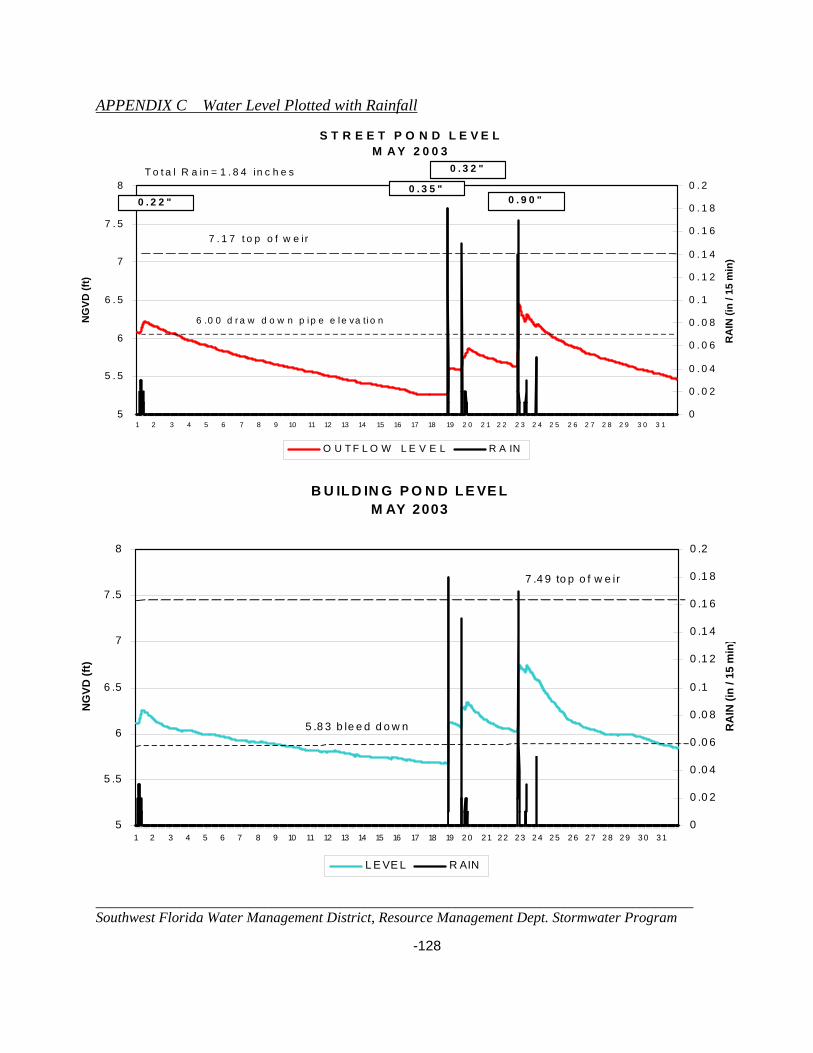
APPENDIX C Water Level Plotted with Rainfall
______________________________________________________________________________ Southwest Florida Water Management District, Resource Management Dept. Stormwater Program -128
S T R E E T P O N D L E V E LM A Y 2 0 0 3
5
5 . 5
6
6 . 5
7
7 . 5
8
1 2 3 4 5 6 7 8 9 10 11 12 13 14 15 16 17 18 19 2 0 2 1 2 2 2 3 2 4 2 5 2 6 2 7 2 8 2 9 3 0 3 1
NG
VD (f
t)
0
0 . 0 2
0 . 0 4
0 . 0 6
0 . 0 8
0 . 1
0 . 1 2
0 . 1 4
0 . 1 6
0 . 1 8
0 . 2
RA
IN (i
n / 1
5 m
in)
O U T F L O W L E V E L R A IN
6 .0 0 d r a w d o w n p i p e e l e va ti o n
7 . 1 7 t o p o f w e i r
0 . 2 2 "0 . 3 5 "
0 . 3 2 "
0 . 9 0 "
T o t a l R a in = 1 . 8 4 in c h e s
B U IL D IN G P O N D L E VE LM AY 2003
5
5 .5
6
6 .5
7
7 .5
8
1 2 3 4 5 6 7 8 9 10 11 12 13 14 15 16 17 18 19 2 0 2 1 2 2 2 3 2 4 2 5 2 6 2 7 2 8 2 9 3 0 3 1
NG
VD (f
t)
0
0 .0 2
0 .0 4
0 .0 6
0 .0 8
0 .1
0 .1 2
0 .1 4
0 .1 6
0 .1 8
0 .2
RA
IN (i
n / 1
5 m
in)
L E VE L R AIN
7 .4 9 to p o f w e ir
5 .8 3 b le e d d o w n
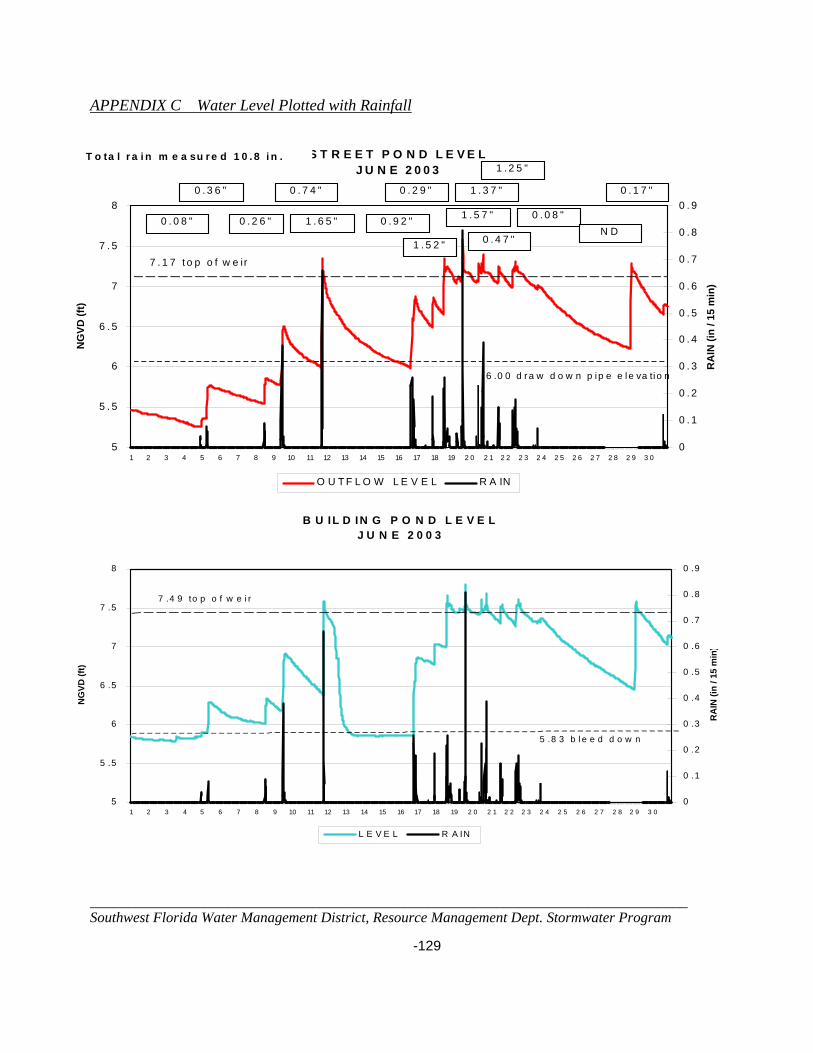
APPENDIX C Water Level Plotted with Rainfall
______________________________________________________________________________ Southwest Florida Water Management District, Resource Management Dept. Stormwater Program -129
S T R E E T P O N D L E V E LJ U N E 2 0 0 3
5
5 . 5
6
6 . 5
7
7 . 5
8
1 2 3 4 5 6 7 8 9 10 11 12 13 14 15 16 17 18 19 2 0 2 1 2 2 2 3 2 4 2 5 2 6 2 7 2 8 2 9 3 0
NG
VD (f
t)
0
0 . 1
0 . 2
0 . 3
0 . 4
0 . 5
0 . 6
0 . 7
0 . 8
0 . 9
RA
IN (i
n / 1
5 m
in)
O U T F L O W L E V E L R A IN
6 .0 0 d ra w d o w n p ip e e l e va ti o n
7 . 1 7 t o p o f w e ir
0 . 0 8 "
0 . 3 6 "
0 . 2 6 "
0 . 7 4 "
1 . 6 5 " 0 . 9 2 "
0 . 2 9 "
1 . 5 2 "
1 . 5 7 "
1 . 3 7 "
0 . 4 7 "
1 . 2 5 "
0 . 0 8 "N D
0 . 1 7 "
T o ta l r a i n m e a su r e d 1 0 . 8 i n .
B U IL D IN G P O N D L E V E L
J U N E 2 0 0 3
5
5 .5
6
6 .5
7
7 .5
8
1 2 3 4 5 6 7 8 9 10 11 12 13 14 15 16 17 18 19 2 0 2 1 2 2 2 3 2 4 2 5 2 6 2 7 2 8 2 9 3 0
NG
VD (f
t)
0
0 .1
0 .2
0 .3
0 .4
0 .5
0 .6
0 .7
0 .8
0 .9
RA
IN (i
n / 1
5 m
in)
L E V E L R A IN
7 .4 9 to p o f w e i r
5 .8 3 b l e e d d o w n
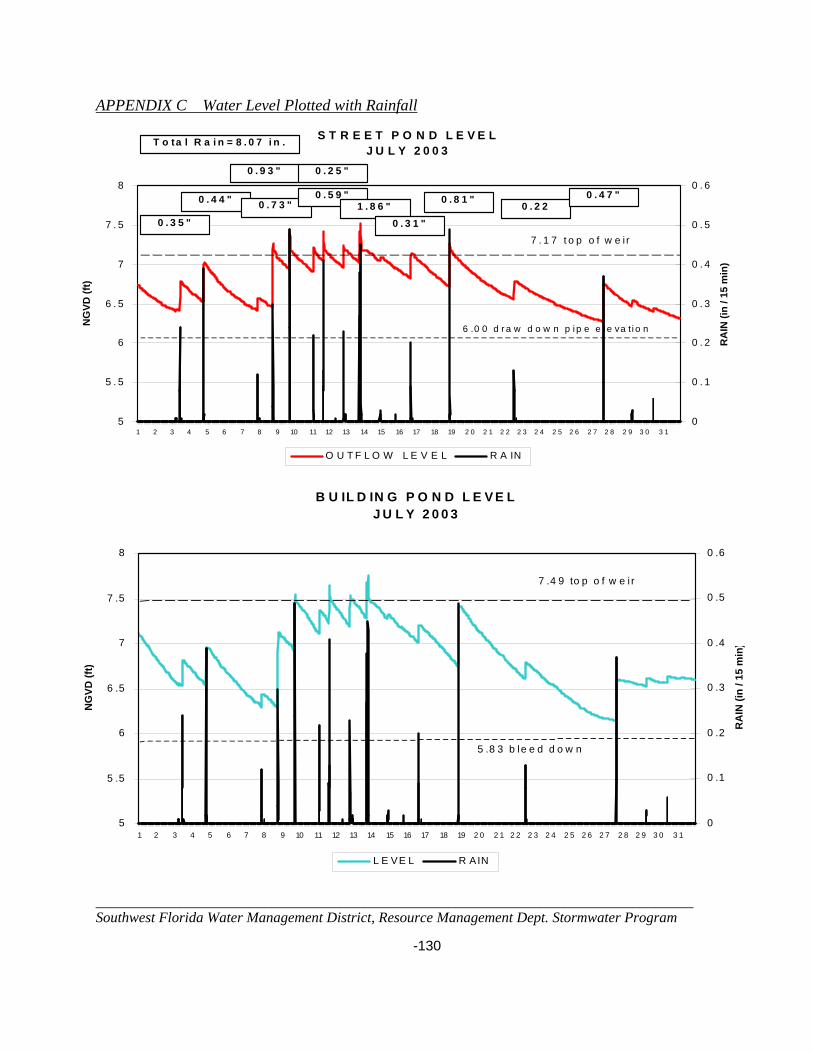
APPENDIX C Water Level Plotted with Rainfall
______________________________________________________________________________ Southwest Florida Water Management District, Resource Management Dept. Stormwater Program -130
S T R E E T P O N D L E V E LJ U L Y 2 0 0 3
5
5 . 5
6
6 . 5
7
7 . 5
8
1 2 3 4 5 6 7 8 9 10 11 12 13 14 15 16 17 18 19 2 0 2 1 2 2 2 3 2 4 2 5 2 6 2 7 2 8 2 9 3 0 3 1
NG
VD (f
t)
0
0 . 1
0 . 2
0 . 3
0 . 4
0 . 5
0 . 6
RA
IN (i
n / 1
5 m
in)
O U T F L O W L E V E L R A IN
6 .0 0 d r a w d o w n p i p e e l e va ti o n
7 . 1 7 t o p o f w e i r
0 . 4 4 "
0 . 3 5 "
0 . 9 3 "
0 . 7 3 "
0 . 2 5 "
0 . 5 9 "1 . 8 6 "
0 . 3 1 "
0 . 8 1 " 0 . 2 20 . 4 7 "
T o ta l R a i n = 8 . 0 7 i n .
B U IL D IN G P O N D L E V E LJ U L Y 2 0 0 3
5
5 .5
6
6 .5
7
7 .5
8
1 2 3 4 5 6 7 8 9 10 11 12 13 14 15 16 17 18 19 2 0 2 1 2 2 2 3 2 4 2 5 2 6 2 7 2 8 2 9 3 0 3 1
NG
VD (f
t)
0
0 .1
0 .2
0 .3
0 .4
0 .5
0 .6
RA
IN (i
n / 1
5 m
in)
L E VE L R AIN
7 .4 9 to p o f w e i r
5 .8 3 b le e d d o w n
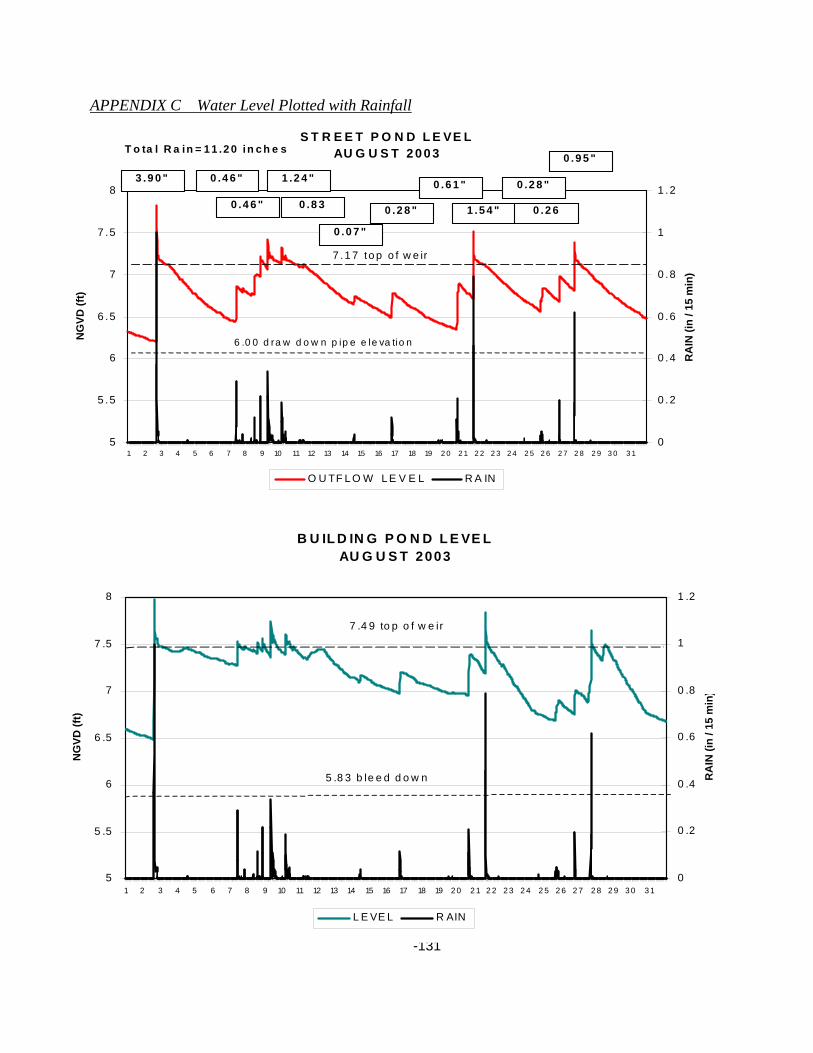
APPENDIX C Water Level Plotted with Rainfall
______________________________________________________________________________ Southwest Florida Water Management District, Resource Management Dept. Stormwater Program -131
S T R E E T P O N D L E VE LAU G U S T 2 0 0 3
5
5 .5
6
6 .5
7
7 .5
8
1 2 3 4 5 6 7 8 9 10 11 12 13 14 15 16 17 18 19 2 0 2 1 2 2 2 3 2 4 2 5 2 6 2 7 2 8 2 9 3 0 3 1
NG
VD (f
t)
0
0 .2
0 .4
0 .6
0 .8
1
1 .2
RA
IN (i
n / 1
5 m
in)
O U TF L O W L E V E L R A IN
6 .0 0 d ra w d o w n p ip e e le va tio n
7 .1 7 to p o f w e ir
T o ta l R a in = 1 1 .2 0 in c h e s
3 .9 0 " 0 .4 6 "
0 .4 6 "
1 .2 4 "
0 .8 3
0 .0 7 "
0 .2 8 "
0 .6 1 "
1 .5 4 "
0 .2 8 "
0 .2 6
0 .9 5 "
B U IL D IN G P O N D L E VE LAU G U S T 2003
5
5 .5
6
6 .5
7
7 .5
8
1 2 3 4 5 6 7 8 9 10 11 12 13 14 15 16 17 18 19 2 0 2 1 2 2 2 3 2 4 2 5 2 6 2 7 2 8 2 9 3 0 3 1
NG
VD (f
t)
0
0 .2
0 .4
0 .6
0 .8
1
1 .2
RA
IN (i
n / 1
5 m
in)
L E VE L R AIN
7 .4 9 to p o f w e ir
5 .8 3 b le e d d o w n
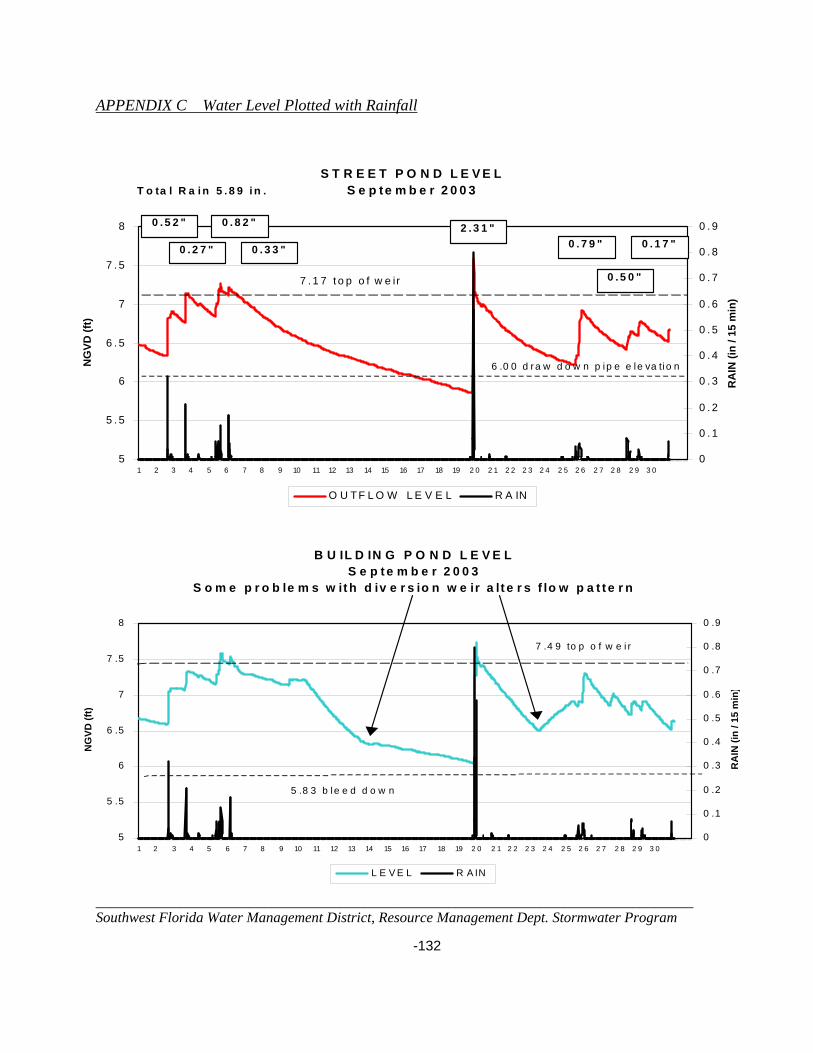
APPENDIX C Water Level Plotted with Rainfall
______________________________________________________________________________ Southwest Florida Water Management District, Resource Management Dept. Stormwater Program -132
S T R E E T P O N D L E V E LS e p te m b e r 2 0 0 3
5
5 . 5
6
6 . 5
7
7 . 5
8
1 2 3 4 5 6 7 8 9 10 11 12 13 14 15 16 17 18 19 2 0 2 1 2 2 2 3 2 4 2 5 2 6 2 7 2 8 2 9 3 0
NG
VD (f
t)
0
0 . 1
0 . 2
0 . 3
0 . 4
0 . 5
0 . 6
0 . 7
0 . 8
0 . 9
RA
IN (i
n / 1
5 m
in)
O U TF L O W L E V E L R A IN
6 .0 0 d ra w d o w n p ip e e le va ti o n
7 . 1 7 t o p o f w e ir
0 . 5 2 "
0 . 2 7 "
0 . 8 2 "
0 . 3 3 "
2 . 3 1 "0 . 7 9 "
0 . 5 0 "
0 . 1 7 "
T o ta l R a i n 5 . 8 9 i n .
B U IL D IN G P O N D L E V E LS e p t e m b e r 2 0 0 3
S o m e p r o b le m s w it h d iv e r s io n w e ir a lt e r s f lo w p a t t e r n
5
5 .5
6
6 .5
7
7 .5
8
1 2 3 4 5 6 7 8 9 10 11 12 13 14 15 16 17 18 19 2 0 2 1 2 2 2 3 2 4 2 5 2 6 2 7 2 8 2 9 3 0
NG
VD (f
t)
0
0 .1
0 .2
0 .3
0 .4
0 .5
0 .6
0 .7
0 .8
0 .9
RA
IN (i
n / 1
5 m
in)
L E V E L R A IN
7 .4 9 to p o f w e i r
5 .8 3 b le e d d o w n
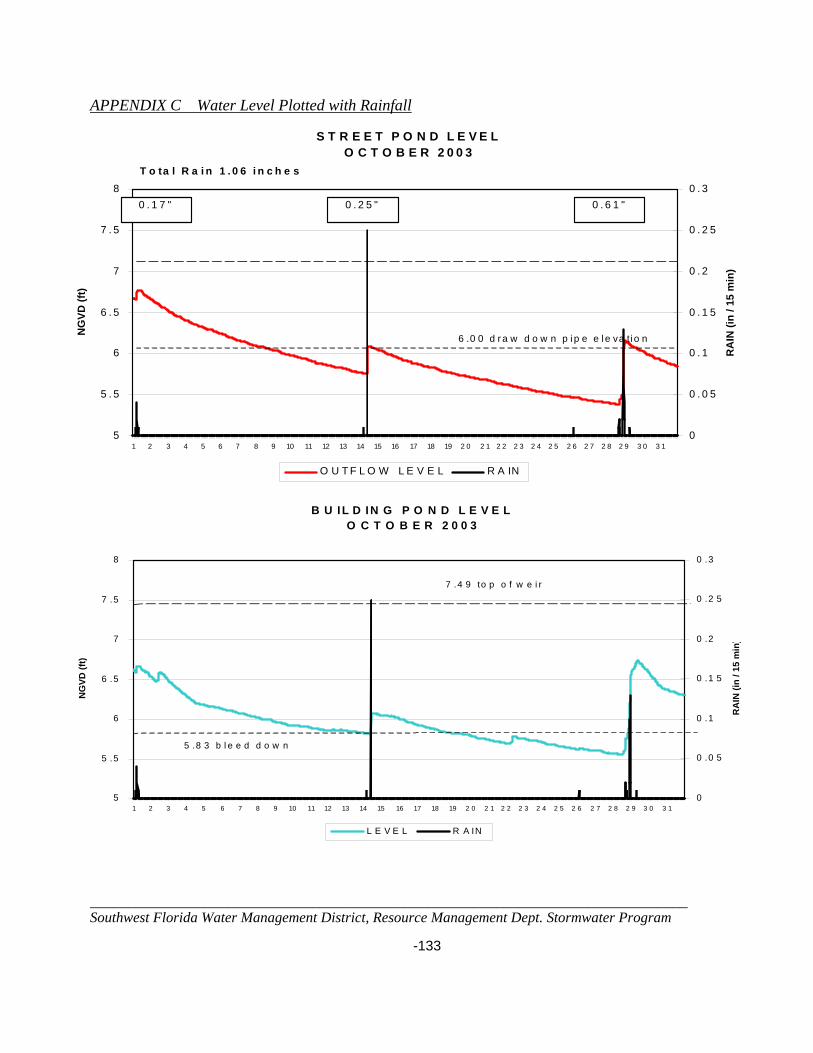
APPENDIX C Water Level Plotted with Rainfall
______________________________________________________________________________ Southwest Florida Water Management District, Resource Management Dept. Stormwater Program -133
S T R E E T P O N D L E V E LO C T O B E R 2 0 0 3
5
5 . 5
6
6 . 5
7
7 . 5
8
1 2 3 4 5 6 7 8 9 10 11 12 13 14 15 16 17 18 19 2 0 2 1 2 2 2 3 2 4 2 5 2 6 2 7 2 8 2 9 3 0 3 1
NG
VD (f
t)
0
0 . 0 5
0 . 1
0 . 1 5
0 . 2
0 . 2 5
0 . 3
RA
IN (i
n / 1
5 m
in)
O U T F L O W L E V E L R A IN
6 .0 0 d r a w d o w n p i p e e le va ti o n
0 . 1 7 " 0 . 2 5 " 0 . 6 1 "
T o ta l R a i n 1 . 0 6 i n c h e s
B U IL D IN G P O N D L E V E L
O C T O B E R 2 0 0 3
5
5 .5
6
6 .5
7
7 .5
8
1 2 3 4 5 6 7 8 9 10 11 12 13 14 15 16 17 18 19 2 0 2 1 2 2 2 3 2 4 2 5 2 6 2 7 2 8 2 9 3 0 3 1
NG
VD (f
t)
0
0 .0 5
0 .1
0 .1 5
0 .2
0 .2 5
0 .3
RA
IN (i
n / 1
5 m
in)
L E V E L R A IN
7 .4 9 to p o f w e i r
5 .8 3 b l e e d d o w n

APPENDIX D Storm Event Water Quality - Intensive Study
______________________________________________________________________________ Southwest Florida Water Management District, Resource Management Dept. Stormwater Program -134
APPENDIX D
Storm Event Water Quality Intensive Study
Original data in EXCEL file: WQ_BLDG_ST-FINAL
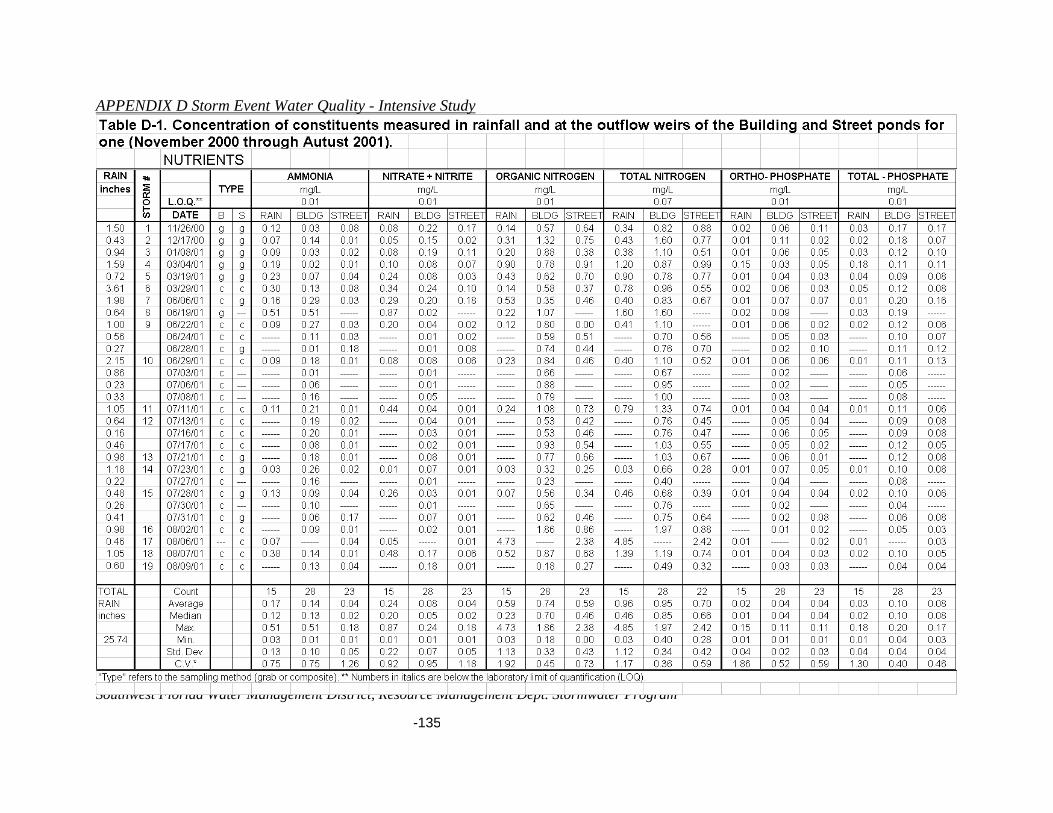
APPENDIX D Storm Event Water Quality - Intensive Study
______________________________________________________________________________ Southwest Florida Water Management District, Resource Management Dept. Stormwater Program
-135
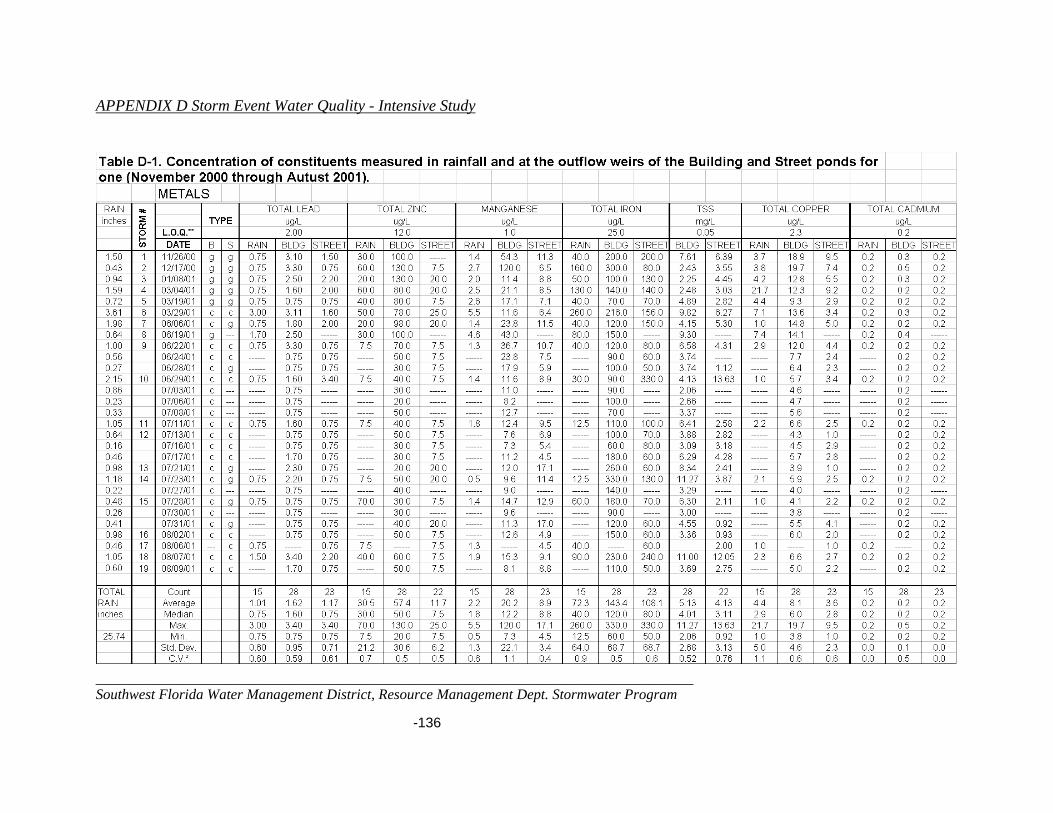
APPENDIX D Storm Event Water Quality - Intensive Study
______________________________________________________________________________ Southwest Florida Water Management District, Resource Management Dept. Stormwater Program
-136

APPENDIX D Storm Event Water Quality - Intensive Study
______________________________________________________________________________ Southwest Florida Water Management District, Resource Management Dept. Stormwater Program
-137

APPENDIX D Storm Event Water Quality - Intensive Study
______________________________________________________________________________ Southwest Florida Water Management District, Resource Management Dept. Stormwater Program
-138
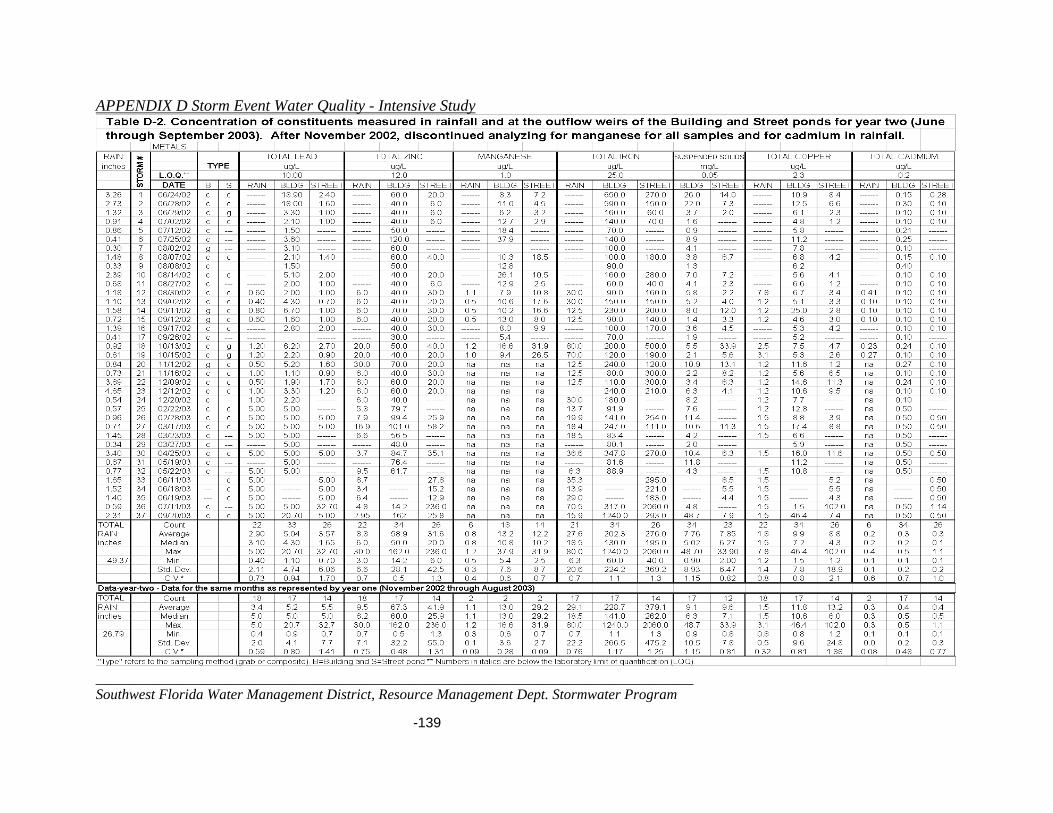
APPENDIX D Storm Event Water Quality - Intensive Study
______________________________________________________________________________ Southwest Florida Water Management District, Resource Management Dept. Stormwater Program
-139
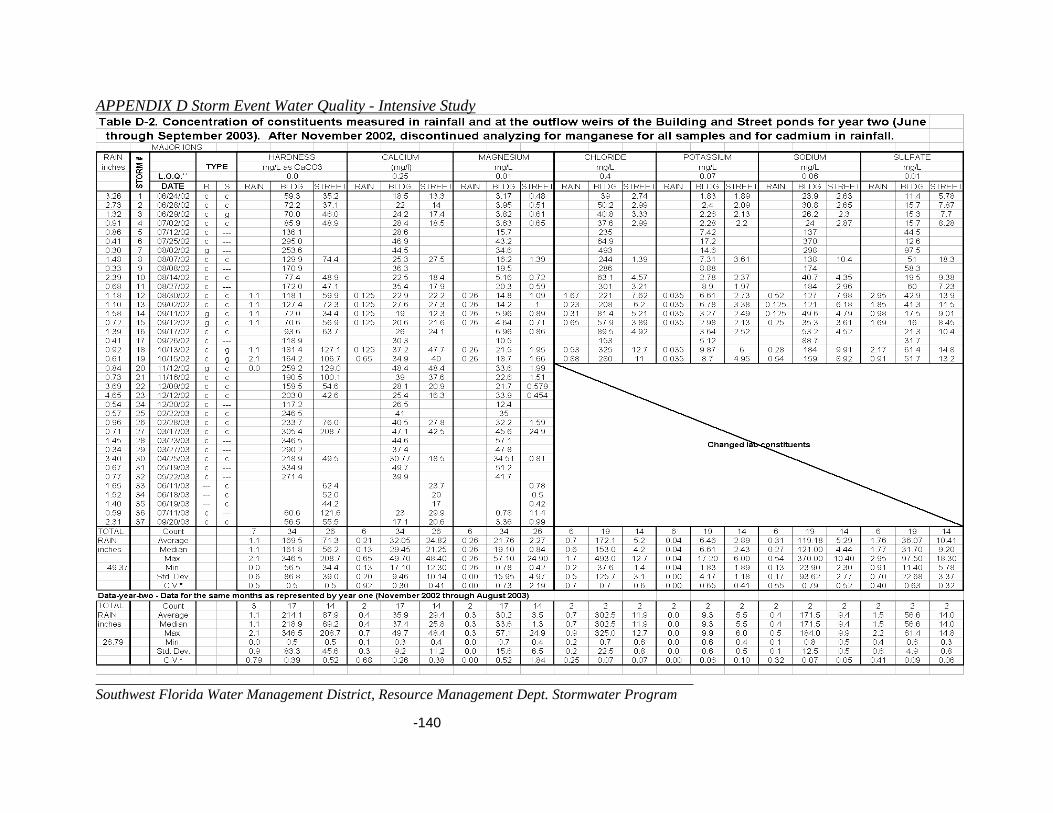
APPENDIX D Storm Event Water Quality - Intensive Study
______________________________________________________________________________ Southwest Florida Water Management District, Resource Management Dept. Stormwater Program
-140

APPENDIX D Storm Event Water Quality - Intensive Study
______________________________________________________________________________ Southwest Florida Water Management District, Resource Management Dept. Stormwater Program
-141

APPENDIX E Metal Concentrations vs Metal Standards .
______________________________________________________________________________ Southwest Florida Water Management District, Resource Management Dept. Stormwater Program -142
APPENDIX E
Comparison of Metal concentrations to Metal Standards For All Storm Events Sampled – 1996 to 2003
Original data: Excel spreadsheet APP E Metals vs Standards Excel stdsold and Quattro Pro MDLIMIT

APPENDIX E Metal Concentrations vs Metal Standards .
______________________________________________________________________________ Southwest Florida Water Management District, Resource Management Dept. Stormwater Program -143
Appendix E-1. Comparison of metal concentrations measured at the outflow of the ponds to metal class III standards. Bolded values exceed Class III WQ stds. Exceed(%) represents percent of samples in non-compliance with standards. When values are below the laboratory quantification limit (MDL) one-half the MDL was substituted. See table 3a for formulas used to calculate state standards from water hardness. Data are for 1997 sample year.
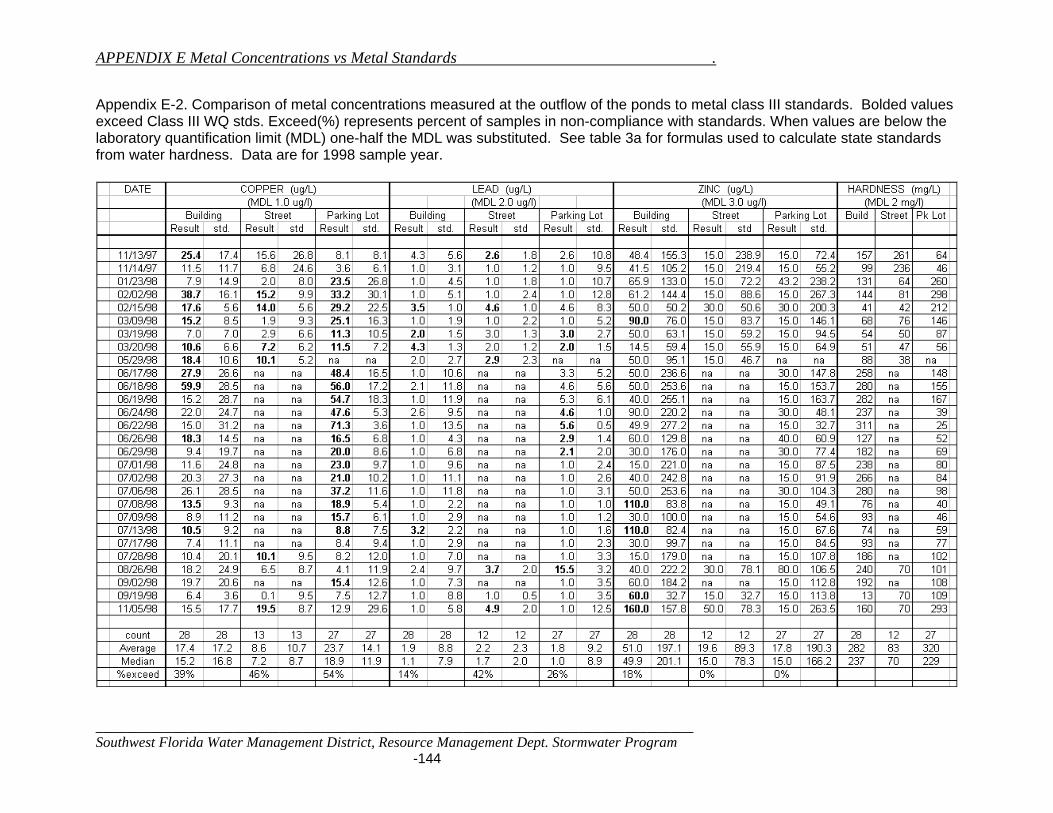
APPENDIX E Metal Concentrations vs Metal Standards .
______________________________________________________________________________ Southwest Florida Water Management District, Resource Management Dept. Stormwater Program -144
Appendix E-2. Comparison of metal concentrations measured at the outflow of the ponds to metal class III standards. Bolded values exceed Class III WQ stds. Exceed(%) represents percent of samples in non-compliance with standards. When values are below the laboratory quantification limit (MDL) one-half the MDL was substituted. See table 3a for formulas used to calculate state standards from water hardness. Data are for 1998 sample year.

APPENDIX E Metal Concentrations vs Metal Standards .
______________________________________________________________________________ Southwest Florida Water Management District, Resource Management Dept. Stormwater Program -145
Appendix E-3. Comparison of metal concentrations measured at the outflow of the ponds to metal class III standards. Bolded values exceed Class III WQ stds. Exceed(%) represents percent of samples in non-compliance with standards. When values are below the laboratory quantification limit (LOQ) one-half the LOQ was substituted. See table 3a for formulas used to calculate state standards from water hardness. Data are for the Street pond for the 2001 sample year.
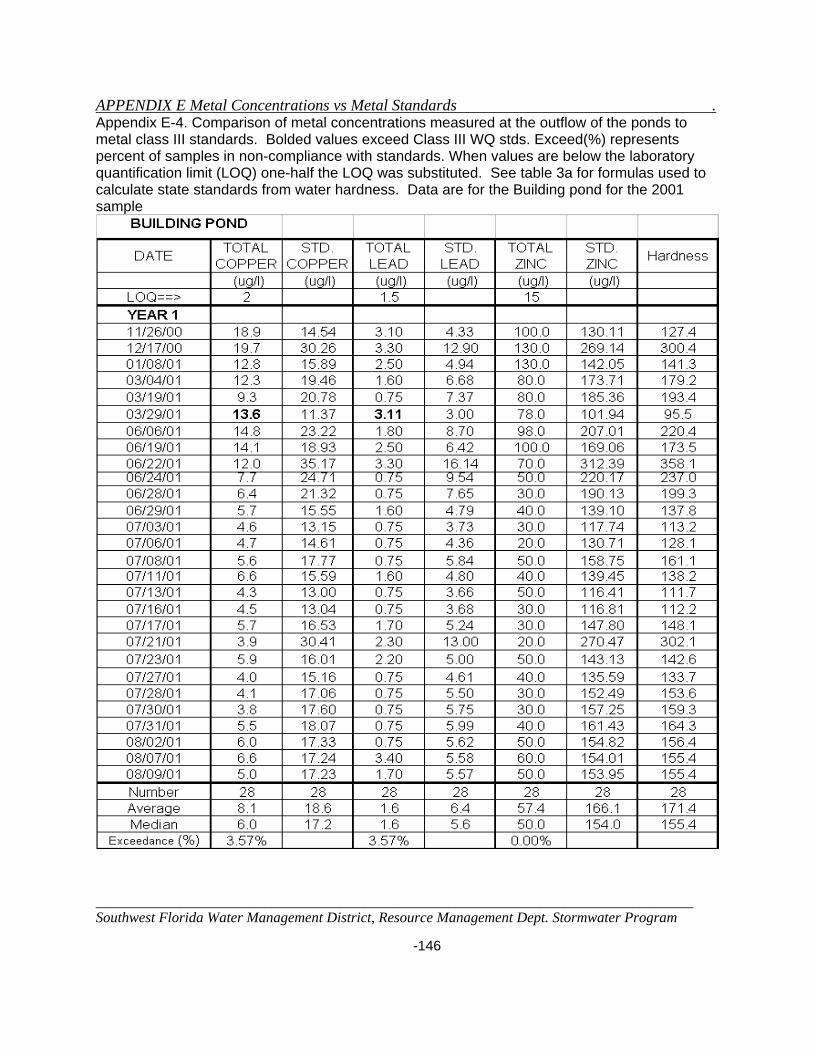
APPENDIX E Metal Concentrations vs Metal Standards .
______________________________________________________________________________ Southwest Florida Water Management District, Resource Management Dept. Stormwater Program -146
Appendix E-4. Comparison of metal concentrations measured at the outflow of the ponds to metal class III standards. Bolded values exceed Class III WQ stds. Exceed(%) represents percent of samples in non-compliance with standards. When values are below the laboratory quantification limit (LOQ) one-half the LOQ was substituted. See table 3a for formulas used to calculate state standards from water hardness. Data are for the Building pond for the 2001 sample

APPENDIX E Metal Concentrations vs Metal Standards .
______________________________________________________________________________ Southwest Florida Water Management District, Resource Management Dept. Stormwater Program -147
Appendix E-5. Comparison of metal concentrations measured at the outflow of the ponds to metal class III standards. Bolded values exceed Class III WQ stds. Exceed(%) represents percent of samples in non-compliance with standards. When values are below the laboratory quantification limit (LOQ) one-half the LOQ was substituted. See table 3a for formulas used to calculate state standards from water hardness. Data are for the Street pond for the 2002 sample year.
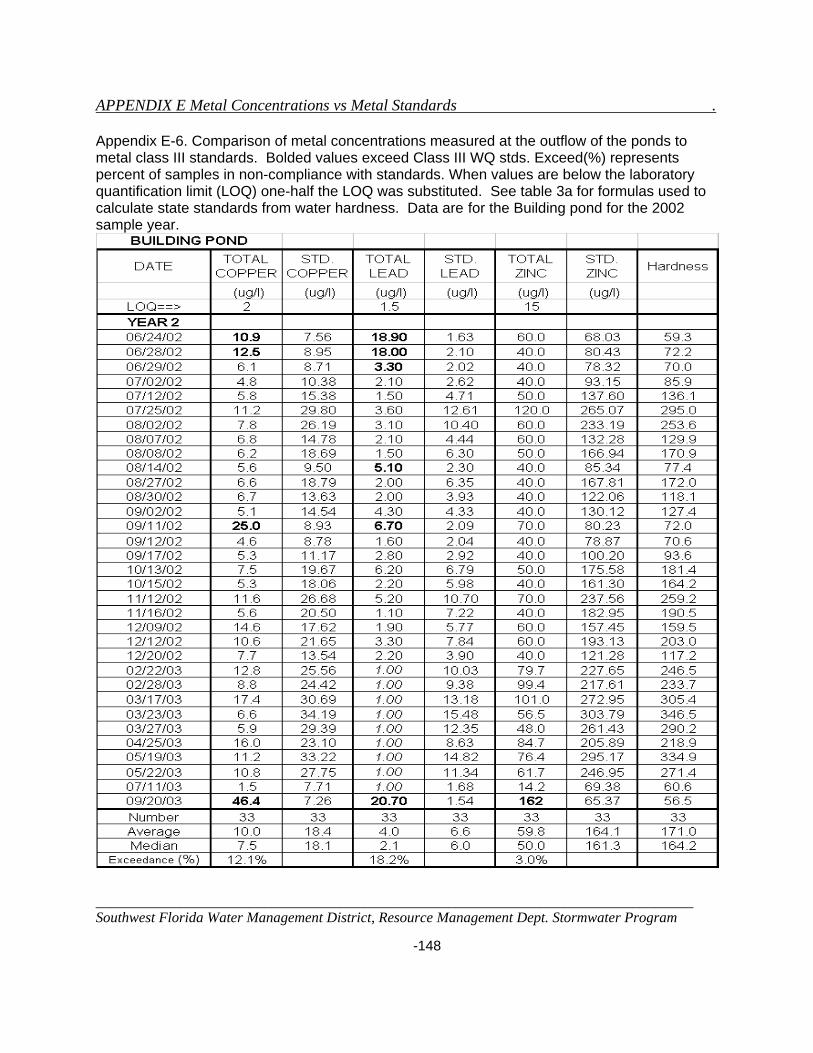
APPENDIX E Metal Concentrations vs Metal Standards .
______________________________________________________________________________ Southwest Florida Water Management District, Resource Management Dept. Stormwater Program -148
Appendix E-6. Comparison of metal concentrations measured at the outflow of the ponds to metal class III standards. Bolded values exceed Class III WQ stds. Exceed(%) represents percent of samples in non-compliance with standards. When values are below the laboratory quantification limit (LOQ) one-half the LOQ was substituted. See table 3a for formulas used to calculate state standards from water hardness. Data are for the Building pond for the 2002 sample year.

APPENDIX E Metal Concentrations vs Metal Standards .
______________________________________________________________________________ Southwest Florida Water Management District, Resource Management Dept. Stormwater Program -149
Appendix E-7. Summary statistics and percent non-compliance of standards,

APPENDIX F Water Quality in the Under Drains .
______________________________________________________________________________ Southwest Florida Water Management District, Resource Management Dept. Stormwater Program
-150
APPENDIX F
Comparison of Water Quality Concentrations in the Under Drains Intensive Study 2000 to 2003
Original data: DEMO/FINAL COMPARISON/WQyr2conc/AppK_ud comparisons
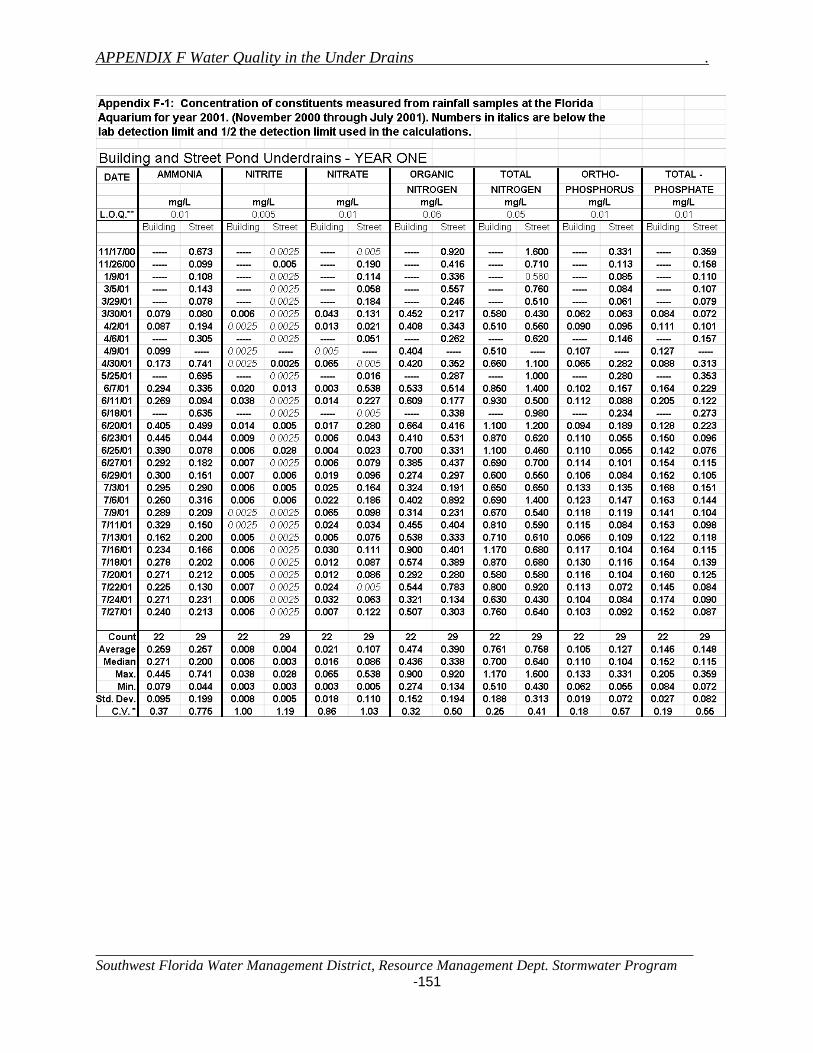
APPENDIX F Water Quality in the Under Drains .
______________________________________________________________________________ Southwest Florida Water Management District, Resource Management Dept. Stormwater Program
-151

APPENDIX F Water Quality in the Under Drains .
______________________________________________________________________________ Southwest Florida Water Management District, Resource Management Dept. Stormwater Program
-152
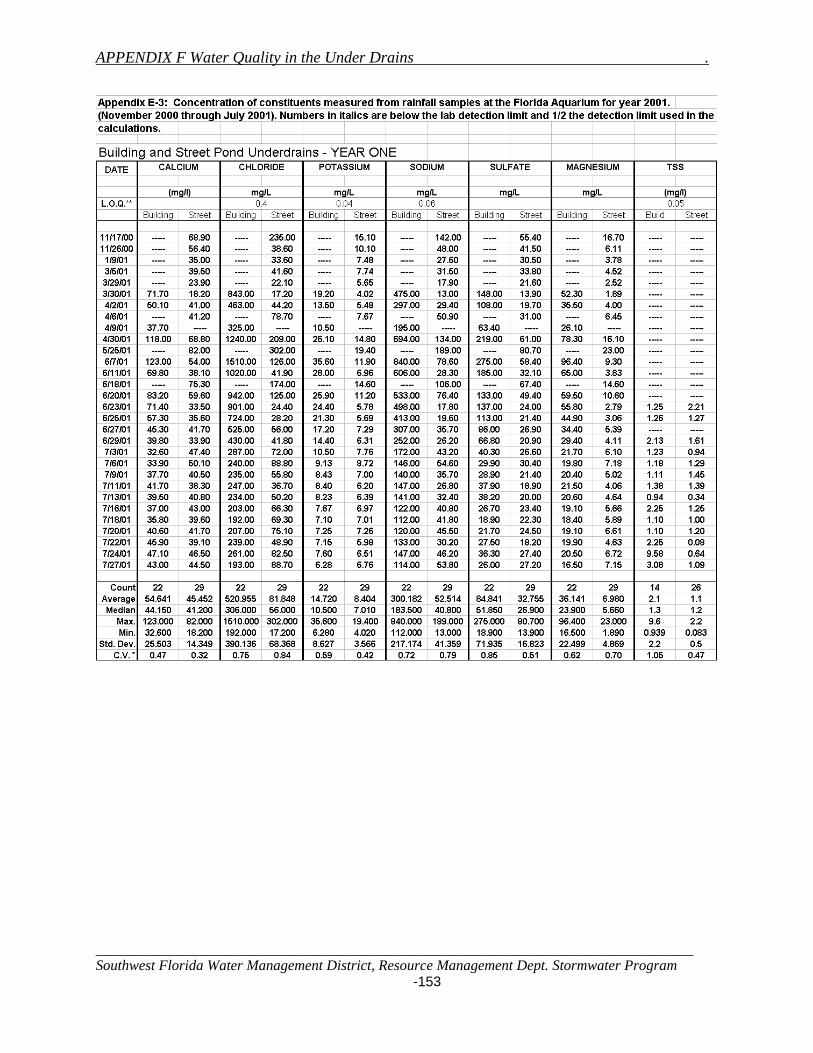
APPENDIX F Water Quality in the Under Drains .
______________________________________________________________________________ Southwest Florida Water Management District, Resource Management Dept. Stormwater Program
-153

APPENDIX F Water Quality in the Under Drains .
______________________________________________________________________________ Southwest Florida Water Management District, Resource Management Dept. Stormwater Program
-154
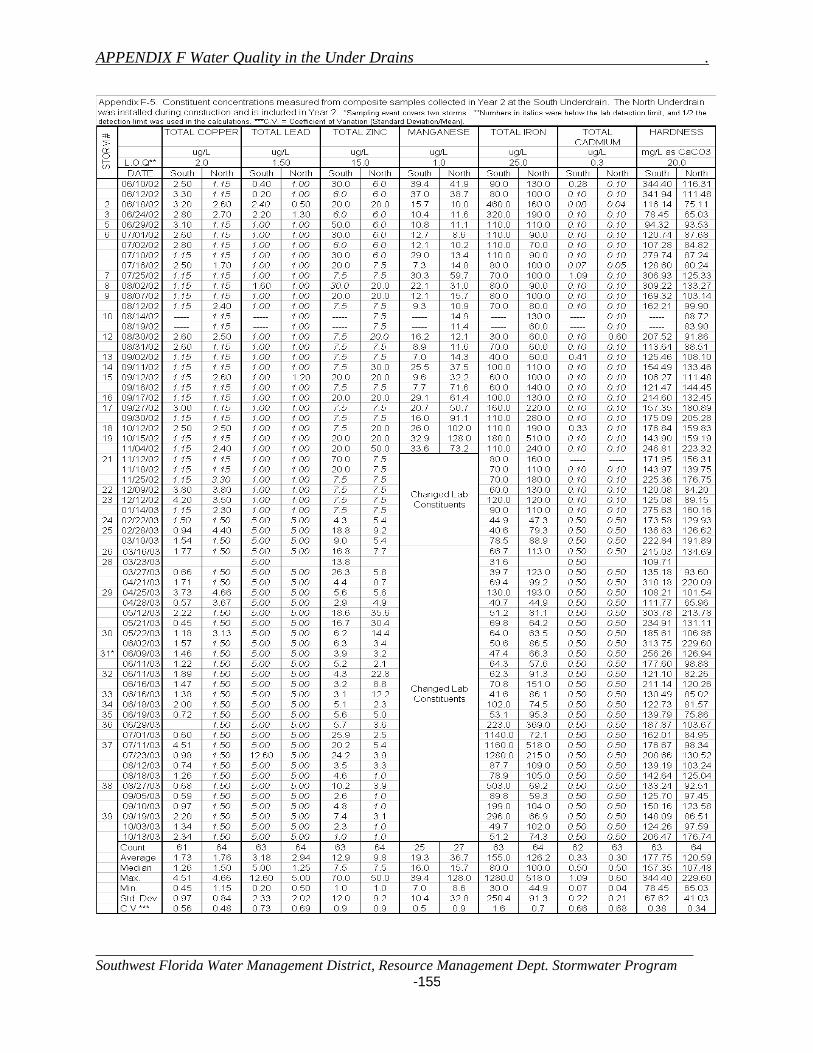
APPENDIX F Water Quality in the Under Drains .
______________________________________________________________________________ Southwest Florida Water Management District, Resource Management Dept. Stormwater Program
-155
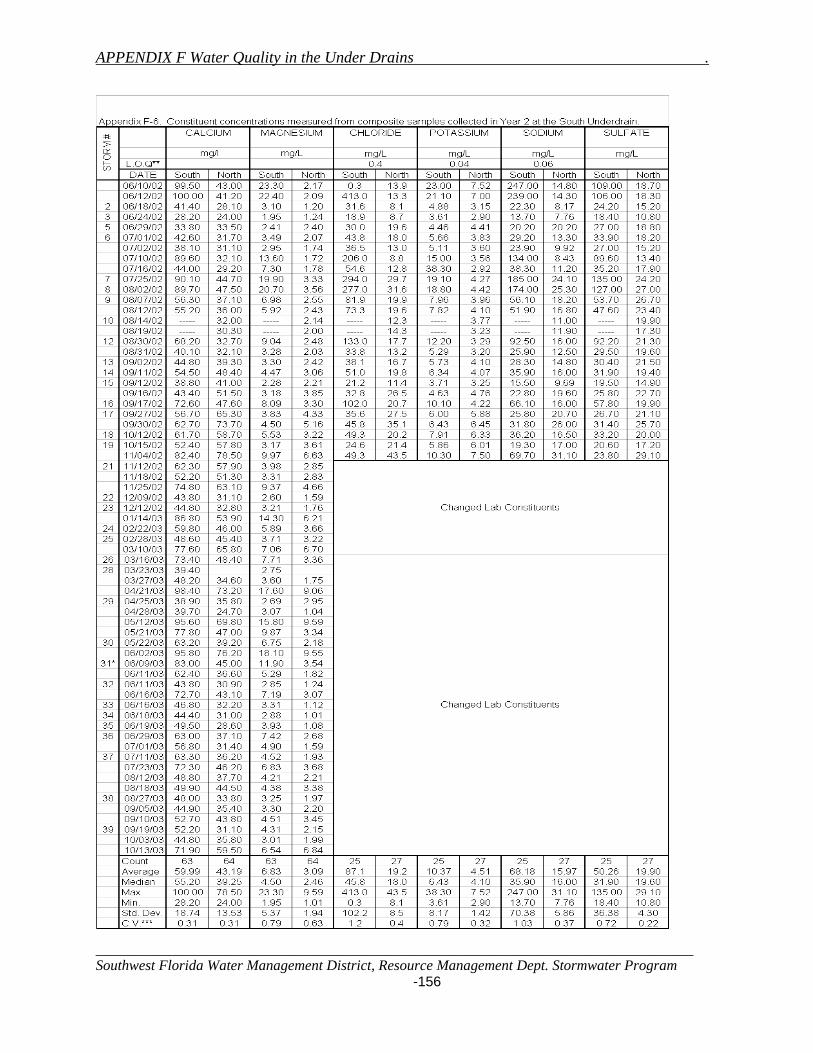
APPENDIX F Water Quality in the Under Drains .
______________________________________________________________________________ Southwest Florida Water Management District, Resource Management Dept. Stormwater Program
-156
APPENDIX F Water Quality in the Under Drains .
______________________________________________________________________________ Southwest Florida Water Management District, Resource Management Dept. Stormwater Program
-157
APPENDIX G In Situ Field Measurements .
______________________________________________________________________________ Southwest Florida Water Management District, Resource Management Dept. Stormwater Program
-158
APPENDIX G
CONTINUOUS READINGS OF IN SITU FIELD MEASUREMENTS TEMPERATURE, pH, DISSOLVED OXYGEN, CONDUCTIVITY
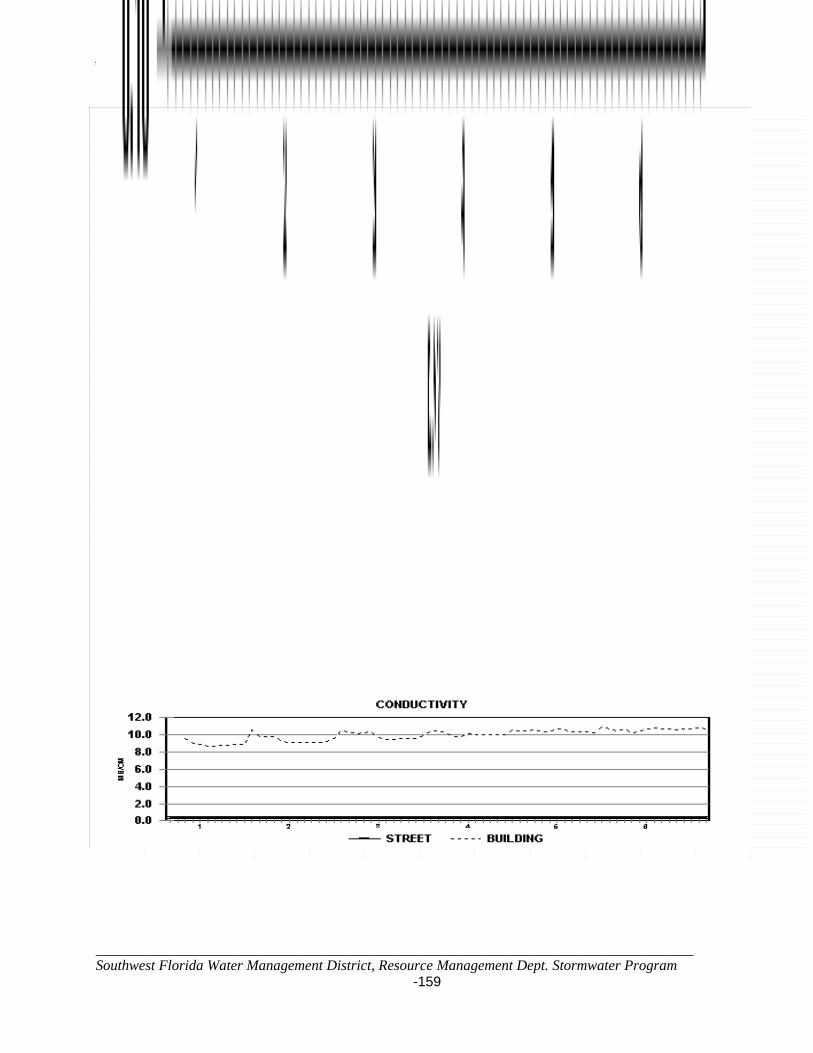
APPENDIX G In Situ Field Measurements .
______________________________________________________________________________ Southwest Florida Water Management District, Resource Management Dept. Stormwater Program
-159

APPENDIX G In Situ Field Measurements .
______________________________________________________________________________ Southwest Florida Water Management District, Resource Management Dept. Stormwater Program
-160
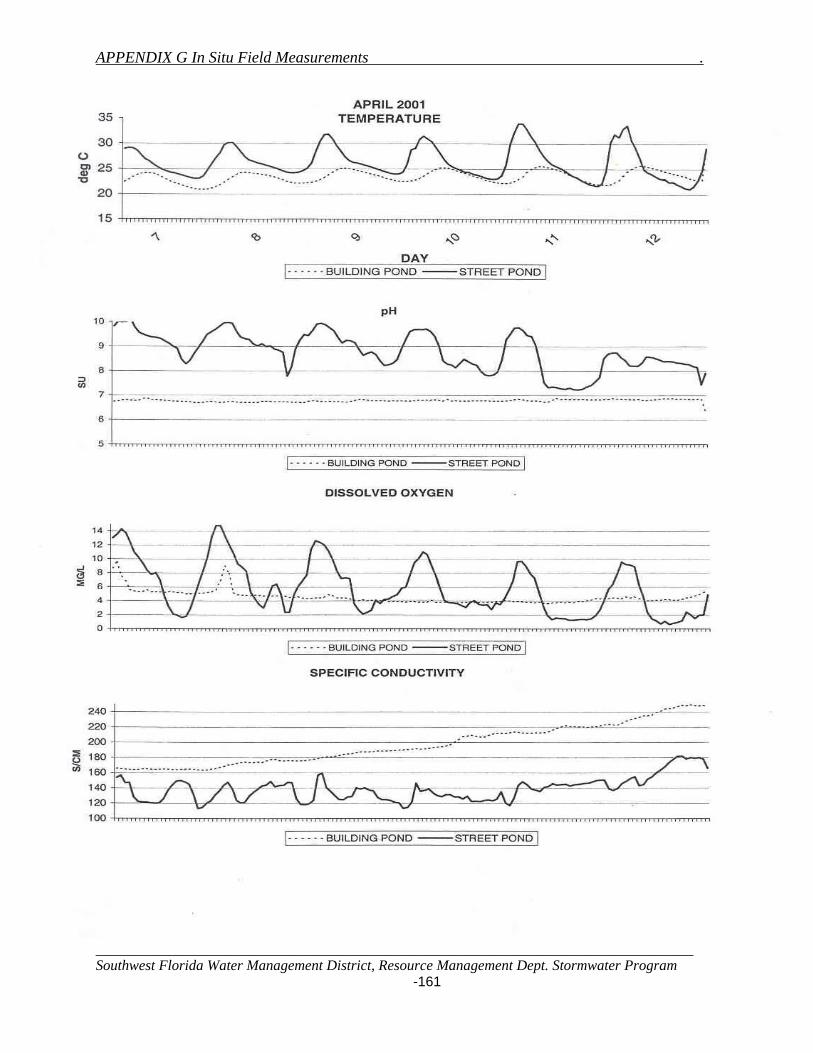
APPENDIX G In Situ Field Measurements .
______________________________________________________________________________ Southwest Florida Water Management District, Resource Management Dept. Stormwater Program
-161

APPENDIX G In Situ Field Measurements .
______________________________________________________________________________ Southwest Florida Water Management District, Resource Management Dept. Stormwater Program
-162
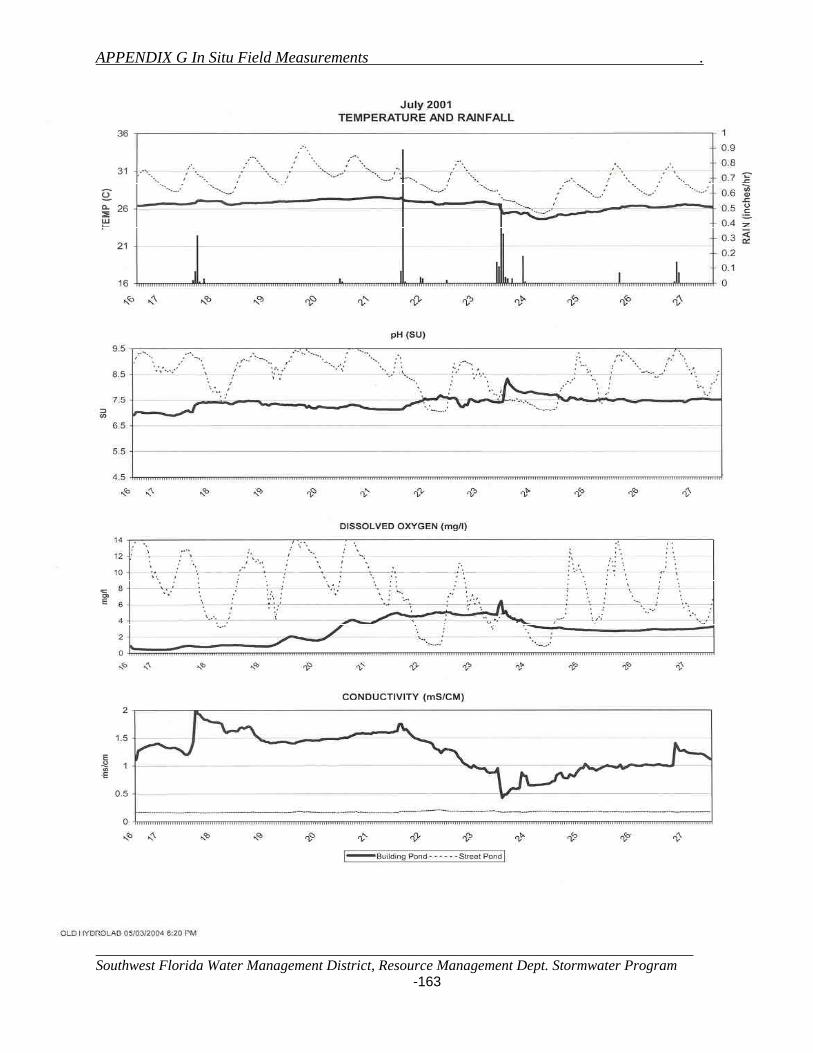
APPENDIX G In Situ Field Measurements .
______________________________________________________________________________ Southwest Florida Water Management District, Resource Management Dept. Stormwater Program
-163
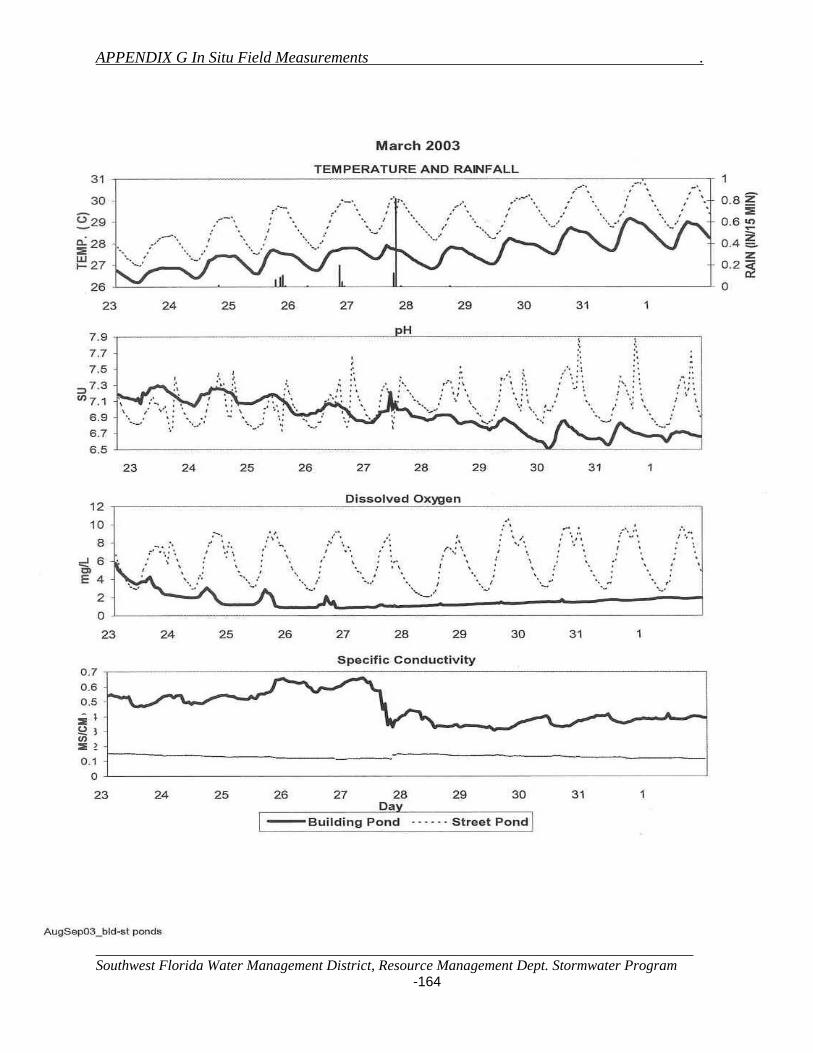
APPENDIX G In Situ Field Measurements .
______________________________________________________________________________ Southwest Florida Water Management District, Resource Management Dept. Stormwater Program
-164
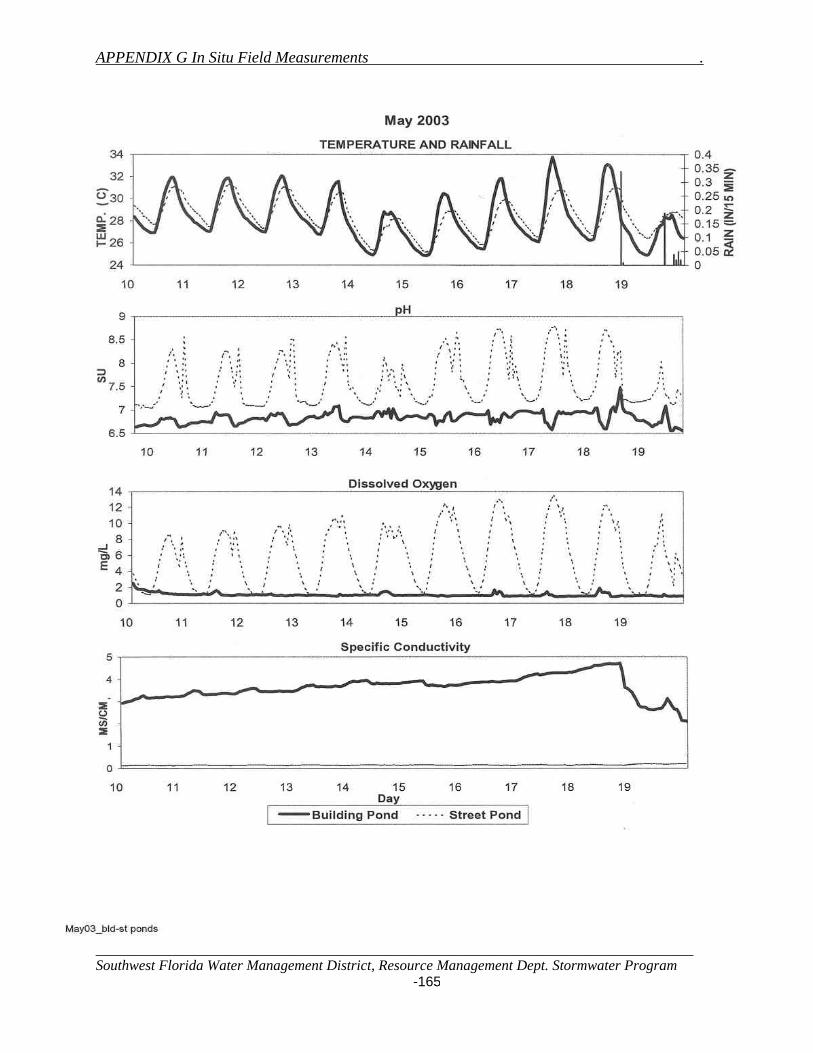
APPENDIX G In Situ Field Measurements .
______________________________________________________________________________ Southwest Florida Water Management District, Resource Management Dept. Stormwater Program
-165
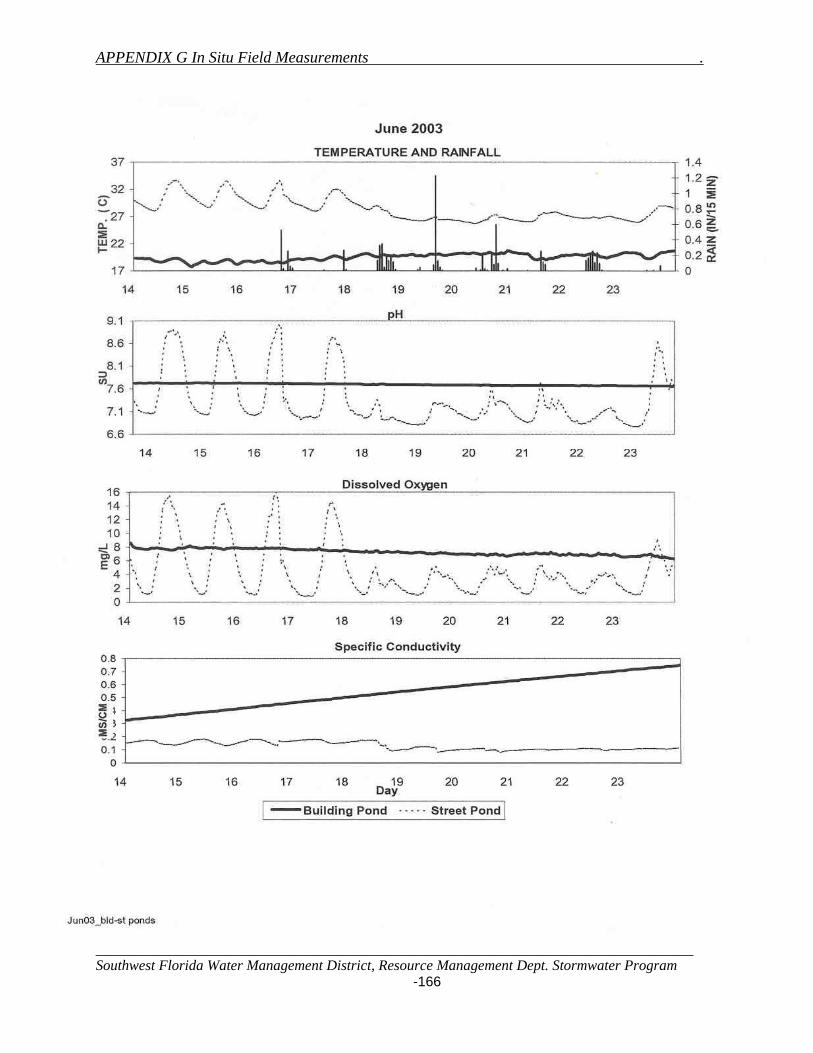
APPENDIX G In Situ Field Measurements .
______________________________________________________________________________ Southwest Florida Water Management District, Resource Management Dept. Stormwater Program
-166
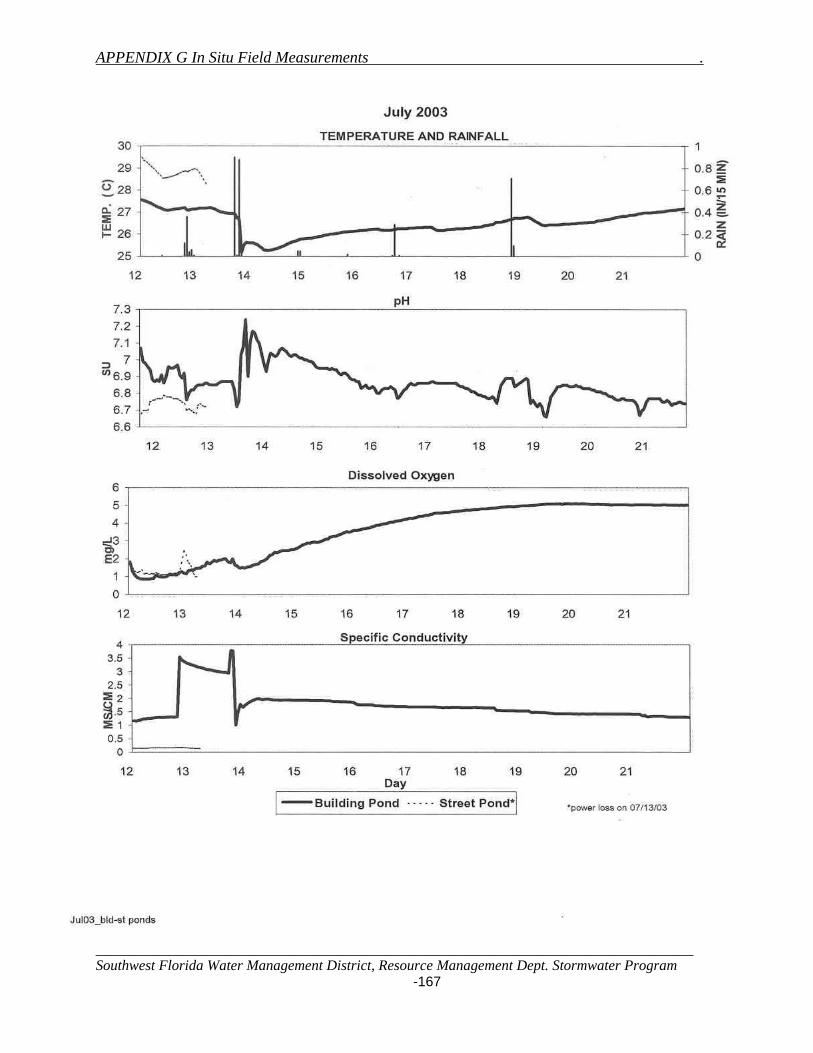
APPENDIX G In Situ Field Measurements .
______________________________________________________________________________ Southwest Florida Water Management District, Resource Management Dept. Stormwater Program
-167
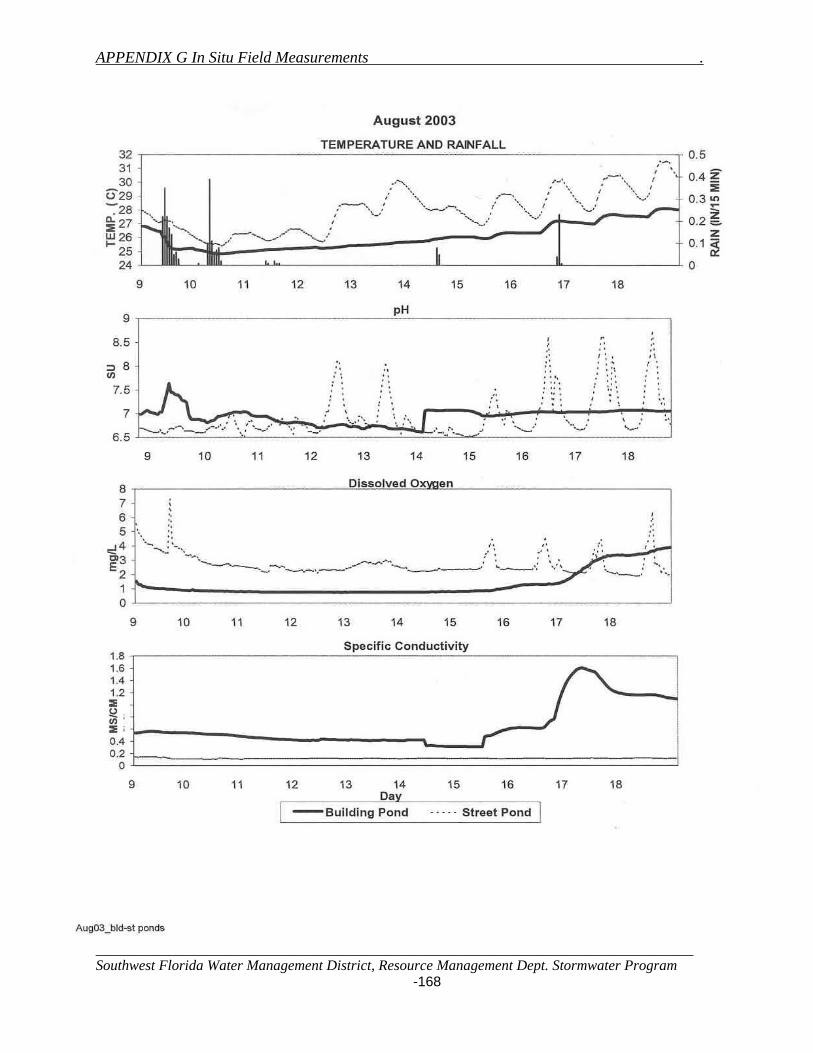
APPENDIX G In Situ Field Measurements .
______________________________________________________________________________ Southwest Florida Water Management District, Resource Management Dept. Stormwater Program
-168
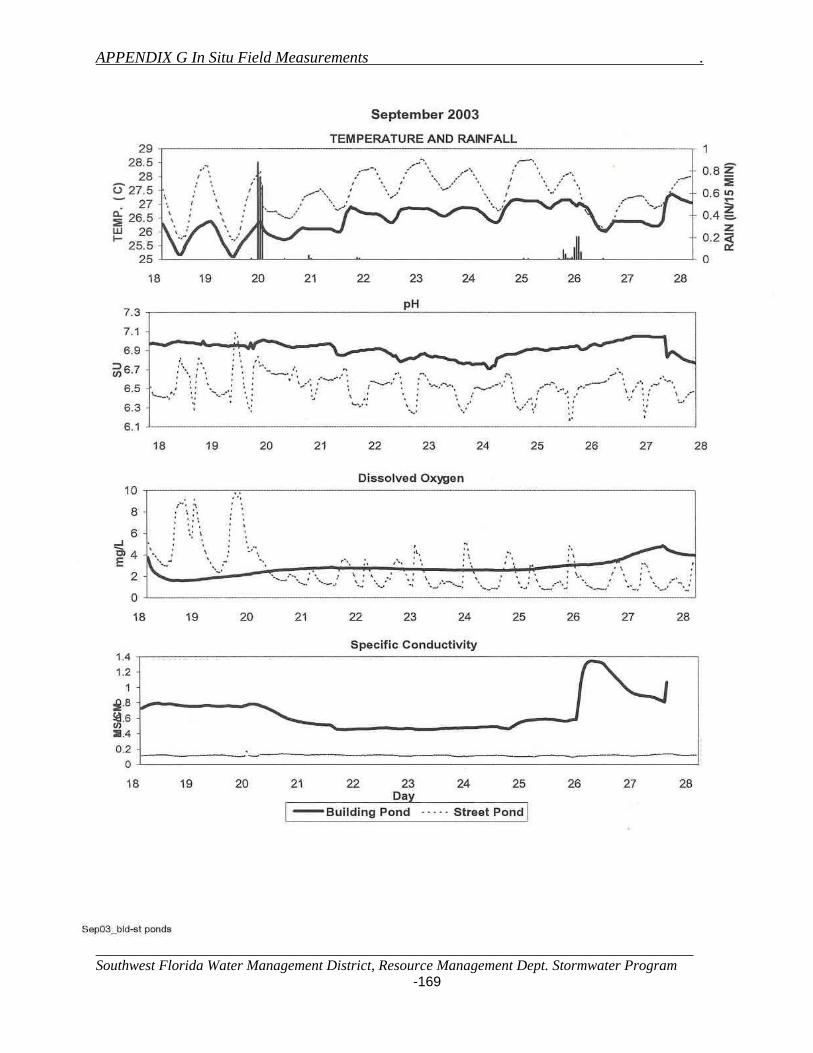
APPENDIX G In Situ Field Measurements .
______________________________________________________________________________ Southwest Florida Water Management District, Resource Management Dept. Stormwater Program
-169
APPENDIX H Sediment Samples .
______________________________________________________________________________ Southwest Florida Water Management District, Resource Management Dept. Stormwater Program
-170
APPENDIX H
SEDIMENT SAMPLES
APPENDIX H Sediment Samples .
______________________________________________________________________________ Southwest Florida Water Management District, Resource Management Dept. Stormwater Program
-171

APPENDIX H Sediment Samples .
______________________________________________________________________________ Southwest Florida Water Management District, Resource Management Dept. Stormwater Program -172
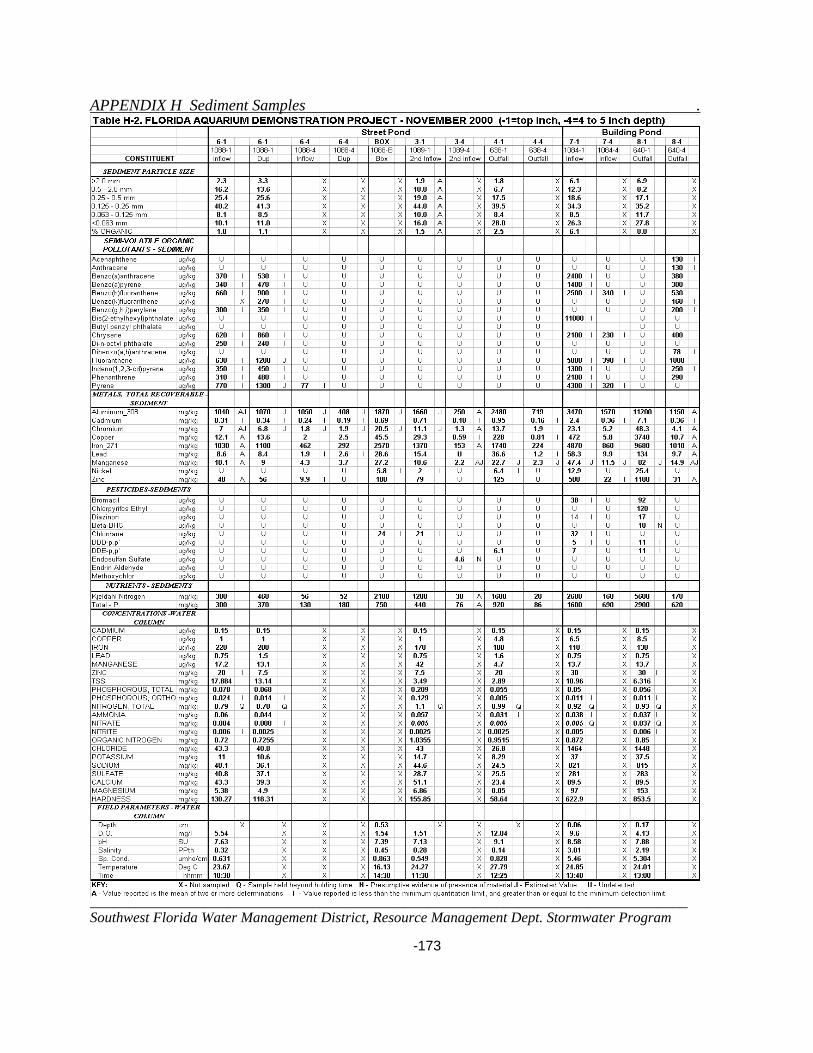
APPENDIX H Sediment Samples .
______________________________________________________________________________ Southwest Florida Water Management District, Resource Management Dept. Stormwater Program -173
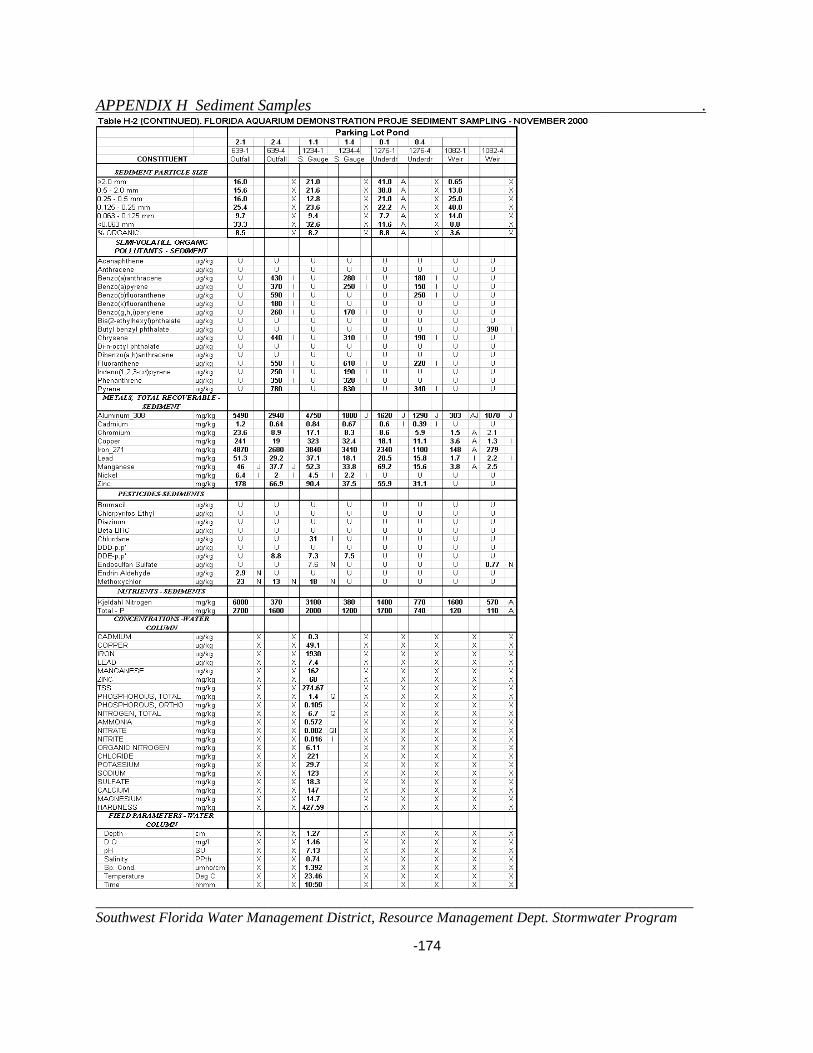
APPENDIX H Sediment Samples .
______________________________________________________________________________ Southwest Florida Water Management District, Resource Management Dept. Stormwater Program -174
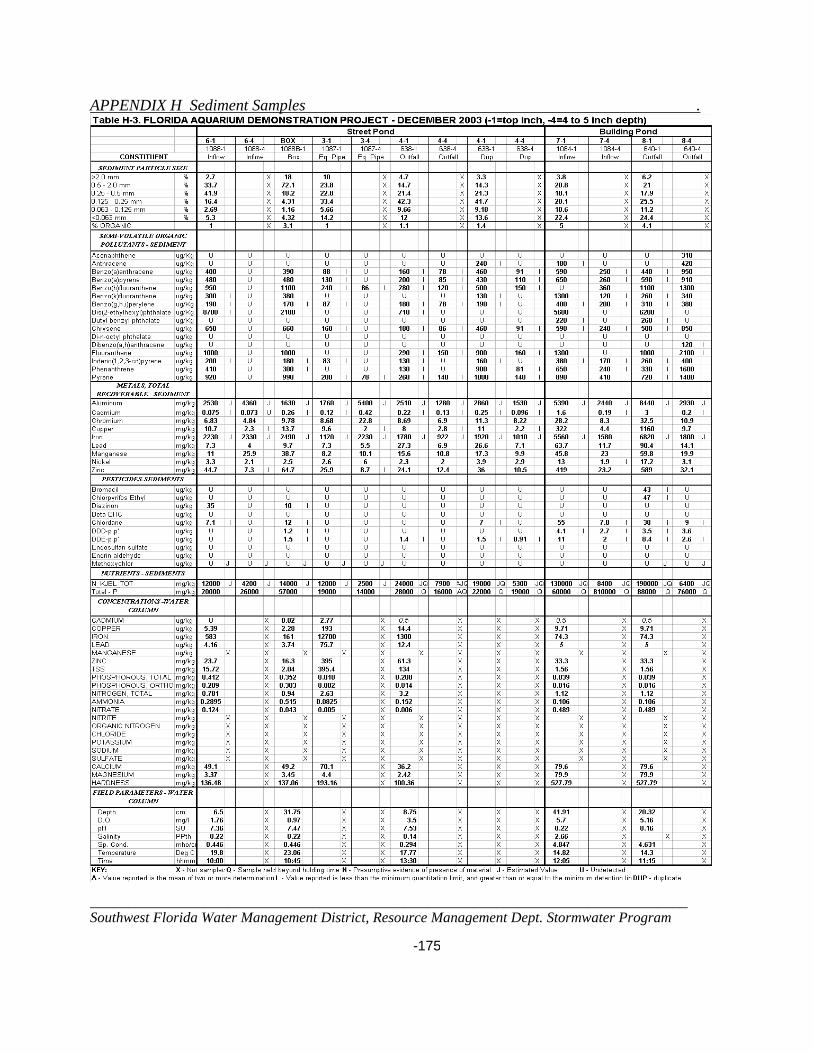
APPENDIX H Sediment Samples .
______________________________________________________________________________ Southwest Florida Water Management District, Resource Management Dept. Stormwater Program -175
APPENDIX I macroinvertebrate samples________________________________________
______________________________________________________________________________ Southwest Florida Water Management District, Resource Management Dept. Stormwater Program -176
APPENDIX I
MACROINVERTEBRATES
APPENDIX I macroinvertebrate samples________________________________________
______________________________________________________________________________ Southwest Florida Water Management District, Resource Management Dept. Stormwater Program -177
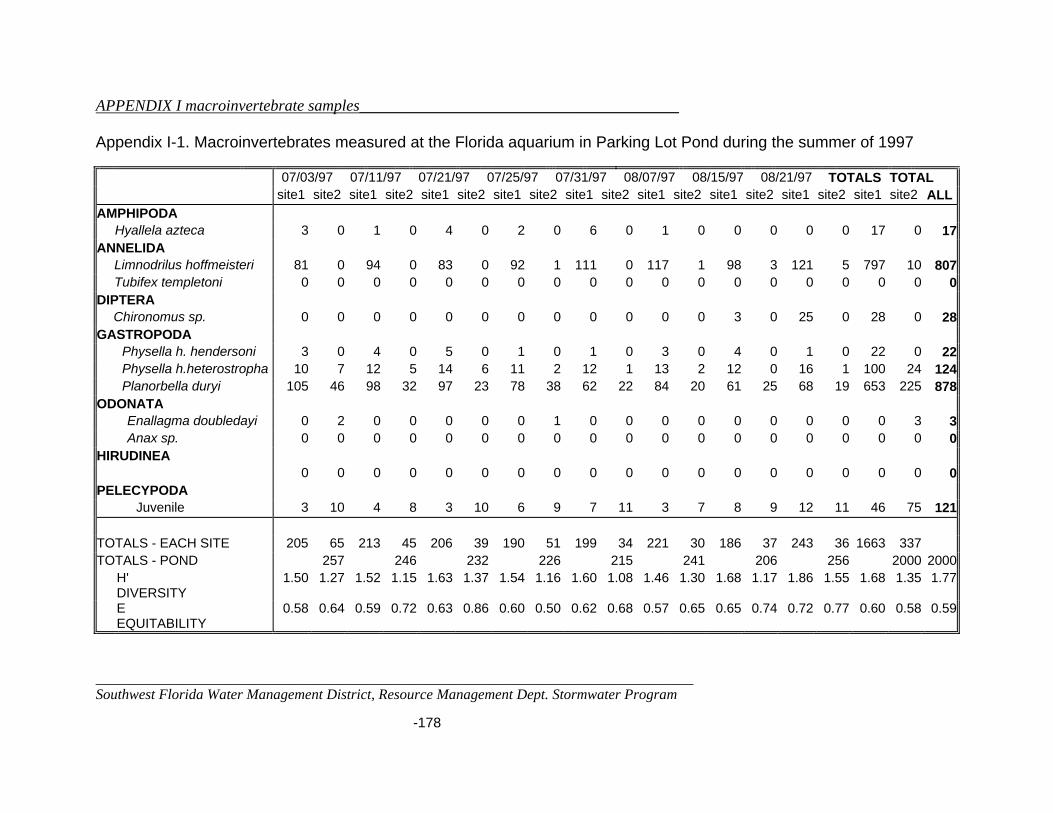
APPENDIX I macroinvertebrate samples________________________________________
______________________________________________________________________________ Southwest Florida Water Management District, Resource Management Dept. Stormwater Program
-178
Appendix I-1. Macroinvertebrates measured at the Florida aquarium in Parking Lot Pond during the summer of 1997
07/03/97 07/11/97 07/21/97 07/25/97 07/31/97 08/07/97 08/15/97 08/21/97 TOTALS TOTAL
site1 site2 site1 site2 site1 site2 site1 site2 site1 site2 site1 site2 site1 site2 site1 site2 site1 site2 ALLAMPHIPODA
Hyallela azteca 3 0 1 0 4 0 2 0 6 0 1 0 0 0 0 0 17 0 17 ANNELIDA
Limnodrilus hoffmeisteri 81 0 94 0 83 0 92 1 111 0 117 1 98 3 121 5 797 10 807 Tubifex templetoni 0 0 0 0 0 0 0 0 0 0 0 0 0 0 0 0 0 0 0
DIPTERA Chironomus sp. 0 0 0 0 0 0 0 0 0 0 0 0 3 0 25 0 28 0 28
GASTROPODA Physella h. hendersoni 3 0 4 0 5 0 1 0 1 0 3 0 4 0 1 0 22 0 22 Physella h.heterostropha 10 7 12 5 14 6 11 2 12 1 13 2 12 0 16 1 100 24 124 Planorbella duryi 105 46 98 32 97 23 78 38 62 22 84 20 61 25 68 19 653 225 878
ODONATA Enallagma doubledayi 0 2 0 0 0 0 0 1 0 0 0 0 0 0 0 0 0 3 3 Anax sp. 0 0 0 0 0 0 0 0 0 0 0 0 0 0 0 0 0 0 0
HIRUDINEA 0 0 0 0 0 0 0 0 0 0 0 0 0 0 0 0 0 0 0
PELECYPODA Juvenile 3 10 4 8 3 10 6 9 7 11 3 7 8 9 12 11 46 75 121
TOTALS - EACH SITE 205 65 213 45 206 39 190 51 199 34 221 30 186 37 243 36 1663 337 TOTALS - POND 257 246 232 226 215 241 206 256 2000 2000
H' DIVERSITY
1.50 1.27 1.52 1.15 1.63 1.37 1.54 1.16 1.60 1.08 1.46 1.30 1.68 1.17 1.86 1.55 1.68 1.35 1.77
E EQUITABILITY
0.58 0.64 0.59 0.72 0.63 0.86 0.60 0.50 0.62 0.68 0.57 0.65 0.65 0.74 0.72 0.77 0.60 0.58 0.59
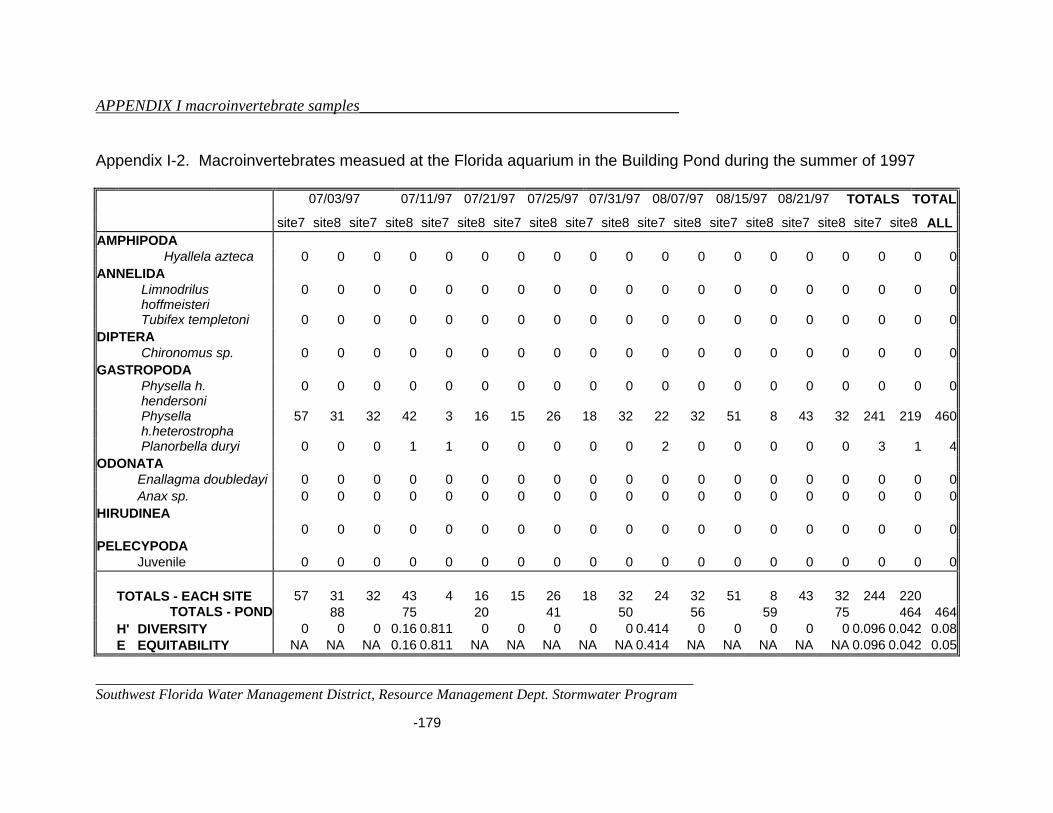
APPENDIX I macroinvertebrate samples________________________________________
______________________________________________________________________________ Southwest Florida Water Management District, Resource Management Dept. Stormwater Program
-179
Appendix I-2. Macroinvertebrates measued at the Florida aquarium in the Building Pond during the summer of 1997
07/03/97 07/11/97 07/21/97 07/25/97 07/31/97 08/07/97 08/15/97 08/21/97 TOTALS TOTAL
site7 site8 site7 site8 site7 site8 site7 site8 site7 site8 site7 site8 site7 site8 site7 site8 site7 site8 ALLAMPHIPODA
Hyallela azteca 0 0 0 0 0 0 0 0 0 0 0 0 0 0 0 0 0 0 0 ANNELIDA
Limnodrilus hoffmeisteri
0 0 0 0 0 0 0 0 0 0 0 0 0 0 0 0 0 0 0
Tubifex templetoni 0 0 0 0 0 0 0 0 0 0 0 0 0 0 0 0 0 0 0 DIPTERA
Chironomus sp. 0 0 0 0 0 0 0 0 0 0 0 0 0 0 0 0 0 0 0 GASTROPODA
Physella h. hendersoni
0 0 0 0 0 0 0 0 0 0 0 0 0 0 0 0 0 0 0
Physella h.heterostropha
57 31 32 42 3 16 15 26 18 32 22 32 51 8 43 32 241 219 460
Planorbella duryi 0 0 0 1 1 0 0 0 0 0 2 0 0 0 0 0 3 1 4 ODONATA
Enallagma doubledayi 0 0 0 0 0 0 0 0 0 0 0 0 0 0 0 0 0 0 0 Anax sp. 0 0 0 0 0 0 0 0 0 0 0 0 0 0 0 0 0 0 0
HIRUDINEA 0 0 0 0 0 0 0 0 0 0 0 0 0 0 0 0 0 0 0
PELECYPODA Juvenile 0 0 0 0 0 0 0 0 0 0 0 0 0 0 0 0 0 0 0
57 31 32 43 4 16 15 26 18 32 24 32 51 8 43 32 244 220 TOTALS - EACH SITE
TOTALS - POND 88 75 20 41 50 56 59 75 464 464 H' DIVERSITY 0 0 0 0.16 0.811 0 0 0 0 0 0.414 0 0 0 0 0 0.096 0.042 0.08 E EQUITABILITY NA NA NA 0.16 0.811 NA NA NA NA NA 0.414 NA NA NA NA NA 0.096 0.042 0.05
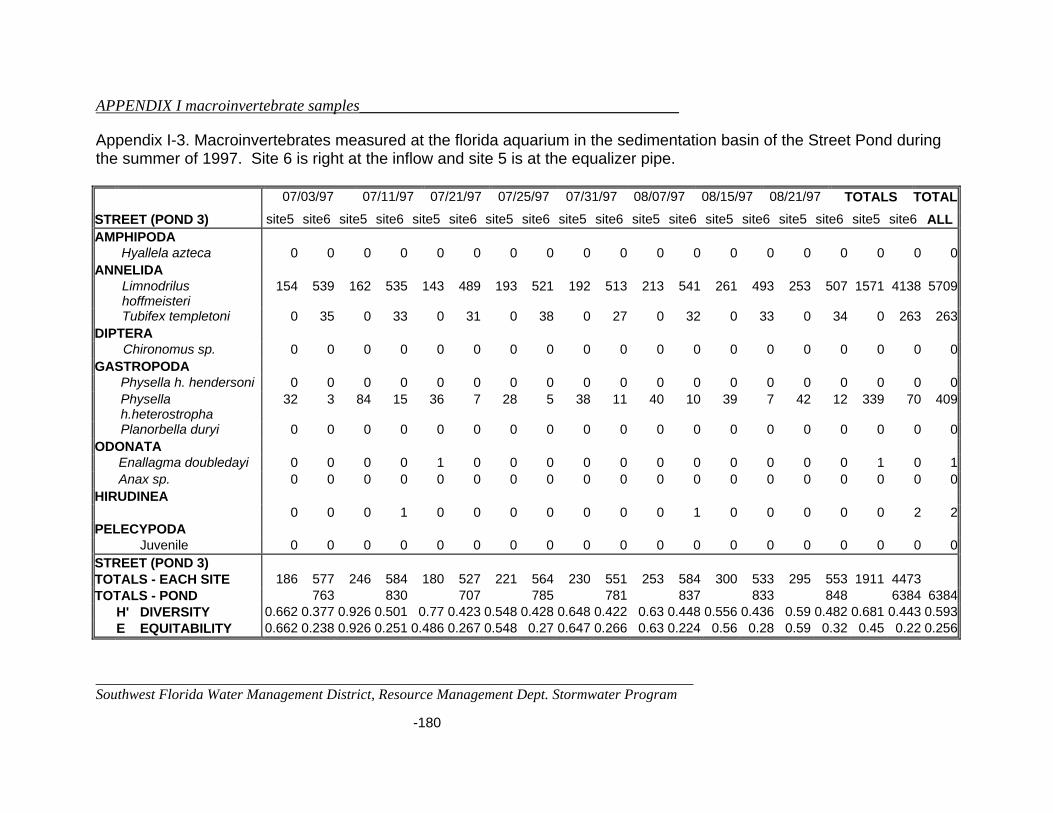
APPENDIX I macroinvertebrate samples________________________________________
______________________________________________________________________________ Southwest Florida Water Management District, Resource Management Dept. Stormwater Program
-180
Appendix I-3. Macroinvertebrates measured at the florida aquarium in the sedimentation basin of the Street Pond during the summer of 1997. Site 6 is right at the inflow and site 5 is at the equalizer pipe.
07/03/97 07/11/97 07/21/97 07/25/97 07/31/97 08/07/97 08/15/97 08/21/97 TOTALS TOTALSTREET (POND 3) site5 site6 site5 site6 site5 site6 site5 site6 site5 site6 site5 site6 site5 site6 site5 site6 site5 site6 ALLAMPHIPODA
Hyallela azteca 0 0 0 0 0 0 0 0 0 0 0 0 0 0 0 0 0 0 0 ANNELIDA
Limnodrilus hoffmeisteri
154 539 162 535 143 489 193 521 192 513 213 541 261 493 253 507 1571 4138 5709
Tubifex templetoni 0 35 0 33 0 31 0 38 0 27 0 32 0 33 0 34 0 263 263 DIPTERA
Chironomus sp. 0 0 0 0 0 0 0 0 0 0 0 0 0 0 0 0 0 0 0 GASTROPODA
Physella h. hendersoni 0 0 0 0 0 0 0 0 0 0 0 0 0 0 0 0 0 0 0 Physella h.heterostropha
32 3 84 15 36 7 28 5 38 11 40 10 39 7 42 12 339 70 409
Planorbella duryi 0 0 0 0 0 0 0 0 0 0 0 0 0 0 0 0 0 0 0 ODONATA
Enallagma doubledayi 0 0 0 0 1 0 0 0 0 0 0 0 0 0 0 0 1 0 1 Anax sp. 0 0 0 0 0 0 0 0 0 0 0 0 0 0 0 0 0 0 0
HIRUDINEA 0 0 0 1 0 0 0 0 0 0 0 1 0 0 0 0 0 2 2
PELECYPODA Juvenile 0 0 0 0 0 0 0 0 0 0 0 0 0 0 0 0 0 0 0
STREET (POND 3) TOTALS - EACH SITE 186 577 246 584 180 527 221 564 230 551 253 584 300 533 295 553 1911 4473 TOTALS - POND 763 830 707 785 781 837 833 848 6384 6384
H' DIVERSITY 0.662 0.377 0.926 0.501 0.77 0.423 0.548 0.428 0.648 0.422 0.63 0.448 0.556 0.436 0.59 0.482 0.681 0.443 0.593 E EQUITABILITY 0.662 0.238 0.926 0.251 0.486 0.267 0.548 0.27 0.647 0.266 0.63 0.224 0.56 0.28 0.59 0.32 0.45 0.22 0.256

APPENDIX I macroinvertebrate samples________________________________________
______________________________________________________________________________ Southwest Florida Water Management District, Resource Management Dept. Stormwater Program
-181
Appendix I-4. Macroinvertebrates measured at the Florida Aquarium in the filtration basin of the Street Pond during the summer of 1997.
07/03/97 07/11/97 07/21/97 07/25/97 07/31/97 08/07/97 08/15/97 08/21/97 TOTALS TOTALSTREET (POND 4) site3 site4 site3 site4 site3 site4 site3 site4 site3 site4 site3 site4 site3 site4 site3 site4 site3 site4 ALLAMPHIPODA
Hyallela azteca 0 0 0 0 0 0 0 0 0 0 0 0 0 0 0 0 0 0 0 ANNELIDA
Limnodrilus hoffmeisteri
212 521 252 283 249 274 310 225 217 298 248 243 362 276 384 208 2234 2328 4562
Tubifex templetoni 0 0 0 0 0 0 0 0 0 0 0 0 0 0 0 0 0 0 0 DIPTERA
Chironomus sp. 0 0 0 0 0 0 0 0 0 0 0 0 0 0 0 0 0 0 0 GASTROPODA
Physella h. hendersoni 0 0 0 0 0 0 0 0 0 0 0 0 0 0 0 0 0 0 0 Physella
h.heterostropha 7 11 8 13 7 11 11 12 17 8 4 13 9 12 12 14 75 94 169
Planorbella duryi 0 0 0 0 0 0 0 0 0 0 0 0 0 0 0 0 0 0 0 ODONATA
Enallagma doubledayi 0 0 0 0 1 0 0 0 0 0 1 0 0 0 0 0 2 0 2 Anax sp. 0 0 0 1 0 0 0 0 0 0 0 0 0 1 0 0 0 2 2
HIRUDINEA 0 0 0 0 0 0 0 0 0 0 0 0 0 0 0 0 0 0 0
PELECYPODA Juvenile 9 0 10 0 8 0 14 0 11 0 11 0 9 0 12 0 84 0 84
STREET (POND 4) TOTALS - EACH SITE 228 532 270 297 265 285 335 237 245 306 264 256 380 289 408 222 2395 2424 TOTALS - POND 751 557 542 558 540 509 660 618 4735 4735
H' DIVERSITY 0.44 0.15 0.42 0.29 0.41 0.24 0.46 0.29 0.62 0.18 0.40 0.29 0.32 0.28 0.38 0.34 0.43 0.25 0.36 E EQITABILITY 0.28 0.15 0.27 0.18 0.20 0.24 0.29 0.29 0.39 0.18 0.20 0.29 0.20 0.17 0.23 0.34 0.21 0.16 0.15
APPENDIX J skimmer Box Gross Solids .
______________________________________________________________________________ Southwest Florida Water Management District, Resource Management Dept. Stormwater Program -182
APPENDIX J
ANALYSIS OF GROSS SOLIDS IN
DROP BOXES AT FLORIDA AQUARIUM
COMPARING THREE CLEAN OUT PERIODS
This has been kept as a stand-alone summary report with all the data
:\DEMO\DROPBOX\GROSS SOLIDS\DROPBOX_SED_ALL
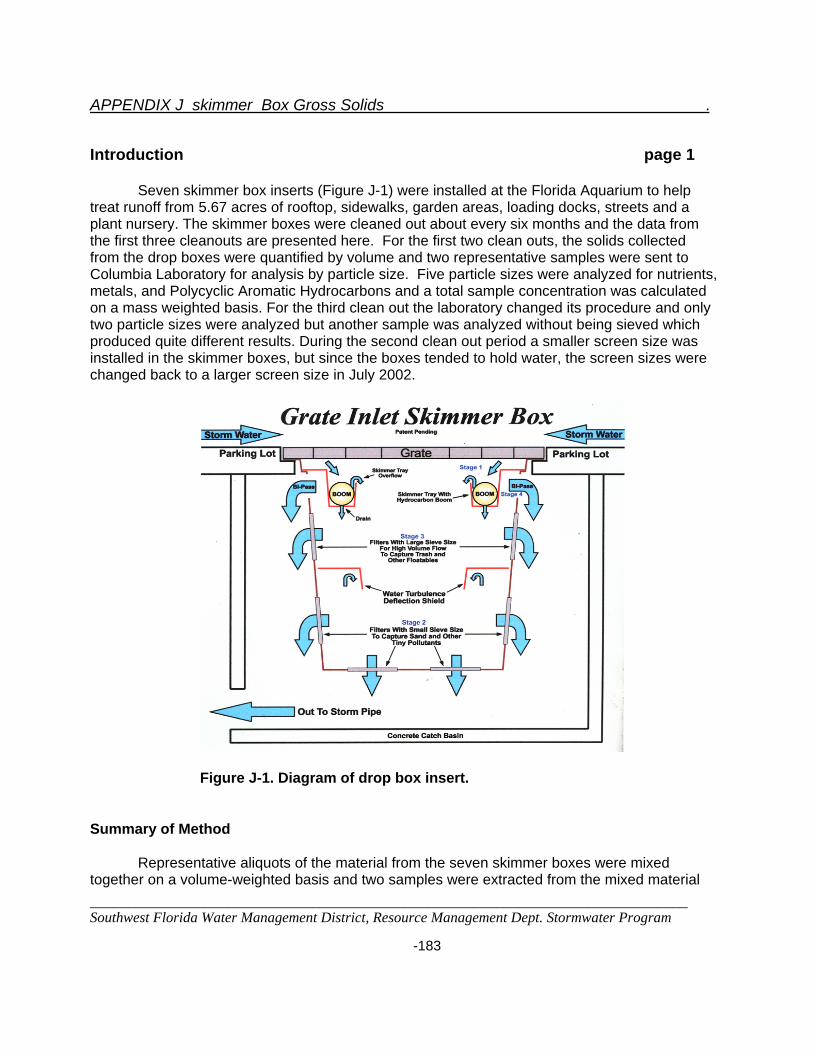
APPENDIX J skimmer Box Gross Solids .
______________________________________________________________________________ Southwest Florida Water Management District, Resource Management Dept. Stormwater Program -183
Introduction page 1
Seven skimmer box inserts (Figure J-1) were installed at the Florida Aquarium to help treat runoff from 5.67 acres of rooftop, sidewalks, garden areas, loading docks, streets and a plant nursery. The skimmer boxes were cleaned out about every six months and the data from the first three cleanouts are presented here. For the first two clean outs, the solids collected from the drop boxes were quantified by volume and two representative samples were sent to Columbia Laboratory for analysis by particle size. Five particle sizes were analyzed for nutrients, metals, and Polycyclic Aromatic Hydrocarbons and a total sample concentration was calculated on a mass weighted basis. For the third clean out the laboratory changed its procedure and only two particle sizes were analyzed but another sample was analyzed without being sieved which produced quite different results. During the second clean out period a smaller screen size was installed in the skimmer boxes, but since the boxes tended to hold water, the screen sizes were changed back to a larger screen size in July 2002.
Figure J-1. Diagram of drop box insert.
Summary of Method Representative aliquots of the material from the seven skimmer boxes were mixed together on a volume-weighted basis and two samples were extracted from the mixed material

APPENDIX J skimmer Box Gross Solids .
______________________________________________________________________________ Southwest Florida Water Management District, Resource Management Dept. Stormwater Program -184
Page 2 and sent to the laboratory for analysis. The data include: 1) tables for particle size, 2) tables with the concentrations analyzed by particle size, and 3) figures showing the analysis for each particle size. For the third cleanout, only two particle sizes were analyzed, but for comparison a sample was also analyzed without being sieved. Summary of Results The preliminary data presented here are being analyzed for a future report and the figures and tables are poorly organized and a haphazard numbering system has been used.
• Similar particle size ranges were measured for all three cleanout periods. Most of the particles (30 to 40%) were measured in the 180 to 425 micron size range (Figure J-2, page 7). Usually less than 10% of particles were smaller than 75 microns, which is about the largest size particle that can be sampled using automatic water quality samplers (Tables XX-1 to XX-3 and Figure J-2 pages 4-7).
• All the constituent concentrations are reported for each clean out event in Tables X-1
through X-3, pages 8,9 and 10. The data for individual constituents are presented in Figures J-4 through J-11, pages 12 – 17. Constituent concentrations for samples that have been combined on a mass- weighted basis show that duplicate samples usually measured comparable concentrations, but that there were often differences between sampling events (Figure J-3, page 11).
• When the samples were analyzed by particle size, the smallest particle size usually had
the highest concentrations of pollutants (Figures J-4 through Figure J-9, pages 12-16).
• An exception to the pattern showing the smallest particle size with the highest
concentrations was seen for organic carbon and nitrogen during the third clean out period when the largest particle size range had the highest concentrations. The leaves captured on the largest sieve may have caused this result (Figure J-6, page 14).
• Of some concern is the comparison of concentrations measured in the samples that were not sieved compared to the samples that were sieved. There appears to be a significant difference between concentrations with some much higher and others much lower. This brings into question whether the physical process of sieving the sample changes the concentrations (Figure J-6 and Figure J-9, page 14 and page17). If the differences were caused by samples that were not well mixed or homogeneous then it would be expected that the duplicate samples would have shown more variation (FigureJ-3, page 11). This result was also noted for another site that is being studied.
APPENDIX J skimmer Box Gross Solids .
______________________________________________________________________________ Southwest Florida Water Management District, Resource Management Dept. Stormwater Program -185
Page 3 Conclusions Drop box inserts are effective for collecting coarse solids from the stormwater flow stream. The drop boxes removed about fifteen cubic feet of material per year from this six-acre drainage basin. Although the smallest particle size had the highest concentrations of pollutants, the larger particle sizes contributed a greater mass of pollutants. Of some concern is that sieving samples into separate particle size ranges is changing the concentration of pollutants measured in samples.
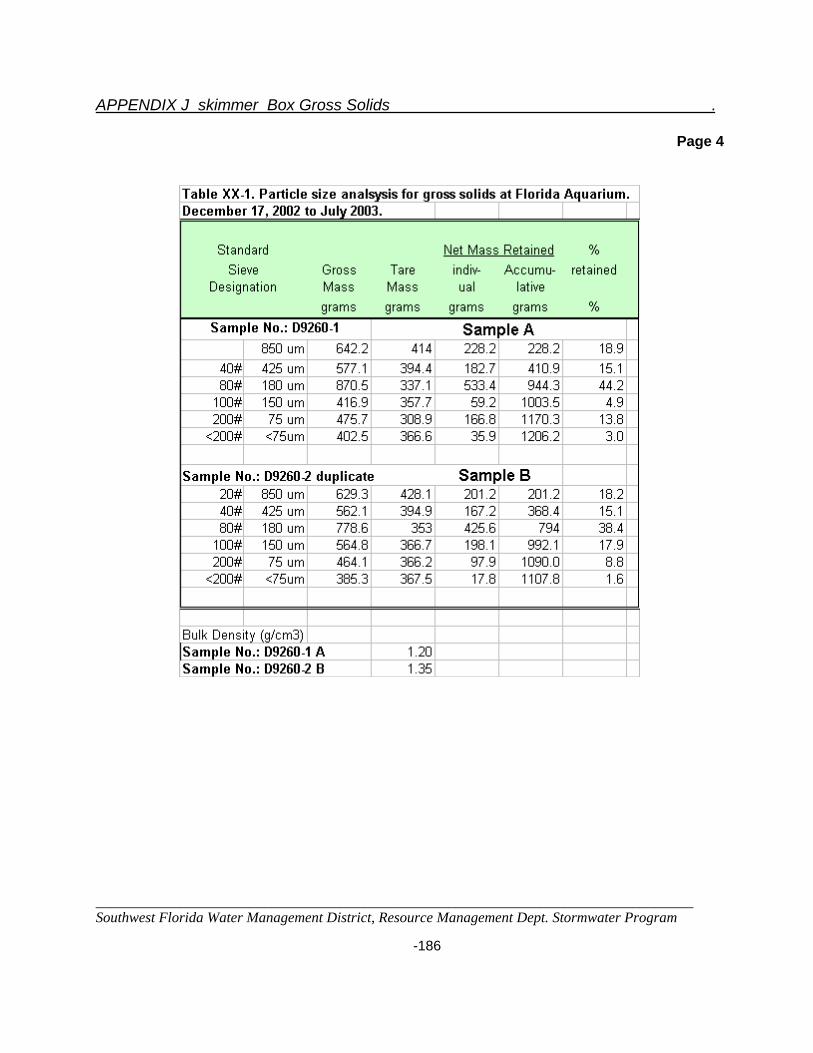
APPENDIX J skimmer Box Gross Solids .
______________________________________________________________________________ Southwest Florida Water Management District, Resource Management Dept. Stormwater Program -186
Page 4

APPENDIX J skimmer Box Gross Solids .
______________________________________________________________________________ Southwest Florida Water Management District, Resource Management Dept. Stormwater Program -187
Page 5
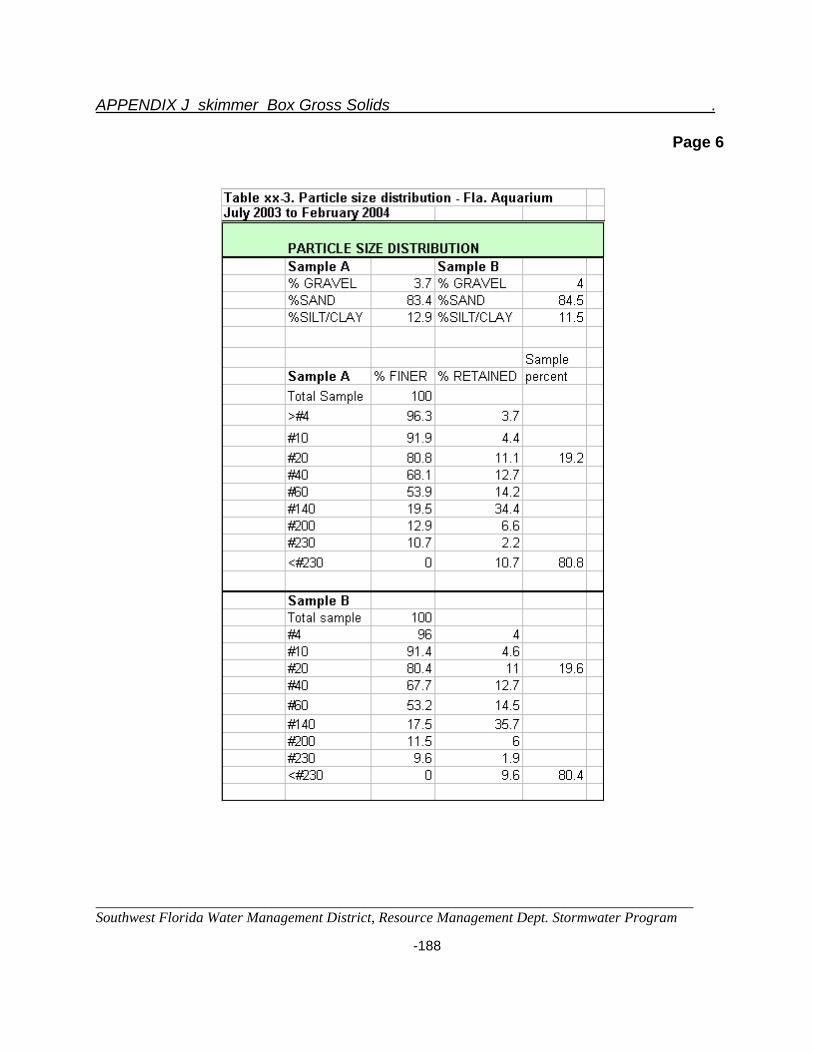
APPENDIX J skimmer Box Gross Solids .
______________________________________________________________________________ Southwest Florida Water Management District, Resource Management Dept. Stormwater Program -188
Page 6
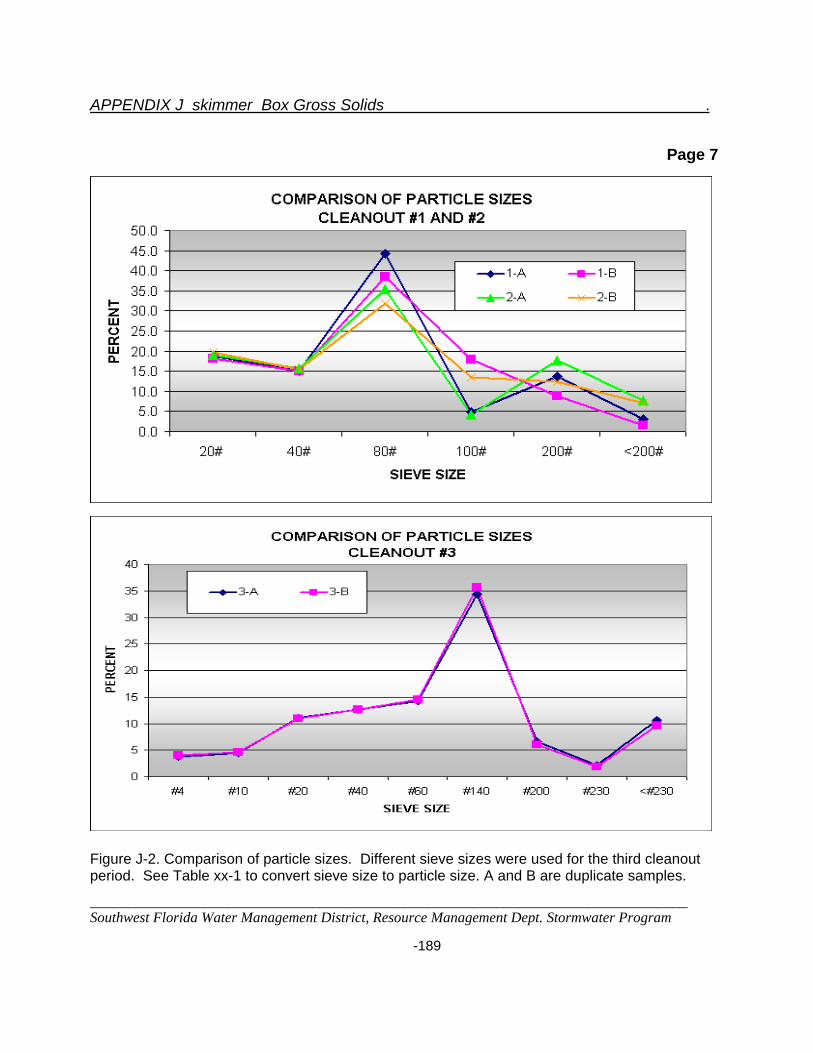
APPENDIX J skimmer Box Gross Solids .
______________________________________________________________________________ Southwest Florida Water Management District, Resource Management Dept. Stormwater Program -189
Page 7
Figure J-2. Comparison of particle sizes. Different sieve sizes were used for the third cleanout period. See Table xx-1 to convert sieve size to particle size. A and B are duplicate samples.
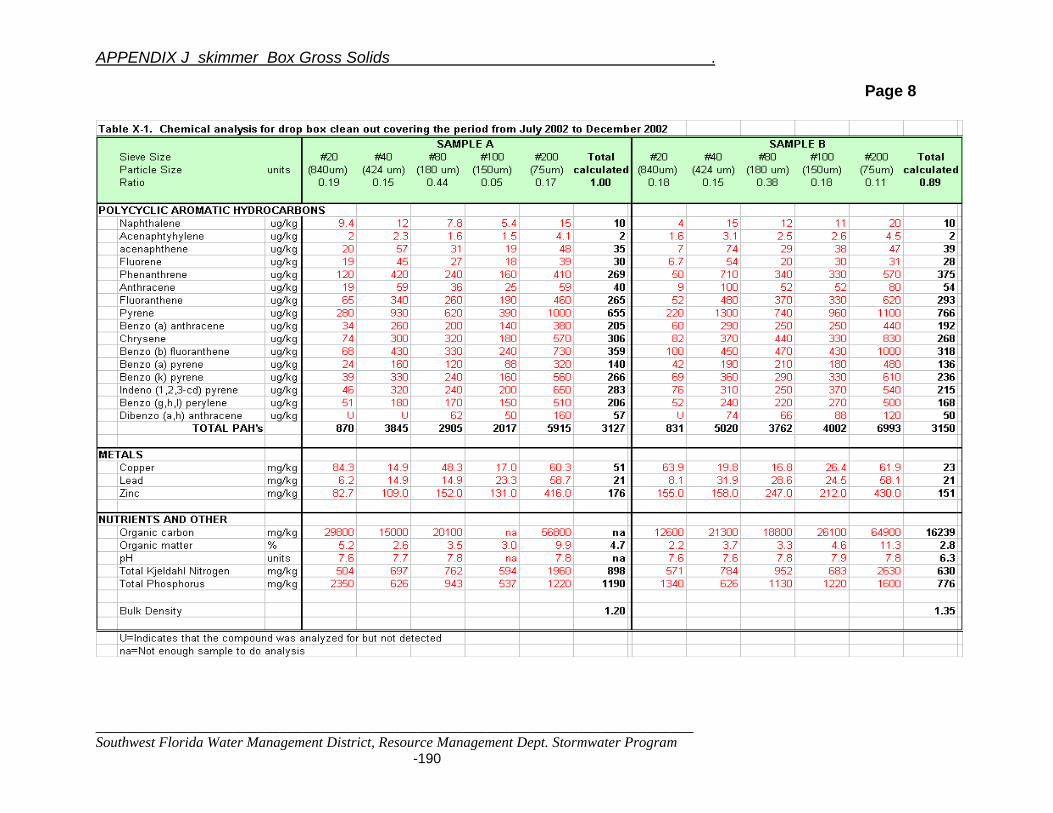
APPENDIX J skimmer Box Gross Solids .
______________________________________________________________________________ Southwest Florida Water Management District, Resource Management Dept. Stormwater Program -190
Page 8
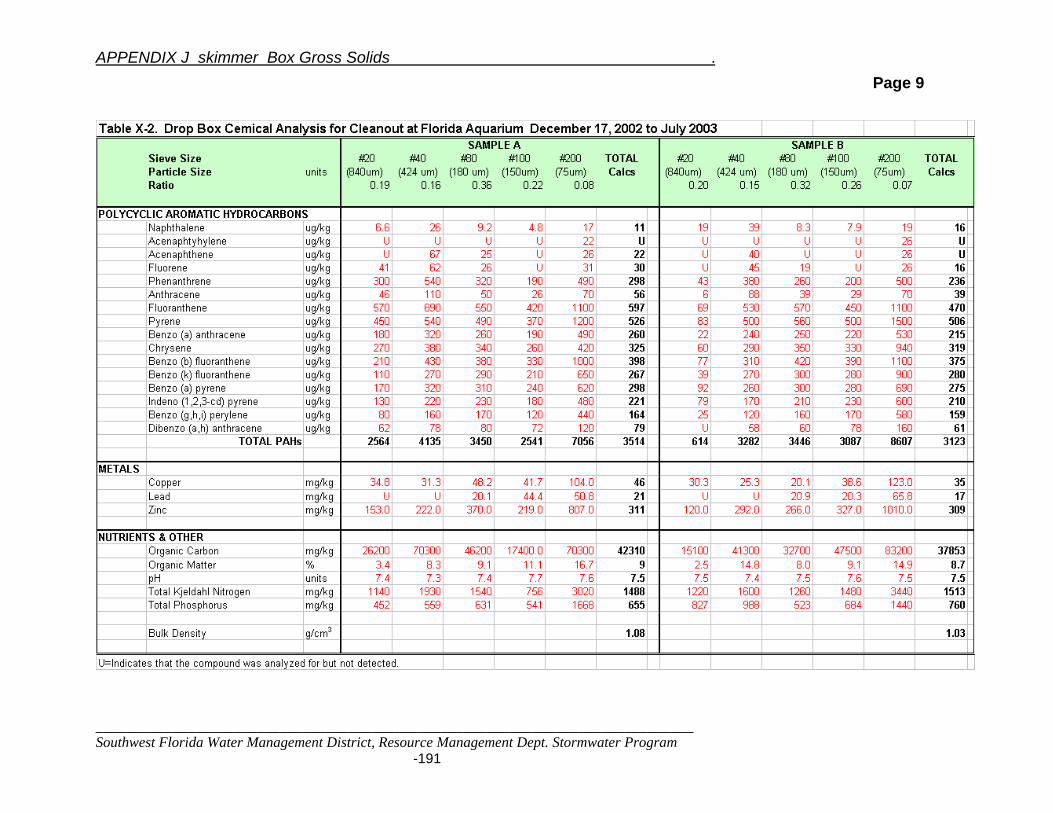
APPENDIX J skimmer Box Gross Solids .
______________________________________________________________________________ Southwest Florida Water Management District, Resource Management Dept. Stormwater Program -191
Page 9
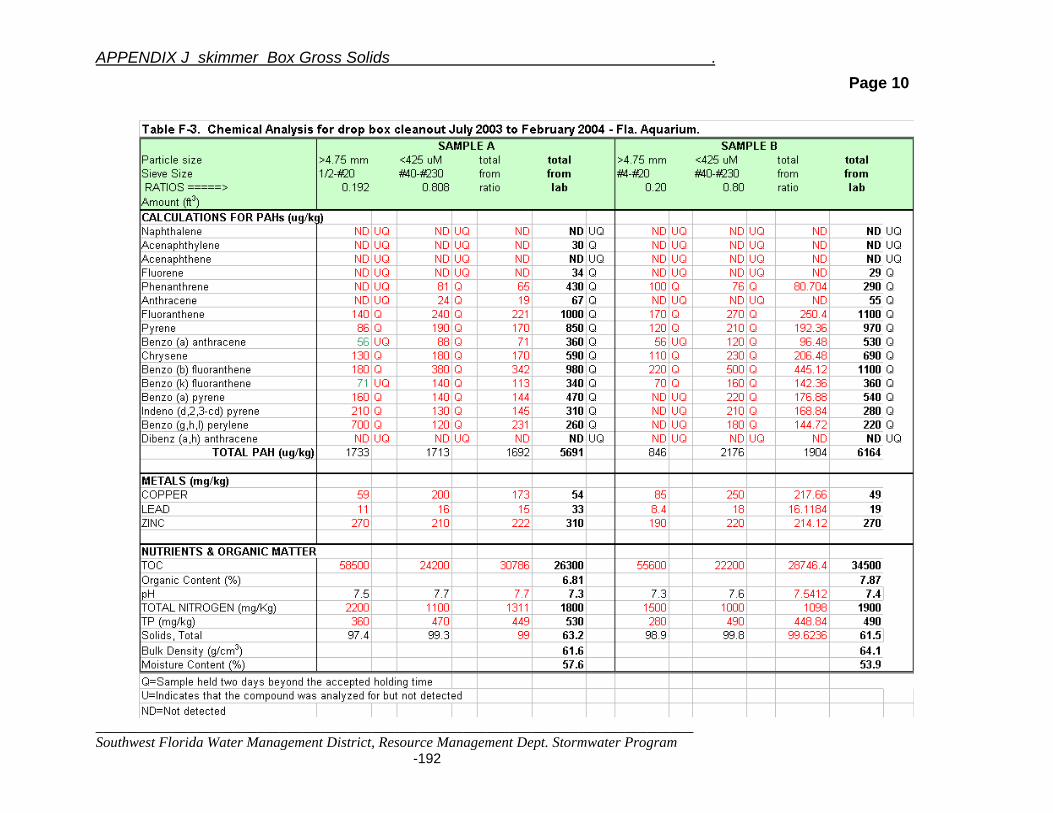
APPENDIX J skimmer Box Gross Solids .
______________________________________________________________________________ Southwest Florida Water Management District, Resource Management Dept. Stormwater Program -192
Page 10
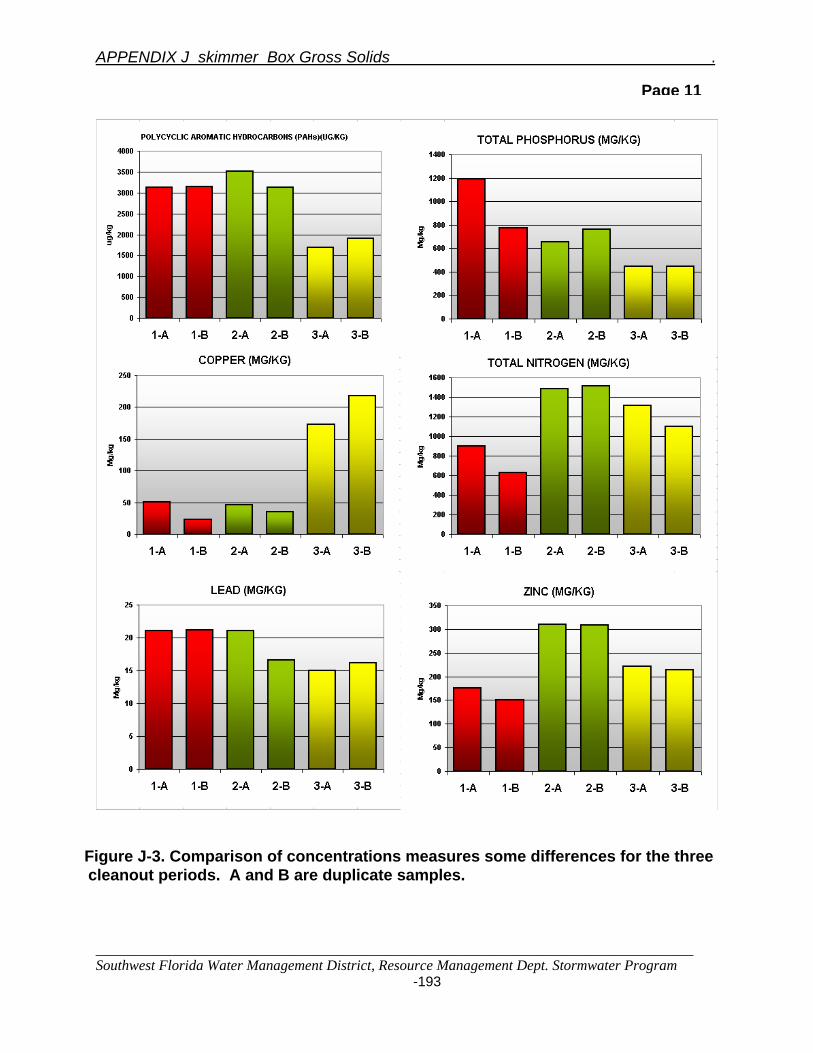
APPENDIX J skimmer Box Gross Solids .
______________________________________________________________________________ Southwest Florida Water Management District, Resource Management Dept. Stormwater Program
-193
Figure J-3. Comparison of concentrations measures some differences for the three cleanout periods. A and B are duplicate samples.
Page 11
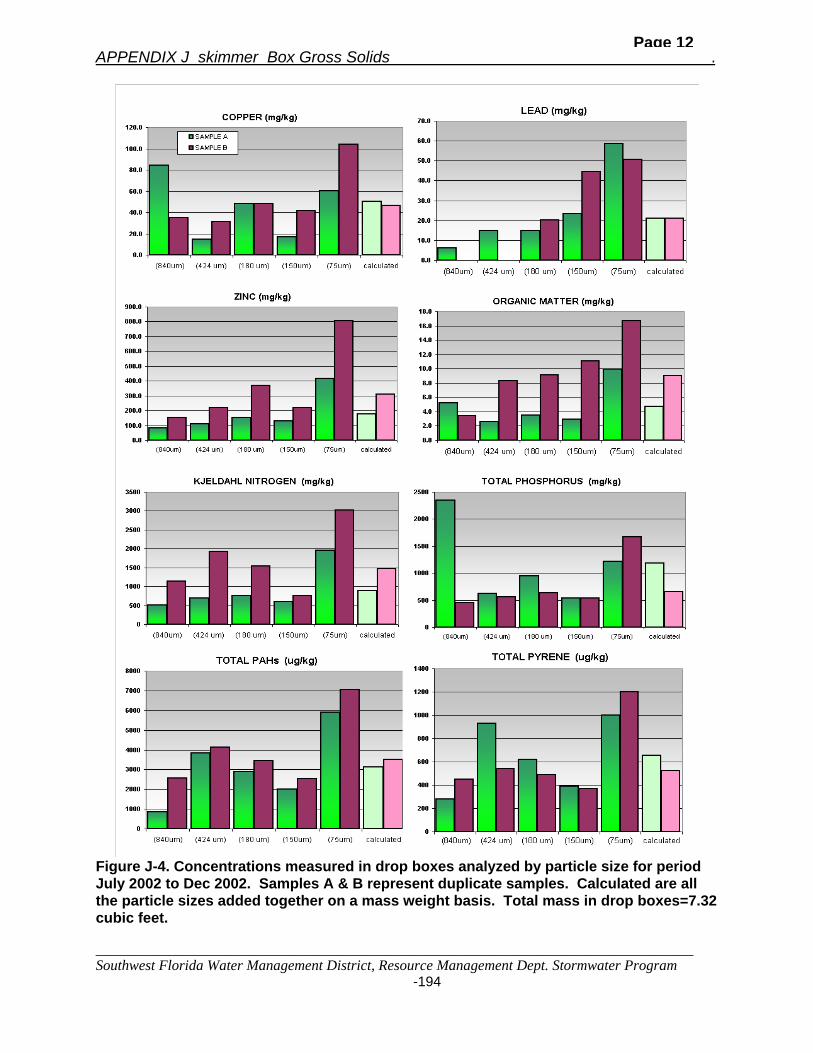
APPENDIX J skimmer Box Gross Solids .
______________________________________________________________________________ Southwest Florida Water Management District, Resource Management Dept. Stormwater Program
-194
Figure J-4. Concentrations measured in drop boxes analyzed by particle size for period July 2002 to Dec 2002. Samples A & B represent duplicate samples. Calculated are all the particle sizes added together on a mass weight basis. Total mass in drop boxes=7.32 cubic feet.
Page 12
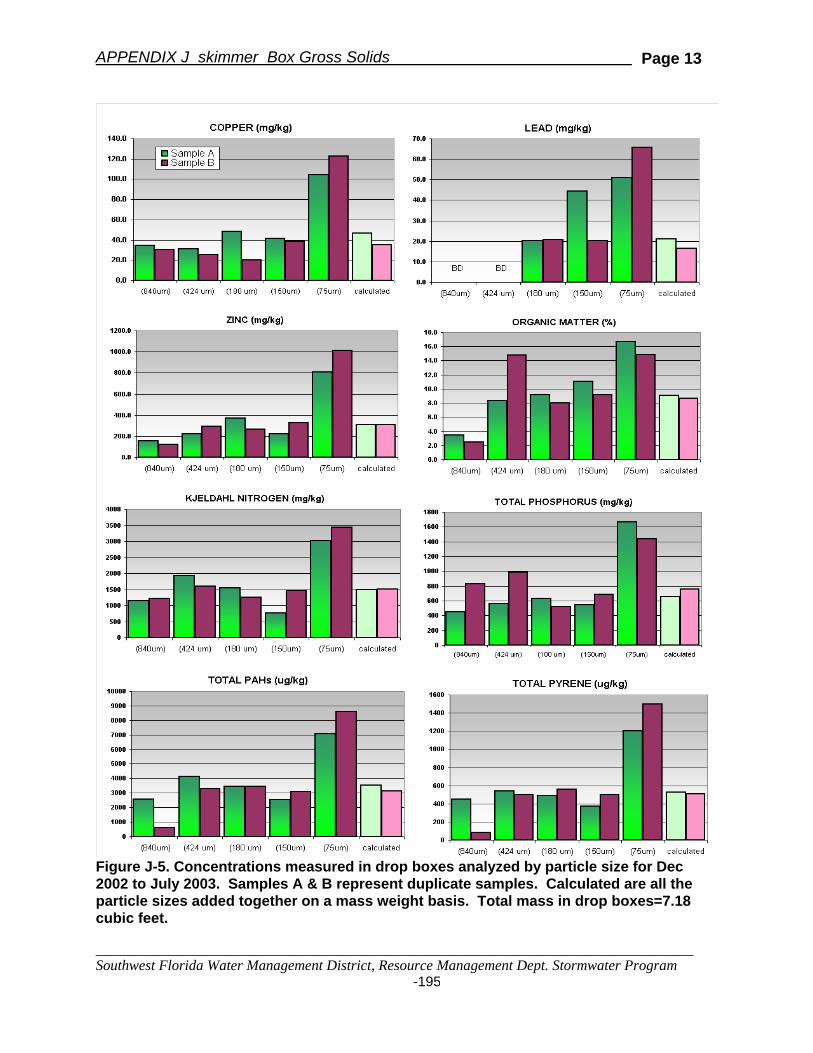
APPENDIX J skimmer Box Gross Solids .
______________________________________________________________________________ Southwest Florida Water Management District, Resource Management Dept. Stormwater Program
-195
Figure J-5. Concentrations measured in drop boxes analyzed by particle size for Dec 2002 to July 2003. Samples A & B represent duplicate samples. Calculated are all the particle sizes added together on a mass weight basis. Total mass in drop boxes=7.18 cubic feet.
Page 13
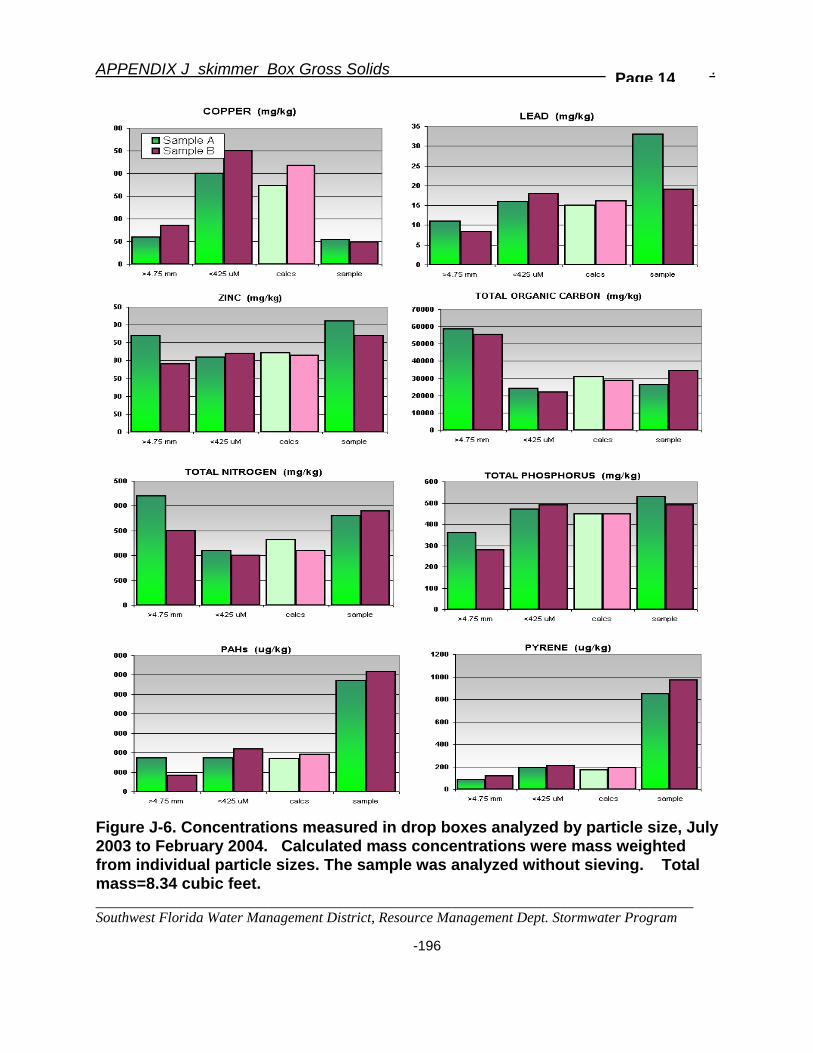
APPENDIX J skimmer Box Gross Solids .
______________________________________________________________________________ Southwest Florida Water Management District, Resource Management Dept. Stormwater Program -196
Figure J-6. Concentrations measured in drop boxes analyzed by particle size, July 2003 to February 2004. Calculated mass concentrations were mass weighted from individual particle sizes. The sample was analyzed without sieving. Total mass=8.34 cubic feet.
Page 14

APPENDIX J skimmer Box Gross Solids .
______________________________________________________________________________ Southwest Florida Water Management District, Resource Management Dept. Stormwater Program -197
COMPARISON OF PAH (SAMPLE A)12 /02
0
200
400
600
800
1000
1200
Acena
phtyh
ylene
Naphth
alene
Fluoren
e
acen
aphth
ene
Anthrac
ene
Benzo
(a) p
yrene
Benzo
(a) a
nthrac
ene
Phena
nthren
e
Fluoran
thene
Benzo
(g,h,
I) pery
lene
Benzo
(k) p
yrene
Chryse
ne
Inden
o (1,2
,3-cd
) pyre
ne
Benzo
(b) fl
uoran
thene
Pyrene
ug/k
g
(840um ) (424 um ) (180 um ) (150um ) (> 75um )
C O M P A R IS O N O F P A H (S A M PL E B )12 /02
0
200
400
600
800
1000
1200
1400
Acena
phtyh
ylene
Naphth
alene
Fluoren
e
Acena
phthe
ne
Anthrac
ene
Dibenz
o (a,h
) anth
racen
e
Benzo
(a) a
nthrac
ene
Benzo
(a) p
yrene
Benzo
(g,h,
I) pery
lene
Inden
o (1,2
,3-cd
) pyre
ne
Phena
nthren
e
Benzo
(k) p
yrene
Fluoran
thene
Chryse
ne
Benzo
(b) fl
uoran
thene
Pyrene
ug/k
g
(8 4 0 u m ) (4 2 4 u m ) (1 8 0 u m ) (1 5 0 u m ) (>7 5 u m )
Figure J-7.. Concentrations of individual Polycyclic Aromatic Hydrocarbons species.
Page 15

APPENDIX J skimmer Box Gross Solids .
______________________________________________________________________________ Southwest Florida Water Management District, Resource Management Dept. Stormwater Program -198
POLYCYCLIC AROMATIC HYDROCARBONS (SAMPLE A)7/23/03
0
200400
600
800
10001200
1400
1600
Naphthale
ne
Acenap
htyhyle
ne
Acenap
hthene
Fluorene
Anthracen
e
Dibenzo
(a,h) a
nthracen
e
Chrysen
e
Benzo
(g,h,i)
perylen
e
Indeno (1
,2,3-c
d) pyre
ne
Phenan
threne
Benzo
(a) a
nthracen
e
Benzo
(a) p
yrene
Benzo
(k) fl
uoranthen
e
Benzo
(b) fl
uoranthen
e
Fluoranthen
e
Pyrene
MIC
RO
NS
>840 um424 um180 um150 um<75 um
POLYCYCLIC AROMATIC HYDROCARBONS (SAMPLE B)7/23/03
0
200
400
600
800
1000
1200
1400
1600
Naphthale
ne
Acenap
htyhyle
ne
Acenap
hthene
Fluorene
Anthracen
e
Dibenzo
(a,h) a
nthracen
e
Chrysen
e
Benzo
(g,h,i)
perylen
e
Indeno (1
,2,3-c
d) pyre
ne
Phenan
threne
Benzo
(a) a
nthracen
e
Benzo
(a) p
yrene
Benzo
(k) fl
uoranthen
e
Benzo
(b) fl
uoranthen
e
Fluoranthen
e
Pyrene
MIC
RO
NS
>840 um424 um180 um150 um<75 um
Figure J-8. Concentration of individual PAHs by particle size.
Page 16
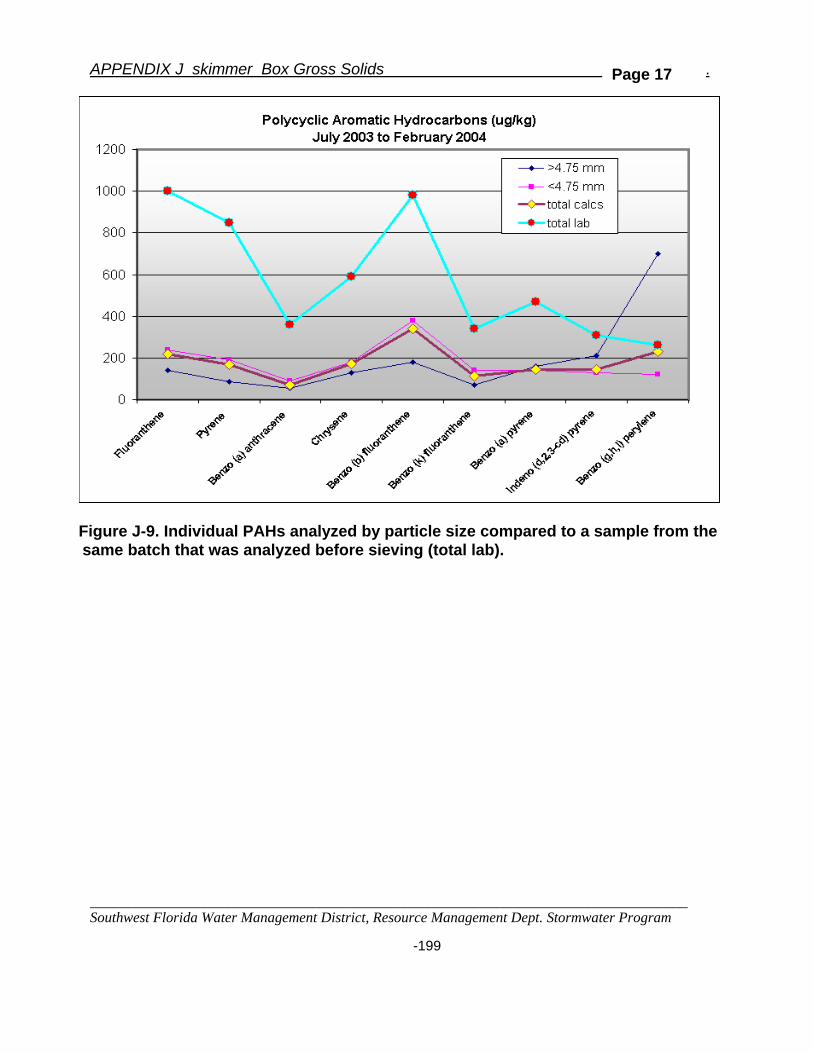
APPENDIX J skimmer Box Gross Solids .
______________________________________________________________________________ Southwest Florida Water Management District, Resource Management Dept. Stormwater Program -199
Figure J-9. Individual PAHs analyzed by particle size compared to a sample from the same batch that was analyzed before sieving (total lab).
Page 17


APPENDIX K Skimmer Box Water Quality .
______________________________________________________________________________ Southwest Florida Water Management District, Resource Management Dept. Stormwater Program -201
APPENDIX K
Water Quality measured in the bottom of drop boxes Includes data before installation and for two clean out periods

APPENDIX K Skimmer Box Water Quality .
______________________________________________________________________________ Southwest Florida Water Management District, Resource Management Dept. Stormwater Program -202
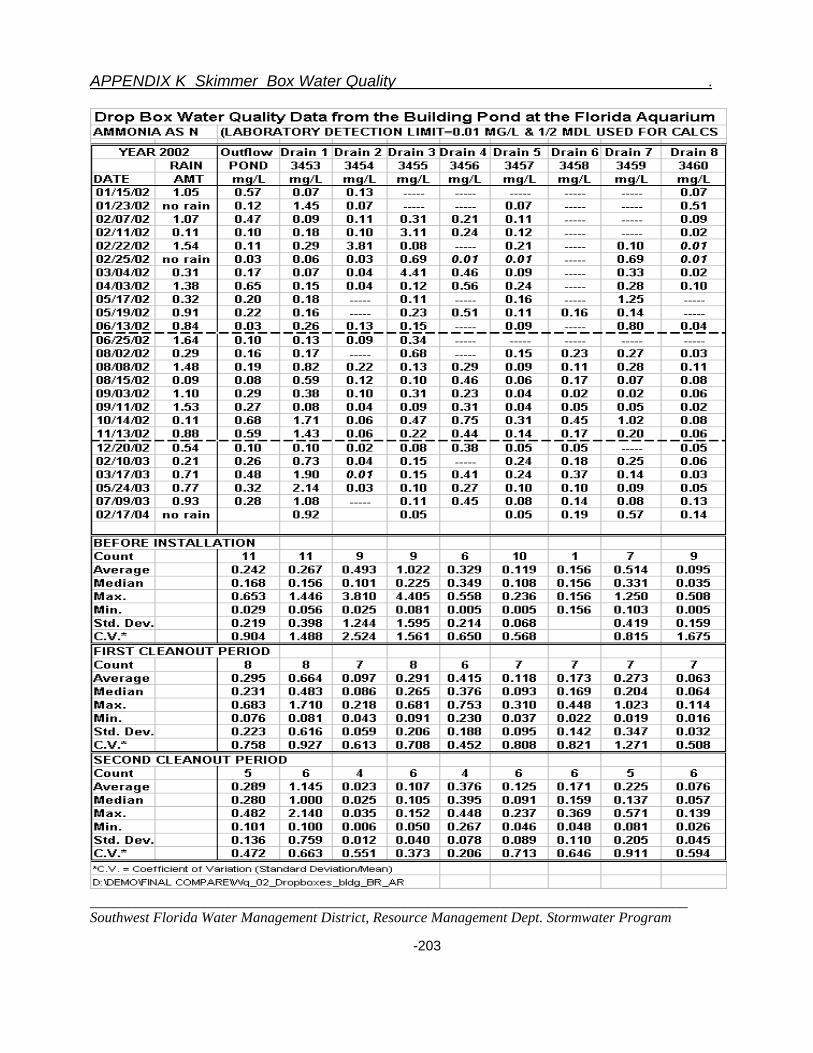
APPENDIX K Skimmer Box Water Quality .
______________________________________________________________________________ Southwest Florida Water Management District, Resource Management Dept. Stormwater Program -203
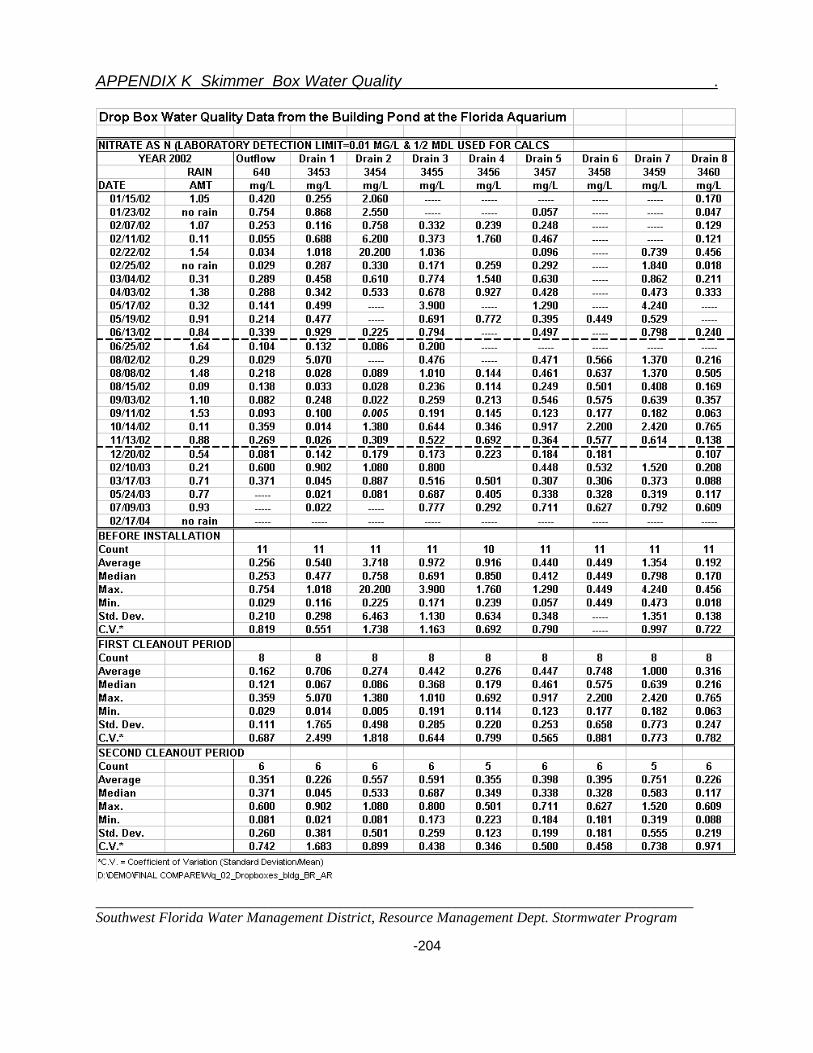
APPENDIX K Skimmer Box Water Quality .
______________________________________________________________________________ Southwest Florida Water Management District, Resource Management Dept. Stormwater Program -204
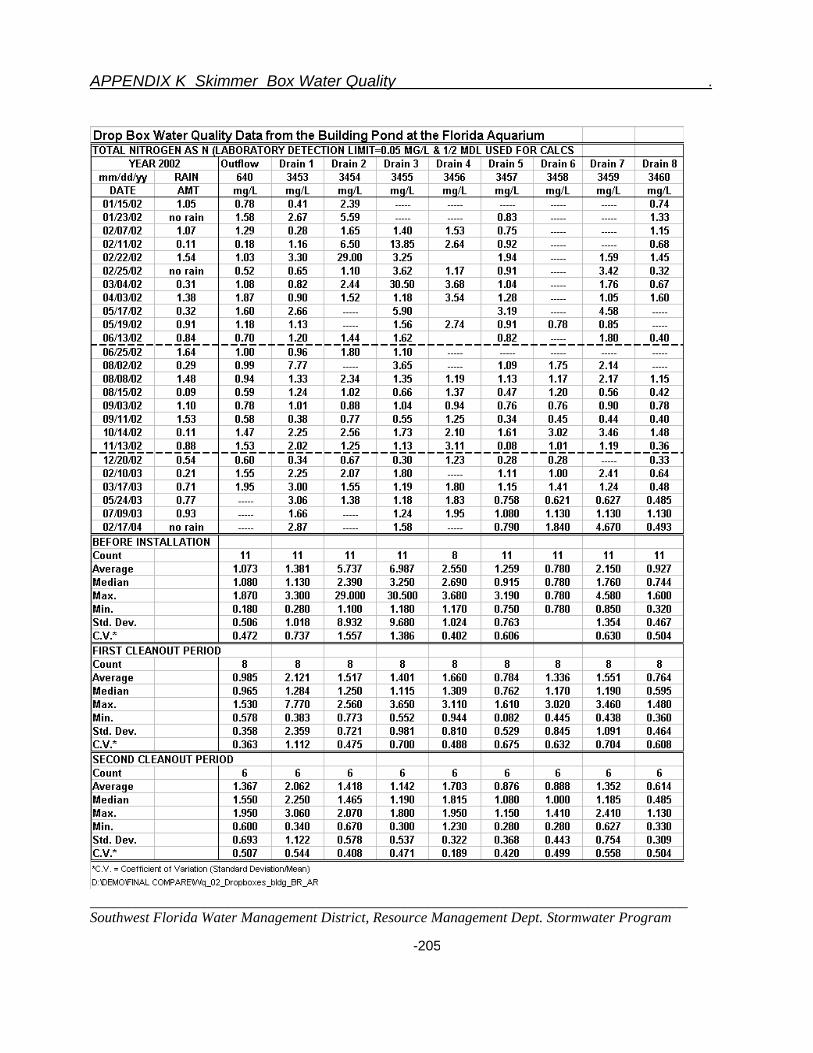
APPENDIX K Skimmer Box Water Quality .
______________________________________________________________________________ Southwest Florida Water Management District, Resource Management Dept. Stormwater Program -205
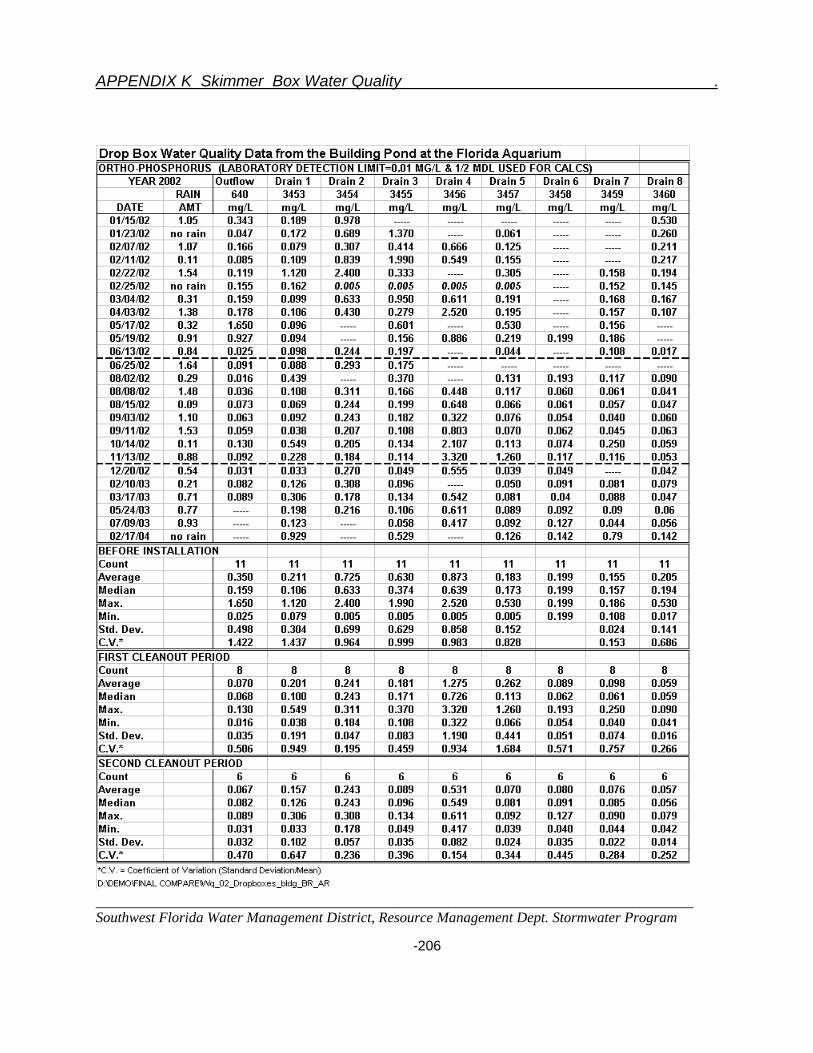
APPENDIX K Skimmer Box Water Quality .
______________________________________________________________________________ Southwest Florida Water Management District, Resource Management Dept. Stormwater Program -206
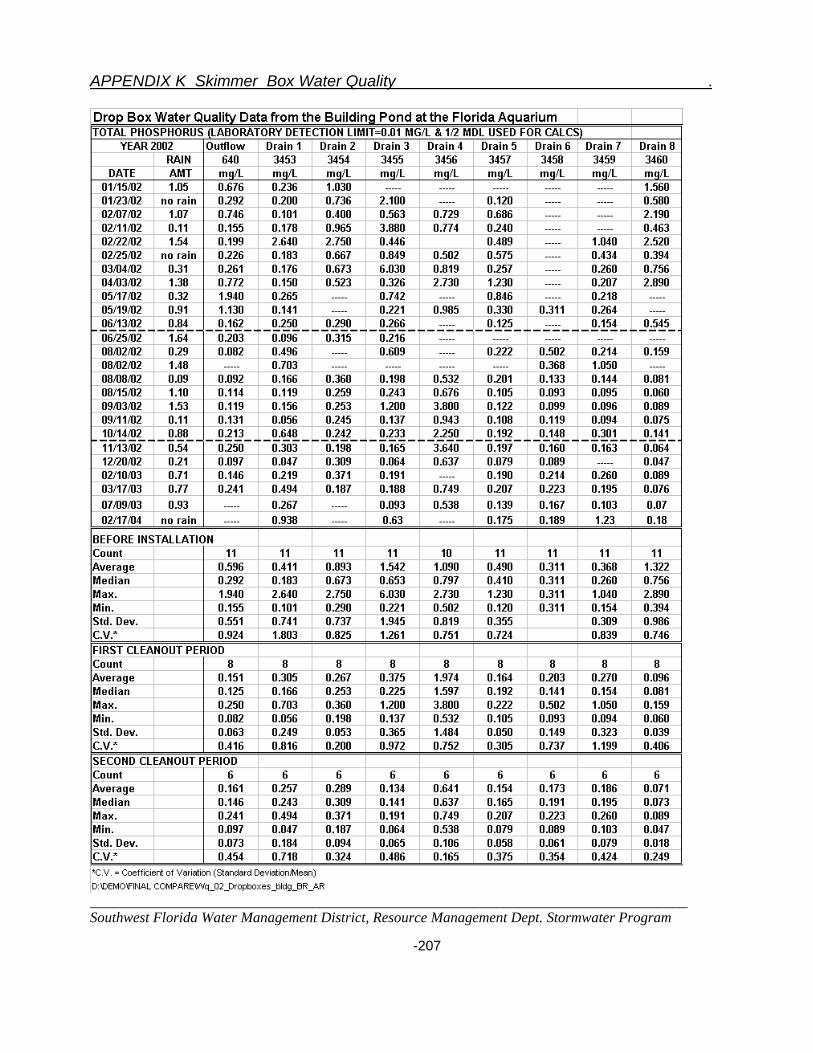
APPENDIX K Skimmer Box Water Quality .
______________________________________________________________________________ Southwest Florida Water Management District, Resource Management Dept. Stormwater Program -207

APPENDIX K Skimmer Box Water Quality .
______________________________________________________________________________ Southwest Florida Water Management District, Resource Management Dept. Stormwater Program -208
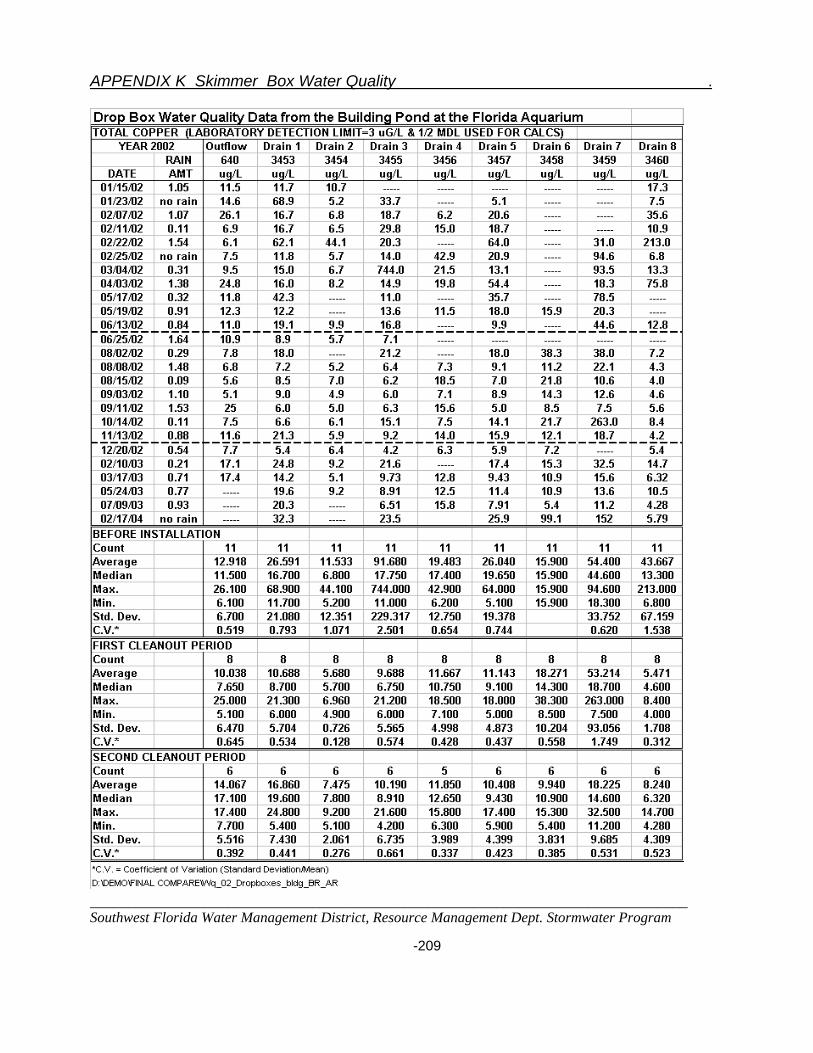
APPENDIX K Skimmer Box Water Quality .
______________________________________________________________________________ Southwest Florida Water Management District, Resource Management Dept. Stormwater Program -209
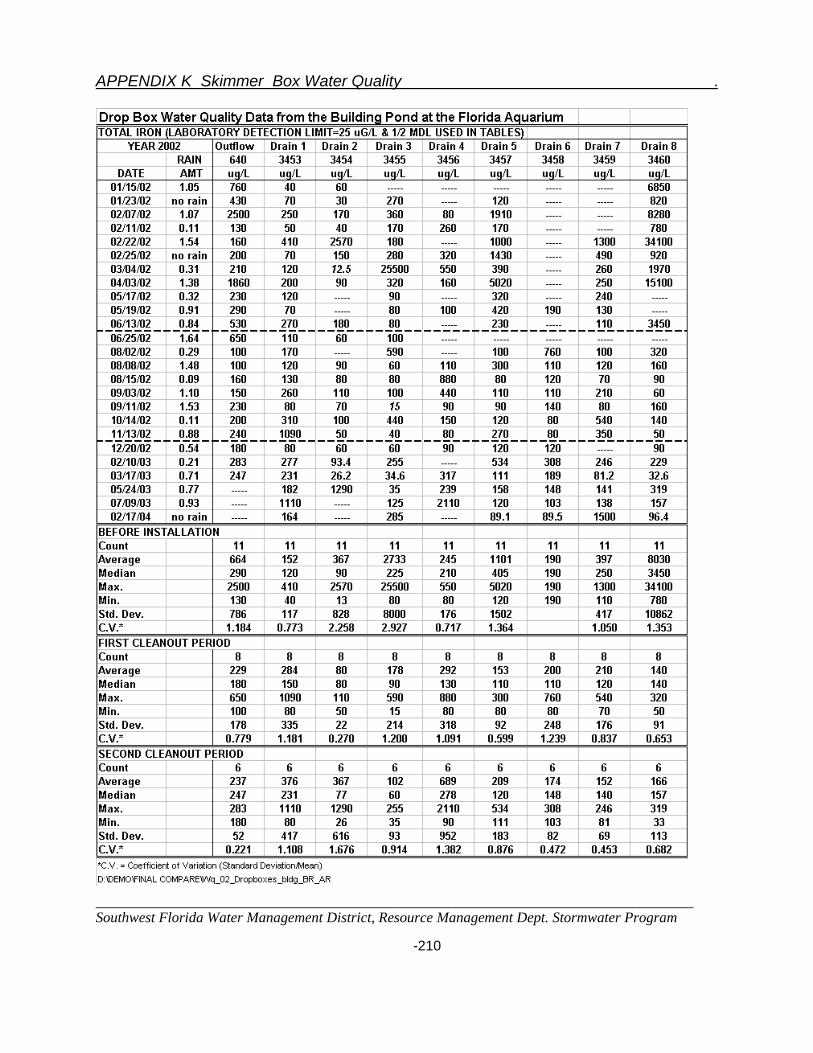
APPENDIX K Skimmer Box Water Quality .
______________________________________________________________________________ Southwest Florida Water Management District, Resource Management Dept. Stormwater Program -210

APPENDIX K Skimmer Box Water Quality .
______________________________________________________________________________ Southwest Florida Water Management District, Resource Management Dept. Stormwater Program -211
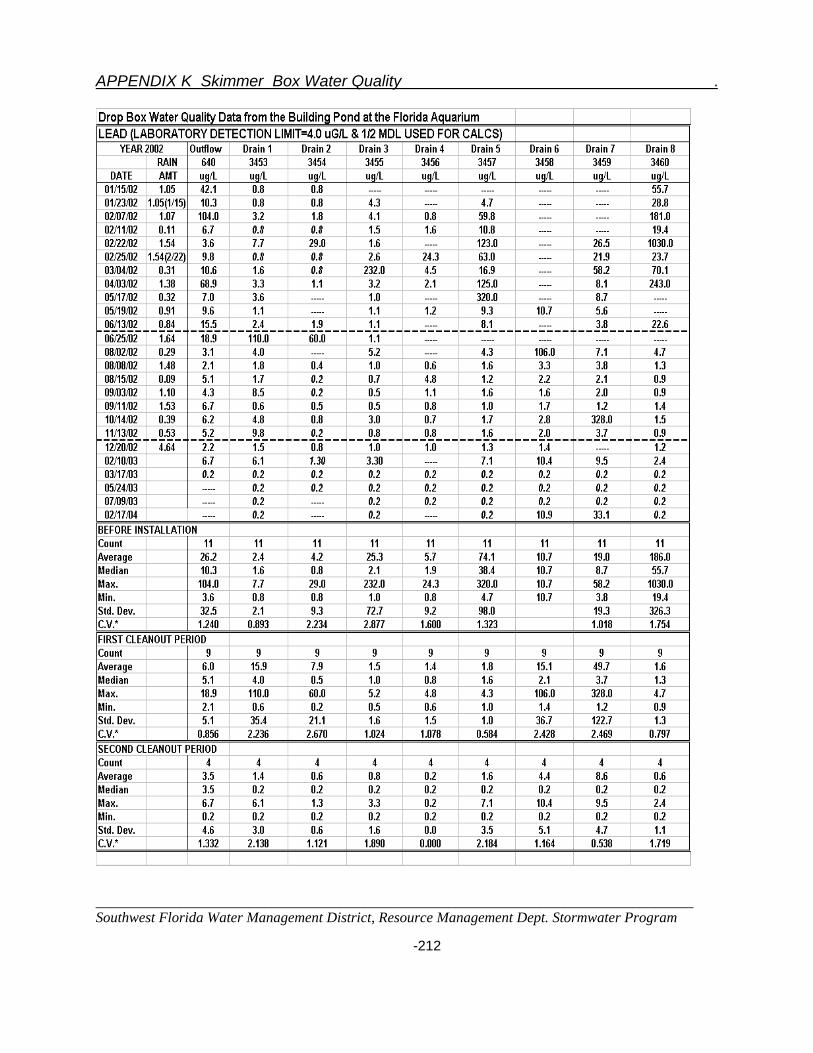
APPENDIX K Skimmer Box Water Quality .
______________________________________________________________________________ Southwest Florida Water Management District, Resource Management Dept. Stormwater Program -212

APPENDIX L "living Soils" .
______________________________________________________________________________ Southwest Florida Water Management District, Resource Management Dept. Stormwater Program -213
APPENDIX L
BIOCULTURE – "LIVING SOILS "
Quattro pro: WQ3POND2.WB2new.wb2
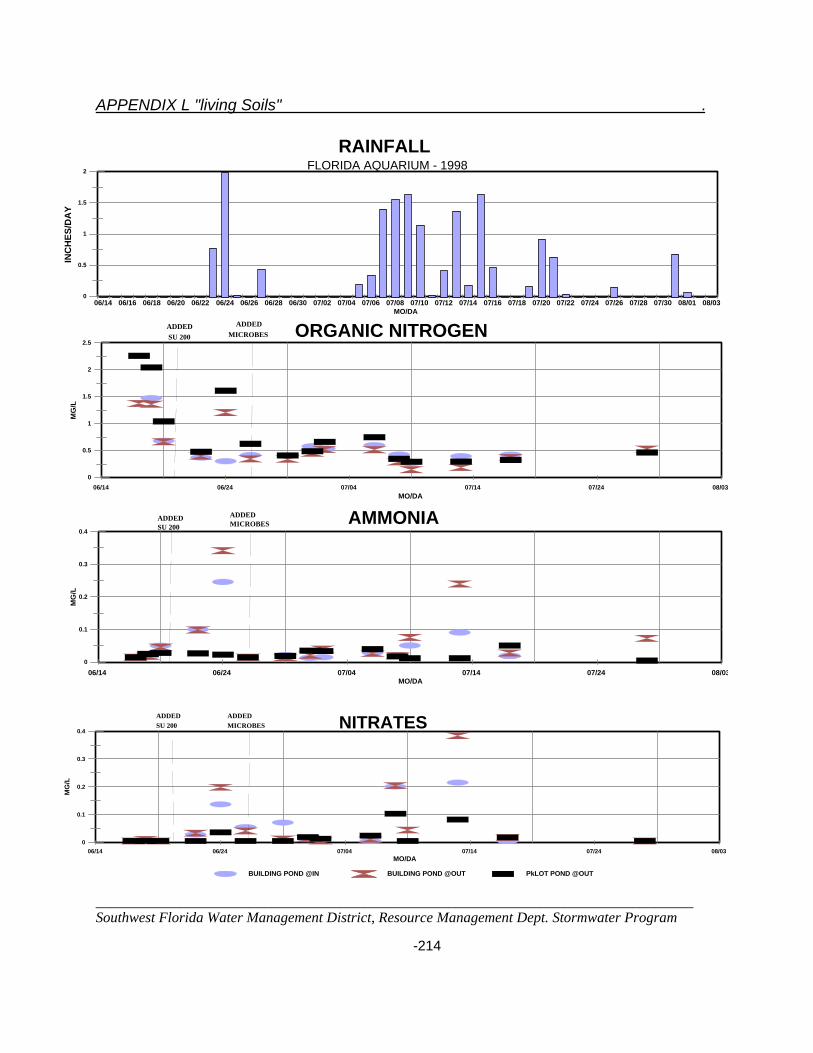
APPENDIX L "living Soils" .
______________________________________________________________________________ Southwest Florida Water Management District, Resource Management Dept. Stormwater Program -214
0
0.5
1
1.5
2
INC
HES
/DA
Y
06/14 06/16 06/18 06/20 06/22 06/24 06/26 06/28 06/30 07/02 07/04 07/06 07/08 07/10 07/12 07/14 07/16 07/18 07/20 07/22 07/24 07/26 07/28 07/30 08/01 08/03MO/DA
RAINFALLFLORIDA AQUARIUM - 1998
0
0.5
1
1.5
2
2.5
MG
/L
06/14 06/24 07/04 07/14 07/24 08/03 MO/DA
ORGANIC NITROGENADDEDSU 200
ADDEDMICROBES
0
0.1
0.2
0.3
0.4
MG
/L
06/14 06/24 07/04 07/14 07/24 08/03MO/DA
AMMONIAADDEDSU 200
ADDEDMICROBES
0
0.1
0.2
0.3
0.4
MG
/L
06/14 06/24 07/04 07/14 07/24 08/03 MO/DA
BUILDING POND @IN BUILDING POND @OUT PkLOT POND @OUT
NITRATESADDEDMICROBES
ADDEDSU 200

APPENDIX L "living Soils" .
______________________________________________________________________________ Southwest Florida Water Management District, Resource Management Dept. Stormwater Program -215
0
0.5
1
1.5
2
INC
HES
/DA
Y
06/14 06/16 06/18 06/20 06/22 06/24 06/26 06/28 06/30 07/02 07/04 07/06 07/08 07/10 07/12 07/14 07/16 07/18 07/20 07/22 07/24 07/26 07/28 07/30 08/01 08/03MO/DA
RAINFALLFLORIDA AQUARIUM - 1998
0
0.1
0.2
0.3
0.4
0.5
MG
/L
06/14 06/24 07/04 07/14 07/24 08/03MO/DA
TOTAL PHOSPHORUSADDEDSU 200
ADDEDMICROBE
0
0.05
0.1
0.15
0.2
0.25
0.3
MG
/L
06/14 06/24 07/04 07/14 07/24 08/03 MO/DA
ORTHO-PHOSPHORUSADDEDSU 200
ADDEDMICROBES
0
10
20
30
40
50
60
70
80
uG/L
06/14 06/24 07/04 07/14 07/24 08/03MO/DABUILDING POND @IN BUILDING POND @OUT PkLOT POND @OUT
TOTAL COPPERADDEDSU 200
ADDEDMICROBES
APPENDIX L "living Soils" .
______________________________________________________________________________ Southwest Florida Water Management District, Resource Management Dept. Stormwater Program -216

APPENDIX M "Healthy Pond"
______________________________________________________________________________ Southwest Florida Water Management District, Resource Management Dept. Stormwater Program -217
APPENDIX M
BIOCULTURES – "HEALTHY POND"
D:\DEMO\FINAL COMPARE\Wqyr2conc2\nutrient study

APPENDIX M "Healthy Pond"
______________________________________________________________________________ Southwest Florida Water Management District, Resource Management Dept. Stormwater Program -218
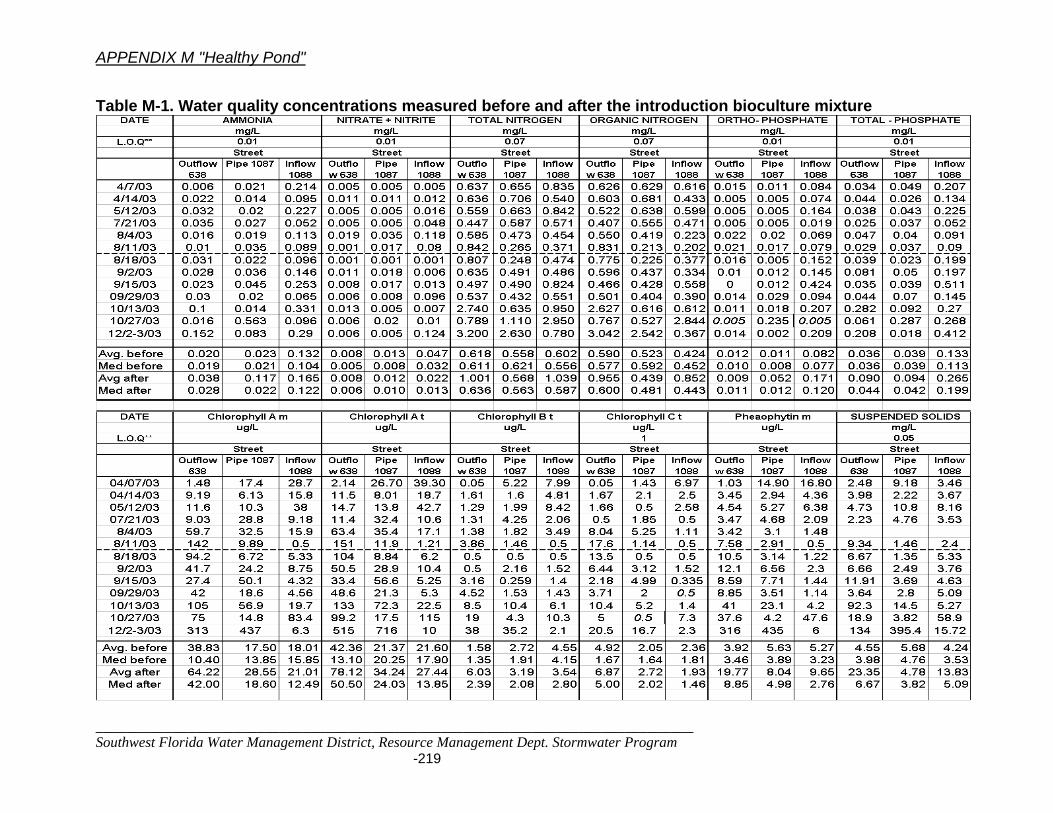
APPENDIX M "Healthy Pond"
______________________________________________________________________________ Southwest Florida Water Management District, Resource Management Dept. Stormwater Program -219
Table M-1. Water quality concentrations measured before and after the introduction bioculture mixture
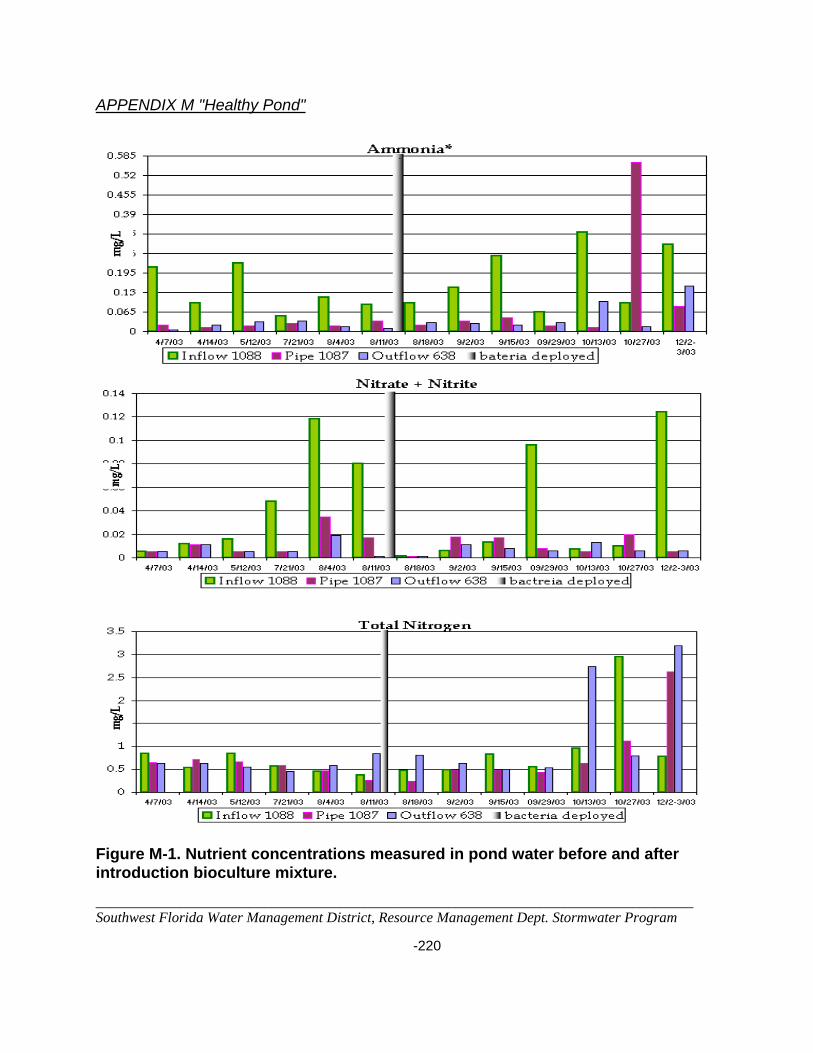
APPENDIX M "Healthy Pond"
______________________________________________________________________________ Southwest Florida Water Management District, Resource Management Dept. Stormwater Program -220
Figure M-1. Nutrient concentrations measured in pond water before and after introduction bioculture mixture.
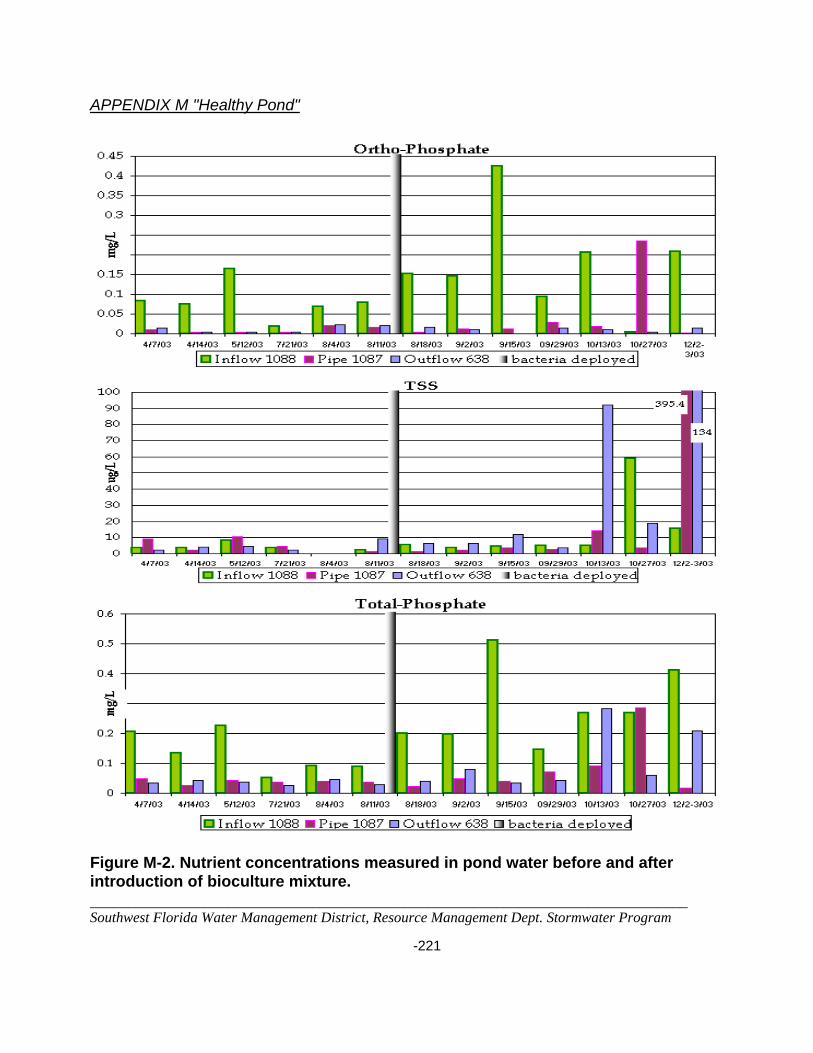
APPENDIX M "Healthy Pond"
______________________________________________________________________________ Southwest Florida Water Management District, Resource Management Dept. Stormwater Program -221
Figure M-2. Nutrient concentrations measured in pond water before and after introduction of bioculture mixture.
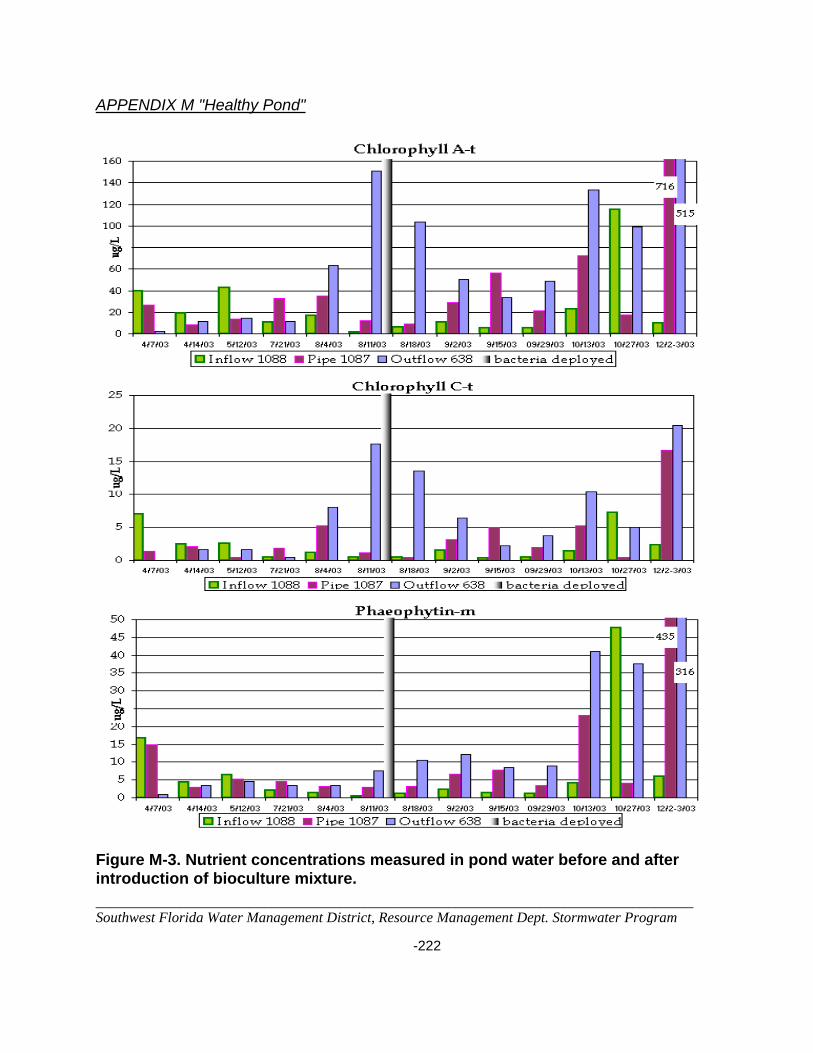
APPENDIX M "Healthy Pond"
______________________________________________________________________________ Southwest Florida Water Management District, Resource Management Dept. Stormwater Program -222
Figure M-3. Nutrient concentrations measured in pond water before and after introduction of bioculture mixture.

APPENDIX M "Healthy Pond"
______________________________________________________________________________ Southwest Florida Water Management District, Resource Management Dept. Stormwater Program -223
APPENDIX N
PICTURES OF THE SITE
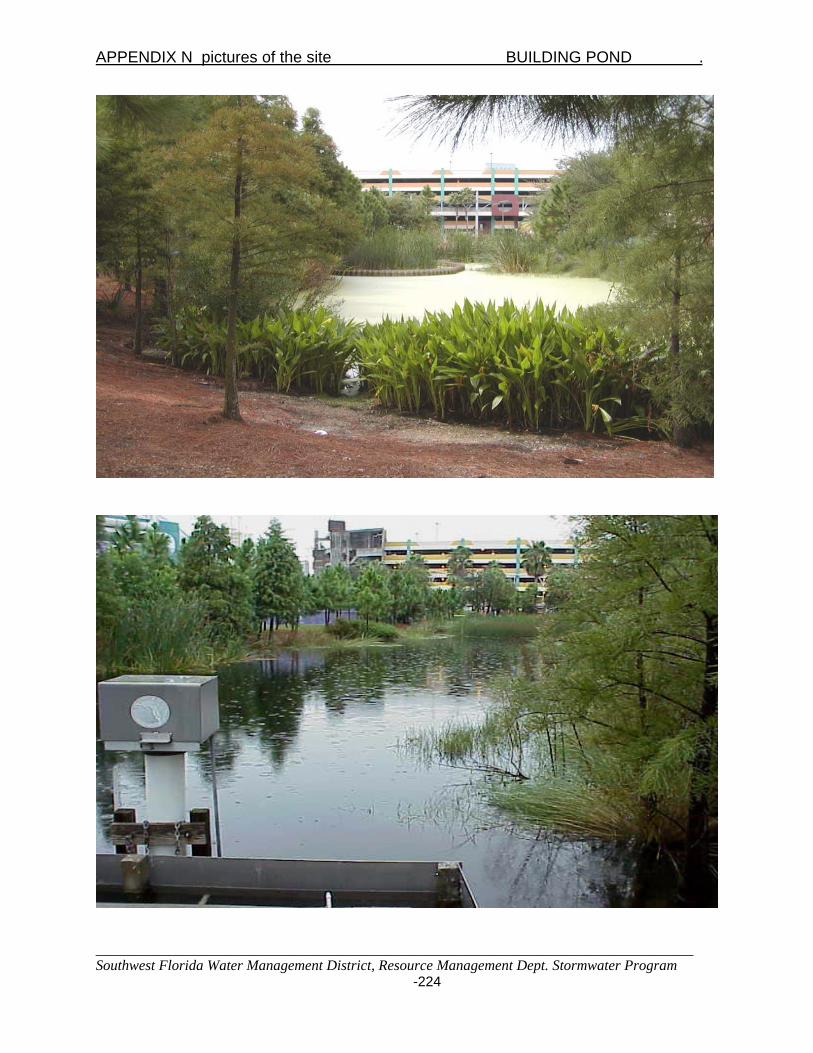
APPENDIX N pictures of the site BUILDING POND .
______________________________________________________________________________ Southwest Florida Water Management District, Resource Management Dept. Stormwater Program
-224
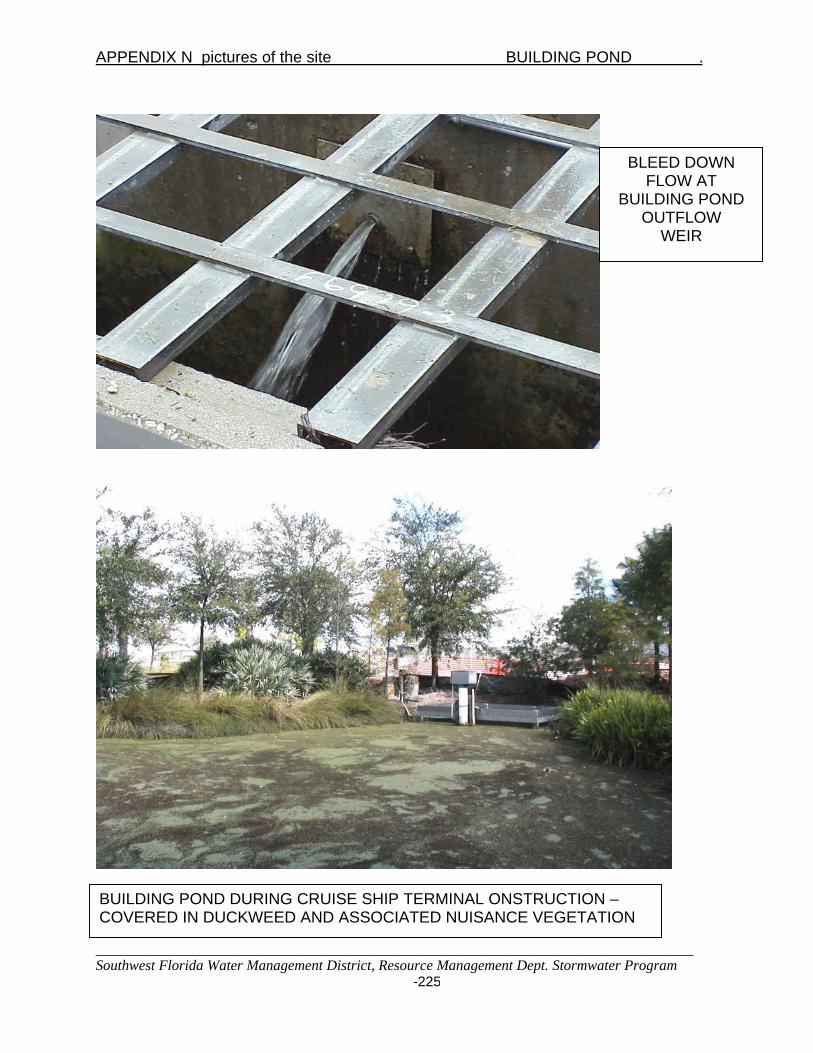
APPENDIX N pictures of the site BUILDING POND .
______________________________________________________________________________ Southwest Florida Water Management District, Resource Management Dept. Stormwater Program
-225
BLEED DOWN FLOW AT
BUILDING POND OUTFLOW
WEIR
BUILDING POND DURING CRUISE SHIP TERMINAL ONSTRUCTION – COVERED IN DUCKWEED AND ASSOCIATED NUISANCE VEGETATION
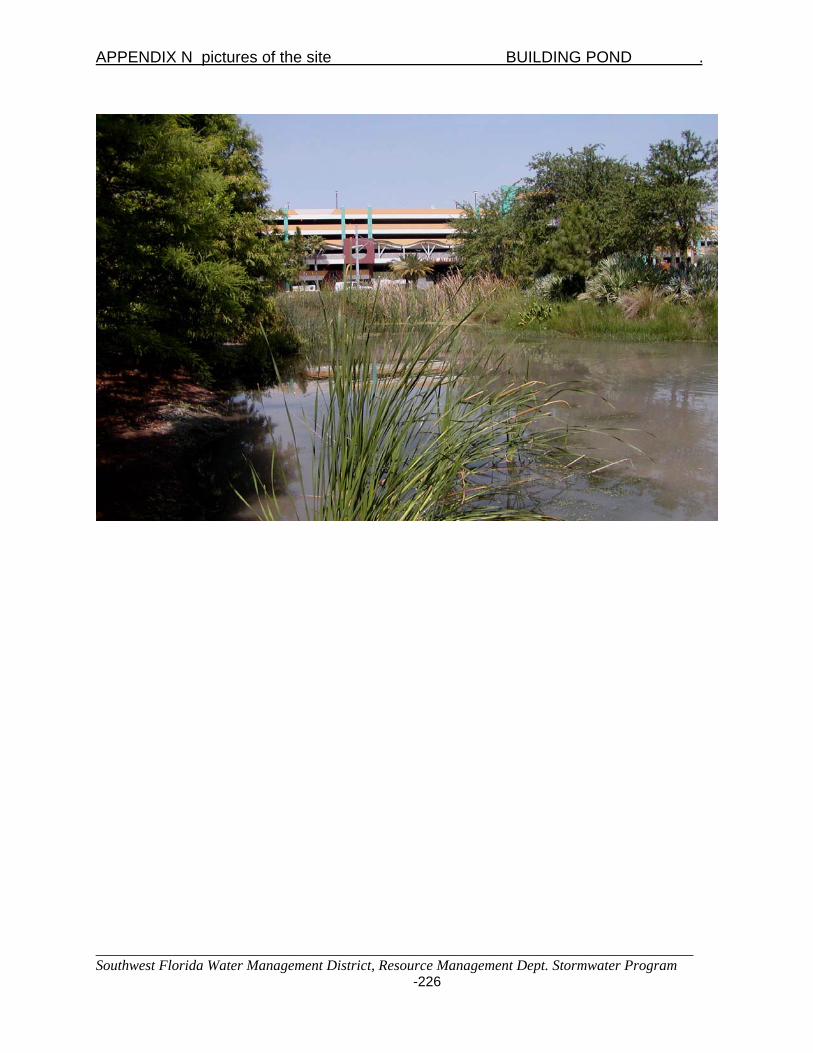
APPENDIX N pictures of the site BUILDING POND .
______________________________________________________________________________ Southwest Florida Water Management District, Resource Management Dept. Stormwater Program
-226
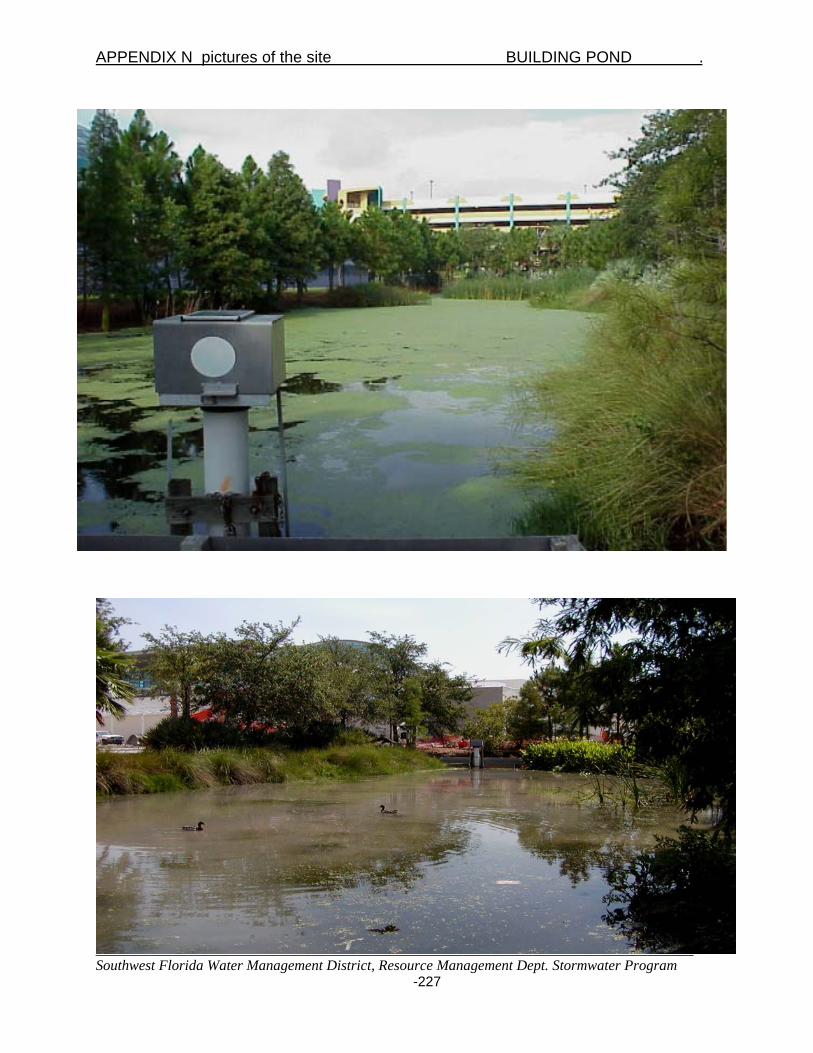
APPENDIX N pictures of the site BUILDING POND .
______________________________________________________________________________ Southwest Florida Water Management District, Resource Management Dept. Stormwater Program
-227

APPENDIX N pictures of the site STREET POND .
______________________________________________________________________________ Southwest Florida Water Management District, Resource Management Dept. Stormwater Program
-228
STREET POND INFLOW INSTRUMENT SHELTER WITH PROJECT PERSONNEL COLLECTING STORM SAMPLES
INFLOW TO STREET POND DURING TROLLEY CONSTRUCTION SHOWING INSTRUMENT SHELTER AND SEDIMENTATION BASIN
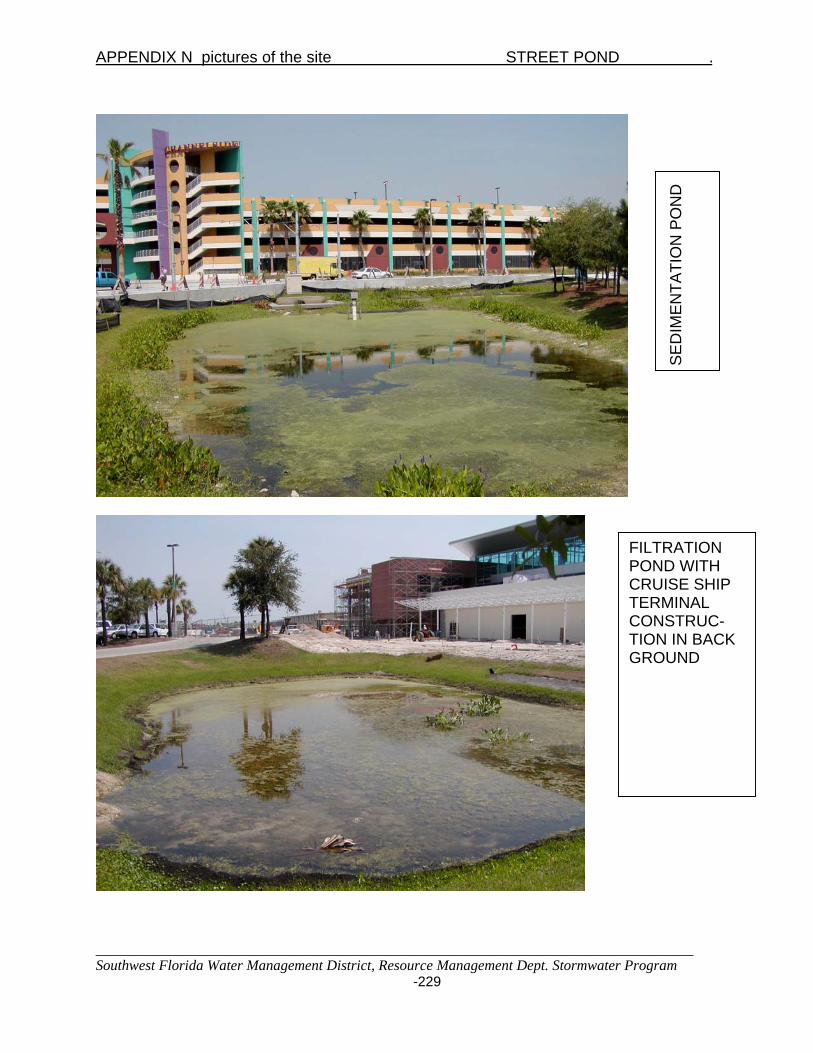
APPENDIX N pictures of the site STREET POND .
______________________________________________________________________________ Southwest Florida Water Management District, Resource Management Dept. Stormwater Program
-229
SE
DIM
EN
TATI
ON
PO
ND
FILTRATION POND WITH CRUISE SHIP TERMINAL CONSTRUC-TION IN BACK GROUND
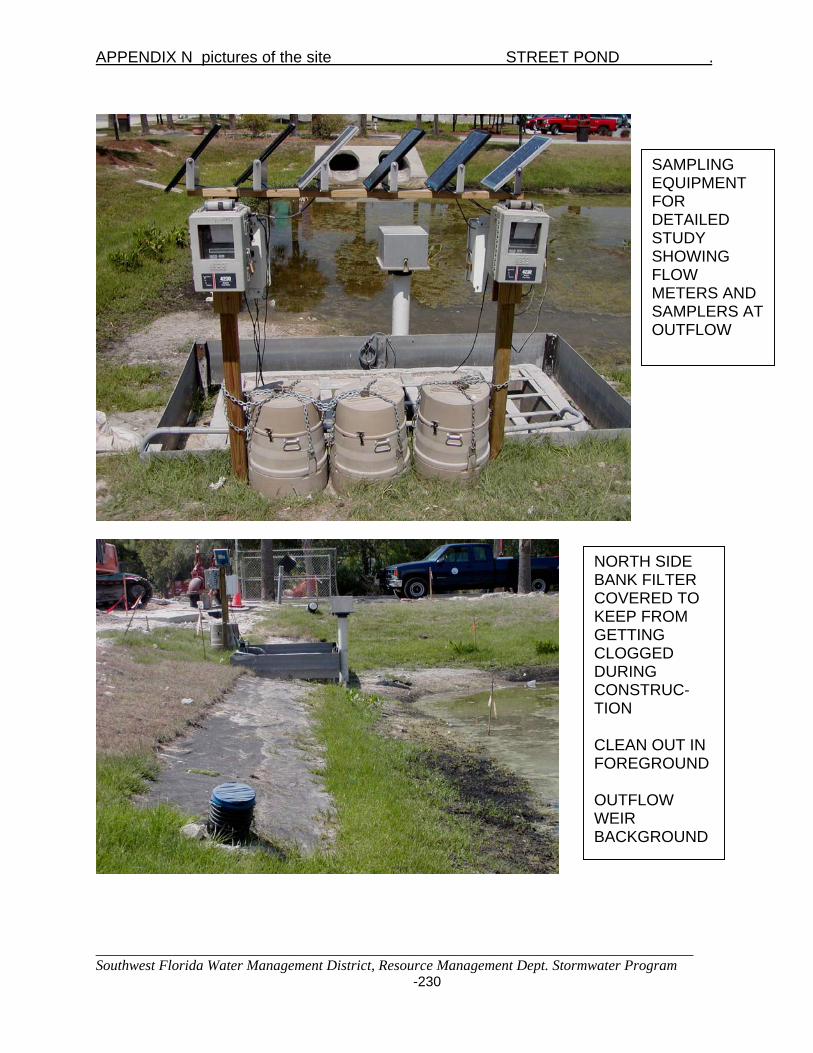
APPENDIX N pictures of the site STREET POND .
______________________________________________________________________________ Southwest Florida Water Management District, Resource Management Dept. Stormwater Program
-230
SAMPLING EQUIPMENT FOR DETAILED STUDY SHOWING FLOW METERS AND SAMPLERS AT OUTFLOW
NORTH SIDE BANK FILTER COVERED TO KEEP FROM GETTING CLOGGED DURING CONSTRUC-TION CLEAN OUT IN FOREGROUND OUTFLOW WEIR BACKGROUND
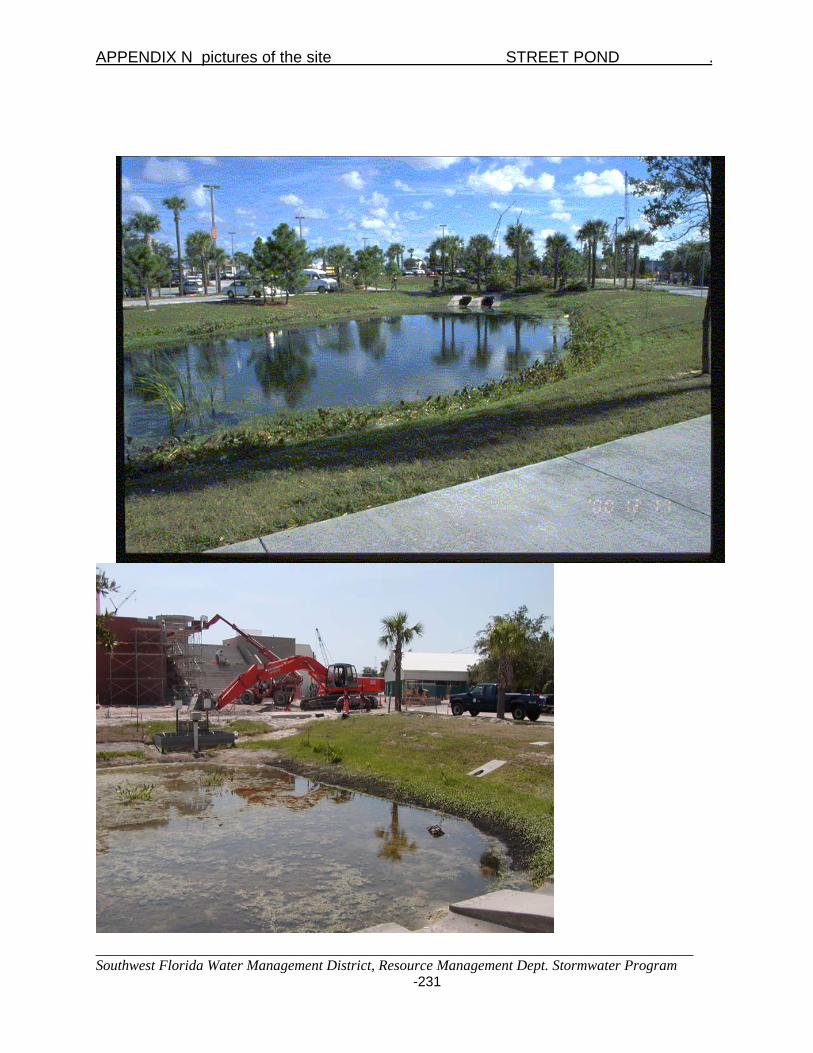
APPENDIX N pictures of the site STREET POND .
______________________________________________________________________________ Southwest Florida Water Management District, Resource Management Dept. Stormwater Program
-231

APPENDIX N pictures of the site STREET POND .
______________________________________________________________________________ Southwest Florida Water Management District, Resource Management Dept. Stormwater Program
-232
UNDER DRAIN PIPE WITH THELMAR WEIR MEASURING DEVICE
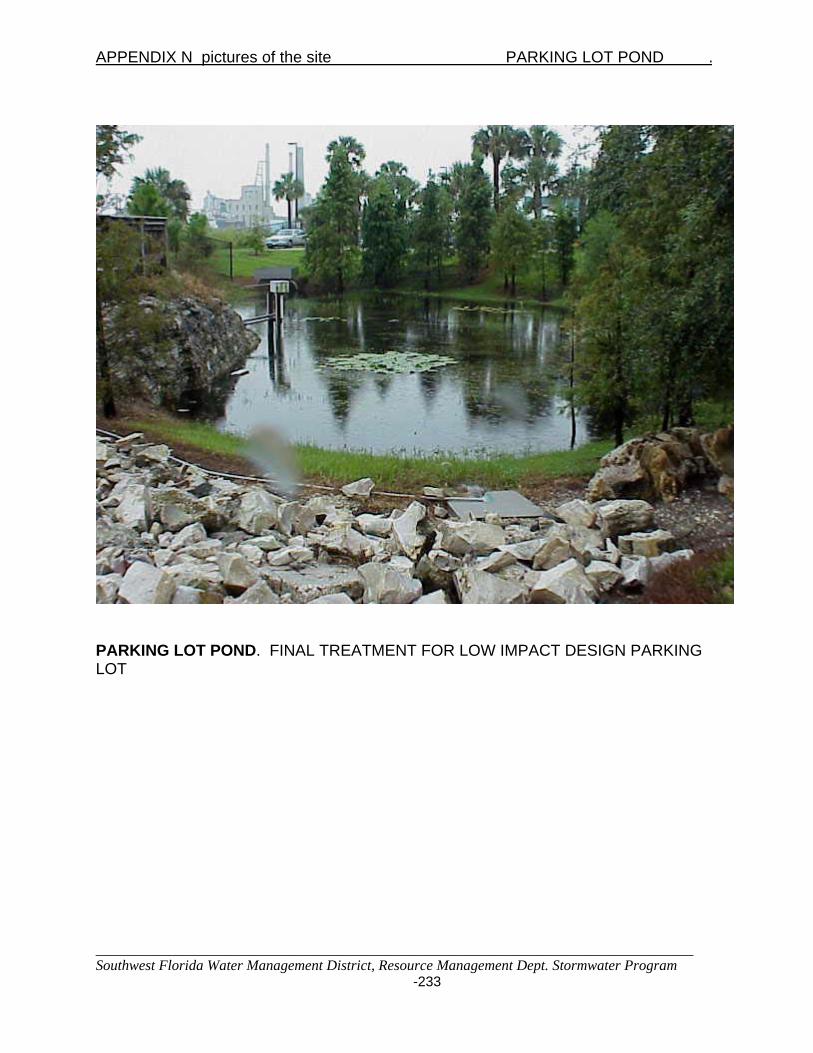
APPENDIX N pictures of the site PARKING LOT POND .
______________________________________________________________________________ Southwest Florida Water Management District, Resource Management Dept. Stormwater Program
-233
PARKING LOT POND. FINAL TREATMENT FOR LOW IMPACT DESIGN PARKING LOT
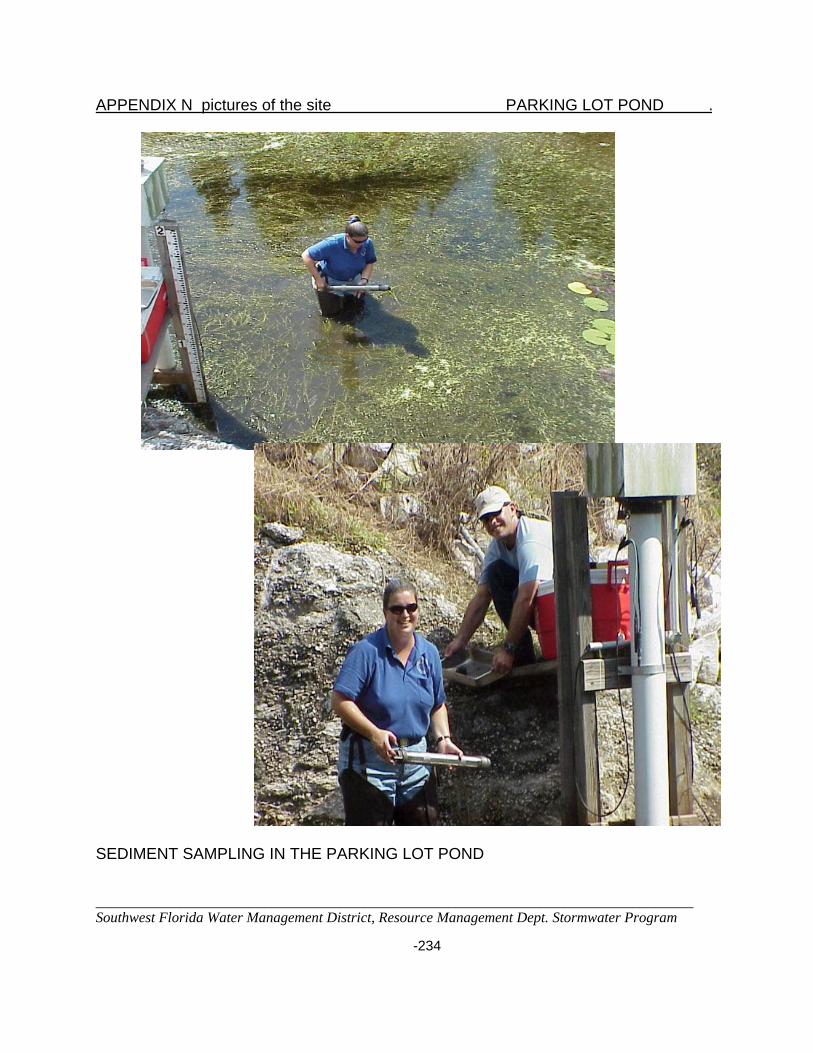
APPENDIX N pictures of the site PARKING LOT POND .
______________________________________________________________________________ Southwest Florida Water Management District, Resource Management Dept. Stormwater Program -234
SEDIMENT SAMPLING IN THE PARKING LOT POND
APPENDIX N pictures of the site PARKING LOT POND .
______________________________________________________________________________ Southwest Florida Water Management District, Resource Management Dept. Stormwater Program -235
APPENDIX N pictures of the site PARKING LOT POND .
______________________________________________________________________________ Southwest Florida Water Management District, Resource Management Dept. Stormwater Program -236