Embed Size (px)
Citation preview

1
ISABE-2015-20006
CHARACTERIZATION OF TIP LEAKAGE FLOW TRAJECTORIES IN A MULTISTAGE
COMPRESSOR USING TIME-RESOLVED OVER-ROTOR STATIC PRESSURES
Reid A. Berdanier and Nicole L. Key
Purdue University
West Lafayette, Indiana 47907 USA
Abstract
Fast-response pressure measurements collected
in a three-stage axial compressor highlight the
development of the rotor tip leakage flow for three tip
clearance heights. Data collected from an array of
high-frequency-response pressure transducers
measure time-resolved static pressure over the rotors.
These data are presented at several compressor
loading conditions for three rotor tip clearances to
investigate changes of the tip leakage flow.
Circumferential traverses of the stationary vane rows
with respect to the fixed sensor positions show a
modulation of the leakage flow trajectory as a result
of interactions with upstream stator wakes.
Multistage effects are also revealed by comparing
measurements from each of the three rotors, and
rotor-rotor interactions are observed in blade-to-blade
analyses of the tip leakage flows. In some cases,
variations of the leakage flow trajectory angle due to
these blade row interactions are greater than the
differences due to a doubling of rotor tip clearance
height, an important finding not previously reported
in the literature. Clearance derivatives for leakage
flow angle are calculated and compared with
trajectory angle measurements from a similar study to
develop a reliable method for evaluating tip leakage
flow trajectories at several loading conditions, which
is independent of compressor geometry.
Nomenclature BPP Blade passing period �� Axial chord �� Clearance derivative for leakage flow angle EA Ensemble average Annulus height � � Corrected mass flow rate Pressure RMS Root mean square � Blade pitch � Time TPR Total pressure ratio TLF Tip leakage flow � Tip clearance height � Leakage flow trajectory angle
Subscripts o-in,AA Area-averaged inlet stagnation pressure
Accents � � Ensemble average
Introduction
In axial compressors, the tip leakage flow (TLF)
develops as a result of the pressure difference
between the pressure surface and suction surface of
the rotor blade in the tip region. Past research has
shown that increased rotor tip clearances leads to a
growth of the blockage associated with the
recirculating tip leakage flow, and this leakage flow
is a significant contributor to overall compressor
loss.1 As a result, the overall pressure rise capability
of a compressor generally decreases with increasing
rotor tip clearance.
Although the growth and development of the tip
leakage flow is important for all stages of the
compressor, its effect can be most significant in the
rear stages of high-pressure compressors. In these
rear stages, the rotor tip clearances are often large
relative to the overall blade height, and the leakage
flow affects a more significant fraction of the overall
flow area. Next-generation engine designs will
feature small flow areas and thus shorter blading in
the rear stages as a result of increased bypass ratio
and overall pressure ratio. In these cases leading to
large relative tip clearance heights, an opportunity
exists to build upon a limited understanding of the tip
leakage flow and facilitate the development of loss-
reduction design mechanisms.
For this reason, the detailed flow features
associated with the rotor tip leakage flow are
important for the advancement of computational
modeling tools. However, the challenges associated
with adequately modeling tip leakage flows in
turbomachinery are substantial, as discussed by
Denton.2 Therefore, detailed measurements of the tip
leakage flow trajectory provide valuable information
which will help develop and validate reliable
modeling techniques.
Over the years, a variety of techniques have been
incorporated to identify rotor tip leakage flow

2
phenomena. One of these techniques utilizes high-
frequency-response pressure transducers in a flush-
mounted configuration in the casing over the rotor
tips to monitor time-resolved casing static
pressures.3-6
Using this method, the low static
pressure region associated with the tip leakage flow
can be used to identify the leakage flow trajectory
through the blade passage.
Previous examples of this technique in single-
stage or isolated rotor machines4-5
have provided
valuable information about the development of the tip
leakage flow, and data collected in a low-speed
repeating stage machine3 have yielded valuable
comparisons at two clearance heights. However,
these studies lack important multistage effects.
Measurements collected in a two-stage high-
speed compressor by Ernst et al.6 have provided
valuable insight into the stator-rotor interactions and
rotor-rotor interactions associated with the tip
leakage flow. However, the study was only carried
out for one tip clearance. Moyle et al.7 used casing
static pressure measurements with two tip clearances
in a two-stage compressor, but the clearances
evaluated were both less than one percent span.
Nonetheless, the observations documented by Moyle
et al. showed an important dependence of the
measured wall static pressure traces on the relative
position of the adjacent stator vanes.
In support of research investigating tip leakage
flows, other authors have also identified an
interaction between the rotor tip leakage flow and
wakes from upstream stator vanes.6-11
As the rotor
passes through the velocity deficit region associated
with the stator wake, an interaction occurs between
the wake and the formation of the rotor tip leakage
flow. This periodic interference pattern with the
upstream stator wake introduces corresponding
periodic fluctuations of the tip leakage flow.
In the present study, three rotor tip clearance
heights are investigated using a series of high-
frequency-response static pressure sensors mounted
in a removable block over the rotors for several
loading conditions on the 100% corrected speedline.
These measurements provide valuable insight into the
development of the tip leakage flow through
quantification of the leakage flow trajectory angle
and tip leakage flow variations due to blade row
interactions.
Experimental Approach
The measurements for this study were collected
from the three-stage axial compressor research
facility at Purdue University. The facility features an
inlet guide vane (IGV) followed by three stages
designed for flow conditions representative of the
rear stages in modern high-pressure compressors,
including engine-representative Reynolds numbers
and Mach numbers. The design speed for the
compressor is 5000 rpm, which is sufficient to
achieve appreciable compressibility effects.
Furthermore, the four vane rows are circumferentially
indexable to capture flowfield variations due to
wakes and potential fields. Additional information
about the facility is available in Ref. 12.
An extensive study of tip clearance flow effects
has been conducted using three separate rotor tip
clearance heights. The design intent for these
clearances represents 1.5%, 3.0%, and 4.0% as a
fraction of overall annulus height, . These tip
clearance configurations will be identified as TC1,
TC2, and TC3, respectively.
The time-resolved pressure measurements
presented herein were collected using a custom-
designed array implementing 25 flush-mounted fast-
response pressure transducers (Kulite XCS-062-5G).
The XCS-series transducers feature high-sensitivity
piezoresistive sensing elements to maximize the
resolution of the measurements in a small diameter
unit (0.066 in. diameter, in this case). This small
diameter of the selected sensors provides the ability
to incorporate as many sensors as possible in one
axial row. Previous authors have utilized a method of
offsetting sensors in two or more axial rows,
separated by some angle in the pitchwise direction, to
accommodate increased axial resolution.3,13-14
However, such sensor installations can introduce
complications in the measurements for multistage
machines from the influence of wakes and potential
fields from adjacent vane rows, which must be
appropriately considered in both the data acquisition
and processing procedures.
The fast-response pressure sensors are
permanently installed in a removable block which
Figure 1. Rotor over-tip instrumentation block.

3
can be inserted into any one of nine frames (one for
each rotor and each tip clearance). The removable
sensing block and one of the nine frames are shown
in Fig. 1. Because the sensor locations are fixed in
the removable block but the three rotor rows in the
facility differ slightly in their chord length, the sensor
locations are listed as a percentage of axial chord for
each of the three rotors in Table 1.
Table 1. Fast-response pressure sensor positions
for each rotor as a percentage of axial chord.
Blade
Row
Min. Sensor
Location [%]
Max. Sensor
Location [%]
Separation
[%]
Rotor 1 -14.0 114.0 5.33
Rotor 2 -12.8 113.6 5.26
Rotor 3 -11.9 113.2 5.21
The excitation and amplification for these fast-
response pressure sensors were supplied by a
Precision Filters 28000-series system. Immediately
prior to installation and operation in the compressor,
the sensors were calibrated in a custom-designed
calibration chamber over the full sensing range of 0
to 5 psi, and a least-squares linear fit was applied to
the calibration data for each sensor. The overall
uncertainty for the measured time-resolved pressures
represents approximately 0.030 psi. The data
presented herein represent statistical results
calculated using 500 revolutions (identified by a
once-per-revolution signal from a laser tachometer)
of data collected with a sampling frequency of 100
kHz and a low-pass filter applied at a cut-off
frequency of 40 kHz. The utilization of a protective
screen for the sensors decreases the sensor frequency
response to approximately 30 kHz.
The data collected in this study are compared for
four loading conditions on the 100% corrected
speedline, as identified by the compressor map in
Fig. 2: a low loading (LL) condition, a nominal
loading (NL) condition with a flow rate slightly
higher than the peak efficiency point, a peak
efficiency (PE) point, and a high loading (HL)
condition at high incidence. In this study, the same
loading condition is compared for different tip
clearance configurations using equivalent corrected
mass flow rates.
Results
Tip Leakage Flow Trajectories
Data collected from a large number of
revolutions allow a representation of the pressure
measurements using statistical methods. The time-
resolved pressure measurements presented herein are
evaluated in terms of the root-mean-square (RMS)
unsteadiness with respect to the ensemble average:
RMS�� ! = #1% &' �� ! − � �� !�)* +,
+-. , (1)
at the 0th time position in a given revolution for %
revolutions of data. In this equation, the ensemble
average (EA) is defined by:
� �� !� = 1% &' �� !)+,+-. . (2)
This definition of RMS provides the ability to
identify regions of pressure unsteadiness associated
with the tip leakage flow further into the blade
passage compared to the EA static pressure field.
Figure 3 shows the normalized EA static
pressures measured over Rotor 1 at the nominal
loading condition for each of the rotor tip clearances,
and Fig. 4 presents the same data in terms of
normalized RMS pressure unsteadiness. The data in
these figures represent a mean rotor tip flow,
calculated by dividing the ensemble averaged
revolution into 36 equal segments (one segment for
each blade of Rotor 1) and averaging across these 36
passages. This average result is shown twice,
assuming periodicity, to more easily discern the
applicable flow features. Also in these figures, dots
on the abscissa identify the sensor positions which
were used to create the contours. Data collected from
malfunctioning sensors are not presented, and the
corresponding sensors markers (if any) are absent for
such cases.
Figure 2. Compressor total pressure ratio map for
100% corrected speed.
0.7 0.8 0.9 1.0 1.1 1.2
1.15
1.20
1.25
1.30
1.35
1.40
LL
NL
PE
HL
Normalized Inlet Corrected Mass Flow Rate, mc [−]
To
tal P
ressu
re R
atio
, T
PR
[−
]
TC1
TC2
TC3
4
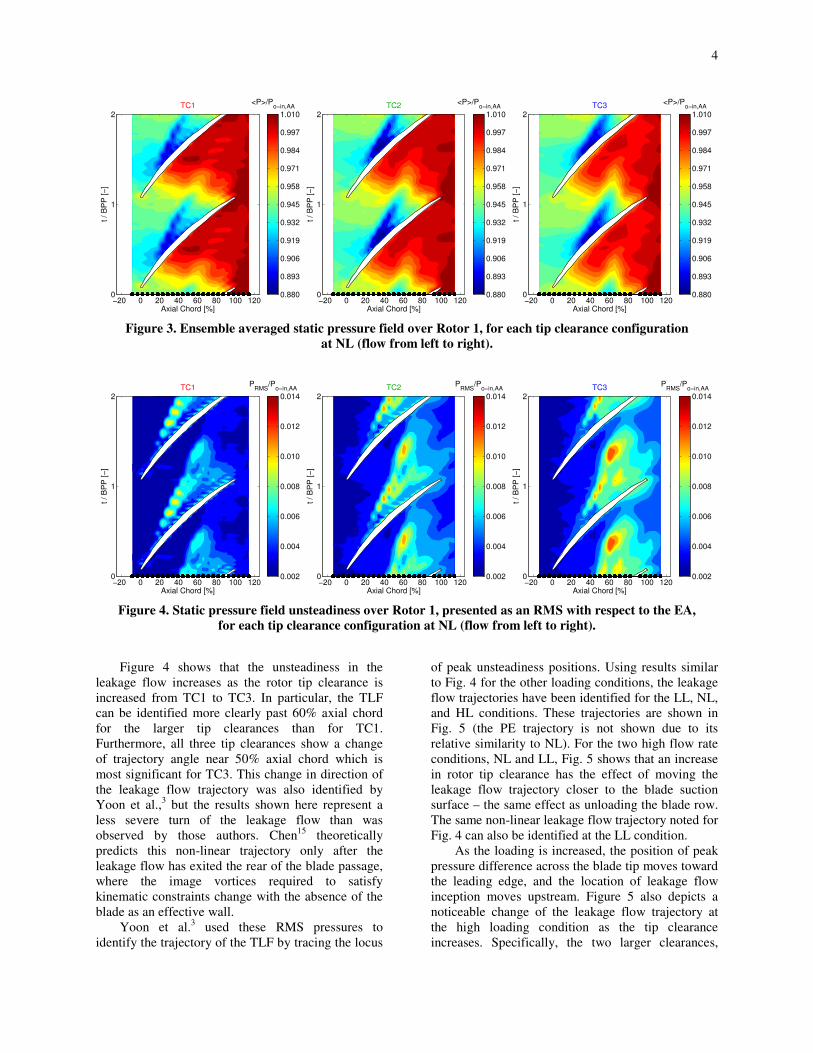
Figure 4 shows that the unsteadiness in the
leakage flow increases as the rotor tip clearance is
increased from TC1 to TC3. In particular, the TLF
can be identified more clearly past 60% axial chord
for the larger tip clearances than for TC1.
Furthermore, all three tip clearances show a change
of trajectory angle near 50% axial chord which is
most significant for TC3. This change in direction of
the leakage flow trajectory was also identified by
Yoon et al.,3 but the results shown here represent a
less severe turn of the leakage flow than was
observed by those authors. Chen15
theoretically
predicts this non-linear trajectory only after the
leakage flow has exited the rear of the blade passage,
where the image vortices required to satisfy
kinematic constraints change with the absence of the
blade as an effective wall.
Yoon et al.3 used these RMS pressures to
identify the trajectory of the TLF by tracing the locus
of peak unsteadiness positions. Using results similar
to Fig. 4 for the other loading conditions, the leakage
flow trajectories have been identified for the LL, NL,
and HL conditions. These trajectories are shown in
Fig. 5 (the PE trajectory is not shown due to its
relative similarity to NL). For the two high flow rate
conditions, NL and LL, Fig. 5 shows that an increase
in rotor tip clearance has the effect of moving the
leakage flow trajectory closer to the blade suction
surface – the same effect as unloading the blade row.
The same non-linear leakage flow trajectory noted for
Fig. 4 can also be identified at the LL condition.
As the loading is increased, the position of peak
pressure difference across the blade tip moves toward
the leading edge, and the location of leakage flow
inception moves upstream. Figure 5 also depicts a
noticeable change of the leakage flow trajectory at
the high loading condition as the tip clearance
increases. Specifically, the two larger clearances,
Figure 3. Ensemble averaged static pressure field over Rotor 1, for each tip clearance configuration
at NL (flow from left to right).
Figure 4. Static pressure field unsteadiness over Rotor 1, presented as an RMS with respect to the EA,
for each tip clearance configuration at NL (flow from left to right).
Axial Chord [%]
t / B
PP
[−
]TC1
−20 0 20 40 60 80 100 1200
1
2
<P>/Po−in,AA
0.880
0.893
0.906
0.919
0.932
0.945
0.958
0.971
0.984
0.997
1.010
Axial Chord [%]t / B
PP
[−
]
TC2
−20 0 20 40 60 80 100 1200
1
2
<P>/Po−in,AA
0.880
0.893
0.906
0.919
0.932
0.945
0.958
0.971
0.984
0.997
1.010
Axial Chord [%]
t / B
PP
[−
]
TC3
−20 0 20 40 60 80 100 1200
1
2
<P>/Po−in,AA
0.880
0.893
0.906
0.919
0.932
0.945
0.958
0.971
0.984
0.997
1.010
Axial Chord [%]
t /
BP
P [
−]
TC1
−20 0 20 40 60 80 100 1200
1
2
PRMS
/Po−in,AA
0.002
0.004
0.006
0.008
0.010
0.012
0.014
Axial Chord [%]
t /
BP
P [
−]
TC2
−20 0 20 40 60 80 100 1200
1
2
PRMS
/Po−in,AA
0.002
0.004
0.006
0.008
0.010
0.012
0.014
Axial Chord [%]
t /
BP
P [
−]
TC3
−20 0 20 40 60 80 100 1200
1
2
PRMS
/Po−in,AA
0.002
0.004
0.006
0.008
0.010
0.012
0.014

5
TC2 and TC3, turn more noticeably away from the
axial direction and toward the adjacent blade,
whereas the TC1 trajectory portrays a more linear
path. This observed change in behavior for the HL
condition can be attributed to the relative proximity
of the HL points to the stall point for each tip
clearance, as outlined in Table 2 (see also Fig. 2)
using the following equation for stall margin (SM):
SM = 2TPR3� 4 567899 − 2TPR3� 4 52TPR3� 4 5 × 100%. (3)
The results presented thus far for Rotor 1 have
shown that the loading condition of the compressor
can affect the trajectory of the leakage flow through
the rotor passage, an observation which agrees with
findings from previous studies. However, analysis of
the Rotor 2 and Rotor 3 results requires an
understanding of other interactions which affect the
leakage flow in those blade rows. As a result, these
interactions will be analyzed before quantifying the
leakage flow trajectories for Rotor 2 and Rotor 3.
Table 2. Stall margin calculated for HL condition.
TC1 TC2 TC3
SM [%] 17.5 13.3 9.3
Influence of Stator Wakes on Leakage Flow
In the wake of a stator vane (i.e., Stator 1), the
absolute velocity deficit creates a corresponding
increase of incidence into the downstream rotor row
(e.g., Rotor 2). When the rotor passes through this
wake region, the local increase of incidence angle
momentarily increases the rotor loading, thereby
affecting the strength and trajectory of the tip leakage
flow. As a result, the location of the sensors with
respect to the stator vanes in the stationary frame of
reference will dictate whether or not the pressure
measured by those sensors will be affected by the
rotor passing through the upstream vane wake.
To better understand this relationship, the same
over-rotor static pressure measurements were
repeated for several loading conditions with the
baseline tip clearance, TC1. A cartoon schematic,
Fig. 6, outlines this measurement process. The
sensors are in fixed positions in the compressor
casing, but the upstream and downstream stator vanes
can be moved (either simultaneously or
independently) through the use of a series of linear
actuators. Thus, Fig. 6 shows representative
measurements that may be collected at two vane
positions with respect to the fixed measurement
Figure 5. Rotor 1 leakage flow trajectories.
Figure 6. Schematic of leakage flow measurements over the rotor for two vane wake-leakage flow
interaction positions, (a) and (b).

6
locations: (a) the first few sensors are located
between the upstream stator wakes and measure the
freestream flow, or (b) the first few sensors are
approximately in the upstream stator wake.
In each case, the time-resolved measurements are
phase-locked with the rotor rotation, so the shaded
measurement region identifies one blade passage of
data. The cartoons in Fig. 6 show measurements over
Rotor 2 for which the upstream and downstream
stator vanes were moved together, but data were also
collected over Rotor 2 when Stator 1 and Stator 2
(the upstream and downstream vane rows) were
moved independently from one another.
To assess this effect, the IGV and Stator 1 were
moved to 25 unique equally-spaced pitchwise
positions with respect to the fixed pressure sensors
over Rotor 2. A smooth modulation of static
pressures over Rotor 2 can be identified by moving
cyclically through the 25 pitchwise positions, but
only two out-of-phase positions are shown here for
comparison, identified in Fig. 7 as 0% vp and
52% vp. For these results in Fig. 7, the vanes
downstream of Rotor 2 (Stator 2 and Stator 3) were
maintained in fixed positions to separate effects due
to the upstream stator wake from the potential field
associated with the downstream vanes.
The pressure RMS unsteadiness results for these
two discrete vane positions shown in Fig. 7 have
been used to determine the leakage flow trajectories,
as explained in the discussion accompanying Fig. 5.
This comparison of trajectories, Fig. 8(a), shows an
identifiable difference of nearly three degrees
between 0% vp and 52% vp. Although this difference
may seem small, it is significant compared to the
effects associated with changes of tip clearance or
loading condition, as will be shown later in this
paper.
A procedure similar to the one outlined for Fig. 7
was followed to identify whether the potential field
associated with the downstream vanes may also
affect the trajectory of the tip leakage flow. In this
case, the IGV and Stator 1 were maintained in fixed
positions while Stator 2 and Stator 3 were moved
simultaneously to 25 pitchwise positions. The time-
averaged static pressure downstream of the Rotor 2
trailing edge was used to identify the vane positions
associated with the minimum and maximum static
pressure field related to Stator 2. The leakage flow
trajectories from these vane positions are presented in
Fig. 8(b). These results confirm that there is no
discernable effect on the trajectory of the tip leakage
flow associated with the downstream potential field
compared to the effect from the upstream vane
wakes.
Although previous authors have identified a
stator-rotor interaction governing the development of
the rotor tip leakage flow, these measurements help
to specifically discern between upstream and
downstream vane effects.
Blade-to-Blade Leakage Flow Variability
In general, compressor measurements associated
with the rotor are often considered in an average
form, neglecting variations which may exist from one
blade to the next – similar to the results presented in
Fig. 3 and Fig. 4. However, small manufacturing
defects in the blade hardware and blade row
interactions within the machine can create substantial
variations which must be considered, as identified in
rotor wake variability studies by previous
authors.11,16-18
As a result, in addition to the influence
of upstream stator vane wakes on the tip leakage
flow, it is also desirable to investigate blade-to-blade
variations of the tip leakage flow.
In this compressor facility, the runout of the
rotor blade tips has been evaluated using a dial
Figure 7. Rotor 2 static pressure unsteadiness for
two Stator 1 positions half a passage out-of-phase
from one another. (a) (b)
Figure 8. Rotor 2 leakage flow trajectories:
(a) Stator 1 pitchwise positions 0%vp and 52%vp
identified in Fig. 7; (b) Stator 2 positions for
Stator 2 and Stator 3 movement (with IGV and
Stator 1 fixed).
t / B
PP
[−
]0% vp
0
1
252% vp
P
RMS / P
o−in,AA
0.004
0.005
0.006
0.007
0.008
0.009
0.010
0.011
0.012

7
indicator with a rolling tip. These measurements,
presented in Fig. 9, represent the blade-to-blade
variation of static (non-operating) tip clearance
height at any fixed location about the circumference
of the compressor. The information in Fig. 9 shows
that the blade-to-blade tip clearance varies on the
order of 3×10⁻³
to 5×10⁻³
in. (depending on rotor row)
around the circumference of the rotor. However,
there is also a particularly large discrepancy for
Blade 9 of Rotor 3, which shows a significant
increase of tip clearance of approximately 1×10⁻³
in.
compared to its adjacent blades.
Based on the information in Fig. 9, it is expected
that a discernable change of tip leakage flow pattern
may be identified for Blade 9 of Rotor 3. Indeed, if
the RMS results for Rotor 3 are maintained as 30
separate data sets (one for each blade) instead of an
“average blade” representing the entire row, Fig. 10
shows that Blade 9 can be easily identified by its
leakage flow pattern which differs noticeably from its
adjacent blades. In this case, the local tip clearance
increase for Blade 9 creates a larger region of high
unsteadiness identified by the RMS which is more
dispersed throughout the blade passage, compared
with the more localized trajectories crossing the blade
passage for the other blades. This phenomenon can
be qualitatively compared with the change of leakage
flow pattern with increased clearance height in Fig. 4.
Aside from the differences for Blade 9 identified
in Fig. 10, blade-to-blade variations of the TLF are
also visible for other blades which do not necessarily
Figure 10. Blade-to-blade leakage flow pattern variability for Rotor 3 with TC1 at NL.
Figure 11. Blade-to-blade leakage flow pattern variability for Rotor 3 with TC3 at NL.
Figure 9. Blade-to-blade variation of rotor tip
clearance with respect to Blade 1 for each
rotor row.
Blade Number
cx [%
]
4 5 6 7 8 9 10 11 12 13 14
0
50
100
cx [%
]
0 1 2 3 4 5 6 7 8 9 10
0
50
100
cx [%
]
10 11 12 13 14 15 16 17 18 19 20
0
50
100
Blade Number
cx [%
]
20 21 22 23 24 25 26 27 28 29 30
0
50
100
1 6 12 18 24 30 36−3
−2
−1
0
1
2
3
4x 10
−3
Bla
de−
to−
Bla
de T
ip C
leara
nce [in
]
Blade Number
Rotor 1
Rotor 2
Rotor 3

8
correlate with the clearance variations in Fig. 9.
Figure 11 shows a similar comparison of blade-to-
blade leakage flow variability, but for all 30 blades
from the Rotor 3 row at the larger tip clearance TC3.
In Fig. 11, the 30 blades have been segmented into
three 10-blade series.
For this facility, the difference of blade counts
between Rotor 1, Rotor 2, and Rotor 3 (36, 33, and
30, respectively) introduces a 3/rev modulation of the
flow field for both Rotor 2 and Rotor 3. Fig. 11
highlights the effect of this 3/rev modulation on the
tip leakage flow. An assessment of the EA static
pressure signals (not shown) highlights troughs of
this 3/rev modulation which exist at blade numbers of
approximately 3, 13, and 23, and peaks located at
blade numbers of 8, 18, and 28. The data in Fig. 11
identify these same trends as the 3/rev troughs at
Blades 3, 13, and 23 show lower leakage flow
intensities than the peaks at Blades 8, 18, and 28.
However, the results in Fig. 11 tell an additional
story as the 3/rev modulation is superimposed with
the 1/rev tip clearance variations identified for
Rotor 3 in Fig. 9. A specific comparison of the TLF
pattern for Blades 3, 13, and 23 (the troughs of the
3/rev modulation) shows highest intensity in the
leakage flow for Blade 23 and lowest intensity (with
more dispersed unsteadiness) for Blade 3. Referring
to Fig. 9, this observation aligns with the discussion
for Fig. 8 that larger clearance heights lead to
decreased unsteadiness intensity in the leakage flow
region as it is more dispersed through the blade
passage and located at an increased distance from the
sensor.
Based on the data shown in Fig. 10 and Fig. 11,
it is determined that the effect of small blade-to-blade
tip clearance variations, such as the one identified for
Blade 9 from Rotor 3, are most noticeable in the
leakage flow unsteadiness if the tip clearance height
is small (i.e., TC1 instead of TC3). This observation
could be due to the fact that a 1×10⁻³
in. change
represents a larger fraction of the overall clearance
height for TC1 (nominally 0.030 in.) than for TC3
(nominally 0.080 in.), but the closer proximity of the
sensors to the blade tips for TC1 may also make the
sensors more sensitive to these small variations.
Similar to the stator wake interaction highlighted
in Fig. 8, the blade-to-blade variations identified in
Fig. 10 and Fig. 11 are also important for quantifying
changes of the tip leakage flow angle. In this case,
the leakage flow angle, �, is defined with reference to
an axial reference datum, as shown in Fig. 12. In
Fig. 12, two leakage flow trajectories are shown for
Rotor 1 and Rotor 3 at each loading condition, NL
and HL. The minimum and maximum traces define
the envelope of trajectory angles representing the
blade-to-blade variations. This angular envelope for
Rotor 1 is 1.8 degrees for both NL and HL. The
blade-to-blade variation of trajectory angle shows no
discernible trend with the tip clearance height (e.g.,
Fig. 9), and no rotor-rotor interactions are expected
for the Rotor 1 results.
However, several differences exist for the
Rotor 3 results in Fig. 12 compared to Rotor 1. In
particular, the envelope of blade-to-blade trajectory
angle variation for Rotor 3 is 1.5 degrees for NL, but
increases to 2.2 degrees for HL. Also, the axial
location of leakage flow inception and the leakage
flow trajectory angle are more similar between the
NL and HL positions for Rotor 3 than for Rotor 1. In
this case, although a weak trend of trajectory angle
with blade-to-blade tip clearance variation exists,
there is no discernible trend associated with the other
engine-order frequencies introduced previously.
Although not shown here, the Rotor 2 envelopes are
nearly identical to the Rotor 3 trends (1.5 and 2.2
degrees for NL and HL respectively).
Quantifying Tip Leakage Flow Trajectory
Using the leakage flow trajectory identification
techniques presented in this paper, the angle of the
leakage flow trajectory can be determined. The
Figure 12. Maximum and minimum leakage flow
angle variations for Rotor 1 and Rotor 3 (TC1).

9
results from the present study are shown for each of
the three rotors at the four loading conditions in
Fig. 13. Several of the NL and HL data points for
TC1 in Fig. 13 also include range bars which identify
the variations of tip leakage trajectory angle
associated with the modulation of the tip leakage
flow due to the upstream vane wakes (as calculated
using information similar to Fig. 7). The data in Fig.
13 are presented as a function of measured tip
clearances instead of the “nominal” design values.
These operating clearances account for thermal
growth differences related to changes in loading and
ambient temperature discussed by Berdanier and
Key.20
The results in Fig. 13 highlight several important
trends. In particular, the leakage flow trajectory
angles appear to change differently for Rotor 1 than
for Rotor 2 and Rotor 3, both of which show similar
trends at all four loading conditions. For all rotors,
however, there is a consistent trend of decreasing
trajectory angle with increasing tip clearance for LL,
NL, and PE, but an increasing trend for the HL
condition. At the HL condition, the relative
difference of stall margin between the three clearance
configurations has a more profound effect on the
flow.
The results for Rotor 1 in Fig. 13 show that the
leakage trajectory angles vary almost linearly with
increasing rotor tip clearance for the range of
clearances investigated in the present study. In
contrast to these Rotor 1 observations, the data for
Rotor 2 and Rotor 3 show insignificant changes of
leakage flow trajectory angle for a tip clearance
change from TC1 to TC2. This noted difference for
Rotor 2 and Rotor 3 is crucial to this study because it
shows a trend which would be otherwise overlooked
if only two tip clearances were studied (e.g., TC1 and
TC3, as was the case for the data presented by Yoon
et al.3). This difference of leakage flow trajectory
angles between Rotor 1 and the other two rotor rows
agrees with previous observations in this facility
suggesting a difference of Rotor 1 performance with
increased tip clearance compared to the downstream
rotors.
Results similar to the measurements presented in
Fig. 13 have also been collected by Yoon et al.3 over
Rotor 3 in a four-stage low-speed research
compressor with repeating stages. A comparison of
the Rotor 3 results from the present study with the
measurements collected by Yoon et al. is shown in
Fig. 14.
Previous authors have introduced the clearance
derivative as a method for evaluating the change of a
particular parameter with changes in tip clearance. In
this case, a clearance derivative for leakage flow
trajectory angle is defined with respect to the
clearance-to-pitch ratio:
�� = ���/�!. (4)
In Fig. 13 and Fig. 14, the clearance-to-pitch
ratio was selected instead of the clearance-to-chord
ratio used by Yoon et al.3 (or clearance-to-span,
which is typically used as a metric for efficiency
Figure 13. Leakage flow trajectory angle versus normalized clearance height.
Range bars identify change of trajectory angle due to interaction with the
upstream vane wake.
1 2 3 4
55
60
65
70
75
80
Rotor 1
Le
aka
ge
Flo
w T
raje
cto
ry A
ng
le,
ξ [
de
g]
1 2 3 4
Rotor 2
Normalized Tip Clearance, τ / s [%]
LL
NL
PE
HL
1 2 3 4
Rotor 3

10
changes) to present trajectory angle changes. The
clearance-to-pitch ratio was chosen to avoid
discrepancies of aspect ratio between the two
facilities compared in Fig. 14. A comparison between
the four-stage low-speed compressor used by Yoon et
al. with the machine used for the present study shows
a difference of aspect ratio from approximately 1.2 to
approximately 0.7, respectively.
The relationship between pitch and blade
loading, as well as the contribution of pitch as a
representative length scale in the measurement plane
over the rotor, combined to guide the selection of
clearance-to-pitch as the representative metric for
comparison. However, the relative dissimilarity of
blade pitch for Yoon et al.3 and the present study
creates an opportunity to evaluate the dependence of
observed trends to a particular compressor design.
A comparison of the results from the present
study in Fig. 14 with the data presented by Yoon
et al.3 shows good agreement using the clearance-to-
pitch ratio on the abscissa. Especially at the LL and
HL conditions, the clearance derivatives are nearly
identical when the widest tip clearance range is
considered for the present study (TC1 to TC3).
However, the absence of a third tip clearance
configuration for Yoon et al. makes it difficult to
conclude whether the same non-linear trend is
expected for any multistage compressor. For
reference, if the Rotor 2 results from the present are
selected for comparison with Yoon et al. instead of
Rotor 3, the results are also similar based on the
nearly identical trends between Rotor 2 and Rotor 3
in Fig. 13.
As a rule-of-thumb, these data suggest that the
leakage flow trajectory angle will decrease
approximately one degree for every one percent
increase of clearance-to-pitch when rotor incidence
angle is large and negative. Similarly, approximately
one degree of trajectory angle increase is expected for
every one percent of clearance-to-pitch when rotor
incidence is large and positive. Although these data
show trends which may apply for large clearance
changes, it is very important to observe that a critical
clearance may exist, leading to significant differences
of the clearance derivative for leakage flow angle
assessed here. For the present study, the critical
clearance represents the TC2 clearance height. By
this proposed effect, a change from a “small” to a
“moderate” clearance height (i.e., TC1 to TC2) may
be met by little or no change of leakage flow angle,
whereas a change from a “moderate” to “large”
clearance height (i.e., TC2 to TC3) may incur
significant changes.
Further comparison of the present study results
in Fig. 14 with the data from Yoon et al.3 also shows
that the peak efficiency point from the comparison
study has a positive clearance derivative which was
not observed in the present study. Based on the trends
suggested here, it is assumed that the rotor may
operate at a higher loading at the peak efficiency
point for the machine investigated by Yoon et al. than
the compressor in the present study.
The range bars in Fig. 14 show that the leakage
flow modulation associated with the upstream vane
wake has a profound influence on the leakage flow.
In fact, the change of leakage flow angle due to this
stator-rotor interaction is greater than the change due
to a doubling of the tip clearance height (TC1 to
TC2). Additional research is required to determine
whether the observed leakage flow angle ranges
associated with the wake interactions shown for TC1
in Fig. 13 are similarly present for other clearance
configurations and loading conditions. At this point,
however, there is sufficient information to determine
that the stator-rotor interaction plays a significant role
in the development of the tip leakage flow, and this
relationship must be appropriately considered when
comparing experimental data with computational
results.
Summary and Conclusions
This study has characterized the tip leakage flow
trajectory for three rotor tip clearance heights at four
loading conditions on the 100% corrected speedline.
Changes of the leakage flow trajectory angle with
Figure 14. Rotor 3 leakage flow trajectory trends
compared with results from Yoon et al.3
1 2 3 4 5 650
55
60
65
70
75
80
85
δξ,LL
= −1.0
δξ,HL
= 0.8
δξ,Y,LL
= −0.9
δξ,Y,HL
= 0.9
Leakage F
low
Tra
jecto
ry A
ngle
, ξ
[deg]
Normalized Tip Clearance, τ / s [%]
Present Study
Yoon et al.

11
increased tip clearance are dependent on the loading
condition and the proximity to the stall point.
Although previous authors have identified an
interaction between the rotor tip leakage flow and the
adjacent stator vanes, a specific effort was performed
here to separate the effect from the upstream stator
vane wake from a potential effect associated with the
downstream stator. The results from this study
showed that the downstream stator vane has a
negligible effect on the trajectory of the tip leakage
flow. This quantitative evaluation of the significance
of this stator-rotor interaction showed the modulation
of the leakage flow angle due to the upstream stator
vane wake can be more significant than the trajectory
change due to a doubling (1.5% increase) of rotor tip
clearance height, especially if tip clearance heights
are small.
In addition to the influence of the upstream
stator vanes on the rotor tip leakage flow, blade-to-
blade variations of the leakage flow have also been
investigated with a consideration of rotor-rotor
interactions. Multistage effects in the compressor
utilized for this study create a modulation of the tip
leakage flow as a result of a difference of rotor blade
counts for adjacent stages. However, separate blade-
to-blade variations of the tip leakage flow were also
identified as a result of blade-to-blade clearance
changes associated with manufacturing tolerances.
Although these manufacturing variations exist to
some extent in all machines, their effect is often
overlooked in experimental methods and
computational modeling in favor of a representative
average.
The present study emphasizes the importance of
using at least three tip clearance configurations to
achieve meaningful conclusions from tip clearance
studies. Specifically, Rotor 2 and Rotor 3 revealed
the presence of a critical clearance, for which smaller
clearances showed little or no change of trajectory
angle, but larger clearances show noticeable changes.
This observation would be overlooked if only two tip
clearance heights were investigated. However, a
comparison of the overall change from small to large
clearance with the results from Yoon et al.3 shows
good agreement. Specifically, the trends of trajectory
angle collapse when the clearances are normalized by
rotor pitch. This comparison suggests a rule-of-thumb
clearance derivative for leakage flow angle of
approximately negative one for low loading
conditions and positive one for high loading
conditions (as a function of clearance-to-pitch).
Although this rule-of-thumb applies on the average
for large tip clearance changes, it comes with the
understanding that critical tip clearance heights may
exist at which these trends change significantly.
Acknowledgments
This material is based upon work supported by
NASA under the ROA-2010 NRA of the Subsonic
Fixed Wing project, with Technical Monitor Dr.
Mark Celestina, and in part by the National Science
Foundation Graduate Research Fellowship Program
under Grant No. DGE-1333468. The authors would
also like to thank Rolls-Royce for the permission to
publish this work.
References
1Storer, J.A., and Cumpsty, N.A., “An
Approximate Analysis and Prediction Method for Tip
Clearance Loss in Axial Compressors,” Journal of
Turbomachinery, Vol. 116, No. 4, 1994, pp. 648-656. 2Denton, J.D., “Some Limitations of
Turbomachinery CFD,” ASME Paper No. GT2010-
22540, 2010, 11 pages. 3Yoon, Y.S., Song, S.J., and Shin, H.-W.,
“Influence of Flow Coefficient, Stagger Angle, and
Tip Clearance on Tip Vortex in Axial Compressors,”
Journal of Fluids Engineering, Vol. 128, No. 6,
2006, pp. 1274-1280. 4Weichert, S.A., “Tip Clearance Flows in Axial
Compressors: Stall Inception and Stability
Enhancement,” Ph.D. Dissertation, Dept. of
Engineering, Univ. of Cambridge, Cambridge, UK,
2011. 5Hah, C., and Shin, H.-W., “Study of Near-Stall
Flow Behavior in a Modern Transonic Fan with
Compound Sweep,” Journal of Fluids Engineering,
Vol. 134, No. 7, 2012, 071101 (7 pages). 6Ernst, M., Michel, A., and Jeschke, P., “Analysis
of Stator-rotor-Interaction and Blade-to-Blade
Measurements in a Two Stage Axial Flow
Compressor,” Journal of Turbomachinery, Vol. 133,
No. 1, 2011, 011027 (12 pages). 7Moyle, I.N., Shreeve, R.P., Walker, G.J., “Case
Wall Pressures in a Multistage Axial Compressor
with Tip Clearance Variation,” Journal of Propulsion
and Power, Vol. 12, No. 5, 1996, pp. 967-973. 8Mailach, R., Lehmann, I., and Vogeler, K.,
“Periodical Unsteady Flow Within a Rotor Blade
Row of an Axial Compressor—Part II: Wake-Tip
Clearance Vortex Interaction,” Journal of
Turbomachinery, Vol. 130, No. 4, 2008, 014005 (10
pages).

12
9Lange, M., Vogeler, K., and Mailach, R., “Tip and
Hub Clearance Vortex Development Due to Stator-
rotor-Interactions in Axial Compressors,”
Proceedings of the 13th International Symposium on
Unsteady Aerodynamics, Aeroacoustics and
Aeroelasticity of Turbomachines, Paper No.
ISUAAAT13-S4-5, 2012. 10
Krug, A., Busse, P., and Vogeler, K.,
“Experimental Investigation into the Effects of the
Steady Wake-Tip Clearance Vortex Interaction in a
Compressor Cascade,” Journal of Turbomachinery,
Vol. 137, No. 6, 2015, 061006 (10 pages). 11
Smith, N.R., Murray III, W.L., and Key, N.L.,
“Considerations for Measuring Compressor
Aerodynamic Excitations Including Rotor Wakes and
Tip Leakage Flows,” ASME Paper No. GT2015-
43508, 2015, 11 pages. 12
Ball, P.R., “An Experimental and Computational
Investigation on the Effects of Stator Leakage Flow
on Compressor Performance,” Master Thesis, School
of Aeronautics and Astronautics, Purdue University,
West Lafayette, IN, 2013. 13
Shin, H.-W., Solomon, W., and Wadia, A.,
“Transonic Fan Tip-Flow Features Revealed by High
Frequency Response Over-Tip Pressure
Measurements,” ASME Paper No. GT2008-50279,
2008, 9 pages.
14Courtiade, N., and Ottavy, X., “Experimental
Study of Surge Precursors in a High-Speed
Multistage Compressor,” ASME GT2012-68321,
2012. 15
Chen, G-T., “Vortical Structures in
Turbomachinery Tip Clearance Flows,”
Massachusetts Institute of Technology, Cambridge,
MA, PhD Thesis, 1991. 16
Sherman, P.J., Dudley, R., and Suarez, M., “The
Stochastic Structure of Downstream Pressure from an
Axial Compressor – II. An Investigation of Blade-to-
Blade Variability,” Mechanical Systems and Signal
Processing, Vol. 10, No. 4, 1996, pp. 423-437. 17
Boyd, D.M., and Fleeter, S., “Axial Compressor
Blade-to-Blade Unsteady Aerodynamic Variability,”
Journal of Propulsion and Power, Vol. 19, No. 2,
2003, pp. 242-249. 18
Key, N.L., Lawless, P.B., and Fleeter, S., “Rotor
Wake Variability in a Multistage Compressor,”
Journal of Propulsion and Power, Vol. 26, No. 2,
2010, pp. 344-352. 19
Suder, K.L., “Blockage Development in a
Transonic, Axial Compressor Rotor,” Journal of
Turbomachinery, Vol. 120, No. 3, 1998, pp. 465-476. 20
Berdanier, R.A., and Key, N.L., “Experimental
Investigation of Factors Influencing Operating Rotor
Tip Clearance in Multistage Compressors,”
International Journal of Rotating Machinery, 2015,
Article ID 146272 (13 pages).