Embed Size (px)
Citation preview
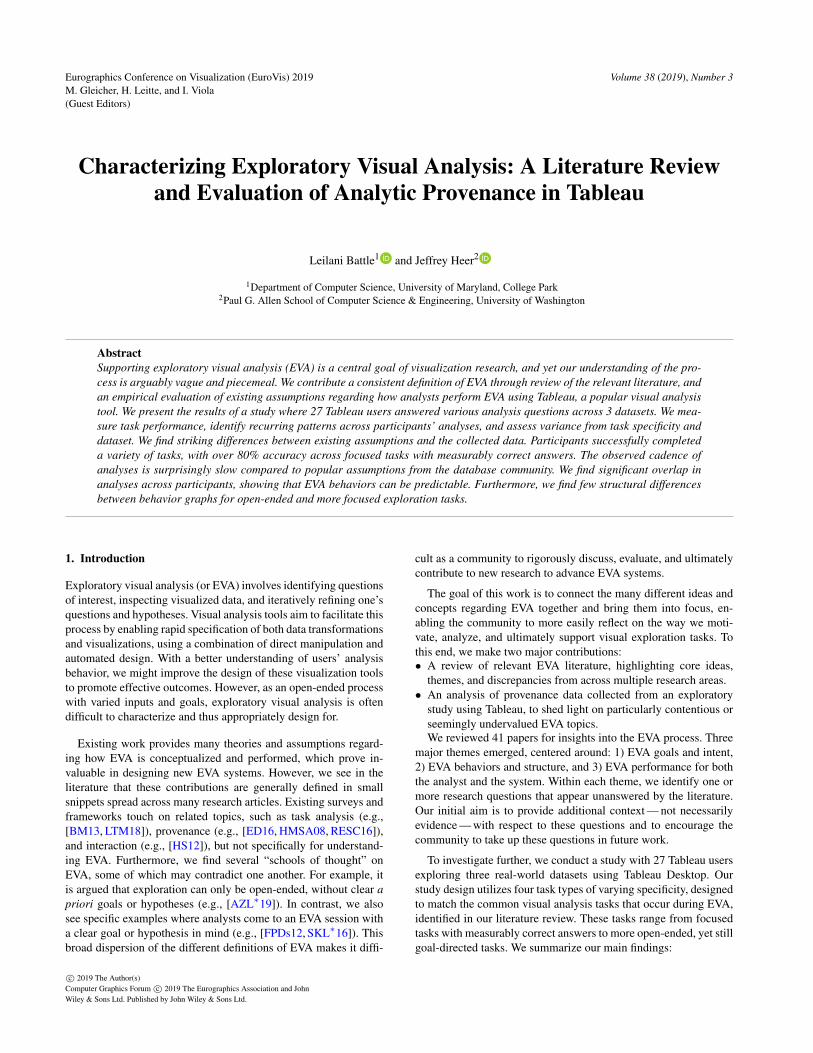
Eurographics Conference on Visualization (EuroVis) 2019M. Gleicher, H. Leitte, and I. Viola(Guest Editors)
Volume 38 (2019), Number 3
Characterizing Exploratory Visual Analysis: A Literature Reviewand Evaluation of Analytic Provenance in Tableau
Leilani Battle1 and Jeffrey Heer2
1Department of Computer Science, University of Maryland, College Park2Paul G. Allen School of Computer Science & Engineering, University of Washington
AbstractSupporting exploratory visual analysis (EVA) is a central goal of visualization research, and yet our understanding of the pro-cess is arguably vague and piecemeal. We contribute a consistent definition of EVA through review of the relevant literature, andan empirical evaluation of existing assumptions regarding how analysts perform EVA using Tableau, a popular visual analysistool. We present the results of a study where 27 Tableau users answered various analysis questions across 3 datasets. We mea-sure task performance, identify recurring patterns across participants’ analyses, and assess variance from task specificity anddataset. We find striking differences between existing assumptions and the collected data. Participants successfully completeda variety of tasks, with over 80% accuracy across focused tasks with measurably correct answers. The observed cadence ofanalyses is surprisingly slow compared to popular assumptions from the database community. We find significant overlap inanalyses across participants, showing that EVA behaviors can be predictable. Furthermore, we find few structural differencesbetween behavior graphs for open-ended and more focused exploration tasks.
1. Introduction
Exploratory visual analysis (or EVA) involves identifying questionsof interest, inspecting visualized data, and iteratively refining one’squestions and hypotheses. Visual analysis tools aim to facilitate thisprocess by enabling rapid specification of both data transformationsand visualizations, using a combination of direct manipulation andautomated design. With a better understanding of users’ analysisbehavior, we might improve the design of these visualization toolsto promote effective outcomes. However, as an open-ended processwith varied inputs and goals, exploratory visual analysis is oftendifficult to characterize and thus appropriately design for.
Existing work provides many theories and assumptions regard-ing how EVA is conceptualized and performed, which prove in-valuable in designing new EVA systems. However, we see in theliterature that these contributions are generally defined in smallsnippets spread across many research articles. Existing surveys andframeworks touch on related topics, such as task analysis (e.g.,[BM13, LTM18]), provenance (e.g., [ED16, HMSA08, RESC16]),and interaction (e.g., [HS12]), but not specifically for understand-ing EVA. Furthermore, we find several “schools of thought” onEVA, some of which may contradict one another. For example, itis argued that exploration can only be open-ended, without clear apriori goals or hypotheses (e.g., [AZL∗19]). In contrast, we alsosee specific examples where analysts come to an EVA session witha clear goal or hypothesis in mind (e.g., [FPDs12, SKL∗16]). Thisbroad dispersion of the different definitions of EVA makes it diffi-
cult as a community to rigorously discuss, evaluate, and ultimatelycontribute to new research to advance EVA systems.
The goal of this work is to connect the many different ideas andconcepts regarding EVA together and bring them into focus, en-abling the community to more easily reflect on the way we moti-vate, analyze, and ultimately support visual exploration tasks. Tothis end, we make two major contributions:• A review of relevant EVA literature, highlighting core ideas,
themes, and discrepancies from across multiple research areas.• An analysis of provenance data collected from an exploratory
study using Tableau, to shed light on particularly contentious orseemingly undervalued EVA topics.We reviewed 41 papers for insights into the EVA process. Three
major themes emerged, centered around: 1) EVA goals and intent,2) EVA behaviors and structure, and 3) EVA performance for boththe analyst and the system. Within each theme, we identify one ormore research questions that appear unanswered by the literature.Our initial aim is to provide additional context — not necessarilyevidence — with respect to these questions and to encourage thecommunity to take up these questions in future work.
To investigate further, we conduct a study with 27 Tableau usersexploring three real-world datasets using Tableau Desktop. Ourstudy design utilizes four task types of varying specificity, designedto match the common visual analysis tasks that occur during EVA,identified in our literature review. These tasks range from focusedtasks with measurably correct answers to more open-ended, yet stillgoal-directed tasks. We summarize our main findings:
c© 2019 The Author(s)Computer Graphics Forum c© 2019 The Eurographics Association and JohnWiley & Sons Ltd. Published by John Wiley & Sons Ltd.
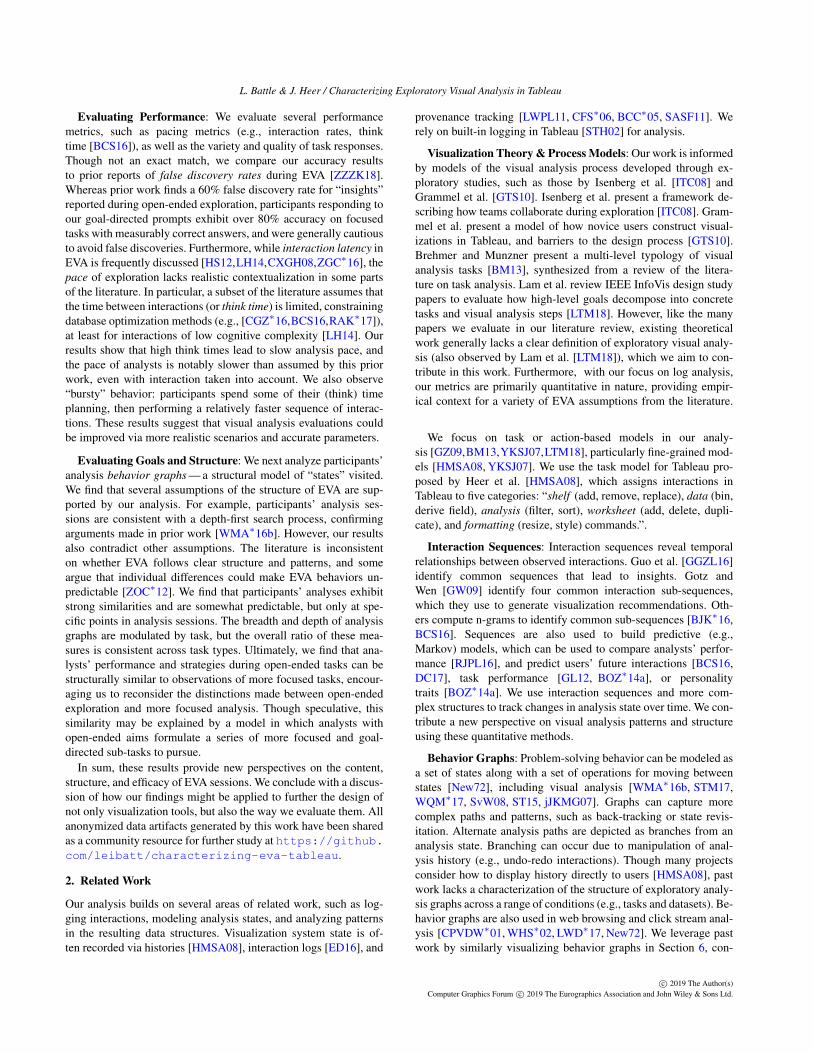
L. Battle & J. Heer / Characterizing Exploratory Visual Analysis in Tableau
Evaluating Performance: We evaluate several performancemetrics, such as pacing metrics (e.g., interaction rates, thinktime [BCS16]), as well as the variety and quality of task responses.Though not an exact match, we compare our accuracy resultsto prior reports of false discovery rates during EVA [ZZZK18].Whereas prior work finds a 60% false discovery rate for “insights”reported during open-ended exploration, participants responding toour goal-directed prompts exhibit over 80% accuracy on focusedtasks with measurably correct answers, and were generally cautiousto avoid false discoveries. Furthermore, while interaction latency inEVA is frequently discussed [HS12,LH14,CXGH08,ZGC∗16], thepace of exploration lacks realistic contextualization in some partsof the literature. In particular, a subset of the literature assumes thatthe time between interactions (or think time) is limited, constrainingdatabase optimization methods (e.g., [CGZ∗16,BCS16,RAK∗17]),at least for interactions of low cognitive complexity [LH14]. Ourresults show that high think times lead to slow analysis pace, andthe pace of analysts is notably slower than assumed by this priorwork, even with interaction taken into account. We also observe“bursty” behavior: participants spend some of their (think) timeplanning, then performing a relatively faster sequence of interac-tions. These results suggest that visual analysis evaluations couldbe improved via more realistic scenarios and accurate parameters.
Evaluating Goals and Structure: We next analyze participants’analysis behavior graphs — a structural model of “states” visited.We find that several assumptions of the structure of EVA are sup-ported by our analysis. For example, participants’ analysis ses-sions are consistent with a depth-first search process, confirmingarguments made in prior work [WMA∗16b]. However, our resultsalso contradict other assumptions. The literature is inconsistenton whether EVA follows clear structure and patterns, and someargue that individual differences could make EVA behaviors un-predictable [ZOC∗12]. We find that participants’ analyses exhibitstrong similarities and are somewhat predictable, but only at spe-cific points in analysis sessions. The breadth and depth of analysisgraphs are modulated by task, but the overall ratio of these mea-sures is consistent across task types. Ultimately, we find that ana-lysts’ performance and strategies during open-ended tasks can bestructurally similar to observations of more focused tasks, encour-aging us to reconsider the distinctions made between open-endedexploration and more focused analysis. Though speculative, thissimilarity may be explained by a model in which analysts withopen-ended aims formulate a series of more focused and goal-directed sub-tasks to pursue.
In sum, these results provide new perspectives on the content,structure, and efficacy of EVA sessions. We conclude with a discus-sion of how our findings might be applied to further the design ofnot only visualization tools, but also the way we evaluate them. Allanonymized data artifacts generated by this work have been sharedas a community resource for further study at https://github.com/leibatt/characterizing-eva-tableau.
2. Related Work
Our analysis builds on several areas of related work, such as log-ging interactions, modeling analysis states, and analyzing patternsin the resulting data structures. Visualization system state is of-ten recorded via histories [HMSA08], interaction logs [ED16], and
provenance tracking [LWPL11, CFS∗06, BCC∗05, SASF11]. Werely on built-in logging in Tableau [STH02] for analysis.
Visualization Theory & Process Models: Our work is informedby models of the visual analysis process developed through ex-ploratory studies, such as those by Isenberg et al. [ITC08] andGrammel et al. [GTS10]. Isenberg et al. present a framework de-scribing how teams collaborate during exploration [ITC08]. Gram-mel et al. present a model of how novice users construct visual-izations in Tableau, and barriers to the design process [GTS10].Brehmer and Munzner present a multi-level typology of visualanalysis tasks [BM13], synthesized from a review of the litera-ture on task analysis. Lam et al. review IEEE InfoVis design studypapers to evaluate how high-level goals decompose into concretetasks and visual analysis steps [LTM18]. However, like the manypapers we evaluate in our literature review, existing theoreticalwork generally lacks a clear definition of exploratory visual analy-sis (also observed by Lam et al. [LTM18]), which we aim to con-tribute in this work. Furthermore, with our focus on log analysis,our metrics are primarily quantitative in nature, providing empir-ical context for a variety of EVA assumptions from the literature.
We focus on task or action-based models in our analy-sis [GZ09,BM13,YKSJ07,LTM18], particularly fine-grained mod-els [HMSA08, YKSJ07]. We use the task model for Tableau pro-posed by Heer et al. [HMSA08], which assigns interactions inTableau to five categories: “shelf (add, remove, replace), data (bin,derive field), analysis (filter, sort), worksheet (add, delete, dupli-cate), and formatting (resize, style) commands.”.
Interaction Sequences: Interaction sequences reveal temporalrelationships between observed interactions. Guo et al. [GGZL16]identify common sequences that lead to insights. Gotz andWen [GW09] identify four common interaction sub-sequences,which they use to generate visualization recommendations. Oth-ers compute n-grams to identify common sub-sequences [BJK∗16,BCS16]. Sequences are also used to build predictive (e.g.,Markov) models, which can be used to compare analysts’ perfor-mance [RJPL16], and predict users’ future interactions [BCS16,DC17], task performance [GL12, BOZ∗14a], or personalitytraits [BOZ∗14a]. We use interaction sequences and more com-plex structures to track changes in analysis state over time. We con-tribute a new perspective on visual analysis patterns and structureusing these quantitative methods.
Behavior Graphs: Problem-solving behavior can be modeled asa set of states along with a set of operations for moving betweenstates [New72], including visual analysis [WMA∗16b, STM17,WQM∗17, SvW08, ST15, jJKMG07]. Graphs can capture morecomplex paths and patterns, such as back-tracking or state revis-itation. Alternate analysis paths are depicted as branches from ananalysis state. Branching can occur due to manipulation of anal-ysis history (e.g., undo-redo interactions). Though many projectsconsider how to display history directly to users [HMSA08], pastwork lacks a characterization of the structure of exploratory analy-sis graphs across a range of conditions (e.g., tasks and datasets). Be-havior graphs are also used in web browsing and click stream anal-ysis [CPVDW∗01, WHS∗02, LWD∗17, New72]. We leverage pastwork by similarly visualizing behavior graphs in Section 6, con-
c© 2019 The Author(s)Computer Graphics Forum c© 2019 The Eurographics Association and John Wiley & Sons Ltd.
L. Battle & J. Heer / Characterizing Exploratory Visual Analysis in Tableau
tributing a structural signature for analysis sessions, through whichdifferences in analysis strategies can be measured during EVA.
Insight-Based Evaluations: Insight-based evaluations attemptto catalog “insights” generated through open-ended visualizationuse [SND05, SNLD06, LH14, GGZL16, ZZZK18]. These methodscollect qualitative data about the EVA process, which researcherscode and analyze. While useful for identifying meaningful cogni-tive events, the veracity of reported insights must be evaluated withcare. However, having participants engage in open-ended explo-ration without clear goals and encouraging them to verbalize allinsights that come to mind may decrease accuracy in visual anal-ysis tasks. We use directed task prompts representative of visualanalysis tasks that commonly occur during EVA, ranging from fo-cused EVA tasks with verifiable answers to more open-ended, butstill goal-directed, tasks. These tasks were identified through ourliterature review. We evaluate analysts’ performance and analysisstrategies, and compare with prior insight-based studies.3. Themes in the EVA Literature
Through a review of the EVA literature we identify and discussthree major themes that appear frequently throughout: explorationgoals, structure, and performance. We then present a summary def-inition of EVA based on our findings.
3.1. Review Methodology
We utilized the following paper selection method for our review:1. Papers that analyze or design for EVA contexts were selected.2. Papers described or referenced by papers from step 1 as also
analyzing or designing for EVA were selected.3. Tasks or topics from papers from step 1 that were described as
relevant to EVA were identified. Task relevance suggested bypaper authors or study subjects was considered (e.g., subjects’comments observed by Alspaugh et al. [AZL∗19]). Then rele-vant, well-known papers that also discuss these tasks and topicswere identified, such as the work by Kandel et al. [KPHH12].These papers are only used to provide context, other irrelevanttasks or topics from these papers are excluded from our review.Step 1 yielded 39 papers and step 2 yielded 2 papers [HS12,
Shn96] for review. Step 3 Yielded 7 papers to provide additionalcontext for specific EVA topics and tasks [Lam08,HMSA08,KS12,PC05, MWN∗19, ZOC∗12, KPHH12]†.
The selected papers were reviewed to identify major themes,and three themes emerged: EVA goals, structure, and performance.These themes occurred most frequently across the selected papers,and often as core priorities, for example Battle et al. prioritizesystem performance during EVA [BCS16], and Lam et al. prior-itize understanding analysis goals in various contexts, includingEVA [LTM18]. A subsequent review was made to capture similar-ities and differences between papers with respect to these themes.
3.2. Exploration Goals
Formulation and Evolution of Goals: An oft-stated goal of EVAis the production of new insights or observations from a given
† The full list of papers yielded from each step, along with our reasoningfor the inclusion of each paper, is provided in the supplemental materials.
dataset (insight generation) [ED16, LTM18, jJKMG07, GGZL16,ZGC∗16, ZZZK18, LH14, FPDs12]. Lam et al. [LTM18] describethe goal of exploration as “Discover[ing] Observation[s]”; how-ever, this goal is vague in comparison to other visual analytic goals.Liu & Heer argue that EVA often “does not have a clear goalstate” [LH14], which is a popular sentiment in both the visual-ization [Kei01,AZL∗19,RJPL16] and database [IPC15] communi-ties. For example, Idreos et al. [IPC15] describe EVA as a situationwhere analysts may not know exactly what they are looking for, butthey will know something interesting when they see it. Keim makesa stronger argument: that EVA is more effective when the goals areless clear [Kei01]. Alspaugh et al. [AZL∗19] take this idea evenfurther by saying that exploration does not have well-formed goals;once clear goals are formed, the analysis is no longer exploration.
Others take a different view, saying that analysts’ goals evolvethroughout the course of an EVA session: the analyst starts witha vague goal, and refines and sharpens this goal as they ex-plore [RJPL16, GW09, WMA∗16b]. For example, Wongsupha-sawat et al. [WMA∗16b] describe the evolution of analysts’ goalsto motivate the Voyager system design: “Analysts’ interests willevolve as they browse their data, and so the gallery [of suggestedvisualizations] must be adaptable to more focused explorations.”
Bottom-Up Versus Top-Down Exploration: Exploration is of-ten described as “open-ended”, where many of the papers we re-viewed equate exploration with at most vaguely defined tasks (e.g.,[LH14,RJPL16,AZL∗19,ZGC∗16,ZZZK18]): visual analysis per-formed without an explicit objective, perusing a dataset for inter-esting observations. Open-endedness seems to be tightly coupledwith the notion of opportunistic analysis [Tuk77, LH14, AZL∗19,RJPL16]. For example, Alspaugh et al. [AZL∗19] argue that duringEVA, “... actions are driven in reaction to the data, in a bottom-upfashion...”. Liu & Heer [LH14] suggest that “User interaction maybe triggered by salient visual cues in the display...”. There seems tobe an argument in a subset of the literature that exploration mustbe unconstrained (e.g., by goals or tasks) to allow for an organic“bottom-up” process of uncovering new insights from a dataset.
In contrast, other projects describe scenarios where analystscome to an exploration session with a high-level goal or concretehypothesis in mind. Liu & Heer [LH14] suggest that user inter-actions during EVA may be “... driven by a priori hypotheses...”.Gotz & Zhou [GZ08] describe a specific example with a finan-cial analyst exploring stock market data to identify and prioritizewhich stocks to invest in. Perer & Shneiderman [PS08] recount ex-amples of domain analysts “trying to sift through gigabytes of ge-nomic data to understand the causes of inherited disease, to filterlegal cases in search of all relevant precedents, or to discover be-havioral patterns in social networks with billions of people.” Fisheret al. [FPDs12] study in-depth cases of EVA with three different an-alysts with specific goals; for example: “Sam is analyzing Twitterdata to understand relationships between the use of vocabulary andsentiment.” Kalinin et al. [KCZ14] describe two motivating scenar-ios, with users exploring stock data and astronomy data for records(i.e., stocks, celestial objects) with specific properties (e.g., starswith high brightness). Siddiqui et al. [SKL∗16] describe three spe-cific use cases, where scientists, advertisers and clinical researchersstruggled to successfully explore their dataset for specific visual
c© 2019 The Author(s)Computer Graphics Forum c© 2019 The Eurographics Association and John Wiley & Sons Ltd.
L. Battle & J. Heer / Characterizing Exploratory Visual Analysis in Tableau
patterns. Zgraggen et al. [ZZZK18] motivate the multiple compar-isons problem in EVA with the story of “Jean,” an employee at anon-profit who is interested in exploring his organization’s data toidentify the best gift to send to their donors. In all of these exam-ples, analysts are still performing EVA, but with concrete objectivesto structure and focus exploration. These examples contradict theassumption of a purely bottom-up analysis strategy during EVA,indicating that, for realistic scenarios, top-down goals (includingbroader organizational objectives) need to be accounted for.
From our review, we observe that discussions of EVA include aspectrum of goal specifications, from no goals at all, to clear a pri-ori goals and/or hypotheses. Analysts’ positions within this spec-trum may evolve as they learn more about their data. Furthermore,analysts may utilize both top-down (i.e., goal-directed) and bottom-up (i.e., opportunistic) strategies as they explore [RJPL16,LTM18].Thus no one strategy completely represents how exploration un-folds, and both top-down and bottom-up strategies should be con-sidered when analyzing and evaluating EVA use cases.
3.3. Exploration Structure
Phases of Exploration: EVA may involve iteration within andoscillation between phases of exploration, with analysts pursu-ing multiple branches of analysis over time [DR01, HMSA08].However, the literature is inconsistent in defining exactly whatthe different phases of EVA are. Both Battle et al. [BCS16]and Keim [Kei01] assume that EVA follows Shneiderman’sinformation-seeking mantra [Shn96]: “Overview first, zoom andfilter, details on demand”. Gotz & Zhou argue that users switchbetween two phases: browsing and querying of data to uncoverinsights, and recording their insights (e.g., writing notes) [GZ08].Heer & Shneiderman [HS12] state that EVA “typically progressesin an iterative process of view creation, exploration, and refine-ment,” where exploration happens at two levels: 1) as users interactwith specific visualizations, and 2) in a larger cycle where usersexplore different visualizations. This concept is echoed by Gram-mel et al. [GTS10]. Perer & Sheiderman [PS08] say that analystsalternate between systematic exploration (searching with thoroughcoverage of the data space) and flexible exploration (or open-endedsearch). Wongsuphasawat et al. make a similar argument, inspiredby earlier work [Tuk77]: “Exploratory visual analysis is highly it-erative, involving both open-ended exploration and targeted ques-tion answering...” [WMA∗16b]. The common theme is that EVAinvolves alternating between open-ended and focused exploration.
EVA and Search: Terms like “query” [GZ08, LKS13, KJTN14,DPD14, KCZ14, SKL∗16], “browse” [LH14, GGZL16, BCS16],and “search” [KS12, WMA∗16b, PS08] are frequently associatedwith visual exploration. In EVA, users are often searching for novelobservations in a dataset, which could inform or validate future hy-potheses [Kei01,LH14,GZ08,RJPL16,AZL∗19,ZZZK18]. Jankun-Kelly et al. [jJKMG07] observe that earlier EVA systems “assumevisualization exploration is equivalent to navigating a multidimen-sional parameter space,” essentially a directed search of the param-eter space of data transformations and visual encodings — a modelsubsequently adopted by visualization recommenders such as Com-passQL [WMA∗16a] and Draco [MWN∗19]. Perer & Shneider-man [PS08] make a similarly strong connection between EVA and
search by incorporating support for what they call “systematic ex-ploration,” an exploration strategy that “guarantees that all mea-sures, dimensions and features of a data set are studied.” Oth-ers [DPD14, KCZ14, VRM∗15, SKL∗16, DHPP17] propose tech-niques to automatically search the data space for interesting data re-gions or collections of visualizations for the user to review. The ideaof searching for insights shares strong similarities with Pirolli &Card’s Information Foraging loop [PC05], in particular the “Readand extract” action, where users extract observations or “evidence”that may “trigger new hypotheses and searches”. Thus existingmodels of search behavior may play an important role in under-standing behavioral patterns and analysis structure in EVA.
Analysis Tasks: Analysts seem to decompose their analyses intosmaller tasks and subtasks [GZ08, RJPL16, AES05], where tasksmay be re-used across datasets [PS08]. In the literature, we observea consensus that EVA involves specific low-level visual analyticstasks and that specific classes of tasks occur frequently in EVA:
• understanding data correctness and semantics [PS08, AZL∗19,KS12] (overlaps with “profiling” [KPHH12]),
• characterizing data distributions and relationships [Tuk77,PS08,IPC15, SKL∗16, AZL∗19, ZZZK18, CGZ∗16, KS12, SKL∗16,AES05] (overlaps with“profiling” and “modeling” [KPHH12]),
• analyzing causal relationships [PS08, HS12, STH02] (overlapswith “modeling” [KPHH12]),
• hypothesis formulation and verification [PS08, Kei01, LH14,RJPL16, SKL∗16, AES05, AZL∗19],
• and decision making [RJPL16, RAK∗17, KJTN14].
For example, Stolte et al. [STH02] describe EVA as the processof “extract[ing] meaning from data: to discover structure, find pat-terns, and derive causal relationships.” In similar spirit, Perer &Shneiderman [PS08] argue that during EVA, analysts seek to “...un-derstand patterns, discern relationships, identify outliers, and dis-cover gaps.” Alspaugh et al. [AZL∗19] find that analysts describeseveral of their own activities as exploration activities, which werere-classified by Alspaugh et al. as understanding data semantics andcorrectness or characterizing data distributions and relationships.
Interactions: EVA involves sequences of small, incrementalsteps (i.e., interactions) to formulate and answer questions aboutthe data [HMSA08, GW09, WMA∗16b]. Iteration could manifestas multiple interactions with the same data/visualization state, or amove to a new state. Interactions play an integral role in helping an-alysts explore their data [YKSJ07, HS12, jJKMG07, PSCO09]. Forexample, Jankun-Kelly et al. argue that “... the interaction with boththe data and its depiction is as important as the data and depictionitself” [jJKMG07]. Intuitively this makes sense, as (inter)actionsare the building blocks to complete low-level EVA tasks [GZ08].
Predictability: EVA is also described as “unpredictable”[STH02], where it may be unclear what the user will do throughoutan EVA session. Many factors may influence predictability. A crit-ical question is whether analysts will produce similar results whenperforming similar EVA tasks. If analysts approach an EVA taskdifferently, then the outcomes will be hard to predict. If analysts ar-rive at similar answers, with notable overlap in strategies, then theremay be opportunities to predict future outcomes [DC17, BCS16].Ziemkiewicz et al. [ZOC∗12] argue that differences in users’ indi-vidual experiences drive differences in analysis outcomes with vi-
c© 2019 The Author(s)Computer Graphics Forum c© 2019 The Eurographics Association and John Wiley & Sons Ltd.
L. Battle & J. Heer / Characterizing Exploratory Visual Analysis in Tableau
sual analysis tools. It is unclear whether analysts generally utilizesimilar analysis sequences during EVA, or arrive at similar answersto EVA tasks and subtasks, requiring further investigation.
3.4. Exploration Performance
An ambitious goal of visual analytics is to support “fluent and flex-ible use of visualizations at rates resonant with the pace of humanthought” [HS12]. Liu & Heer divide [LH14] this goal into two spe-cific research questions: “... understanding the rate of cognitive ac-tivities in the context of visualization, and supporting these cogni-tive processes through appropriately designed and performant sys-tems.” Here we discuss themes in the literature focused on measur-ing, supporting and improving: 1) the exploration pace and accu-racy of end users and 2) the performance of EVA systems.
Pacing and Analyst Performance: A number of methods havebeen developed to measure the pace of exploration. Interaction rate,or the number of interactions performed per unit time, is a com-mon measure of exploration pacing [LH14, ZZZK18, FPH19]. In-sight generation rate is also a prominent pacing metric, particularlyfor open-ended exploration tasks [ED16,LH14,GGZL16,ZGC∗16,ZZZK18]. Feng et al. [FPH19] propose new metrics, such as ex-ploration uniqueness, to capture more nuanced information fromcasual, open-ended exploration sessions on the web.
Several observations regard how users’ selection of interactionscan affect exploration pacing. Guo et al. [GGZL16] find that moreexploration-focused interactions lead to more insights being gen-erated. More broadly, Lam [Lam08] observes that high cognitiveload can impact visual analytic performance. Extrapolating fromthis observation, high cognitive load interactions, such as writing aSQL query, could lead to a slower exploration pace.
Zgraggen et al. [ZZZK18] argue that not only the number of in-sights, but also the quality of insights are critical to gauging theeffectiveness of EVA. Their study finds a 60% rate of false discov-eries (i.e., insights that do not hold for the population-level data) forunconstrained, open-ended exploration by novices. They ultimatelyargue that EVA systems should help users formulate a reliable men-tal model of the data, for example more accurate insights.
Wongsuphasawat et al. [WMA∗16b] evaluate the number ofunique data attribute combinations explored by users, to gaugewhether exploration sessions increase in breadth when users areprovided with useful visualization recommendations. Though not adirect pacing metric, exploration breadth can contribute to an over-all understanding of analysts’ performance.
System Performance: We note a general consensus within boththe database and visualization communities that response time la-tency is a critical performance measure for EVA systems. For ex-ample, Liu & Heer [LH14] observe that high response time laten-cies (500ms or longer) can impede exploration performance andprogress, where analysts may be more sensitive to high latencies forsome interactions (e.g., brush filters) over others (e.g., zooming).Zgraggen et al. [ZGC∗16] observe similar outcomes when evaluat-ing progressive visualizations. Idreos et al. [IPC15] survey a rangeof database projects focused on optimization and performance forEVA contexts, and also observe that response time latency is theprimary performance measure within these projects.
To study the effects of latency, both Liu & Heer [LH14] andZgraggen et al. [ZZZK18] inject latency into EVA systems andmeasure the resulting interaction rates of analysts to gauge systemperformance. The idea is that latency will likely slow the user’s ex-ploration progress, resulting in fewer interactions over time. Crottyet al. [CGZ∗16] propose optimizations to reduce system latencyfor big data EVA contexts, in an effort to improve interaction rates.Rather than measuring interaction rates, one can instead measurethe average or worst case latencies observed per interaction, whichseveral database research projects utilize to evaluate optimizationsfor EVA systems [CXGH08,KJTN14,BCS16,CGZ∗16,RAK∗17].
To measure effects over an entire EVA session, alternative met-rics include total exploration time (i.e., the duration of a single EVAsession) [DPD14, FPH19], and total user effort (i.e., total interac-tions performed) [DC17,DPD14,GW09,FPH19]. These metrics areoften utilized to gauge whether recommendation-focused optimiza-tions help users to spend less time and effort exploring the data toachieve their analysis goals [DPD14].
Pacing Optimization Constraints: Multiple projects furtherconstrain EVA system optimization by not only positing latencyconstraints (e.g., system response time latencies under 500ms), butalso assuming a rapid pace of exploration, where users quickly per-form successive interactions. For example, Gotz & Zhou [GZ08]argue that “During a visual analytic task, users typically performa very large number of activities at a very fast pace,” implyingthat users perform interactions quickly during most visual ana-lytic tasks (including EVA). Narrowing the scope to EVA, Fisheret al. [FPDs12] argue that “In exploratory data visualization, itis common to rapidly iterate through different views and queriesabout a data-set.” In a more recent example, Battle et al. [BCS16]deploy new optimizations to reduce response time latency for pan-and-zoom applications by prefetching data regions (i.e., data tiles)that the user may pan or zoom to next. Battle et al. argue that dueto the presumably fast pace of EVA, the system “... may only havetime to fetch a small number of tiles before the user’s next request,”motivating a need for accurate and efficient prediction and prioriti-zation of the set of tiles to prefetch before the user’s next interac-tion. This work seems to argue that due to the fast pace of EVA, thetime between interactions (or think time) is restricted, limiting howwe deploy sophisticated (e.g., predictive) optimizations for EVA.
3.5. Synthesized Definition of EVA
Exploratory data analysis (or EDA, originally coined by JohnTukey [Tuk77]) encompasses the tasks of learning about and mak-ing sense of a new dataset. We define exploratory visual analysis(or EVA) as a subset of exploratory data analysis, where visualiza-tions are the primary output medium and input interface for explo-ration. EVA is often viewed as a high-level analysis goal, which canrange from being precise (e.g., exploring an existing hypothesis orhunch) to quite vague (e.g., wanting to find something “interest-ing” in the data). During EVA, the analyst updates and refines theirgoals through subsequent interactions with and manipulation of thenew dataset. Due to the inherent complexity in accomplishing high-level exploration goals, analysts often decompose their explorationinto a series of more focused visual analysis subtasks, which in turncould be partitioned further into smaller subtasks, and so on. Sev-eral visual analysis subtasks are commonly associated with EVA:
c© 2019 The Author(s)Computer Graphics Forum c© 2019 The Eurographics Association and John Wiley & Sons Ltd.
L. Battle & J. Heer / Characterizing Exploratory Visual Analysis in Tableau
assessing the quality and semantics of the data, discovering un-derlying relationships and statistical distributions within the data,formulating and verifying hypotheses, and evaluating causality ormore complex models on the data. These subtasks are not unique toEVA, but occur often during EVA contexts nonetheless, and rangefrom being more focused (i.e., data quality assessment) to moreopen-ended (i.e., causality analysis and modeling).
We note that this definition is quite broad, revealing a lack ofprecision and consistency in how EVA is discussed in the literature.
3.6. Summary
We now summarize our review and posit research questions, focus-ing on topics that lack consensus or corroborating evidence.
Goals Summary: Discrepancies across the literature suggestthat we lack a shared definition that covers the various ways EVAgoals are formulated. Analysts who perform EVA may come to itwith a clear intent (i.e., explicit goals and tasks), with no clear intent(i.e., no pre-conceived goals or tasks), or somewhere in between(i.e., vague goals, a few initial tasks). As such, it seems beneficialto account for both top-down (i.e., focused) and bottom-up (i.e., op-portunistic) exploration strategies when evaluating EVA behavior.We utilize these insights in the design of our exploratory study.
Structure Summary: Prior work suggests that actions and tasksduring EVA are not purely opportunistic: exploration behavior isnot only dependent on what is observed from the data, but alsoon the analyst’s goals and experience [PS08, RJPL16]. Analystsmay incorporate concrete analysis steps or tasks that they have per-formed in the past. However, analysts may select among these tasksopportunistically, based on what they observe in the data. Thus ex-ploration sessions appear to have some structure to them, thoughthe discrepancies in the literature make it difficult to reason aboutwhat structural properties to expect for a specific exploration usecase (i.e., for real log data collected from a study on EVA). Here,we focus on two specific aspects of EVA structure, organization andoverlap (or predictability):
• (S1): How are focused and open-ended EVA sessions organized(e.g., are they breadth- or depth-oriented)? (Section 6.2)
• (S2): How predictable are participants’ EVA paths, given differ-ences in task specificity/open-endedness? (Section 6.3)
Performance Summary: We find consensus around popularperformance metrics for EVA (interaction rates, response time la-tency) and their outcomes (latency hinders exploration). However,more recent metrics and assumptions have only been measured ina limited number of experiments: the accuracy of insights, and ex-ploration breadth, uniqueness, and pace. We focus on two metricsin our performance analysis, accuracy and pacing:
• (P1): How does the accuracy of EVA compare for focused, goal-directed EVA? (Section 5.1)
• (P2): How does the pace of EVA influence available time fordeploying system optimizations? (Section 5.2)
4. Exploratory Study Design
Our literature review answers some questions, but also producesnew ones. To further investigate our research questions in Sec-tion 3.6, we designed an exploratory study of analysis behavior.
Our goal in the study design is to capture realistic visual analy-sis behavior during specific analytic subtasks relevant to EVA. Toensure that participants could use a familiar tool, we selected thecommercial tool Tableau for analysis. Even one commercial toolcan still provide useful insights into the strategies and needs of endusers [GTS10,HMSA08,BDM∗18]. Therefore, we focused our ef-forts on this one tool, allowing us ensure it was properly instru-mented, designing realistic visual analysis subtasks for analysis,and recruiting local analysts with Tableau experience to participate.We discuss the limitations of our study design in Section 4.6.
4.1. Participants
We recruited participants via university mailing lists and localTableau User Groups (e.g., message boards, meet-ups). 27 Tableauusers participated in the study (10 male, 17 female, age 23-47years). 22 participants were recruited from our university cam-pus, 5 from our metropolitan area. Participants had no prior ex-perience with the study datasets, and used Tableau either for work,or through classes. Participants varied widely in Tableau and dataanalysis experience, from just learning Tableau (including 13 stu-dents) to seasoned veteran analysts to Tableau power users.
4.2. Protocol
Participants completed an initial survey online. Qualifying partici-pants completed a 90-120 minute in-person session (on campus, orat their workplace), consisting of: 1) study overview and consentform; 2) 5 minute warm-up with Tableau on a movies dataset; 3)30 minute analysis block with one dataset; 4) 30 minute block withanother dataset; and 5) exit survey. Analysis blocks included a 5minute warm-up for the given dataset. Task sheets were provided,with 4 visual analysis subtasks to complete per block (8 total). Sub-task prompts were printed for participants, as well as a dataset sup-plement document defining the data attributes, and a map of theUSA. Participants were allowed to take notes, if desired, and werecompensated with a $25 Amazon gift card. A 15-inch Macbook Prowith Tableau Desktop pre-installed was provided to participants.Datasets were loaded directly into Tableau Desktop 10.3 (the latestversion that supported the logging features required for analysis).
4.3. Datasets
We evaluate three real-world datasets, selected for similar complex-ity, sufficiently large size to simulate large-scale analysis, relevanceto real-world questions (irrelevant attributes were removed). Fur-thermore, we selected datasets used in previous studies of visualanalysis and exploration behavior: flight performance data [LH14],wildlife strikes [WMA∗16b], and weather data [KH18].
1. FAA (31 columns, 34.5M rows, 5.36GB)‡: recorded flights,with itinerary (destination, distance, etc.) and performance mea-sures (arrival delays, cancellations, etc.).
2. Weather (35 columns, 56.2M rows, 3.53GB)§: daily weatherstation reports, containing measures (precipitation, temperature,etc.) and observed phenomena (e.g., tornados, ground fog, etc.)
‡ https://www.transtats.bts.gov/Tables.asp?DB_ID=120§ https://www.ncdc.noaa.gov/ghcn-daily-description
c© 2019 The Author(s)Computer Graphics Forum c© 2019 The Eurographics Association and John Wiley & Sons Ltd.
L. Battle & J. Heer / Characterizing Exploratory Visual Analysis in Tableau
Dataset Subtask Prompt
Birdstrikes T1Consider these four parts of the aircraft: engine 1 ([Dam Eng1]), engine 2 ([Dam Eng2]), thewindshield ([Dam Windshield]), and wing/rotor ([Dam Wing Rot]). Which parts of the aircraftappear to get damaged the most?
Birdstrikes T2Which aircraft classes ([Ac Class]), if any, appear to be more susceptible to damage ([Damage])from animal strikes? Note that [Damage] also records when no damage has occurred.
Birdstrikes T3What relationships (if any) do you observe involving weather conditions ([Precip], [Sky]) andstrike frequency, or counts over time ([Incident Date])?
Birdstrikes T4What are the most common conditions for an animal strike? Note that this is not limited toweather conditions, any dataset columns that are interesting to you can be included.
FAA T1How do cancelled flights ([Cancelled]), diverted flights ([Diverted]), and delayed flights([ArrDelay], [DepDelay]) compare in terms of counts or frequency?
FAA T2What patterns (if any) do you observe in the count of flights over time ([FlightDate])? If anypatterns are observed, what deviations (if any) do you see for individual airlines ([UniqueCarrier])?
FAA T3What relationships (if any) do you find involving flight distance ([Distance]) and arrivaldelays ([ArrDelay])?
FAA T4Suppose Delta Airlines wants to expand 3 airports. Based on your analysis of the data, which3 airports would you recommend to Delta Airlines (airport code DL)? Existing Delta Airlinesairports, and/or airports that Delta doesn’t cover, can be included in your analysis.
Weather T1Consider the following weather measurements: Heavy Fog ([Heavy Fog]), Mist ([Mist]),Drizzle ([Drizzle]), and Ground Fog ([Ground Fog]). Which measurements have more data?Which weather measures (if any) would you remove from the dataset?
Weather T2How have maximum temperatures ([T Max]) and minimum temperatures ([T Min]) changedover the duration of the dataset (i.e., over the [Date] column)?
Weather T3How do the wind ([High Winds]) measurements compare for the northeast and southwestregions of the US?
Weather T4 What weather predictions would you make for February 14th 2018 in Seattle, and why?
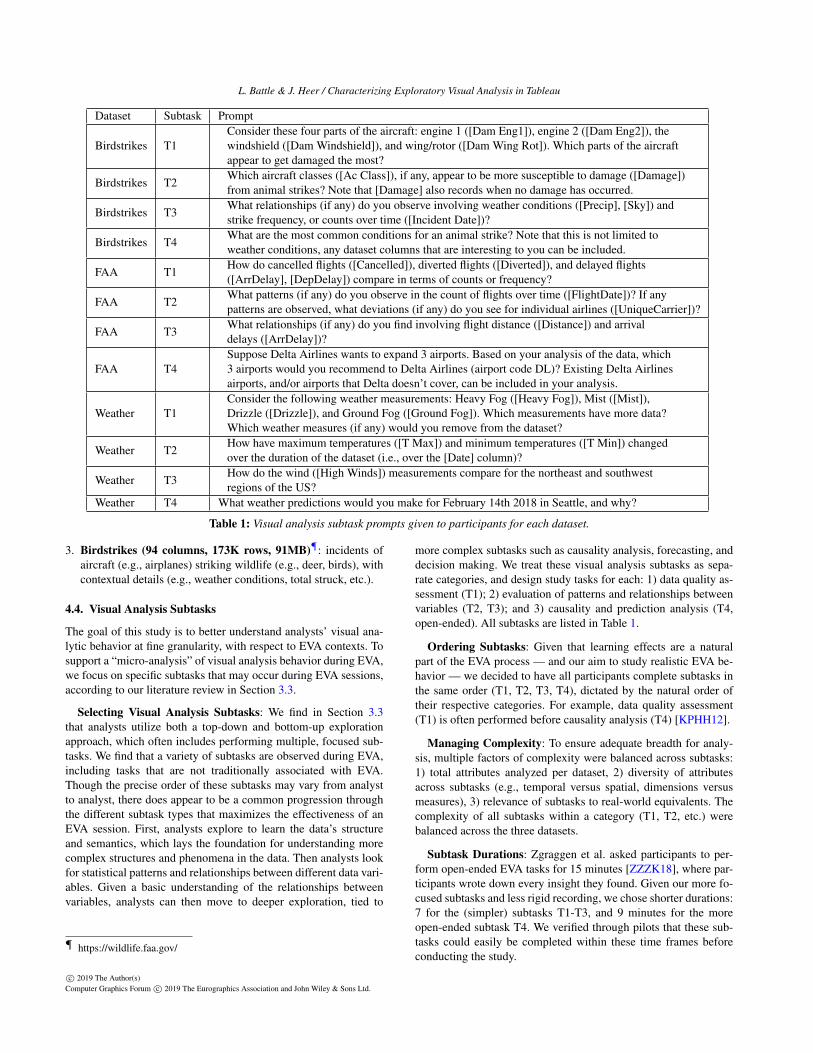
Table 1: Visual analysis subtask prompts given to participants for each dataset.
3. Birdstrikes (94 columns, 173K rows, 91MB)¶: incidents ofaircraft (e.g., airplanes) striking wildlife (e.g., deer, birds), withcontextual details (e.g., weather conditions, total struck, etc.).
4.4. Visual Analysis Subtasks
The goal of this study is to better understand analysts’ visual ana-lytic behavior at fine granularity, with respect to EVA contexts. Tosupport a “micro-analysis” of visual analysis behavior during EVA,we focus on specific subtasks that may occur during EVA sessions,according to our literature review in Section 3.3.
Selecting Visual Analysis Subtasks: We find in Section 3.3that analysts utilize both a top-down and bottom-up explorationapproach, which often includes performing multiple, focused sub-tasks. We find that a variety of subtasks are observed during EVA,including tasks that are not traditionally associated with EVA.Though the precise order of these subtasks may vary from analystto analyst, there does appear to be a common progression throughthe different subtask types that maximizes the effectiveness of anEVA session. First, analysts explore to learn the data’s structureand semantics, which lays the foundation for understanding morecomplex structures and phenomena in the data. Then analysts lookfor statistical patterns and relationships between different data vari-ables. Given a basic understanding of the relationships betweenvariables, analysts can then move to deeper exploration, tied to
¶ https://wildlife.faa.gov/
more complex subtasks such as causality analysis, forecasting, anddecision making. We treat these visual analysis subtasks as sepa-rate categories, and design study tasks for each: 1) data quality as-sessment (T1); 2) evaluation of patterns and relationships betweenvariables (T2, T3); and 3) causality and prediction analysis (T4,open-ended). All subtasks are listed in Table 1.
Ordering Subtasks: Given that learning effects are a naturalpart of the EVA process — and our aim to study realistic EVA be-havior — we decided to have all participants complete subtasks inthe same order (T1, T2, T3, T4), dictated by the natural order oftheir respective categories. For example, data quality assessment(T1) is often performed before causality analysis (T4) [KPHH12].
Managing Complexity: To ensure adequate breadth for analy-sis, multiple factors of complexity were balanced across subtasks:1) total attributes analyzed per dataset, 2) diversity of attributesacross subtasks (e.g., temporal versus spatial, dimensions versusmeasures), 3) relevance of subtasks to real-world equivalents. Thecomplexity of all subtasks within a category (T1, T2, etc.) werebalanced across the three datasets.
Subtask Durations: Zgraggen et al. asked participants to per-form open-ended EVA tasks for 15 minutes [ZZZK18], where par-ticipants wrote down every insight they found. Given our more fo-cused subtasks and less rigid recording, we chose shorter durations:7 for the (simpler) subtasks T1-T3, and 9 minutes for the moreopen-ended subtask T4. We verified through pilots that these sub-tasks could easily be completed within these time frames beforeconducting the study.
c© 2019 The Author(s)Computer Graphics Forum c© 2019 The Eurographics Association and John Wiley & Sons Ltd.
L. Battle & J. Heer / Characterizing Exploratory Visual Analysis in Tableau
4.5. Data Collection & Processing
Data Sources: We collected raw logs from Tableau Desktop andTableau Data Engine (or TDE, an internal database system). Screencapture was also recorded to contextualize our log analysis. Datafrom one participant was removed due to experiment error.
Interactions: All events were extracted from the logs and com-pared with the screen capture to identify interactions (e.g., add at-tributes to shelf, change mark type, etc.). These events were thenlabeled with established interaction types [HMSA08].
Shelf State and Visual Encodings: Tableau automaticallyrecords shelf state (Row, Column, Filter, and Encoding shelves).These entries were extracted and then stored with their correspond-ing interactions in a larger master log (matched via timestamps).
Data Transformations and Queries: Data transformationswere extracted from Tableau shelf state (e.g., sum:snow,count:damage), as well as TDE logs. Tableau uses a separatequery language to interact with the TDE. We developed a parserfor the Tableau queries to perform the parameter extraction.
4.6. Study Design Limitations
Our study design differs significantly from previous studies of EVAbehavior, which generally preserve the natural structure of entireexploration sessions, rather than capturing a series of focused sub-tasks. Our analysis does not capture a completely faithful represen-tation of EVA, but instead simulates (some of) its individual parts.Understandably, this design will not allow us to make high-levelinferences about EVA behavior. However, what we lose in con-textual accuracy (i.e., capturing complete EVA sessions) we par-tially make up for in precision (i.e., knowing exactly what subtaskis being performed and when). This study design helps us to betterunderstand specific, low-level behavioral patterns, and the signif-icance of these patterns within common visual analysis subtasksthat can occur during EVA (as well as other analysis contexts).
We note here that some important aspects of EVA sessions arestill preserved in our design, such as selecting subtasks that occurduring EVA, and imposing a subtask ordering that aims to maxi-mize the effectiveness of the selected subtasks for EVA contexts.For example, an analyst will not be able to make sense of relation-ships between data attributes (subtasks T2 and T3) without first ver-ifying their understanding of the individual attributes themselves(subtask T1). Similarly, an analyst will not be able to effectivelymake predictions or assess causality amongst data attributes (sub-task T4) without first identifying and understanding the underlyingrelationships between them (subtasks T2 and T3).
5. Task Performance
We report on the accuracy and pacing of study participants, andcompare our results to assumptions in the literature.
5.1. Evaluating Task Completion Rates & Accuracy (P1)
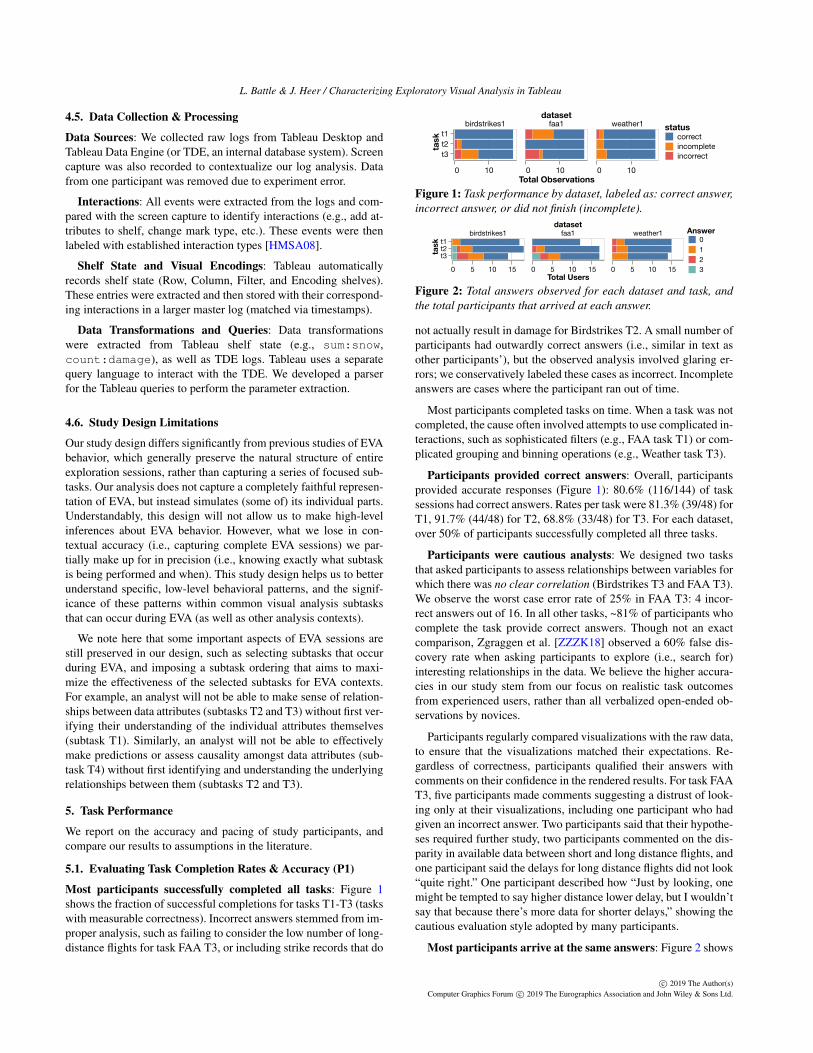
Most participants successfully completed all tasks: Figure 1shows the fraction of successful completions for tasks T1-T3 (taskswith measurable correctness). Incorrect answers stemmed from im-proper analysis, such as failing to consider the low number of long-distance flights for task FAA T3, or including strike records that do
datasetbirdstrikes1 faa1 weather1
t1t2t3
task
0 10 0 10Total Observations
0 10
correctincompleteincorrect
status
Figure 1: Task performance by dataset, labeled as: correct answer,incorrect answer, or did not finish (incomplete).
dataset
t1t2t3ta
sk
birdstrikes1 faa1 weather1
0 5 10 15 0 5 10 15Total Users
0 5 10 15
0123
Answer
Figure 2: Total answers observed for each dataset and task, andthe total participants that arrived at each answer.
not actually result in damage for Birdstrikes T2. A small number ofparticipants had outwardly correct answers (i.e., similar in text asother participants’), but the observed analysis involved glaring er-rors; we conservatively labeled these cases as incorrect. Incompleteanswers are cases where the participant ran out of time.
Most participants completed tasks on time. When a task was notcompleted, the cause often involved attempts to use complicated in-teractions, such as sophisticated filters (e.g., FAA task T1) or com-plicated grouping and binning operations (e.g., Weather task T3).
Participants provided correct answers: Overall, participantsprovided accurate responses (Figure 1): 80.6% (116/144) of tasksessions had correct answers. Rates per task were 81.3% (39/48) forT1, 91.7% (44/48) for T2, 68.8% (33/48) for T3. For each dataset,over 50% of participants successfully completed all three tasks.
Participants were cautious analysts: We designed two tasksthat asked participants to assess relationships between variables forwhich there was no clear correlation (Birdstrikes T3 and FAA T3).We observe the worst case error rate of 25% in FAA T3: 4 incor-rect answers out of 16. In all other tasks, ~81% of participants whocomplete the task provide correct answers. Though not an exactcomparison, Zgraggen et al. [ZZZK18] observed a 60% false dis-covery rate when asking participants to explore (i.e., search for)interesting relationships in the data. We believe the higher accura-cies in our study stem from our focus on realistic task outcomesfrom experienced users, rather than all verbalized open-ended ob-servations by novices.
Participants regularly compared visualizations with the raw data,to ensure that the visualizations matched their expectations. Re-gardless of correctness, participants qualified their answers withcomments on their confidence in the rendered results. For task FAAT3, five participants made comments suggesting a distrust of look-ing only at their visualizations, including one participant who hadgiven an incorrect answer. Two participants said that their hypothe-ses required further study, two participants commented on the dis-parity in available data between short and long distance flights, andone participant said the delays for long distance flights did not look“quite right.” One participant described how “Just by looking, onemight be tempted to say higher distance lower delay, but I wouldn’tsay that because there’s more data for shorter delays,” showing thecautious evaluation style adopted by many participants.
Most participants arrive at the same answers: Figure 2 shows
c© 2019 The Author(s)Computer Graphics Forum c© 2019 The Eurographics Association and John Wiley & Sons Ltd.
L. Battle & J. Heer / Characterizing Exploratory Visual Analysis in Tableau
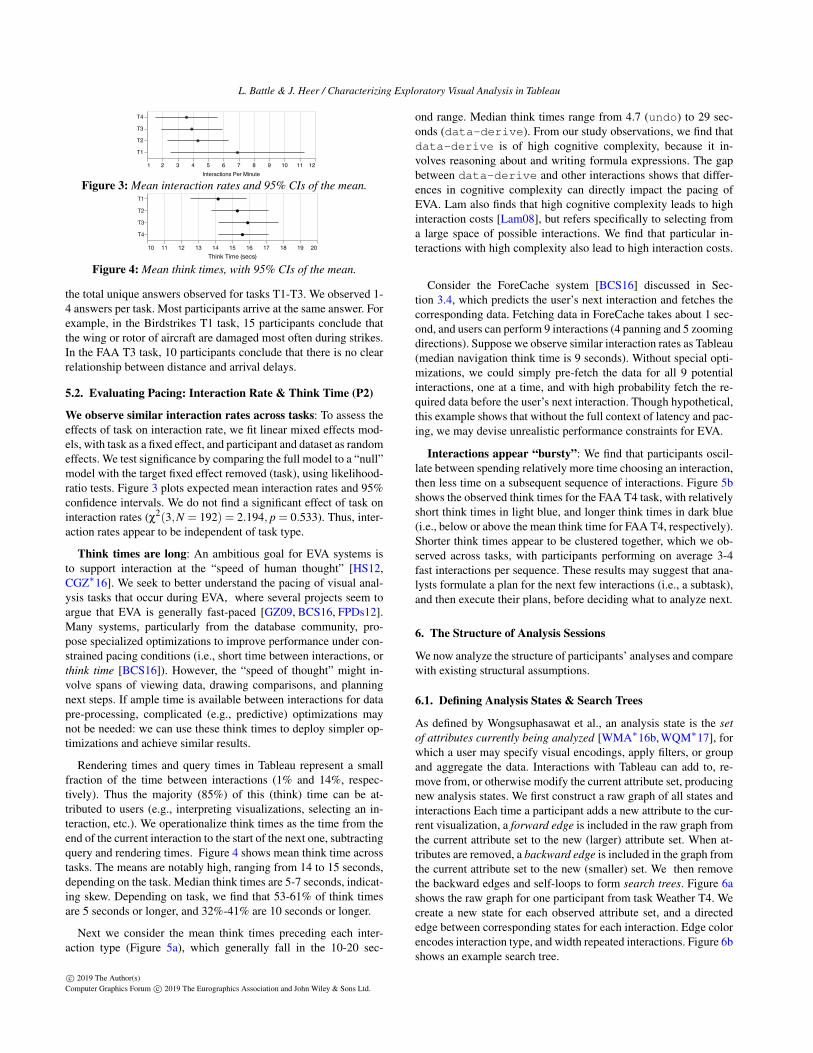
1 2 3 4 5 6 7 8 9 10 11 12Interactions Per Minute
T4
T3
T2
T1
Figure 3: Mean interaction rates and 95% CIs of the mean.
10 11 12 13 14 15 16 17 18 19 20Think Time (secs)
T1
T2
T3
T4
Figure 4: Mean think times, with 95% CIs of the mean.
the total unique answers observed for tasks T1-T3. We observed 1-4 answers per task. Most participants arrive at the same answer. Forexample, in the Birdstrikes T1 task, 15 participants conclude thatthe wing or rotor of aircraft are damaged most often during strikes.In the FAA T3 task, 10 participants conclude that there is no clearrelationship between distance and arrival delays.
5.2. Evaluating Pacing: Interaction Rate & Think Time (P2)
We observe similar interaction rates across tasks: To assess theeffects of task on interaction rate, we fit linear mixed effects mod-els, with task as a fixed effect, and participant and dataset as randomeffects. We test significance by comparing the full model to a “null”model with the target fixed effect removed (task), using likelihood-ratio tests. Figure 3 plots expected mean interaction rates and 95%confidence intervals. We do not find a significant effect of task oninteraction rates (χ2(3,N = 192) = 2.194, p = 0.533). Thus, inter-action rates appear to be independent of task type.
Think times are long: An ambitious goal for EVA systems isto support interaction at the “speed of human thought” [HS12,CGZ∗16]. We seek to better understand the pacing of visual anal-ysis tasks that occur during EVA, where several projects seem toargue that EVA is generally fast-paced [GZ09, BCS16, FPDs12].Many systems, particularly from the database community, pro-pose specialized optimizations to improve performance under con-strained pacing conditions (i.e., short time between interactions, orthink time [BCS16]). However, the “speed of thought” might in-volve spans of viewing data, drawing comparisons, and planningnext steps. If ample time is available between interactions for datapre-processing, complicated (e.g., predictive) optimizations maynot be needed: we can use these think times to deploy simpler op-timizations and achieve similar results.
Rendering times and query times in Tableau represent a smallfraction of the time between interactions (1% and 14%, respec-tively). Thus the majority (85%) of this (think) time can be at-tributed to users (e.g., interpreting visualizations, selecting an in-teraction, etc.). We operationalize think times as the time from theend of the current interaction to the start of the next one, subtractingquery and rendering times. Figure 4 shows mean think time acrosstasks. The means are notably high, ranging from 14 to 15 seconds,depending on the task. Median think times are 5-7 seconds, indicat-ing skew. Depending on task, we find that 53-61% of think timesare 5 seconds or longer, and 32%-41% are 10 seconds or longer.
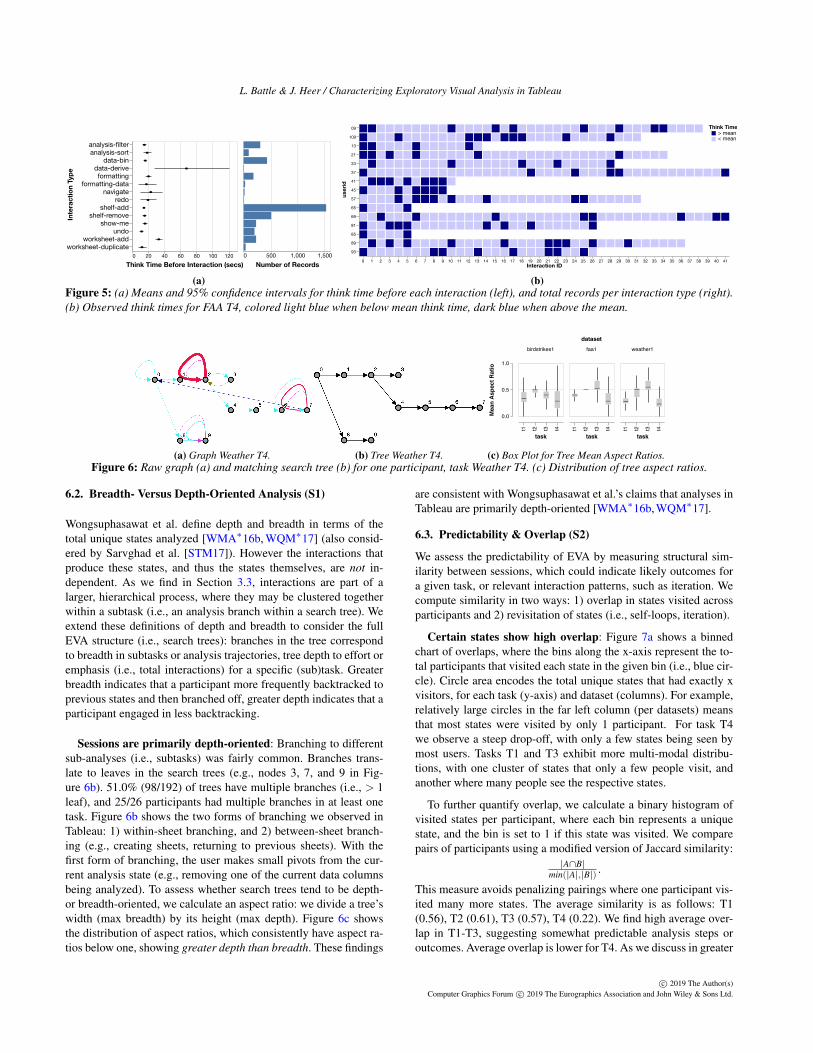
Next we consider the mean think times preceding each inter-action type (Figure 5a), which generally fall in the 10-20 sec-
ond range. Median think times range from 4.7 (undo) to 29 sec-onds (data-derive). From our study observations, we find thatdata-derive is of high cognitive complexity, because it in-volves reasoning about and writing formula expressions. The gapbetween data-derive and other interactions shows that differ-ences in cognitive complexity can directly impact the pacing ofEVA. Lam also finds that high cognitive complexity leads to highinteraction costs [Lam08], but refers specifically to selecting froma large space of possible interactions. We find that particular in-teractions with high complexity also lead to high interaction costs.
Consider the ForeCache system [BCS16] discussed in Sec-tion 3.4, which predicts the user’s next interaction and fetches thecorresponding data. Fetching data in ForeCache takes about 1 sec-ond, and users can perform 9 interactions (4 panning and 5 zoomingdirections). Suppose we observe similar interaction rates as Tableau(median navigation think time is 9 seconds). Without special opti-mizations, we could simply pre-fetch the data for all 9 potentialinteractions, one at a time, and with high probability fetch the re-quired data before the user’s next interaction. Though hypothetical,this example shows that without the full context of latency and pac-ing, we may devise unrealistic performance constraints for EVA.
Interactions appear “bursty”: We find that participants oscil-late between spending relatively more time choosing an interaction,then less time on a subsequent sequence of interactions. Figure 5bshows the observed think times for the FAA T4 task, with relativelyshort think times in light blue, and longer think times in dark blue(i.e., below or above the mean think time for FAA T4, respectively).Shorter think times appear to be clustered together, which we ob-served across tasks, with participants performing on average 3-4fast interactions per sequence. These results may suggest that ana-lysts formulate a plan for the next few interactions (i.e., a subtask),and then execute their plans, before deciding what to analyze next.
6. The Structure of Analysis Sessions
We now analyze the structure of participants’ analyses and comparewith existing structural assumptions.
6.1. Defining Analysis States & Search Trees
As defined by Wongsuphasawat et al., an analysis state is the setof attributes currently being analyzed [WMA∗16b, WQM∗17], forwhich a user may specify visual encodings, apply filters, or groupand aggregate the data. Interactions with Tableau can add to, re-move from, or otherwise modify the current attribute set, producingnew analysis states. We first construct a raw graph of all states andinteractions Each time a participant adds a new attribute to the cur-rent visualization, a forward edge is included in the raw graph fromthe current attribute set to the new (larger) attribute set. When at-tributes are removed, a backward edge is included in the graph fromthe current attribute set to the new (smaller) set. We then removethe backward edges and self-loops to form search trees. Figure 6ashows the raw graph for one participant from task Weather T4. Wecreate a new state for each observed attribute set, and a directededge between corresponding states for each interaction. Edge colorencodes interaction type, and width repeated interactions. Figure 6bshows an example search tree.
c© 2019 The Author(s)Computer Graphics Forum c© 2019 The Eurographics Association and John Wiley & Sons Ltd.
L. Battle & J. Heer / Characterizing Exploratory Visual Analysis in Tableau
0 500 1,000 1,500Number of Records
0 20 40 60 80 100 120
Think Time Before Interaction (secs)
analysis-filteranalysis-sort
data-bindata-deriveformatting
formatting-datanavigate
redoshelf-add
shelf-removeshow-me
undoworksheet-add
worksheet-duplicate
Inte
ract
ion
Type
(a)
> mean< mean
Think Time
0 1 2 3 4 5 6 7 8 9 10 11 12 13 14 15 16 17 18 19 20 21 22 23 24 25 26 27 28 29 30 31 32 33 34 35 36 37 38 39 40 41Interaction ID
09
109
13
21
33
37
41
45
57
65
69
81
85
89
93
user
id
(b)Figure 5: (a) Means and 95% confidence intervals for think time before each interaction (left), and total records per interaction type (right).(b) Observed think times for FAA T4, colored light blue when below mean think time, dark blue when above the mean.
(a) Graph Weather T4. (b) Tree Weather T4.
dataset
0.0
0.5
1.0
Mea
n A
spec
t Rat
io
birdstrikes1 faa1 weather1
t1 t2 t3 t4
task
t1 t2 t3 t4
task
t1 t2 t3 t4
task
(c) Box Plot for Tree Mean Aspect Ratios.Figure 6: Raw graph (a) and matching search tree (b) for one participant, task Weather T4. (c) Distribution of tree aspect ratios.
6.2. Breadth- Versus Depth-Oriented Analysis (S1)
Wongsuphasawat et al. define depth and breadth in terms of thetotal unique states analyzed [WMA∗16b, WQM∗17] (also consid-ered by Sarvghad et al. [STM17]). However the interactions thatproduce these states, and thus the states themselves, are not in-dependent. As we find in Section 3.3, interactions are part of alarger, hierarchical process, where they may be clustered togetherwithin a subtask (i.e., an analysis branch within a search tree). Weextend these definitions of depth and breadth to consider the fullEVA structure (i.e., search trees): branches in the tree correspondto breadth in subtasks or analysis trajectories, tree depth to effort oremphasis (i.e., total interactions) for a specific (sub)task. Greaterbreadth indicates that a participant more frequently backtracked toprevious states and then branched off, greater depth indicates that aparticipant engaged in less backtracking.
Sessions are primarily depth-oriented: Branching to differentsub-analyses (i.e., subtasks) was fairly common. Branches trans-late to leaves in the search trees (e.g., nodes 3, 7, and 9 in Fig-ure 6b). 51.0% (98/192) of trees have multiple branches (i.e., > 1leaf), and 25/26 participants had multiple branches in at least onetask. Figure 6b shows the two forms of branching we observed inTableau: 1) within-sheet branching, and 2) between-sheet branch-ing (e.g., creating sheets, returning to previous sheets). With thefirst form of branching, the user makes small pivots from the cur-rent analysis state (e.g., removing one of the current data columnsbeing analyzed). To assess whether search trees tend to be depth-or breadth-oriented, we calculate an aspect ratio: we divide a tree’swidth (max breadth) by its height (max depth). Figure 6c showsthe distribution of aspect ratios, which consistently have aspect ra-tios below one, showing greater depth than breadth. These findings
are consistent with Wongsuphasawat et al.’s claims that analyses inTableau are primarily depth-oriented [WMA∗16b, WQM∗17].
6.3. Predictability & Overlap (S2)
We assess the predictability of EVA by measuring structural sim-ilarity between sessions, which could indicate likely outcomes fora given task, or relevant interaction patterns, such as iteration. Wecompute similarity in two ways: 1) overlap in states visited acrossparticipants and 2) revisitation of states (i.e., self-loops, iteration).
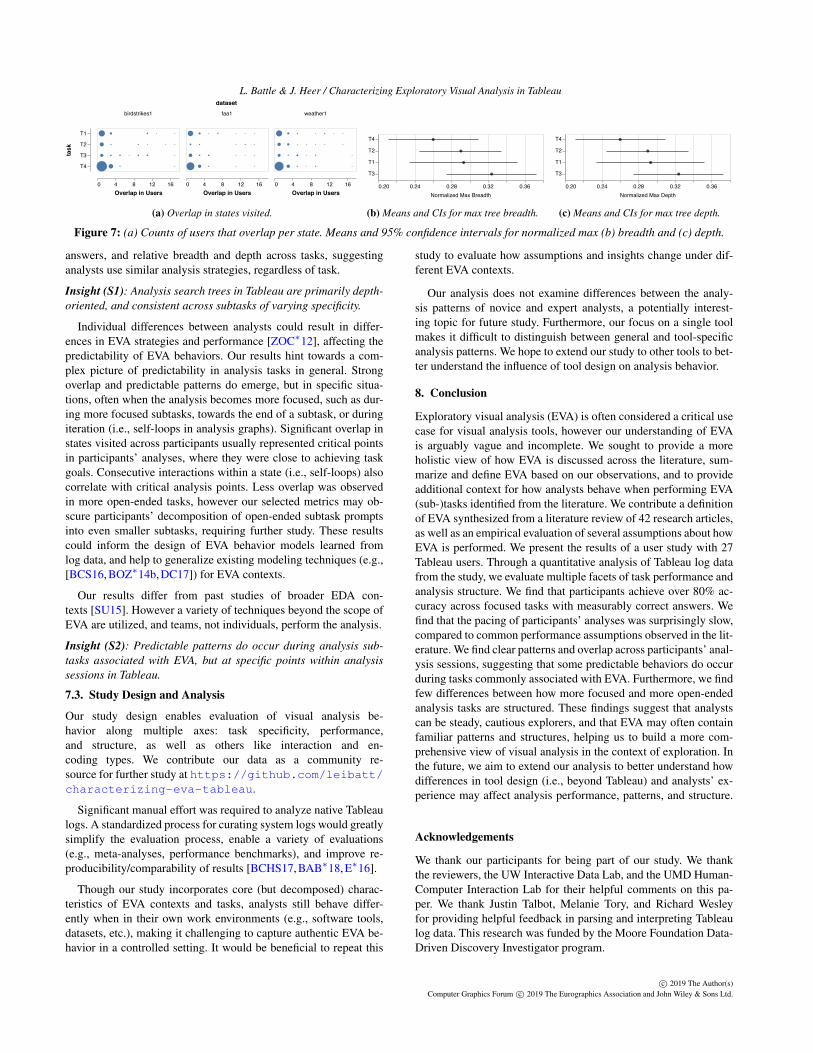
Certain states show high overlap: Figure 7a shows a binnedchart of overlaps, where the bins along the x-axis represent the to-tal participants that visited each state in the given bin (i.e., blue cir-cle). Circle area encodes the total unique states that had exactly xvisitors, for each task (y-axis) and dataset (columns). For example,relatively large circles in the far left column (per datasets) meansthat most states were visited by only 1 participant. For task T4we observe a steep drop-off, with only a few states being seen bymost users. Tasks T1 and T3 exhibit more multi-modal distribu-tions, with one cluster of states that only a few people visit, andanother where many people see the respective states.
To further quantify overlap, we calculate a binary histogram ofvisited states per participant, where each bin represents a uniquestate, and the bin is set to 1 if this state was visited. We comparepairs of participants using a modified version of Jaccard similarity:
|A∩B|min(|A|,|B|) .
This measure avoids penalizing pairings where one participant vis-ited many more states. The average similarity is as follows: T1(0.56), T2 (0.61), T3 (0.57), T4 (0.22). We find high average over-lap in T1-T3, suggesting somewhat predictable analysis steps oroutcomes. Average overlap is lower for T4. As we discuss in greater
c© 2019 The Author(s)Computer Graphics Forum c© 2019 The Eurographics Association and John Wiley & Sons Ltd.
L. Battle & J. Heer / Characterizing Exploratory Visual Analysis in Tableau
detail later, we believe this is related to participants taking a high-level goal (T4) and decomposing it into focused subtasks.
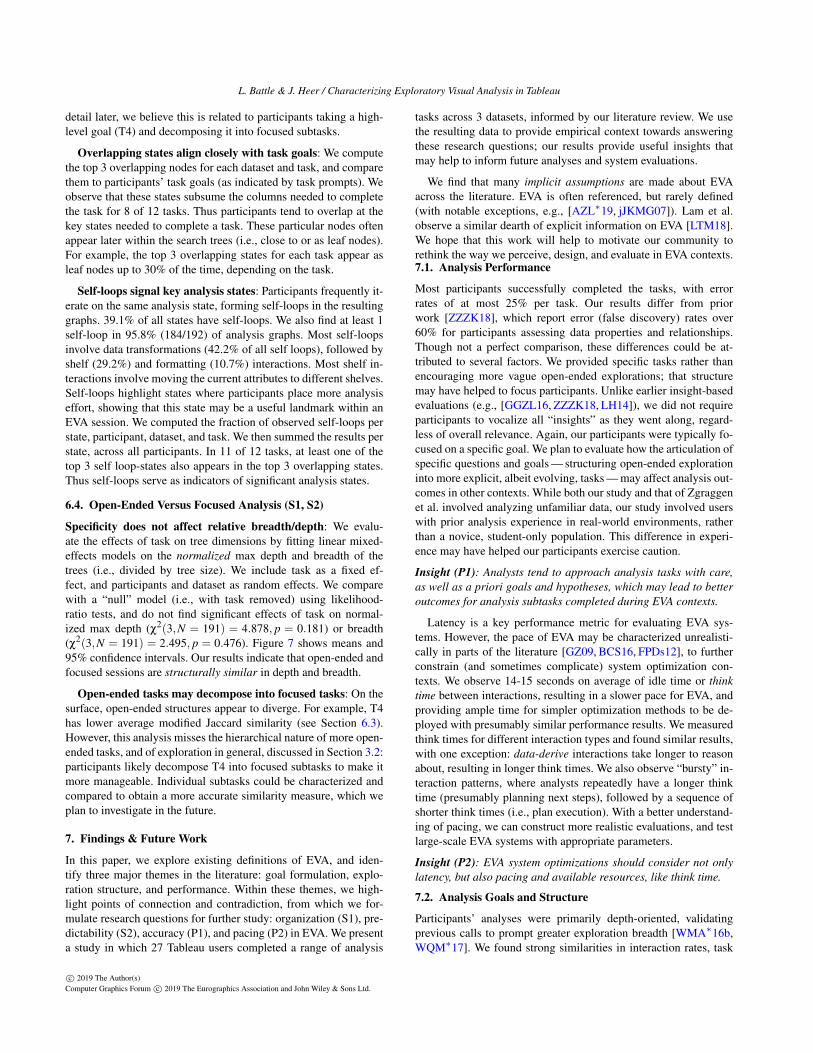
Overlapping states align closely with task goals: We computethe top 3 overlapping nodes for each dataset and task, and comparethem to participants’ task goals (as indicated by task prompts). Weobserve that these states subsume the columns needed to completethe task for 8 of 12 tasks. Thus participants tend to overlap at thekey states needed to complete a task. These particular nodes oftenappear later within the search trees (i.e., close to or as leaf nodes).For example, the top 3 overlapping states for each task appear asleaf nodes up to 30% of the time, depending on the task.
Self-loops signal key analysis states: Participants frequently it-erate on the same analysis state, forming self-loops in the resultinggraphs. 39.1% of all states have self-loops. We also find at least 1self-loop in 95.8% (184/192) of analysis graphs. Most self-loopsinvolve data transformations (42.2% of all self loops), followed byshelf (29.2%) and formatting (10.7%) interactions. Most shelf in-teractions involve moving the current attributes to different shelves.Self-loops highlight states where participants place more analysiseffort, showing that this state may be a useful landmark within anEVA session. We computed the fraction of observed self-loops perstate, participant, dataset, and task. We then summed the results perstate, across all participants. In 11 of 12 tasks, at least one of thetop 3 self loop-states also appears in the top 3 overlapping states.Thus self-loops serve as indicators of significant analysis states.
6.4. Open-Ended Versus Focused Analysis (S1, S2)
Specificity does not affect relative breadth/depth: We evalu-ate the effects of task on tree dimensions by fitting linear mixed-effects models on the normalized max depth and breadth of thetrees (i.e., divided by tree size). We include task as a fixed ef-fect, and participants and dataset as random effects. We comparewith a “null” model (i.e., with task removed) using likelihood-ratio tests, and do not find significant effects of task on normal-ized max depth (χ2(3,N = 191) = 4.878, p = 0.181) or breadth(χ2(3,N = 191) = 2.495, p = 0.476). Figure 7 shows means and95% confidence intervals. Our results indicate that open-ended andfocused sessions are structurally similar in depth and breadth.
Open-ended tasks may decompose into focused tasks: On thesurface, open-ended structures appear to diverge. For example, T4has lower average modified Jaccard similarity (see Section 6.3).However, this analysis misses the hierarchical nature of more open-ended tasks, and of exploration in general, discussed in Section 3.2:participants likely decompose T4 into focused subtasks to make itmore manageable. Individual subtasks could be characterized andcompared to obtain a more accurate similarity measure, which weplan to investigate in the future.
7. Findings & Future Work
In this paper, we explore existing definitions of EVA, and iden-tify three major themes in the literature: goal formulation, explo-ration structure, and performance. Within these themes, we high-light points of connection and contradiction, from which we for-mulate research questions for further study: organization (S1), pre-dictability (S2), accuracy (P1), and pacing (P2) in EVA. We presenta study in which 27 Tableau users completed a range of analysis
tasks across 3 datasets, informed by our literature review. We usethe resulting data to provide empirical context towards answeringthese research questions; our results provide useful insights thatmay help to inform future analyses and system evaluations.
We find that many implicit assumptions are made about EVAacross the literature. EVA is often referenced, but rarely defined(with notable exceptions, e.g., [AZL∗19, jJKMG07]). Lam et al.observe a similar dearth of explicit information on EVA [LTM18].We hope that this work will help to motivate our community torethink the way we perceive, design, and evaluate in EVA contexts.7.1. Analysis Performance
Most participants successfully completed the tasks, with errorrates of at most 25% per task. Our results differ from priorwork [ZZZK18], which report error (false discovery) rates over60% for participants assessing data properties and relationships.Though not a perfect comparison, these differences could be at-tributed to several factors. We provided specific tasks rather thanencouraging more vague open-ended explorations; that structuremay have helped to focus participants. Unlike earlier insight-basedevaluations (e.g., [GGZL16, ZZZK18, LH14]), we did not requireparticipants to vocalize all “insights” as they went along, regard-less of overall relevance. Again, our participants were typically fo-cused on a specific goal. We plan to evaluate how the articulation ofspecific questions and goals — structuring open-ended explorationinto more explicit, albeit evolving, tasks — may affect analysis out-comes in other contexts. While both our study and that of Zgraggenet al. involved analyzing unfamiliar data, our study involved userswith prior analysis experience in real-world environments, ratherthan a novice, student-only population. This difference in experi-ence may have helped our participants exercise caution.
Insight (P1): Analysts tend to approach analysis tasks with care,as well as a priori goals and hypotheses, which may lead to betteroutcomes for analysis subtasks completed during EVA contexts.
Latency is a key performance metric for evaluating EVA sys-tems. However, the pace of EVA may be characterized unrealisti-cally in parts of the literature [GZ09, BCS16, FPDs12], to furtherconstrain (and sometimes complicate) system optimization con-texts. We observe 14-15 seconds on average of idle time or thinktime between interactions, resulting in a slower pace for EVA, andproviding ample time for simpler optimization methods to be de-ployed with presumably similar performance results. We measuredthink times for different interaction types and found similar results,with one exception: data-derive interactions take longer to reasonabout, resulting in longer think times. We also observe “bursty” in-teraction patterns, where analysts repeatedly have a longer thinktime (presumably planning next steps), followed by a sequence ofshorter think times (i.e., plan execution). With a better understand-ing of pacing, we can construct more realistic evaluations, and testlarge-scale EVA systems with appropriate parameters.
Insight (P2): EVA system optimizations should consider not onlylatency, but also pacing and available resources, like think time.
7.2. Analysis Goals and Structure
Participants’ analyses were primarily depth-oriented, validatingprevious calls to prompt greater exploration breadth [WMA∗16b,WQM∗17]. We found strong similarities in interaction rates, task
c© 2019 The Author(s)Computer Graphics Forum c© 2019 The Eurographics Association and John Wiley & Sons Ltd.
L. Battle & J. Heer / Characterizing Exploratory Visual Analysis in Tableaudataset
T1
T2
T3
T4
tas
k
birdstrikes1 faa1 weather1
0 4 8 12 16Overlap in Users
0 4 8 12 16Overlap in Users
0 4 8 12 16Overlap in Users
(a) Overlap in states visited.
0.20 0.24 0.28 0.32 0.36
Normalized Max Breadth
T4
T2
T1
T3
(b) Means and CIs for max tree breadth.
0.20 0.24 0.28 0.32 0.36Normalized Max Depth
T4
T2
T1
T3
(c) Means and CIs for max tree depth.
Figure 7: (a) Counts of users that overlap per state. Means and 95% confidence intervals for normalized max (b) breadth and (c) depth.
answers, and relative breadth and depth across tasks, suggestinganalysts use similar analysis strategies, regardless of task.
Insight (S1): Analysis search trees in Tableau are primarily depth-oriented, and consistent across subtasks of varying specificity.
Individual differences between analysts could result in differ-ences in EVA strategies and performance [ZOC∗12], affecting thepredictability of EVA behaviors. Our results hint towards a com-plex picture of predictability in analysis tasks in general. Strongoverlap and predictable patterns do emerge, but in specific situa-tions, often when the analysis becomes more focused, such as dur-ing more focused subtasks, towards the end of a subtask, or duringiteration (i.e., self-loops in analysis graphs). Significant overlap instates visited across participants usually represented critical pointsin participants’ analyses, where they were close to achieving taskgoals. Consecutive interactions within a state (i.e., self-loops) alsocorrelate with critical analysis points. Less overlap was observedin more open-ended tasks, however our selected metrics may ob-scure participants’ decomposition of open-ended subtask promptsinto even smaller subtasks, requiring further study. These resultscould inform the design of EVA behavior models learned fromlog data, and help to generalize existing modeling techniques (e.g.,[BCS16, BOZ∗14b, DC17]) for EVA contexts.
Our results differ from past studies of broader EDA con-texts [SU15]. However a variety of techniques beyond the scope ofEVA are utilized, and teams, not individuals, perform the analysis.
Insight (S2): Predictable patterns do occur during analysis sub-tasks associated with EVA, but at specific points within analysissessions in Tableau.
7.3. Study Design and Analysis
Our study design enables evaluation of visual analysis be-havior along multiple axes: task specificity, performance,and structure, as well as others like interaction and en-coding types. We contribute our data as a community re-source for further study at https://github.com/leibatt/characterizing-eva-tableau.
Significant manual effort was required to analyze native Tableaulogs. A standardized process for curating system logs would greatlysimplify the evaluation process, enable a variety of evaluations(e.g., meta-analyses, performance benchmarks), and improve re-producibility/comparability of results [BCHS17, BAB∗18, E∗16].
Though our study incorporates core (but decomposed) charac-teristics of EVA contexts and tasks, analysts still behave differ-ently when in their own work environments (e.g., software tools,datasets, etc.), making it challenging to capture authentic EVA be-havior in a controlled setting. It would be beneficial to repeat this
study to evaluate how assumptions and insights change under dif-ferent EVA contexts.
Our analysis does not examine differences between the analy-sis patterns of novice and expert analysts, a potentially interest-ing topic for future study. Furthermore, our focus on a single toolmakes it difficult to distinguish between general and tool-specificanalysis patterns. We hope to extend our study to other tools to bet-ter understand the influence of tool design on analysis behavior.
8. Conclusion
Exploratory visual analysis (EVA) is often considered a critical usecase for visual analysis tools, however our understanding of EVAis arguably vague and incomplete. We sought to provide a moreholistic view of how EVA is discussed across the literature, sum-marize and define EVA based on our observations, and to provideadditional context for how analysts behave when performing EVA(sub-)tasks identified from the literature. We contribute a definitionof EVA synthesized from a literature review of 42 research articles,as well as an empirical evaluation of several assumptions about howEVA is performed. We present the results of a user study with 27Tableau users. Through a quantitative analysis of Tableau log datafrom the study, we evaluate multiple facets of task performance andanalysis structure. We find that participants achieve over 80% ac-curacy across focused tasks with measurably correct answers. Wefind that the pacing of participants’ analyses was surprisingly slow,compared to common performance assumptions observed in the lit-erature. We find clear patterns and overlap across participants’ anal-ysis sessions, suggesting that some predictable behaviors do occurduring tasks commonly associated with EVA. Furthermore, we findfew differences between how more focused and more open-endedanalysis tasks are structured. These findings suggest that analystscan be steady, cautious explorers, and that EVA may often containfamiliar patterns and structures, helping us to build a more com-prehensive view of visual analysis in the context of exploration. Inthe future, we aim to extend our analysis to better understand howdifferences in tool design (i.e., beyond Tableau) and analysts’ ex-perience may affect analysis performance, patterns, and structure.
Acknowledgements
We thank our participants for being part of our study. We thankthe reviewers, the UW Interactive Data Lab, and the UMD Human-Computer Interaction Lab for their helpful comments on this pa-per. We thank Justin Talbot, Melanie Tory, and Richard Wesleyfor providing helpful feedback in parsing and interpreting Tableaulog data. This research was funded by the Moore Foundation Data-Driven Discovery Investigator program.
c© 2019 The Author(s)Computer Graphics Forum c© 2019 The Eurographics Association and John Wiley & Sons Ltd.
L. Battle & J. Heer / Characterizing Exploratory Visual Analysis in Tableau
References
[AES05] AMAR R., EAGAN J., STASKO J.: Low-level components ofanalytic activity in information visualization. In IEEE Symposium onInformation Visualization, 2005. INFOVIS 2005. (Oct. 2005), pp. 111–117. doi:10.1109/INFVIS.2005.1532136. 4
[AZL∗19] ALSPAUGH S., ZOKAEI N., LIU A., JIN C., HEARST M. A.:Futzing and moseying: Interviews with professional data analysts on ex-ploration practices. IEEE Transactions on Visualization and ComputerGraphics 25, 1 (Jan 2019), 22–31. doi:10.1109/TVCG.2018.2865040. 1, 3, 4, 11
[BAB∗18] BATTLE L., ANGELINI M., BINNIG C., CATARCI T., EICH-MANN P., FEKETE J.-D., SANTUCCI G., SEDLMAIR M., WILLETT W.:Evaluating visual data analysis systems: A discussion report. In Pro-ceedings of the Workshop on Human-In-the-Loop Data Analytics (NewYork, NY, USA, 2018), HILDA’18, ACM, pp. 4:1–4:6. URL: http://doi.acm.org/10.1145/3209900.3209901, doi:10.1145/3209900.3209901. 12
[BCC∗05] BAVOIL L., CALLAHAN S. P., CROSSNO P. J., FREIRE J.,SCHEIDEGGER C. E., SILVA C. T., VO H. T.: VisTrails: enabling in-teractive multiple-view visualizations. In VIS 05. IEEE Visualization,2005. (Oct. 2005), pp. 135–142. doi:10.1109/VISUAL.2005.1532788. 2
[BCHS17] BATTLE L., CHANG R., HEER J., STONEBRAKER M.: Posi-tion statement: The case for a visualization performance benchmark. In2017 IEEE Workshop on Data Systems for Interactive Analysis (DSIA)(Oct 2017), pp. 1–5. doi:10.1109/DSIA.2017.8339089. 12
[BCS16] BATTLE L., CHANG R., STONEBRAKER M.: DynamicPrefetching of Data Tiles for Interactive Visualization. In Proceedings ofthe 2016 International Conference on Management of Data (New York,NY, USA, 2016), SIGMOD ’16, ACM, pp. 1363–1375. URL: http://doi.acm.org/10.1145/2882903.2882919, doi:10.1145/2882903.2882919. 2, 3, 4, 5, 9, 11, 12
[BDM∗18] BATTLE L., DUAN P., MIRANDA Z., MUKUSHEVA D.,CHANG R., STONEBRAKER M.: Beagle: Automated extraction and in-terpretation of visualizations from the web. In Proceedings of the 2018CHI Conference on Human Factors in Computing Systems (New York,NY, USA, 2018), CHI ’18, ACM, pp. 594:1–594:8. URL: http://doi.acm.org/10.1145/3173574.3174168, doi:10.1145/3173574.3174168. 6
[BJK∗16] BLASCHECK T., JOHN M., KURZHALS K., KOCH S., ERTLT.: VA2: A Visual Analytics Approach for Evaluating Visual Analyt-ics Applications. IEEE Transactions on Visualization and ComputerGraphics 22, 1 (Jan. 2016), 61–70. doi:10.1109/TVCG.2015.2467871. 2
[BM13] BREHMER M., MUNZNER T.: A Multi-Level Typology of Ab-stract Visualization Tasks. IEEE Transactions on Visualization andComputer Graphics 19, 12 (Dec. 2013), 2376–2385. doi:10.1109/TVCG.2013.124. 1, 2
[BOZ∗14a] BROWN E. T., OTTLEY A., ZHAO H., LIN Q., SOUVENIRR., ENDERT A., CHANG R.: Finding Waldo: Learning about Users fromtheir Interactions. IEEE Transactions on Visualization and ComputerGraphics 20, 12 (Dec. 2014), 1663–1672. doi:10.1109/TVCG.2014.2346575. 2
[BOZ∗14b] BROWN E. T., OTTLEY A., ZHAO H., LIN Q., SOUVENIRR., ENDERT A., CHANG R.: Finding Waldo: Learning about Users fromtheir Interactions. IEEE Transactions on Visualization and ComputerGraphics 20, 12 (2014), 1663–1672. doi:10.1109/TVCG.2014.2346575. 12
[CFS∗06] CALLAHAN S. P., FREIRE J., SANTOS E., SCHEIDEGGERC. E., SILVA C. T., VO H. T.: Managing the Evolution of Dataflowswith VisTrails. In 22nd International Conference on Data Engineer-ing Workshops (ICDEW’06) (Apr. 2006), pp. 71–71. doi:10.1109/ICDEW.2006.75. 2
[CGZ∗16] CROTTY A., GALAKATOS A., ZGRAGGEN E., BINNIG
C., KRASKA T.: The case for interactive data exploration ac-celerators (ideas). In Proceedings of the Workshop on Human-In-the-Loop Data Analytics (New York, NY, USA, 2016), HILDA ’16,ACM, pp. 11:1–11:6. URL: http://doi.acm.org/10.1145/2939502.2939513, doi:10.1145/2939502.2939513. 2, 4, 5,9
[CPVDW∗01] CARD S. K., PIROLLI P., VAN DER WEGE M., MORRI-SON J. B., REEDER R. W., SCHRAEDLEY P. K., BOSHART J.: In-formation Scent As a Driver of Web Behavior Graphs: Results of aProtocol Analysis Method for Web Usability. In Proceedings of theSIGCHI Conference on Human Factors in Computing Systems (NewYork, NY, USA, 2001), CHI ’01, ACM, pp. 498–505. URL: http://doi.acm.org/10.1145/365024.365331, doi:10.1145/365024.365331. 2
[CXGH08] CHAN S.-M., XIAO L., GERTH J., HANRAHAN P.: Main-taining interactivity while exploring massive time series. In IEEE Sym-posium on Visual Analytics Science and Technology, 2008. VAST ’08(Oct. 2008), pp. 59–66. doi:10.1109/VAST.2008.4677357. 2,5
[DC17] DABEK F., CABAN J. J.: A Grammar-based Approach for Mod-eling User Interactions and Generating Suggestions During the Data Ex-ploration Process. IEEE Transactions on Visualization and ComputerGraphics 23, 1 (Jan. 2017), 41–50. doi:10.1109/TVCG.2016.2598471. 2, 4, 5, 12
[DHPP17] DEMIRALP Ç., HAAS P. J., PARTHASARATHY S., PEDAPATIT.: Foresight: Rapid data exploration through guideposts. arXiv preprintarXiv:1709.10513 (2017). 4
[DPD14] DIMITRIADOU K., PAPAEMMANOUIL O., DIAO Y.: Explore-by-example: An automatic query steering framework for interactivedata exploration. In Proceedings of the 2014 ACM SIGMOD Inter-national Conference on Management of Data (New York, NY, USA,2014), SIGMOD ’14, ACM, pp. 517–528. URL: http://doi.acm.org/10.1145/2588555.2610523, doi:10.1145/2588555.2610523. 4, 5
[DR01] DERTHICK M., ROTH S. F.: Enhancing data exploration witha branching history of user operations. Knowledge-Based Systems 14,1 (Mar. 2001), 65–74. URL: http://www.sciencedirect.com/science/article/pii/S0950705100001015,doi:10.1016/S0950-7051(00)00101-5. 4
[E∗16] EICHMANN P., ET AL.: Towards a benchmark for interactive dataexploration. IEEE Data Eng. Bull. 39, 4 (2016), 50–61. 12
[ED16] ELTAYEBY O., DOU W.: A Survey on Interaction Log Anal-ysis for Evaluating Exploratory Visualizations. In Proceedings of theSixth Workshop on Beyond Time and Errors on Novel Evaluation Meth-ods for Visualization (New York, NY, USA, 2016), BELIV ’16, ACM,pp. 62–69. URL: http://doi.acm.org/10.1145/2993901.2993912, doi:10.1145/2993901.2993912. 1, 2, 3, 5
[FPDs12] FISHER D., POPOV I., DRUCKER S., SCHRAEFEL M.: TrustMe, I’M Partially Right: Incremental Visualization Lets Analysts Ex-plore Large Datasets Faster. In Proceedings of the SIGCHI Confer-ence on Human Factors in Computing Systems (New York, NY, USA,2012), CHI ’12, ACM, pp. 1673–1682. URL: http://doi.acm.org/10.1145/2207676.2208294, doi:10.1145/2207676.2208294. 1, 3, 5, 9, 11
[FPH19] FENG M., PECK E., HARRISON L.: Patterns and pace: Quanti-fying diverse exploration behavior with visualizations on the web. IEEETransactions on Visualization and Computer Graphics 25, 1 (Jan 2019),501–511. doi:10.1109/TVCG.2018.2865117. 5
[GGZL16] GUO H., GOMEZ S. R., ZIEMKIEWICZ C., LAIDLAW D. H.:A Case Study Using Visualization Interaction Logs and Insight Metricsto Understand How Analysts Arrive at Insights. IEEE Transactions onVisualization and Computer Graphics 22, 1 (Jan. 2016), 51–60. doi:10.1109/TVCG.2015.2467613. 2, 3, 4, 5, 11
[GL12] GOMEZ S., LAIDLAW D.: Modeling Task Performance fora Crowd of Users from Interaction Histories. In Proceedings of the
c© 2019 The Author(s)Computer Graphics Forum c© 2019 The Eurographics Association and John Wiley & Sons Ltd.
L. Battle & J. Heer / Characterizing Exploratory Visual Analysis in Tableau
SIGCHI Conference on Human Factors in Computing Systems (NewYork, NY, USA, 2012), CHI ’12, ACM, pp. 2465–2468. URL: http://doi.acm.org/10.1145/2207676.2208412, doi:10.1145/2207676.2208412. 2
[GTS10] GRAMMEL L., TORY M., STOREY M. A.: How Informa-tion Visualization Novices Construct Visualizations. IEEE Transactionson Visualization and Computer Graphics 16, 6 (Nov. 2010), 943–952.doi:10.1109/TVCG.2010.164. 2, 4, 6
[GW09] GOTZ D., WEN Z.: Behavior-driven Visualization Recom-mendation. In Proceedings of the 14th International Conference onIntelligent User Interfaces (New York, NY, USA, 2009), IUI ’09,ACM, pp. 315–324. URL: http://doi.acm.org/10.1145/1502650.1502695, doi:10.1145/1502650.1502695. 2, 3, 4,5
[GZ08] GOTZ D., ZHOU M. X.: Characterizing users’ visual analyticactivity for insight provenance. In 2008 IEEE Symposium on VisualAnalytics Science and Technology (Oct. 2008), pp. 123–130. doi:10.1109/VAST.2008.4677365. 3, 4, 5
[GZ09] GOTZ D., ZHOU M. X.: Characterizing Users’ Visual AnalyticActivity for Insight Provenance. Information Visualization 8, 1 (Jan.2009), 42–55. URL: https://doi.org/10.1057/ivs.2008.31, doi:10.1057/ivs.2008.31. 2, 9, 11
[HMSA08] HEER J., MACKINLAY J., STOLTE C., AGRAWALA M.:Graphical Histories for Visualization: Supporting Analysis, Communi-cation, and Evaluation. IEEE Transactions on Visualization and Com-puter Graphics 14, 6 (Nov. 2008), 1189–1196. doi:10.1109/TVCG.2008.137. 1, 2, 3, 4, 6, 8
[HS12] HEER J., SHNEIDERMAN B.: Interactive dynamics for visualanalysis. Commun. ACM 55, 4 (Apr. 2012), 45–54. URL: http://doi.acm.org/10.1145/2133806.2133821, doi:10.1145/2133806.2133821. 1, 2, 3, 4, 5, 9
[IPC15] IDREOS S., PAPAEMMANOUIL O., CHAUDHURI S.: Overviewof data exploration techniques. In Proceedings of the 2015 ACM SIG-MOD International Conference on Management of Data (New York,NY, USA, 2015), SIGMOD ’15, ACM, pp. 277–281. URL: http://doi.acm.org/10.1145/2723372.2731084, doi:10.1145/2723372.2731084. 3, 4, 5
[ITC08] ISENBERG P., TANG A., CARPENDALE S.: An ExploratoryStudy of Visual Information Analysis. In Proceedings of the SIGCHIConference on Human Factors in Computing Systems (New York,NY, USA, 2008), CHI ’08, ACM, pp. 1217–1226. URL: http://doi.acm.org/10.1145/1357054.1357245, doi:10.1145/1357054.1357245. 2
[jJKMG07] J. JANKUN-KELLY T., MA K., GERTZ M.: A model andframework for visualization exploration. IEEE Transactions on Visual-ization and Computer Graphics 13, 2 (March 2007), 357–369. doi:10.1109/TVCG.2007.28. 2, 3, 4, 11
[KCZ14] KALININ A., CETINTEMEL U., ZDONIK S.: Interactive dataexploration using semantic windows. In Proceedings of the 2014 ACMSIGMOD International Conference on Management of Data (New York,NY, USA, 2014), SIGMOD ’14, ACM, pp. 505–516. URL: http://doi.acm.org/10.1145/2588555.2593666, doi:10.1145/2588555.2593666. 3, 4
[Kei01] KEIM D. A.: Visual exploration of large data sets. Commun.ACM 44, 8 (Aug. 2001), 38–44. URL: http://doi.acm.org/10.1145/381641.381656, doi:10.1145/381641.381656. 3, 4
[KH18] KIM Y., HEER J.: Assessing effects of task and data distributionon the effectiveness of visual encodings. In Computer Graphics Forum(2018), vol. 37, Wiley Online Library, pp. 157–167. 6
[KJTN14] KAMAT N., JAYACHANDRAN P., TUNGA K., NANDI A.: Dis-tributed and interactive cube exploration. In 2014 IEEE 30th Interna-tional Conference on Data Engineering (ICDE) (Mar. 2014), pp. 472–483. doi:10.1109/ICDE.2014.6816674. 4, 5
[KPHH12] KANDEL S., PAEPCKE A., HELLERSTEIN J. M., HEER
J.: Enterprise data analysis and visualization: An interview study.IEEE Transactions on Visualization and Computer Graphics 18 (122012), 2917–2926. URL: doi.ieeecomputersociety.org/10.1109/TVCG.2012.219, doi:10.1109/TVCG.2012.219. 3, 4,7
[KS12] KANG Y., STASKO J.: Examining the use of a visual analyt-ics system for sensemaking tasks: Case studies with domain experts.IEEE Transactions on Visualization and Computer Graphics 18 (122012), 2869–2878. URL: doi.ieeecomputersociety.org/10.1109/TVCG.2012.224, doi:10.1109/TVCG.2012.224. 3, 4
[Lam08] LAM H.: A framework of interaction costs in information visu-alization. IEEE Transactions on Visualization and Computer Graphics14, 6 (Nov 2008), 1149–1156. doi:10.1109/TVCG.2008.109. 3,5, 9
[LH14] LIU Z., HEER J.: The effects of interactive latency on ex-ploratory visual analysis. IEEE Transactions on Visualization and Com-puter Graphics 20, 12 (Dec 2014), 2122–2131. 2, 3, 4, 5, 6, 11
[LKS13] LINS L., KLOSOWSKI J. T., SCHEIDEGGER C.: Nanocubesfor real-time exploration of spatiotemporal datasets. IEEE Transactionson Visualization and Computer Graphics 19, 12 (Dec 2013), 2456–2465.doi:10.1109/TVCG.2013.179. 4
[LTM18] LAM H., TORY M., MUNZNER T.: Bridging from Goals toTasks with Design Study Analysis Reports. IEEE Transactions on Vi-sualization and Computer Graphics 24, 1 (Jan. 2018), 435–445. doi:10.1109/TVCG.2017.2744319. 1, 2, 3, 4, 11
[LWD∗17] LIU Z., WANG Y., DONTCHEVA M., HOFFMAN M.,WALKER S., WILSON A.: Patterns and Sequences: Interactive Ex-ploration of Clickstreams to Understand Common Visitor Paths. IEEETransactions on Visualization and Computer Graphics 23, 1 (Jan. 2017),321–330. doi:10.1109/TVCG.2016.2598797. 2
[LWPL11] LU J., WEN Z., PAN S., LAI J.: Analytic Trails: SupportingProvenance, Collaboration, and Reuse for Visual Data Analysis byBusiness Users. In Human-Computer Interaction âAS INTERACT 2011(Sept. 2011), Lecture Notes in Computer Science, Springer, Berlin,Heidelberg, pp. 256–273. URL: https://link.springer.com/chapter/10.1007/978-3-642-23768-3_22,doi:10.1007/978-3-642-23768-3_22. 2
[MWN∗19] MORITZ D., WANG C., NELSON G. L., LIN H., SMITHA. M., HOWE B., HEER J.: Formalizing visualization design knowledgeas constraints: actionable and extensible models in draco. To appear,IEEE Transactions on Visualization and Computer Graphics (2019). 3,4
[New72] NEWELL A.: Human problem solving. Prentice-Hall Engle-wood Cliffs, NJ, 1972. 2
[PC05] PIROLLI P., CARD S.: The sensemaking process and leveragepoints for analyst technology as identified through cognitive task analy-sis. In Proceedings of international conference on intelligence analysis(2005), vol. 5, McLean, VA, USA, pp. 2–4. 3, 4
[PS08] PERER A., SHNEIDERMAN B.: Systematic yet flexible dis-covery: Guiding domain experts through exploratory data analy-sis. In Proceedings of the 13th International Conference on In-telligent User Interfaces (New York, NY, USA, 2008), IUI ’08,ACM, pp. 109–118. URL: http://doi.acm.org/10.1145/1378773.1378788, doi:10.1145/1378773.1378788. 3, 4, 6
[PSCO09] PIKE W. A., STASKO J., CHANG R., O’CONNELL T. A.: Thescience of interaction. Information Visualization 8, 4 (2009), 263–274.4
[RAK∗17] RAHMAN S., ALIAKBARPOUR M., KONG H. K., BLAIS E.,KARAHALIOS K., PARAMESWARAN A., RUBINFIELD R.: I’ve seen"enough": Incrementally improving visualizations to support rapid deci-sion making. Proc. VLDB Endow. 10, 11 (Aug. 2017), 1262–1273. URL:https://doi.org/10.14778/3137628.3137637, doi:10.14778/3137628.3137637. 2, 4, 5
[RESC16] RAGAN E. D., ENDERT A., SANYAL J., CHEN J.: Charac-
c© 2019 The Author(s)Computer Graphics Forum c© 2019 The Eurographics Association and John Wiley & Sons Ltd.
L. Battle & J. Heer / Characterizing Exploratory Visual Analysis in Tableau
terizing Provenance in Visualization and Data Analysis: An Organiza-tional Framework of Provenance Types and Purposes. IEEE Transac-tions on Visualization and Computer Graphics 22, 1 (Jan. 2016), 31–40.doi:10.1109/TVCG.2015.2467551. 1
[RJPL16] REDA K., JOHNSON A. E., PAPKA M. E., LEIGH J.:Modeling and evaluating user behavior in exploratory visual analy-sis. Information Visualization 15, 4 (Oct. 2016), 325–339. URL:https://doi.org/10.1177/1473871616638546, doi:10.1177/1473871616638546. 2, 3, 4, 6
[SASF11] SILVA C. T., ANDERSON E., SANTOS E., FREIRE J.:Using VisTrails and Provenance for Teaching Scientific Visual-ization. Computer Graphics Forum 30, 1 (Mar. 2011), 75–84.URL: http://onlinelibrary.wiley.com/doi/10.1111/j.1467-8659.2010.01830.x/abstract, doi:10.1111/j.1467-8659.2010.01830.x. 2
[Shn96] SHNEIDERMAN B.: The Eyes Have It: A Task by Data TypeTaxonomy for Information Visualizations. In Proceedings of the 1996IEEE Symposium on Visual Languages (Washington, DC, USA, 1996),VL ’96, IEEE Computer Society, pp. 336–. URL: http://dl.acm.org/citation.cfm?id=832277.834354. 3, 4
[SKL∗16] SIDDIQUI T., KIM A., LEE J., KARAHALIOS K.,PARAMESWARAN A.: Effortless data exploration with zen-visage: An expressive and interactive visual analytics sys-tem. Proc. VLDB Endow. 10, 4 (Nov. 2016), 457–468. URL:https://doi.org/10.14778/3025111.3025126,doi:10.14778/3025111.3025126. 1, 3, 4
[SND05] SARAIYA P., NORTH C., DUCA K.: An insight-based method-ology for evaluating bioinformatics visualizations. IEEE Transactionson Visualization and Computer Graphics 11, 4 (July 2005), 443–456. 3
[SNLD06] SARAIYA P., NORTH C., LAM V., DUCA K. A.: An insight-based longitudinal study of visual analytics. IEEE Transactions on Visu-alization and Computer Graphics 12, 6 (Nov 2006), 1511–1522. 3
[ST15] SARVGHAD A., TORY M.: Exploiting Analysis History to Sup-port Collaborative Data Analysis. In Proceedings of the 41st Graph-ics Interface Conference (Toronto, Ont., Canada, Canada, 2015), GI ’15,Canadian Information Processing Society, pp. 123–130. URL: http://dl.acm.org/citation.cfm?id=2788890.2788913. 2
[STH02] STOLTE C., TANG D., HANRAHAN P.: Polaris: a systemfor query, analysis, and visualization of multidimensional relationaldatabases. IEEE Transactions on Visualization and Computer Graph-ics 8, 1 (Jan 2002), 52–65. doi:10.1109/2945.981851. 2, 4
[STM17] SARVGHAD A., TORY M., MAHYAR N.: Visualizing dimen-sion coverage to support exploratory analysis. IEEE transactions on vi-sualization and computer graphics 23, 1 (2017), 21–30. 2, 10
[SU15] SILBERZAHN R., UHLMANN E. L.: Crowdsourced research:Many hands make tight work. Nature News 526, 7572 (2015), 189. 12
[SvW08] SHRINIVASAN Y. B., VAN WIJK J. J.: Supporting the analyt-ical reasoning process in information visualization. In Proceedings ofthe SIGCHI Conference on Human Factors in Computing Systems (NewYork, NY, USA, 2008), CHI ’08, ACM, pp. 1237–1246. URL: http://doi.acm.org/10.1145/1357054.1357247, doi:10.1145/1357054.1357247. 2
[Tuk77] TUKEY J. W.: Exploratory data analysis, vol. 2. Reading, Mass.,1977. 3, 4, 5
[VRM∗15] VARTAK M., RAHMAN S., MADDEN S., PARAMESWARANA., POLYZOTIS N.: SeeDB: Efficient Data-driven Visualization Recom-mendations to Support Visual Analytics. Proc. VLDB Endow. 8, 13 (Sept.2015), 2182–2193. URL: http://dx.doi.org/10.14778/2831360.2831371, doi:10.14778/2831360.2831371. 4
[WHS∗02] WATERSON S. J., HONG J. I., SOHN T., LANDAY J. A.,HEER J., MATTHEWS T.: What Did They Do? Understanding Click-streams with the WebQuilt Visualization System. In Proceedings ofthe Working Conference on Advanced Visual Interfaces (New York, NY,USA, 2002), AVI ’02, ACM, pp. 94–102. URL: http://doi.acm.
org/10.1145/1556262.1556276, doi:10.1145/1556262.1556276. 2
[WMA∗16a] WONGSUPHASAWAT K., MORITZ D., ANAND A.,MACKINLAY J., HOWE B., HEER J.: Towards a general-purpose querylanguage for visualization recommendation. In Proceedings of the Work-shop on Human-In-the-Loop Data Analytics (2016), ACM, p. 4. 4
[WMA∗16b] WONGSUPHASAWAT K., MORITZ D., ANAND A.,MACKINLAY J., HOWE B., HEER J.: Voyager: Exploratory Analysisvia Faceted Browsing of Visualization Recommendations. IEEE Trans-actions on Visualization and Computer Graphics 22, 1 (Jan. 2016), 649–658. doi:10.1109/TVCG.2015.2467191. 2, 3, 4, 5, 6, 9, 10,11
[WQM∗17] WONGSUPHASAWAT K., QU Z., MORITZ D., CHANG R.,OUK F., ANAND A., MACKINLAY J., HOWE B., HEER J.: Voy-ager 2: Augmenting Visual Analysis with Partial View Specifica-tions. In Proceedings of the 2017 CHI Conference on Human Fac-tors in Computing Systems (New York, NY, USA, 2017), CHI ’17,ACM, pp. 2648–2659. URL: http://doi.acm.org/10.1145/3025453.3025768, doi:10.1145/3025453.3025768. 2, 9,10, 11
[YKSJ07] YI J. S., KANG Y. A., STASKO J., JACKO J.: Toward a DeeperUnderstanding of the Role of Interaction in Information Visualization.IEEE Transactions on Visualization and Computer Graphics 13, 6 (Nov.2007), 1224–1231. URL: http://dx.doi.org/10.1109/TVCG.2007.70515, doi:10.1109/TVCG.2007.70515. 2, 4
[ZGC∗16] ZGRAGGEN E., GALAKATOS A., CROTTY A., FEKETE J.-D., KRASKA T.: How progressive visualizations affect exploratoryanalysis. IEEE Transactions on Visualization and Computer Graphics(2016). 2, 3, 5
[ZOC∗12] ZIEMKIEWICZ C., OTTLEY A., CROUSER R. J., CHAUNCEYK., SU S. L., CHANG R.: Understanding visualization by understandingindividual users. IEEE Computer Graphics and Applications 32, 6 (Nov2012), 88–94. doi:10.1109/MCG.2012.120. 2, 3, 4, 12
[ZZZK18] ZGRAGGEN E., ZHAO Z., ZELEZNIK R., KRASKA T.: Inves-tigating the effect of the multiple comparisons problem in visual anal-ysis. In Proceedings of the SIGCHI Conference on Human Factorsin Computing Systems (Montreal, QC, Canada, 2018), CHI ’18, ACM.doi:10.1145/3173574.3174053. 2, 3, 4, 5, 7, 8, 11
c© 2019 The Author(s)Computer Graphics Forum c© 2019 The Eurographics Association and John Wiley & Sons Ltd.