Embed Size (px)
Citation preview

Characterizing Impact of Initial Conditions on Fermentation
in Two New Grape Wines
A Major Qualifying Project Report:
Submitted to
The Faculty of WORCESTER POLYTECHNIC INSTITUTE
And Zoll Cellars
In Partial Fulfillment of the Requirements for the
Degree of Bachelor of Science
By
J
Minxue Jia
Date: April 28th, 2016
J
Professor Drew R. Brodeur, Co-Advisor
J
Professor Stephen James Kmiotek, Co-Advisor
This report represents the work of WPI undergraduate students submitted to the faculty as evidence of completion of a degree requirement. WPI routinely publishes these reports on its website without editorial or peer review. For more information about the projects program at WPI, please see http://www.wpi.edu/academics/ugradstudies/project-learning.html

1
Abstract
The cold-hardy Marquette and Arandell grapes are cultivated in Massachusetts for
winemaking by Zoll Cellars. Since those two species grapes are relatively new to the wine-
making industry, the initial must pH value and yeast assimilable nitrogen (YAN) are regarded as
key influential vinification process factors. This project investigates the effect of pH and yeast
assimilable nitrogen to discover optimum initial fermentation condition for advancing wine
quality. Throughout adjustment of pH and YAN, 40 micro-fermenters with different initial
fermentation conditions were prepared to conduct fermentation experiment. With the analytical
chemistry, the wine products were analyzed to determine optimum initial fermentation
conditions for Arandell and Marquette. A pH of 3.0 and a high YAN concentration are suggested
for Arandell to have a pleasant smell while a pH range from 3.4 to 3.6 is recommended for
Marquette grape.

2
Table of Contents Abstract ........................................................................................................................................................ 1
1. Introduction ......................................................................................................................................... 5
2. Background .......................................................................................................................................... 6
2.1 Viniculture ......................................................................................................................................... 6
2.1.1 Species of grapes ......................................................................................................................... 6
2.1.2 Vineyard Location ...................................................................................................................... 7
2.1.3 Ripeness of Grape ...................................................................................................................... 8
2.1.4 Seasonal Variation ..................................................................................................................... 9
2.2 Preparation of Must and Juice ........................................................................................................ 9
2.2.1 Grape Crushing ........................................................................................................................ 10
2.2.2 Sugar concentration ................................................................................................................. 10
2.2.3 pH .............................................................................................................................................. 10
2.2.4 Yeast assimilable nitrogen ....................................................................................................... 11
2.2.5 Metabisulfite ............................................................................................................................. 11
2.3 Microbial Fermentation ................................................................................................................. 12
2.4 Fining and Clarification of Wine ................................................................................................... 12
2.5 Aging of Wine .................................................................................................................................. 13
2.6 Yeast: BM4X4 ................................................................................................................................. 13
2.7 Project Sponsor: Zoll Cellars ......................................................................................................... 13
2.8 Gas Chromatography Mass Spectrometry ................................................................................... 14
2.9 Infrared Spectroscopy .................................................................................................................... 15
3. Methodology ...................................................................................................................................... 17
3.1 Micro Fermentation ........................................................................................................................ 17
3.1.1 Method Development ............................................................................................................... 17
3.1.2 Material Source ........................................................................................................................ 17
3.1.3 Fermentation ............................................................................................................................ 18
3.2 Analytical Chemistry ...................................................................................................................... 19
3.2.1 pH Measurement ...................................................................................................................... 19
3.2.2 Measure of YAN ....................................................................................................................... 19
3.2.3 GC-MS ...................................................................................................................................... 20
3.2.4 IR Spectroscopy ........................................................................................................................ 20

3
3.3 Smell Descriptions ........................................................................................................................... 21
4. Results .................................................................................................................................................... 21
4.1 pH Change ....................................................................................................................................... 21
4.2 YAN Change .................................................................................................................................... 23
4.3 IR Result .......................................................................................................................................... 25
4.4 Sensory Descriptions ....................................................................................................................... 25
4.5 GC-MS Result ................................................................................................................................. 26
4. Conclusion .......................................................................................................................................... 31
Appendices ................................................................................................................................................. 32
Appendix A: Calculations of Potassium Metabisulfite ...................................................................... 32
Appendix B: Instruction for BM4X4 Yeast ........................................................................................ 33
Appendix C: YAN Measurement Procedures and Calculation ........................................................ 34
Appendix D: Wine Smelling Test Survey Form ................................................................................. 37
Appendix E: GC-MS result .................................................................................................................. 38
Appendix F: Odor description of aroma substances in wine ............................................................ 43
Appendix G: IR Spectrum ................................................................................................................... 46
Table of Figures Figure 1. Generalized graphical representation of grape berry compositional changes during development and ripening .............................................................................................................. 9 Figure 2. Zoll Cellars’ alcohol products ....................................................................................... 14 Figure 3. A typical GC-MS instrument ........................................................................................ 15 Figure 4. Schematic diagram of Infrared Spectroscopy ................................................................ 16 Figure 5. Must Masher ................................................................................................................ 18 Figure 6. pH Value of Wine Samples and Regression Analysis ..................................................... 22 Figure 7. Primary Amino Nitrogen Content of several wine samples ............................................ 23 Figure 8. Ammonia Nitrogen Content of several wine samples ..................................................... 24 Figure 9. GCMS Result of Marquette Wine with Must pH of 3.0 .................................................. 27 Figure 10. IR Spectrum of Arandell and Marquette Juice ............................................................ 46 Figure 11. IR Spectrums of Arandell Must with a pH value of 3.4 and YAN of 457.5 mg/L ........... 47 Figure 12. IR Spectrums of Arandell Must with a pH value of 3.6 and YAN of 457.5 mg/L ........... 48 Figure 13. IR Spectrums of Marquette Must with a pH value of 3.4 ............................................. 49 Figure 14. IR Spectrums of Marquette Must with a pH value of 3.6 ............................................. 50

4
Table of Tables Table 1. Average juice and wine chemistry for Arandell research lots ............................................ 7 Table 2. Recommended SO2 concentration for different pH value ................................................ 12 Table 3. Initial Fermentation Conditions. ..................................................................................... 19 Table 4. pH Value of Wine Samples ............................................................................................. 22 Table 5. Primary Amino Nitrogen (PAN) data for all wine samples .............................................. 24 Table 6. Ammonia Nitrogen (AN) data for all wine samples ......................................................... 24 Table 7. Summary of Absorbance in IR Spectrum of samples ...................................................... 25 Table 8. Smell Test Result Summary ............................................................................................ 26 Table 9. Aroma Substances in Marquette Wine Samples .............................................................. 28 Table 10. Aroma Substances in Arandell (YAN of 375.5 mg/L) Wine Samples .............................. 29 Table 11. Aroma Substances in Arandell (YAN of 475.5 mg/L) Wine Samples .............................. 29 Table 12. Aroma Substances in Arandell (YAN of 575.5 mg/L) Wine Samples .............................. 30 Table 13. Weight of Potassium Metabisulfite Addition ................................................................. 32 Table 14. Absorbance Data and Nitrogen Concentration of Arandell & Marquette ...................... 36 Table 15. Aroma Substance in GC-MS result of Marquette .......................................................... 38 Table 16. Aroma Substance in GC-MS result of Arandell wine samples (375.5 mg/L) ................... 39 Table 17. Aroma Substance in GC-MS result of Arandell wine samples (475.5 mg/L) ................... 40 Table 18. Aroma Substance in GC-MS result of Arandell wine samples (575.5 mg/L) ................... 42

5
1. Introduction Wine is a valuable gift from nature. The stunning liquid provides enthusiasts with lots of
leisure and contentment. Following the earliest archaeological evidence of wine, people have been producing and enjoying wine for 8000 years.1 Wine products are deeply involved in life and used for lots of purposes. With the development of modern technology and science, the production and consumption of wine are increasing. Nowadays, USA has become one of the largest wine markets in the world in terms of internal wine consumption volume.2 With the increasing demand, the wine industry is constantly seeking more improvements in winemaking
The Zoll Cellars is a private winery in Shrewsbury, Massachusetts. The winery cultivates grape via the biodynamic branch of organic farming and makes exceptional wine at harvest. Due to the typical northeast regional climate, winemaking grapes are influenced significantly by the colder temperature, higher humidity, and more unpredictable precipitation pattern. The cold climate limits vine metabolism hence the organic acid accumulation in the grape fruit. Therefore, the grapes with low content sugar and high content acid are harvested in this area. In order to overcome climate constraints and abnormal grape composition, the Zoll Cellars took advice from University of Minnesota Horticultural Research Center and Cornell University’s New York State Agricultural Experiment Station, to grow two kinds of cold-hardy grapes, Marquette and Arandell. Since Marquette and Arandell are relatively new to the wine producing industry, the process variables of vinification for those two species are obscure. In order to optimize the wine quality, the Zoll Cellars partners with Worcester Polytechnic Institute (WPI) wine project team to discover Marquette and Arandell grapes vinification advancements. The yeast BM45 was the optimum yeast which provide best sensory quality in a major qualifying project of eastern U.S. wine and yeast study.3 However, the high requirements of nutrition and undesired fermentation kinetics of BM45 impose a limitation for enhancement of a wine product quality. Thus another yeast BM 4X4 developed for excellent fermentation kinetics is provided by Zoll Cellars to use for this project. The project will concern vinification process and key process variables of pH and yeast assimilable nitrogen concentration to discover the solution for improving the quality of wine.
1 (David, K. (2003, December 27). Now that’s what you call a real vintage: professor unearths 8,000-year-old wine. Retrieved December 10, 2015, from http://www.independent.co.uk/news/science/now-thats-what-you-call-a-real-vintage-professor-unearths-8000-year-old-wine-84179.html. 2 "State of World Vitiviniculture situation - SlideShare." 2014. 20 Feb. 2016 <http://www.slideshare.net/JulesOenovino/state-of-world-vitiviniculture-situation> 3 Cellars, Z. "EASTERN U.S. WINE AND YEAST STUDY." 2014. <https://www.wpi.edu/Pubs/E-project/Available/E-project-050214-093729/unrestricted/Lagassey_-_Final.pdf>
6
2. Background This chapter aims to provide audience a better understanding of the process, history, and
science of winemaking. The origins of winemaking can be traced back to the Stone Age. Over the history of
vinification practices, many guidelines have been written to figure out the process and provide directions for winemakers. The winemaking process is a series of operations that involve harvesting grape fruits, manufacturing, and bottling the final products. The primary process of vinification is simultaneously straightforward and complex. The vinification involves viticulture, preparation of must, microbial fermentation, clarification and maturation of wine.
2.1 Viniculture The viniculture is the cultivation of grapevines, which is a process of vines converting light energy to chemical energy. These forms of energy are stored in hydrocarbon molecules, which yields grapes with perfect balance of polyphenol, organic acids, sugar, yeast assimilable nitrogen and other organic compounds. It is a truism to say “great wine is made in vineyard” since the geographical location and climate influence the quality of the grapes.4 Suitable grape is the primary key to produce high-quality, characteristic wine products, and the composition and quality of grapes could be influenced synergistically by species, vineyard location, ripeness and seasonal variation.
2.1.1 Species of grapes By Angiosperm Phylogeny Group (APG II) classification, grapes belong to the genus
Vitis, which is one of 16 genera in the family Vitaceae. The Vitaceae family is sister to fabids + malvids clade in most recent analyses.5 Vitis is an economically important genus as the source of grapes, and grapes have been cultivated for different purposes, such as, wine production, juice production, and raisins. Different grape products require different characteristics of grapes, which drives the cultivation of new species. Besides, tractability, distinctive flavor and economics-scales would be taken into account for the selection of grape species for this project.
Since the climate, soil condition, and other environmental conditions would influence the composition of grape, the climate of New England causes high accumulation of organic acid and low pH value. Thus, our sponsor chooses Arandell and Marquette for winemaking. The reasons are explained in the following sections.
4 "Wine is Not Made in the Vineyard - Wine Searcher." 2014. 20 Feb. 2016 <http://www.wine-searcher.com/m/2014/03/wine-is-not-made-in-the-vineyard> 5 Soejima, A., & Wen, J. (2006). Phylogenetic analysis of the grape family (Vitaceae) based on three chloroplast markers. American Journal of Botany, 93(2), 278-287.

7
2.1.1.1 Arandell
Arandell, a disease-resistant red wine grape with clean, berry aromas, was bred at Cornell University’s New York State Agricultural Experiment Station in 1995. Also, vines of Arandell are moderately cold-resistant, and upright growth of Arandell makes it suitable for vine management. The Arandell wines have light to moderate tannins and exhibit notes of dark berry fruit (blueberry, black cherry), tobacco and hints of black pepper or cedar. The average juice and wine chemistry data are listed Table 1.
Table 1. Average juice and wine chemistry for Arandell research lots
pH Value Titratable Acidity
° Brix % Ethanol
Juice 3.3 10.5 19.5 --
Wine (post MLF, cold
stabilization) 3.9 6.2 -- 10.8
2.1.1.2 Marquette
Marquette is an outstanding wine-grape. Its resistance to low temperature, downy mildew, powdery mildew, and black rot is brilliant. The open, orderly growth habit of Marquette increases efficiency of vine canopy management. The high sugar and moderate acidity of Marquette make it very manageable in the winery. The wine characteristics of Marquette are often variable, such as attractive ruby color, pronounced tannins, and beautiful notes of cherry, berry, black pepper, and spice on both nose and palate.6 The harvest data from 2003 to 2005 at the University of Minnesota Horticultural Research Center suggested that Marquette grapes averaged 26.1° Brix, 12.1g/liter titratable acidity and 2.95 pH.7
2.1.2 Vineyard Location Environmental factors, topographical, agro-pedological and climatic, have been
recognized to influence grape and wine quality. The site requires favorable climates, or good soil fertility to achieve adequate but not excessive vine vigor and water supply. Those environmental factors would influence the metabolism of the vine so as to induce a change of berries composition. The cold climate will intervene respiration of vine, which causes excess accumulated organic acid and undesirable low pH value.8 Regarding soil fertility, high-quality wines come from vineyards with relatively low fertility, the barren soil promotes deep, perennial 6 (2016). University of Minnesota Grapes - Minnesota Hardy. Retrieved April 12, 2016, from http://mnhardy.umn.edu/varieties/fruit/grapes. 7 (2008). Marquette - Viticulture Iowa State University. Retrieved April 12, 2016, from http://viticulture.hort.iastate.edu/cultivars/Marquette.pdf. 8 Rachel, G. (2012). Malic Acid Uncovered: expert tips on finding the right balance in your wine. Australian Grapegrower and Winemaker, Issue 576, p50, 79936470
8
root system and healthy grapevine. The water status significantly influence grape vine and fruit quality as well. Differences in vine water status are highly correlated with the earliness of shoot growth cessation and veraison. Also, water deficiency would accelerate accumulation of sugar, the breakdown of malic acid and increment of glycoconjugates of the aromatic components of grapes.9
2.1.3 Ripeness of Grape Grape ripeness is an elusive concept for many people since grape berry development and ripening is a continuous process and there is no single state. At a different stage of ripening, the various combinations of aromas, flavors, tannins, sugar and acids result in unique characters. However, winemakers have the desired grape ripeness for their distinctive wine. Thus, vineyards need to be managed appropriately to achieve the targeted ripeness and avoid overripe of grapes.
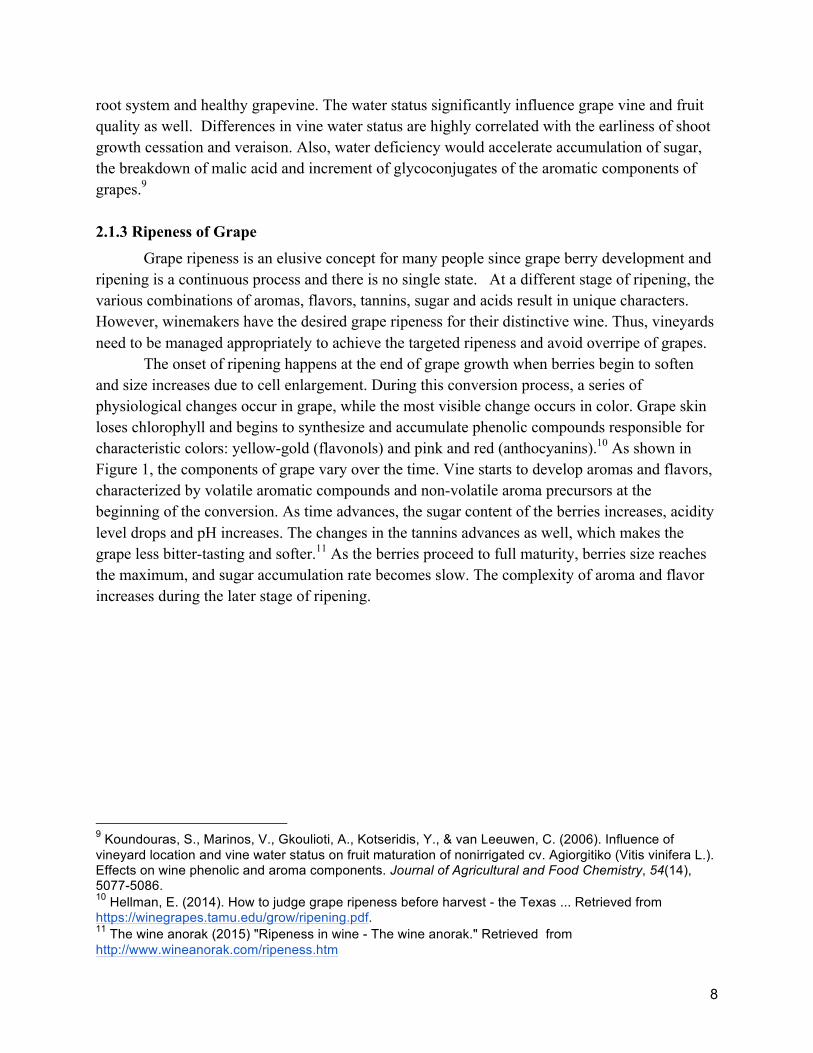
The onset of ripening happens at the end of grape growth when berries begin to soften and size increases due to cell enlargement. During this conversion process, a series of physiological changes occur in grape, while the most visible change occurs in color. Grape skin loses chlorophyll and begins to synthesize and accumulate phenolic compounds responsible for characteristic colors: yellow-gold (flavonols) and pink and red (anthocyanins).10 As shown in Figure 1, the components of grape vary over the time. Vine starts to develop aromas and flavors, characterized by volatile aromatic compounds and non-volatile aroma precursors at the beginning of the conversion. As time advances, the sugar content of the berries increases, acidity level drops and pH increases. The changes in the tannins advances as well, which makes the grape less bitter-tasting and softer.11 As the berries proceed to full maturity, berries size reaches the maximum, and sugar accumulation rate becomes slow. The complexity of aroma and flavor increases during the later stage of ripening.
9 Koundouras, S., Marinos, V., Gkoulioti, A., Kotseridis, Y., & van Leeuwen, C. (2006). Influence of vineyard location and vine water status on fruit maturation of nonirrigated cv. Agiorgitiko (Vitis vinifera L.). Effects on wine phenolic and aroma components. Journal of Agricultural and Food Chemistry, 54(14), 5077-5086. 10 Hellman, E. (2014). How to judge grape ripeness before harvest - the Texas ... Retrieved from https://winegrapes.tamu.edu/grow/ripening.pdf. 11 The wine anorak (2015) "Ripeness in wine - The wine anorak." Retrieved from http://www.wineanorak.com/ripeness.htm
9
Figure 1. Generalized graphical representation of grape berry compositional changes during development
and ripening (From Hellman, E. 2014)
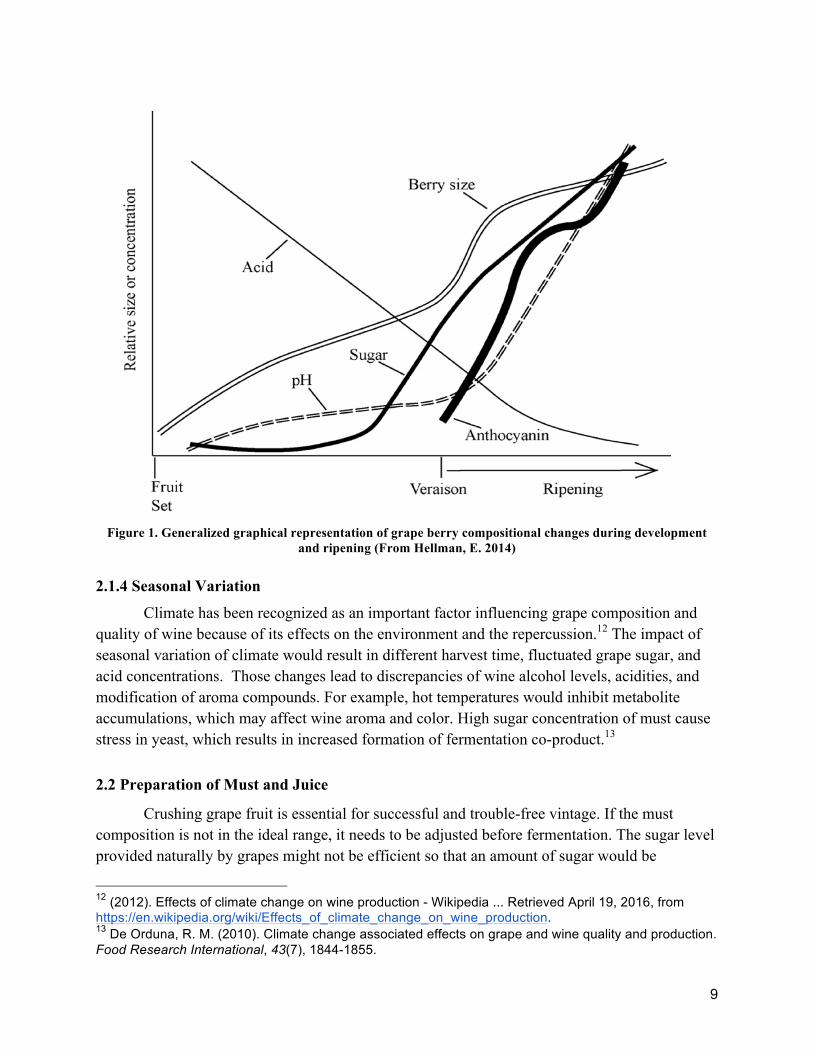
2.1.4 Seasonal Variation Climate has been recognized as an important factor influencing grape composition and
quality of wine because of its effects on the environment and the repercussion.12 The impact of seasonal variation of climate would result in different harvest time, fluctuated grape sugar, and acid concentrations. Those changes lead to discrepancies of wine alcohol levels, acidities, and modification of aroma compounds. For example, hot temperatures would inhibit metabolite accumulations, which may affect wine aroma and color. High sugar concentration of must cause stress in yeast, which results in increased formation of fermentation co-product.13
2.2 Preparation of Must and Juice Crushing grape fruit is essential for successful and trouble-free vintage. If the must
composition is not in the ideal range, it needs to be adjusted before fermentation. The sugar level provided naturally by grapes might not be efficient so that an amount of sugar would be
12 (2012). Effects of climate change on wine production - Wikipedia ... Retrieved April 19, 2016, from https://en.wikipedia.org/wiki/Effects_of_climate_change_on_wine_production. 13 De Orduna, R. M. (2010). Climate change associated effects on grape and wine quality and production. Food Research International, 43(7), 1844-1855.

10
calculated and then added to the must. For pH adjustment, tartaric acid or malic acid will be used to increase acidity, while the addition of potassium bicarbonate must will be used to reduce the acidity of must.
2.2.1 Grape Crushing Crushing is a physical process to squeezing the berries and get fresh fruit juice or must
which include the skin, seeds, pulp and stem. In traditional and smaller-scale winemaking, the harvested grapes are sometimes crushed by trampling with barefoot or by the use of inexpensive small scale crushers. During the crushing process, the grapes require enough squeeze, but not as much to cause excessive shearing or tearing of the skin tissue. Thus, to prepare the must for this project, a wine masher made by polyethylene will be applied for making must.
2.2.2 Sugar concentration During the process of fermentation, sugar in must acts as the substrate of the enzymes in
yeast cells and is broken down and converted into ethanol and carbon dioxide. Sometimes sugar is added to must for an increment of the alcohol content of the final product. Also, the content of sugar determines the sweetness of wine.
Degree Brix can scale the sugar content level, and one degree Brix is 1 gram of sucrose in 100 grams of solution. Brix can be measured by using a refractometer.14 In this study, specific gravity was determined by the density of the must.
For the desirable alcohol content and taste of wine product, the sugar content will be adjusted. Since the low sugar content of must would result in poor quality of the wine, an addition of sugar to must would be necessary. The initial sugar content of Marquette must is 21.7 Brix, and the value of Arandell is 15.9 Brix. The final sugar content of Marquette and Arandell is 21.9 Brix and 22.3 Brix.
2.2.3 pH The pH of wine is crucial not only to its flavor but also to nearly every aspect of the wine.
The pH could affect flavor, aroma, color, tartrate precipitation, carbon dioxide absorption, malolactic fermentation, stability, agility, and fermentation rate. Also, the pH can influence many chemical reactions that take place in wine.
A suitable acid level enables wine to possess excellent aroma, a beautiful color, and a brilliant mouthfeel. In contrast, the low acid level would cause flabby taste and brownish hue of wine. Additionally, a perfect pH level inhibits the growth of most bacteria and fungi, and provides a natural protection for yeast during fermentation process. For adjustment of pH, the must can be acidified by addition of malic acid, while the acid level can be lowered by the
14 (2011). Brix - Wikipedia, the free encyclopedia. Retrieved April 19, 2016, from https://en.wikipedia.org/wiki/Brix.
11
addition of potassium bicarbonate. Generally, a pH range of 3.0 ~3.8 is optimum for vinification to avoid poor taste and tarnished color.15
2.2.4 Yeast assimilable nitrogen Yeast assimilable nitrogen (YAN) on must suggests the level of available nitrogen at the
start of fermentation. The nitrogenous compounds which can be assimilated under anaerobic conditions are the primary or alpha amino acids, ammonium ion and small peptides.16 Nitrogen is an essential nutrient required for yeast health during the fermentation process. The deficiency of YAN would result in a sluggish and unhealthy fermentation. Also, the unhealthy fermentation process will yield hydrogen sulfide which leaves a sulfur odor in wine. The YAN content of grape must helps winemakers determine the amount of nitrogen addition to minimize the production of hydrogen sulfide.17 For the occurrence of proper fermentation reaction, the initial YAN content and Brix of must would be measured to determine nutrient supplement addition. Also, some specific yeasts require more YAN than others during fermentation process.
2.2.5 Metabisulfite Meta sulfites can be added to the must to provide a protection against the oxidation,
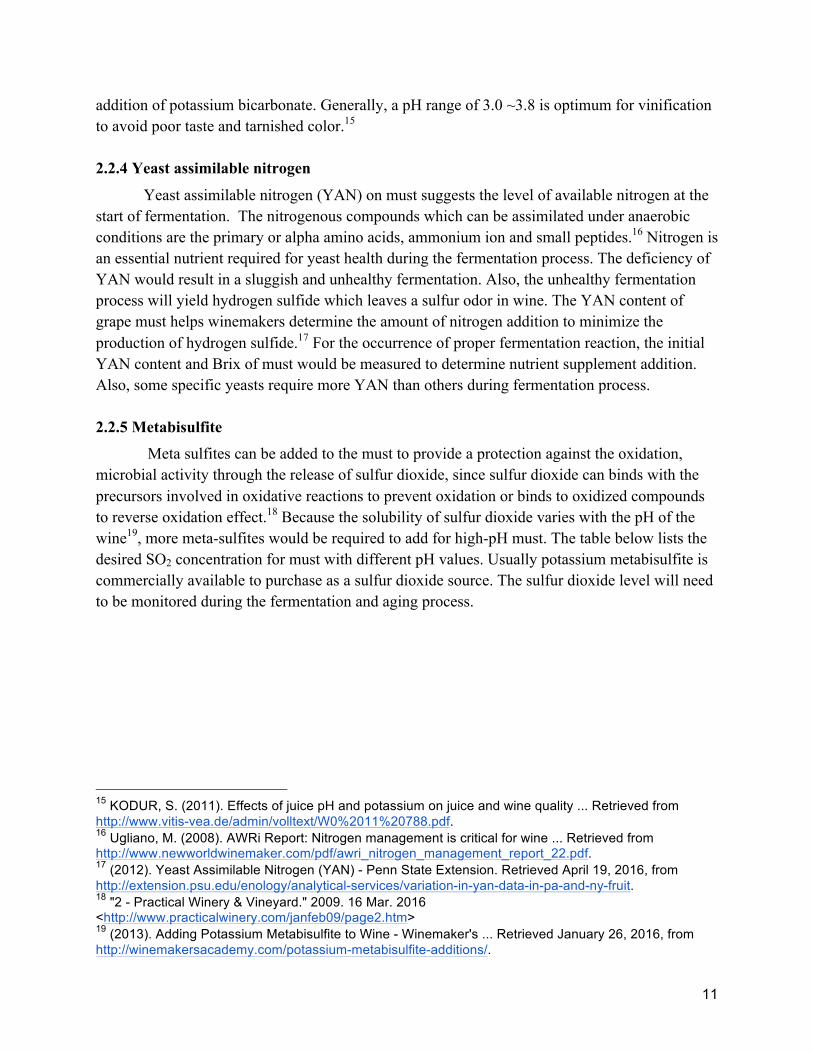
microbial activity through the release of sulfur dioxide, since sulfur dioxide can binds with the precursors involved in oxidative reactions to prevent oxidation or binds to oxidized compounds to reverse oxidation effect.18 Because the solubility of sulfur dioxide varies with the pH of the wine19, more meta-sulfites would be required to add for high-pH must. The table below lists the desired SO2 concentration for must with different pH values. Usually potassium metabisulfite is commercially available to purchase as a sulfur dioxide source. The sulfur dioxide level will need to be monitored during the fermentation and aging process.
15 KODUR, S. (2011). Effects of juice pH and potassium on juice and wine quality ... Retrieved from http://www.vitis-vea.de/admin/volltext/W0%2011%20788.pdf. 16 Ugliano, M. (2008). AWRi Report: Nitrogen management is critical for wine ... Retrieved from http://www.newworldwinemaker.com/pdf/awri_nitrogen_management_report_22.pdf. 17 (2012). Yeast Assimilable Nitrogen (YAN) - Penn State Extension. Retrieved April 19, 2016, from http://extension.psu.edu/enology/analytical-services/variation-in-yan-data-in-pa-and-ny-fruit. 18 "2 - Practical Winery & Vineyard." 2009. 16 Mar. 2016 <http://www.practicalwinery.com/janfeb09/page2.htm> 19 (2013). Adding Potassium Metabisulfite to Wine - Winemaker's ... Retrieved January 26, 2016, from http://winemakersacademy.com/potassium-metabisulfite-additions/.
12
Table 2. Recommended SO2 concentration for different pH value20
pH Desired Free SO2
(ppm) pH Desired Free SO2
(ppm)
2.9 11 3.5 40
3 13 3.6 50
3.1 16 3.7 63
3.2 21 3.8 79
3.3 26 3.9 99
3.4 32 4.0 125
2.3 Microbial Fermentation After collecting and crushing of grapes, the must and juice are moved to a barrel or
fermentation tank. The conversion of grape juice to wine is carried out by yeasts, or a selected S. cerevisiae starter culture.21 During the fermentation, the grape materials tend to float on the top. To acquire better extraction of red pigments and wine flavor, usually winemakers punch down the floating materials or pump juice from the bottom over the floating materials. After the alcoholic fermentation, winemakers can lower wine pH value through using lactic acid bacteria or malolactic fermentation to convert malate to lactate if the pH value of wines is pretty high.22
2.4 Fining and Clarification of Wine After fermentation, the suspended particles are removed through fining and filtering.
Fining is carried out by adding a substance or several substances to wine, which leads to clarification and stabilization of wine. Through a set of fining procedures, a clear aqueous solution can be separated from the must. The filtration is passing wine or must through a media to separate the liquid (wine) from suspended particles. The size of removed particles depends on the filtration system and the specifications of wine quality.
20 (2012). Sulfur Dioxide Additions Using Potassium Metabisulfite. Retrieved April 19, 2016, from https://www.extension.iastate.edu/wine/sites/www.extension.iastate.edu/files/wine/SulfurDioxideAdditions.pdf. 21 (2007). Wine Fermentation - Springer. Retrieved April 19, 2016, from http://www.springer.com/cda/content/document/cda_downloaddocument/9780387745190-c1.pdf?SGWID=0-0-45-475211-p173754537. 22 (2012). Lactic Acid Bacteria and Wine Spoilage - Iowa State ... Retrieved April 19, 2016, from http://www.extension.iastate.edu/wine/lactic-acid-bacteria-and-wine-spoilage.

13
2.5 Aging of Wine Wine aging process is a group of reactions and series of changes that occur after the
alcoholic fermentation. Usually, aging causes a family of changes improves the quality of wine. The influential factors of aging process involve time, type of storage containers and the conditions of storage in the cellar such as temperature and humidity. Cellar temperature can influence aging reactions and length of reaction time. Aging will occur in a shorter time if the temperature of the cellar increases.23 For storage containers, many types of material can be used to store wine, such as stainless steel, concrete, plastics, and wood. The conditioner size and container material also have a profound effect on wine development during maturation as well. Winemakers usually select specific wine containers to develop characteristic wines.
2.6 Yeast: BM4X4 As what mentioned in introduction part, our sponsor decides to use yeast BM4X4
(Saccharomyces cerevisiae var cerevisiae) for winemaking. The BM4X4 would release a significant quantity of parietal polysaccharides, which results in a round mouthfeel, better stability of color and lower astringency of tannins through stabilizing and binding polyphenols in the must. The alcohol tolerance of BM4X4 is 16%, which meets the characteristics and specifications of Zoll Cellars wine product. The optimum fermentation temperature range of the yeast is 16 ~ 28 Celsius degree so that fermentation process can be easily controlled.24
2.7 Project Sponsor: Zoll Cellars Zoll Cellars is a winery located in Shrewsbury, Massachusetts, which is owned and
operated by Frank Zoll since 2009. Frank grows his grapes for wine in Shrewsbury and Lancaster through the biodynamic branch of organic farming. The grape must would be put into stainless steel tanks or oak barrels for six to nine months before bottling wine products. Zoll Cellars is a micro winery and produces approximately 150 gallons of wine every year. Currently, seven different varietals of wines products are sold at local wine shops and restaurants with an average price of seventeen. The wine product also can be purchased through the website, zollwine.com
23 (2012). Oak Aging of Red Wine - Iowa State University Extension ... Retrieved April 19, 2016, from http://www.extension.iastate.edu/wine/oak-aging-red-wine. 24 (2015). BM4X4® - Winequip. Retrieved April 19, 2016, from http://winequip.com.au/wp-content/uploads/2015/01/BM4X4.pdf.

14
Figure 2. Zoll Cellars’ alcohol products
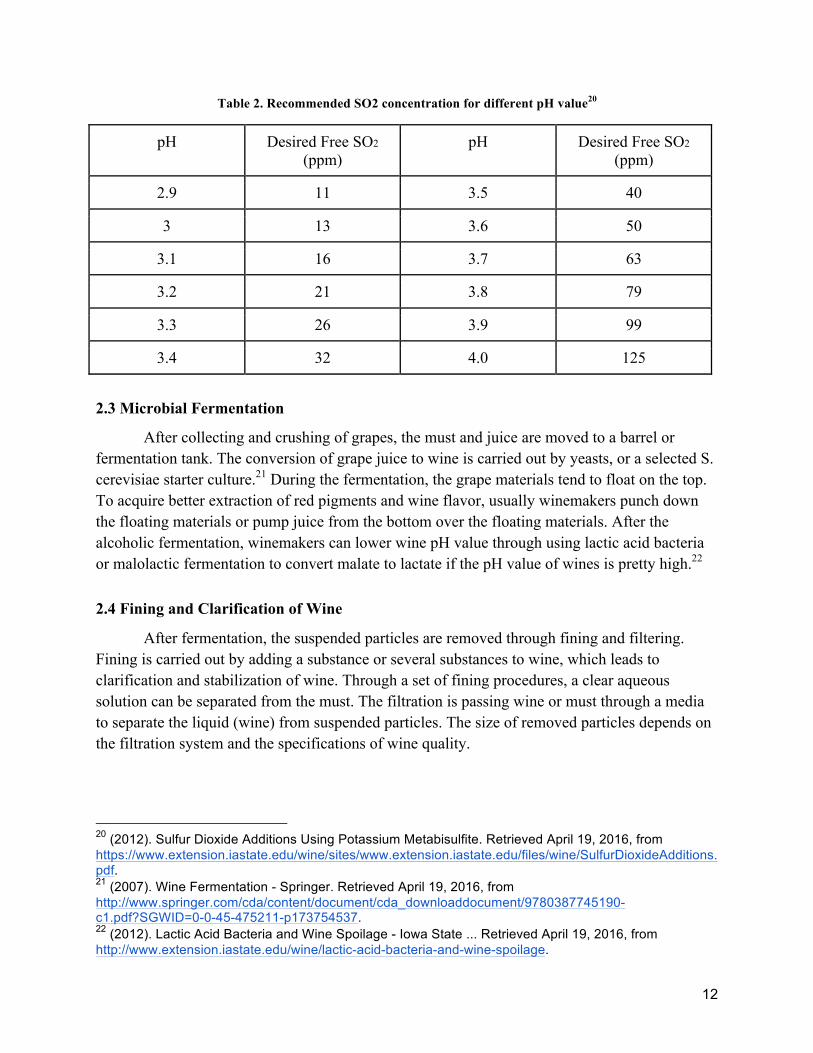
2.8 Gas Chromatography Mass Spectrometry GC-MS is a combination of Gas Chromatography (GC) and mass spectrometry (MS) for
chemical analysis. Gas chromatography is commonly used in analytical chemistry for separating and analyzing compound depends on volatility. Thus, the separation of the mixture would be carried out between a liquid stationary phase and gas mobile phase, and compounds of the mixture would be eluted at a different time, retention time, which indicates the decomposition of liquid samples. During the elution process, mass spectrometry identifies substances by electrically charging the specimen molecules, accelerating them through a magnetic field, breaking the molecules into ionized fragments and detecting those fragments using their mass-to-charge ratio. The MS instrument produces the output by drawing an array of peaks on a chart, the mass spectrum. Each substance of specimen can be identified by comparing the specimen’s mass spectrum with known compounds’ mass spectrum.25
A schematic of the Gas Chromatography Mass Spectrometry is shown in figure 3 below.
25 GC/MS. Retrieved December 22, 2015, from http://www.scientific.org/tutorials/articles/gcms.html.
15
Figure 3. A typical GC-MS instrument26
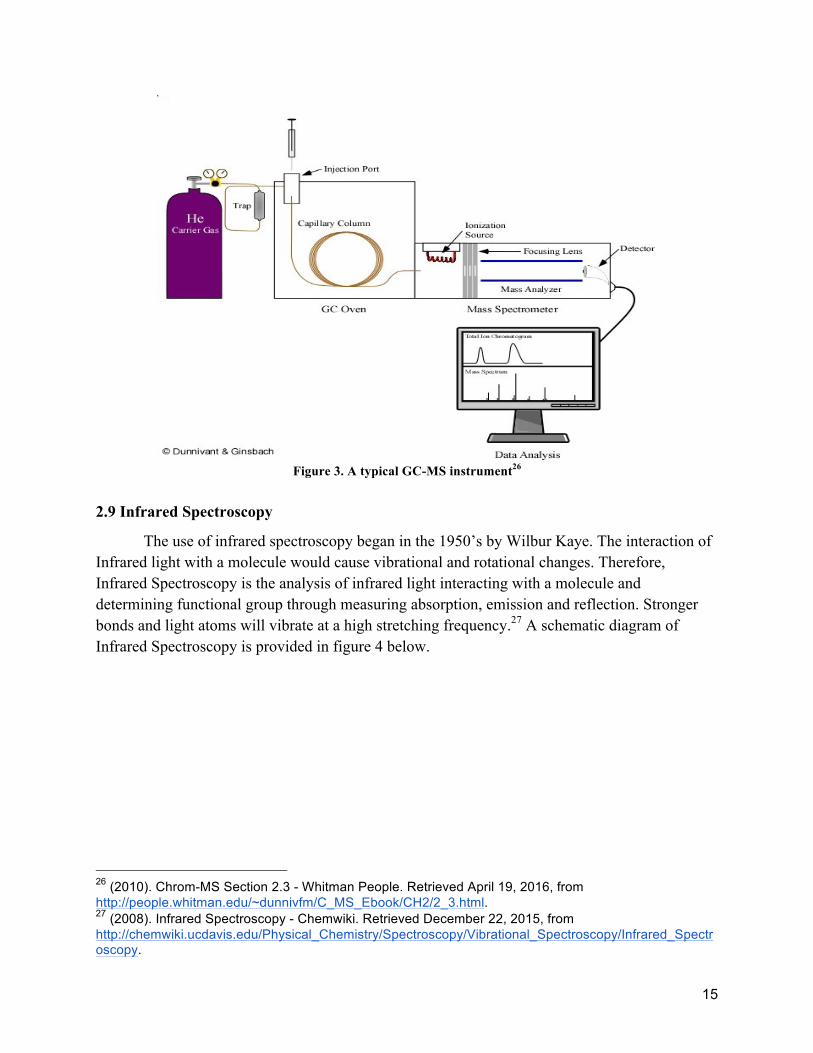
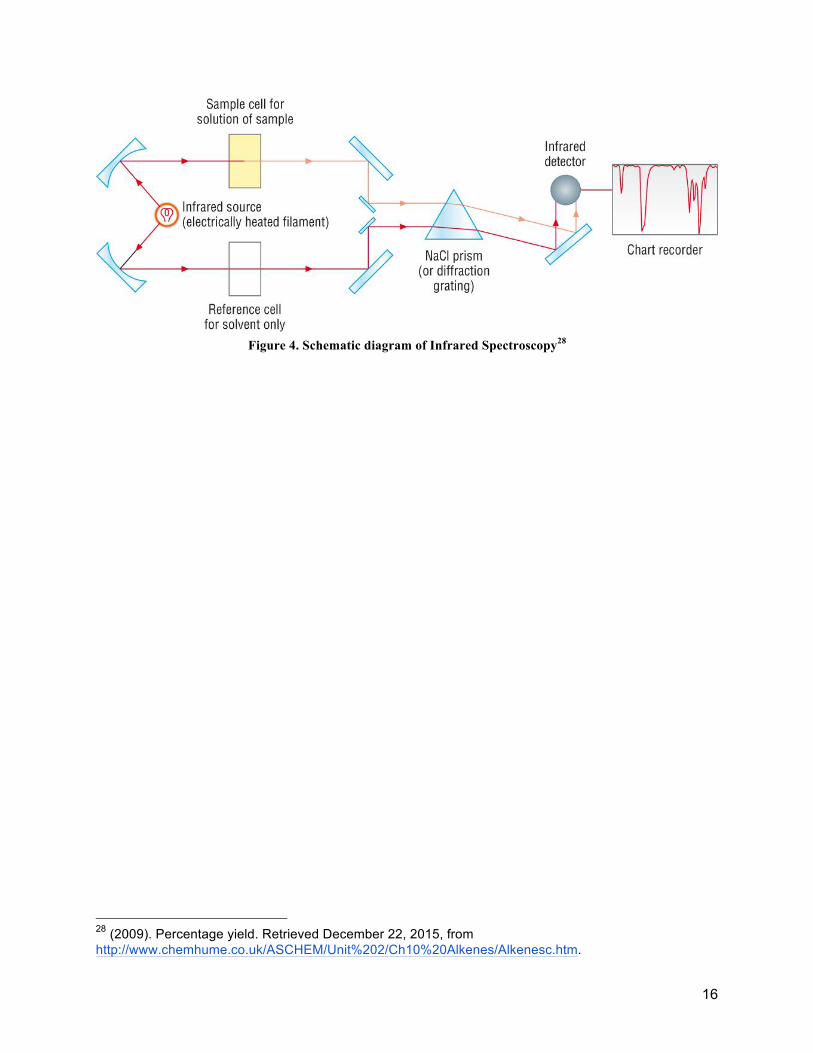
2.9 Infrared Spectroscopy The use of infrared spectroscopy began in the 1950’s by Wilbur Kaye. The interaction of
Infrared light with a molecule would cause vibrational and rotational changes. Therefore, Infrared Spectroscopy is the analysis of infrared light interacting with a molecule and determining functional group through measuring absorption, emission and reflection. Stronger bonds and light atoms will vibrate at a high stretching frequency.27 A schematic diagram of Infrared Spectroscopy is provided in figure 4 below.
26 (2010). Chrom-MS Section 2.3 - Whitman People. Retrieved April 19, 2016, from http://people.whitman.edu/~dunnivfm/C_MS_Ebook/CH2/2_3.html. 27 (2008). Infrared Spectroscopy - Chemwiki. Retrieved December 22, 2015, from http://chemwiki.ucdavis.edu/Physical_Chemistry/Spectroscopy/Vibrational_Spectroscopy/Infrared_Spectroscopy.
16
Figure 4. Schematic diagram of Infrared Spectroscopy28
28 (2009). Percentage yield. Retrieved December 22, 2015, from http://www.chemhume.co.uk/ASCHEM/Unit%202/Ch10%20Alkenes/Alkenesc.htm.
17
3. Methodology The following method utilized in this study were selected basing on literature review and
available resource conditions.
3.1 Micro Fermentation
3.1.1 Method Development Since the volume of grape must is limited, the micro-fermentation approach was applied
to complete the research goal that is investigating the critical process variables of vinification to improve commercial wine product quality for Zoll Winery. This method uses the similar time frame in the winemaking process and simulates the vinification process with a consideration of environmental conditions. It includes crush, fermentation, and analytical measurements. The micro fermenter was designed for micro-fermentation experiment to discover the effect of pH and YAN on wine aroma.
The micro-fermentation was operated in quart sized Mason Jars fitted with an air lock. For the construction of micro-fermenter, the lid was designed and transformed by a mechanical approach. The transformation is drilling a 3/8” hole in jar lids to allow S-shape airlock to be inserted and immobilized by a glue. The particular lids can protect the wine from contaminants presented in the air and enable the release of carbon dioxide produced during the fermentation process. Each grape must which will be prepared for micro-fermentation is about 100 ml. The sugar content of must will be measured for mass change estimation of substrates and product during the overall fermentation process. Also, the ethanol content will be measured by Gas Chromatography to study the fermentation reaction.
The wine micro-fermentation was conducted in January 2016 and expect to see the fermentation termination by February. Wine products will be sealed to prevent loss of aroma Substances.
3.1.2 Material Source The Marquette and Arandell grapes for micro fermentation study were provided by the
sponsor. The yeasts and additives, including malic acid, potassium bicarbonate and potassium metabisulfite, were provided by Zoll Winery as well. The chemical engineering department at WPI and WPI wine project team provided must masher, micro fermenters and other instruments required for this micro fermentation study.
A must masher for this fermentation study was designed and manufactured by Thomas Partington. The masher is composed of a 20 cm polyethylene handle and a Teflon plate with a diameter of 10 cm. There are several 5 mm holes in the plate, which enables better separation between grape juice and suspended particles. The Figure 5 shown below is the picture of the must masher.

18
Figure 5. Must Masher
3.1.3 Fermentation In this project, the pH and yeast assimilable nitrogen (YAN) were regarded as the
influential factors for vinification. Arandell must were used for investigation of the perfect combination of pH and YAN While the limited volume of Marquette must only enable the study of pH selection process.
In this project, the pH and yeast assimilable nitrogen (YAN) were regarded as the influential factors for winemaking. Arandell must was used for investigation of the perfect combination of pH and YAN while the limited volume of Marquette must only enable the execution of the pH selection process study.
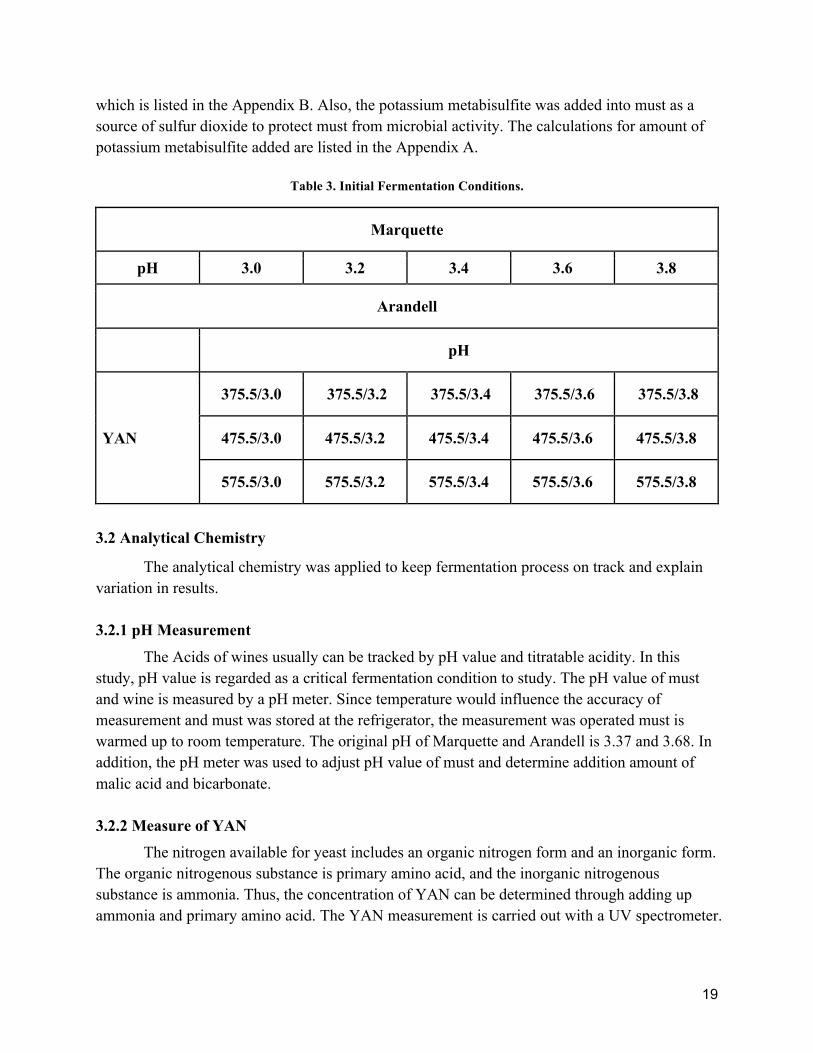
A pH range of 3.0 ~ 3.8 is recommended for most winemakers. In this way, the fermentation experiments were executed with pH Values of 3.0, 3.2, 3.4, 3.6 & 3.8 to determine the optimum pH value for improving wine quality. The must pH was adjusted by adding of malic acid and potassium bicarbonate. Since YAN requirement for vinification depends on species of yeast, the YAN concentration of must was measured and adjusted to determine an optimum YAN concentration as a recommended value for BM 4X4 yeast. The optimum YAN concentration was determined by conducting fermentation with three YAN concentrations. The initial YAN amount of Marquette and Arandell is 395.9 mg/L and 375.5 mg/L. Since it is hard to separate YAN from must, the YAN concentration was adjusted through adding Ammonium Phosphate ((NH4)2HPO4). The initial fermentation conditions settings are listed in table 3. Each micro-fermentation experiment with different initial fermentation condition combination was conducted in duplicate. The fermentation was activated by following the instruction of BM4X4,
19
which is listed in the Appendix B. Also, the potassium metabisulfite was added into must as a source of sulfur dioxide to protect must from microbial activity. The calculations for amount of potassium metabisulfite added are listed in the Appendix A.
Table 3. Initial Fermentation Conditions.
Marquette
pH 3.0 3.2 3.4 3.6 3.8
Arandell
pH
YAN
375.5/3.0 375.5/3.2 375.5/3.4 375.5/3.6 375.5/3.8
475.5/3.0 475.5/3.2 475.5/3.4 475.5/3.6 475.5/3.8
575.5/3.0 575.5/3.2 575.5/3.4 575.5/3.6 575.5/3.8
3.2 Analytical Chemistry The analytical chemistry was applied to keep fermentation process on track and explain
variation in results.
3.2.1 pH Measurement The Acids of wines usually can be tracked by pH value and titratable acidity. In this
study, pH value is regarded as a critical fermentation condition to study. The pH value of must and wine is measured by a pH meter. Since temperature would influence the accuracy of measurement and must was stored at the refrigerator, the measurement was operated must is warmed up to room temperature. The original pH of Marquette and Arandell is 3.37 and 3.68. In addition, the pH meter was used to adjust pH value of must and determine addition amount of malic acid and bicarbonate.
3.2.2 Measure of YAN The nitrogen available for yeast includes an organic nitrogen form and an inorganic form.
The organic nitrogenous substance is primary amino acid, and the inorganic nitrogenous substance is ammonia. Thus, the concentration of YAN can be determined through adding up ammonia and primary amino acid. The YAN measurement is carried out with a UV spectrometer.
20
The ammonia nitrogen test can be used to measure Ammonia Nitrogen (AN) concentration, and the primary amino acid test can be used to measure primary amino acid nitrogen (PAN) concentration. For the ammonia nitrogen test, nicotinamide adenosine dinucleotide (NADPH), α-ketoglutaric acid (KGA) and L-glutamate dehydrogenase (GDH) are added to the specimen in the presence of buffers. 29 For the Primary Amino Acid test, orthophthalialdehyde (OPA) and N-acetyl-L-cysteine (NAC) bind with primary amino acids in the samples to from isoindole derivative. Thus, the amount of isoindole derivate formed is proportional to the amount of primary amino acids in the specimen. The isoindole derivative can be measured by the increment in absorbance at 340 nm. 30
The juice and wine would be diluted and bleached before YAN measurement. The specimen was prepared by mixing 6 ml of DI water, 2 ml of grape juice or wine and 0.2 ml of bleach.
The AN and PAN can be calculated basing on absorbance at 340 nm. Then adding up the two concentration values to determine the YAN content. The test keys procedures and YAN measurement calculation are listed in Appendix C. 3.2.3 GC-MS
GC-MS was performed to study the aroma molecules in wine. Analytes were prepared by two ways. One way is using 4 ml of grape juice and 1 ml of dichloromethane in a 15 ml test tube. The other one is using 4 ml of grape juice, 1 ml of dichloromethane and 0.5 ml of an internal standard. The analyte was shaken for 15 minutes by hand and filtrated by syringe filters.
The internal standard for GC-MS was prepared as an Acetone solution with Isoamyl Alcohol, Ethyl Acetate and Cyclohexanol. The gas chromatography method was determined by trial. The important parameters are as follows. The injection was done by the auto sampler injecting 2 ul of analyte in split mode with a split ratio of 50 to 1 and a split flow of 50 ml/min at 280°C. The carrier gas, He, was controlled at a constant pressure of 11.6 psi. The oven temperature was held at 40 mins (1 min), ramp 20°C/min to 325°C, hold for 5 minutes. The mass spectrometer was operated with an interface temp of 230 °C and ion source of 150 °C. The detection time window began to plot at 1 minutes to the end at 21 min.
3.2.4 IR Spectroscopy
Infrared Spectroscopy was used for several selected must samples during micro-fermentation process to determine when the fermentation process is finished. The composition change of wine would be slight at the end of the fermentation process. If the absorbance of each peak in IR spectrum of must sample stops varying, the fermentation process has been finished.
29 (2013). AA0100 - Sigma-Aldrich. Retrieved January 27, 2016, from https://www.sigmaaldrich.com/content/dam/sigma-aldrich/docs/Sigma/Bulletin/aa0100bul.pdf. 30 (2015). Data Booklet - Megazyme. Retrieved January 27, 2016, from https://secure.megazyme.com/files/Booklet/K-PANOPA_DATA.pdf.

21
3.3 Smell Descriptions
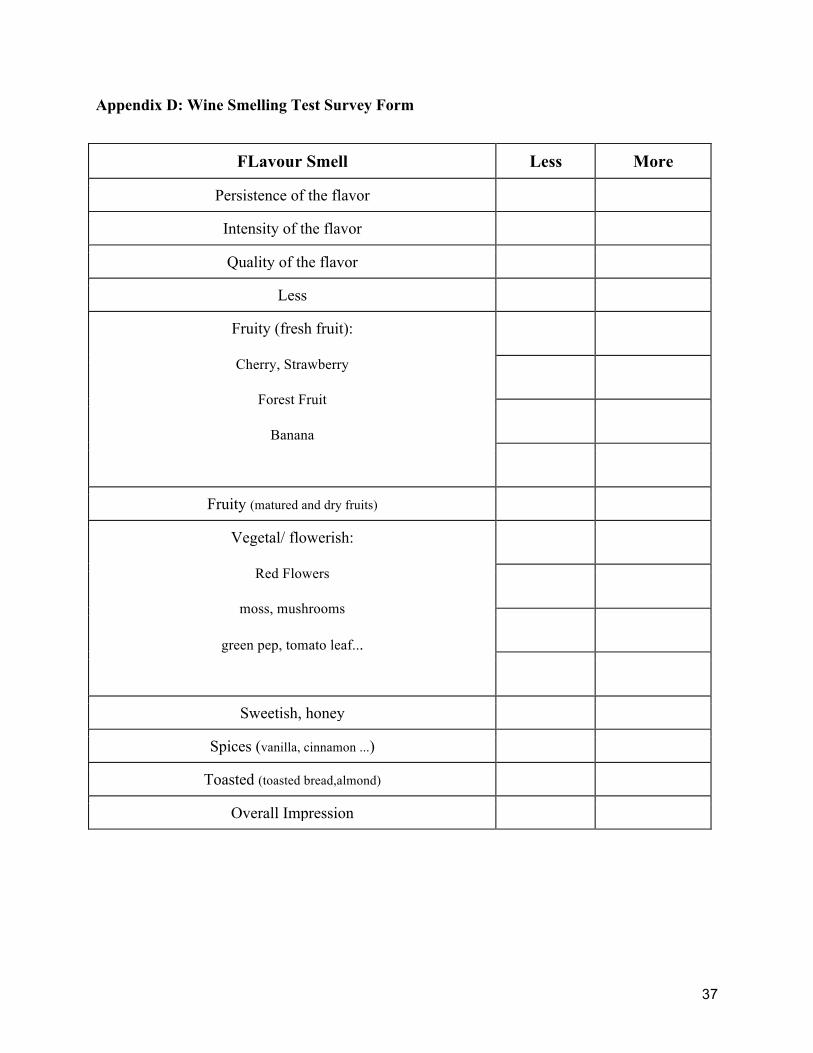
In this project, a sensory description for each wine sample is required to discern the subtle difference in forty samples and discover the optimum initial fermentation condition. Commonly the most important test in winemaking process is winemaker's sensory description of wine from tasting and smelling wine samples. Since the fermentation process was operated in the laboratory, the wine samples are not drinkable for safety consideration. Thus, only a smelling test was carried out to figure out wine aroma profiles. The wines were evaluated based on their aroma in this study. A smell test form was designed to collect and quantify sensory description of wine aroma. The form is shown in Appendix D.
4. Results
The results will be given in five sections to depict several aspects of the wine and effect of must pH and YAN.
4.1 pH Change
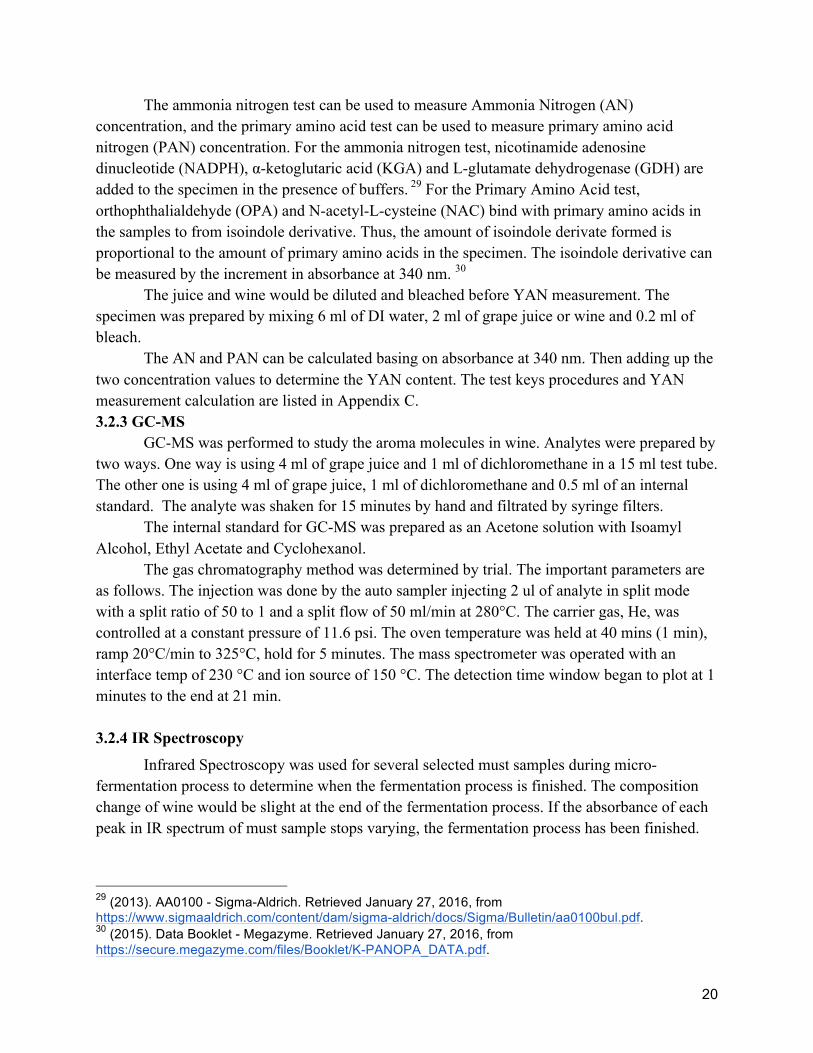
The pH values of wine samples are summarized in Table 4 and Figure 6. In accordance with the pH value, the wine all are basic than must. Thus, the yeast’s activity during alcoholic fermentation deacidifies must. Four regression analysis was made to get R-square values. The R-square values all are close to 1, which indicates that the pH change during fermentation are almost constant for grape must with same YAN concentration.
22
Figure 6. pH Value of Wine Samples and Regression Analysis
Table 4. pH Value of Wine Samples
pH 3.0 3.2 3.4 3.6 3.8 Arandell (375.5 mg/L YAN) 3.37 3.60 3.83 3.94 4.13 Arandell (475.5 mg/L YAN) 3.36 3.54 3.73 3.90 3.98 Arandell (575.5 mg/L YAN) 3.26 3.52 3.74 3.83 3.97
Marquette (397.9 mg/L YAN) 3.34 3.49 3.66 3.71 3.94
y = 0.9275x + 0.6175 R² = 0.98387
y = 0.8025x + 0.9705 R² = 0.98192
y = 0.865x + 0.72 R² = 0.96407
y = 0.7125x + 1.2035 R² = 0.97057
3.00
3.20
3.40
3.60
3.80
4.00
4.20
3 3.1 3.2 3.3 3.4 3.5 3.6 3.7 3.8 3.9
Wine PH
Must PH
Arandell (375.5 mg/L YAN)
Arandell (475.5 mg/L YAN)
Arandell (575.5 mg/L YAN)
MarqueEe
23
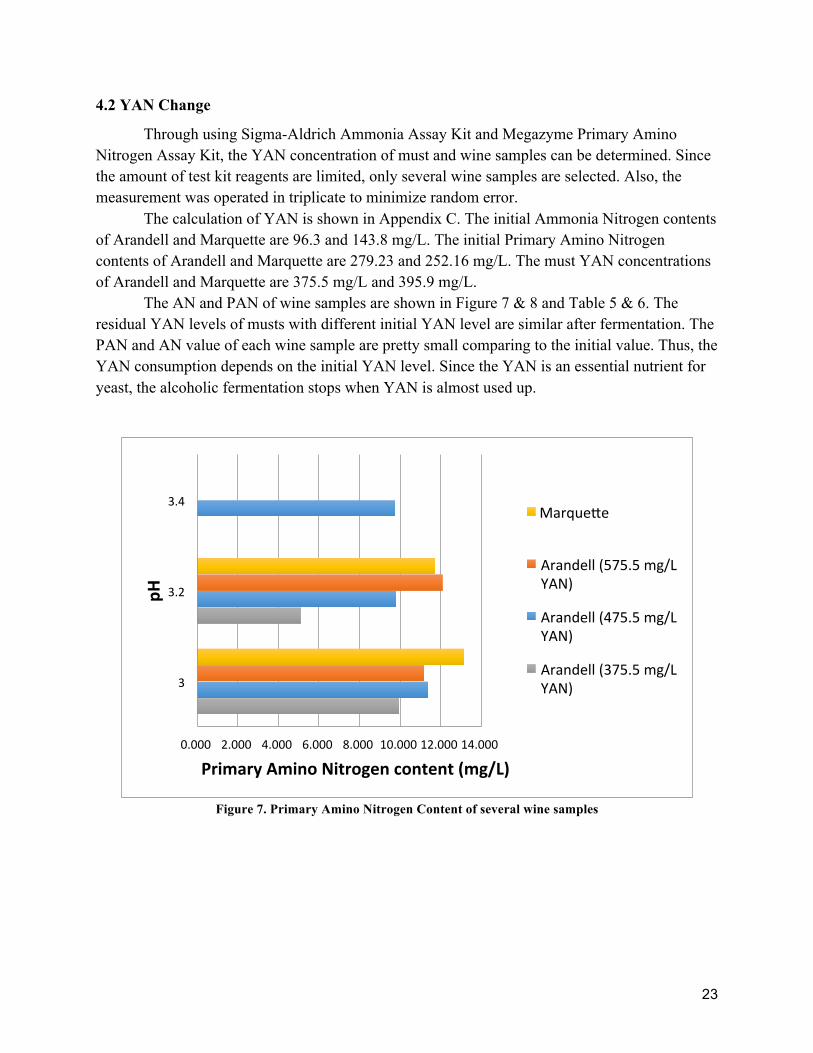
4.2 YAN Change
Through using Sigma-Aldrich Ammonia Assay Kit and Megazyme Primary Amino Nitrogen Assay Kit, the YAN concentration of must and wine samples can be determined. Since the amount of test kit reagents are limited, only several wine samples are selected. Also, the measurement was operated in triplicate to minimize random error.
The calculation of YAN is shown in Appendix C. The initial Ammonia Nitrogen contents of Arandell and Marquette are 96.3 and 143.8 mg/L. The initial Primary Amino Nitrogen contents of Arandell and Marquette are 279.23 and 252.16 mg/L. The must YAN concentrations of Arandell and Marquette are 375.5 mg/L and 395.9 mg/L.
The AN and PAN of wine samples are shown in Figure 7 & 8 and Table 5 & 6. The residual YAN levels of musts with different initial YAN level are similar after fermentation. The PAN and AN value of each wine sample are pretty small comparing to the initial value. Thus, the YAN consumption depends on the initial YAN level. Since the YAN is an essential nutrient for yeast, the alcoholic fermentation stops when YAN is almost used up.
Figure 7. Primary Amino Nitrogen Content of several wine samples
0.000 2.000 4.000 6.000 8.000 10.000 12.000 14.000
3
3.2
3.4
Primary Amino Nitrogen content (mg/L)
pH
MarqueEe
Arandell (575.5 mg/L YAN)
Arandell (475.5 mg/L YAN)
Arandell (375.5 mg/L YAN)

24
Figure 8. Ammonia Nitrogen Content of several wine samples
Table 5. Primary Amino Nitrogen (PAN) data for all wine samples
PAN (mg/L) pH 3 3.2 3.4
Arandell (375.5 mg/L YAN) 9.961 5.115 Arandell (475.5 mg/L YAN) 11.397 9.826 9.781
Arandell (575.5 mg/L YAN) 11.217 12.114 Marquette 13.191 11.756
Table 6. Ammonia Nitrogen (AN) data for all wine samples
AN (mg/L) pH 3 3.2 3.4
Arandell (375.5 mg/L YAN) 0.0505 0.0495 Arandell (475.5 mg/L YAN) -0.04675 -0.02325 0.00825 Arandell (575.5 mg/L YAN) 0.045 0.00875
Marquette -0.0145 -0.0335
0 10 20 30 40
3.0
3.2
Ammmonia Nitrogen Content (mg/L)
PH Arandell (575.5 mg/L YAN)
Arandell (375.5 mg/L YAN)
25
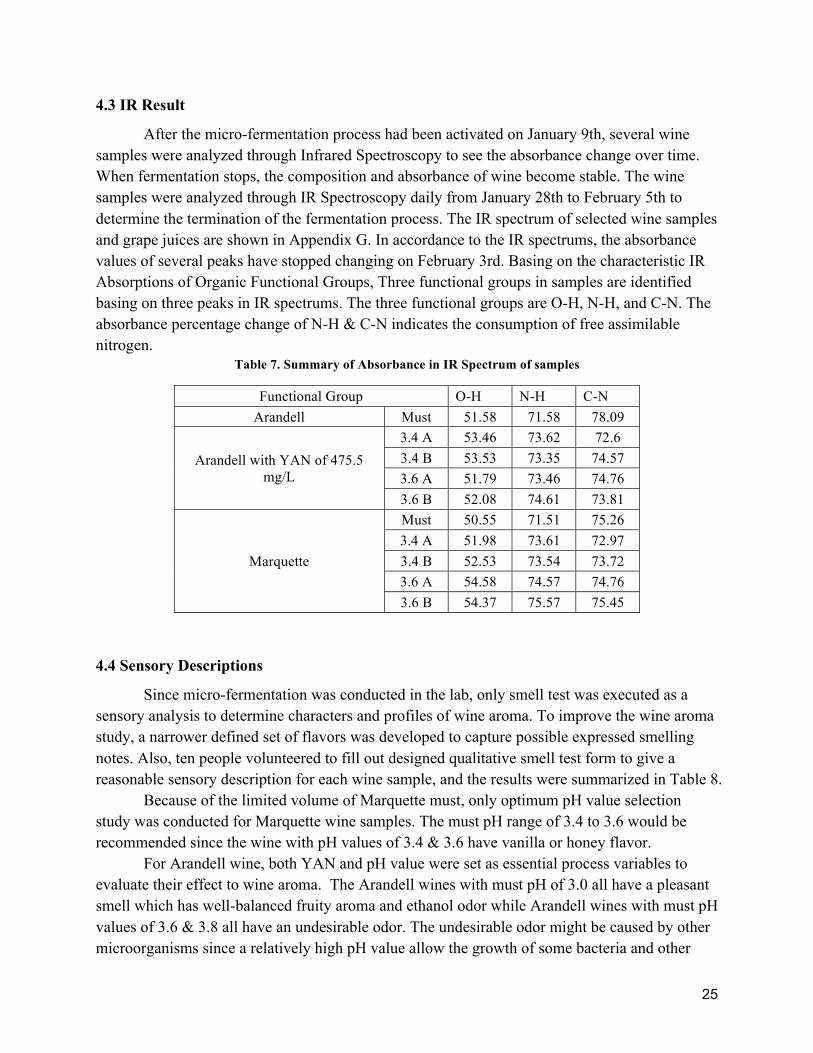
4.3 IR Result
After the micro-fermentation process had been activated on January 9th, several wine samples were analyzed through Infrared Spectroscopy to see the absorbance change over time. When fermentation stops, the composition and absorbance of wine become stable. The wine samples were analyzed through IR Spectroscopy daily from January 28th to February 5th to determine the termination of the fermentation process. The IR spectrum of selected wine samples and grape juices are shown in Appendix G. In accordance to the IR spectrums, the absorbance values of several peaks have stopped changing on February 3rd. Basing on the characteristic IR Absorptions of Organic Functional Groups, Three functional groups in samples are identified basing on three peaks in IR spectrums. The three functional groups are O-H, N-H, and C-N. The absorbance percentage change of N-H & C-N indicates the consumption of free assimilable nitrogen.
Table 7. Summary of Absorbance in IR Spectrum of samples
Functional Group O-H N-H C-N Arandell Must 51.58 71.58 78.09
Arandell with YAN of 475.5 mg/L
3.4 A 53.46 73.62 72.6 3.4 B 53.53 73.35 74.57 3.6 A 51.79 73.46 74.76 3.6 B 52.08 74.61 73.81
Marquette
Must 50.55 71.51 75.26 3.4 A 51.98 73.61 72.97 3.4 B 52.53 73.54 73.72 3.6 A 54.58 74.57 74.76 3.6 B 54.37 75.57 75.45
4.4 Sensory Descriptions
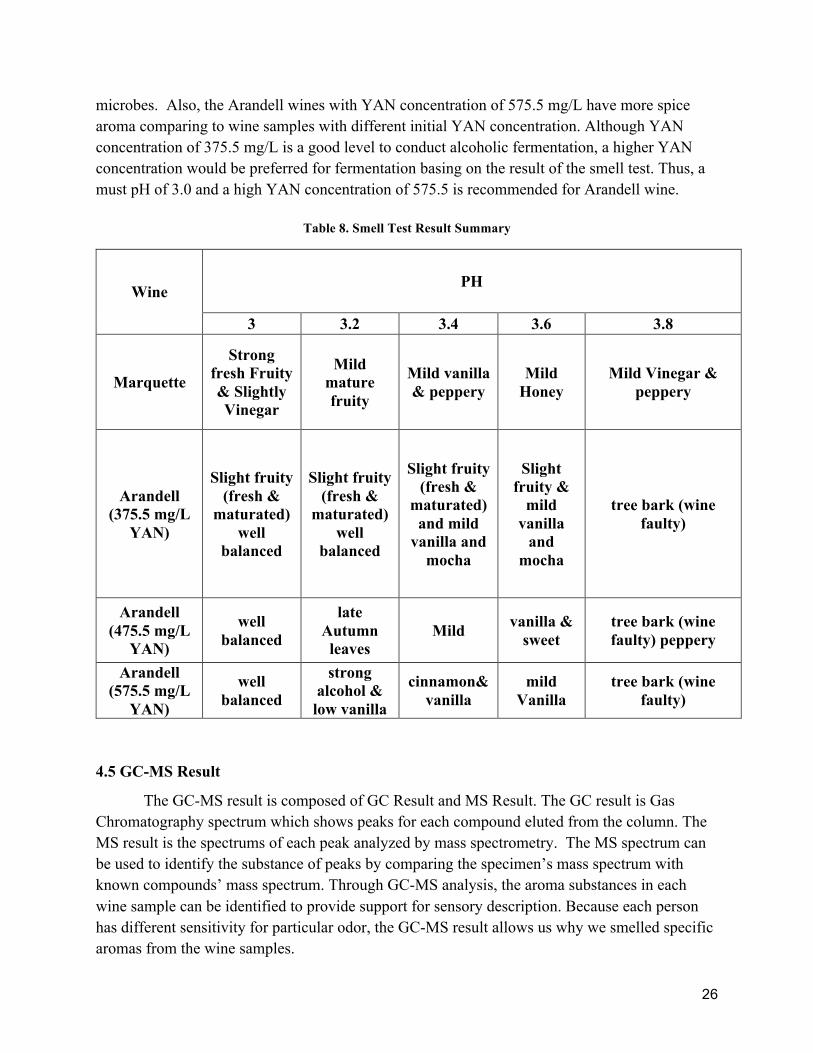
Since micro-fermentation was conducted in the lab, only smell test was executed as a sensory analysis to determine characters and profiles of wine aroma. To improve the wine aroma study, a narrower defined set of flavors was developed to capture possible expressed smelling notes. Also, ten people volunteered to fill out designed qualitative smell test form to give a reasonable sensory description for each wine sample, and the results were summarized in Table 8.
Because of the limited volume of Marquette must, only optimum pH value selection study was conducted for Marquette wine samples. The must pH range of 3.4 to 3.6 would be recommended since the wine with pH values of 3.4 & 3.6 have vanilla or honey flavor.
For Arandell wine, both YAN and pH value were set as essential process variables to evaluate their effect to wine aroma. The Arandell wines with must pH of 3.0 all have a pleasant smell which has well-balanced fruity aroma and ethanol odor while Arandell wines with must pH values of 3.6 & 3.8 all have an undesirable odor. The undesirable odor might be caused by other microorganisms since a relatively high pH value allow the growth of some bacteria and other
26
microbes. Also, the Arandell wines with YAN concentration of 575.5 mg/L have more spice aroma comparing to wine samples with different initial YAN concentration. Although YAN concentration of 375.5 mg/L is a good level to conduct alcoholic fermentation, a higher YAN concentration would be preferred for fermentation basing on the result of the smell test. Thus, a must pH of 3.0 and a high YAN concentration of 575.5 is recommended for Arandell wine.
Table 8. Smell Test Result Summary
Wine PH
3 3.2 3.4 3.6 3.8
Marquette
Strong fresh Fruity & Slightly Vinegar
Mild mature fruity
Mild vanilla & peppery
Mild Honey
Mild Vinegar & peppery
Arandell (375.5 mg/L
YAN)
Slight fruity (fresh &
maturated) well
balanced
Slight fruity (fresh &
maturated) well
balanced
Slight fruity (fresh &
maturated) and mild
vanilla and mocha
Slight fruity &
mild vanilla
and mocha
tree bark (wine faulty)
Arandell (475.5 mg/L
YAN)
well balanced
late Autumn
leaves Mild vanilla &
sweet tree bark (wine faulty) peppery
Arandell (575.5 mg/L
YAN)
well balanced
strong alcohol &
low vanilla
cinnamon& vanilla
mild Vanilla
tree bark (wine faulty)
4.5 GC-MS Result
The GC-MS result is composed of GC Result and MS Result. The GC result is Gas Chromatography spectrum which shows peaks for each compound eluted from the column. The MS result is the spectrums of each peak analyzed by mass spectrometry. The MS spectrum can be used to identify the substance of peaks by comparing the specimen’s mass spectrum with known compounds’ mass spectrum. Through GC-MS analysis, the aroma substances in each wine sample can be identified to provide support for sensory description. Because each person has different sensitivity for particular odor, the GC-MS result allows us why we smelled specific aromas from the wine samples.

27
Initially, the specimen was preparing by mixing 4 ml of grape juice and 1 ml of dichloromethane, the peaks were not well-separated, and gas chromatography had a trouble to obtain the result. Another method of specimen preparation was applied and good GCMS result was obtained, the difference between the two specimen preparation methods is the addition of internal standard which is made of isometric Acetone Isoamyl Alcohol, Ethyl Acetate, and Cyclohexanol. The GCMS result of Marquette wine with must pH of 3.0 is shown in Figure 9, which includes Gas chromatography spectrum and each substance in the specimen.
Figure 9. GCMS Result of Marquette Wine with Must pH of 3.0
For Marquette wine samples, 38 substances were identified using GCMS. The composition of each Marquette Wine is shown in Appendix E. Through learning odor description
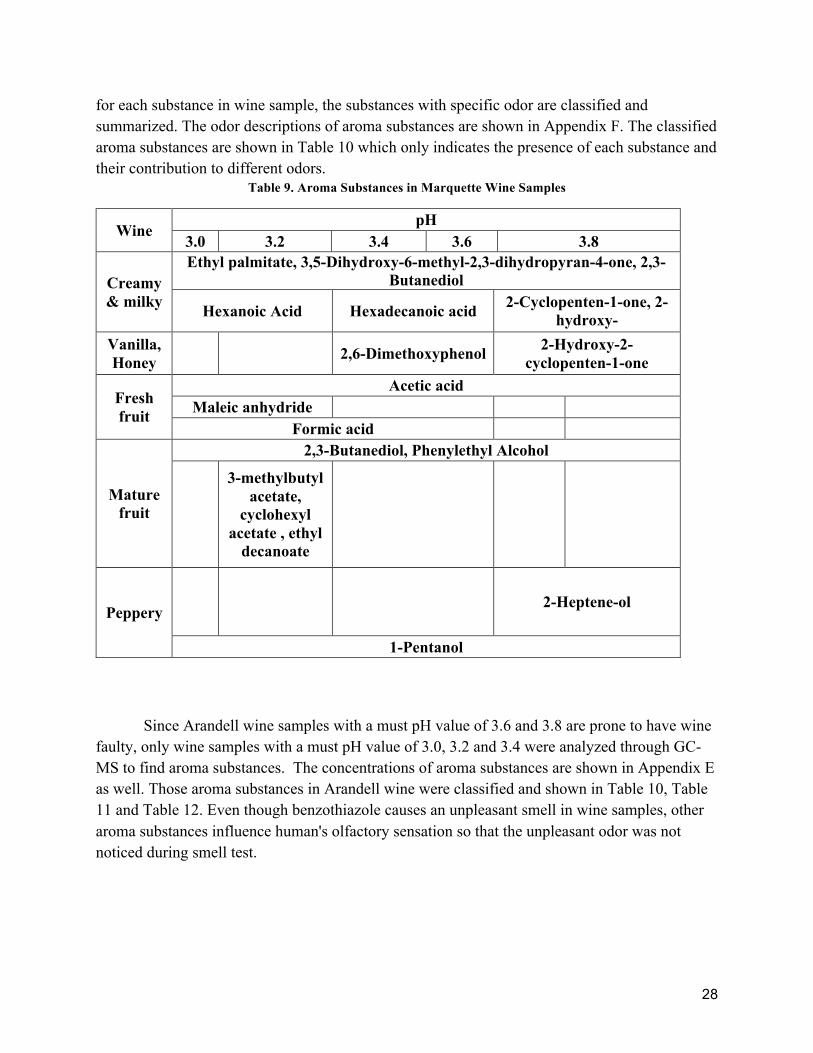
28
for each substance in wine sample, the substances with specific odor are classified and summarized. The odor descriptions of aroma substances are shown in Appendix F. The classified aroma substances are shown in Table 10 which only indicates the presence of each substance and their contribution to different odors.
Table 9. Aroma Substances in Marquette Wine Samples
Wine pH
3.0 3.2 3.4 3.6 3.8
Creamy & milky
Ethyl palmitate, 3,5-Dihydroxy-6-methyl-2,3-dihydropyran-4-one, 2,3-Butanediol
Hexanoic Acid Hexadecanoic acid 2-Cyclopenten-1-one, 2-hydroxy-
Vanilla, Honey 2,6-Dimethoxyphenol 2-Hydroxy-2-
cyclopenten-1-one
Fresh fruit
Acetic acid Maleic anhydride
Formic acid
Mature fruit
2,3-Butanediol, Phenylethyl Alcohol
3-methylbutyl acetate,
cyclohexyl acetate , ethyl
decanoate
Peppery 2-Heptene-ol
1-Pentanol
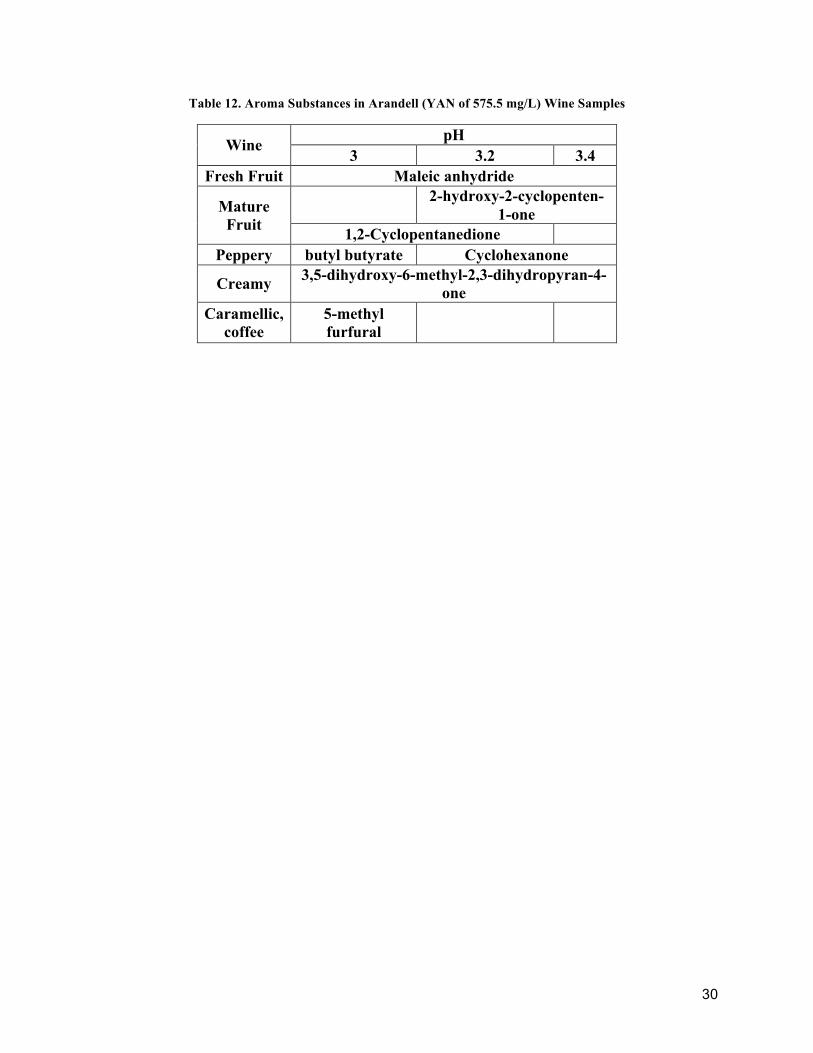
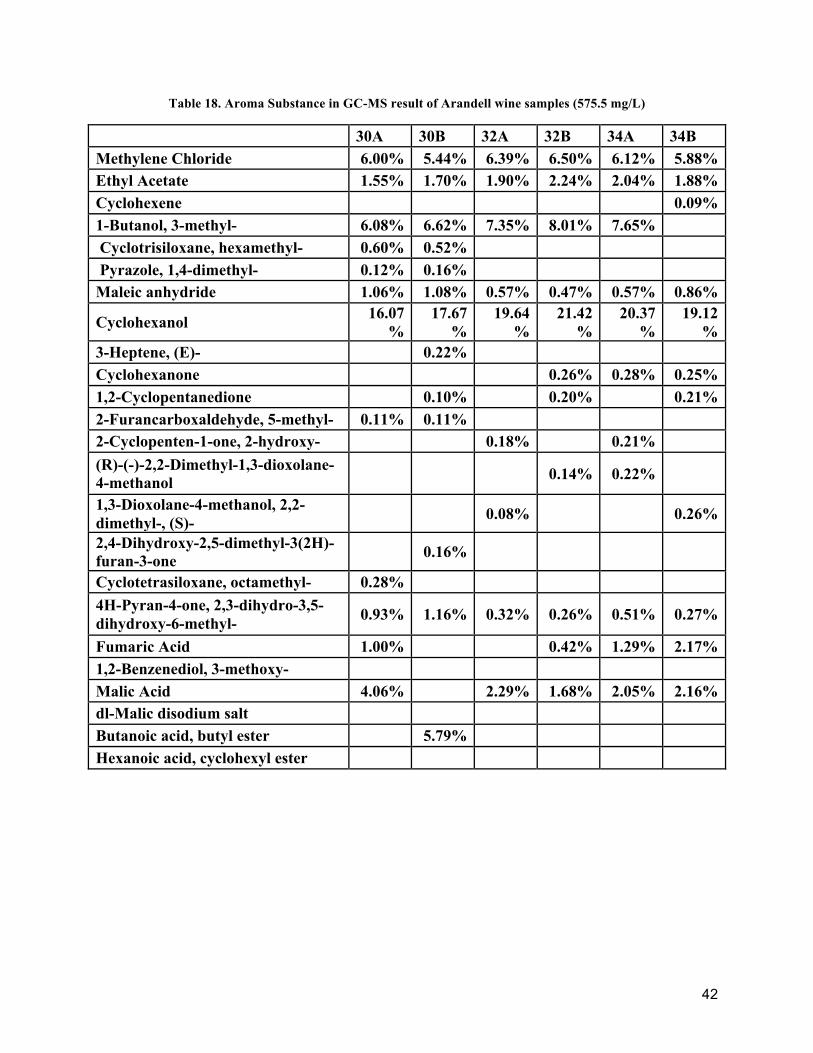
Since Arandell wine samples with a must pH value of 3.6 and 3.8 are prone to have wine faulty, only wine samples with a must pH value of 3.0, 3.2 and 3.4 were analyzed through GC-MS to find aroma substances. The concentrations of aroma substances are shown in Appendix E as well. Those aroma substances in Arandell wine were classified and shown in Table 10, Table 11 and Table 12. Even though benzothiazole causes an unpleasant smell in wine samples, other aroma substances influence human's olfactory sensation so that the unpleasant odor was not noticed during smell test.

29
Table 10. Aroma Substances in Arandell (YAN of 375.5 mg/L) Wine Samples
Wine pH
3 3.2 3.4 Fresh Fruit Maleic anhydride
Mature Fruit Phenylethyl Alcohol
Ethyl Acetate
Peppery Cyclohexanone 1,2-Benzenediol
Creamy Butyrolactone, Hexanoic acid
3,5-dihydroxy-6-methyl-2,3-dihydropyran-4-one Caramellic, coffee 1,2-Cyclopentanedione Unpleasant flavor Benzothiazole
Table 11. Aroma Substances in Arandell (YAN of 475.5 mg/L) Wine Samples
Wine pH
3 3.2 3.4
Fresh Fruit
Maleic anhydride Cyclohexyl carboxylic acid Butyl acetate
Valeric acid
CYCLOHEXYL CARBINOL
Mature Fruit
strawberry furanone 2,2-Diethoxypropane, Isoamyl acetate, Cyclohexyl acetate, Phenylethyl Alcohol
cyclohexyl hexanoate, butyl butyrate
Peppery Cyclohexanone Tert-Butyl ethyl ether
1,2-Benzenediol 1-Pentanol
Creamy
Butyrolactone Hexanoic acid
3,5-dihydroxy-6-methyl-2,3-dihydropyran-4-one
Caramellic, coffee
2(3H)-Furanone, 5-methyl
Unpleasant flavor Benzothiazole
30
Table 12. Aroma Substances in Arandell (YAN of 575.5 mg/L) Wine Samples
Wine pH 3 3.2 3.4
Fresh Fruit Maleic anhydride
Mature Fruit
2-hydroxy-2-cyclopenten-1-one
1,2-Cyclopentanedione Peppery butyl butyrate Cyclohexanone
Creamy 3,5-dihydroxy-6-methyl-2,3-dihydropyran-4-one
Caramellic, coffee
5-methyl furfural
31
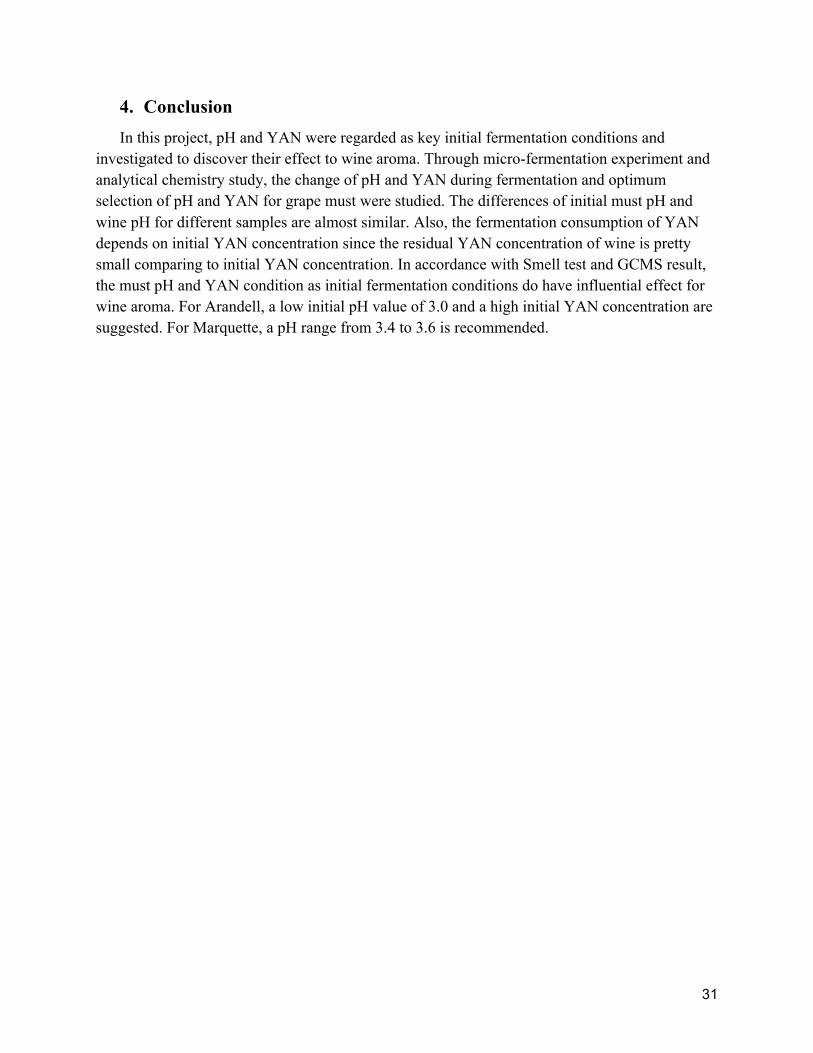
4. Conclusion In this project, pH and YAN were regarded as key initial fermentation conditions and
investigated to discover their effect to wine aroma. Through micro-fermentation experiment and analytical chemistry study, the change of pH and YAN during fermentation and optimum selection of pH and YAN for grape must were studied. The differences of initial must pH and wine pH for different samples are almost similar. Also, the fermentation consumption of YAN depends on initial YAN concentration since the residual YAN concentration of wine is pretty small comparing to initial YAN concentration. In accordance with Smell test and GCMS result, the must pH and YAN condition as initial fermentation conditions do have influential effect for wine aroma. For Arandell, a low initial pH value of 3.0 and a high initial YAN concentration are suggested. For Marquette, a pH range from 3.4 to 3.6 is recommended.
32
Appendices
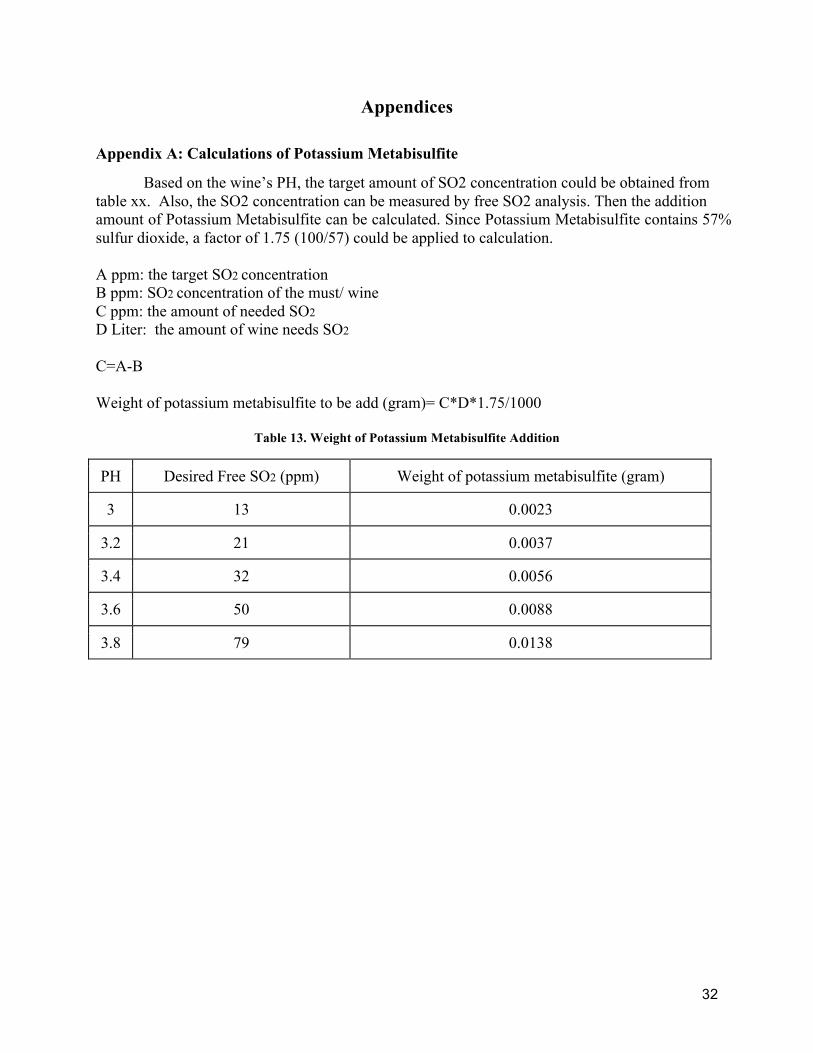
Appendix A: Calculations of Potassium Metabisulfite
Based on the wine’s PH, the target amount of SO2 concentration could be obtained from table xx. Also, the SO2 concentration can be measured by free SO2 analysis. Then the addition amount of Potassium Metabisulfite can be calculated. Since Potassium Metabisulfite contains 57% sulfur dioxide, a factor of 1.75 (100/57) could be applied to calculation. A ppm: the target SO2 concentration B ppm: SO2 concentration of the must/ wine C ppm: the amount of needed SO2 D Liter: the amount of wine needs SO2 C=A-B Weight of potassium metabisulfite to be add (gram)= C*D*1.75/1000
Table 13. Weight of Potassium Metabisulfite Addition
PH Desired Free SO2 (ppm) Weight of potassium metabisulfite (gram)
3 13 0.0023
3.2 21 0.0037
3.4 32 0.0056
3.6 50 0.0088
3.8 79 0.0138

33
Appendix B: Instruction for BM4X4 Yeast
Dosage Rate: • 25g/hL ~35g/hL of Active Dried Yeast (this will provide an initial cell population of approximately 5 x10⁶ viable cells/ml). • 30g/hL of GoFerm product. Procedure for 1000L ferment. 1) Add 300g of GoFerm product to 5L of 40-43 Celsius Degree clean, chlorine free water. Stir until a homogenous suspension free of lumps is achieved. 2) When the temperature of this suspension is between 35-40 Celsius Degree, sprinkle 250g of yeast, slowly and evenly onto the surface of the water, whilst gently stirring. Ensure any clumps are dispersed. 3) Allow to stand for 20 minutes before further gently mixing. 4) Mix the rehydrated yeast with a little juice, gradually adjusting the yeast suspension temperature to within 5-10 Celsius Degree of the juice/must temperature. 5) Inoculate into the must. Further Notes: • Steps 1-5 should be completed within 30 minutes. • It is best to limit first juice/must volume addition to one tenth the yeast suspension volume and wait 10 minutes before the addition to juice. • To minimize cold shock, ensure temperature changes are less than 10oC. • It is recommended that juice/must be inoculated no lower than 18oC. Since the volumne of each must is 100 ml and recommended yeast concentration is 25g/hL ~35g/hL, 30mg BM 4X4 yeast was added into each must to conduct micro fermentation. Thus 0.6ml ferment was added into each must. Sample Calculation: Ferment Concentration: 250 g/ 5L= 0.05g/ml Ferment Addition dosage: (30 mg * 1g/1000mg) /0.05 g/ml=0.6 ml

34
Appendix C: YAN Measurement Procedures and Calculation
Sigma-Aldrich Ammonia Assay Kit Procedure 1. Pipette the following solutions into appropriately marked cuvettes.
Cuvette Ammonia Assay Reagent
Ammonia Standard Solution
Sample Volume Water
Reagent Blank 1.0 ml 100 ml Test 1.0 ml 10 ml
Standard 1.0 ml 0.05 ml 2. Set the spectrophotometer to 340 nm and the absorbance to zero using water as the reference. 3. Mix the contents in each cuvette and incubate for~5 minutes at 18–35 °C. Measure the absorbance of each solution at 340 nm. 4. Add 10 ml of L-Glutamate Dehydrogenase solution to each cuvette. 5. Mix the contents of each cuvette and incubate for ~5 minutes at 18–35 °C. Then measure the absorbance of each solution at 340 nm. Calculation: Determine DA340 for the Reagent Blank, Test, and Standard. For each: DA340 = AInitial – AFinal D (DA340)Test or Standard = DA340(Test or Standard) – DA340(Blank) mg of NH3/ml of original sample Ammonia Nitrogen (AN) = (A) (TV) (MW of Ammonia) (F) (e) (d) (SV) (Conversion Factor for mg to mg) = (A) (TV) (17) (F) (6.22) (1) (SV) (1,000) = (A) (TV) (F) x 0.00273 (SV) A = D (DA340)Test or Standard TV = Total Assay Volume in ml SV = Sample Volume in ml MW of Ammonia = 17 g/mole or equivalently 17 mg/mmole F = Dilution Factor from Sample Preparation e = Millimolar Extinction Coefficient for NADPH at 340 nm [mM-1 cm –1 or equivalently (ml/mmoles)(1/cm)] d = Light path (cm) = 1 cm
35
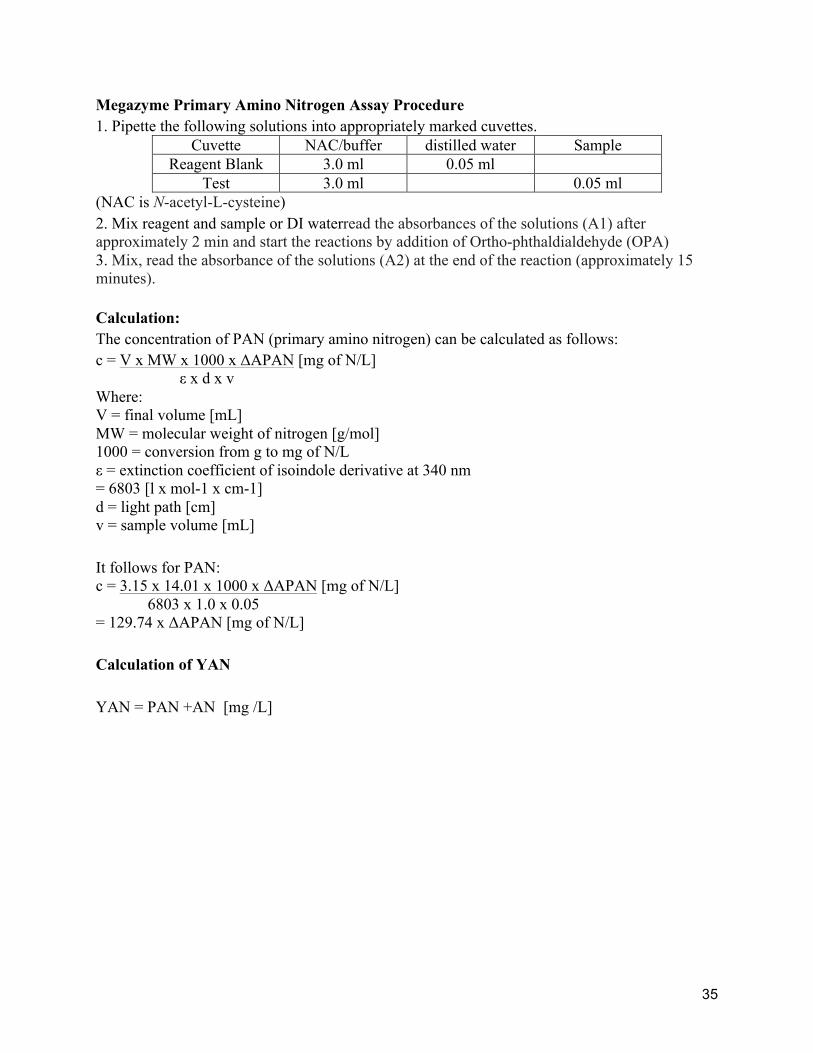
Megazyme Primary Amino Nitrogen Assay Procedure 1. Pipette the following solutions into appropriately marked cuvettes.
Cuvette NAC/buffer distilled water Sample Reagent Blank 3.0 ml 0.05 ml
Test 3.0 ml 0.05 ml (NAC is N-acetyl-L-cysteine) 2. Mix reagent and sample or DI waterread the absorbances of the solutions (A1) after approximately 2 min and start the reactions by addition of Ortho-phthaldialdehyde (OPA) 3. Mix, read the absorbance of the solutions (A2) at the end of the reaction (approximately 15 minutes). Calculation: The concentration of PAN (primary amino nitrogen) can be calculated as follows: c = V x MW x 1000 x ΔAPAN [mg of N/L] ε x d x v Where: V = final volume [mL] MW = molecular weight of nitrogen [g/mol] 1000 = conversion from g to mg of N/L ε = extinction coefficient of isoindole derivative at 340 nm = 6803 [l x mol-1 x cm-1] d = light path [cm] v = sample volume [mL] It follows for PAN: c = 3.15 x 14.01 x 1000 x ΔAPAN [mg of N/L]
6803 x 1.0 x 0.05 = 129.74 x ΔAPAN [mg of N/L] Calculation of YAN YAN = PAN +AN [mg /L]
36
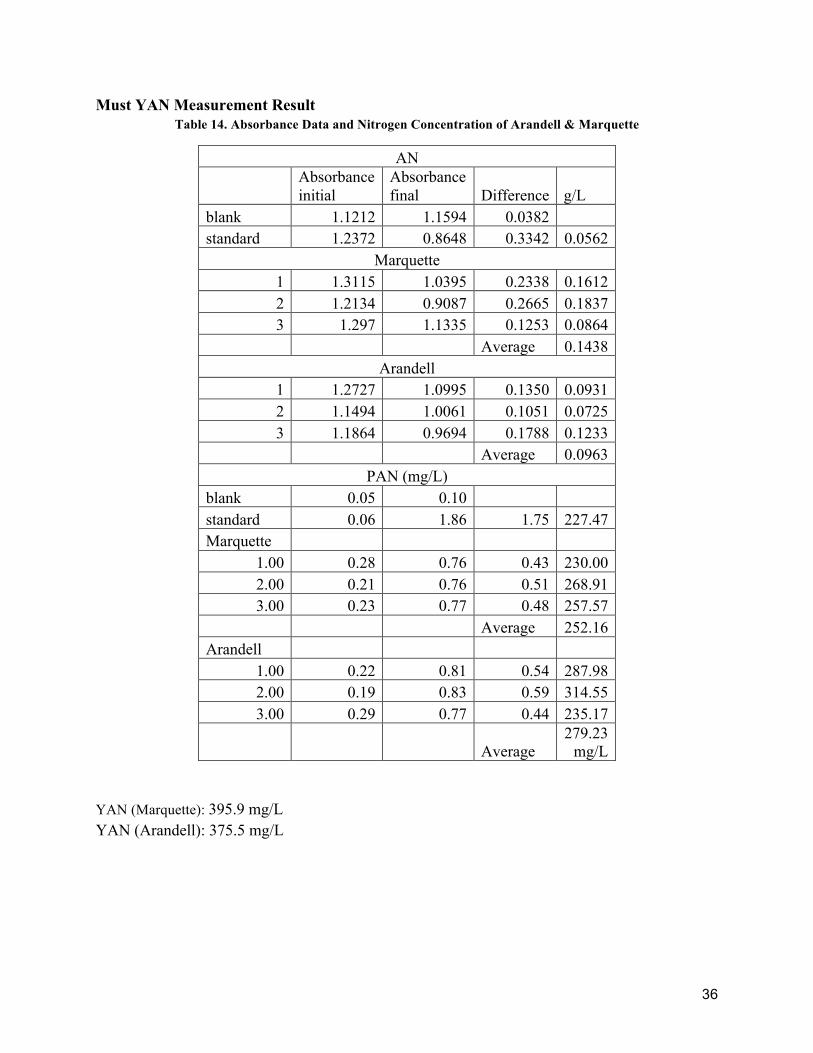
Must YAN Measurement Result Table 14. Absorbance Data and Nitrogen Concentration of Arandell & Marquette
AN
Absorbance initial
Absorbance final Difference g/L
blank 1.1212 1.1594 0.0382 standard 1.2372 0.8648 0.3342 0.0562
Marquette 1 1.3115 1.0395 0.2338 0.1612 2 1.2134 0.9087 0.2665 0.1837 3 1.297 1.1335 0.1253 0.0864
Average 0.1438 Arandell
1 1.2727 1.0995 0.1350 0.0931 2 1.1494 1.0061 0.1051 0.0725 3 1.1864 0.9694 0.1788 0.1233
Average 0.0963 PAN (mg/L)
blank 0.05 0.10 standard 0.06 1.86 1.75 227.47 Marquette
1.00 0.28 0.76 0.43 230.00 2.00 0.21 0.76 0.51 268.91 3.00 0.23 0.77 0.48 257.57
Average 252.16 Arandell
1.00 0.22 0.81 0.54 287.98 2.00 0.19 0.83 0.59 314.55 3.00 0.29 0.77 0.44 235.17
Average 279.23
mg/L YAN (Marquette): 395.9 mg/L YAN (Arandell): 375.5 mg/L
37
Appendix D: Wine Smelling Test Survey Form
FLavour Smell Less More
Persistence of the flavor
Intensity of the flavor
Quality of the flavor
Less
Fruity (fresh fruit):
Cherry, Strawberry
Forest Fruit
Banana
Fruity (matured and dry fruits)
Vegetal/ flowerish:
Red Flowers
moss, mushrooms
green pep, tomato leaf...
Sweetish, honey
Spices (vanilla, cinnamon ...)
Toasted (toasted bread,almond)
Overall Impression

38
Appendix E: GC-MS result
Table 15. Aroma Substance in GC-MS result of Marquette
M30A M30B M32A M32B M34A M34B M36A M36B M38A Acetic acid 0.391% 0.502% 0.405% 0.264% 0.424% 0.412% 0.513% 1-pentanol 0.037% 0.054% 0.139% 0.067% 0.055%
2,3-butanediol 0.798% 0.757% 0.578% 0.242% 0.711% 0.774% 1.146% 1.200% maleic anhydride 0.047% 0.067% 0.026%
3-methylbutyl acetate 0.023% 0.040%
2-Heptene-ol 0.078%
2-hydroxy-2-cyclopenten-1-one 0.088% 0.284% Formic acid 0.023% 0.066%
Hexanoic Acid 0.089% 0.094% 0.098% 0.187% Glycerin 1.159% 6.560% 6.442% 6.426% 7.501% cyclohexyl acetate 0.055% Phenylethyl Alcohol 0.070% 0.091% 0.103% 0.180% 0.096% 0.114% 0.131% 0.095% 0.143%
3,5-dihydroxy-6-methyl-2,3-dihydropyran-4-one 0.035% 0.033% 0.023% 0.019% 0.019% 0.093% Malic acid 0.219% 0.022%
ethyl palmitate 0.056% 0.041% 0.033% 0.038% 0.030% 0.020% 0.020%
2,6-dimethoxyphenol
0.018%
ethyl decanoate 0.009% 4-methyl-1,3-thiazole 0.123%

39
Table 16. Aroma Substance in GC-MS result of Arandell wine samples (375.5 mg/L)
30A 30B 32A 32B 34A 34B Methylene Chloride 2.47% 2.79% 4.28% 4.94% 5.73% 0.72%
Ethyl Acetate 2.48% 1.91% 2.57% 2.69% 2.53% 2.91% Cyclohexene 0.19% 0.20% 0.99%
1,3-Dioxolane, 2,4,5-trimethyl-
1-Butanol, 3-methyl- 8.55% 1.29% 9.31% 9.47% 8.85% 13.95%
Maleic anhydride 0.68% 0.72% 0.26% 0.22% Cyclohexanol 22.28% 21.76% 24.44% 24.76% 23.21% 35.81%
Cyclohexanone 0.54% 0.36% 0.42% 0.38% 0.33% 0.99% Butyrolactone 0.09% 0.07%
1,2-Cyclopentanedione 0.22% 0.29% 0.37% 0.39% 0.44% 0.34%
(R)-(-)-2,2-Dimethyl-1,3-dioxolane-4-
methanol 0.09% 0.09%
1,3-Dioxolane-4-methanol, 2,2-dimethyl-, (S)-
0.08% 0.10% 0.12% 0.22%
N-Methoxy-N-methylacetamide 0.53%
Hexanoic acid 0.07% 4H-Pyran-4-one, 2,3-dihydro-3,5-
dihydroxy-6-methyl-
0.59% 0.88% 0.22% 0.23% 0.18% 0.16%
Phenylethyl Alcohol 0.28%
1,2-Benzenediol 0.51% 0.29% 0.06% 0.26% 0.13% 0.09% Benzothiazole 0.15% Fumaric Acid 1.02%
Malic Acid 2.35% 1.13% 0.89% dl-Malic disodium
salt 1.24%
40
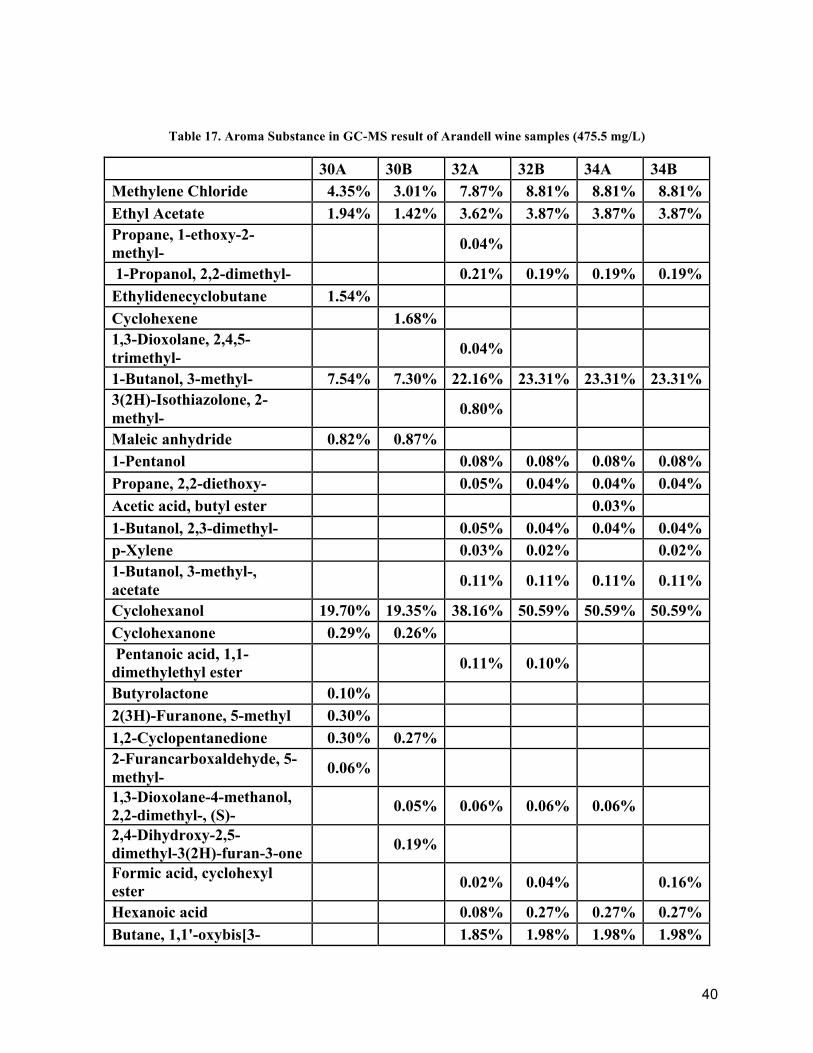
Table 17. Aroma Substance in GC-MS result of Arandell wine samples (475.5 mg/L)
30A 30B 32A 32B 34A 34B Methylene Chloride 4.35% 3.01% 7.87% 8.81% 8.81% 8.81% Ethyl Acetate 1.94% 1.42% 3.62% 3.87% 3.87% 3.87% Propane, 1-ethoxy-2-methyl- 0.04%
1-Propanol, 2,2-dimethyl- 0.21% 0.19% 0.19% 0.19% Ethylidenecyclobutane 1.54% Cyclohexene 1.68% 1,3-Dioxolane, 2,4,5-trimethyl- 0.04%
1-Butanol, 3-methyl- 7.54% 7.30% 22.16% 23.31% 23.31% 23.31% 3(2H)-Isothiazolone, 2-methyl- 0.80%
Maleic anhydride 0.82% 0.87% 1-Pentanol 0.08% 0.08% 0.08% 0.08% Propane, 2,2-diethoxy- 0.05% 0.04% 0.04% 0.04% Acetic acid, butyl ester 0.03% 1-Butanol, 2,3-dimethyl- 0.05% 0.04% 0.04% 0.04% p-Xylene 0.03% 0.02% 0.02% 1-Butanol, 3-methyl-, acetate 0.11% 0.11% 0.11% 0.11%
Cyclohexanol 19.70% 19.35% 38.16% 50.59% 50.59% 50.59% Cyclohexanone 0.29% 0.26% Pentanoic acid, 1,1-dimethylethyl ester 0.11% 0.10%
Butyrolactone 0.10% 2(3H)-Furanone, 5-methyl 0.30% 1,2-Cyclopentanedione 0.30% 0.27% 2-Furancarboxaldehyde, 5-methyl- 0.06%
1,3-Dioxolane-4-methanol, 2,2-dimethyl-, (S)- 0.05% 0.06% 0.06% 0.06%
2,4-Dihydroxy-2,5-dimethyl-3(2H)-furan-3-one 0.19%
Formic acid, cyclohexyl ester 0.02% 0.04% 0.16%
Hexanoic acid 0.08% 0.27% 0.27% 0.27% Butane, 1,1'-oxybis[3- 1.85% 1.98% 1.98% 1.98%
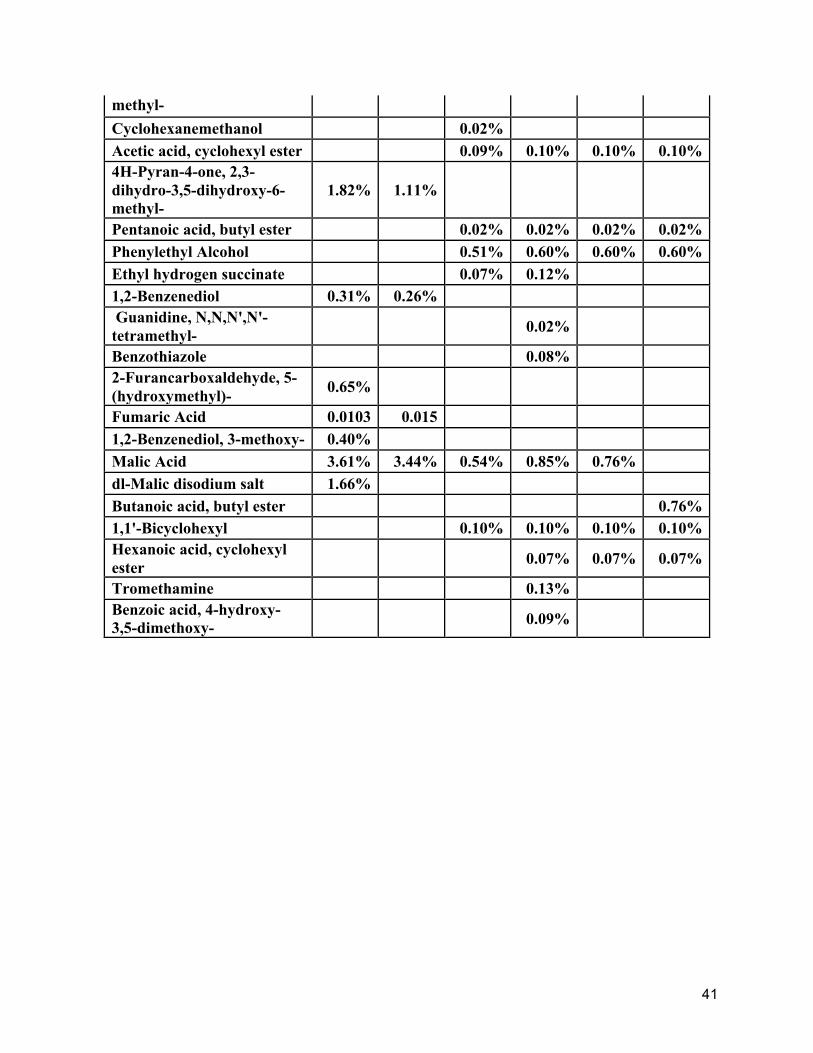
41
methyl- Cyclohexanemethanol 0.02% Acetic acid, cyclohexyl ester 0.09% 0.10% 0.10% 0.10% 4H-Pyran-4-one, 2,3-dihydro-3,5-dihydroxy-6-methyl-
1.82% 1.11%
Pentanoic acid, butyl ester 0.02% 0.02% 0.02% 0.02% Phenylethyl Alcohol 0.51% 0.60% 0.60% 0.60% Ethyl hydrogen succinate 0.07% 0.12% 1,2-Benzenediol 0.31% 0.26% Guanidine, N,N,N',N'-tetramethyl- 0.02%
Benzothiazole 0.08% 2-Furancarboxaldehyde, 5-(hydroxymethyl)- 0.65%
Fumaric Acid 0.0103 0.015 1,2-Benzenediol, 3-methoxy- 0.40% Malic Acid 3.61% 3.44% 0.54% 0.85% 0.76% dl-Malic disodium salt 1.66% Butanoic acid, butyl ester 0.76% 1,1'-Bicyclohexyl 0.10% 0.10% 0.10% 0.10% Hexanoic acid, cyclohexyl ester 0.07% 0.07% 0.07%
Tromethamine 0.13% Benzoic acid, 4-hydroxy-3,5-dimethoxy- 0.09%
42
Table 18. Aroma Substance in GC-MS result of Arandell wine samples (575.5 mg/L)
30A 30B 32A 32B 34A 34B Methylene Chloride 6.00% 5.44% 6.39% 6.50% 6.12% 5.88% Ethyl Acetate 1.55% 1.70% 1.90% 2.24% 2.04% 1.88% Cyclohexene 0.09% 1-Butanol, 3-methyl- 6.08% 6.62% 7.35% 8.01% 7.65% Cyclotrisiloxane, hexamethyl- 0.60% 0.52% Pyrazole, 1,4-dimethyl- 0.12% 0.16% Maleic anhydride 1.06% 1.08% 0.57% 0.47% 0.57% 0.86%
Cyclohexanol 16.07%
17.67%
19.64%
21.42%
20.37%
19.12%
3-Heptene, (E)- 0.22% Cyclohexanone 0.26% 0.28% 0.25% 1,2-Cyclopentanedione 0.10% 0.20% 0.21% 2-Furancarboxaldehyde, 5-methyl- 0.11% 0.11% 2-Cyclopenten-1-one, 2-hydroxy- 0.18% 0.21% (R)-(-)-2,2-Dimethyl-1,3-dioxolane-4-methanol 0.14% 0.22%
1,3-Dioxolane-4-methanol, 2,2-dimethyl-, (S)- 0.08% 0.26%
2,4-Dihydroxy-2,5-dimethyl-3(2H)-furan-3-one 0.16%
Cyclotetrasiloxane, octamethyl- 0.28% 4H-Pyran-4-one, 2,3-dihydro-3,5-dihydroxy-6-methyl- 0.93% 1.16% 0.32% 0.26% 0.51% 0.27%
Fumaric Acid 1.00% 0.42% 1.29% 2.17% 1,2-Benzenediol, 3-methoxy- Malic Acid 4.06% 2.29% 1.68% 2.05% 2.16% dl-Malic disodium salt Butanoic acid, butyl ester 5.79% Hexanoic acid, cyclohexyl ester
43
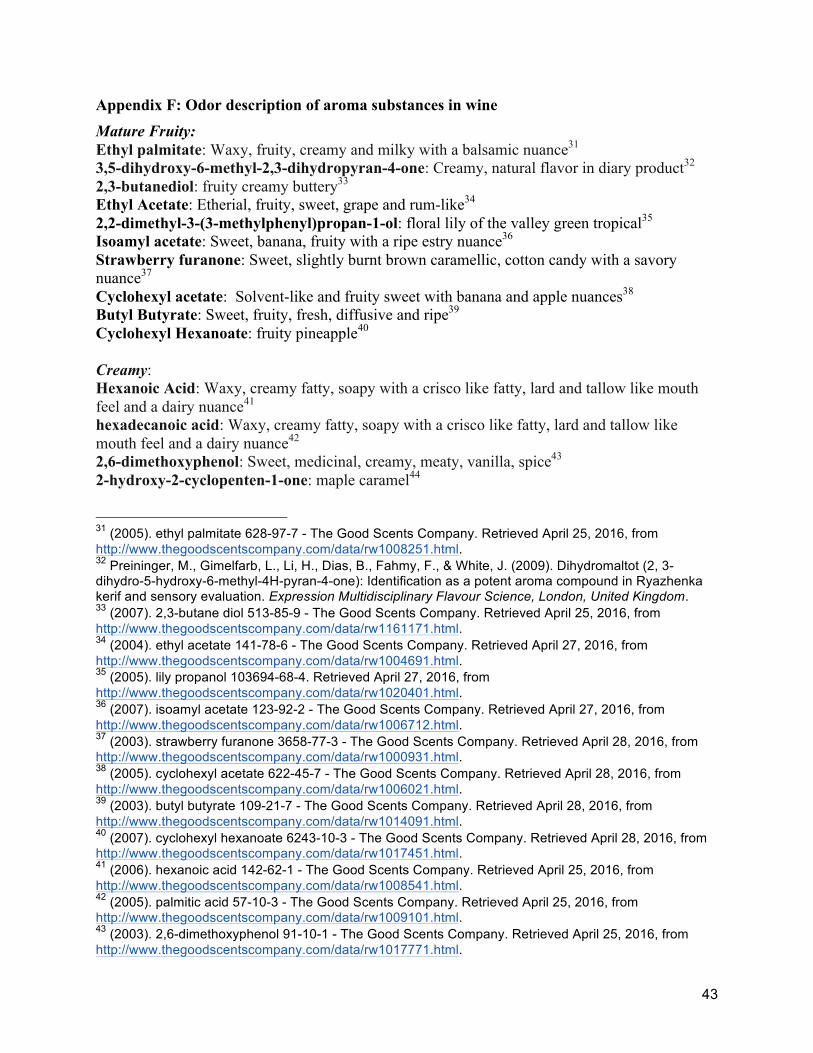
Appendix F: Odor description of aroma substances in wine Mature Fruity: Ethyl palmitate: Waxy, fruity, creamy and milky with a balsamic nuance31 3,5-dihydroxy-6-methyl-2,3-dihydropyran-4-one: Creamy, natural flavor in diary product32 2,3-butanediol: fruity creamy buttery33 Ethyl Acetate: Etherial, fruity, sweet, grape and rum-like34 2,2-dimethyl-3-(3-methylphenyl)propan-1-ol: floral lily of the valley green tropical35 Isoamyl acetate: Sweet, banana, fruity with a ripe estry nuance36 Strawberry furanone: Sweet, slightly burnt brown caramellic, cotton candy with a savory nuance37 Cyclohexyl acetate: Solvent-like and fruity sweet with banana and apple nuances38 Butyl Butyrate: Sweet, fruity, fresh, diffusive and ripe39 Cyclohexyl Hexanoate: fruity pineapple40 Creamy: Hexanoic Acid: Waxy, creamy fatty, soapy with a crisco like fatty, lard and tallow like mouth feel and a dairy nuance41 hexadecanoic acid: Waxy, creamy fatty, soapy with a crisco like fatty, lard and tallow like mouth feel and a dairy nuance42 2,6-dimethoxyphenol: Sweet, medicinal, creamy, meaty, vanilla, spice43 2-hydroxy-2-cyclopenten-1-one: maple caramel44
31 (2005). ethyl palmitate 628-97-7 - The Good Scents Company. Retrieved April 25, 2016, from http://www.thegoodscentscompany.com/data/rw1008251.html. 32 Preininger, M., Gimelfarb, L., Li, H., Dias, B., Fahmy, F., & White, J. (2009). Dihydromaltot (2, 3-dihydro-5-hydroxy-6-methyl-4H-pyran-4-one): Identification as a potent aroma compound in Ryazhenka kerif and sensory evaluation. Expression Multidisciplinary Flavour Science, London, United Kingdom. 33 (2007). 2,3-butane diol 513-85-9 - The Good Scents Company. Retrieved April 25, 2016, from http://www.thegoodscentscompany.com/data/rw1161171.html. 34 (2004). ethyl acetate 141-78-6 - The Good Scents Company. Retrieved April 27, 2016, from http://www.thegoodscentscompany.com/data/rw1004691.html. 35 (2005). lily propanol 103694-68-4. Retrieved April 27, 2016, from http://www.thegoodscentscompany.com/data/rw1020401.html. 36 (2007). isoamyl acetate 123-92-2 - The Good Scents Company. Retrieved April 27, 2016, from http://www.thegoodscentscompany.com/data/rw1006712.html. 37 (2003). strawberry furanone 3658-77-3 - The Good Scents Company. Retrieved April 28, 2016, from http://www.thegoodscentscompany.com/data/rw1000931.html. 38 (2005). cyclohexyl acetate 622-45-7 - The Good Scents Company. Retrieved April 28, 2016, from http://www.thegoodscentscompany.com/data/rw1006021.html. 39 (2003). butyl butyrate 109-21-7 - The Good Scents Company. Retrieved April 28, 2016, from http://www.thegoodscentscompany.com/data/rw1014091.html. 40 (2007). cyclohexyl hexanoate 6243-10-3 - The Good Scents Company. Retrieved April 28, 2016, from http://www.thegoodscentscompany.com/data/rw1017451.html. 41 (2006). hexanoic acid 142-62-1 - The Good Scents Company. Retrieved April 25, 2016, from http://www.thegoodscentscompany.com/data/rw1008541.html. 42 (2005). palmitic acid 57-10-3 - The Good Scents Company. Retrieved April 25, 2016, from http://www.thegoodscentscompany.com/data/rw1009101.html. 43 (2003). 2,6-dimethoxyphenol 91-10-1 - The Good Scents Company. Retrieved April 25, 2016, from http://www.thegoodscentscompany.com/data/rw1017771.html.
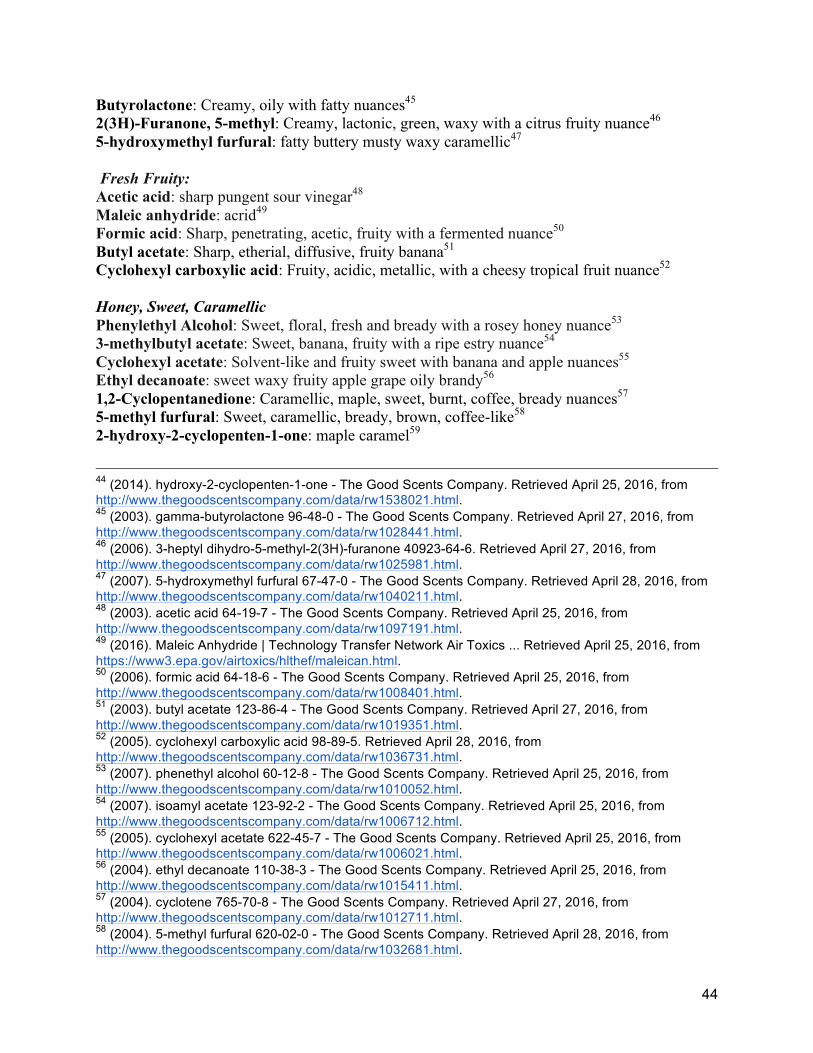
44
Butyrolactone: Creamy, oily with fatty nuances45 2(3H)-Furanone, 5-methyl: Creamy, lactonic, green, waxy with a citrus fruity nuance46 5-hydroxymethyl furfural: fatty buttery musty waxy caramellic47 Fresh Fruity: Acetic acid: sharp pungent sour vinegar48 Maleic anhydride: acrid49 Formic acid: Sharp, penetrating, acetic, fruity with a fermented nuance50 Butyl acetate: Sharp, etherial, diffusive, fruity banana51 Cyclohexyl carboxylic acid: Fruity, acidic, metallic, with a cheesy tropical fruit nuance52 Honey, Sweet, Caramellic Phenylethyl Alcohol: Sweet, floral, fresh and bready with a rosey honey nuance53 3-methylbutyl acetate: Sweet, banana, fruity with a ripe estry nuance54 Cyclohexyl acetate: Solvent-like and fruity sweet with banana and apple nuances55 Ethyl decanoate: sweet waxy fruity apple grape oily brandy56 1,2-Cyclopentanedione: Caramellic, maple, sweet, burnt, coffee, bready nuances57 5-methyl furfural: Sweet, caramellic, bready, brown, coffee-like58 2-hydroxy-2-cyclopenten-1-one: maple caramel59
44 (2014). hydroxy-2-cyclopenten-1-one - The Good Scents Company. Retrieved April 25, 2016, from http://www.thegoodscentscompany.com/data/rw1538021.html. 45 (2003). gamma-butyrolactone 96-48-0 - The Good Scents Company. Retrieved April 27, 2016, from http://www.thegoodscentscompany.com/data/rw1028441.html. 46 (2006). 3-heptyl dihydro-5-methyl-2(3H)-furanone 40923-64-6. Retrieved April 27, 2016, from http://www.thegoodscentscompany.com/data/rw1025981.html. 47 (2007). 5-hydroxymethyl furfural 67-47-0 - The Good Scents Company. Retrieved April 28, 2016, from http://www.thegoodscentscompany.com/data/rw1040211.html. 48 (2003). acetic acid 64-19-7 - The Good Scents Company. Retrieved April 25, 2016, from http://www.thegoodscentscompany.com/data/rw1097191.html. 49 (2016). Maleic Anhydride | Technology Transfer Network Air Toxics ... Retrieved April 25, 2016, from https://www3.epa.gov/airtoxics/hlthef/maleican.html. 50 (2006). formic acid 64-18-6 - The Good Scents Company. Retrieved April 25, 2016, from http://www.thegoodscentscompany.com/data/rw1008401.html. 51 (2003). butyl acetate 123-86-4 - The Good Scents Company. Retrieved April 27, 2016, from http://www.thegoodscentscompany.com/data/rw1019351.html. 52 (2005). cyclohexyl carboxylic acid 98-89-5. Retrieved April 28, 2016, from http://www.thegoodscentscompany.com/data/rw1036731.html. 53 (2007). phenethyl alcohol 60-12-8 - The Good Scents Company. Retrieved April 25, 2016, from http://www.thegoodscentscompany.com/data/rw1010052.html. 54 (2007). isoamyl acetate 123-92-2 - The Good Scents Company. Retrieved April 25, 2016, from http://www.thegoodscentscompany.com/data/rw1006712.html. 55 (2005). cyclohexyl acetate 622-45-7 - The Good Scents Company. Retrieved April 25, 2016, from http://www.thegoodscentscompany.com/data/rw1006021.html. 56 (2004). ethyl decanoate 110-38-3 - The Good Scents Company. Retrieved April 25, 2016, from http://www.thegoodscentscompany.com/data/rw1015411.html. 57 (2004). cyclotene 765-70-8 - The Good Scents Company. Retrieved April 27, 2016, from http://www.thegoodscentscompany.com/data/rw1012711.html. 58 (2004). 5-methyl furfural 620-02-0 - The Good Scents Company. Retrieved April 28, 2016, from http://www.thegoodscentscompany.com/data/rw1032681.html.

45
Peppery: 2-Heptene-ol: pungent fatty60 1-pentanol: Pungent, fermented, bready, yeasty, fusel, winey and solvent-like61 Tert-Butyl ethyl ether: reminiscent of ether, gasoline, or varnish or as being sweet62 1-Pentanol: smells like paint thinner63 Cyclohexanone: peppermint or acetone-like64 Cyclohexyl Carbinol: pungent65 Valeric Acid: Acidic and sharp, cheese-like, sour milky, tobacco, with fruity nuance66 Catechol: faint, phenolic odor67 Unpleasant Odor: Benzothiazole: Sulfureous, rubbery, vegetative, cooked, brown, nutty, coffee-like and meaty68
59 (2014). 2-hydroxy-2-cyclopenten-1-one 10493-98-8. Retrieved April 28, 2016, from http://www.thegoodscentscompany.com/data/rw1538021.html. 60 (2006). (E)-2-hepten-1-ol 33467-76-4 - The Good Scents Company. Retrieved April 25, 2016, from http://www.thegoodscentscompany.com/data/rw1025711.html. 61 (2005). amyl alcohol 71-41-0 - The Good Scents Company. Retrieved April 25, 2016, from http://www.thegoodscentscompany.com/data/rw1003191.html. 62 (2016). tert-Butyl ethyl ether | C6H14O - PubChem. Retrieved April 27, 2016, from https://pubchem.ncbi.nlm.nih.gov/compound/tert-Butyl_ethyl_ether. 63 (2015). smellslabforchem - smells lab - Wikispaces. Retrieved April 27, 2016, from https://smellslabforchem.wikispaces.com/smells+lab. 64 (2011). Cyclohexanone - Wikipedia, the free encyclopedia. Retrieved April 27, 2016, from https://en.wikipedia.org/wiki/Cyclohexanone. 65 (2005). cyclohexyl carbinol - Chemicalland21.com. Retrieved April 28, 2016, from http://chemicalland21.com/specialtychem/NH/CYCLOHEXYL%20CARBINOL.htm. 66 (2005). valeric acid 109-52-4 - The Good Scents Company. Retrieved April 28, 2016, from http://www.thegoodscentscompany.com/data/rw1009341.html. 67 (2011). Catechol - Wikipedia, the free encyclopedia. Retrieved April 28, 2016, from https://en.wikipedia.org/wiki/Catechol. 68 (2005). benzothiazole 95-16-9 - The Good Scents Company. Retrieved April 28, 2016, from http://www.thegoodscentscompany.com/data/rw1007521.html.

46
Appendix G: IR Spectrum
Figure 10. IR Spectrum of Arandell and Marquette Juice

47
Figure 11. IR Spectrums of Arandell Must with a pH value of 3.4 and YAN of 457.5 mg/L
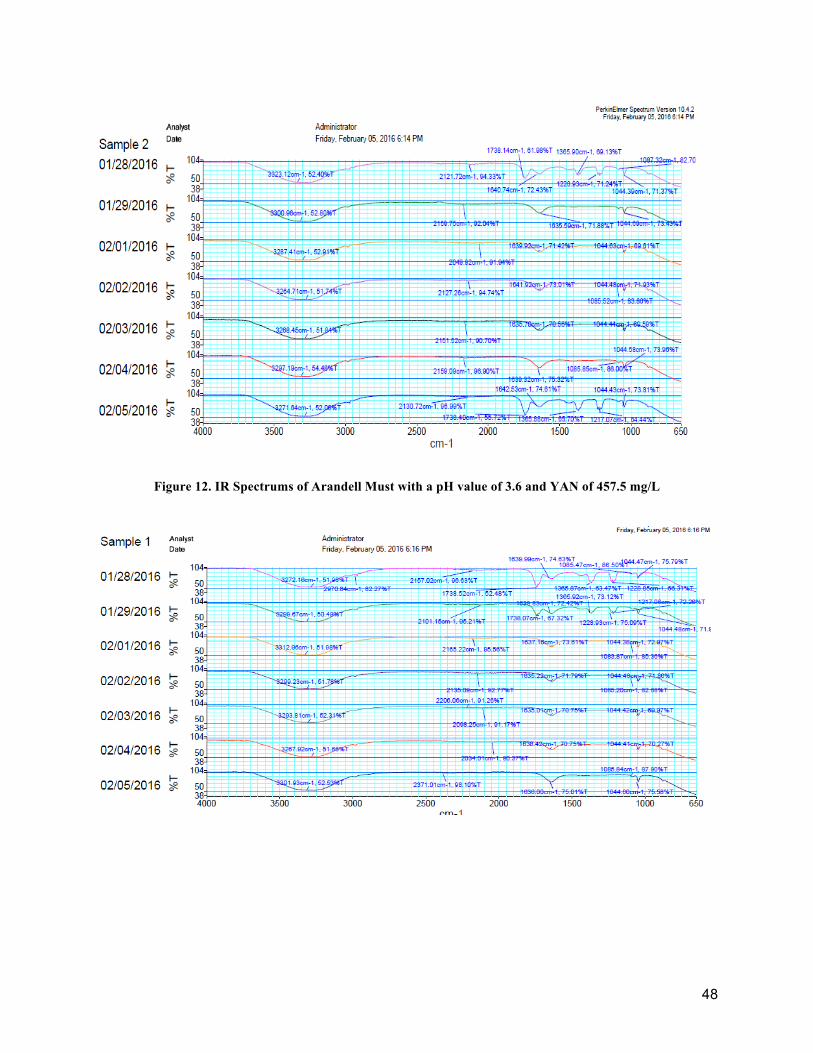
48
Figure 12. IR Spectrums of Arandell Must with a pH value of 3.6 and YAN of 457.5 mg/L
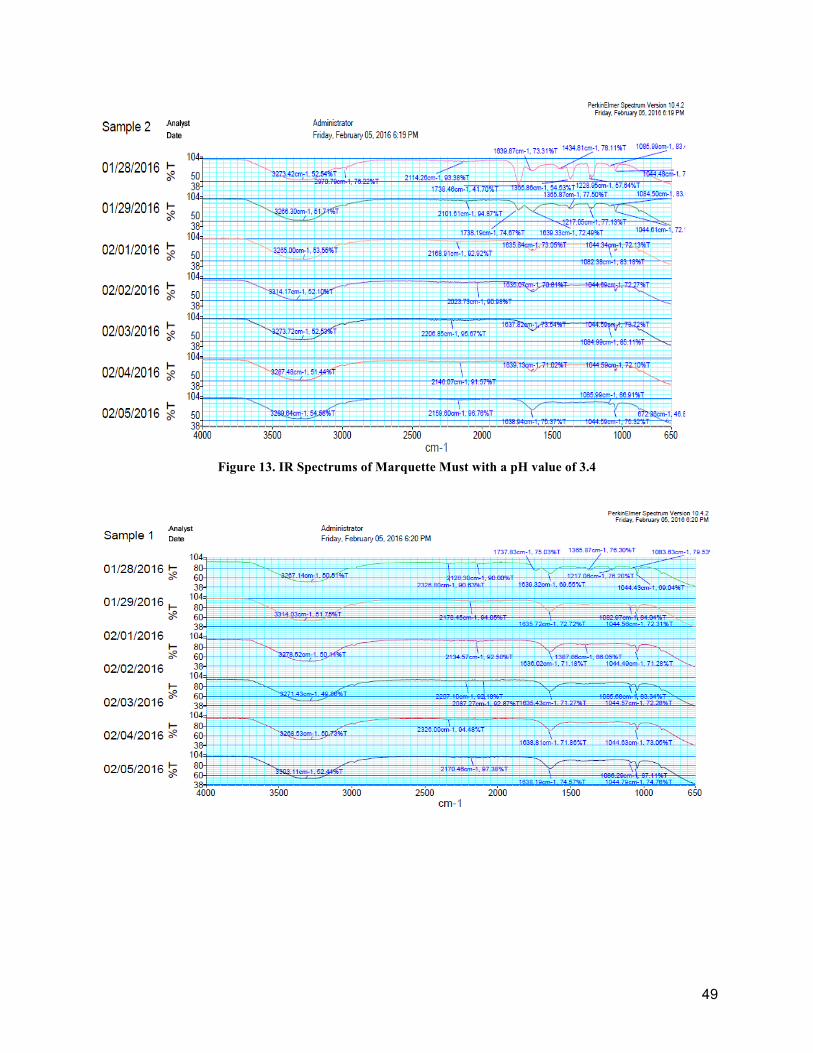
49
Figure 13. IR Spectrums of Marquette Must with a pH value of 3.4

50
Figure 14. IR Spectrums of Marquette Must with a pH value of 3.6