Embed Size (px)
Citation preview

Journal of Advanced Concrete Technology Vol. 6, No. 2, 273-286, June 2008 / Copyright © 2008 Japan Concrete Institute 273
Scientific paper
Characterizing the 3D Pore Structure of Hardened Cement Paste with Synchrotron Microtomography Michael Angelo B. Promentilla1, Takafumi Sugiyama2, Takashi Hitomi3 and Nobufumi Takeda4
Received 18 March 2008, accepted 21 May 2008
Abstract Aside from porosity, the degree of pore connectivity and tortuosity are important pore structure characteristics of ce-ment-based materials to understand better the effect of microstructure on transport processes that influence the durability of these materials. Synchrotron X-ray computed microtomography is employed to provide information about the three-dimensional (3D) pore structure at submicron resolution (0.5 µm/voxel) using the SPring-8 facility in Hyogo, Japan. This paper presents a method to characterize the pore space of hardened cement pastes taken from different specimens of various ages (2, 7, and 28 days) of curing. By defining the pore threshold value on the basis of the transition point in the porosity-threshold dependency curve, the pores were distinguished from the solid matrix in the microtomographic images. Further, pore cluster multiple labeling was performed to gain information on the pore connectivity and the associated effective porosity. 3D random walk simulation in the largest percolating pore cluster was then conducted to evaluate the diffusion tortuosity. The results from this study provide indications of increasing diffusion tortuosity as pores that can be resolved by the X-ray imaging system decreased and became more disconnected. Sensitivity analysis to pore threshold value was performed to evaluate the robustness of the method.
1. Introduction
The pore structure characteristics of cement-based ma-terials play a fundamental role in governing transport processes that influence the durability-based perform-ance of these materials (Sugiyama et al., 2003; 2008). For example, the pore connectivity and the tortuosity of pore space are important variables to understand and model the diffusion whereby aggressive species (e.g., chlorides, sulfates, etc.) from the environment penetrate concrete structures. In this study, we investigate the pore structure characteristics of hardened cement paste with particular focus on evaluating the pore connectivity and the diffusion tortuosity in three-dimensional (3D) pore space.
A variety of experimental techniques such as mercury intrusion porosimetry, scanning electron microscopy, optical microscopy, and gas adsorption have been used to
characterize the pore structure of cement-based materials. Recently, thermoporometry or low-temperature calo-rimetry has also been used to examine the pore structure indirectly without any drying or special specimen prepa-ration (e.g., see Bentz, 2006). However, most of these techniques assume the pore geometry in the interpreta-tion of results, and are either invasive or limited to two-dimensional (2D) information. One way to over-come these limitations is to use X-ray computed micro-tomography to examine directly the three-dimensional internal microstructure of the material in a non-invasive manner without requiring any specimen preparation typical of the other mentioned experimental techniques.
Microtomography with synchrotron radiation as the X-ray source has already been applied by various re-searchers (e.g., see Bentz et al., 2000; Bentz et al., 2002; Burlion et al., 2006; Gallucci et al., 2007; Helfen et al., 2005; Hitomi et al., 2004; Koster et al., 2006; Lu et al., 2006) in cement and concrete research. Synchrotron microtomography at the ESRF (European Synchrotron Radiation Facility) in Grenoble, France has been used by Bentz et al. (2002) and Helfen et al. (2005) to observe directly the three-dimensional percolation of capillary pore structure in hydrating cement pastes at a resolution of about 1 micrometer. Using the microtomographic images that are made available online (Bentz et al., 2002) from the NIST’s “Visible Cement Data Set,” Koster et al. (2006) simulated the water permeability and water vapor diffusion through hardened cement pastes by converting first the extracted pore space into a transportation net-work of cylindrical tubes. More recently, at the SLS (Swiss Light Source) in Villigen, Switzerland, Gallucci et al., (2007) observed the 3D pore structure evolution of cement pastes at a resolution of about 0.7 micrometers.
1Postdoctoral Fellow, Environmental Material Engineer-ing Laboratory, Division of Built Environment, Graduate School of Engineering, Hokkaido University, Japan. E-mail:[email protected]; [email protected] 2Professor, Environmental Material Engineering Labo-ratory, Division of Built Environment, Graduate School of Engineering, Hokkaido University, Japan. 3Research Engineer, Civil Engineering Materials De-partment, Technical Research Institute, Obayashi Corp.,Japan. 4 Senior Research Engineer, Civil Engineering Materials Department, Technical Research Institute, Obayashi Corp., Japan.

274 M. A. B. Promentilla, T. Sugiyama, T. Hitomi and N. Takeda / Journal of Advanced Concrete Technology Vol. 6, No. 2, 273-286, 2008
In this paper, we present the results of the micro-structure investigation carried out on different hardened cement pastes of various ages (2, 7, and 28 days) using synchrotron microtomography at SPring-8 in Hyogo, Japan, at a higher resolution of 0.5 µm per voxel. Three-dimensional random walk simulation is performed to evaluate the diffusion tortuosity through the complex pore space of hardened cement paste. To our knowledge, this study is the first attempt to quantify tortuosity from the extracted pore space in high resolution microtomo-graphic images of cement pastes. The advantage of using random walk simulation is that we could directly meas-ure tortuosity, a pore structure parameter that has a direct bearing on transport properties, without resorting to any assumption of the pore geometry. Furthermore, another significant feature of this study is the description of the linear attenuation coefficients of the different phases of interest in cement pastes. From this information, the relative brightness of the different phases is inferred and a pore threshold value is introduced to distinguish the pores from the solid matrix during segmentation. The sensitivity of the pore structure parameters to the pore threshold value, and the correlation between the effective porosity and tortuosity are also investigated.
2. Methods
2.1 Sample preparation and X-ray imaging of specimen The cement pastes analyzed in this study were prepared using an ordinary Portland cement (OPC) that is desig-nated as JIS R5210. By mass, the cement contains 67.80% of CaO, 21.30% of SiO2, 3.80% of Al2O3, 2.41% of Fe2O3, and 2.20% of SO3. The fineness of OPC in terms of Blaine specific surface area is 3200 cm2/g. The pastes were prepared at an initial water to cement ratio of 0.50 (mass basis). A cellulose-based viscosity admixture was also added in the mixture to prevent segregation. After mixing the cement paste, it was sealed for one day followed by curing in water until the predetermined ages, namely 2, 7 and 28 days, respectively. Accordingly, these hardened cement pastes of different ages of curing were
referred to as OPC50-2d, OPC50-7d, and OPC50-28d, respectively. Note that in this way, the microstructure evolution was evaluated according to the age of the hardened cement pastes prepared from the single batch mix.
These samples were crushed and the crushed pieces were treated with acetone to suspend the hydration, fol-lowed by drying under vacuum. Then, these prepared samples were stored in a sealed container prior to the X-ray CT experimentation. It was assumed that the mi-crostructure of the specimens is not altered significantly during the sample preparation as this is commonly prac-ticed by many researchers (Japan Cement Association, 2008). For exposure to the beam line, shards of about 1 mm at its greatest width and 1 mm in length were pre-pared to examine the internal pore structure with syn-chrotron X-ray computed microtomography.
Synchrotron X-ray computed microtomography is a three-dimensional imaging technique that is based on the 3D computed reconstruction of a sample from the 2D radiographic projections acquired at different angles around its axis of rotation. In principle, the synchrotron microtomography technique is similar to medical com-puted tomography (CT) scans or industrial micro-focus CT, but this technique achieves much higher spatial resolution by combining extremely bright, monochro-matic synchrotron radiation with high-quality optics and X-ray detection. In addition, reconstruction artifacts such as the occurrence of beam hardening, which is com-monly encountered in polychromatic CT systems, are also reduced (Ashbridge et al., 2003).
In this study, we used the X-ray CT system through the BL20XU beamline at SPring-8 (Super Photon ring-8 GeV), which is the world’s largest third generation syn-chrotron radiation facility, located at Hyogo, Japan. A schematic illustration of the X-ray imaging system at SPring-8 is shown in Fig. 1. The system consists of an X-ray light source from the beam line, double crystal monochromator, high-precision rotation stage, and high-resolution X-ray image detector (Uesugi et al., 2001). The transmitted images are detected by an X-ray imaged detector that consists of a thin scintillator, optic
CCD camera
Sample
High precisionrotation stage
Cross slit
Beam monitor(Scintillator and optic system)
Monochromator
In-vacuumundulator
X-ray source Image acquisitionand
reconstruction
CCD camera
Sample
High precisionrotation stage
Cross slit
Beam monitor(Scintillator and optic system)
Monochromator
In-vacuumundulator
X-ray source Image acquisitionand
reconstruction
CCD camera
Sample
High precisionrotation stage
Cross slit
Beam monitor(Scintillator and optic system)
Monochromator
In-vacuumundulator
X-ray source Image acquisitionand
reconstruction
CCD camera
Sample
High precisionrotation stage
Cross slit
Beam monitor(Scintillator and optic system)
Monochromator
In-vacuumundulator
X-ray source
CCD camera
Sample
High precisionrotation stage
Cross slit
Beam monitor(Scintillator and optic system)
Monochromator
In-vacuumundulator
CCD camera
Sample
High precisionrotation stage
Cross slit
Beam monitor(Scintillator and optic system)
Monochromator
In-vacuumundulator
CCD camera
Sample
High precisionrotation stage
Cross slit
Beam monitor(Scintillator and optic system)
Monochromator
In-vacuumundulator
X-ray source Image acquisitionand
reconstruction
Fig. 1 X-ray CT system at SPring-8, Japan.

M. A. B. Promentilla, T. Sugiyama, T. Hitomi and N. Takeda / Journal of Advanced Concrete Technology Vol. 6, No. 2, 273-286, 2008 275
system and CCD camera. In this experiment, the effec-tive pixel size in the transmitted image was 0.50 µm by 0.50 µm. Moreover, the beam energy was set to a value of 15 keV. For each specimen, 1500 X-ray projection images with an angle step of 0.12 degrees and an expo-sure time of 0.30 s each were obtained.
Tomographic reconstruction was done using a com-puter program in use at SPring-8, which employs the convolution back projection algorithm to generate the “slice” images. The slices refer to the individual micro-tomographic images, similar to a slice from a loaf of bread or a petrographic thin section, since the slices correspond to what would be observed if the slices were observed from the object in the scanned plane. Stacked up, these slices provide the reconstructed volumetric data of the scanned object. In this study, the reconstructed 3D-image data set was composed of 1300 contiguous grayscale images where each slice image contained 2000 x 2000 voxels (volume element or 3D pixel). The di-mension of a voxel is a 0.5 x 0.5 micrometer-sized pixel with a thickness of 0.5 µm. In other words, the effective size of the cubic voxel is 0.50 µm in the CT image. The voxel intensities or grayscale values (GSV) in slices correspond to the CT values, which are proportional to the measured linear attenuation coefficient (LAC) of X-rays obtained from the CT reconstruction (see Fig. 2). It should be noted that the LAC defined in Beer-Lambert’s law is strongly correlated with density, and is also a function of the mean atomic number and
X-ray energy. In general, the darker voxels in the recon-structed grayscale image correspond to low density phases (e.g., air voids or pores), whereas the brighter voxels denote the high density phases (e.g., anhydrous cement). Table 1 provides a list of some of the phases of interest for hardened cement pastes in descending order of their predicted LAC at the X-ray energy level of 15 keV. These predicted values were obtained using the following equation:
Pixel (2D)
Voxel (3D)
One slice
Slicethickness
x
y
z
Pixel (2D)
Voxel (3D)
One slice
Slicethickness
x
y
zx
y
z
Fig. 2 Illustration of pixel, voxel and slice. Each voxel is associated with an attenuation coefficient as shown by the grayscale intensity.
Table 1 Composition, notation, density, mean atomic number and linear attenuation coefficient of different phases ranked according to relative CT image brightness.
Phase Chemical formula NotationDensity
ρ (g/cc)
Mean atomic
number Z
Mass attenuation coefficient (cm2/g)
at 15 keV, (μ/ρ)
LAC μ(cm-1)
Ferrite (CaO)4(Al2O3)(Fe2O3) C4AF 3.73 a 16.65 24.44 91.16Free lime CaO C 3.32 b 16.58 21.82 72.45
Alite (CaO)3(SiO2) C3S 3.21 a 15.06 17.60 56.51Belite (CaO)2(SiO2) C2S 3.28 a 14.56 16.23 53.24
Aluminate (CaO)3(Al2O3) C3A 3.03 a 14.34 15.50 46.97Anhydrite CaSO4 CS 2.98 b 13.42 13.29 39.60Portlandite Ca(OH)2 CH 2.24 a 14.30 16.92 37.91
Calcium silicate hydrate (CaO)1.7(SiO2) 1.8H2O c C-S-H 2.60 c 13.11 13.22 34.37
Gypsum CaSO4 2H2O CS H2 2.32 a 12.12 10.86 25.19Calcium silicate
hydrate (CaO)1.7(SiO2) 4H2O a C-S-H 2.12 a 12.09 11.21 23.76
Monosulfate (CaO)3(Al2O3)(CaSO4) 12H2O C4 AS H12 1.99 a 11.66 10.22 20.33Periclase MgO M 3.58 b 10.41 4.56 16.34Quartz SiO2 S 2.65 d 10.80 5.79 15.36
Ettringite (CaO)3(Al2O3)(CaSO4)3 32H2O C6AS 3H32 1.70 a 10.77 8.43 14.33Water H2O H 1.00 7.22 1.68 1.68
Air - - 0.001 7.37 1.61 0.002Sources: a) Bentz et al. (1994); b) Stutzman (2004); c) Allen et al. (2007); d) Justnes et al. (2005)

276 M. A. B. Promentilla, T. Sugiyama, T. Hitomi and N. Takeda / Journal of Advanced Concrete Technology Vol. 6, No. 2, 273-286, 2008
( ) ( )i
imixture i
E Ew=⎡ ⎤⎛ ⎞ ⎛ ⎞
⎜ ⎟ ⎜ ⎟⎢ ⎥⎝ ⎠ ⎝ ⎠⎣ ⎦∑
μ μ
ρ ρ (1)
where wi is the fraction by weight of the ith atomic (or ele-mental) constituent;
( )i
E⎛ ⎞⎜ ⎟⎝ ⎠
μ
ρis the mass attenuation coefficient at a given
X-ray energy (E) obtained from the NIST database (Hubbell and Seltzer, 2004).
2.2 3D image processing and analysis Although numerous routines such as smoothing and noise suppression can be used to process the recon-structed slice, minimal image processing was conducted in order to maintain the direct correlation of grayscale intensity (GSV) in the image to the measured LAC of the original reconstructed slice. In this study, image nor-malization or contrast stretching was applied to the whole stack of the reconstructed slices to even out the brightness and contrast variation between the slices, as well as, to enhance the contrast in the said images. In the normalization process, the set of images was also down-sampled from 16-bit to 8-bit grayscale images resulting in a smaller image file size. SLICE, a basic 3D-image analysis program developed in SPring-8, was also used for the segmentation and cluster labeling of the normalized reconstructed grayscale images (Nakano et al., 2006).
To avoid possible edge effects and reduce the com-puting time, a region of interest (ROI) was selected, and a cubic volume of interest (VOI) was obtained therefrom. In this study, the VOI was limited to 200 x 200 x 200 voxels, i.e., a cubic VOI with physical dimension of 100 µm, for the analysis of quantitative data from the mi-crotomographic images of cement paste. It has been previously stated by Uchikawa (1988, 1989) that 100 micrometers is a representative size for studying cement pastes.
The pore space was then extracted from this VOI by thresholding the slices on the basis of their gray level histogram. Although several approaches to pore seg-mentation are mentioned in the literature (e.g., see Bentz et al., 2002), which is appropriate for the given task is still an open discussion. For this study, a global thresh-olding method, the simplest and usual method of seg-mentation, was used to identify the pore voxels from the solid matrix. Global thresholding is done by visiting each pixel (or voxel) in an image, and setting the pixel to a grayscale value (e.g., GSV = 255 for an 8-bit grayscale image) if its value is above the given threshold value, and to another grayscale value (e.g., GSV = 0 for an 8-bit grayscale image) if the pixel value is below or equal to the threshold value. Accordingly, the lower bound of GSV associated with pore voxel was set to 0 while the upper bound was set to the pore threshold value on the basis of the transition point in the segmented poros-
ity-threshold dependency curve, as described in Fig. 3. At this transition point, the segmented porosity started to increase rapidly wherein the boundary between the pore and the solid matrix is most likely to be segmented as pore space (Promentilla et al., 2007). The output from this pore segmentation is a set of binary images where the pores and solid matrix are imaged as black (GSV = 0) and white voxels (GSV = 255), respectively.
After pore segmentation, the cluster multiple labeling technique described in Hoshen and Kopelman (1976) was applied to identify and label the connected pore clusters using the 6-point connectivity rule. In this con-nectivity analysis (Ikeda et al., 2000), two voxels are considered to be connected when a pore voxel shares a common face with another voxel. This set of connected voxels forms a so-called cluster. On the other hand, if the pore voxels are in contact only at the vertex or edge, then the voxels are considered to be disconnected and belong to different clusters. The output from the pore cluster labeling enumerates the number of pore clusters and their sizes (number of voxels) including their end-to-end co-ordinates in the cubic image system.
2.3 3D random walk simulation In this study, the concept of diffusion tortuosity is in-troduced as a pore structure-transport parameter associ-ated with the 3D-microgeometry of the pore space in cement-based materials. Random walk simulations were applied to measure the tortuosity of the pore space in the volume of interest (VOI). This technique has also been applied to measure the tortuosity from microtomographic images of geologic materials (Nakashima et al., 2004; Nakashima and Kamiya, 2007). It is based on the concept that the time-dependent diffusion coefficient D(t) asso-ciated with the random Brownian motion of molecules can be used to probe the geometry of porous media (Sen, 2004). The self-diffusion coefficient of molecules in a bulk medium is time-independent but becomes reduced and time-dependent in a confining geometry. With a long
Segmented porosity-threshold dependency curve
0
20000
40000
60000
80000
100000
120000
140000
160000
1 6 11 16 21 26 31 36 41 46 51 56 61 66 71 76 81 86 91 96 101
106
111
116
121
126
131
136
141
146
151
156
161
166
171
176
181
186
191
196
201
206
211
216
221
226
231
236
241
246
251
256
Grayscale value (GSV)
No.
of v
oxel
s
0
0.1
0.2
0.3
0.4
0.5
0.6
0.7
0.8
0.9
1
Segm
ente
d po
rosit
y
No. of voxe
Inflection point
Segmented porosity
Histogram of VOI
VOI (OPC50-2d) Segmented porosity-threshold dependency curve
0
20000
40000
60000
80000
100000
120000
140000
160000
1 6 11 16 21 26 31 36 41 46 51 56 61 66 71 76 81 86 91 96 101
106
111
116
121
126
131
136
141
146
151
156
161
166
171
176
181
186
191
196
201
206
211
216
221
226
231
236
241
246
251
256
Grayscale value (GSV)
No.
of v
oxel
s
0
0.1
0.2
0.3
0.4
0.5
0.6
0.7
0.8
0.9
1
Segm
ente
d po
rosit
y
No. of voxe
Inflection point
Segmented porosity
Histogram of VOI
VOI (OPC50-2d)
Fig. 3 Example of GSV histogram for VOI and corre-sponding porosity-threshold dependency curve.
No. of voxels PorosityNo. of voxels Porosity
Transition point: pore threshold value (ThV)
M. A. B. Promentilla, T. Sugiyama, T. Hitomi and N. Takeda / Journal of Advanced Concrete Technology Vol. 6, No. 2, 273-286, 2008 277
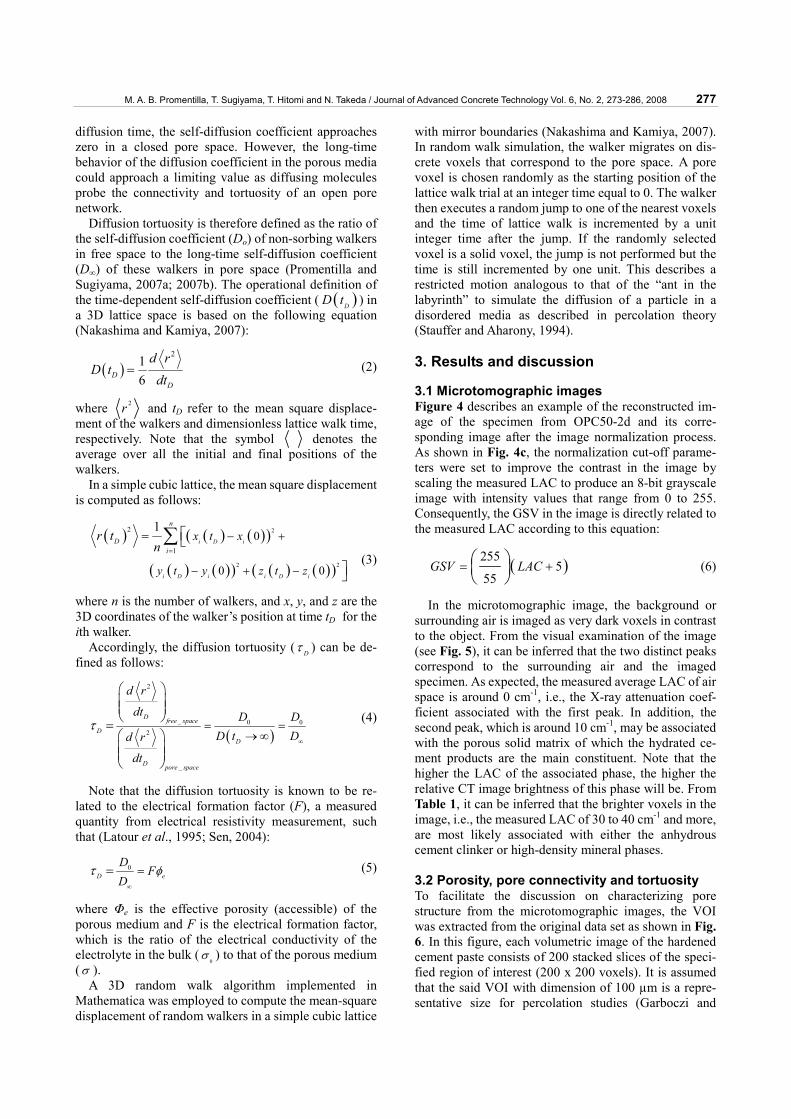
diffusion time, the self-diffusion coefficient approaches zero in a closed pore space. However, the long-time behavior of the diffusion coefficient in the porous media could approach a limiting value as diffusing molecules probe the connectivity and tortuosity of an open pore network.
Diffusion tortuosity is therefore defined as the ratio of the self-diffusion coefficient (Do) of non-sorbing walkers in free space to the long-time self-diffusion coefficient (D∞) of these walkers in pore space (Promentilla and Sugiyama, 2007a; 2007b). The operational definition of the time-dependent self-diffusion coefficient ( ( )DD t ) in a 3D lattice space is based on the following equation (Nakashima and Kamiya, 2007):
( )2
16D
D
d rD t
dt= (2)
where 2r and tD refer to the mean square displace-ment of the walkers and dimensionless lattice walk time, respectively. Note that the symbol denotes the average over all the initial and final positions of the walkers.
In a simple cubic lattice, the mean square displacement is computed as follows:
( ) ( ) ( )( )
( ) ( )( ) ( ) ( )( )
2
2 2
2
1
0
0 0
1i D i
i D i i D i
n
Di
x t x
y t y z t z
r tn =
− +
− + −
= ⎡⎣
⎤⎦
∑ (3)
where n is the number of walkers, and x, y, and z are the 3D coordinates of the walker’s position at time tD for the ith walker.
Accordingly, the diffusion tortuosity ( Dτ ) can be de-fined as follows:
( )
2
_ 0 02
_
D free spaceD
D
D pore space
d r
dt D DD t Dd r
dt∞
= =→ ∞
⎛ ⎞⎜ ⎟⎜ ⎟⎝ ⎠=⎛ ⎞⎜ ⎟⎜ ⎟⎝ ⎠
τ (4)
Note that the diffusion tortuosity is known to be re-lated to the electrical formation factor (F), a measured quantity from electrical resistivity measurement, such that (Latour et al., 1995; Sen, 2004):
0D e
DF
D∞
== φτ (5)
where Φe is the effective porosity (accessible) of the porous medium and F is the electrical formation factor, which is the ratio of the electrical conductivity of the electrolyte in the bulk (
0σ ) to that of the porous medium
(σ ). A 3D random walk algorithm implemented in
Mathematica was employed to compute the mean-square displacement of random walkers in a simple cubic lattice
with mirror boundaries (Nakashima and Kamiya, 2007). In random walk simulation, the walker migrates on dis-crete voxels that correspond to the pore space. A pore voxel is chosen randomly as the starting position of the lattice walk trial at an integer time equal to 0. The walker then executes a random jump to one of the nearest voxels and the time of lattice walk is incremented by a unit integer time after the jump. If the randomly selected voxel is a solid voxel, the jump is not performed but the time is still incremented by one unit. This describes a restricted motion analogous to that of the “ant in the labyrinth” to simulate the diffusion of a particle in a disordered media as described in percolation theory (Stauffer and Aharony, 1994).
3. Results and discussion
3.1 Microtomographic images Figure 4 describes an example of the reconstructed im-age of the specimen from OPC50-2d and its corre-sponding image after the image normalization process. As shown in Fig. 4c, the normalization cut-off parame-ters were set to improve the contrast in the image by scaling the measured LAC to produce an 8-bit grayscale image with intensity values that range from 0 to 255. Consequently, the GSV in the image is directly related to the measured LAC according to this equation:
( )2555
55GSV LAC= +⎛ ⎞
⎜ ⎟⎝ ⎠
(6)
In the microtomographic image, the background or surrounding air is imaged as very dark voxels in contrast to the object. From the visual examination of the image (see Fig. 5), it can be inferred that the two distinct peaks correspond to the surrounding air and the imaged specimen. As expected, the measured average LAC of air space is around 0 cm-1, i.e., the X-ray attenuation coef-ficient associated with the first peak. In addition, the second peak, which is around 10 cm-1, may be associated with the porous solid matrix of which the hydrated ce-ment products are the main constituent. Note that the higher the LAC of the associated phase, the higher the relative CT image brightness of this phase will be. From Table 1, it can be inferred that the brighter voxels in the image, i.e., the measured LAC of 30 to 40 cm-1 and more, are most likely associated with either the anhydrous cement clinker or high-density mineral phases.
3.2 Porosity, pore connectivity and tortuosity To facilitate the discussion on characterizing pore structure from the microtomographic images, the VOI was extracted from the original data set as shown in Fig. 6. In this figure, each volumetric image of the hardened cement paste consists of 200 stacked slices of the speci-fied region of interest (200 x 200 voxels). It is assumed that the said VOI with dimension of 100 µm is a repre-sentative size for percolation studies (Garboczi and

278 M. A. B. Promentilla, T. Sugiyama, T. Hitomi and N. Takeda / Journal of Advanced Concrete Technology Vol. 6, No. 2, 273-286, 2008
Bentz, 2001), but this requires further investigation in the future. For the purpose of brevity, representative results from the 3D image analysis of these VOIs were only shown in this paper. Figure 7 describes the VOI after pore segmentation and cluster multiple labeling. In Figs. 7a, 7c, and 7e, the VOIs of OPC50-2d, OPC50-7d, and OPC50-28d are shown respectively as stacks of binary images in which the pores are imaged as black voxels while the “solid matrix” are imaged as white voxels. The segmented porosity was quantified by just counting the total number of black voxels and then dividing this number by the total number of voxels in the VOI. Using a cluster labeling technique, the largest percolating pore cluster (imaged as black voxels) was identified and dif-ferentiated from the smaller isolated pore clusters and dead-end pores (imaged as gray voxels) as shown in Figs. 7b, 7d, and 7e. Although these black voxels are appar-
ently disconnected in 2D, the pores are in fact connected to form a large percolating cluster or network in 3D. Note that the criterion we used to define percolation here is when this pore cluster contains voxels that are connected to the six faces of the cubic VOI. In other words, perco-lation means that any external species can enter one face of the VOI and exit any other face through the said pore cluster. Figure 8 illustrates the 3D micro-geometry of the pore structure associated with the originally segmented porosity and the corresponding largest percolating pore cluster.
It is assumed that the largest percolating pore cluster would most likely contribute to the macroscopic trans-port property of the cement paste. Thus, random walk simulation in the largest percolating cluster was per-formed to determine the pertinent diffusion tortuosity. A random walk simulation was also performed in free
OPC50-2d Slice 400 OPC50-2d Slice 400
a) Before normalization b) After normalization
c) LAC histogram of slice 400: Max. LAC = 103.8, Min.LAC = 14.5
0
10000
20000
30000
40000
50000
60000
-20.0
-10.0
0.0
10.0
20.0
30.0
40.0
50.0
60.0
70.0
80.0
90.0
100.0
110.0
Linear attenuation coefficient (cm-1
)
No. o
f vo
xels
Max. cut-off
Min. cut-off
OPC50-2d
OPC50-2d Slice 400 OPC50-2d Slice 400
a) Before normalization b) After normalization
c) LAC histogram of slice 400: Max. LAC = 103.8, Min.LAC = 14.5
0
10000
20000
30000
40000
50000
60000
-20.0
-10.0
0.0
10.0
20.0
30.0
40.0
50.0
60.0
70.0
80.0
90.0
100.0
110.0
Linear attenuation coefficient (cm-1
)
No. o
f vo
xels
Max. cut-off
Min. cut-off
OPC50-2dc) LAC histogram of slice 400: Max. LAC = 103.8, Min.LAC = 14.5
0
10000
20000
30000
40000
50000
60000
-20.0
-10.0
0.0
10.0
20.0
30.0
40.0
50.0
60.0
70.0
80.0
90.0
100.0
110.0
Linear attenuation coefficient (cm-1
)
No. o
f vo
xels
Max. cut-off
Min. cut-off
OPC50-2d
Fig. 4 Example of reconstructed slice before and after normalization process.

M. A. B. Promentilla, T. Sugiyama, T. Hitomi and N. Takeda / Journal of Advanced Concrete Technology Vol. 6, No. 2, 273-286, 2008 279
space (i.e., porosity = 100%) of the same VOI size to check the reliability of the results. Figure 9a shows the sample trajectory of a walker in the pore space. The dimensionless mean square displacement (MSD) aver-aged over 100,000 walkers is plotted against the time (t) of lattice walk (see Fig. 9b). In free space where uncon-strained diffusion can be observed, the mean square displacement of walkers was observed to be directly proportional to the time of the lattice walk. In contrast, the curve of MSD against time for the pore space indi-cated restricted diffusion resulting in a reduced self-diffusion coefficient of the walkers as they probe the tortuosity of the pore space. The slope of MSD against time would correspond to the inverse (diffusion) tortu-osity of the pore space. As expected, the constant slope observed in free space yielded a diffusion tortuosity equal to one. On the other hand, the computed long-time diffusion tortuosity was estimated to be 13, 111, 167 for OPC50-2d, OPC50-7d and OPC50-28d, respectively.
The results of the analysis from the VOI of OPC50-2d, OPC50-7d and OPC50-28d are summarized in Fig. 10. Note that the degree of pore connectivity is defined as the volume fraction of the largest pore cluster in the pore space (i.e., the segmented porosity). If all the pores in the segmented porosity are connected to each other, then the degree of connectivity is one. By multiplying the degree
Fig. 5 Cross-sectional slice through OPC50-2d speci-men. The normalized reconstructed 8-bit grayscale im-age size is 2000 x 2000 voxels of 0.5 µm size. In the foreground image, bright voxels are anhydrous cement, light to medium gray voxels are hydrated cement prod-ucts, and very dark gray to black voxels are pore space.
a) OPC50-2dSlice 299
b) OPC50-7dSlice 299
c) OPC50-28dSlice
VOI VOI VOI
100
µm
a) OPC50-2dSlice 299
b) OPC50-7dSlice 299
c) OPC50-28dSlice
VOI VOI VOI
100
µm
Fig. 6 Volume of interest (VOI) extracted from original data set of microtomographic images. Size of VOI = 2003 voxels.

280 M. A. B. Promentilla, T. Sugiyama, T. Hitomi and N. Takeda / Journal of Advanced Concrete Technology Vol. 6, No. 2, 273-286, 2008
of connectivity to the segmented porosity, we defined the effective porosity that is percolating in three orthogonal directions. For example, the largest percolating pore in OPC50-2d is 87% of the segmented porosity (0.21) that corresponds to an effective porosity of 0.18. The other 13% is either isolated pores or dead-end pore clusters.
Although this study was limited in its extent, indications were found that the porosity and the degree of pore connectivity decrease as the age of hardened cement paste increases. Likewise, the diffusion tortuosity tends to increase in a 3D pore space that is becoming more disconnected as the age of cement paste increases. These
a) Pore segmentation of OPC50-2d b) Pore cluster multiple labeling of OPC50-2d
100
µm
c) Pore segmentation of OPC50-7d d) Pore cluster multiple labeling of OPC50-7d
100
µm
e) Pore segmentation of OPC50-28d f) Pore cluster multiple labeling of OPC50-28d
100
µm
a) Pore segmentation of OPC50-2d b) Pore cluster multiple labeling of OPC50-2d
100
µm
c) Pore segmentation of OPC50-7d d) Pore cluster multiple labeling of OPC50-7d
100
µm
a) Pore segmentation of OPC50-2d b) Pore cluster multiple labeling of OPC50-2d
100
µm
c) Pore segmentation of OPC50-7d d) Pore cluster multiple labeling of OPC50-7d
100
µm
e) Pore segmentation of OPC50-28d f) Pore cluster multiple labeling of OPC50-28d
100
µm
e) Pore segmentation of OPC50-28d f) Pore cluster multiple labeling of OPC50-28d
100
µm
Fig. 7 Visualization of output from pore segmentation and cluster labeling. The pore voxels are imaged as black and the solid matrix is imaged as white. After cluster labeling, the pore voxels that are not connected to the largest percolating pore cluster are imaged as gray voxels.

M. A. B. Promentilla, T. Sugiyama, T. Hitomi and N. Takeda / Journal of Advanced Concrete Technology Vol. 6, No. 2, 273-286, 2008 281
preliminary findings seem reasonable and consistent with the common knowledge on pore microstructure evolution in hardened cement pastes as hydration pro-gresses through time. For example, Powers et al. (1959) have demonstrated the depercolation of capillary pores with a corresponding decrease of permeability in cement
pastes as the capillary pores decrease in volume and size and start to become disconnected with increases in the degree of cement hydration.
However, some doubt as to the significance of the findings from this study may exist since the current spa-tial resolution (0.50 micrometers per voxel) of the 3D
a) OPC50-2d
Segmented porosity
Percolating pore cluster
b) OPC50-7d
Segmented porosity
Percolating pore cluster
100
µm
c) OPC50-28d
Percolating pore cluster
Segmented porosity
100
µm
100
µm
a) OPC50-2d
Segmented porosity
Percolating pore cluster
b) OPC50-7d
Segmented porosity
Percolating pore cluster
100
µm
c) OPC50-28d
Percolating pore cluster
Segmented porosity
100
µm
100
µm
Fig. 8 3D visualization of segmented porosity and largest percolating pore cluster. The pore space is filled (colored image) to give a sense of the 3D structure.
-200
0
200
400
X
-200
0
200
400Y
-200
0
200
400
Z
-200
0
200X
00
0
200Y
-200
0
200
400
X
-200
0
200
400Y
-200
0
200
400
Z
-200
0
200X
00
0
200Y Mean square displacement (MSD) from
Random Walk Simulation
0100002000030000400005000060000700008000090000
100000
0 200000 400000 600000 800000 1000000 1200000
Lattice-walk time
MS
D
Free spaceOPC50-2d
OPC50-7d
OPC50-28d
Mean square displacement (MSD) from Random Walk Simulation
0100002000030000400005000060000700008000090000
100000
0 200000 400000 600000 800000 1000000 1200000
Lattice-walk time
MS
D
Free spaceOPC50-2d
OPC50-7d
OPC50-28d
a) Trajectory of a walker in 3D pore space b) Mean square displacement of walkers averaged over 100,000 walkers
Fig. 9 Output from random walk simulation in 3D pore space.

282 M. A. B. Promentilla, T. Sugiyama, T. Hitomi and N. Takeda / Journal of Advanced Concrete Technology Vol. 6, No. 2, 273-286, 2008
image is quite low relative to the sizes of the pores that could be critical to the transport properties in the hard-ened cement pastes. Note that the lower end of the pore size range that can be detected from synchrotron micro-tomography is determined by the spatial resolution of the X-ray imaging system whereas the upper end can be as large as possible depending on the specimen size. One might argue that porosity, pore connectivity, and tortu-osity may be influenced by the pore size that can be resolved in the X-ray imaging system. As these limita-tions are related to the digital resolution, there have been studies on the effect of such resolution on pore percola-tion in digital images obtained from either microstructure models (Ye, 2005; Garboczi and Bentz, 2001; Navi and Pignat, 1996) or microtomographic studies (e.g., see Galucci et al., 2007). As expected, an increase in pixel (or voxel) size, i.e., a decrease in the digital image resolution, results in a decrease in the calculated con-nectivity of the pore network.
Despite this sensitivity to resolution, it is interesting to note that the digital resolution near 1 micrometer per voxel appears to be reasonable based on the rough agreement of the computer models with the experimental evidences as reported in Garboczi and Bentz (2001). Furthermore, Koster et al. (2006) suggest that a voxel size of 1 micrometer can be scaled down to 20 nm without changing its morphological shape because of the self-similarity of pore space in the microtomographic images. The information obtained from microtomo-graphic studies can then be interfaced with computer models that allow extrapolations to finer pore size. Therefore, it was conjectured that the current resolution of the microtomographic images is adequate to study the 3D micro-geometry of the pore structure in accordance to
the physical length scale of interest that mainly controls the transport properties of cement paste.
3.3 Sensitivity to pore threshold value As in any tomographic imaging technique, the robustness of the results is influenced by the spatial resolution of the X-ray imaging system. Aside from the inherent statistical noise, the measured LAC in the CT image depends on the restricted size of the voxel. Finer pores with a voxel size of 0.5 µm or smaller cannot be detected in an appropriate manner. As each voxel in the reconstructed image represents the attenuation properties (LAC) of a specific material volume, we could always find partial volume effects (PVE) at the boundary between the pore and hydrated cement products (e.g., ettringite, portlandite, CSH, among others). In other words, if the voxel is ac-tually composed of a number of different substances, then the resulting GSV (or measured LAC) represents some average of their properties. Furthermore, blurring at the interface of the material and pore due to fixed spatial resolution indicates that the voxel can be affected by the GSV voxel of the surrounding area. For example, if in the analysis, air has a GSV of 23 and the solid matrix has a GSV of 67, small pore voxels may show up as small features that are darker than the matrix; but may not ever achieve a grayscale of 23, and may not even reach the midpoint grayscale of 45. Thus, the interpretation of the pore threshold value to extract the pore from the matrix is not necessarily straightforward as compared to that of surrounding air (background) and the solid object (fore-ground) in the image.
To examine the uncertainty involved in the calculation of pore connectivity and tortuosity, we conducted a lim-ited sensitivity analysis wherein the pore threshold value
0
0.1
0.2
0.3
0.4
0.5
0.6
0.7
0.8
0.9
1
OPC50-2d OPC50-7d OPC50-28d
Poro
sit
y o
r degre
e o
f connecti
vit
y
0
20
40
60
80
100
120
140
160
180
Dif
fusi
on t
ort
uosi
ty
Seg. porosity Connectivity Eff.porosity Tortuosity
Fig. 10 Porosity, pore connectivity and diffusion tortuosity of hardened cement pastes of different curing ages.

M. A. B. Promentilla, T. Sugiyama, T. Hitomi and N. Takeda / Journal of Advanced Concrete Technology Vol. 6, No. 2, 273-286, 2008 283
was varied within the range of GSV that corresponds to the values between the transition point and the inflection point, i.e., where a distinct peak in the respective VOI histogram is observed (see Fig. 3). This peak in said VOI was assumed to be most likely associated with the GSV (or LAC) of the hydrated cement pastes that may actually contain finer pores. In addition, it is also possible to have pore voxels with linear attenuation coefficients that are very close to those of the hydrated cement products. This has been shown before by Gallucci et al. (2007) based on closer examination of microtomographic images wherein increases of contrast resolution loss are observed with decreases in pore size. Figure 11 summarizes the results of this analysis for the VOI of OPC50-2d, OPC50-7d and OPC50-28d, respectively.
3.4 Porosity-tortuosity correlation Results from this study also provide indications of the strong correlation between the effective porosity Φe and the measured diffusion tortuosity (τD) in hardened ce-ment paste.
Since an effective porosity of 1.0 yields a diffusion tortuosity of 1, a power law function was used to define the correlation between effective porosity and diffusion tortuosity, such that:
mD e
−=τ φ (7)
where m is the fitting parameter. Note that Eq. 7 is analogous to Archie’s law, which
correlates the electrical tortuosity or the so-called for-mation factor to the measured porosity of rocks. Archie’s law, proposed in 1942, is an empirical relation that re-lates the porosity of brine-saturated rock to its electrical conductivity (Garboczi, 1990). It can be written in the form of the dimensionless electrical formation factor (F), such that:
0 mF a −= =σ
φσ
(8)
where 0σ is the electrical conductivity of the brine, σ is the overall conductivity of the brine-saturated rock, treated as an effective uniform continuum, a and m are constants that can vary between rock formations, and φ is the measured porosity (which is usually referred to as total porosity in the classical definition of Archie’s law).
Compared with Eq. 5, Archie’s law can be expressed with a that is equal to 1.0 and replacing the porosity (φ ) with the effective porosity ( eφ ) such that:
( )1m m
e eF − − += =φ φ (9)
This means that the formation factor contains the ef-fective porosity and tortuosity of the porous medium.
Using the data in either Fig. 10 or Fig. 11, parameter m in Eq. 7 was estimated from nonlinear regression analy-sis using the Levenberg-Marquardt algorithm. It is as-sumed that the data in Fig. 11 are a set of possible values
that relate the effective porosity and diffusion tortuosity regardless of the age of cement paste. It is worth noting that in every case, there is a sudden change in the degree of connectivity or tortuosity as the porosity crosses the level of about 20%. This is in agreement with the pre-vious experimental and computer modeling studies done in capillary porosity depercolation (e.g., see Powers, 1959; Bentz and Garboczi, 1991; Garboczi and Bentz, 2001).
Results from the regression analysis are summarized in Fig. 12. The computed value of m in the effective porosity-tortuosity correlation is very close to the power law exponent of 2. In terms of the formation factor, this corresponds to the cementation factor m of 3, which is on the high side but still in the range of values encoun-tered in some geologic materials. This is consistent with the concept that the formation factor (electrical tortuos-ity) is directly related to the diffusivity (diffusion tortu-osity) of the material pore structure according to the Einstein relation. There have been reports (Garboczi, 1990) about reasonable success estimating the diffusivity of hardened cement paste using this relation along with experimental measurements, provided that the pore structure is the only geometric constraint to transport, and any interactions among ionic species, and between ionic species and pore walls, are considered insignificant. This implies that tortuosity is not just a "fudge" factor (Grathwohl, 1998) in solving transport equations but a physical parameter that can be measured independently from the 3D micro-geometry of pore structure in hard-ened cement paste. Diffusion tortuosity can thus be used as a parameter to relate the pore structure to the transport properties in cement-based materials.
4. Conclusions
Synchrotron microtomography allows us to examine the 3D micro-geometry of hydrated cement systems with submicron spatial resolution. The three-dimensional imaging of the pore space allows us to measure the pore connectivity and diffusion tortuosity, which clearly demonstrates the advantage of this technique over the 2D microscopic imaging technique. To our knowledge, this study, which uses a spatial resolution that corresponds to a voxel size of 0.5 µm, offers by far the highest resolution thus far reported for studying the cement paste micro-structure.
By employing 3D image analysis and random walk simulation, relevant pore structure parameters from the 3D micro-geometry, such as porosity, pore connectivity and diffusion tortuosity, were quantified. Given the pores that can be resolved in the X-ray imaging system, the porosity and degree of pore connectivity tend to decrease while diffusion tortuosity tends to increase as the age of hardened cement paste increases. However, caution must be taken with regards to the interpretation of results as this method is also sensitive to the specified pore threshold value. Preliminary analysis of the robustness of

284 M. A. B. Promentilla, T. Sugiyama, T. Hitomi and N. Takeda / Journal of Advanced Concrete Technology Vol. 6, No. 2, 273-286, 2008
the results by varying the pore threshold value at a rea-sonable range was investigated. In addition, the effective porosity-tortuosity correlation was shown as a power law function analogous to Archie’s law.
As in any other techniques for characterizing pore structure, synchrotron microtomography has its limita-tion, in particular as regards its spatial resolution, which is quite low relative to the reported capillary pore size
range that controls the transport processes in hardened cement pastes. Nevertheless, the results from this study were consistent with the previous experimental and computer modeling studies reported in the literature. This implies that the current “rough” resolution used in this study could have extracted the percolating 3D pore space that plays an important role in the transport proc-esses in cement pastes. As this technique is the only
0
0.2
0.4
0.6
0.8
1
5.0 6.0 7.0 8.0 9.0 10.0
Pore LAC (1/cm)
Poro
sity
or
co
nnect
ivity
0
2
4
6
8
10
12
14
Diff
usi
on
Tort
uosi
ty
Seg.porosity Connectivity Eff. porosity Tortuosity
0
0.2
0.4
0.6
0.8
1
5.0 6.0 7.0 8.0 9.0 10.0
Pore LAC (1/cm)
Poro
sity
or
conn
ectivity
0
20
40
60
80
100
120
Diff
usi
on t
ort
uosi
ty
Seg.porosity Connectivity Eff. porosity Tortuosity
0
0.2
0.4
0.6
0.8
1
5.0 6.0 7.0 8.0 9.0 10.0
Pore LAC (1/cm)
Poro
sity
or
con
nect
ivity
0
50
100
150
200
Diff
usi
on t
ort
uosi
tySeg.porosity Connectivity Eff. porosity Tortuosity
a) OPC50-2d
b) OPC50-7d
c) OPC50-28d
0
0.2
0.4
0.6
0.8
1
5.0 6.0 7.0 8.0 9.0 10.0
Pore LAC (1/cm)
Poro
sity
or
co
nnect
ivity
0
2
4
6
8
10
12
14
Diff
usi
on
Tort
uosi
ty
Seg.porosity Connectivity Eff. porosity Tortuosity
0
0.2
0.4
0.6
0.8
1
5.0 6.0 7.0 8.0 9.0 10.0
Pore LAC (1/cm)
Poro
sity
or
conn
ectivity
0
20
40
60
80
100
120
Diff
usi
on t
ort
uosi
ty
Seg.porosity Connectivity Eff. porosity Tortuosity
0
0.2
0.4
0.6
0.8
1
5.0 6.0 7.0 8.0 9.0 10.0
Pore LAC (1/cm)
Poro
sity
or
con
nect
ivity
0
50
100
150
200
Diff
usi
on t
ort
uosi
tySeg.porosity Connectivity Eff. porosity Tortuosity
a) OPC50-2d
b) OPC50-7d
c) OPC50-28d
Fig. 11 Sensitivity of porosity, connectivity, and diffusion tortuosity to pore threshold value (LAC).

M. A. B. Promentilla, T. Sugiyama, T. Hitomi and N. Takeda / Journal of Advanced Concrete Technology Vol. 6, No. 2, 273-286, 2008 285
noninvasive 3D imaging technique available so far, this kind of research could contribute to the clarification of the relationship between the 3D microstructure and transport properties of cement pastes. Diffusion tortuos-ity could be used as a robust microstructure parameter that has a direct bearing on transports properties (e.g., permeability, diffusivity, etc.) as it can be evaluated di-rectly from a complex pore network without requiring any assumption about the pore geometry in three di-mensions. Therefore, future studies along these lines are being considered to further understanding of the 3D micro-geometry of pore structure as it influences the transport properties of cement-based materials.
Acknowledgments Part of this present research work was funded by the Japan Society for the Promotion of Science (Research No.: 196561060 7, Representative: Sugiyama Takafumi). The synchrotron radiation experiments were performed at the BL20XU beamline at SPring-8 with the approval of the Japan Synchrotron Radiation Research Institute (JASRI) (Proposal No. 2007A1951-NL-np). The authors wish to acknowledge SPring-8 for letting them use the synchrotron radiation facilities, with particular thanks to the staff of BL20XU. The authors are also thankful to the three anonymous reviewers for their valuable comments and insights in improving the content of the paper. The first author acknowledges Dr. Yoshito Nakashima and Dr. Masayuki Uesugi for their kind assistance in the use of the Mathematica program and SLICE, respectively. He also acknowledges the support of Prof. Tamon Ueda, the group leader of the COE project of which this research was part of. He is grateful to the financial support given by the COE program of the Graduate School of Engi-neering, Hokkaido University, and the JSPS Postdoctoral Fellowship for Foreign Researchers in the conduct of this study. References Allen, A. J., Thomas, J. J. and Jennings, H. M. (2007).
“Composition and density of nanoscale calcium-
silicate-hydrate in cement.” Nature Materials, 6(4), 311-316.
Ashbridge, D., Thorne, M., Rivers, M., Muccino, J. and O’Day, P. A. (2003). “Image optimization and analysis of synchrotron X-ray computed microtomography data.” Computers and Geosciences, 29, 823-836.
Bentz, D. P. (2006). “Capillary porosity depercolation/ repercolation in hydrating cement pastes via low-temperature calorimetry measurements and CEMHYD3D modeling.” J. Am. Ceram. Soc., 89(8), 2606-2611.
Bentz, D. P., Mizell, S., Satterfield, S., Devaney, J., George, W., Ketcham, P., Graham, J., Porterfield, J., Quenard, D., Vallee, F., Sallee, H., Boller, E. and Baruchel, J. (2002). “The visible cement data set.” Journal of Research of the National Institute of Standards and Technology, 107, 137-148.
Bentz, D. P., Quenard, D. A., Kunzel, H. M., Baruchel, J., Peyrin, F., Martys, N. S. and Garboczi, E. J. (2000). “Microstructure and transport properties of porous building materials. II: Three-dimensional X-ray tomographic studies.” Materials and Structures, 33, 147-153.
Bentz, D. P. and Garboczi, E. J. (1991). “Percolation of phases in a three-dimensional cement paste microstructural model.” Cem. Concr. Res., 21, 325- 344.
Bentz, D. P., Coveney, P. V., Garboczi, E. J., Kleyn, M. F. and Stutzman, P. E. (1994). “Cellular automaton simulations of cement hydration and microstructure development.” Modell. Simul. Mater. Sci. Eng., 2, 783-808.
Burlion, N., Bernard, D. and Chen, D. (2006). “X-ray microtomography: Application to microstructure analysis of a cementitious material during leaching process.” Cem. Concr. Res., 36, 346-357.
Gallucci, E., Scrivener, K., Groso, A., Stampanoni, M. and Margaritondo, G. (2007). “3D experimental investigation of the microstructure of cement pastes using synchrotron X-ray microtomography.” Cem. Concr. Res., 37, 360-368.
Garboczi, E. J. and Bentz, D. P. (2001). “The effect of statistical fluctuation, finite size error, and digital resolution on the phase percolation and transport properties of the NIST cement hydration model.” Cem. Concr. Res., 31(10), 1501-1514.
Garboczi, E. (1990). “Permeability, diffusivity, and microstructural parameters: a critical review.” Cem. Concr. Res., 20, 591-601.
Grathwohl, P. (1998). “Diffusion in Natural Porous Media: Contaminant Transport, Sorption/Desorption and Dissolution Kinetics.” Boston: Kluwer Academic Publishing.
Helfen, L., Dehn, F., Mikulik, P. and Baumbach, T. (2005). “Three-dimensional imaging of cement microstructure evolution during hydration.” Advances in Cement Research, 17(3), 103-111.
Hitomi, T., Mita, Y., Saito, H. and Takeda, N. (2004).
Effective porosity-tortuosity correlation
0
20
40
60
80
100
120
140
160
180
200
0 0.1 0.2 0.3 0.4 0.5 0.6 0.7 0.8 0.9 1
Effective porosity
Diff
usio
n to
rtuos
ity
1.99 0.10D eτ φ − ±=
1.98 0.04D eτ φ − ±=
( )2r 0 .96=a) Fig. 10 data:
b) Fig. 11 data:
Effective porosity-tortuosity correlation
0
20
40
60
80
100
120
140
160
180
200
0 0.1 0.2 0.3 0.4 0.5 0.6 0.7 0.8 0.9 1
Effective porosity
Diff
usio
n to
rtuos
ity
1.99 0.10D eτ φ − ±=
1.98 0.04D eτ φ − ±=
( )2r 0 .96=a) Fig. 10 data:
b) Fig. 11 data:
a) Fig. 10 data:
b) Fig. 11 data:
Fig. 12 Effective porosity-tortuosity correlation using power law model. The correlation coefficient (r2) from using either data of Fig. 10 or Fig. 11 is 0.96.

286 M. A. B. Promentilla, T. Sugiyama, T. Hitomi and N. Takeda / Journal of Advanced Concrete Technology Vol. 6, No. 2, 273-286, 2008
“Observation of fine structure of mortar using X-ray CT images at SPring-8.” In: Proceedings of the Japan Concrete Institute, 26(1), 645-650. (in Japanese)
Hoshen, J. and Kopelman, R. (1976). “Percolation and cluster distribution. I. Cluster multiple labeling technique and critical concentration algorithm.” Phys. Rev. B, 14, 34-38.
Hubbell, J. H. and Seltzer, S. M. (2004). “Tables of X-Ray Mass Attenuation Coefficients and Mass Energy-Absorption Coefficients (version 1.4) [online].” National Institute of Standards and Technology, Gaithersburg, MD. Available from: <http://physics.nist.gov/xaamdi/> [10 Dec. 2007].
Ikeda, S., Nakano, N. and Nakashima, Y. (2000). “Three-dimensional study on the interconnection and shape of crystals in a graphic granite by X-ray CT and image analysis.” Mineralogical Magazine, 64(5), 945-959.
Japan Cement Association, (2008). “Study on the method of stopping hydration for hardened cement paste or mortar and cement hydrates.” Report of the technical committee on cement chemistry, C-11 (In Japanese).
Justnes, H., Elfgren, L. and Ronin, V. (2005). “Mechanism for performance of energetically modified cement versus corresponding blended cement.” Cem. Concr. Res., 35(2), 315-323.
Koster, M., Hannawald, J. and Brameshuber, W. (2006). “Simulation of water permeability and water vapor diffusion through hardened cement paste.” Computational Mechanics. 37(2), 163-172.
Latour, L. L., Kleinberg, R. L., Mitra, P. P. and Sotak, C. H. (1995). “Pore-size distributions and tortuosity in heterogeneous porous media.” J. Magn. Res. A, 112, 83-91.
Lu, S., Landis, E. N. and Keane, D. T. (2006). “X-ray microtomographic studies of pore structure and permeability in Portland cement concrete.” Materials and Structures, 36, 11-20.
Nakano, T., Tsuchiyama, A., Uesugi, K., Uesugi, M. and Shinohara, K. (2006). “SLICE –Software for basic 3-D image analysis [online].” Japan Synchrotron Radiation Research Institute (JASRI). Available from: <http://www-bl20.spring8.or.jp/slice/> [5 April 2007].
Nakashima, Y., Nakano, T., Nakamura, K., Uesugi, K., Tsuchiyama, A. and Ikeda, S. (2004). “Three-dimensional diffusion of non-sorbing species in porous sandstone: computer simulation based on X-ray microtomography using synchrotron radiation.” Journal of Contaminant Hydrology, 74, 253-264.
Nakashima, Y. and Kamiya, S. (2007). “Mathematica programs for the analysis of three-dimensional pore connectivity and anisotropic tortuosity of porous rocks using X-ray microtomography.” Journal of Nuclear Science and Technology, 44(9), 1233-1247.
Navi, P. and Pignat, C. (1996). “Simulation of cement hydration and the connectivity of capillary pore space.” Advanced Cement Based Materials, 4(2),
58-67. Powers, T. C., Copeland, L. E. and Mann, H. M. (1959).
“Capillary continuity or discontinuity in cement pastes.” Portland Cem. Bull., 110, 3-12.
Promentilla, M. A. B. and Sugiyama, T. (2007). “Studies on 3D micro-geometry and diffusion tortuosity of cement-based materials using X-ray microtomography.” In: Proceedings of the 32nd Conference on Our World in Concrete and Structures, Singapore, Aug. 2007, 389-396.
Promentilla, M. A. B. and Sugiyama T. (2007). “Evaluation of tortuosity of cement-based materials with X-ray synchrotron radiation microtomography.” In: Proceedings of the 1st International Conference on Recent Advances in Concrete Technology, Washington D.C., USA, Sept. 2007, 101-112.
Promentilla, M. A. B., Sugiyama, T., Hitomi, T. and Takeda, N. “Studies on pore structure characterization in hydrated cement system based on 3D micro-geometry technique.” In: Proceedings of the JCI symposium on Durability Mechanism of Concrete Structures, Tokyo, Japan, Dec. 2007, 357-366.
Sen, P. (2004). “Time-dependent diffusion coefficient as a probe of geometry.” Concepts in Magnetic Resonance Part A, 23(1), 1-21.
Stauffer, D. and Aharony, A. (1994). “Introduction to percolation theory.” Revised 2nd ed., London: Taylor and Francis.
Stutzman, P. (2004). “Scanning electron microscopy imaging of hydraulic cement microstructure.” Cem Conc Comp, 26(8), 957–966.
Sugiyama, T., Ritthichauy, W. and Tsuji, Y. (2003). “Simultaneous transport of chloride and calcium ions in hydrated cement systems.” Journal of Advanced Concrete Technology , 1(2), 127-138.
Sugiyama, T., Ritthichauy, W. and Tsuji, Y. (2008). “Experimental investigation and numerical modeling of chloride penetration and calcium dissolution in saturated concrete.” Cem. Concr. Res., 38, 49-67.
Uchikawa, H. (1988). “Similarities and discrepancies of hardened cement paste, mortar, and concrete from the standpoints of composition and structure.” J. of Research of the Onoda Cement Co. 40(2), No. 119, 87-121.
Uchikawa, H. (1989). “Similarities and discrepancies of hardened cement paste, mortar, and concrete from the standpoints of composition and structure.” In: E. Gartner (Ed.), Advances in Cement Manufacture and Use, Engineering Foundation, New York, , 271- 294.
Uesugi, K., Suzuki, Y., Yagi, N., Tsuchiyama, A. and Nakano, T. (2001). “Development of high spatial resolution X-ray CT system at BL47XU in SPring-8.” Nuclear Instruments and Methods I Physics Research A, 467-468, 853-856.
Ye, G. (2005). “Percolation of capillary pores in hardening cement pastes.” Cem. Concr. Res., 35, 167-176.