Embed Size (px)
Citation preview
CHARACTERIZING UPTAKE, DISTRIBUTION AND FATE OF CdSe/ZnS QUANTUM DOTS IN SYNNECHOCOCCUS ELONGATUS PCC7942
BY SUN MIN KIM
THESIS
Submitted in partial fulfillment of the requirements for the degree of Master of Science in Agricultural and Biological Engineering
in the Graduate College of the University of Illinois at Urbana‐Champaign, 2011
Urbana, Illinois
Advisers:
Assistant Professor Kaustubh Bhalerao Professor Rashid Bashir

ii
ABSTRACT
One of the challenges in developing a framework for characterizing nanoparticle
toxicity is that the number of nanoparticles and their superficial derivatives is very large and
continues to expand rapidly. Multiple factors such as size, geometry, surface chemistry,
nanoscale topology, electromagnetic activity, and aggregation and degradation processes
can modify the original nanoparticle and change its behavior significantly. Secondly, the
type of environments and organisms these nanoparticles may be subjected to are also
numerous and complex. Thirdly, the number of analytical and computational techniques
available to the researcher today spans physical, chemical, biomolecular, ecological and ‘‐
omics’ based approaches. Thus any combination of nanoparticle, model organismal system
and analytical technique is a potential route of investigation and can produce important
broad empirical information on the impact of nanomaterials on living systems.
This study is an extension of the analytical framework called DIMER, which involves
characterizing the dispersion, imbibition, metabolism, elimination and recycle of
nanoparticles to study its life cycle of in the environment. Cadmium selenide quantum dots
coated with zinc sulfide were chosen as a model nanoparticle. Similarly the cyanobacterium
Synechococcus elongatus PCC 7942 were chosen as the model host organism.
This study characterizes the uptake, distribution and fate of both water insoluble and
water soluble CdSe/ZnS quantum dots in cyanobacteria. To quantify the toxicological impact
of quantum dots on cells, cell growth rate, membrane destabilization, viability and the
activity of photosynthetic pigments were characterized. For characterization of uptake and
distribution, flow cytometry, laser scanning confocal microscopy and transmission electron
microscopy were used. When quantum dots are dispersed into the environment, their
imbibition, metabolism, degradation and elimination from cells depends on their surface
coating. Consequently, water soluble quantum dots, which are coated with a hydrophilic
coating, showed dramatically reduced degradation rates and resulting hazardous effects on
the cells even when observed directly in contact with the cells. However, water insoluble
quantum dots were immediately toxic to the cells. The observed toxicity was largely
indistinguishable from cadmium toxicity, which is a degradation product of the quantum dot.
The primary impact observed is that the cadmium destroys the photosynthetic machinery of

iii
the cells. Given the central role of cyanobacteria in many aquatic ecosystems, such damage
has serious implications to an ecosystem. Additionally, the cadmium toxicity is persistent in
the environment. Once contaminated, the growth media continues to inhibit the growth of
new cyanobacteria indicating a long‐lasting, toxic effect on the environment.

iv
ACKNOWLEDGEMENTS
My graduate study would not have been finished without many people. First and
foremost, I would like to express my gratitude to Dr. Kaustubh Bhalerao for his guidance,
support and patience to successfully complete all my graduate studies at UIUC. He always
encouraged me to have many questions, which helped me to develop critical thinking and
instilled confidence in me. I would also like to express my sincere thanks to co‐advisor, Dr.
Rashid Bashir for introducing me various nanotechnology applications. I deeply thank my
committee, Dr. Prasanta Kalita for his valuable insight and guidance towards completing the
thesis.
I thank Phil, Vaisak, Rekha and Goutam to have great time together in the lab. I have
lots of great memories in Champaign with Jinhae, Yoon Ju, Patricia, Hyun Seung, Jong Min and
SangHoon. Thanks go also to my friends in the Department of Agricultural and Biological
Engineering.
I also want to thank all my friends and family in Korea. My parents, Si Ju Kim and Jung
Hee Kim have always provided encouragement and support.
v
TABLEOFCONTENTS
Chapter 1. INTRODUCTION ∙∙∙∙∙∙∙∙∙∙∙∙∙∙∙∙∙∙∙∙∙∙∙∙∙∙∙∙∙∙∙∙∙∙∙∙∙∙∙∙∙∙∙∙∙∙∙∙∙∙∙∙∙∙∙∙∙∙∙∙∙∙∙∙∙∙∙∙∙∙∙∙∙∙∙∙∙∙∙∙∙∙∙∙∙∙∙∙∙∙∙∙∙∙∙∙∙∙∙∙∙∙∙∙ 1
1.1. DIMER: Need for a framework for understanding the environmental impact of nanotechnology ∙∙∙∙∙∙∙∙∙∙∙∙∙∙∙∙∙∙∙∙∙∙∙∙∙∙∙∙∙∙∙∙∙∙∙∙∙∙∙∙∙∙∙∙∙∙∙∙∙∙∙∙∙∙∙∙∙∙∙∙∙∙∙∙∙∙∙∙∙∙∙∙∙∙∙∙∙∙∙∙∙∙∙∙∙∙∙∙∙∙∙∙∙∙∙∙∙∙∙∙∙∙∙∙∙∙∙∙∙∙∙∙∙∙ 1 1.2 Case for using quantum dots (QDs) ∙∙∙∙∙∙∙∙∙∙∙∙∙∙∙∙∙∙∙∙∙∙∙∙∙∙∙∙∙∙∙∙∙∙∙∙∙∙∙∙∙∙∙∙∙∙∙∙∙∙∙∙∙∙∙∙∙∙∙∙∙∙∙∙∙∙∙∙∙∙∙∙∙∙∙∙∙∙ 6 1.3 Case for using cyanobacteria ∙∙∙∙∙∙∙∙∙∙∙∙∙∙∙∙∙∙∙∙∙∙∙∙∙∙∙∙∙∙∙∙∙∙∙∙∙∙∙∙∙∙∙∙∙∙∙∙∙∙∙∙∙∙∙∙∙∙∙∙∙∙∙∙∙∙∙∙∙∙∙∙∙∙∙∙∙∙∙∙∙∙∙∙∙∙∙∙ 7 1.4 Objectives of the present study ∙∙∙∙∙∙∙∙∙∙∙∙∙∙∙∙∙∙∙∙∙∙∙∙∙∙∙∙∙∙∙∙∙∙∙∙∙∙∙∙∙∙∙∙∙∙∙∙∙∙∙∙∙∙∙∙∙∙∙∙∙∙∙∙∙∙∙∙∙∙∙∙∙∙∙∙∙∙∙∙∙∙∙∙ 9
Chapter 2. BACKGROUND AND LITERATURE REVIEW ∙∙∙∙∙∙∙∙∙∙∙∙∙∙∙∙∙∙∙∙∙∙∙∙∙∙∙∙∙∙∙∙∙∙∙∙∙∙∙∙∙∙∙∙∙∙∙∙∙∙∙∙∙∙∙∙∙∙∙∙∙ 10
2.1 Nanomaterial ∙∙∙∙∙∙∙∙∙∙∙∙∙∙∙∙∙∙∙∙∙∙∙∙∙∙∙∙∙∙∙∙∙∙∙∙∙∙∙∙∙∙∙∙∙∙∙∙∙∙∙∙∙∙∙∙∙∙∙∙∙∙∙∙∙∙∙∙∙∙∙∙∙∙∙∙∙∙∙∙∙∙∙∙∙∙∙∙∙∙∙∙∙∙∙∙∙∙∙∙∙∙∙∙∙∙∙∙∙∙ 10 2.2 Biology of Cyanobacteria ∙∙∙∙∙∙∙∙∙∙∙∙∙∙∙∙∙∙∙∙∙∙∙∙∙∙∙∙∙∙∙∙∙∙∙∙∙∙∙∙∙∙∙∙∙∙∙∙∙∙∙∙∙∙∙∙∙∙∙∙∙∙∙∙∙∙∙∙∙∙∙∙∙∙∙∙∙∙∙∙∙∙∙∙∙∙∙∙∙∙∙∙ 12
Chapter 3. EXPERIMENTAL METHOD ∙∙∙∙∙∙∙∙∙∙∙∙∙∙∙∙∙∙∙∙∙∙∙∙∙∙∙∙∙∙∙∙∙∙∙∙∙∙∙∙∙∙∙∙∙∙∙∙∙∙∙∙∙∙∙∙∙∙∙∙∙∙∙∙∙∙∙∙∙∙∙∙∙∙∙∙∙∙∙∙∙∙∙∙∙∙∙ 17
3.1 Visualization of nanoparticles ∙∙∙∙∙∙∙∙∙∙∙∙∙∙∙∙∙∙∙∙∙∙∙∙∙∙∙∙∙∙∙∙∙∙∙∙∙∙∙∙∙∙∙∙∙∙∙∙∙∙∙∙∙∙∙∙∙∙∙∙∙∙∙∙∙∙∙∙∙∙∙∙∙∙∙∙∙∙∙∙∙∙∙∙∙ 17 3.2 Cells exposed to treatments and controls ∙∙∙∙∙∙∙∙∙∙∙∙∙∙∙∙∙∙∙∙∙∙∙∙∙∙∙∙∙∙∙∙∙∙∙∙∙∙∙∙∙∙∙∙∙∙∙∙∙∙∙∙∙∙∙∙∙∙∙∙∙∙∙∙∙∙ 17 3.3 Fate of quantum dots in cyanobacteria∙∙∙∙∙∙∙∙∙∙∙∙∙∙∙∙∙∙∙∙∙∙∙∙∙∙∙∙∙∙∙∙∙∙∙∙∙∙∙∙∙∙∙∙∙∙∙∙∙∙∙∙∙∙∙∙∙∙∙∙∙∙∙∙∙∙∙∙∙∙ 19 3.4 Uptake and distribution of quantum dots ∙∙∙∙∙∙∙∙∙∙∙∙∙∙∙∙∙∙∙∙∙∙∙∙∙∙∙∙∙∙∙∙∙∙∙∙∙∙∙∙∙∙∙∙∙∙∙∙∙∙∙∙∙∙∙∙∙∙∙∙∙∙∙∙∙∙ 21 3.5 Media contamination ∙∙∙∙∙∙∙∙∙∙∙∙∙∙∙∙∙∙∙∙∙∙∙∙∙∙∙∙∙∙∙∙∙∙∙∙∙∙∙∙∙∙∙∙∙∙∙∙∙∙∙∙∙∙∙∙∙∙∙∙∙∙∙∙∙∙∙∙∙∙∙∙∙∙∙∙∙∙∙∙∙∙∙∙∙∙∙∙∙∙∙∙∙∙∙∙∙ 24
Chapter 4. RESULT AND DISCUSSION ∙∙∙∙∙∙∙∙∙∙∙∙∙∙∙∙∙∙∙∙∙∙∙∙∙∙∙∙∙∙∙∙∙∙∙∙∙∙∙∙∙∙∙∙∙∙∙∙∙∙∙∙∙∙∙∙∙∙∙∙∙∙∙∙∙∙∙∙∙∙∙∙∙∙∙∙∙∙∙∙∙∙∙∙∙∙ 25
4.1 Characterization of quantum dots ∙∙∙∙∙∙∙∙∙∙∙∙∙∙∙∙∙∙∙∙∙∙∙∙∙∙∙∙∙∙∙∙∙∙∙∙∙∙∙∙∙∙∙∙∙∙∙∙∙∙∙∙∙∙∙∙∙∙∙∙∙∙∙∙∙∙∙∙∙∙∙∙∙∙∙∙∙∙ 25 4.2 Fate of quantum dots in cyanobacteria∙∙∙∙∙∙∙∙∙∙∙∙∙∙∙∙∙∙∙∙∙∙∙∙∙∙∙∙∙∙∙∙∙∙∙∙∙∙∙∙∙∙∙∙∙∙∙∙∙∙∙∙∙∙∙∙∙∙∙∙∙∙∙∙∙∙∙∙∙∙ 26 4.3 Degradation rate of quantum dots ∙∙∙∙∙∙∙∙∙∙∙∙∙∙∙∙∙∙∙∙∙∙∙∙∙∙∙∙∙∙∙∙∙∙∙∙∙∙∙∙∙∙∙∙∙∙∙∙∙∙∙∙∙∙∙∙∙∙∙∙∙∙∙∙∙∙∙∙∙∙∙∙∙∙∙∙∙ 43 4.4 Uptake and distribution of quantum dots ∙∙∙∙∙∙∙∙∙∙∙∙∙∙∙∙∙∙∙∙∙∙∙∙∙∙∙∙∙∙∙∙∙∙∙∙∙∙∙∙∙∙∙∙∙∙∙∙∙∙∙∙∙∙∙∙∙∙∙∙∙∙∙∙∙∙ 46
Chapter 5. CONCLUSION ∙∙∙∙∙∙∙∙∙∙∙∙∙∙∙∙∙∙∙∙∙∙∙∙∙∙∙∙∙∙∙∙∙∙∙∙∙∙∙∙∙∙∙∙∙∙∙∙∙∙∙∙∙∙∙∙∙∙∙∙∙∙∙∙∙∙∙∙∙∙∙∙∙∙∙∙∙∙∙∙∙∙∙∙∙∙∙∙∙∙∙∙∙∙∙∙∙∙∙∙∙∙∙∙∙∙ 56
REFERENCES ∙∙∙∙∙∙∙∙∙∙∙∙∙∙∙∙∙∙∙∙∙∙∙∙∙∙∙∙∙∙∙∙∙∙∙∙∙∙∙∙∙∙∙∙∙∙∙∙∙∙∙∙∙∙∙∙∙∙∙∙∙∙∙∙∙∙∙∙∙∙∙∙∙∙∙∙∙∙∙∙∙∙∙∙∙∙∙∙∙∙∙∙∙∙∙∙∙∙∙∙∙∙∙∙∙∙∙∙∙∙∙∙∙∙∙∙∙∙∙∙∙∙∙∙∙ 57
1
Chapter1.INTRODUCTION
1.1. DIMER: Need for a framework for understanding the environmental impact of
nanotechnology
Applications of engineered nanoparticles are becoming increasingly commonplace.
Nanomaterials offer superior mechanical, electromagnetic and chemical properties, some of
which are a result of particle sizes in the 1‐100 nm size scale. There are various examples of
engineered nanoparticles used in daily products such as cosmetics (Xia et al., 2010;
Wokovich et al., 2009), soap, and food packaging (Monteiro et al., 2009; Zhang et al., 2010).
Engineered nanoparticles are also used in imaging‐based diagnostic and drug delivery (Xing
and Rao, 2008; Michalet et al., 2005; Xing et al., 2009), monitoring of tumors (Jaiswal and
Simon, 2007; Su et al., 2010) and therapeutics (Xing and Rao, 2008; Ho and Leong, 2010;
Yang, 2010). Given their novel and impactful applications, the possibility that nanoparticles
are being dispersed into the environment by accidental and intentional means is also clearly
on the rise. Since nanoparticles can possess different chemical and physical properties when
compared with constituent bulk materials, a new approach for risk assessment that takes
into account the nanoscale nature of these materials is needed.
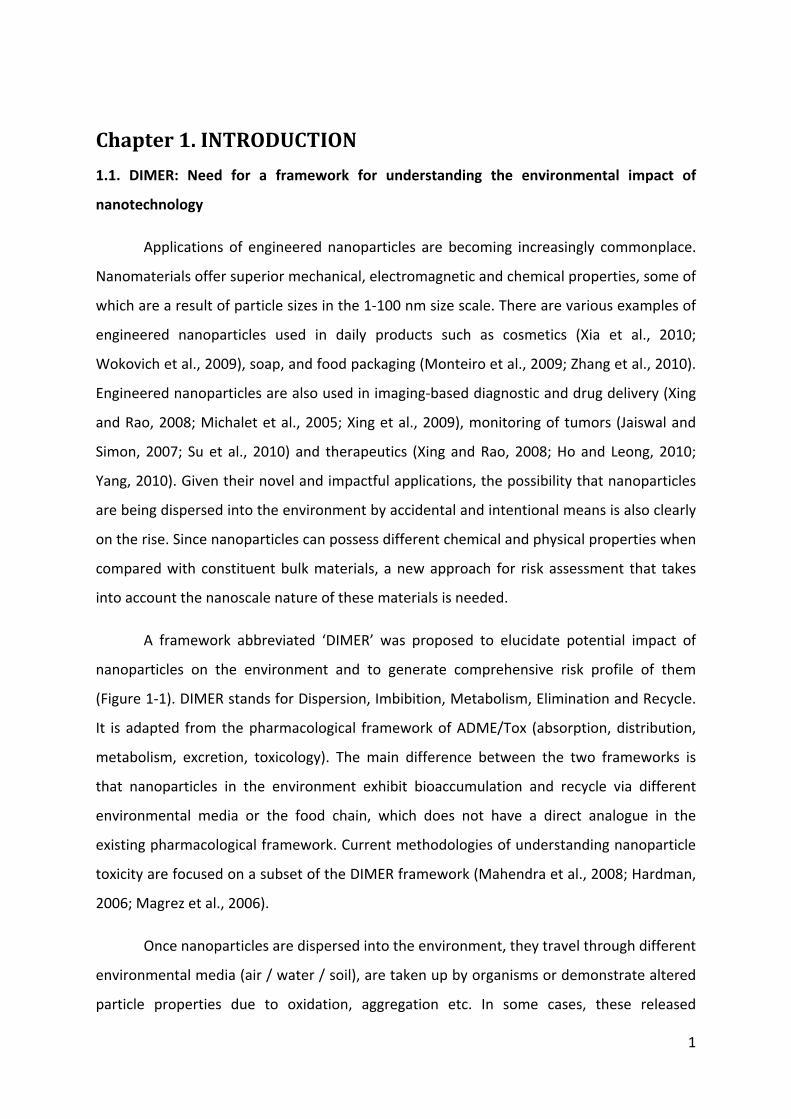
A framework abbreviated ‘DIMER’ was proposed to elucidate potential impact of
nanoparticles on the environment and to generate comprehensive risk profile of them
(Figure 1‐1). DIMER stands for Dispersion, Imbibition, Metabolism, Elimination and Recycle.
It is adapted from the pharmacological framework of ADME/Tox (absorption, distribution,
metabolism, excretion, toxicology). The main difference between the two frameworks is
that nanoparticles in the environment exhibit bioaccumulation and recycle via different
environmental media or the food chain, which does not have a direct analogue in the
existing pharmacological framework. Current methodologies of understanding nanoparticle
toxicity are focused on a subset of the DIMER framework (Mahendra et al., 2008; Hardman,
2006; Magrez et al., 2006).
Once nanoparticles are dispersed into the environment, they travel through different
environmental media (air / water / soil), are taken up by organisms or demonstrate altered
particle properties due to oxidation, aggregation etc. In some cases, these released
2
nanoparticles can be sequestered and removed from circulation, while in other cases, they
could redisperse into the environment in an intact or altered form. Thus, all phases of the
life cycle of nanoparticles should be considered in order to develop a comprehensive risk
profile (Oberdörster et al., 2005). While the DIMER framework provides a graph of the
potential paths taken by the nanoparticle through the environment, a suite of analytical
tools are required to fill in our gaps in knowledge in order to provide predictive analysis on
the potential paths a nanoparticle might take through the environment and the biosphere.
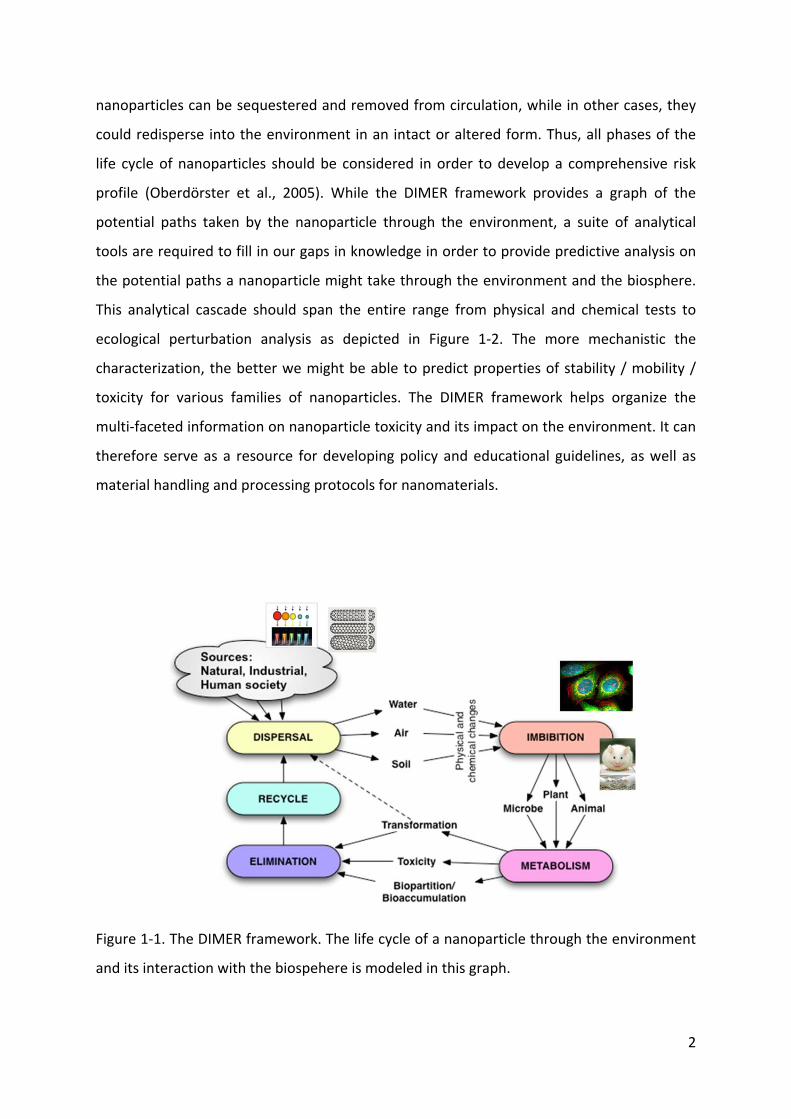
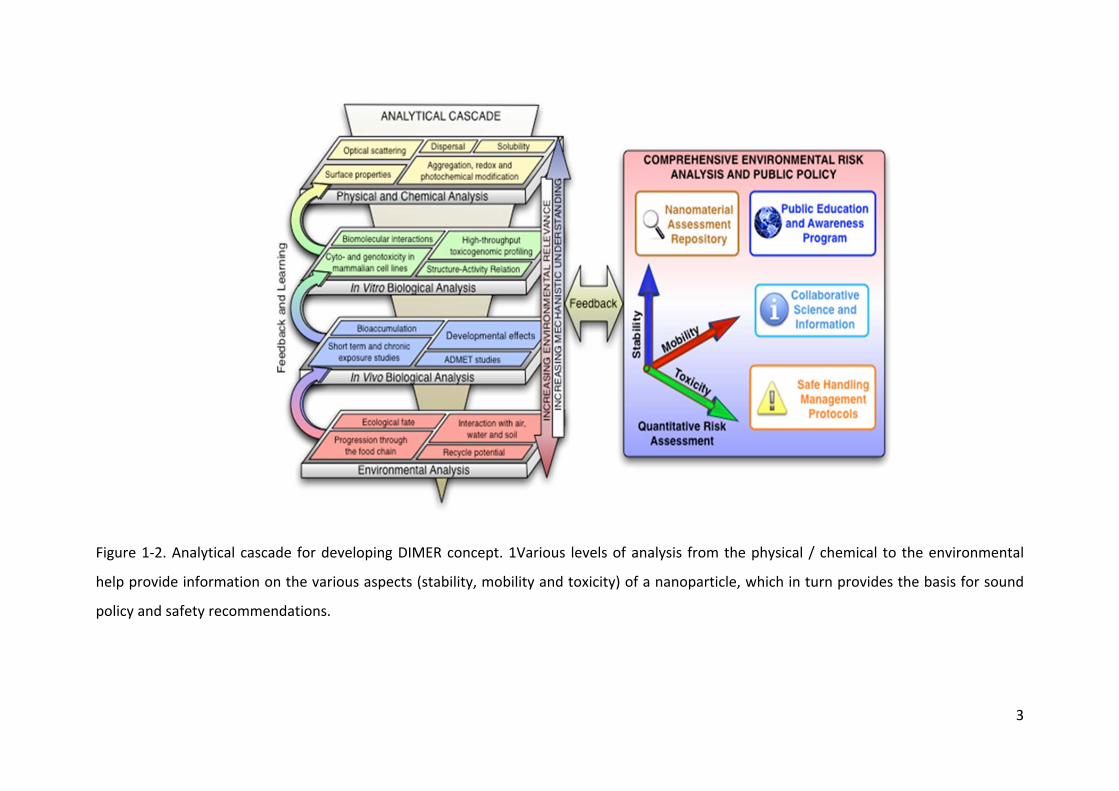
This analytical cascade should span the entire range from physical and chemical tests to
ecological perturbation analysis as depicted in Figure 1‐2. The more mechanistic the
characterization, the better we might be able to predict properties of stability / mobility /
toxicity for various families of nanoparticles. The DIMER framework helps organize the
multi‐faceted information on nanoparticle toxicity and its impact on the environment. It can
therefore serve as a resource for developing policy and educational guidelines, as well as
material handling and processing protocols for nanomaterials.
Figure 1‐1. The DIMER framework. The life cycle of a nanoparticle through the environment
and its interaction with the biospehere is modeled in this graph.
3
Figure 1‐2. Analytical cascade for developing DIMER concept. 1Various levels of analysis from the physical / chemical to the environmental
help provide information on the various aspects (stability, mobility and toxicity) of a nanoparticle, which in turn provides the basis for sound
policy and safety recommendations.
4
Dispersion, Elimination and Recycle
First and foremost aspect of environmental release of any engineered nanoparticle is
its mode of dispersion. Nanoparticles could be released in the process of manufacture,
usage, and disposal. Mueller and Nowack (2008) estimated that 500 t/a of nano silver, 350
t/a of carbon nanotubes and 5000 t/a of nano titanium dioxide were produced worldwide in
2007/2008. During the manufacturing process, they could be dispersed as aerosols or
manufacturing wastes. Blaser et al. (2008) proposed dispersion mechanisms for nano‐silver,
which is known to have antimicrobial activity and is used as a component of biocidal plastics
and textiles. Silver nanoparticles would be dispersed into environment while the plastics
and textiles discharge through untreated wastewater, treated wastewater and solid waste.
Another common example of nanoparticle dispersion is that of nanoparticulate
titania. Nano‐TiO2, with its high reflectivity and ability to scatter ultraviolet, is used in
cosmetics, especially sunscreen. Once the sunscreen is washed off, the majority of the
nanoparticles end up in the sewage. Thus nanoparticles, when used in high volumes, can
potentially travel through the aquatic, terrestrial or atmospheric routes. Moreover,
nanoparticles could move through food chain by accumulating in the organismal tissues. If
nanoparticles have long residence times in cells, they could affect higher level of organisms
in the food web.
Imbibition
Once nanoparticles are exposed to the environment, they can enter into the
ecosystem via several uptake routes depending upon the organism. Inhalation, transdermal
absorption and ingestion are the main pathways that nanoparticles enter into higher
organisms. Inhaled nanoparticles attack the respiratory tract and can translocate to other
organs. Aquatic organisms can take up nanoparticles via the gill epithelium or the digestive
tract. Zhang et al. (2006) showed that TiO2 nanoparticles are accumulated in the viscera and
gills of carp. 10 nm gold nanoparticles adsorbed on the cell wall of algae. As the algae are
consumed by clams, the nanoparticles penetrated clam’s gills and accumulated in the
digestive epithelia and damaged intracellular organelles (Renault et al., 2008). Similar
studies on nickel nanoparticles showed that they were localized within the digestive system
lumen in zebrafish embryo (Ispas et al., 2009).

5
It is generally difficult to determine whether low level organisms in the ecosystem
are more sensitive than higher level organisms or vice versa. Even when different types of
bacterial cultures are exposed to the same nanoparticle, the cultures showed differential
toxicities, indicating that the overall risk is a result of a combination of a variety of elements
and the environment. Comparing the gram positive B. subtilis and the gram negative E. coli,
E. coli is more resistant to the CdTe quantum dots but is more susceptible to SiO2, TiO2 and
ZnO (Dumas et al., 2009; Adams et al., 2006). On the other hand, different allotropes of
carbon are differentially toxic to a single organism. Carbon nanotubes exhibited more
hazardous effects than carbon black to mice (Lam et al., 2004). Similarly, Navarro et al.
(2008) observed that silver nanoparticles showed higher growth inhibition than same silver
concentration of AgNO3 on green algae, C. reinhardtii.
At the cellular level, nanoparticles cross the cell membrane via endocytosis. In this
process, the membrane extends and engulfs the particles, which cannot directly cross the
plasma membrane, to enter into the cells. The endocytosis may occur through lipid rafts as
well as cell membranes. This method of uptake is categorized as phagocytosis or pinocytosis.
The latter can be further sub‐divided into macropinocytosis, clathrin‐mediated endocytosis
and caveolae‐mediated endocytosis. Phagocytosis engulfs solid particles, whereas
pinocytosis makes vesicles of fluid. Macropinocytosis is a non‐specific form of endocytosis
and involves relatively large fluid vesicles (>1µm). Clathrin‐mediated and caveolae‐mediated
endocytosis are specific receptor‐mediated forms of endocytosis. Clathrin‐mediated
endocytosis which exists in all kinds of cell types has receptors in clathrin‐coated pits on
plasma membrane and forms engulfing vesicles size less than 120 nm. Caveolae‐mediated
endocytosis involves flask‐shaped invaginations in the plasma membrane and forms less
than 60 nm size of vesicles (Conner and Schmid, 2003). Endocytosis is a size‐ and surface
charge‐dependent process. Positively charged nanoparticles are more likely to vigorously
bind to the negatively charged cell surface moieties, and are therefore more likely to
translocate across the plasma membrane (Verma and Stellacci, 2010). ZnO anoparticles
were internalized by endocytosis and localization in vesicles of Euglena gracilis (Brayner et
al., 2010). Zhang and Monteiro‐Riviere (2009) observed that the carboxylic acid group of
quantum dots were first recognized by the lipid rafts. In contrast, cells absorb TiO2

6
nanoparticles by engulfing them via endosomes and localizing them in the lysosomes. In
some cases, they may also accumulate in the mitochondria (Braydich‐Stolle et al., 2009).
Metabolism
Cells undergo various toxic effects after uptake nanoparticles. A review paper of Nel
et al. (2006) describes the numerous perturbations on cells exposed to nanoparticles. These
include the generation of reactive oxygen species (ROS) and consequent oxidative stress,
mitochondrial perturbation (eg: energy failure, membrane damage…), inflammation, altered
cell cycle regulation, DNA damage and more.
1.2Caseforusingquantumdots(QDs)
Quantum dots are artificial atoms with a core‐shell structure. The core part consists
of cadmium, which is the frame element, along with another chemical, either selenium,
sulfur or tellurium. The CdSe (or CdTe / Cd/S) core is responsible for unique fluorescent
properties. By constraining the CdSe in a very small space, the quantum dot is often
represented as a material with zero dimensions. The constrained size has the effect of
limiting the energies that the electrons of CdSe composite may have. This leads to the
observed fluorescence properties. The fluorescent core is protected by an encasing shell,
which is usually composed of a zinc sulfide. The ZnS shell is frequently modified with various
functional coatings to achieve suitable surface properties of solubility or surface interaction.
In addition to modifying surface properties, functional groups protect quantum dots from
U/V light and limit degradation. The fluorescence emission wavelength can be tuned by
adjusting the size of the quantum dot core. With their high photostability, quantum yields
and tunable emission characteristics, quantum dots find broad applications in monitoring
and diagnostics. Well‐established areas of application include tumor imaging (Gao et al.,
2005; Bagalkot et al., 2007), as well as imaging intracellular properties and structure (Derfus
et al., 2004a; Sukhanova et al., 2004).
Their degradation of quantum dots and the release of their components under light
and high temperatures are well understood. There are several studies investigating the
temporal decay in the efficiency of optical properties using higher organisms (King‐Heiden

7
et al., 2009) and mammalian cells (Derfus et al., 2004b) as model cultures. For evaluating
toxicity, the released heavy metal components play a significant role following quantum dot
degradation. This toxicity might show synergistic effects combining heavy metal and
quantum dots, or toxic effects unique to nanomaterials. King‐Heiden et al. (2009) studied
quantum dots toxicity using zebrafish embryos, and found that their toxicity is similar to
cadmium toxicity, along with some toxicity that was unique to quantum dots. Toxicity
evaluation of quantum dots is generally more complex because of degradation. However,
since there is much information about heavy metal toxicity, separate toxicity studies on
nanomaterials serve to illuminate the differential aspects of nanomaterial toxicity when
compared with heavy metal toxicity.
Although many biological applications of quantum dots, such as imaging and drug
delivery using quantum dots, have been studied, their application has been extended to
include quantum computers and opto‐electronic devices (Coe et al., 2002; Press et al., 2008).
As more quantum dots applications appear on the market, and the probability of
environmental release correspondingly increases. It is therefore necessary to generate a
comprehensive risk profile of quantum dots and their ultimate fate in the environment, to
the degree it can be estimated.
1.3Caseforusingcyanobacteria
Cyanobacteria are prokaryotic, photosynthetic unicellular organisms living in
aqueous environments. They are also known as blue‐green algae. Cyanobacteria have
played a key role in the evolution of life on the planet, as they are regarded as a pioneer for
oxygenic photosynthesis and oxygen respiration (Herrero and Flores, 2008). In addition to
generating an oxygen‐rich environment 3500 million years ago, cyanobacteria are also
considered to be the precursors of green plants. Although the details of the evolution of an
eukaryotic organism are still being debated, endosymbiosis is a generally accepted
mechanism in eukaryotic evolution. Plant organelles such as chloroplasts are thought to
have originated as endosymbiotic cyanobacteria (Archibald, 2009; Okamoto and Inouye,
2005).

8
Along with evolutionary significance, cyanobacteria are also highly adaptable. It is
easy to find cyanobacteria regardless of environmental conditions. They live in extremely
hot and cold temperatures, salty conditions, and within a wide range of pH. Their high
tolerance for extremely harsh conditions might help their evolvability and provide a better
understanding of mechanisms for coping with environmental stresses (Hagemann, 2011;
Marin et al., 2006; Ozturk and Aslim, 2010; Pandhal et al., 2009; Tamoi et al., 2007).
Being primary photosynthetic producers, cyanobacteria form the foundation of an
aqueous ecosystem. They are at the bottom level of the food chain and can significantly
impact a given ecosystem. Cyanobacterial blooms can cover the surface of an aqueous
system and affect the quality of water, by preventing light to enter, depleting oxygen or the
producing odor. Some species can also produce toxic substances harmful to other aqueous
living things, which could induce die–offs of entire organisms, causing system‐wide
disruption of ecosystems (Saker et al., 2009).
Given their relevance to aqueous ecosystems and the sensitive dependence of
ecosystems on cyanobacteria, the following six points summarize the merits of choosing
cyanobacteria as a model for evaluating the environmental impact of nanoparticles:
1) They are prolific and form the food source for a number of aquatic species, which has
profound implications, due to bioaccumulation and biomagnification.
2) They are relatively easy to cultivate in a laboratory.
3) Tools for molecular genetics and bioinformatics exist, which can allow for analysis using
systems biology tools.
4) They are a potential candidate for deploying mitigation strategies for cleanup in aquatic
environments.
5) They serve to elucidate the mechanism of ingress of environmental contaminants into an
ecosystem in a realistic manner.
6) Their evolutionary relationship to cell organelles such as mitochondria and chloroplasts
might provide predictive insight into the impact of quantum dots on cellular organelles of
higher organisms.
9
1.4Objectivesofthepresentstudy
This study is mainly focused on understanding the toxicity of CdSe/ZnS nanoparticles
on a species of freshwater cyanobacterium. The study is framed using the DIMER concept,
which provides guidelines on interpreting the analytical results in the context of
environmental release. We study ecosystem integrity using the simplest organism,
cyanobacteria Synnechococcus elongatus PCC7942, as a result of an accidental dispersal of
nanoparticles especially quantum dots. Objectives of this study are as follows:
1) Characterizing water insoluble quantum dots and water soluble quantum dots before
dispersal into the model culture media. (Dispersion) Physical and chemical properties of
particles would determine the uptake mechanism and interaction with cyanobacteria. As
different types of nanoparticles would show different results, similar nanoparticle
composition with different surface properties are expected to show unique toxic effects.
2) Characterizing the uptake mechanism and distribution of quantum dots in cells.
(Imbibition) How nanoparticles enter into cells and how they are distributed among the
various compartments will be studied. This will elucidate the relationship between the
uptake and the fate of cells.
3) Characterizing the fate of cells exposed to quantum dots. (Imbibition / Metabolism) This
task seeks to understand the relationship between biodistribution within cells and the
resulting organism‐wide impact measured via growth rate and photosynthetic ability.
4) Characterizing media contamination. (Elimination / Recycle) If inorganic nanoparticles
produce a toxic response, lead to the death of the organism exposed to them, and are
subsequently re‐released into the environment, they can potentially accumulate and
continue to elicit such toxic responses in new organisms.
10
Chapter2.BACKGROUNDANDLITERATUREREVIEW
2.1Nanomaterial
Terminology and properties
The discipline of nanotechnology is built around the exploitation of materials, which
show unique physical properties at nanometer size scales, that are not normally observable
at larger scales. In 2005, International Organization for Standardization (ISO) established the
ISO TC229 for standardization in the field of nanotechnologies. It defines nanotechnologies
to include either or both of the following:
1) understanding and control of matter and processes at the
nanoscale, typically, but not exclusively, below 100 nanometres in
one or more dimensions where the onset of size‐dependent
phenomena usually enables novel applications,
2) utilizing the properties of nanoscale materials that differ
from the properties of individual atoms, molecules, and bulk matter,
to create improved materials, devices, and systems that exploit these
new properties.
Nanomaterials are defined as materials with any external dimension in the nanoscale
or having internal structure or surface structure in the nanoscale. They can be divided into
nano‐objects and nanostructured materials. Nano‐objects are materials with one, two or
three external dimensions in the nanoscale. Nano‐objects in turn are classified as
nanoplates, nanofibres, and nanoparticles by external dimension.
A quantum dot is defined by the European Standardization Committee and
International Organization for Standardization (CEN ISO/TS 27687) as crystalline
nanoparticle that exhibits size‐dependent properties. As particle sizes decrease, physical
phenomena resulting from weak forces such as van der Waal’s forces and electrodynamic
quantum effects become increasingly influential in the overall properties of the
nanomaterials. Quantum confinement of the electronic states appears and the energy band
gap becomes larger and discrete and resembles atoms. In the case of quantum dots
composed of a core and shell architecture, they have three‐dimension quantum
confinement (total confinement) and display the property of fluorescence. Different
11
fluorescence emission of quantum dots can be obtained by adjusting the size of quantum
dots. This property of fluorescence is not observed in the bulk materials.
Regulation for nonmaterial's
Nanotechnology and nanomaterials have productive applications in the areas of
energy, cosmetics, healthcare and agriculture. Among many types of nanomaterials, single‐
wall and multi‐wall carbon nanotubes were first regulated by the U.S. Environmental
Protection Agency (EPA) under Significant New Use Rules (SNURs). Not only EPA, but also
other regulation agencies such as U.S. Food and Drug Administration (FDA), Organization for
Economic Co‐operation and Development (OECD) and European Union (EU) are discussing
regulatory schemes for nanotechnology. To produce predictive information on nanoparticle
toxicity for the risk assessment and regulations, it is necessary to develop appropriate
experimental platforms to analyze physicochemical and environmental properties of
nanomaterials, which differ with bulk materials (Powers et al., 2006).
Properties of nanomaterials for risk evaluation
Size, shape, solubility, chemical composition and surface properties are important in
determining the toxicity of nanoparticles. Moreover, different synthetic process of
manufactured nanoparticles of same chemical composition showed different toxic effects
Tri‐n‐octylphosphine oxide (TOPO) or polyoxyethylene stearyl ether (Brij‐76) was used as
protective agents to control particle size and shape of nanoparticles during the synthesis.
ZnO nanoparticles with tri‐n‐octylphosphine oxide (TOPO) showed acute toxicity to Anabena
flos‐aquae than particles with polyoxyethylene stearyl ether (Brij‐76) (Brayner et al., 2010).
Also, properties of nanoparticles could be changed and particles may become toxic after
dispersion to the environment. For example, quantum dots could release toxic heavy metal
ions (such as Cd) upon exposure to U/V light or high temperature (Derfus et al., 2004a).
Size is one parameter of nanomaterials that determines the mechanism of entry,
deposition, translocation, and elimination of nanoparticles within an organism. Chemical
and biological reactivity with the cells is increased as size of particles decreases (Hildebrand
et al., 2009; Nutt et al., 2006). Typically, particles size below 20 to 30 nm change the
crystallography of the particle through the rearrangement of the surface atoms or crystal

12
lattice contraction to achieve a more stable energy state (Auffan et al., 2009). These
modifications can enhance the toxicity of particles to organism and environment. Chithrani
et al. (2006) demonstrated the influence of particles size on intracellular uptake rate. 50 nm
of gold nanoparticle showed maximum uptake rate than other sizes since the size seems
best suited for receptor‐mediated endocytosis. Moreover, the original particle size seems to
be as important as aggregate size in case of particles that aggregate. For instance, both 10
and 100 nm TiO2 particles aggregated to 1,800 nm aggregates, but the smaller particles
were more toxic to the cell (Braydich‐Stolle et al., 2009).
Surface properties including specific surface area, surface chemistry and surface
charge have to be characterized for risk assessment of nanomaterials. Physical and chemical
properties are governed by surface properties. For example, surface charge determines the
dispersion stability in solution and absorption rate at cells’ surface. Surface coating and
covalent surface modifications are exploited to improve biocompatibility. For example,
quantum dots without a functional coating are more vulnerable to U/V and oxidative
degradation. They are prone to degrade into their elemental constituents, chiefly Cd and Zn
The leached heavy metal from core is toxic to organisms (King‐Heiden et al., 2009; Derfus et
al., 2004b; Hauck et al., 2010). On the other hand, PEG coated quantum dots showed
reduced uptake by Daphnia magna and caused reduced inhibition of cell growth (Lewinski
et al., 2010). Surface properties also influence aggregation, which is also one of the
significantly important elements for toxicological evaluation of nanomaterials (Van Hoecke
et al., 2011; Gosens et al., 2010). Brunner et al. (2006) revealed that insoluble nanoparticles
significantly decrease cell activity and DNA content than hydrophilic nanoparticles.
2.2BiologyofCyanobacteria
Cyanobacteria are gram‐negative photosynthetic prokaryotes. They are widely
distributed around world, and inhabit every environment. Over than 3500 millions of years
old of cyanobacteria fossils have been found (Golubic and Seong‐Joo, 1999). They seem to
be evolutionarily related to chloroplasts in plants. They play an important role in the global
bio‐geo‐chemical cycle by fixing carbon and nitrogen from the environment.
13
Photosynthesis and nitrogen fixation in cyanobacteria
Cyanobacteria are called blue‐green algae because they contain the photosynthetic
pigments chlorophyll‐a and phycobilins. These pigments have characteristic optical
absorption and fluorescence properties. In the simple prokaryotes, photosynthesis occurs
directly in the cytoplasm, as opposed to in chloroplasts in higher photosynthetic organisms
such as algae and plants. Photosynthesis is carried out through a set of light‐dependent and
light‐independent reactions. In the light‐dependent phase, carbon dioxide, water and
sunlight are used as inputs to produce oxygen and energy, which is stored in the form of
sugars. This energy is used for the light‐independent process, the Calvin cycle.
The light‐dependent process utilizes two reactive complexes, called photosystem I
(PS I) and photosystem II (PS II), which is conserved in eukaryotic algae and in green plants.
The two photosystems are associated with the electron transfer chain and are embedded in
the thylakoid membranes of the cell. Phycobilins are the predominant energy collector in PS
II (denoted P680). Chlorophyll‐a is the predominant light absorbing pigments of PS I (P700).
Each photosystem consists of a reaction center and the respective pigment molecules. First,
the pigment molecules in P680 absorb a photon of the light and transfer it to an electron.
The electron in the photosystem II is supplied by splitting water to produce oxygen and
protons. The protons are pumped through ATPases in the thylakoid membrane to produce
ATP. The photon‐excited electrons are collected in the reaction center and transfer to P700
through electron transfer chain with loss of energy. When the electrons hit P700, they are
further exited by another proton. These high energy electrons pass through electron
transfer chain and effect redox reactions. NADP+ is reduced into NADPH. ATP and NADPH
are used to make glucose in the Calvin cycle.
Cyanobacteria are also capable of nitrogen fixation. They can reduce free
dinitrongen to ammonia via the nitrogenase enzyme. The fixed nitrogen is used for the
synthesis of amino acids and nucleotides. There are two ways to by which nitrogen fixation
is accomplished: organic and inorganic route. Proteins are broken down into amino acid via
the organic route, while nitrates are reduced to nitrite and further to ammonia by the
inorganic route. The process of reduction of nitrogen to ammonia requires 16 ATP as an
energy source and proceeds according to the following reaction:
14
N2 + 16 ATP + 8e‐ + 8H+ => 2NH3 + 16 ADP + 16 Pi + H2
Cyanobacteria can be divided into three groups: the filamentous cyanobacteria with
heterocysts (Anabaena, Anabaenopsis, Aulosira, Calothrix, Nostoc, etc…), the filamentous
cyanobacteria without heterocysts (Plectonema, Trichodesmium, Plectonema, etc…) and
unicellular cyanobacteria (Syneccochoccus, Cyanothece, Gloeocapsa, etc…). It was believed
that filamentous cyanobacteria with heterocysts were the only species that do the nitrogen
fixation. However, new studies have demonstrated that other groups of cyanobacteria can
also do the nitrogen fixation in an aerobic environment (Carr and Whitton, 1982).
Cyanobacteria without heterocysts and unicellular cyanobacteria also can fix nitrogen in
aerobic condition during photosynthesis. Syneccochoccus, one of the unicellular
cyanobacteria, is the example of an aerobic nitrogen fixing strain. Mitsui et al. (1986)
studied nitrogen fixation and photosynthesis in different phases of the cell cycle of
Syneccochoccus, and established that these two activities do not occur simultaneously. Cells
are more likely do photosynthesis when oxygen evolution activity is high. The decrease of
oxygen evolution activity induces the nitrogen fixation (Mitsui et al., 1986). Cyanothece is
also capable of nitrogen fixation as well as photosynthesis. Reddy showed that nitrogenase
of Cyanothece showed lower activity in the dark than in the light because of ATP generation.
Ion transport in cyanobacteria
Essential ions move in and out of cells by passive and active transfer processes.
Passive transfer results from the difference in electrochemical potential maintained by the
cell membrane. Passive diffusion of ions down a concentration gradient can occur across the
lipid‐bilayer membrane or through protein and ion channels. Active transfer is chemical
interaction with carrier molecule, which requires the energy from ATP hydrolysis, and
typically occurs against a concentration gradient. Additionally, ions have affinity with
surface of cells. The cell surface is negatively charged; positively charged metal ions
compete with other cations and replace them. Sulfhydryl group in the cell membrane can
interact with metal ions to form S‐metal‐S bridges (Vymazal, 1987).
Cyanobacteria have distinct surface layers, which have unique molecular functional
groups and metal binding properties. Yee et al. (2004) have shown that Calothrix, a
filamentous cyanobacterium, has heterogeneously distributed metal binding sites on its
15
surface. Proton‐active surface carboxyl, phosphoryl, hydroxyl, and amine functional groups
located on the cell wall and exopolymer sheath interact with metal ions (Yee et al., 2004).
Since this process is not ion‐specific, along with essential ions, toxic ions also enter into the
cell.
For resisting heavy metal ions toxicity, cyanobacteria possess heavy metal resistance
systems. Metallothionein (MT), phytochelatins (PC) and polyphosphate bodies can
sequester imbibed toxic metals. Metallothionein are low‐molecular‐weight, cysteine‐rich,
metal‐binding proteins. Metal ions are sequestered in metal thiolate clusters of
metallothionein. Metallothioneins are not only involved in detoxification of heave metals,
they also play a role in Zn2+ homeostasis. Fowler classifiedmetallothionein into three classes,
class I, class II and class III (Fowler et al., 1987). Class I is polypeptides with locations of
cysteine closely related to those in equine renal MT. Class II is polypeptides with locations of
cysteine only distantly related to those in equine renal MT. Class III metallothioneins are
atypical non‐translationally synthesized metal‐thiolate polypeptides (Turner and Robinson,
1995). The concentration of MT increases with the presence of heavy metal. PCs are
enzymatically synthesized cysteine‐rich peptides and structurally related to glutathione
(GSH; g‐Glu‐Cys‐Gly). They are active only in the presence of metal ions (Cobbett, 2000).
When heavy metal concentration is beyond detoxification limits, heavy metal ions
damage the photosystem. The fluorescence of photosynthetic pigment changes as a result
of the physiological stress (Dudkowiak et al., 2010). PS II seems to be more sensitive to
heavy metal ions than PS I. Mercury damages the PSII reaction center and electron transfer
chain (Lu et al., 2000). Sas et al. have shown that Cd also affects the transport electron chain
of photosystem in Synechocystis and inhibit the activity of photosynthesis (Sas et al., 2006).
In addition to the damage to the photosystem, toxic effects can also be observed in the
morphology and ultrastructure of the cells. Rachlin studied morphological change of
Anabaena flos‐aquae and Anabaena variabilis after exposing the cultures to Zn in
concentrations in excess of that required for the cells. With the increase in Zn concentration,
both cells showed increased thylakoids and lipid bodies per cell (Rachlin et al., 1985).
Spirulina platensis also showed similar results, but their thylakoid membranes were
disorganized and had large intrathylakoidal spaces along with an increase in polyphosphate
bodies after exposed to cadmium (Rangsayatorn et al., 2002). Phosphate, lipids, and

16
proteins bind positively charged heavy metal ions by electrostatic interaction (Vymazal,
1987). Additional studies by Surosz and Palinska (2004) show that the number and size of
phosphate granules increase as the concentration of heavy metal ions increase. Rachlin et al.
(1984) also reported that cadmium leads to an increase in the volume of polyhedral bodies,
polyphosphate bodies, lipid inclusions, cyanophycin granules and membrane‐limited
crystalline inclusions in Anabaena flos‐aquae.

17
Chapter3.EXPERIMENTALMETHOD
3.1Visualizationofnanoparticles
Before exposing quantum dots to cells, size and fluorescence of quantum dots were
characterized. Transmission electron microcopy (TEM) was used for size determination. No
sample preparation was needed for TEM. Quantum dots were directly embedded on the
grid and dried before measuring size. Fluorescence was measured to determine
fluorescence changes before and after exposure to the culture.
3.2Cellsexposedtotreatmentsandcontrols
Cell culture media (BG‐11 media)
The trace metal mix consists of 2.86 g H3BO3, 1.81 g MnCl2∙4H2O, 0.222 g ZnSO4∙7H2O,
0.39 g NaMoO4∙2H2O, 0.079 g CuSO4∙5H2O, 49.4 mg Co(NO3)2∙6H2O with distilled water
added to make up a total volume of 1 l. 1636.7 mg of BG‐11 powder was purchased from
Fluka (St. Louis, MO) and 1 ml of trace metal mix is added together in distilled water and
adjusted in total volume of media as 1 l. The pH was adjusted at 7 using NaOH or H2SO4 and
is crucial to obtain a desirable growth rate. Lastly, the media was autoclaved at 121°C for 15
m for sterilization.
Growth condition and culture preparation
Synnechococcus elongatus PCC 7942 (Se7942) culture was kindly provided by
Professor Susan Golden of the University of California at San Diego. All the cultures were
grown on an orbital shaker at 160 rpm, setting the temperature at 30 °C, with light intensity
at 3000 lux as measured with a Davis light meter (Vernon Hills, IL). A master culture was
prepared first either from freezer stock or a plated culture in BG‐11 media. When the
culture reached an optical density (OD) at 730 nm of 0.45, the master culture was readied
for sub‐culturing for further experimentation.
For every experiment, three replications of subcultures were prepared. 10 ml of
master culture were added to 250 ml of fresh BG‐11 media in 500 ml flasks, under growth
18
conditions. After samples reached OD730 of 0.1, subcultures were divided 25 ml each to 125
ml flasks without dilution for various treatments and controls.
The culture used for every experiment was prepared with the same method, as
indicated above.
Various treatments and controls
Water insoluble quantum dots (WIQD): A core and shell structure of 5 mg/ml water‐
insoluble CdSe/ZnS quantum dots (WIQD) was obtained from Aldrich (St. Louis, MO), Cat.
#694630. A hexadecylamine (HDA) ligand coating surface treatment was used for
stabilization, and dots were dissolved in an organic solvent, toluene. The particle size is 3.4
nm and has a maximum excitation of 545 nm and emission at 560 nm, as indicated in
company specifications. 4 mg/ml and 1 mg/ml of diluted quantum dots were prepared using
toluene. Each concentration of WIQD was used to make 20 µg/ml (20 ppm) and 5 µg/ml (5
ppm), respectively, by adding 125 µl of each WIQD to 25 ml Se7942 culture.
Water soluble quantum dots (WSQD): A functional coating could prevent
degradation and might have a different uptake mechanism. To verify the role of the
functional coating, a carboxylic acid group with functionalized CdSe/ZnS quantum dots
(WSQD) was obtained from Ocean Nanotech (Springdale, AR.), Cat. #QSH‐580‐04. It has a
maximum emission of 580 nm with 4 nm particles size, as observed by TEM. 4 mg/ml of
initial concentration of WSQD, which was diluted to 1 mg/ml to make a final concentration
of 5 µg/ml (5 ppm) by adding 125 µl of 1 mg/ml diluted WSQD to Se7942 culture.
Cadmium control: Cadmium chloride CdCl2 was obtained from Aldrich (St. Louis, MO)
to differentiate the toxic effects of quantum dots and cadmium, which could be released
following degradation. To make the same final concentration of cadmium with 20 ppm
WIQD, inductively coupled plasma mass spectrometry (ICP‐MS) was used to analyze the
cadmium concentration in 20 ppm of WIQD culture media and arrive at the result that a 5
ppm cadmium concentration was in the 20 ppm WIQD. 125 µl of 1.63 mg/ml CdCl2 were
added to the 25 ml culture to make a final cadmium concentration of 5 ppm, equal to a Cd
concentration of 20 ppm WIQDs.

19
Toluene controls (20 ppm and 5 ppm WIQD controls): To demonstrate whether the
amounts of toluene used as solvent to disperse WIQDs is harmful to cultures, cultures were
also exposed to the same amounts of toluene for dissolving WIQDs. 25 µl of toluene was
used for 20 ppm WIQDs and 100 µl of toluene was used for 5 ppm WIQDs. 125 µl of WIQDs
was added to the culture regardless of the final concentration, which means 5 ppm WIQDs
used more toluene to dissolve than that of 20 ppm WIQDs.
Cadmium‐Toluene controls: Not solely cadmium, but both cadmium and toluene
could create a synergetic toxic effect. Both 100 µl of 2.04 mg/ml CdCl2 and 25 µl toluene,
which corresponds, to the Cd and toluene concentrations in the 20 ppm WIQD treatment,
were added to the culture for a control setting.
3.3Fateofquantumdotsincyanobacteria
Spectroscopic characterization
Optical density at 730 nm was measured as an indication of growth, and
fluorescence scans from 350 nm to 600 nm for excitation range and 400 nm to 700 nm for
emissions were measured for characterizing auto‐fluorescence. A Tecan Infinite M200
spectrophotometer (Männedorf, Switzerland) was used for both optical density and
fluorescence readings of samples at 6, 12, 18, 24, 36, 48, 60, 72 and 96 h after exposure to
various treatments and controls.
Cell viability assay
SYTOX® Green assay consists of a dye that only penetrates plasma membrane of
damaged or dead cells and attaches itself to the nucleic acid. It can be used for both gram‐
positive and gram‐negative bacteria. The dye adhering to the nucleic acid after incubation
emits fluorescence with excitation at 488 nm and emission at 530 nm. Flow cytometry or
fluorescence spectroscopy is used for characterizing a cell population with this assay.
Cell membrane integrity is one way of determining cell viability. To conduct a live
and dead cell assay, the commercial SYTOX® Green nucleic acid stain obtained from
Molecular Probes, Inc. (Eugene, OR), Cat. #S7020, was used. To characterize the stain that
20
enters into damaged plasma membranes and chelates nucleic acids, emission at 530 nm
with a 470 nm excitation source was used. 5 mM of SYTOX® Green was diluted to 0.25 mM
using dimethyl sulfoxide (DMSO) and 0.4 μl of diluted stain was added to 200 μl of culture
placed in a 96 well plate to make a final concentration of SYTOX® Green as 0.5 μM. Then,
samples were incubated 10 m on an orbital shaker equipped in a fluorescence spectrometer
to enhance the maximum reaction.
Solid media cultures
Solid media is also one way to determine cell viability reinforcing the result of a
SYTOX® Green assay. To make a liquid BG‐11 media into a solid, 12.0 g Bacto™ agar was
mixed with 1636.7 mg BG‐11 powder and 1 ml trace metal, to make a final volume of 1 l
with distilled water. After adjusting a pH of 7.0 using NaOH or H2SO4, sterilization of media
by autoclaving at 121 °C for 15 m was followed. Solidifying the BG‐11 agar media in culture
plates, 50 µl of samples 6, 12, 24 and 36 h after treatments were plated and kept at 30 °C,
3000 lux light intensity.
Does‐response relationship
To find a certain minimum inhibitory concentration (MIC) of leaked cadmium below
which there exists no significant toxicity to a cyanobacterial culture, cells were exposed to
various concentration of cadmium. 1.63 mg/ml CdCl2, the concentration used for cadmium
control, was diluted by two‐fold series dilution (1:2, 1:4, 1:8, 1:16, 1:32). 125 µl of each
diluted solution was added to the 25 ml fresh culture as prepared by the same method as in
the other experiments making a final cadmium concentration of 2.5 ppm, 1.25 ppm, 0.625
ppm, 0.312 ppm and 0.156 ppm. Every 24 hr, the growth and membrane integrity of cells
were investigated.
Fluorescence flow cytometry
Flow cytometry is the technique for analyzing particles and cells in size of 0.2–150
µm using the principles of light scattering. When light of laser hit the particle or cells, it is
scattering or diffracting in all angles. Magnitude of light scattered to forward is proportional
to size of cells. Laser scattered by hitting cell granularity is called side scattering and
determine cell granularity or internal complexity. It measures particle’s relative size, relative
21
granularity or structural complexity, and relative fluorescence intensity. Cells are
transported through a laminar stream across a laser source. The scatter from a passing cell
is captured on a detector, optionally with the fluorescence from the cell. The fluidic system
is structured so that only one cell passes through the laser beam at a time. The cell’s
membrane, nucleus and complexity of cell affect to the lighter scatter.
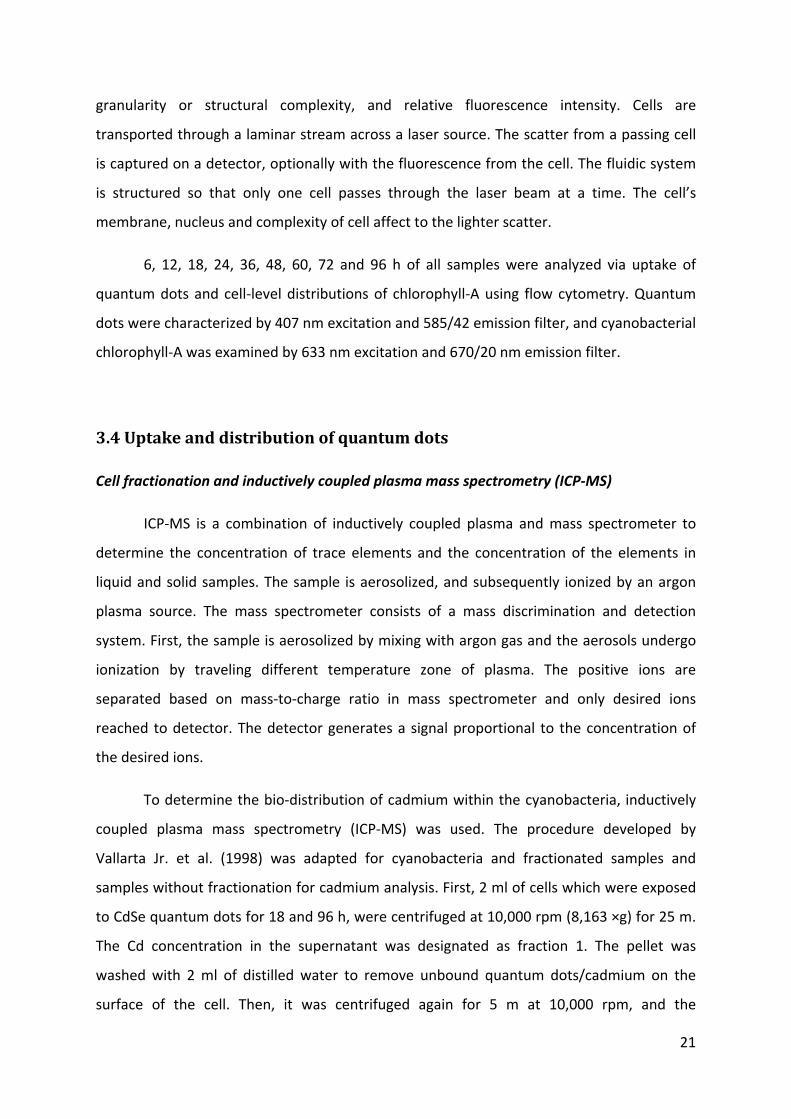
6, 12, 18, 24, 36, 48, 60, 72 and 96 h of all samples were analyzed via uptake of
quantum dots and cell‐level distributions of chlorophyll‐A using flow cytometry. Quantum
dots were characterized by 407 nm excitation and 585/42 emission filter, and cyanobacterial
chlorophyll‐A was examined by 633 nm excitation and 670/20 nm emission filter.
3.4Uptakeanddistributionofquantumdots
Cell fractionation and inductively coupled plasma mass spectrometry (ICP‐MS)
ICP‐MS is a combination of inductively coupled plasma and mass spectrometer to
determine the concentration of trace elements and the concentration of the elements in
liquid and solid samples. The sample is aerosolized, and subsequently ionized by an argon
plasma source. The mass spectrometer consists of a mass discrimination and detection
system. First, the sample is aerosolized by mixing with argon gas and the aerosols undergo
ionization by traveling different temperature zone of plasma. The positive ions are
separated based on mass‐to‐charge ratio in mass spectrometer and only desired ions
reached to detector. The detector generates a signal proportional to the concentration of
the desired ions.
To determine the bio‐distribution of cadmium within the cyanobacteria, inductively
coupled plasma mass spectrometry (ICP‐MS) was used. The procedure developed by
Vallarta Jr. et al. (1998) was adapted for cyanobacteria and fractionated samples and
samples without fractionation for cadmium analysis. First, 2 ml of cells which were exposed
to CdSe quantum dots for 18 and 96 h, were centrifuged at 10,000 rpm (8,163 ×g) for 25 m.
The Cd concentration in the supernatant was designated as fraction 1. The pellet was
washed with 2 ml of distilled water to remove unbound quantum dots/cadmium on the
surface of the cell. Then, it was centrifuged again for 5 m at 10,000 rpm, and the
22
supernatant of solution was called fraction 2. Fraction 1 and 2 were pooled together to
analyze the cadmium concentration of the media. The washed pellet was re‐suspended in 2
ml of 0.01 M ethylenediaminetetraacetic acid (EDTA) to remove cadmium bounded to the
cell membrane and centrifuged at 10,000 rpm for 25 m. Supernatant from the
centrifugation operation was called fraction 3, indicating Cd content in the cell membrane.
The pellet was digested with 2 ml of a lysis buffer containing 50 mM Tris‐HCl (pH 7.8), 0.3
mM MgSO4, 0.1 mM EDTA and sonicated for 5 pulses of 30 s with 75% power using a needle
sonicator Model XL‐2000 from Qsonica, LLC (Newtown, CT). The supernatant from
centrifuging at 10,000 rpm for 25 m was collected as fraction 4, which corresponds to the
intracellular Cd content. Unfractionated sample preparation was the same with the
fractionated sample, but pools all of the fractions and cell debris in the tube. The difference
between the Cd concentration of unfractionated and fractionated is the amount of Cd level
in the cell debris.
Laser scanning confocal microscopy
Confocal microscopy was developed to overcome the drawback of optical
fluorescence microscopy that produces blurry images. To create a high‐resolution image by
removing out‐of‐focus parts of an image, a pinhole is used to only pass in‐focus light
emission from a sample. By computationally combining a stack of in‐plane 2D images, it is
possible to reconstruct a three‐dimensional image of the visualized object.
The brief mapping about the location of quantum dots and auto‐fluorescence of
cyanobacteria can be obtained by using a laser scanning confocal microscope from Leica
Microsystems (Bannockburn, IL), Cat. #TCS SP2 RBB. 6 and 18 hr samples were mounted in a
2 % low melt agarose made with distilled water. TD 488/543/633 was used as a dichroic
beamsplitter, and a 514nm Ar/HeNe laser was set at 90% power for excitation of both
quantum dots and cholorophyll‐A. The quantum dot emissions were measured from 580 to
600 nm (green channel) and the chlorophyll was auto‐fluoresced at 660 to 680 nm (red
channel). An image processing software program (ImageJ, http://rsbweb.nih.gov/ij/) was
used to superimpose the false‐color 2D image series and reconstruct 3D images.

23
Sample preparation for transmission electron microscopy (TEM)
An electron microscopy can provide visual information about structure, morphology
and composition of biological materials and nanomaterials. Transmission electron
microscopy (TEM) is used to measure the size of a nanoparticle and to visualize intracellular
structures. Organism samples need varying degrees of preparation to preserve cell structure.
Biological sample preparation is composed of processing, embedding and polymerization.
24 h treatment samples of WSQD and Cd were prepared for transmission electron
microscopy according to the following procedure (Miller, 1982). Cell morphology was
preserved using a microwave‐based method as a primary fixation procedure. Samples were
centrifuged at 4000 rpm with a micro centrifuge, Fisher Scientific (Pittsburgh, PA), Cat# 59A.
Most of the supernatant was removed until it barely covered the samples. Samples were
placed on ice for 30 s and microwaved at 90 s on, 20 s off and 9 sec on and again, placed on
ice at 20 s. This process was repeated four times. To remove liquid from the samples, a
cacodylate buffer (42.80 g Sodium Caqcodylate in 1000 Lwater) was used for washing. The
washing step was repeated four times. For secondary fixation, 2 % (aq) OsO4 was added,
enough to cover samples. Samples were placed on ice for 20 to 30 s and moved to a fresh
water bath and microwaved twice for 9 s on, 20 s off, and 9 s on. Placing samples on ice and
microwave steps were repeated five times for 5 m each. Then, they were incubated 5 m at
room temperature. 3 % (aq) of KCN was added to samples with an equal volume of OsO4
added and incubated; samples were then rotated for 15 m without microwaving, followed
by three repeated washings using purified water. After removal all water from samples, a
filtered saturated uranyl acetate was added and microwaved for 9 s on, 20 s off and 9 s on,
without chilling. Samples were covered and incubated for 30 m with rotation. The next step
was dehydration. 10, 25, 50, 75, 95, 100 % of ethanol, a 1:1 mixture of 100 ethanol and
acetonitrile, and pure acetonitrile were incubated, with 8 m of each. Infiltration has three
sub‐steps, a 1:1 mixture of acetonitrile and epoxy, 1:3 mixtures of acetonitrile and pure
epoxy, and, finally, pure epoxy. Before adding new chemicals, chemicals in samples were
removed. The first and second sub‐steps had the same procedure. After adding mixtures,
samples were vortexed and microwaved for 20 s and vortexed and incubated on the rotator
for 10 m. Each of the sub‐steps was repeated twice. For last sub‐step, epoxy on the samples
was removed and pure epoxy was added. Vortexing, microwaving for 30 s, vortexing, and
24
incubating on the rotator for 30 m all followed. Samples were replaced with fresh epoxy and
incubated overnight. Finally, embedding and polymerizing were carried out. Mold was
labeled and the tips filled with a drop of epoxy were prepared. Cultures were laid out to
drain off and evaporate chemicals, but not with the intention for the culture to dry out.
Samples were placed into the drop in the bottom of the mold well. The mold was filled with
pure epoxy and placed in a Histodryer set at 85 °C, overnight. The next morning the blocks
were cooled at room temperature before removing them from the molds. Images of cells
were taken using TEM films and scanned by a DuoScan Scanner (AGFA Company).
3.5Mediacontamination
Persistence assay
Fresh new samples of a 20 ppm WIQD treatment and cadmium‐control and Se7942
were prepared. Waiting for cells death takes approximate two days, and then each culture
was centrifuged at 4000 rpm for 10 m and separated into supernatant and pellet categories.
To test cell viability, pellets from WIQD treated sample were mixed with 25 ml of new fresh
BG‐11 media, and pellets from the cadmium‐treated sample were added to 25 ml of new
BG‐11 media. To test media contamination and its effect on new cells, pellets from fresh
new health Se7942 were exposed to a supernatant of WIQD‐treated culture and of
cadmium‐controlled culture, respectively. After all the combinations of damaged cells with
fresh culture media and contaminated media with fresh culture pellets were applied, they
were grown at 30 °C, 3000 lux of light intensity and shook at 160 rpm. Only OD at 730 nm
was measured every 24 h.
25
Chapter4.RESULTANDDISCUSSION
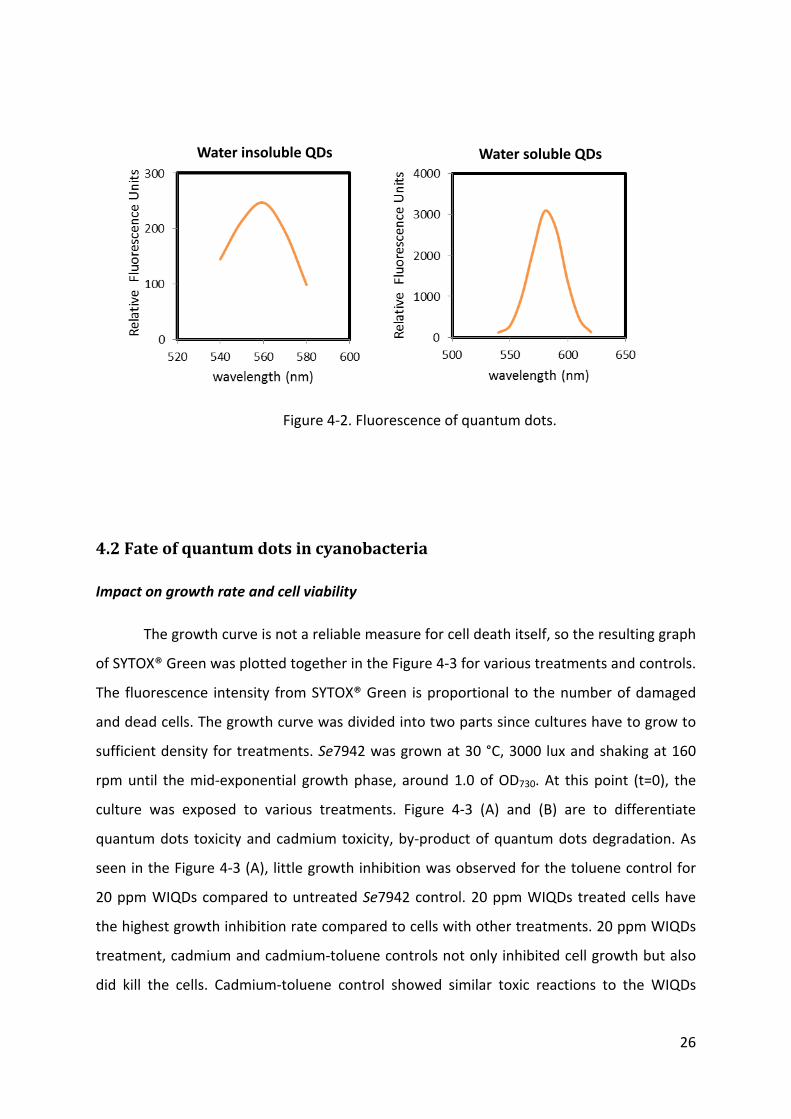
4.1Characterizationofquantumdots
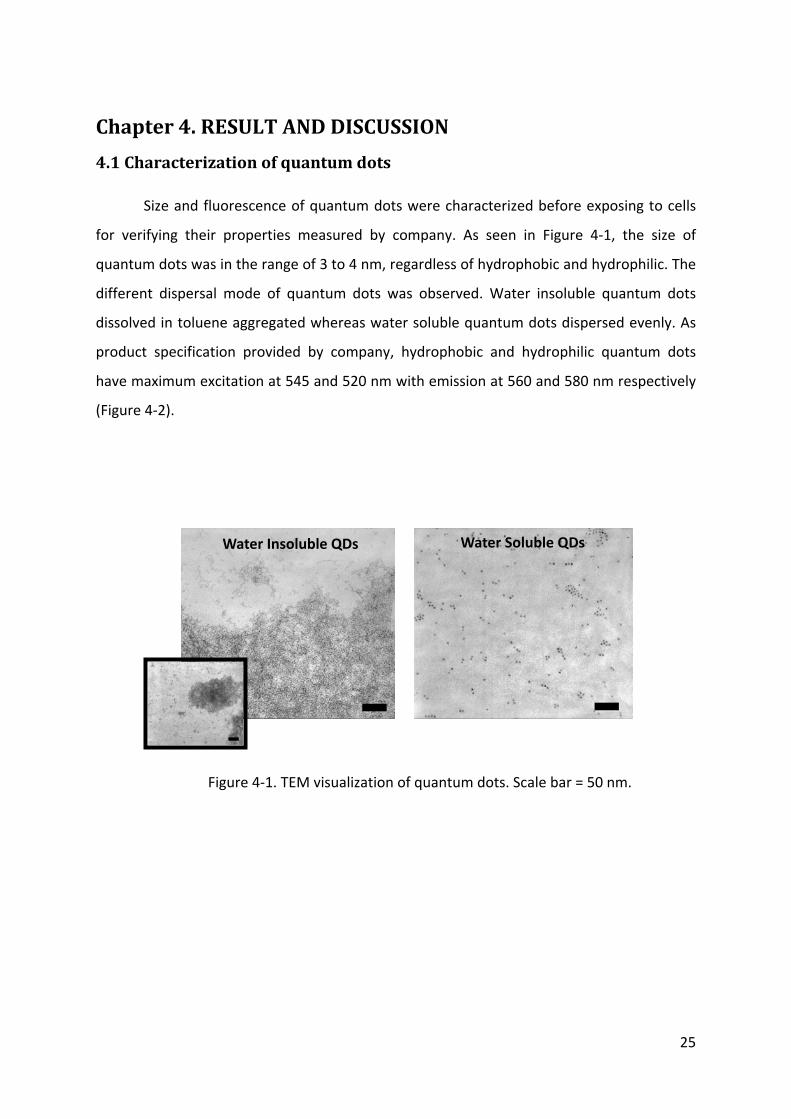
Size and fluorescence of quantum dots were characterized before exposing to cells
for verifying their properties measured by company. As seen in Figure 4‐1, the size of
quantum dots was in the range of 3 to 4 nm, regardless of hydrophobic and hydrophilic. The
different dispersal mode of quantum dots was observed. Water insoluble quantum dots
dissolved in toluene aggregated whereas water soluble quantum dots dispersed evenly. As
product specification provided by company, hydrophobic and hydrophilic quantum dots
have maximum excitation at 545 and 520 nm with emission at 560 and 580 nm respectively
(Figure 4‐2).
Figure 4‐1. TEM visualization of quantum dots. Scale bar = 50 nm.
Water Soluble QDs Water Insoluble QDs
26
Figure 4‐2. Fluorescence of quantum dots.
4.2Fateofquantumdotsincyanobacteria
Impact on growth rate and cell viability
The growth curve is not a reliable measure for cell death itself, so the resulting graph
of SYTOX® Green was plotted together in the Figure 4‐3 for various treatments and controls.
The fluorescence intensity from SYTOX® Green is proportional to the number of damaged
and dead cells. The growth curve was divided into two parts since cultures have to grow to
sufficient density for treatments. Se7942 was grown at 30 °C, 3000 lux and shaking at 160
rpm until the mid‐exponential growth phase, around 1.0 of OD730. At this point (t=0), the
culture was exposed to various treatments. Figure 4‐3 (A) and (B) are to differentiate
quantum dots toxicity and cadmium toxicity, by‐product of quantum dots degradation. As
seen in the Figure 4‐3 (A), little growth inhibition was observed for the toluene control for
20 ppm WIQDs compared to untreated Se7942 control. 20 ppm WIQDs treated cells have
the highest growth inhibition rate compared to cells with other treatments. 20 ppm WIQDs
treatment, cadmium and cadmium‐toluene controls not only inhibited cell growth but also
did kill the cells. Cadmium‐toluene control showed similar toxic reactions to the WIQDs
Water insoluble QDs Water soluble QDs
27
treatments which was a more acute inhibition than cadmium itself. In Figure 4‐3 (B), trends
of SYTOX® Green assay are corresponding to growth rate. Toluene control seemed to have
almost no effect on destabilizing the membrane compared to Se7942 control. Numerous
cells treated to 20 ppm WIQDs were dying within 6 h exposure and showed the highest
membrane destabilization kinetics. Even cadmium‐toluene control showed lower cell
membrane destabilization than WIQDs treatment, it seemed that combination of toluene
and cadmium showed summative effect to the growth inhibition. Figure 4‐3 (C) and (D) are
to elucidating the effect of factional coating on quantum dots toxicity. The growth inhibition
and cell membrane damage results for 5 ppm WIQDs treated cells were similar to 20 ppm
WIQDs treated cells. The carboxylic acid group of 5 ppm WSQDs had no toxic effects on the
cells, which was the opposite result of the same concentration of 5 ppm hydrophobic
quantum dots or similar toluene levels (Figure 4‐3 (C)). Hydrophilic quantum dots did not
seem to have any effect on the cell membrane and remained alive while 5 ppm hydrophobic
quantum dots and toluene both showed cell membrane damage. Note that the amount of
toluene in toluene control for 5 ppm WIQDs is four times larger than that in toluene control
for 20 ppm WIQDs (Figure 4‐3 (D)).
To reinforce the membrane damage results of SYTOX® Green assay, 6, 12 24, 36 h
post exposure cells with various treatments and controls were plated on solid media and
their growth on plates are shown in Figure 4‐4. Even though cultures remain their original
color (Figure 4‐6), no cell growth on plates was observed for 6 hr exposure cells treated with
WIQDs and cadmium‐toluene. Cadmium treated cells have longer lifetime than WIQDs and
cadmium‐toluene control, which stopped growing after 12 h exposure. Thus, Figures 4‐3 and
4‐4 both demonstrated cell membrane damage after treated with WIQD and cadmium and
decreased cell growth as a result of cell death.
Since cadmium and WIQDs showed similar cell growth inhibition rate and viability at
both 20 ppm and 5 ppm, it was assumed that the threshold for cadmium toxicity was far
lower than what the cells were treated with. To determine the threshold cadmium
concentration, cell cultures were subjected to decreasing cadmium concentrations. From
the growth inhibition assay, the threshold of cadmium concentration was determined to be
between 0.313 ppm (1:16 dilution) and 0.156 ppm (1:32 dilution) which was 10 times
smaller than concentration of cadmium control (Figure 4‐5).

28
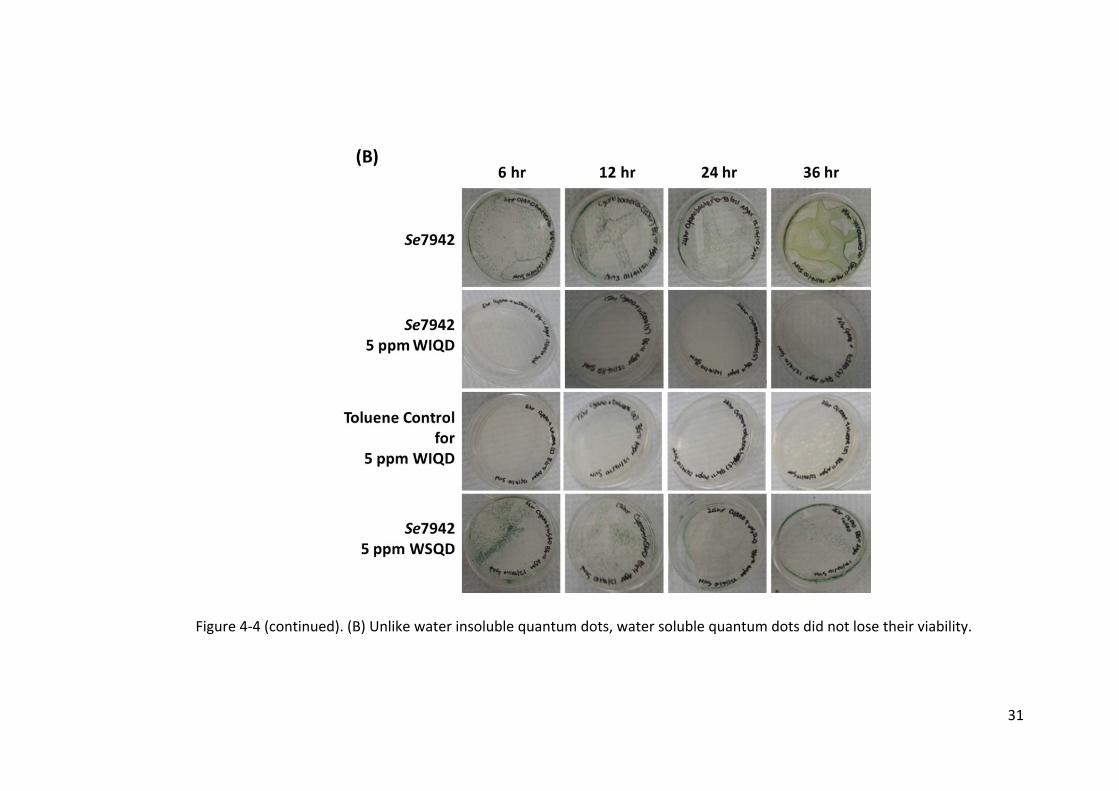
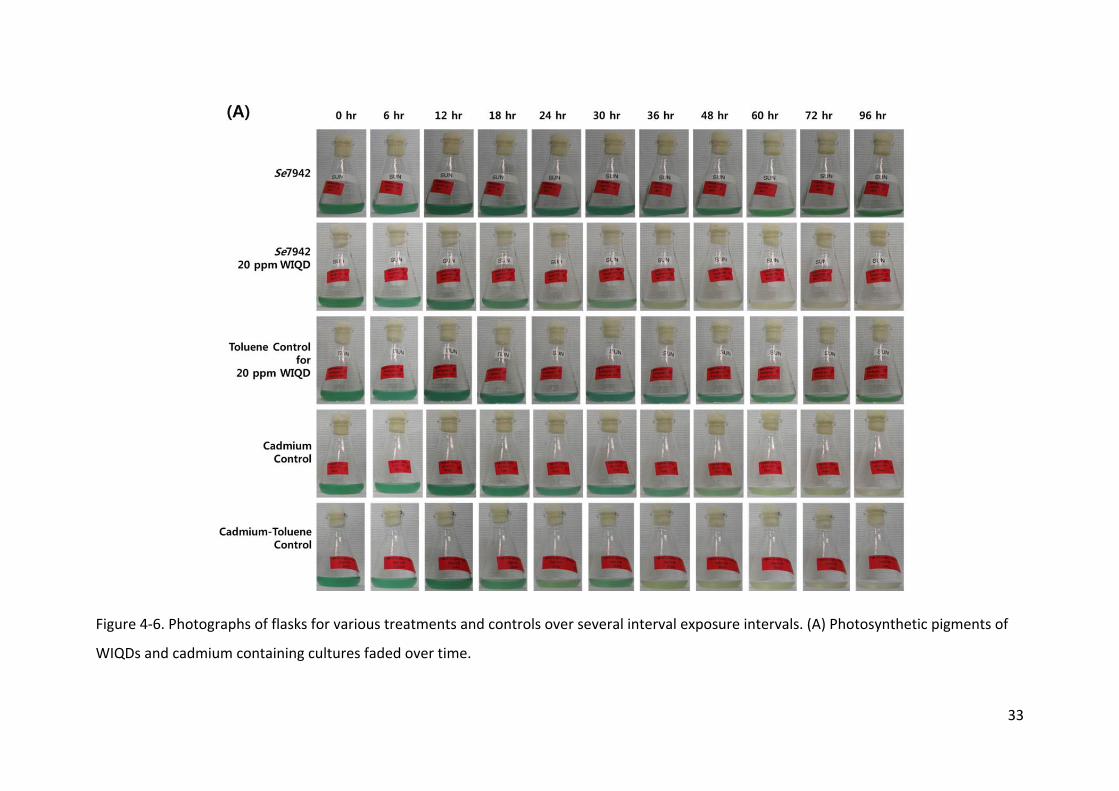
Photographs of culture flasks were taken to observe the color change of cultures
exposed to various treatments and controls over several time intervals (Figure 4‐6). We
observed that photosynthetic pigments faded over time and shifted towards cyan in color.
This might be due to the fact that different pigments have their own degradation rate or
that each pigment possesses different adaptive responses to stress (Prasad et al., 1991).
WIQD treatment and cadmium‐toluene control lost their color completely after 36 h
exposure.

29
Figure 4‐3. Growth rate and cell viability of Se7942 with various treatments and controls. Untreated Se7942 control () Se7942 + 20 ppm
WIQD () Toluene control for 20 ppm WIQD () Cadmium control () Cadmium‐Toluene control () Se7942 + 5 ppm WIQD () Toluene
control for 5 ppm WIQD () Se7942 + 5 ppm WSQD ().

30
Figure 4‐4. Photographs of solid culture plates for various treatments and controls. (A) The results were similar to the SYTOX assay; water
insoluble quantum dots had the lowest cell viability than other samples. Even with 6 h exposure, water insoluble quantum dots lost their
viability while the cadmium control lost their viability after 12 h exposure.
31
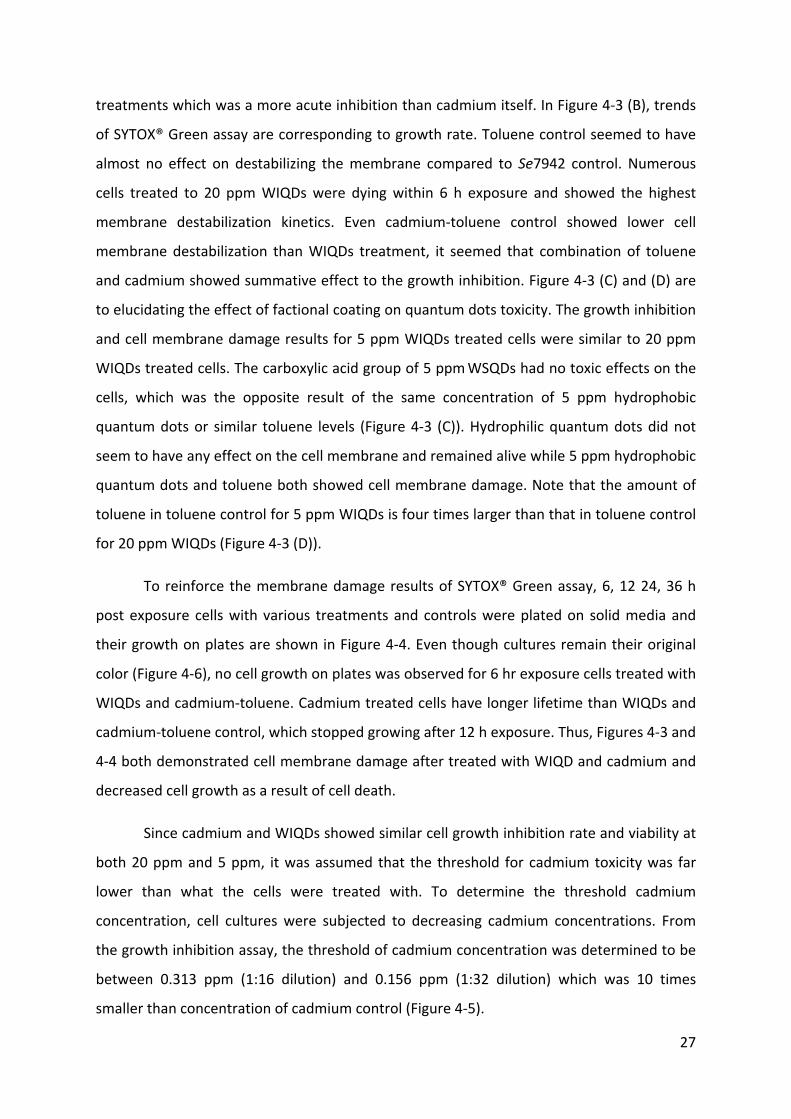
Figure 4‐4 (continued). (B) Unlike water insoluble quantum dots, water soluble quantum dots did not lose their viability.

32
Figure 4‐5. Dose‐response relationship. Untreated Se7942 control () 2.5 ppm Cadmium (1:2 dilution) () 1.25 ppm Cadmium (1:4 dilution)
() 0.625 ppm Cadmium (1:8 dilution) () 0.313 ppm Cadmium (1:16 dilution) () 0.156 ppm Cadmium (1:32 dilution ().
33
Figure 4‐6. Photographs of flasks for various treatments and controls over several interval exposure intervals. (A) Photosynthetic pigments of
WIQDs and cadmium containing cultures faded over time.

34
Figure 4‐6 (continued). (B) Toluene control culture changed their color toward cyan. Cells treated WSQDs were observed to have similar color
as cells with no treatment.
35
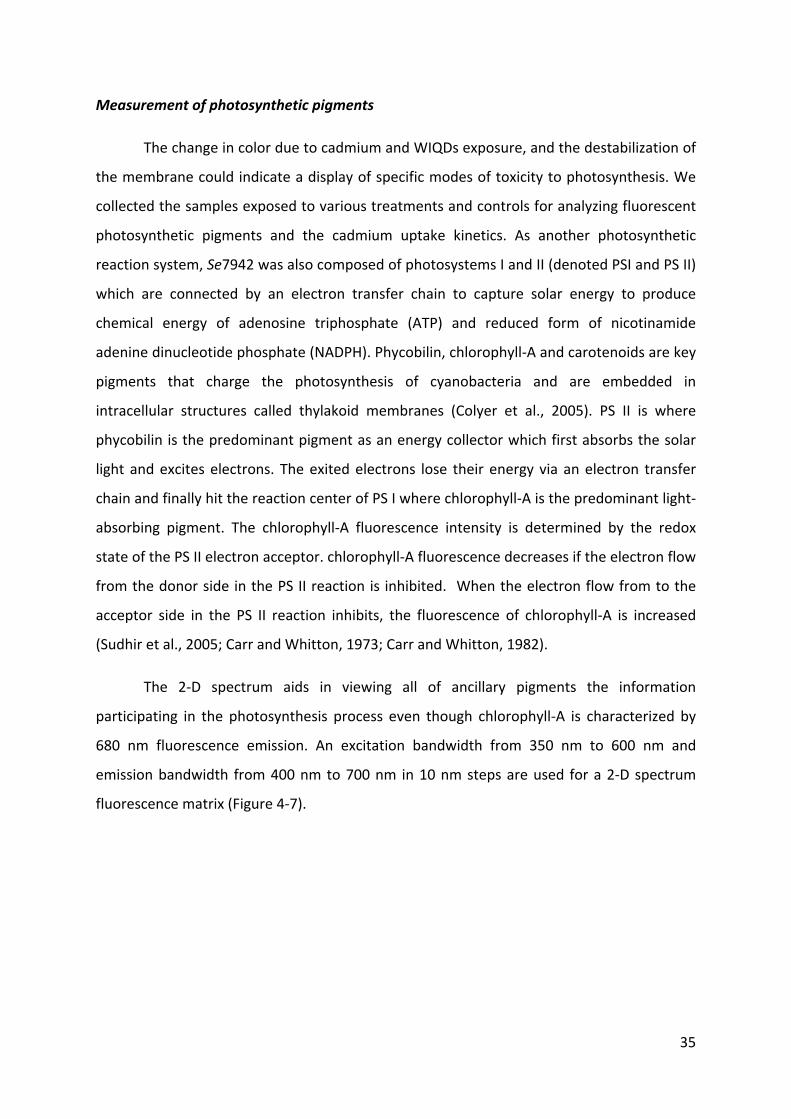
Measurement of photosynthetic pigments
The change in color due to cadmium and WIQDs exposure, and the destabilization of
the membrane could indicate a display of specific modes of toxicity to photosynthesis. We
collected the samples exposed to various treatments and controls for analyzing fluorescent
photosynthetic pigments and the cadmium uptake kinetics. As another photosynthetic
reaction system, Se7942 was also composed of photosystems I and II (denoted PSI and PS II)
which are connected by an electron transfer chain to capture solar energy to produce
chemical energy of adenosine triphosphate (ATP) and reduced form of nicotinamide
adenine dinucleotide phosphate (NADPH). Phycobilin, chlorophyll‐A and carotenoids are key
pigments that charge the photosynthesis of cyanobacteria and are embedded in
intracellular structures called thylakoid membranes (Colyer et al., 2005). PS II is where
phycobilin is the predominant pigment as an energy collector which first absorbs the solar
light and excites electrons. The exited electrons lose their energy via an electron transfer
chain and finally hit the reaction center of PS I where chlorophyll‐A is the predominant light‐
absorbing pigment. The chlorophyll‐A fluorescence intensity is determined by the redox
state of the PS II electron acceptor. chlorophyll‐A fluorescence decreases if the electron flow
from the donor side in the PS II reaction is inhibited. When the electron flow from to the
acceptor side in the PS II reaction inhibits, the fluorescence of chlorophyll‐A is increased
(Sudhir et al., 2005; Carr and Whitton, 1973; Carr and Whitton, 1982).
The 2‐D spectrum aids in viewing all of ancillary pigments the information
participating in the photosynthesis process even though chlorophyll‐A is characterized by
680 nm fluorescence emission. An excitation bandwidth from 350 nm to 600 nm and
emission bandwidth from 400 nm to 700 nm in 10 nm steps are used for a 2‐D spectrum
fluorescence matrix (Figure 4‐7).
36
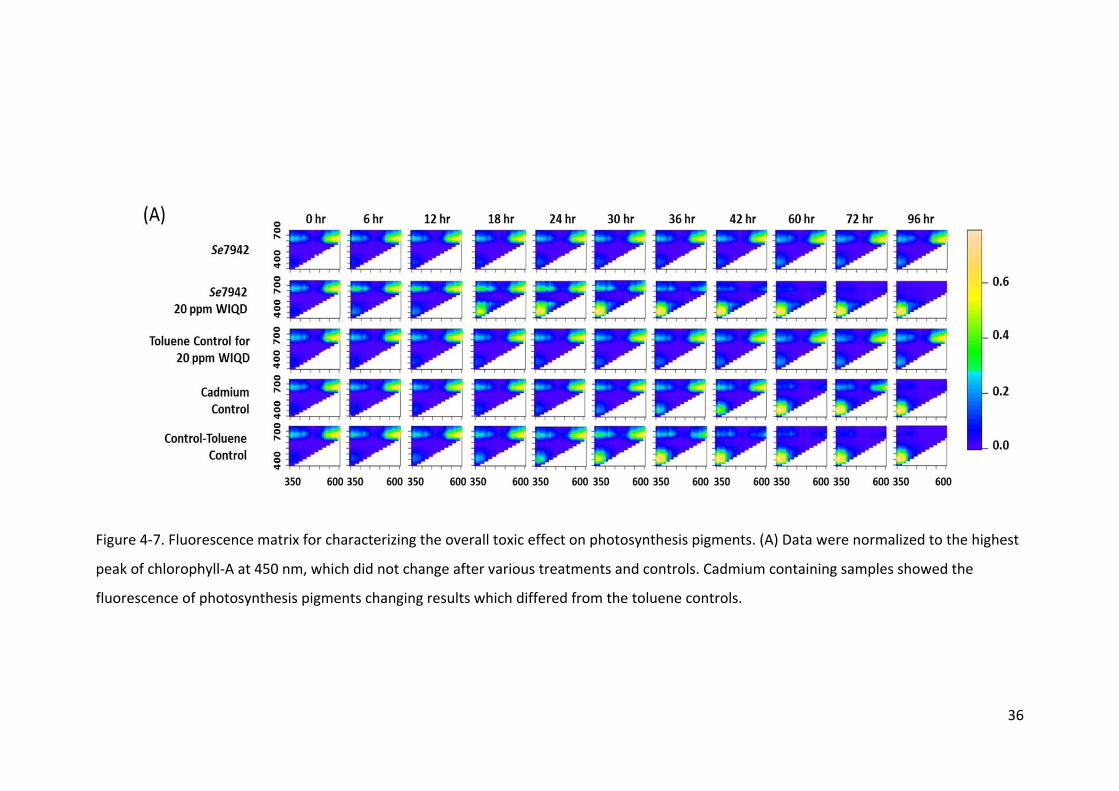
Figure 4‐7. Fluorescence matrix for characterizing the overall toxic effect on photosynthesis pigments. (A) Data were normalized to the highest
peak of chlorophyll‐A at 450 nm, which did not change after various treatments and controls. Cadmium containing samples showed the
fluorescence of photosynthesis pigments changing results which differed from the toluene controls.

37
Figure 4‐7 (continued). (B) The peak around emission 450 nm appeared after 30 h exposure of WSQDs.
38
Data for the fluorescence matrix were normalized by the fluorescence emission of
chlorophyll‐A around 450 nm, which did not seem to be affected much by various
treatments and controls. Chlorophyll‐A (PS I), which has a fluorescence emission peak
around 680 nm, decreased over time indicating a loss in functionality of photosystems. As
seen in Figure 4‐7, when cells were coping with stress, the peak of pigment fluorescence
changed. Novel peaks were only in the emission around emission 650 nm with fluorescence
matrix of intact photosystem but they disappeared and new peaks appeared in the around
emission 450 nm with the fluorescence matrix of a damaged photosystem. The behavior of
fluorescence pigments changed in WIQDs and cadmium treated cells in that a novel peak
roughly around 450 nm was appeared, which demonstrated that the electron transport
activity of photosystems was decreasing. Toluene toxicity to photosynthetic pigments was
lower than cadmium toxicity. Interestingly, the toluene control for 5 ppm WIQDs, where a
higher amount of toluene was added than the control for 20 ppm WIQDs, showed cell
membrane destabilization but had less of an effect on the photosynthetic systems. Small
peaks in the emission 450 nm in the matrices in both toluene controls could be a result of
the small amount of degradation of pigments, which might induce the culture color shift
towards cyan as we observed in the photographs of flasks. Unlike WIQDs, the WSQDs
themselves maintained their fluorescence until 18 h post‐exposure, confirmed by a broad
absorption and narrow emission range around 580 nm. Even though the broadband of
WSQDs fluorescence might not be the same as the fluorescence of WSQDs by themselves
due to the normalized data, it faded out and disappeared after 24 h exposure, indicating
that they may have degraded or were photobleached by light. The degradation of QDs could
affect the photosystem of cyanobacteria since the peak around emission 450 nm seemed to
appear after the loss of the fluorescence broadband of WSQDs. The peak around emission
450 nm in the matrix could suggest that cadmium released from WSQDs after degradation
could affect photosystems.
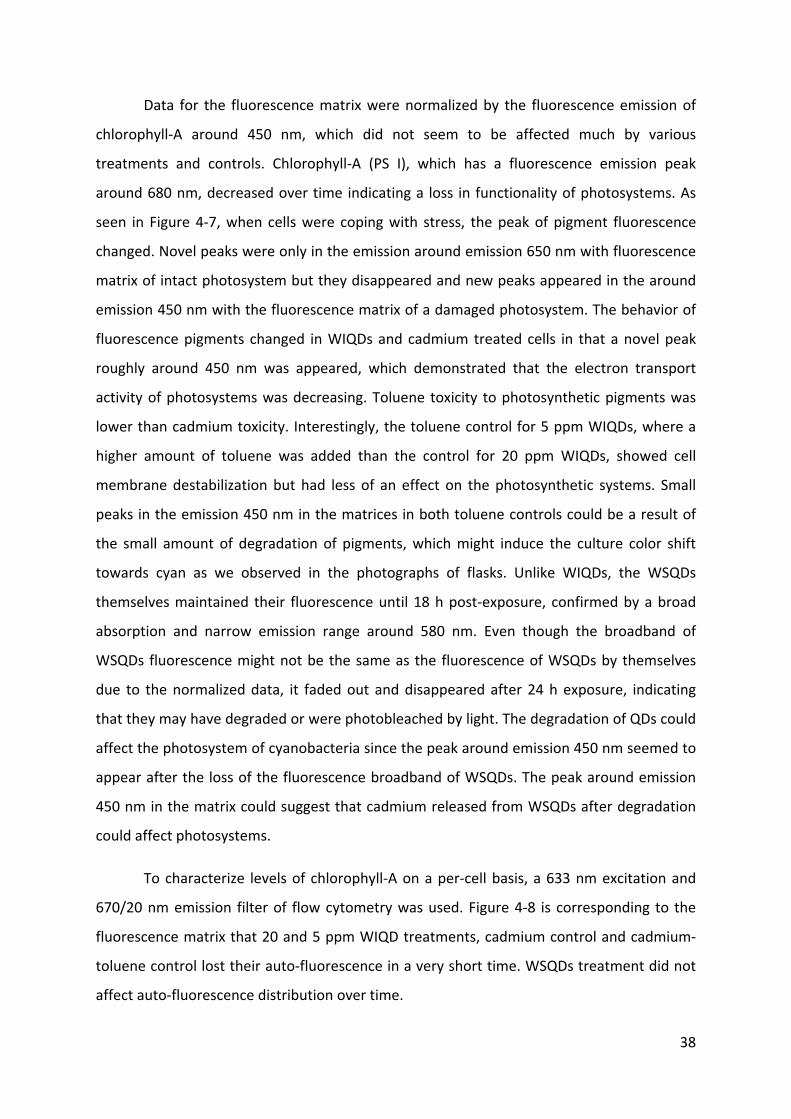
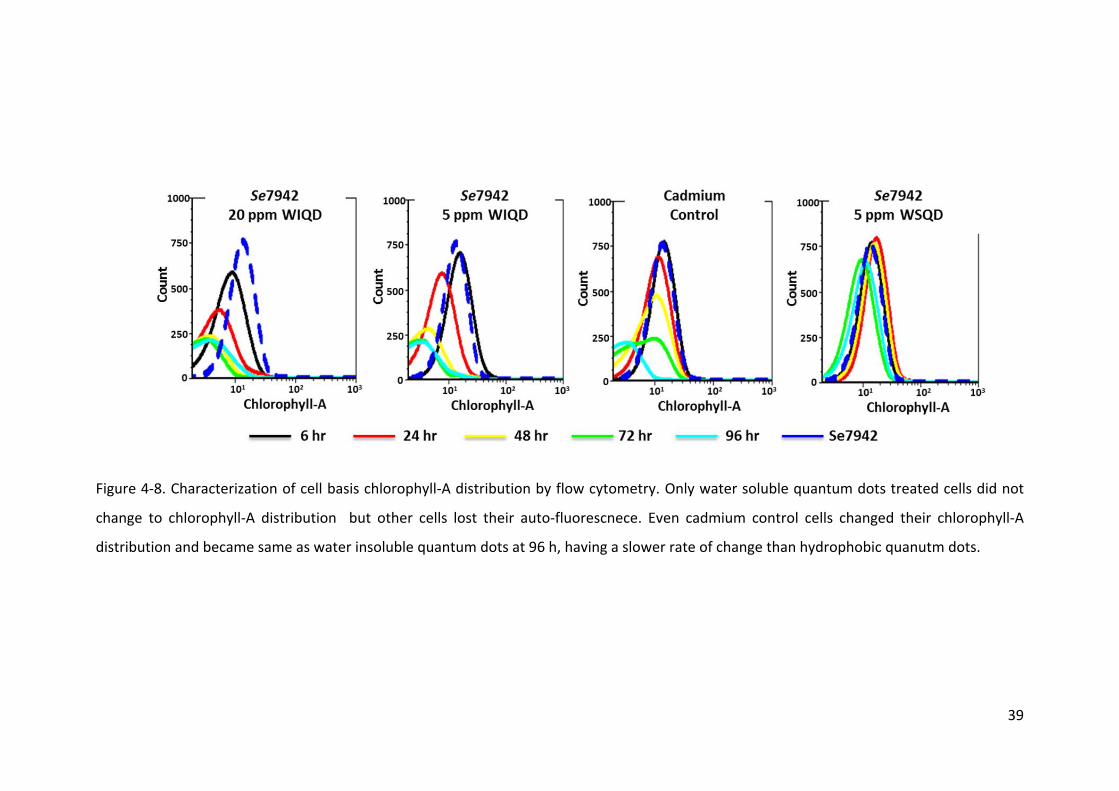
To characterize levels of chlorophyll‐A on a per‐cell basis, a 633 nm excitation and
670/20 nm emission filter of flow cytometry was used. Figure 4‐8 is corresponding to the
fluorescence matrix that 20 and 5 ppm WIQD treatments, cadmium control and cadmium‐
toluene control lost their auto‐fluorescence in a very short time. WSQDs treatment did not
affect auto‐fluorescence distribution over time.
39
Figure 4‐8. Characterization of cell basis chlorophyll‐A distribution by flow cytometry. Only water soluble quantum dots treated cells did not
change to chlorophyll‐A distribution but other cells lost their auto‐fluorescnece. Even cadmium control cells changed their chlorophyll‐A
distribution and became same as water insoluble quantum dots at 96 h, having a slower rate of change than hydrophobic quanutm dots.
40
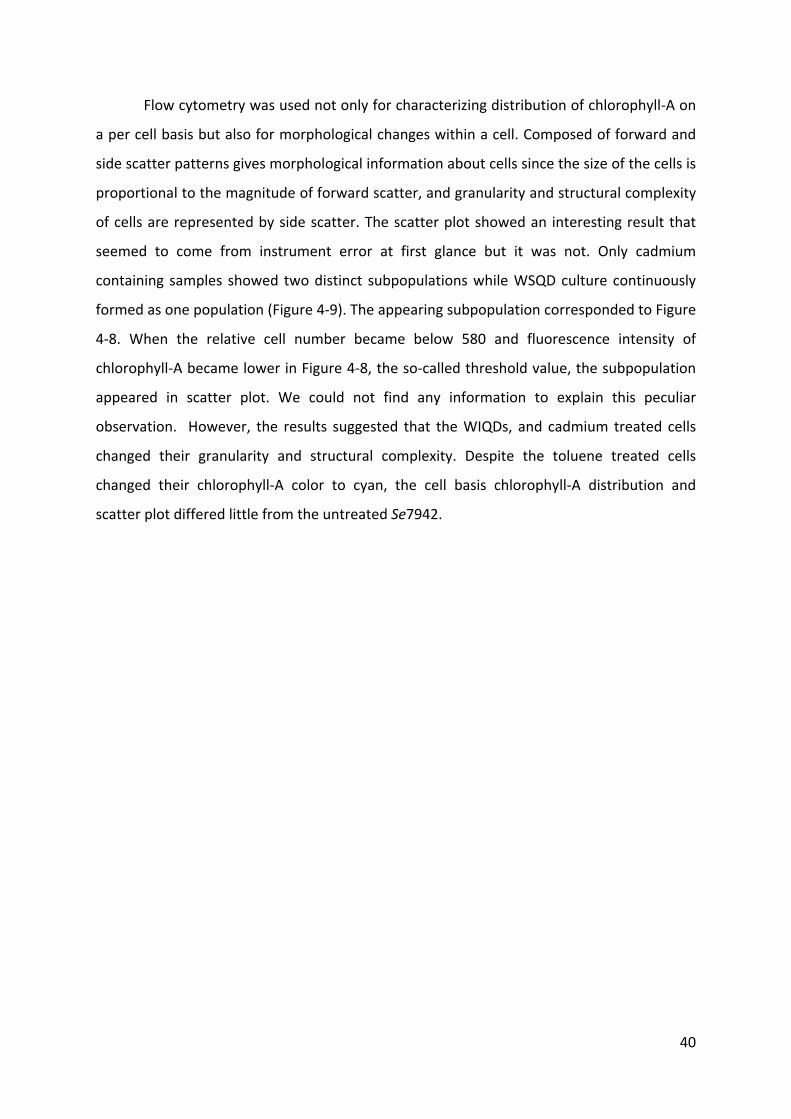
Flow cytometry was used not only for characterizing distribution of chlorophyll‐A on
a per cell basis but also for morphological changes within a cell. Composed of forward and
side scatter patterns gives morphological information about cells since the size of the cells is
proportional to the magnitude of forward scatter, and granularity and structural complexity
of cells are represented by side scatter. The scatter plot showed an interesting result that
seemed to come from instrument error at first glance but it was not. Only cadmium
containing samples showed two distinct subpopulations while WSQD culture continuously
formed as one population (Figure 4‐9). The appearing subpopulation corresponded to Figure
4‐8. When the relative cell number became below 580 and fluorescence intensity of
chlorophyll‐A became lower in Figure 4‐8, the so‐called threshold value, the subpopulation
appeared in scatter plot. We could not find any information to explain this peculiar
observation. However, the results suggested that the WIQDs, and cadmium treated cells
changed their granularity and structural complexity. Despite the toluene treated cells
changed their chlorophyll‐A color to cyan, the cell basis chlorophyll‐A distribution and
scatter plot differed little from the untreated Se7942.
41
Figure 4‐9. Characterization of morphological change by forward and side scatter plots of flow cytometry data. (A) Cadmium containing
cultures showed two distinct subpopulations.

42
Figure 4‐9 (continued). (B) Cells exposed to WSQDs continuously remained in one population.

43
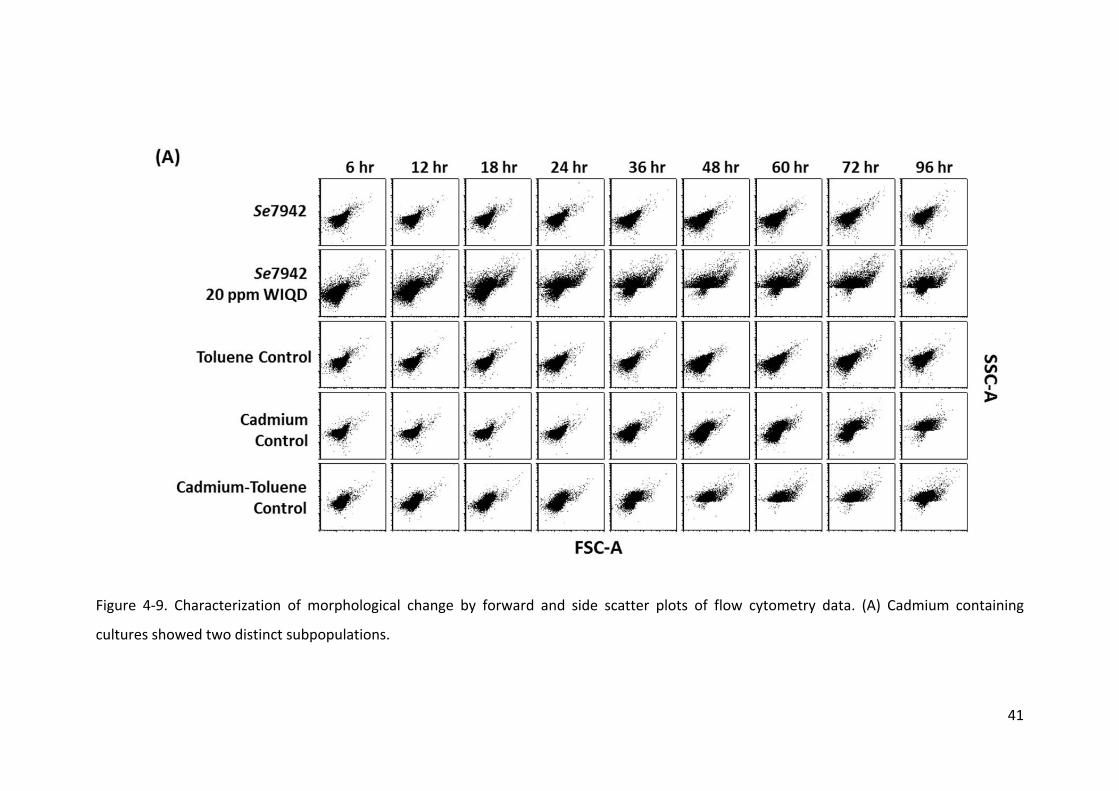
4.3Degradationrateofquantumdots
Degradation of CdSe/ZnS quantum dots
Previous observations indicated that cadmium and quantum dots possess similar
consequence of toxic effects to cells. The degradation rate of the quantum dots could be
main key element to result toxicity in cyanobacteria since cells showed no toxic responses to
WSQDs which kept as intact structure due to carboxylic acid groups. The degradation of
samples of WSQDs in BG‐11 media, WIQDs dissolved in toluene and WIQDs in BG‐11 media
was compared in Figure 4‐10, measured after 5 m of sample preparation (all the samples are
5 ppm concentration). WIQDs dissolved in toluene were still in intact form but WIQDs in BG‐
11 media degraded and lost their fluorescence rapidly within 5 m. WSQDs had the highest
fluorescence, which suggests that the surface coating maintains the photostability of
quantum dots and increases quantum yields.
WSQDs photostability was observed over long period time by fluorescence
spectroscopy (Figure 4‐11). WSQDs in BG‐11 media was incubated in the same condition as
culture growth environment, at 30 °C, light intensity at 3000 lux and shaking at 160 rpm.
After 96 h, the fluorescence of WSQDs remained their fluorescence and increased it due to
media evaporation, indicating surface coating determine the degradation rate of quantum
dots and their toxicity. Hydrophilic quantum dots with surface coating are non‐toxic
substance. However, leaking cadmium after degradation determines the toxicity of
cyanobacteria as we observed. Thus, surface coating of WSQDs is an important key point in
predicting ecological toxicity.
44
Figure 4‐10. Degradation of quantum dots. No fluorescence of WIQDs in BG‐11 media was
detected maybe because of light and hydrophobic and hydrophilic interaction. WSQDs in
BG‐11 media showed highest photostability. 20 ppm WIQDs in toluene ▬ 20 ppm WIQDs in
culture media ▬ 5ppm WSQDs in culture media ▬.

45
Figure 4‐11. Stability of water soluble quantum dots in BG‐11 media. WSQDs was incubated
in the same condition as culture growth environment at 30 °C, light intensity at 3000 lux and
shaking at 160 rpm. WSQDs had peak at 580 nm and it was increased over time. 0 h ▬ 24 h
▬ 48 h ▬ 72 h ▬ 96 h ▬.
0
1000
2000
3000
4000
5000
6000
500 550 600 650
wavelength (nm)
Fluorescen
ce Intensity
46
4.4Uptakeanddistributionofquantumdots
Quantum dot / cadmium uptake in Se7942
The potential uptake route and distribution of quantum dots and cadmium within
the cyanobacterial cells were analyzed. There are two processes for metal uptake by cells:
passive and active transport process. Passive transport process involves interaction of
metals and cell wall, and passive diffusion whereas active transport process involves energy
dependent active metabolic reaction. Endocytosis is known as the common way for
nanoparticles entering into cells. Not much prior information is available about mechanism
of water insoluble quantum dots uptake by cyanobacteria since previous researches more
focus on size and surface charge dependent endocytosis (Verma and Stellacci, 2010). Several
studies on heavy metal toxicity especially cadmium resistance have been researched in
freshwater cyanobacterium, Microcystis aeruginosa (Zeng et al., 2009; Zeng and Wang,
2009). Cd2+ ions are sequester by binding to negative surface of polyphosphate, lipid and
protein, by interacting with sulphydryl groups to produce –S‐metal‐S bridges and by
interacting with thiol groups of class Ⅱ metallothioneins (Vymazal, 1987; Olafson et al.,
1979; Baptista and Vasconcelos, 2006). Cd2+ ions are also sequestered in phyto chelation
and polyphosphate bodies which acting as detoxifying mechanism (Vymazal, 1987). In the
case of WSQDs with a carboxylic acid group, surface coating of WSQDs could conjugate with
lipid components on the cell membrane or with carboxylic acid of fatty acid on cell wall, and
finally enter into cells through endocytosis or macropinocytosis (Zhang and Monteiro‐
Riviere, 2009; Chang et al., 2006).
To investigate approximate location of quantum dots in cells, inductively coupled
plasma mass spectroscopy, flow cytometry and laser scanning confocal microscopy were
used. Results of flow cytometry and laser scanning confocal microscopy are plotted in Figure
4‐12 and 4‐13. Quantum dots distribution in the cell population was examed by 407 nm
excitation and 585/42 emission filter of flow cytometry (Figure 4‐12). A maker (M1) was set
since changes were seen at the left side of x‐axis. WIQDs treated cells were not
distinguishable from Cd controlled cells, confirming no WIQDs were uptake by cells due to
rapid degradation of WIQDs.

47
As has been noticed previous sections and in a literature (Dashdorj et al., 2004), Cd
ions and WIQDs damaged photosystems causing a shift in the fluorescence spectrum. Both
flow cytometry and confocal microscopy images verified the increase number of cells in the
emission range of 570 to 590 nm as a result of damaging photosystems. Green channel, 570
to 590 nm emissions, represented QDs and red channel represented cells’ auto‐fluorescence
in Figure 4‐13. The intensity of both channels has been increased by image process software
to distinguish with background. WIQDs themselves were invisible at any wavelength in or on
cells, but green channel was same shape as red channel in WIQDs treated cells confirming a
shift in fluorescence spectrum. Cadmium control sample also showed an auto‐fluorescence
spectrum shift. Data of flow cytometry was gated at 585 nm for quantifying self‐assembled
quantum dots to cell and fluorescence spectrum shift by nanoparticles (Table 4‐1). In the
case of WIQDs, the value is proportional to the photosystem damaged cells since WIQDs
were not observed after exposure. Less population of cells exposed to 5 ppm WIQDs was
that of 20 ppm WIQDs, indicating dose‐response uptake kinetics that lower concentration of
WIQDs less damage photosystems.
In the case of WSQDs, size of 1 to 2 μm aggregated quantum dots were merged in
the cell membrane (Figure 4‐13). As seen in Table 4‐1, proportion of cells taken up WSQD
was relatively constant at around 20 % over time.

48
Figure 4‐12. Quantum dots and Cd uptake measured by flow cytometry. (A) Se7942 + 20 ppm WIQD. Quantum dots were not observed in the
cells. (B) Cadmium control. Results of cadmium controlled cells were similar with WIQDs treatment. (C) Se7942 + 5 ppm WSQD. 6 h ▬ 24 h ▬
48 h ▬ 72 h ▬ 96 h ▬ Se7942 ▬.
(A) (B) (C)
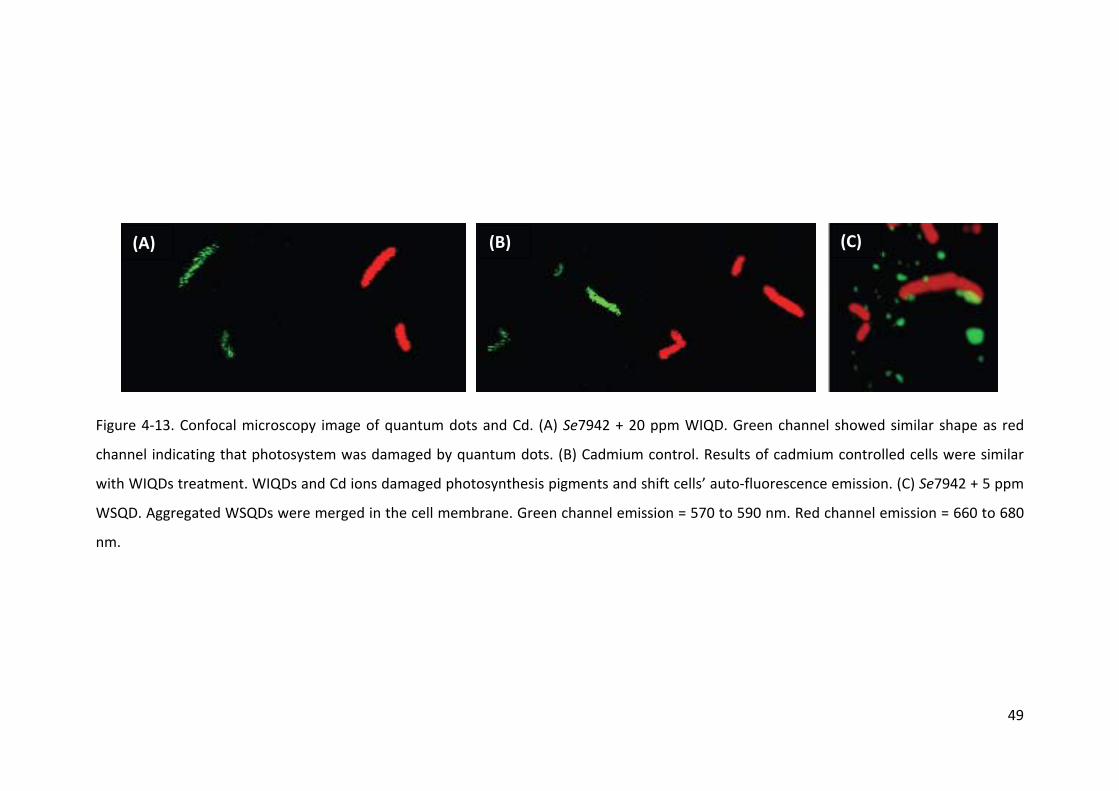
49
Figure 4‐13. Confocal microscopy image of quantum dots and Cd. (A) Se7942 + 20 ppm WIQD. Green channel showed similar shape as red
channel indicating that photosystem was damaged by quantum dots. (B) Cadmium control. Results of cadmium controlled cells were similar
with WIQDs treatment. WIQDs and Cd ions damaged photosynthesis pigments and shift cells’ auto‐fluorescence emission. (C) Se7942 + 5 ppm
WSQD. Aggregated WSQDs were merged in the cell membrane. Green channel emission = 570 to 590 nm. Red channel emission = 660 to 680
nm.
(A) (B) (C)
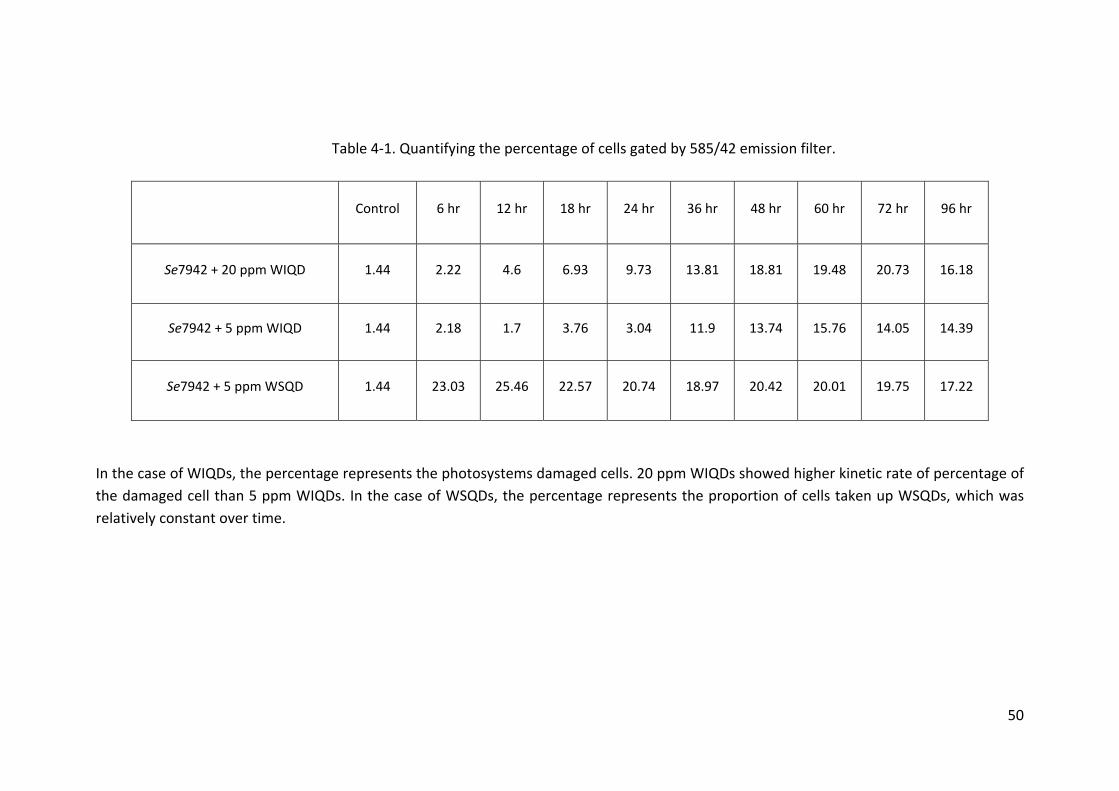
50
Table 4‐1. Quantifying the percentage of cells gated by 585/42 emission filter.
Control 6 hr 12 hr 18 hr 24 hr 36 hr 48 hr 60 hr 72 hr 96 hr
Se7942 + 20 ppm WIQD 1.44 2.22 4.6 6.93 9.73 13.81 18.81 19.48 20.73 16.18
Se7942 + 5 ppm WIQD 1.44 2.18 1.7 3.76 3.04 11.9 13.74 15.76 14.05 14.39
Se7942 + 5 ppm WSQD 1.44 23.03 25.46 22.57 20.74 18.97 20.42 20.01 19.75 17.22
In the case of WIQDs, the percentage represents the photosystems damaged cells. 20 ppm WIQDs showed higher kinetic rate of percentage of
the damaged cell than 5 ppm WIQDs. In the case of WSQDs, the percentage represents the proportion of cells taken up WSQDs, which was
relatively constant over time.
51
Biodistribution and kinetics (ICP/MS)
To characterize localization of cadmium in the culture, WIQDs, WSQDs treatments
and cadmium control samples were fractionated into cell media, cell membrane,
intracellular and cell debris. Cd content of each compartment was measured by ICP‐MS over
two different exposure time, 18 and 96 h. Cd content in media, cell membrane, intracellular
content and cell debris were compared in Figure 4‐14. Level of Cd in cell debris is the
difference between the unfractionated sample and the sum of other fractions (cell media,
cell membrane and intracellular and represents the unaccounted amounts of cadmium. The
assumption for WIQDs treated cells was that Cd contents represent not intact WIQDs but
only Cd ions that released from core part of quantum dots after degradation since no
fluorescence of WIQDs was detected by flow cytometry and confocal microscopy. The
assumption for WSQDs treated cells was that Cd contents mostly composed of intact
WSQDs since fluorescence of WSQDs remained consistently, but high temperature argon of
ICP‐MS degraded intact WSQDs into cadmium. To compare Cd content for 18 and 96 h
samples, data were normalized with biomass and calculated as percentage since media
evaporation was observed over time that Cd content in total sample increased. As seen in
Figure 4‐14, Cd contents self‐assembled with cell membrane increased over time in all cases.
In case of WIQDs treatments and cadmium controls, cadmium was continuously
sequestered in cell membrane by passive transport process despite cells lost their viability.
Unlike other samples, Cd levels of intracellular increased in cells exposed to WSQDs since
quantum dots were taken up by live cells continuously. WSQDs were more effectively
uptake by cells for several reasons. Cells exposed to WSQDs showed limited toxicity and
functional coating of intact quantum dots could do self‐assemble with cell membrane. Lastly,
several mechanisms were available for cadmium degraded form quantum dots. However,
WIQDs uptake mechanisms only limited to the last mechanisms of sequestering leaked
cadmium.
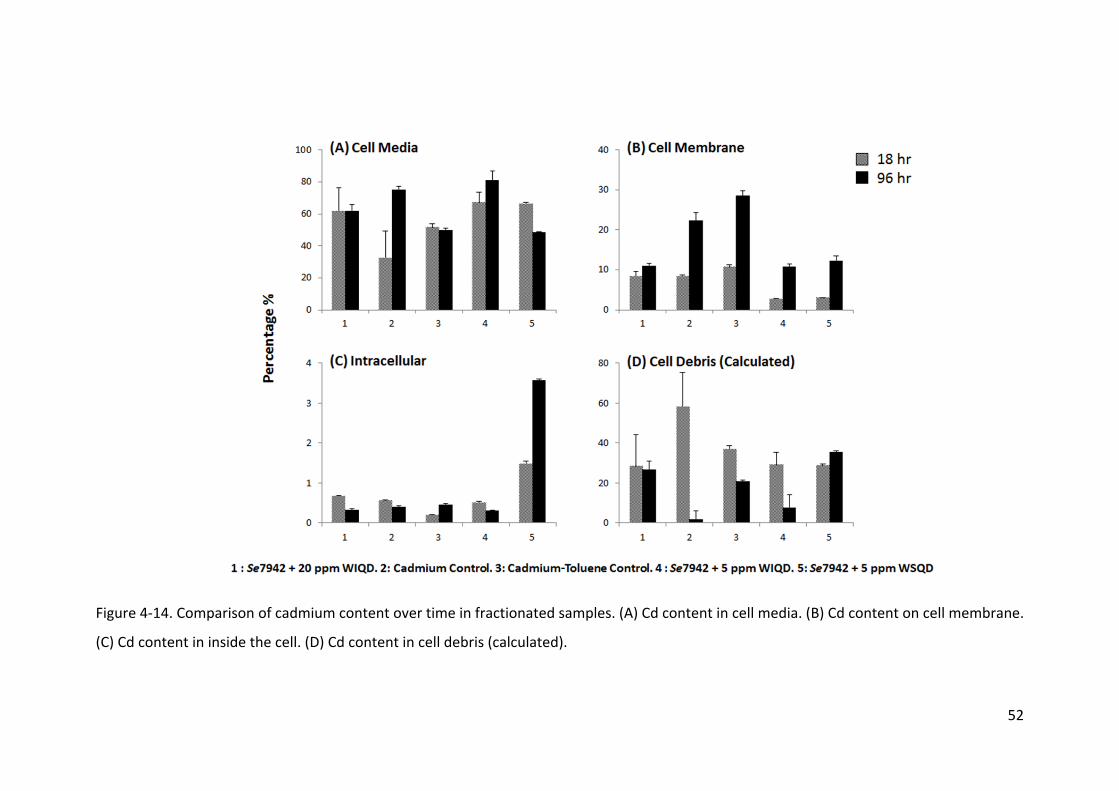
52
Figure 4‐14. Comparison of cadmium content over time in fractionated samples. (A) Cd content in cell media. (B) Cd content on cell membrane.
(C) Cd content in inside the cell. (D) Cd content in cell debris (calculated).
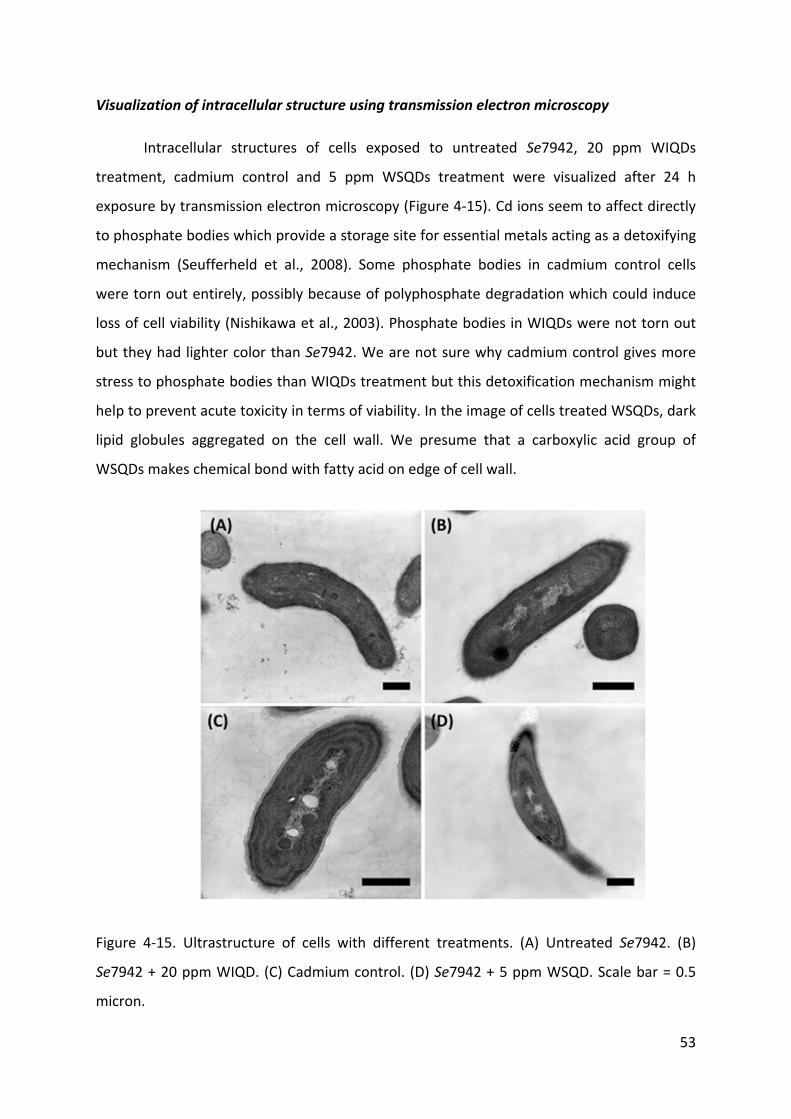
53
Visualization of intracellular structure using transmission electron microscopy
Intracellular structures of cells exposed to untreated Se7942, 20 ppm WIQDs
treatment, cadmium control and 5 ppm WSQDs treatment were visualized after 24 h
exposure by transmission electron microscopy (Figure 4‐15). Cd ions seem to affect directly
to phosphate bodies which provide a storage site for essential metals acting as a detoxifying
mechanism (Seufferheld et al., 2008). Some phosphate bodies in cadmium control cells
were torn out entirely, possibly because of polyphosphate degradation which could induce
loss of cell viability (Nishikawa et al., 2003). Phosphate bodies in WIQDs were not torn out
but they had lighter color than Se7942. We are not sure why cadmium control gives more
stress to phosphate bodies than WIQDs treatment but this detoxification mechanism might
help to prevent acute toxicity in terms of viability. In the image of cells treated WSQDs, dark
lipid globules aggregated on the cell wall. We presume that a carboxylic acid group of
WSQDs makes chemical bond with fatty acid on edge of cell wall.
Figure 4‐15. Ultrastructure of cells with different treatments. (A) Untreated Se7942. (B)
Se7942 + 20 ppm WIQD. (C) Cadmium control. (D) Se7942 + 5 ppm WSQD. Scale bar = 0.5
micron.
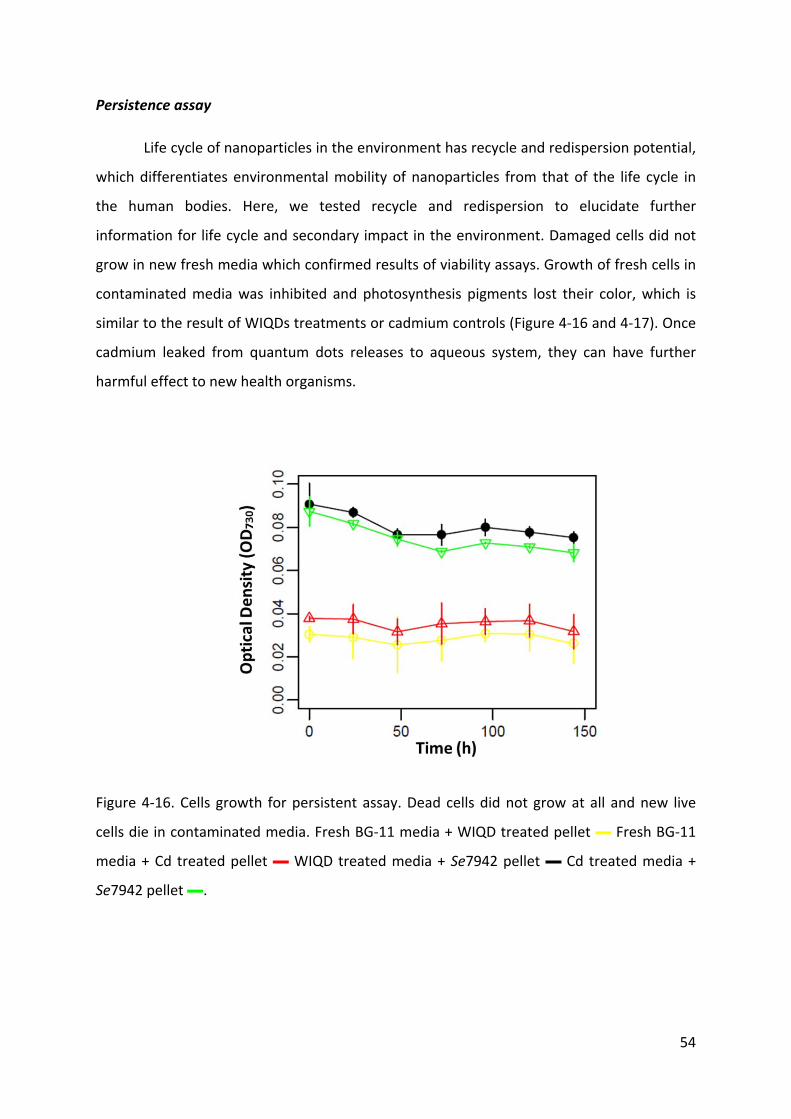
54
Persistence assay
Life cycle of nanoparticles in the environment has recycle and redispersion potential,
which differentiates environmental mobility of nanoparticles from that of the life cycle in
the human bodies. Here, we tested recycle and redispersion to elucidate further
information for life cycle and secondary impact in the environment. Damaged cells did not
grow in new fresh media which confirmed results of viability assays. Growth of fresh cells in
contaminated media was inhibited and photosynthesis pigments lost their color, which is
similar to the result of WIQDs treatments or cadmium controls (Figure 4‐16 and 4‐17). Once
cadmium leaked from quantum dots releases to aqueous system, they can have further
harmful effect to new health organisms.
Figure 4‐16. Cells growth for persistent assay. Dead cells did not grow at all and new live
cells die in contaminated media. Fresh BG‐11 media + WIQD treated pellet ▬ Fresh BG‐11
media + Cd treated pellet ▬ WIQD treated media + Se7942 pellet ▬ Cd treated media +
Se7942 pellet ▬.

55
Figure 4‐17. Photographs of flaks for persistence assay.

56
Chapter5.CONCLUSION
In this study, CdSe/ZnS quantum dots and cyanobacterial species were chosen for
evaluating potential fate of nanoparticles in the environment. Surface coating and
degradation rate of quantum dots were two main factors of determining their toxicity to
cyanobacteria. Aggregated WSQDs were self‐assembled to the cell membrane and
continuously taken up by cyanobacteria via passive and active transport mechanisms.
However, WSQDs had no effect to cell growth and viability at the concentration tested since
surface coating of a carboxylic acid group on WSQDs kept quantum dots intact, preventing
cadmium released from a core portion of quantum dots. WIQDs, quantum dots without
protection of surface coating, were vulnerable to light and were easily degraded into
cadmium and selenium. Thus, toxic responses of quantum dots were similar to that of
cadmium, indicating most quantum dots toxicity was governed by leaked cadmium ions.
WIQDs were impacting the photosynthetic machinery of the cyanobacteria resulting in a
shift of auto‐fluorescence spectrum. We also characterized toxicity of toluene, the solvent
to suspend water insoluble quantum dots. Even though cell exposed to only toluene
changed in color observable to the naked eye, their auto‐fluorescence was not different
with respect to untreated Se7942. To characterize elimination/recycle of nanoparticles for
comprehensive understanding quantum dots life cycle in the environment, media
contamination was analyzed. Contaminated media from quantum dots showed further toxic
effect in new health cells. The result indicates that quantum dots have to be handled
carefully to not disperse into environment.
57
REFERENCES
Adams, L. K., D. Y. Lyon and P. J. J. Alvarez. 2006. Comparative eco‐toxicity of nanoscale TiO2, SiO2, and ZnO water suspensions. Water research 40(19): 3527‐3532.
Archibald, J. M. 2009. The Puzzle of Plastid Evolution. Current Biology 19(2): R81‐R88.
Auffan, M., J. Rose, J. Bottero, G. V. Lowry, J. ‐. Jolivet and M. R. Wiesner. 2009. Towards a definition of inorganic nanoparticles from an environmental, health and safety perspective. Nature Nanotechnology 4(10): 634‐641.
Bagalkot, V., L. Zhang, E. Levy‐Nissenbaum, S. Jon, P. W. Kantoff, R. Langery and O. C. Farokhzad. 2007. Quantum dot‐aptamer conjugates for synchronous cancer imaging, therapy, and sensing of drug delivery based on Bi‐fluorescence resonance energy transfer. Nano Letters 7(10): 3065‐3070.
Baptista, M. S. and M. T. Vasconcelos. 2006. Cyanobacteria metal interactions: Requirements, toxicity, and ecological implications. Critical reviews in microbiology 32(3): 127‐137.
Blaser, S. A., M. Scheringer, M. MacLeod and K. Hungerbühler. 2008. Estimation of cumulative aquatic exposure and risk due to silver: Contribution of nano‐functionalized plastics and textiles. Science of the Total Environment 390(2‐3): 396‐409.
Braydich‐Stolle, L. K., N. M. Schaeublin, R. C. Murdock, J. Jiang, P. Biswas, J. J. Schlager and S. M. Hussain. 2009. Crystal structure mediates mode of cell death in TiO2 nanotoxicity. Journal of Nanoparticle Research 11(6): 1361‐1374.
Brayner, R., S. A. Dahoumane, C. Yéprémian, C. Djediat, M. Meyer, A. Couté and F. Fiévet. 2010. ZnO nanoparticles: Synthesis, characterization, and ecotoxicological studies. Langmuir 26(9): 6522‐6528.
Brunner, T. J., P. Wick, P. Manser, P. Spohn, R. N. Grass, L. K. Limbach, A. Bruinink and W. J. Stark. 2006. In vitro cytotoxicity of oxide nanoparticles: Comparison to asbestos, silica, and the effect of particle solubility. Environmental Science and Technology 40(14): 4374‐4381.
Carr, N.G. and B.A. Whitton. 1973. The biology of blue‐green algae. University of California Press. Carr, N.G. and B.A. Whitton. 1982. The biology of cyanobacteria. University of California Press.
Chang, E., N. Thekkek, W. W. Yu, V. L. Colvin and R. Drezek. 2006. Evaluation of quantum dot cytotoxicity based on intracellular uptake. Small 2(12): 1412‐1417.
Chithrani, B. D., A. A. Ghazani and W. C. W. Chan. 2006. Determining the size and shape dependence of gold nanoparticle uptake into mammalian cells. Nano Letters 6(4): 662‐668.
58
Cobbett, C. S. 2000. Phytochelatins and their roles in heavy metal detoxification. Plant Physiology 123(3): 825‐832.
Coe, S., W. Woo, M. Bawendi and V. Bulović. 2002. Electroluminescence from single monolayers of nanocrystals in molecular organic devices. Nature 420(6917): 800‐803.
Colyer, C. L., C. S. Klinkade, P. J. Viskari and J. P. Landers. 2005. Analysis of cyanobacterial pigments and proteins by electrophoretic and chromatographic methods. Analytical and Bioanalytical Chemistry 382(3): 559‐569.
Conner, S. D. and S. L. Schmid. 2003. Regulated portals of entry into the cell. Nature 422(6927): 37‐44.
Dashdorj, N., W. Xu, P. Martinsson, P. R. Chitnis and S. Savikhin. 2004. Electrochromic Shift of Chlorophyll Absorption in Photosystem I from Synechocystis sp. PCC 6803: A Probe of Optical and Dielectric Properties around the Secondary Electron Acceptor. Biophysical journal 86(5): 3121‐3130.
Derfus, A. M., W. C. W. Chan and S. N. Bhatia. 2004a. Intracellular delivery of quantum dots for live cell labeling and organelle tracking. Advanced Materials 16(12): 961‐966.
Derfus, A. M., W. C. W. Chan and S. N. Bhatia. 2004b. Probing the Cytotoxicity of Semiconductor Quantum Dots. Nano Letters 4(1): 11‐18.
Dudkowiak, A., B. Olejarz, J. Łukasiewicz, J. Banaszek, J. Sikora and K. Wiktorowicz. 2010. Heavy Metals Effect on Cyanobacteria Synechocystis aquatilis Study Using Absorption, Fluorescence, Flow Cytometry, and Photothermal Measurements. International Journal of Thermophysics1‐12.
Dumas, E., V. Ozenne, R. E. Mielke and J. L. Nadeau. 2009. Toxicity of CdTe quantum dots in bacterial strains. IEEE Transactions on Nanobioscience 8(1): 58‐64.
Fowler, B. A., C. E. Hildebrand, Y. Kojima and M. Webb. 1987. Nomenclature of metallothionein. Experientia.Supplementum 5219‐22.
Gao, X., L. Yang, J. A. Petros, F. F. Marshall, J. W. Simons and S. Nie. 2005. In vivo molecular and cellular imaging with quantum dots. Current opinion in biotechnology 16(1 SPEC. ISS.): 63‐72.
Golubic, S. and L. Seong‐Joo. 1999. Early cyanobacterial fossil record: Preservation, palaeoenvironments and identification. European Journal of Phycology 34(4): 339‐348.
Gosens, I., J. A. Post, L. J. J. de la Fonteyne, E. H. J. M. Jansen, J. W. Geus, F. R. Cassee and W. H. de Jong. 2010. Impact of agglomeration state of nano‐ and submicron sized gold particles on pulmonary inflammation. Particle and Fibre Toxicology 7.
Hagemann, M. 2011. Molecular biology of cyanobacterial salt acclimation. FEMS microbiology reviews 35(1): 87‐123.
59
Hardman, R. 2006. A toxicologic review of quantum dots: Toxicity depends on physicochemical and environmental factors. Environmental health perspectives 114(2): 165‐172.
Hauck, T. S., R. E. Anderson, H. C. Fischer, S. Newbigging and W. C. W. Chan. 2010. In vivo quantum‐dot toxicity assessment. Small 6(1): 138‐144.
Herrero, A. and E. Flores. 2008. The cyanobacteria: Molecular biology, genomics and evolution. Caister Academic Press.
Hildebrand, H., K. Mackenzie and F. Kopinke. 2009. Highly active Pd‐on‐magnetite nanocatalysts for aqueous phase hydrodechlorination reactions. Environmental Science and Technology 43(9): 3254‐3259.
Ho, Y. P. and K. W. Leong. 2010. Quantum dot‐based theranostics. Nanoscale 2(1): 60‐68.
Ispas, C., D. Andreescu, A. Patel, D. V. Goia, S. Andreescu and K. N. Wallace. 2009. Toxicity and developmental defects of different sizes and shape nickel nanoparticles in zebrafish. Environmental Science and Technology 43(16): 6349‐6356.
Jaiswal, J. K. and S. M. Simon. 2007. Optical monitoring of single cells using quantum dots. Methods in Molecular Biology 37493‐104.
King‐Heiden, T. C., P. N. Wiecinski, A. N. Mangham, K. M. Metz, D. Nesbit, J. A. Pedersen, R. J. Hamers, W. Heideman and R. E. Peterson. 2009. Quantum dot nanotoxicity assessment using the zebrafish embryo. Environmental Science and Technology 43(5): 1605‐1611.
Lam, C., J. T. James, R. McCluskey and R. L. Hunter. 2004. Pulmonary toxicity of single‐wall carbon nanotubes in mice 7 and 90 days after intractracheal instillation. Toxicological Sciences 77(1): 126‐134.
Lewinski, N. A., H. Zhu, H. E. Jo, D. Pham, R. R. Kamath, C. R. Ouyang, C. D. Vulpe, V. L. Colvin and R. A. Drezek. 2010. Quantification of water solubilized CdSe/ZnS quantum dots in Daphnia magna. Environmental Science and Technology 44(5): 1841‐1846.
Lu, C. M., C. W. Chau and J. H. Zhang. 2000. Acute toxicity of excess mercury on the photosynthetic performance of cyanobacterium, S. platensis ‐ Assessment by chlorophyll fluorescence analysis. Chemosphere 41(1‐2): 191‐196.
Magrez, A., S. Kasas, V. Salicio, N. Pasquier, J. W. Seo, M. Celio, S. Catsicas, B. Schwaller and L. Forró. 2006. Cellular toxicity of carbon‐based nanomaterials. Nano Letters 6(6): 1121‐1125.
Mahendra, S., H. Zhu, V. L. Colvin and P. J. Alvarez. 2008. Quantum dot weathering results in microbial toxicity. Environmental Science and Technology 42(24): 9424‐9430.
60
Marin, K., M. Stirnberg, M. Eisenhut, R. Krämer and M. Hagemann. 2006. Osmotic stress in Synechocystis sp. PCC 6803: Low tolerance towards nonionic osmotic stress results from lacking activation of glucosylglycerol accumulation. Microbiology 152(7): 2023‐2030.
Michalet, X., F. F. Pinaud, L. A. Bentolila, J. M. Tsay, S. Doose, J. J. Li, G. Sundaresan, A. M. Wu, S. S. Gambhir and S. Weiss. 2005. Quantum dots for live cells, in vivo imaging, and diagnostics. Science 307(5709): 538‐544.
Miller, L.A. 1982. Practical rapid embedding procedure for transmission electron microscopy. Laboratory Medicine 13:752‐756.
Mitsui, A., S. Kumazawa and A. Takahashi. 1986. Strategy by which nitrogen‐fixing unicellular cyanobacteria grow photoautotrophically. Nature 323(6090): 720‐722.
Monteiro, D. R., L. F. Gorup, A. S. Takamiya, A. C. Ruvollo‐Filho, E. R. d. Camargo and D. B. Barbosa. 2009. The growing importance of materials that prevent microbial adhesion: antimicrobial effect of medical devices containing silver. International journal of antimicrobial agents 34(2): 103‐110.
Mueller, N. C. and B. Nowack. 2008. Exposure modeling of engineered nanoparticles in the environment. Environmental Science and Technology 42(12): 4447‐4453.
Navarro, E., F. Piccapietra, B. Wagner, F. Marconi, R. Kaegi, N. Odzak, L. Sigg and R. Behra. 2008. Toxicity of silver nanoparticles to Chlamydomonas reinhardtii. Environmental Science and Technology 42(23): 8959‐8964.
Nel, A., T. Xia, L. Mädler and N. Li. 2006. Toxic potential of materials at the nanolevel. Science 311(5761): 622‐627.
Nishikawa, K., Y. Yamakoshi, I. Uemura and N. Tominaga. 2003. Ultrastructural changes in Chlamydomonas acidophila (Chlorophyta) induced by heavy metals and polyphosphate metabolism. FEMS microbiology ecology 44(2): 253‐259.
Nutt, M. O., K. N. Heck, P. Alvarez and M. S. Wong. 2006. Improved Pd‐on‐Au bimetallic nanoparticle catalysts for aqueous‐phase trichloroethene hydrodechlorination. Applied Catalysis B: Environmental 69(1‐2): 115‐125.
Oberdörster, G., E. Oberdörster and J. Oberdörster. 2005. Nanotoxicology: An emerging discipline evolving from studies of ultrafine particles. Environmental health perspectives 113(7): 823‐839.
Okamoto, N. and I. Inouye. 2005. Evolution: A secondary symbiosis in progress? Science 310(5746): 287.
Olafson, R. W., K. Abel and R. G. Sim. 1979. Prokaryotic metallothionein: Preliminary characterization of a blue‐green alga heavy metal‐binding protein. Biochemical and biophysical research communications 89(1): 36‐43.
61
Ozturk, S. and B. Aslim. 2010. Modification of exopolysaccharide composition and production by three cyanobacterial isolates under salt stress. Environmental Science and Pollution Research 17(3): 595‐602.
Pandhal, J., S. Y. Ow, P. C. Wright and C. A. Biggs. 2009. Comparative proteomics study of salt tolerance between a nonsequenced extremely halotolerant cyanobacterium and its mildly halotolerant relative using in vivo metabolic labeling and in vitro isobaric labeling. Journal of Proteome Research 8(2): 818‐828.
Powers, K. W., S. C. Brown, V. B. Krishna, S. C. Wasdo, B. M. Moudgil and S. M. Roberts. 2006. Research strategies for safety evaluation of nanomaterials. Part VI. characterization of nanoscale particles for toxicological evaluation. Toxicological Sciences 90(2): 296‐303.
Prasad, S. M., J. B. Singh, L. C. Rai and H. D. Kumar. 1991. Metal‐induced inhibition of photosynthetic electron transport chain of the cyanobacterium Nostoc muscorum. FEMS microbiology letters 82(1): 95‐100.
Press, D., T. D. Ladd, B. Zhang and Y. Yamamoto. 2008. Complete quantum control of a single quantum dot spin using ultrafast optical pulses. Nature 456(7219): 218‐221.
Rachlin, J. W., T. E. Jensen and B. E. Warkentine. 1985. Morphometric analysis of the response of Anabaena flos‐aquae and Anabaena variabilis (Cyanophyceae) to selected concentrations of zinc. Archives of Environmental Contamination and Toxicology 14(4): 395‐402.
Rachlin, J. W., T. E. Jensen and B. Warkentine. 1984. The toxicological response of the alga Anabaena flos‐aquae (Cyanophyceae) to cadmium. Archives of Environmental Contamination and Toxicology 13(2): 143‐151.
Rangsayatorn, N., E. S. Upatham, M. Kruatrachue, P. Pokethitiyook and G. R. Lanza. 2002. Phytoremediation potential of Spirulina (Arthrospira) platensis: Biosorption and toxicity studies of cadmium. Environmental Pollution 119(1): 45‐53.
Renault, S., M. Baudrimont, N. Mermer‐Dudons, P. Gonzalez, S. Mornet and A. Brisson. 2008. Impacts of gold nanoparticle exposure on two freshwater species: A phytoplanktonic alga (Scenedesmus subspicatus) and a benthic bivalve (Corbicula fluminea). Gold Bulletin 41(2): 116‐126.
Saker, M., C. Moreira, J. Martins, B. Neilan and V. M. Vasconcelos. 2009. DNA profiling of complex bacterial populations: Toxic cyanobacterial blooms. Applied Microbiology and Biotechnology 85(2): 237‐252.
Sas, K. N., L. Kovács, O. Zsíros, Z. Gombos, G. Garab, L. Hemmingsen and E. Danielsen. 2006. Fast cadmium inhibition of photosynthesis in cyanobacteria in vivo and in vitro studies using perturbed angular correlation of γ‐rays. Journal of Biological Inorganic Chemistry 11(6): 725‐734.
62
Seufferheld, M. J., H. M. Alvarez and M. E. Farias. 2008. Role of polyphosphates in microbial adaptation to extreme environments. Applied and Environmental Microbiology 74(19): 5867‐5874.
Su, C. K., C. W. Huang, C. S. Yang, Y. J. Wang and Y. C. Sun. 2010. In vivo monitoring of quantum dots in the extracellular space using push‐pull perfusion sampling, online in‐tube solid phase extraction, and inductively coupled plasma mass spectrometry. Analytical Chemistry 82(17): 7096‐7102.
Sudhir, P., D. Pogoryelov, L. Kovács, G. Garab and S. D. S. Murthy. 2005. The effects of salt stress on photosynthetic electron transport and thylakoid membrane proteins in the cyanobacterium Spirulina platensis. Journal of Biochemistry and Molecular Biology 38(4): 481‐485.
Sukhanova, A., J. Devy, L. Venteo, H. Kaplan, M. Artemyev, V. Oleinikov, D. Klinov, M. Pluot, J. H. M. Cohen and I. Nabiev. 2004. Biocompatible fluorescent nanocrystals for immunolabeling of membrane proteins and cells. Analytical Biochemistry 324(1): 60‐67.
Surosz, W. and K. A. Palinska. 2004. Effects of heavy‐metal stress on cyanobacterium Anabaena flos‐aquae. Archives of Environmental Contamination and Toxicology 48(1): 40‐48.
Tamoi, M., H. Kurotaki and T. Fukamizo. 2007. β‐1,4‐Glucanase‐like protein from the cyanobacterium Synechocystis PCC6803 is a β‐1,3‐1,4‐glucanase and functions in salt stress tolerance. Biochemical Journal 405(1): 137‐146.
Turner, J. S. and N. J. Robinson. 1995. Cyanobacterial metallothioneins: Biochemistry and molecular genetics. Journal of industrial microbiology 14(2): 119‐125.
Vallarta Jr., R., Cao, E., and Y.R. Sibal. 1998. Cadmium Uptake in Synechococcus aquatilis (Reynaud) Strain SY01. ScienceDiliman 10.
Van Hoecke, K., K. A. C. De Schamphelaere, P. Van Der Meeren, G. Smagghe and C. R. Janssen. 2011. Aggregation and ecotoxicity of CeO2 nanoparticles in synthetic and natural waters with variable pH, organic matter concentration and ionic strength. Environmental Pollution 159(4): 970‐976.
Verma, A. and F. Stellacci. 2010. Effect of surface properties on nanoparticle‐cell interactions. Small 6(1): 12‐21.
Vymazal, J. 1987. Toxicity and accumulation of cadmium with respect to algae and cyanobacteria: a review. Toxicity Assessment 2(4): 387‐415.
Wokovich, A., K. Tyner, W. Doub, N. Sadrieh and L. F. Buhse. 2009. Particle size determination of sunscreens formulated with various forms of titanium dioxide. Drug development and industrial pharmacy 35(10): 1180‐1189.
63
Xia, L., S. C. Lenaghan, M. Zhang, Z. Zhang and Q. Li. 2010. Naturally occurring nanoparticles from English ivy: An alternative to metal‐based nanoparticles for UV protection. Journal of Nanobiotechnology 8.
Xing, Y. and J. Rao. 2008. Quantum dot bioconjugates for in vitro diagnostics & in vivo imaging. Cancer Biomarkers 4(6): 307‐319.
Xing, Y., Z. Xia and J. Rao. 2009. Semiconductor quantum dots for biosensing and in vivo imaging. IEEE Transactions on Nanobioscience 8(1): 4‐12.
Yang, H. 2010. Nanoparticle‐mediated brain‐specific drug delivery, imaging, and diagnosis. Pharmaceutical research 27(9): 1759‐1771.
Yee, N., L. G. Benning, V. R. Phoenix and F. G. Ferris. 2004. Characterization of Metal‐Cyanobacteria Sorption Reactions: A Combined Macroscopic and Infrared Spectroscopic Investigation. Environmental Science and Technology 38(3): 775‐782.
Zeng, J. and W. Wang. 2009. The importance of cellular phosphorus in controlling the uptake and toxicity of cadmium and zinc in Microcystis aeruginosa, a freshwater cyanobacterium. Environmental Toxicology and Chemistry 28(8): 1618‐1626.
Zeng, J., L. Yang and W. Wang. 2009. Acclimation to and recovery from cadmium and zinc exposure by a freshwater cyanobacterium, Microcystis aeruginosa. Aquatic Toxicology 93(1): 1‐10.
Zhang, B., Y. Luo and Q. Wang. 2010. Development of silver‐zein composites as a promising antimicrobial agent. Biomacromolecules 11(9): 2366‐2375.
Zhang, L. W. and N. A. Monteiro‐Riviere. 2009. Mechanisms of quantum dot nanoparticle cellular uptake. Toxicological Sciences 110(1): 138‐155.
Zhang, X., H. Sun and Z. Zhang. 2006. Bioaccumulation of titanium dioxide nanoparticles in carp. Huanjing Kexue/Environmental Science 27(8): 1631‐1635.