Embed Size (px)
Citation preview

Copyright © 2005, Paper 09-013; 10,012 words, 9 Figures, 0 Animations, 5 Tables.http://EarthInteractions.org
Characterizing Vegetation FireDynamics in Brazil throughMultisatellite Data: Common Trendsand Practical IssuesWilfrid Schroeder*Department of Geography, University of Maryland, College Park, Maryland
Jeffrey T. MorisetteNASA Goddard Space Flight Center, Greenbelt, Maryland
Ivan CsiszarDepartment of Geography, University of Maryland, College Park, Maryland
Louis GiglioScience Systems and Applications, Inc., NASA GSFC, Greenbelt, Maryland
Douglas Morton and Christopher O. JusticeDepartment of Geography, University of Maryland, College Park, Maryland
Received 19 July 2004; accepted 16 January 2005
* Corresponding author address: Wilfrid Schroeder, Department of Geography, University ofMaryland, College Park, College Park, MD 20742.
E-mail address: [email protected]
Earth Interactions • Volume 9 (2005) • Paper No. 13 • Page 1

ABSTRACT: Correctly characterizing the frequency and distribution of fireoccurrence is essential for understanding the environmental impacts of biomassburning. Satellite fire detection is analyzed from two sensors—the AdvancedVery High Resolution Radiometer (AVHRR) on NOAA-12 and the ModerateResolution Imaging Spectroradiometer (MODIS) on both the Terra and Aquaplatforms, for 2001–03—to characterize fire activity in Brazil, giving specialemphasis to the Amazon region. In evaluating the daily fire counts, theirdependence on variations in satellite viewing geometry, overpass time, atmo-spheric conditions, and fire characteristics were considered. Fire counts wereassessed for major biomes of Brazil, the nine states of the Legal Amazon, andtwo important road corridors in the Amazon region. All three datasets provideconsistent information on the timing of peak fire activity for a given state. Also,ranking by relative fire counts per unit area highlights the importance of fire insmaller biomes such as Complexo do Pantanal. The local analysis of roadcorridors shows trends for fire detections with the increasing intensity of landuse. Although absolute fire counts differ by as much as 1200%, when sum-marized over space and time, trends in fire counts among the three datasetsshow clear patterns of fire dynamics. The fire dynamics that are evident inthese trend analyses are important foundations for assessing environmentalimpacts of biomass burning and policy measures to manage fire in Brazil.
KEYWORDS: Vegetation fire; Fire monitoring; Brazilian Amazon
1. Introduction
Biomass burning plays an important role in various aspects of the global climatesystem, largely because of the effects of trace gas emissions from biomass com-bustion and the resulting changes to the radiation and energy budget (Crutzen andAndreae 1990; Lenoble 1991; Artaxo et al. 1998; Eck et al. 1998; Ross and Hobbs1998). Of the total number of fire events observed every year, most occur in theTropics (Hao and Liu 1994; Dwyer et al. 2000), due to the widespread use of firefor land management, together with the extensive areas of fire-prone native veg-etation. Among these areas, the southern and eastern edges of the Brazilian Ama-zon, known as the arc of deforestation, together with adjacent cerrado (savanna)areas, have the highest consistent fire counts from satellite data of any region inBrazil every year from June to October (Prins et al. 1998; additional informationavailable online at http://www.cptec.inpe.br/queimadas, or http://www.dpi.inpe.br/proarco/bdqueimadas). During these months, a large high pressure system tends tocover the region, inhibiting precipitation and reducing relative humidity due to thesubsidence of dry air from the upper levels of the atmosphere (Figueroa and Nobre1990; Nobre et al. 1998). These circulation patterns result in the retention of smokeemitted by burning over a large horizontal expanse, reducing visibility to the pointof closing airports and causing respiratory problems among local populations(Reinhardt et al. 2001).
Differences in dry season length and severity throughout Brazil and the Amazonregion delineate distinct periods of increased flammability across states andbiomes. The timing and location of biomass burning events in the Amazon re-flect seasonal variations in rainfall and the presence of human ignition sources
Earth Interactions • Volume 9 (2005) • Paper No. 13 • Page 2

(Hoffmann et al. 2002; Hoffmann et al. 2003; Cardoso et al. 2003). Also, anoma-lous climate conditions such as El Niño/La Niña events may exacerbate dry seasonseverity, creating favorable conditions for the development of major fire events,such as the great Roraima forest fire in February–March 1998 (Cochrane andSchulze 1998; Elvidge et al. 2001; Phulpin et al. 2002). The Amazon regionexperiences approximately 70% of the total annual number of fires detectedthrough satellite imagery in Brazil (see information online at http://www.cptec.inpe.br/queimadas, or http://www.dpi.inpe.br/proarco/bdqueimadas). Increasinghuman forcing contributes additional pressure to the environment, inducing uniquespatial patterns for deforestation and fire as a result of land-use management(Laurance et al. 2001; Laurance et al. 2002). The relationship between deforesta-tion and fire can be clearly demonstrated by comparing fire distribution maps withthe recently deforested polygons (Eva and Fritz 2003). Land clearing for newsettlements that are established along roads that cut through the Amazon forest(e.g., federal highways BR163 and BR230 in Pará) promotes the spread of firesfrom forest edges to interior areas (Cochrane 2001; Laurance 2003). A positivefeedback loop is created in these areas where initial deforestation and fire warmsand dries surrounding vegetation, increasing the susceptibility to more intense andlarger fires in the next season (Cochrane et al. 1999; Nepstad et al. 1999). A correctcharacterization of the region’s fire regime is of ultimate importance for trackingenvironmental impacts and developing actions to reduce it.
Vegetation fires are not restricted to the Amazon region in Brazil. In fact, otherbiomes such as the cerrado (savanna) and the caatinga also present large numbersof hot spots that are detected every year (information online at http://www.cptec.inpe.br/queimadas, or http://www.dpi.inpe.br/proarco/bdqueimadas). A correlationbetween fire and land-cover changes in other regions of Brazil outside the Amazonis more difficult to establish because of limited information. The lack of accurateland-cover classification maps and limited field information prohibits a moredetailed characterization of the relationship between fire and land use in cerradoareas (França and Setzer 2001). Satellite detection of surface cover changes in lessvegetated areas requires more laborious methods, limiting their application tolarger scales (Ferreira et al. 2003). However, many informal reports point to fireas an important agent for land conversion, especially in the cerrado. An incon-spicuous process of land conversion is under way over large areas of Brazil wherefire plays a major, but as yet unmeasured, role in driving land-cover change.
The importance of biomass burning to the climate system stimulated the devel-opment of diverse fire-monitoring methods (Kaufman et al. 1990; Menzel et al.1991; Elvidge et al. 1996; Kaufman et al. 1998a; Giglio et al. 2000), experiments(Crutzen et al. 1985; Kaufman et al. 1992; Ward et al. 1992; Kaufman et al.1998b), and land research programs, dedicating special emphasis on forest fireissues [e.g., International Geosphere–Biosphere Programme (IGBP) Land Use andLand Cover Change (LUCC; information available online at http://www.geo.ucl.ac.be/LUCC/lucc.html); National Aeronautics and Space Administration(NASA) Land Cover and Land Use Change (LCLUC; information available onlineat http://lcluc.gsfc.nasa.gov); Global Observation of Forest and Land Cover Dy-namics (GOFC-GOLD; information available online at http://www.fao.org/gtos/gofc-gold)] over the last two decades. In particular, satellite fire detection methodshave been based on a number of sensors aboard a range of orbital platforms,
Earth Interactions • Volume 9 (2005) • Paper No. 13 • Page 3

resulting in different manners of characterizing events at the Earth’s surface. Inthis paper, we focus on daily fire count data from two sensors aboard polar-orbiting satellites—the Advanced Very High Resolution Radiometer (AVHRR)and the Moderate Resolution Imaging Spectroradiometer (MODIS)—to describefire occurrences in Brazil.
The AVHRR sensor aboard the National Oceanic and Atmospheric Adminis-tration (NOAA) polar-orbiting satellites is one of the most widely used instrumentsto monitor vegetation fires. While AVHRR was not specifically developed for firedetection (Kidwell 1991), it has been widely used for this purpose because it ispossible to obtain satisfactory results with this sensor (information online at http://www.cptec.inpe.br/queimadas, or http://www.dpi.inpe.br/proarco/bdqueimadas).A variety of fire detection algorithms utilizing different combinations of bandshave been developed and tested for distinct regions of the globe (e.g., Kaufman etal. 1990; Brustet et al. 1991; França et al. 1995; Setzer and Malingreau 1996;Randriambelo et al. 1998; Stroppiana et al. 2000; Li et al. 2000). AVHRR data arealso important for fire detection because data are available from many NOAAsatellites. A long time series of historical fire data from the AVHRR sensor can befound for some regions of the world (Gutman et al. 2001; see information onlineat http://www.cptec.inpe.br/queimadas, or http://www.dpi.inpe.br/proarco/bdqueimadas), but limited information is available on a global scale.
MODIS was launched aboard the Earth Observing System (EOS) Terra andAqua satellites in December 1999 and May 2002, respectively. Unlike other spa-ceborne moderate resolution sensors at the time, the MODIS instrument wasdesigned with bands that are specifically devoted to monitoring vegetation fires(Justice et al. 1998). Accurate geolocation, atmospheric correction, and productvalidation for MODIS fire products create high-quality data for the scientificcommunity.
The main objective of this paper is to analyze hot-spot data from the AVHRRon board NOAA-12, and the MODIS on board Terra and Aqua to describe firedynamics in Brazil. We start with a brief description of the fire detection algo-rithms for the AVHRR and MODIS fire products. Next, we highlight biases indaily fire counts from the satellite view angle, overpass time, atmospheric condi-tions, and fire characteristics. After aggregating fire counts in space and time tominimize these variations, we assess trends in fire dynamics at three spatial scales:major biomes in Brazil, the nine states of the Brazilian Legal Amazon, and twoimportant road corridors in the Amazon region. Trends among the sensors showfire severity in terms of vegetation distribution, define fire seasons over the Ama-zon region, and characterize the impact of land-use change on fire detections.Aggregated fire statistics for the major Brazilian biomes and each Brazilian Ama-zon state provide insight into biomass burning dynamics in these regions in orderto characterize environmental impacts and develop fire management policies.
2. Data and methods2.1. Fire detection with AVHRR and MODIS
Polar-orbiting environmental satellites are typically placed on sun-synchronousorbits with near-constant equator-crossing times. Except at extremely high lati-
Earth Interactions • Volume 9 (2005) • Paper No. 13 • Page 4

tudes, any point on the Earth is imaged within ± 50 min of the nominal ascendingand descending equator-crossing local times (the exact local times of observationdepend on latitude and the target’s distance from the subsatellite point within theswath). In the Tropics, where swaths from subsequent orbits have minimal over-laps (AVHRR) or even small gaps in coverage (MODIS), a single satellite willtypically image an area once during an ascending and once during a descendingorbit every day. As a result, polar-orbiting satellites capture a snapshot of daily fireactivity over any given area at a certain local time. A more complete mapping ofdaily fire activity from polar satellites is possible by combining observations fromsatellites with different equator-crossing times. For Terra and Aqua, the daytimelocal equator-crossing times are 1030 (descending orbit) and 1330 (ascendingorbit) local time (LT), respectively, and are expected to vary only slightly over thesatellites’ lifetimes. For some NOAA series satellites, a gradual drift of the equa-tor-crossing time has occurred (Price 1991). For NOAA-12, during 2001–03, theequator crossing occurred at 1700–1710 LT.
As determined by the Planck function, a flaming fire front with a temperatureof ∼1000 K has a clearly distinguishable emission peak in the middle infraredregion. Because AVHRR and MODIS measure radiation in bands centered in themiddle infrared region (channel 3 in AVHRR: 3.55–3.93 �m; and channels 21 and22 in MODIS: 3.93–3.99 �m), these two sensors can be used for fire monitoring(Giglio et al. 1999; Kaufman et al. 1998a).
A fire needs not occupy more than a small fraction of the total pixel area to bedetected, allowing the identification of small burning events with moderate reso-lution imagery (Belward et al. 1993). While this is a desirable characteristic, it alsoimposes some limitations on the use of channel 3 on AVHRR. Because thatchannel was not specifically designed to monitor fires, some relevant informationis lost in the digitization of the signal. This loss occurs primarily because of thelow value of saturation of AVHRR channel 3, which is equivalent to 322 K(Csiszar and Sullivan 2002). In many cases, saturation of channel 3 prevents theestimation of fire temperature and extent from AVHRR data. MODIS middleinfrared bands have a higher saturation level of approximately 500 K (Justice et al.2002), enabling the discrimination of a wider range of fire characteristics such asfire size and temperature. For typical Amazon fire conditions [flame temperature:1000 K; background temperature: 300 K; with estimates based on field data(Schroeder et al. 2002)], the fractional pixel area occupied by fire that is requiredto saturate the signal is equal to 0.017% for AVHRR and 1.1% for MODIS.
The NOAA-12 AVHRR fire product used in this paper is based on a fixed-threshold algorithm (Li et al. 2001). All potential fire pixels must exceed a thresh-old in channel 3 (midinfrared band) to identify hot pixels near the saturation level,and in channels 1, 2 (visible bands), 3, and 4 (thermal infrared) to eliminate highlyreflective targets, such as cloud tops and bright soils (Setzer and Pereira 1991;Setzer et al. 1994; Setzer and Malingreau 1996). The resulting fire product is madeavailable to operational fire-monitoring centers in the region within 2 h of imageacquisition. The NOAA-12 AVHRR fire product was created at the Instituto Na-cional de Pesquisas Espaciais (INPE) in Brazil from daily High Resolution PictureTransmission (HRPT) imagery and covers the period of 2001–03. Fire productprocessing is done at the Centro de Previsão do Tempo e Estudos Climáticos(CPTEC) in Cachoeira Paulista. This information is routinely made available to the
Earth Interactions • Volume 9 (2005) • Paper No. 13 • Page 5

general public through simple access to an online data bank where fire (hot spot)coordinates can be downloaded (online at http://www.cptec.inpe.br/queimadas, orhttp://www.dpi.inpe.br/proarco/bdqueimadas).
The MODIS fire product that is presented in this paper was derived using ahybrid contextual/fixed-threshold algorithm (Giglio et al. 2003). The algorithmrelies primarily on a series of adaptive threshold tests to perform relative firedetection; these thresholds are adjusted based on the natural variability of thebackground. An additional fixed-threshold test is used to identify highly unam-biguous fires. Both types of tests look for the characteristic signature of an activefire in which both the 3.96-�m brightness temperature and the 3.96- and 11.0-�mbrightness temperature difference depart substantially from that of the nonfirebackground. Additional specialized tests are used to eliminate false detectionscaused by sun glint, desert boundaries, and errors in the water mask (Giglio et al.2003). The Terra and Aqua MODIS fire products used in this paper were createdat the NASA Goddard Space Flight Center (GSFC) within the MODIS Land RapidResponse System (information online at http://radpidfire.sci.gsfc.nasa.gov/) andcover the period of 2001–03 and 2003, respectively. This product is visualizedusing a Web-based geographical information system (GIS) (available online athttp://maps.geog.umd.edu/) at the University of Maryland, and fire text files areprovided upon request through ftp access. This MODIS fire product is usuallyavailable to the community within 2–3 h following the satellite overpass.
Few validation studies of AVHRR fire product data are documented in theliterature (Belward et al. 1993; Li et al. 2000). However, indirect validation of thedata was accomplished as part of operational fire-monitoring systems in use bycountries (e.g., Brazil). AVHRR fire product development for Brazil showed astrong relationship to vegetation fires in the region, with detection probabilitybeing a function of fire size and intensity and image acquisition conditions (A.Setzer 2004, personal communication). Validation constitutes one distinct com-ponent of the development process of the MODIS fire product (Justice et al. 2002).Validation studies have established the relationship between the MODIS fire prod-uct and vegetation fires (Morisette et al. 2005). The availability of higher-resolution (250 m) visible bands on MODIS improves data quality assessment(e.g., identifying smoke plumes associated with fire detection). Additionally,MODIS’s image navigation characteristics provide accurate fire location informa-tion (Wolfe et al. 2002; Justice et al. 2002), permitting detailed analysis of thespatial trends in land use at smaller scales.
2.2. Analysis of daily hot spots
The relationship between remote sensing–based fire counts and the actual absolutenumber of fires events is an important question. We address this question throughanalysis of time series of daily hot spots. Specifically, we analyze the impacts ofview angle, clouds, overpass time, and fire characteristics on detection probabili-ties and fire counts.
The wide field of view of the AVHRR and the MODIS sensors (approximately55° to each side of nadir) creates images that cover a large swath of the Earth’ssurface (approximately 2400 km). Although wide image swaths are desirable forglobal monitoring, a fixed region of interest on the surface will only be imaged at
Earth Interactions • Volume 9 (2005) • Paper No. 13 • Page 6

near-nadir view angles by both by AVHRR and MODIS sensors approximatelyevery 4 days.
Assuming that the pixel area at nadir for both sensors is close to 1.2 km2, thearea occupied by fire at saturation will cover 0.02 ha in AVHRR (again, consid-ering a flame temperature of 1000 K and background temperature of 300 K). Whilethis value seems to be easily reached under real surface conditions, another factorcontributes to the rapid change of this scenario. Moving away from the center ofthe image, the fire area that is necessary to cause saturation increases due to thegeometric characteristics of image acquisition that cause the pixel area to increase.Using the approximate orbital parameters for NOAA AVHRR and EOS MODIS,we can calculate the effect of pixel distortion.
Figure 1 shows the pixel area increase between nadir and the swath edge forMODIS and AVHRR. In both cases, the increase is large—close to a factor of 10with MODIS and a factor of 16 with AVHRR. The differences between sensors aredue, in part, to different orbital altitudes. Changes in pixel area change the area ofactive fire that is necessary to create the same proportional contribution to a pixel’ssignal for fire detection, because detection probability is a function of fire sizerelative to pixel size (Giglio et al. 1999). As a result, we can expect a clearreduction in the number of hot spots that are detected within an area imaged withan elevated scan angle, compared to the same situation under low scan angles(Giglio et al. 1999).
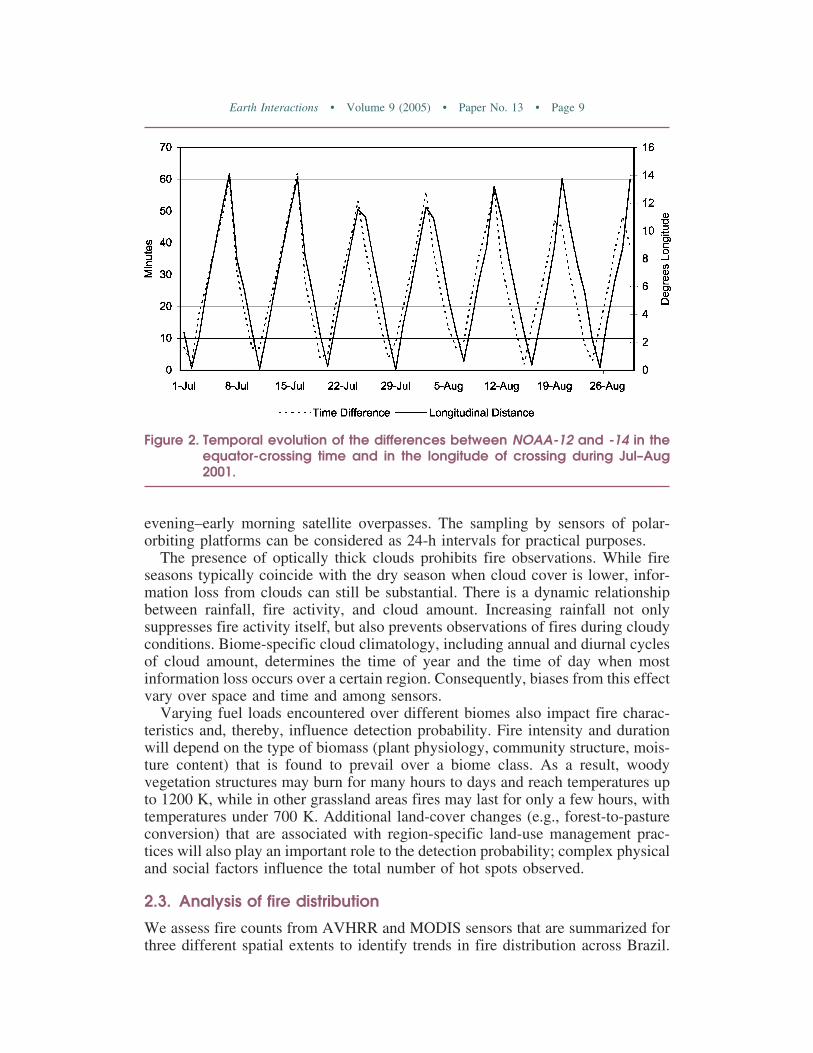
To analyze this effect, we compared hot-spot numbers from AVHRR on NOAA-12 and -14 over the same area. NOAA-12 and -14 are sun-synchronous, polar-orbiting satellites with orbits at 833 and 870 km, respectively. Due to long-termchanges of their orbital characteristics, their equator-crossing times did not remainconstant, resulting in different conditions of image acquisition that were observedover time (Price 1991). In the particular case of NOAA-12 and -14, their equator-crossing time changed in opposite manners, such that there was a drift towardearlier and later local times in the crossing of NOAA-12 and -14, respectively.Therefore, the timing of the two satellites converged, resulting in very similaroverpass times by mid-2001. Figure 2 shows the behavior of the orbits of NOAA-12 and -14 for July and August 2001. The difference in the values varied from aminimum of 5 min or ∼0° longitude to a maximum of 60 min or ∼14° longitude.The convergence of the orbits of these two satellites with similar sensors permittedus to analyze images of the same region, obtained at nearly the same time, butunder different observation angles (target sensor). This unique condition allows forcomparison of images from the two sensors to determine the driving elements thatinfluence hot-spot data derived from polar-orbiting satellites with a fixed instan-taneous field of view (IFOV).
Due to sampling characteristics of polar-orbiting satellites, under normal con-ditions, images are obtained at 12-h intervals from a single satellite (in most cases,one morning–afternoon and one night–early morning overpass; fewer observationsoccur near the equator due to gaps in MODIS coverage). The temporal evolutionof a fire is closely related to surface temperature, with peak activity occurringduring midafternoon hours when high surface temperature and low relative airhumidity are observed. This peak of maximum fire activity may not coincide withthe time of the satellite overpass for the region, thereby underestimating thenumber of hot spots because of real fires on the images. Minimum activity occurs
Earth Interactions • Volume 9 (2005) • Paper No. 13 • Page 7

at dawn when surface temperature reaches its minimum and dew formation in-hibits fire spread. Sensors on geostationary satellites, such as the GeostationaryOperational Environmental Satellite (GOES), allowing for fire monitoring at 30-min intervals, clearly demonstrate this behavior (Prins et al. 1998). As a result,many fires with reduced active flaming fronts are not detected during the late
Figure 1. Pixel size evolution with increasing scan angle for (top) NOAA AVHRR and(bottom) MODIS.
Earth Interactions • Volume 9 (2005) • Paper No. 13 • Page 8
evening–early morning satellite overpasses. The sampling by sensors of polar-orbiting platforms can be considered as 24-h intervals for practical purposes.
The presence of optically thick clouds prohibits fire observations. While fireseasons typically coincide with the dry season when cloud cover is lower, infor-mation loss from clouds can still be substantial. There is a dynamic relationshipbetween rainfall, fire activity, and cloud amount. Increasing rainfall not onlysuppresses fire activity itself, but also prevents observations of fires during cloudyconditions. Biome-specific cloud climatology, including annual and diurnal cyclesof cloud amount, determines the time of year and the time of day when mostinformation loss occurs over a certain region. Consequently, biases from this effectvary over space and time and among sensors.
Varying fuel loads encountered over different biomes also impact fire charac-teristics and, thereby, influence detection probability. Fire intensity and durationwill depend on the type of biomass (plant physiology, community structure, mois-ture content) that is found to prevail over a biome class. As a result, woodyvegetation structures may burn for many hours to days and reach temperatures upto 1200 K, while in other grassland areas fires may last for only a few hours, withtemperatures under 700 K. Additional land-cover changes (e.g., forest-to-pastureconversion) that are associated with region-specific land-use management prac-tices will also play an important role to the detection probability; complex physicaland social factors influence the total number of hot spots observed.
2.3. Analysis of fire distribution
We assess fire counts from AVHRR and MODIS sensors that are summarized forthree different spatial extents to identify trends in fire distribution across Brazil.
Figure 2. Temporal evolution of the differences between NOAA-12 and -14 in theequator-crossing time and in the longitude of crossing during Jul–Aug2001.
Earth Interactions • Volume 9 (2005) • Paper No. 13 • Page 9

Fire counts for each major Brazilian biome highlight trends in fire occurrenceacross a wide range of vegetation and climatic conditions. To focus on fire in theAmazon region, we analyze fire counts for each Brazilian state in the LegalAmazon, and then consider fire use along three important road corridors within theBrazilian Amazon. The spatial extent for fire count summarization decreases foreach successive example. In all three examples, fire counts are summarized an-nually for each sensor (sensor year).
2.3.1. Major Brazilian biomes
Biome classification is based on a generalized map of the major classes found inBrazil where no subclass stratification and land-use changes to the original for-mations are considered (Figure 3). The map divides Brazil into subregions of
Figure 3. IBAMA general biome classification map for Brazil.
Earth Interactions • Volume 9 (2005) • Paper No. 13 • Page 10

similar bioclimatic conditions. This product was provided by the InstitutoBrasileiro do Meio Ambiente e dos Recursos Naturais Renováveis (IBAMA) andcovers 13 different classes, namely, caatinga (semiarid vegetation), campinarana,campos, campos campanha gaúcha, campos de Roraima, cerrado (these are alldifferent types of sparse vegetation with grass) complexo do Pantanal (a recurrentflooded area), floresta Amazônica (Amazon forest), floresta estacional (deciduousforest), ilha (island), mata Atlântica (Atlantic coast forest), mata dos pinheiros(pine forest), and vegetação costeira (coastal vegetation).
The difference between biomes and sensors years can be quantified by consid-ering a simple model:
Cij = � + �Ei+ �Sj,
where Cij represents either fire counts or relative fire counts, for biome i and sensoryear j. A two-factor fixed-effects analysis of variance (ANOVA; Montgomery2001) is used to fit the parameters of the model, where � can be interpreted as theoverall mean, �Ei
as the contribution from biome Ei, and �Sj as the contributionfrom sensor year Sj. This model was applied to both absolute and area-relative firecounts. We conduct statistical hypothesis tests to see if either of the fitted � or �parameters is statistically equivalent to zero. Rejecting this test implies that firecounts differ by biome (rejecting H: � � 0) or sensor year (rejecting H: � � 0).
2.3.2. Brazilian Legal Amazon
Nine states compose the Brazilian Legal Amazon, with a total area exceeding 5 ×10⁶ km2. Given the large area extent, distinct climate regimes exist for variousparts of the basin, driven predominantly by annual patterns of solar radiation andprecipitation from intertropical convergence zone (ITCZ) movement. Wet and dryseasons occur at different times throughout the region; dry seasons create in-creased flammability and higher fire occurrence. The northernmost states, namely,Roraima and Amapá, lie north of the equator and, thereby, have seasonal patternsthat are different from those states south of equator. Rainfall distribution in south-ern Amazonia varies little among the states, with the wet/dry season onset shiftingonly a few weeks over the eastern- and westernmost areas.
To quantify the difference in fire counts between states and sensor years, weused a similar model to the biome analysis:
Cij = � + �Fi+ �Sj,
where all of the parameters have a similar interpretation as the previous model, butnow states (Fi) are substituted for biomes (Ei).
To assess the timing of fire occurrence for each state, we calculate the averagemonth as
�S,Y =�i=1
12
CountsS,Y × i
�i=1
12
CountsS
+ MS,
Earth Interactions • Volume 9 (2005) • Paper No. 13 • Page 11

where CountsS,Y represents the counts for a given state S, indexed by Y, which isthe number of months away from the month with the lowest fire count for that stateMs. This indexing is used to properly average fire counts and is necessary whensubstantial fire counts occur in both the beginning and ending months of the year.Adding the Ms factor into the equation adjusts the indexed months back to thestandard January (�1)–December (�12) indexing. Because the fire season in allof states, except Roraima, occurs during the middle part of the year, breaking downfire counts by the calendar year is appropriate. However, for Roraima, adjustmentswere made; year 2001 represents data from July 2000 to June 2001, and likewisefor 2002 and 2003.
Differences in average month between states and sensor years are quantifiedusing similar modeling:
Mij = � + �Fi+ �Sj,
where Mij represents the average month for state Fi and sensor year Sj, while Mijcan be considered the midpoint of the fire season.
2.3.3. Road corridors
The scarce availability of connecting roads in the Amazon region creates a veryspecific pattern of deforestation and fire use. So-called fishbone deforestationstructures are commonly observed along the major roads cutting through the denseforest. Federal highways BR163 and BR230 in Pará exhibit fishbone land con-version patterns at different stages of development. These two roads were openedonly a few years apart, yet have experienced different colonization mechanisms.
Supported by a strong colonization program, BR230 was rapidly occupied dur-ing the first years after its creation. Financial support from the Brazilian govern-ment served as an incentive for new landowners to occupy the areas along the road(C. Figueiredo 2004, personal communication). In addition to the logging activitiesthat naturally followed the occupation, use of forest wood for charcoal productionand forest conversion to pasture resulted in a drastic land transformation. Charcoalproduction provides fuel for the ferrous exploration companies and raw materialfor the silicium companies in the Serra dos Carajás mining complex that accountsfor large volumes of wood that is extracted from the forest every year [CentroNacional de Referência em Biomassa (CENBIO) information online at http://www.cenbio.org.br].
The creation of BR163 occurred a few years after BR230 was developed. Thecolonization process that followed was much different from the one observed withBR230. Political changes suppressed financial support for new landowners tooccupy the region, making the colonization process much slower. Major activitiesalong BR163 were restricted to gold mining and logging, and poor road conditionsmade the transport of wood, cereals, and other products from the region moredifficult. More recently, intensification of logging activities along BR163, togetherwith the increasing interest in soybean production in the Amazon region, is forcingrapid land conversion in the area.
According to the commonly observed fishbone land transformation pattern thatdominates the areas along major roads in the Brazilian Amazon, side roads, withtheir origins located in the road’s major axis, develop progressively with time.
Earth Interactions • Volume 9 (2005) • Paper No. 13 • Page 12

Continuous land conversion along the road’s major axis and over the perpendicularside roads creates ideal conditions for fire to spread. In our analysis, we useTerra’s MODIS data to identify land conversion patterns by observing fire occur-rence along BR163 and BR230. Three scenarios were delimited according todifferent occupation levels in the region—stage I: deforestation along BR163,where the fishbone structure is under development along Novo Progresso munici-pality; stage II: deforestation along BR230, where a clear fishbone structure isobserved starting from Placas, cutting through Altamira, and reaching Pacajámunicipality; stage III: advanced deforestation along BR230 to the eastern edge ofPará (covering Marabá municipality and vicinity), where the fishbone structurewas replaced by patchy forest remnants (Figure 4). For each scenario, buffers weredefined at 10-km intervals from the road’s major axis up to the limit of 50 km.Hot-spot data for Terra’s MODIS from 2001 to 2003 were extracted and inter-sected with the buffers in order to calculate fire density in each 10-km-widesection from the road:
Fire_densityi = �Hot_spoti − Hot_spoti−1���Buffer_areai − Buffer_areai−1�.
Figure 4. Case scenarios in eastern Amazon region (Pará) with typical deforestationconditions; background image corresponds to the Vegetation Continu-ous Field (VCF; courtesy of M. Hansen 2001) where darker areas representhigher vegetation cover; black areas correspond to water bodies.
Earth Interactions • Volume 9 (2005) • Paper No. 13 • Page 13
3. Results and discussion: Fire dynamics in Brazil3.1. Daily hot spots
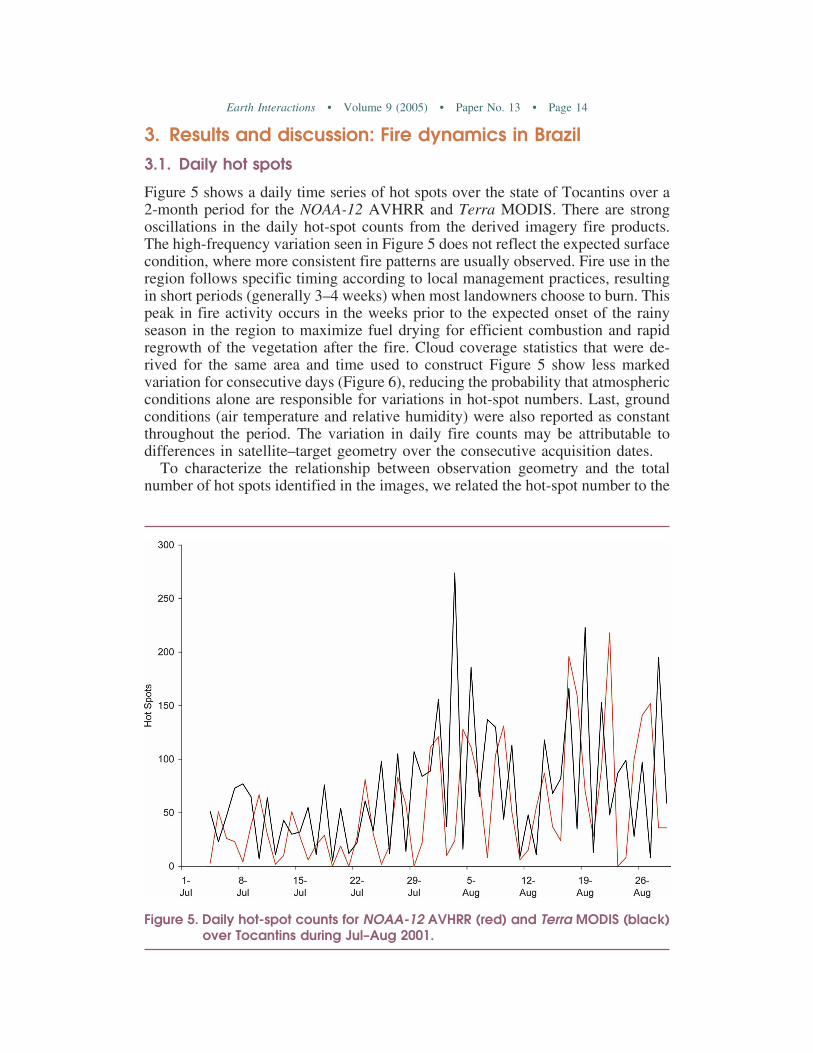
Figure 5 shows a daily time series of hot spots over the state of Tocantins over a2-month period for the NOAA-12 AVHRR and Terra MODIS. There are strongoscillations in the daily hot-spot counts from the derived imagery fire products.The high-frequency variation seen in Figure 5 does not reflect the expected surfacecondition, where more consistent fire patterns are usually observed. Fire use in theregion follows specific timing according to local management practices, resultingin short periods (generally 3–4 weeks) when most landowners choose to burn. Thispeak in fire activity occurs in the weeks prior to the expected onset of the rainyseason in the region to maximize fuel drying for efficient combustion and rapidregrowth of the vegetation after the fire. Cloud coverage statistics that were de-rived for the same area and time used to construct Figure 5 show less markedvariation for consecutive days (Figure 6), reducing the probability that atmosphericconditions alone are responsible for variations in hot-spot numbers. Last, groundconditions (air temperature and relative humidity) were also reported as constantthroughout the period. The variation in daily fire counts may be attributable todifferences in satellite–target geometry over the consecutive acquisition dates.
To characterize the relationship between observation geometry and the totalnumber of hot spots identified in the images, we related the hot-spot number to the
Figure 5. Daily hot-spot counts for NOAA-12 AVHRR (red) and Terra MODIS (black)over Tocantins during Jul–Aug 2001.
Earth Interactions • Volume 9 (2005) • Paper No. 13 • Page 14

associated scan angle derived for each acquisition date. Hot-spot numbers tend tobe higher under low observation angles (near nadir), while fewer hot spots areusually detected under high observation angles (closer to image edge; Figure 7).Figure 8 demonstrates a clear reduction in the number of hot spots detected byNOAA-14 (equator-crossing time: 2059 UTC; scan angle: 42°; hot spots: 25)relative to NOAA-12 (equator-crossing time: 2026 UTC; scan angle: 7°; hot spots:111), with a difference of 86 hot spots between the two sensors. Many of the hotspots that are detected by NOAA-12 show no corresponding elements on theNOAA-14 product, excluding the possibility of a single fire event being repre-sented by different numbers of hot spots as a result of distinct image geometry.This serves to illustrate the reduction in detection capability as an area is imagedunder larger scan angles. Furthermore, the longitudinal distance between satelliteswas intermediate on this date (approximately 6° between the two), so that largerdifferences in detection may be observed on other dates.
From the above analysis we conclude that the view-angle effect decreases themonthly total number of fire counts derived from daily data as compared to atheoretical number based on daily observations at nadir. This is a consequence ofthe daily variation of view angle at which a given location is observed. While theview-angle effect is an inherent characteristic of the sensors used, additionaleffects also contribute to the loss of information.
Considering possible additional sources of information loss, such as the eventual
Figure 6. NOAA-12 AVHRR daily hot-spot counts (red) and cloud coverage per-centage (black) for Tocantins during Jul–Aug 2001; cloud coveragevalues estimated from NOAA-12 AVHRR imagery.
Earth Interactions • Volume 9 (2005) • Paper No. 13 • Page 15

loss of data due to transmission problems at the time of overpass, the time betweenobservations from a single satellite can increase to 48–72 h, although this is lesslikely. Consequently, we can conclude that the number of fires observed by thethree sensors used here is lower than what could have been detected under idealconditions. Absolute numbers of fire counts reflect a wide range of limitations, and
Figure 7. Hot-spot numbers vs approximate scan angle for NOAA-12 and -14AVHRR data during (top) Jul 2001 and (bottom) Aug 2001.
Earth Interactions • Volume 9 (2005) • Paper No. 13 • Page 16

any conclusions and statistics drawn from these data should be considered in thislight. However, the signal of relative changes of fire counts over space, time, andbetween sensors, can help to characterize the spatial and temporal distribution offire activity in Brazil, including the dependence of fire counts on vegetation cover,the time of observation, and their interannual variability.
3.2. Trends: Major Brazilian biomes
Table 1 shows hot-spot numbers derived for the NOAA-12 AVHRR and Terra andAqua MODIS for the major Brazilian biomes. Table 2 presents fire counts relativeto the total area for each biome (hot spots/area). Each table is color coded for the
Figure 8. Hot spots detected over Tocantins in Brazil on 31 Jul 2001 for NOAA-12(equator-crossing time: 2026 UTC; scan angle: 7°; hot spots: 111) andNOAA-14 (equator-crossing time: 2059 UTC; scan angle: 42°; hot spots:25), superimposed on a red–green–blue (RGB) Landsat-6 image (bands:R = 5, G = 4, B = 3).
Earth Interactions • Volume 9 (2005) • Paper No. 13 • Page 17

first, second, and third highest biome for each sensor year. Table 1 shows fairlyconsistent numbers for different sensors and years. The three largest biomes inBrazil—the floresta Amazônica, floresta estacional, and cerrado—cover 80% ofthe total Brazilian land area and account for approximately 84% of the totalnumber of hot spots that are detected every year. For absolute fire counts, thesethree biomes are the top three for any sensor year.
Considering the fire counts relative to a biome’s area highlights how prone agiven unit area may be to fire for a given biome. In Table 2, floresta estacional andcerrado biomes still show large values and are either the highest or second highestbiome for any given sensor year. Relative fire counts for floresta Amazônica arenot in the top three values for any sensor year; consideration of the biome’s largeunpopulated area (totaling 1 × 10⁶ km2 or the equivalent of 28% of the biome’sarea) can cause it to reach the third highest value for both the Aqua 2003 and
Table 2. Hot-spot numbers relative to the total area (counts per squared kilometer)for each biome. Fields are color coded depicting highest values: dark yellow: firsthighest; light yellow: second highest; blue: third highest.
BiomeTerra2001
Terra2002
Terra2003
Aqua2003
AVHRR2001
AVHRR2002
AVHRR2003
Caatinga 0.0056 0.0055 0.0067 0.0316 0.0237 0.0308 0.0409Campinarana 0.0002 0.0001 0.0007 0.0012 0.0004 0.0002 0.0011Campos 0.0056 0.0049 0.0037 0.0072 0.0046 0.0068 0.0059Campos campanha gaúcha 0.0011 0.0009 0.0011 0.0044 0.0011 0.0024 0.0008Campos de Roraima 0.0184 0.0181 0.0072 0.0140 0.0077 0.0102 0.0088Cerrado 0.0192 0.0254 0.0187 0.0324 0.0183 0.0306 0.0247Complexo do Pantanal 0.0348 0.0478 0.0120 0.0203 0.0418 0.0686 0.0150Floresta Amazônica 0.0054 0.0083 0.0069 0.0248 0.0143 0.0238 0.0174Floresta estacional 0.0145 0.0250 0.0242 0.0455 0.0230 0.0376 0.0415Ilha 0 0 0 0 0 0 0Mata Atlântica 0.0029 0.0031 0.0047 0.0168 0.0037 0.0079 0.0122Mata dos pinheiros 0.0014 0.0015 0.0039 0.0505 0.0047 0.0076 0.0189Vegetação costeira 0.0077 0.0063 0.0057 0.0163 0.0109 0.0153 0.0137
Table 1. Total hot-spot numbers per major biome class in Brazil. Fields are colorcoded depicting highest values: dark yellow: first highest; light yellow: secondhighest; blue: third highest.
BiomeTerra2001
Terra2002
Terra2003
Aqua2003
AVHRR2001
AVHRR2002
AVHRR2003
Caatinga 4143 4027 4921 23237 17377 22652 30028Campinarana 50 27 203 336 125 44 302Campos 615 541 403 796 513 750 646Campos campanha gaúcha 67 55 72 274 70 152 52Campos de Roraima 227 224 89 173 95 126 109Cerrado 30205 39878 29378 50911 28747 47958 38766Complexo do Pantanal 5601 7696 1928 3260 6723 11028 2415Floresta Amazônica 19074 29452 24337 88027 50835 84338 61892Floresta estacional 23887 41109 39835 74713 37736 61782 68240Ilha 0 0 0 0 0 0 0Mata Atlântica 720 773 1168 4137 908 1942 2998Mata dos pinheiros 251 284 717 9302 873 1392 3478Vegetação costeira 1111 900 813 2335 1563 2196 1970
Earth Interactions • Volume 9 (2005) • Paper No. 13 • Page 18
AVHRR 2002 relative fire counts. The complexo do Pantanal biome had thehighest relative fire counts in 2001 and 2002, and fairly high counts in 2003 aswell. The relative fire counts also show the significance of fires in the caatinga andcampos de Roraima biomes.
In modeling both the absolute and relative fire counts as a function of biome andsensor year, both � and � terms were statistically different from zero at a 99.8%confidence level, thus, indicating a statistically significant difference in fire countsnot only between biomes but also between sensor years.
The differences between sensor years can be attributed to any or all of the issuesaffecting satellite-derived fire counts, namely, satellite coverage and image acqui-sition characteristics, biome-dependent factors (such as cloud coverage, fuel load,and fire characteristics), and the fire diurnal cycle. For 9 out of the 12 biomes, thehighest number of fire counts comes from the Aqua MODIS sensor, which impliesa diurnal trend of more afternoon fires, less cloud cover during the Aqua overpasstime, or more fire sensitivity from the Aqua MODIS sensor. Differences in in-strument specification between the Terra and Aqua MODIS sensors are small andthe algorithms are identical (Giglio et al. 2003), so more sensitivity from the AquaMODIS sensor is unlikely. The diurnal trend is supported by findings from geo-stationary satellites (Prins et al. 1998). The relatively high fire counts for 2003Aqua MODIS data for mata dos pinheiros may indicate a more pronounced diurnalinfluence for this biome, where consistently larger detection numbers result in asmuch as 13 times more hot spots for this sensor, compared to Terra MODIS datafor the same year.
3.3. Trends: Brazilian Legal Amazon
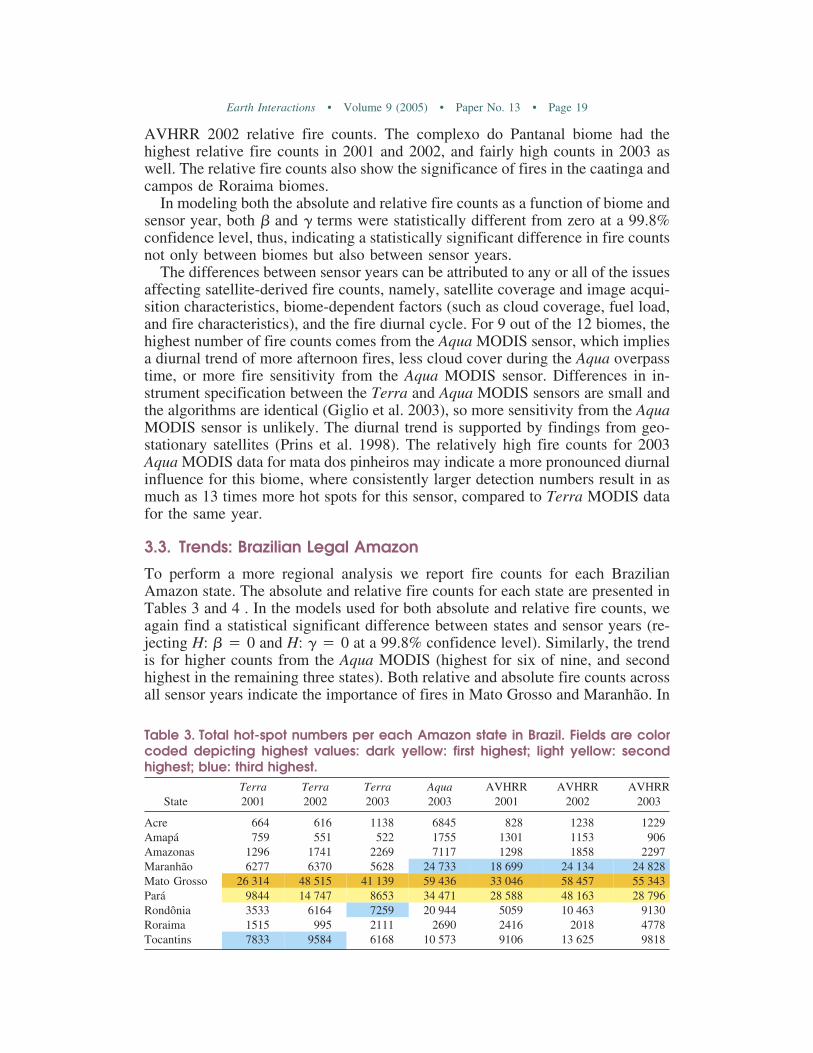
To perform a more regional analysis we report fire counts for each BrazilianAmazon state. The absolute and relative fire counts for each state are presented inTables 3 and 4 . In the models used for both absolute and relative fire counts, weagain find a statistical significant difference between states and sensor years (re-jecting H: � � 0 and H: � � 0 at a 99.8% confidence level). Similarly, the trendis for higher counts from the Aqua MODIS (highest for six of nine, and secondhighest in the remaining three states). Both relative and absolute fire counts acrossall sensor years indicate the importance of fires in Mato Grosso and Maranhão. In
Table 3. Total hot-spot numbers per each Amazon state in Brazil. Fields are colorcoded depicting highest values: dark yellow: first highest; light yellow: secondhighest; blue: third highest.
StateTerra2001
Terra2002
Terra2003
Aqua2003
AVHRR2001
AVHRR2002
AVHRR2003
Acre 664 616 1138 6845 828 1238 1229Amapá 759 551 522 1755 1301 1153 906Amazonas 1296 1741 2269 7117 1298 1858 2297Maranhão 6277 6370 5628 24 733 18 699 24 134 24 828Mato Grosso 26 314 48 515 41 139 59 436 33 046 58 457 55 343Pará 9844 14 747 8653 34 471 28 588 48 163 28 796Rondônia 3533 6164 7259 20 944 5059 10 463 9130Roraima 1515 995 2111 2690 2416 2018 4778Tocantins 7833 9584 6168 10 573 9106 13 625 9818
Earth Interactions • Volume 9 (2005) • Paper No. 13 • Page 19
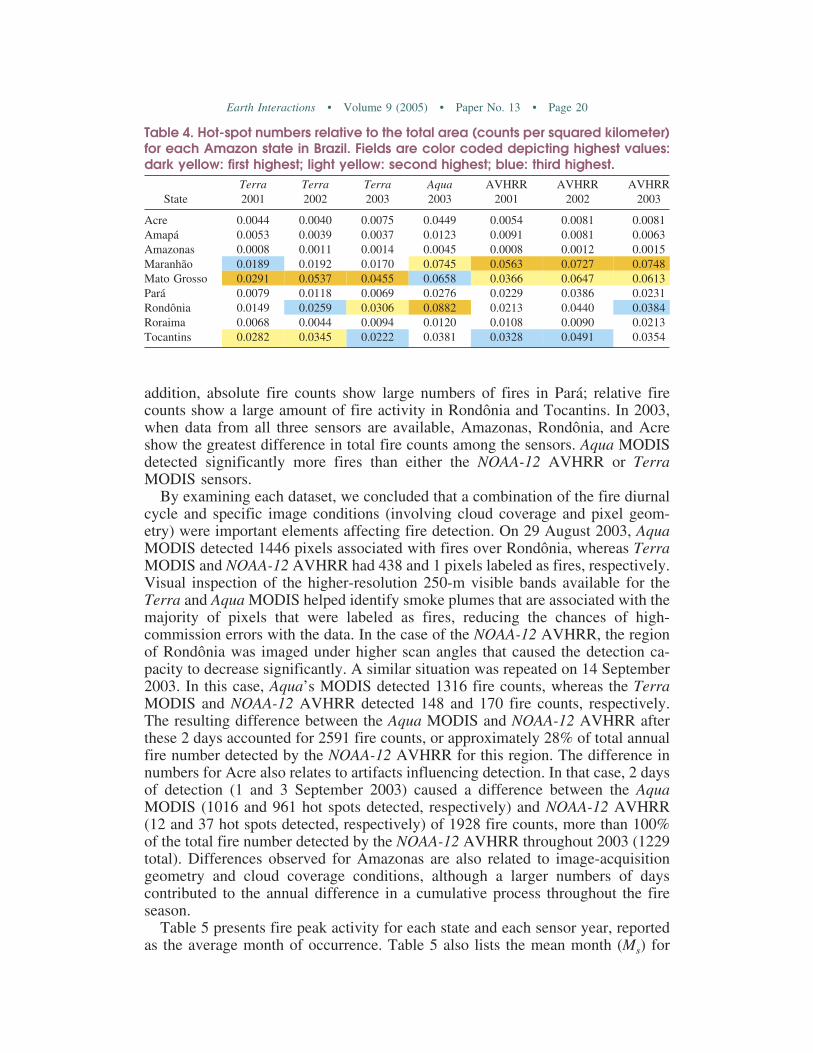
addition, absolute fire counts show large numbers of fires in Pará; relative firecounts show a large amount of fire activity in Rondônia and Tocantins. In 2003,when data from all three sensors are available, Amazonas, Rondônia, and Acreshow the greatest difference in total fire counts among the sensors. Aqua MODISdetected significantly more fires than either the NOAA-12 AVHRR or TerraMODIS sensors.
By examining each dataset, we concluded that a combination of the fire diurnalcycle and specific image conditions (involving cloud coverage and pixel geom-etry) were important elements affecting fire detection. On 29 August 2003, AquaMODIS detected 1446 pixels associated with fires over Rondônia, whereas TerraMODIS and NOAA-12 AVHRR had 438 and 1 pixels labeled as fires, respectively.Visual inspection of the higher-resolution 250-m visible bands available for theTerra and Aqua MODIS helped identify smoke plumes that are associated with themajority of pixels that were labeled as fires, reducing the chances of high-commission errors with the data. In the case of the NOAA-12 AVHRR, the regionof Rondônia was imaged under higher scan angles that caused the detection ca-pacity to decrease significantly. A similar situation was repeated on 14 September2003. In this case, Aqua’s MODIS detected 1316 fire counts, whereas the TerraMODIS and NOAA-12 AVHRR detected 148 and 170 fire counts, respectively.The resulting difference between the Aqua MODIS and NOAA-12 AVHRR afterthese 2 days accounted for 2591 fire counts, or approximately 28% of total annualfire number detected by the NOAA-12 AVHRR for this region. The difference innumbers for Acre also relates to artifacts influencing detection. In that case, 2 daysof detection (1 and 3 September 2003) caused a difference between the AquaMODIS (1016 and 961 hot spots detected, respectively) and NOAA-12 AVHRR(12 and 37 hot spots detected, respectively) of 1928 fire counts, more than 100%of the total fire number detected by the NOAA-12 AVHRR throughout 2003 (1229total). Differences observed for Amazonas are also related to image-acquisitiongeometry and cloud coverage conditions, although a larger numbers of dayscontributed to the annual difference in a cumulative process throughout the fireseason.
Table 5 presents fire peak activity for each state and each sensor year, reportedas the average month of occurrence. Table 5 also lists the mean month (Ms) for
Table 4. Hot-spot numbers relative to the total area (counts per squared kilometer)for each Amazon state in Brazil. Fields are color coded depicting highest values:dark yellow: first highest; light yellow: second highest; blue: third highest.
StateTerra2001
Terra2002
Terra2003
Aqua2003
AVHRR2001
AVHRR2002
AVHRR2003
Acre 0.0044 0.0040 0.0075 0.0449 0.0054 0.0081 0.0081Amapá 0.0053 0.0039 0.0037 0.0123 0.0091 0.0081 0.0063Amazonas 0.0008 0.0011 0.0014 0.0045 0.0008 0.0012 0.0015Maranhão 0.0189 0.0192 0.0170 0.0745 0.0563 0.0727 0.0748Mato Grosso 0.0291 0.0537 0.0455 0.0658 0.0366 0.0647 0.0613Pará 0.0079 0.0118 0.0069 0.0276 0.0229 0.0386 0.0231Rondônia 0.0149 0.0259 0.0306 0.0882 0.0213 0.0440 0.0384Roraima 0.0068 0.0044 0.0094 0.0120 0.0108 0.0090 0.0213Tocantins 0.0282 0.0345 0.0222 0.0381 0.0328 0.0491 0.0354
Earth Interactions • Volume 9 (2005) • Paper No. 13 • Page 20

each state. We see that there is agreement among sensors regarding the timing ofthe fire season. The mean month of peak fire counts falls early in the year forRoraima, later in the year for Amapá, and for all other states is in the September–October time frame.
Interestingly, the model shows that the average month is statistically differentbetween states (rejecting H: � � 0 at a 99.9% confidence level) primarily due toRoraima, but the difference in the average month from the different sensors is notsignificant (fail to reject H: � � 0, p value > 0.10).
3.4. Trends: BR163 and BR230
Figure 9 shows that the original tendency of declining fire density with increasingdistance from the road’s major axis (stage I) is replaced by a more equal distri-bution over the whole 50-km range from the road as land transformation developswith time. A similar hot-spot spatial distribution is observed for the Terra andAqua MODIS and NOAA-12 AVHRR. Once the fishbone structure is well con-solidated along the road (as in stage II), fire occurrence reaches an equilibrium thatwill be maintained until the forest remnants are left in the form of loose patches(stage III). As the area is colonized, an increasing number of new small cities arecreated, allowing more people in the area, changing land use, and limiting fire asa component of land management. Different types of fires (conversion versusmaintenance) during the three stages have varying flame size, intensity, timing,and duration, and, thereby, are expected to impact satellite-derived fire statisticsdifferently. Interaction between fire characteristics and the surrounding local en-vironment will also dictate the probability of detection in this case. Differences inthe fire counts among sensors, as shown in Figure 9, could be attributable to thesevariations.
4. ConclusionsBiomass burning in the Tropics impacts large areas every year, and the BrazilianAmazon is known to be a major contributor to total hot-spot numbers that aredetected through satellite imagery. Major drivers of satellite-derived fire numbers(hot spots) are due to physical, socioeconomic, and sensor-inherent factors. Com-
Table 5. Fire peak activity for each Brazilian state in Amazonia and each sensoryear reported as average month of occurrence.
StateTerra2001
Terra2002
Terra2003
Aqua2003
AVHRR2001
AVHRR2002
AVHRR2003 Ms
Acre 9.6 10.2 9.4 9.7 9.7 10.0 9.4 7Amapá 12.1 11.6 11.8 11.9 12.1 11.8 12.3 3Amazonas 10.4 10.2 10.2 10.3 10.3 10.2 10.2 4Maranhão 9.6 9.7 9.7 10.7 10.8 11.1 11.0 3Mato Grosso 9.4 9.3 9.1 9.1 9.1 9.2 9.0 6Pará 10.3 9.9 10.0 10.6 10.4 10.3 10.6 4Rondônia 9.8 10.2 9.9 9.9 9.7 9.9 9.6 4Roraima 2.9 2.0 2.9 2.9 3.6 3.1 3.4 4Tocantins 9.1 9.3 9.4 9.5 9.6 9.7 9.7 3
Earth Interactions • Volume 9 (2005) • Paper No. 13 • Page 21

Figure 9. Hot spots relative to each buffer area for stages I, II, and III for (top) TerraMODIS 2001–03, (middle) Aqua MODIS 2003, and (bottom) NOAA-12AVHRR 2001–03.
Earth Interactions • Volume 9 (2005) • Paper No. 13 • Page 22

plex interactions among these factors will influence the spatial and temporal char-acterization of fire activity using different satellite sensors. Here, we assess firedynamics in Brazil using fire product data from NOAA-12 AVHRR, and Terra andAqua MODIS. Common trends observed across biomes and state boundaries areapparent, but statistically significant differences between sensor-years also exist.This stresses the limitation of making general statements, and the need to considerinterannual variability as well as the additional caveats presented in this paper. Amore stable result between sensors and years is the timing of fires; the averagemonth of peak fire activity, presented in Table 5, would appear to be a reliablefinding. Three road corridors in the Amazon showed a spatial distribution of firecounts that is consistent with distinct levels of land transformation. Still, differ-ences in the numbers depicted by each sensor that was used remained significant.
Limiting vegetation fire analyses to a single sensor’s data may lead to theincorrect characterization of a region’s fire dynamics, thereby inappropriatelyaffecting public policies of land-use management and fire use. Integrating datafrom multiple sensors may be the best way to currently assess fire occurrence fromsatellite imagery down to a reasonable spatial scale (i.e., detection limits as re-garding fire size and intensity). Data integration involves consideration of mul-tiple, interdependent elements, such as cloud coverage and biome type, requiringa nontrivial approach to correctly account for these problems. By integratingmultiple datasets, we believe it is possible to assess fire continuity over time andspace and reduce uncertainties in fire counts derived by a single system. Additionalresearch will be essential to address these challenges of data integration.
Acknowledgments. We thank Alberto Setzer and Centro de Previsão do Tempo eEstudos Climáticos (CPTEC/INPE) for facilitating NOAA-12 AVHRR data access forBrazil. We thank Carmen Figueiredo for valuable discussions involving social dynamicsof fire use in the Brazilian Amazon. This work was funded in part through NASA’sLBA-Eco Phase II program (Grant LBA/02-0000-0025).
ReferencesArtaxo, P., E. T. Fernandes, J. V. Martins, M. A. Yamasoe, P. V. Hobbs, W. Maenhaut, K. M.
Longo, and A. Castanho, 1998: Large-scale aerosol source apportionment in Amazonia.J. Geophys. Res., 103 (D24), 31 837–31 847.
Belward, A. S., and Coauthors, 1993: In-situ, real-time fire detection using NOAA-AVHRR data.Proceedings, Sixth AVHRR Data Users’ Meeting, Belgirate, Italy, EUMETSAT JRC, 333–339.
Brustet, J. M., J. B. Vickos, J. Fontan, K. Manissadjan, A. Podaire, and F. Lavenu, 1991: Remotesensing of biomass burning in West Africa with NOAA-AVHRR. Global Biomass Burning:Atmospheric, Climatic, and Biospheric Implications, J. S. Levine, Ed., MIT Press, 47–52.
Cardoso, M., G. C. Hurtt, B. Moore, C. Nobre, and E. Prins, 2003: Projecting future fire activityin Amazonia. Global Change Biol., 9, 656–669.
Cochrane, M., 2001: Synergistic interactions between habitat fragmentation and fire in evergreentropical forests. Conserv. Biol., 15, 1515–1521.
——, and M. Schulze, 1998: Forest fires in the Brazilian Amazon. Conserv. Biol., 12, 948–950.——, A. Alencar, M. D. Schulze, C. M. Souza Jr., D. C. Nepstad, P. Lefebvre, and E. A. Davidson,
1999: Positive feedbacks in the fire dynamic of closed canopy tropical forests. Science, 284,1832–1835.
Earth Interactions • Volume 9 (2005) • Paper No. 13 • Page 23

Crutzen, P., and M. O. Andreae, 1990: Biomass burning in the tropics: Impact on atmosphericchemistry and biogeochemical cycles. Science, 250, 1669–1678.
——, and Coauthors, 1985: Tropospheric chemical composition measurements in Brazil during thedry season. J. Atmos. Chem., 2, 233–256.
Csiszar, I., and J. Sullivan, 2002: Recalculated pre-launch saturation temperatures of the AVHRR3.7 �m sensors on board the TIROS-N to NOAA–14 satellites. Int. J. Remote Sens., 23,5271–5276.
Dwyer, E., S. Pinnock, J.-M. Grégroire, and J. M. C. Pereira, 2000: Global spatial and temporaldistribution of vegetation fire as determined from satellite observations. Int. J. Remote Sens.,21, 1289–1302.
Eck, T. F., B. N. Holben, I. Slutsker, and A. Setzer, 1998: Measurements of irradiance attenuationand estimation of aerosol single scattering albedo for biomass burning aerosols in Amazonia.J. Geophys. Res., 103 (D24), 31 865–31 878.
Elvidge, C. D., H. W. Kroehl, E. A. Kihn, K. E. Baugh, E. R. Davis, and W. M. Hao, 1996:Algorithm for the retrieval of fire pixels from DMSP Operational Linescan System Data.Remote Sensing, Modeling and Inventory Development, and Biomass Burning in Africa, J. S.Levine, Ed., Vo. 1, Biomass Burning and Global Change, MIT Press, 73–85.
——, V. R. Hobson, K. E. Baugh, J. B. Dietz, Y. Shimabukuro, T. Krug, E. M. L. M. Novo, andF. R. Echavarria, 2001: DMSP-OLS estimation of tropical forest area impacted by surfacefires in Roraima, Brazil: 1995 versus 1998. Int. J. Remote Sens., 22, 2661–2673.
Eva, H., and S. Fritz, 2003: Examining the potential of using remotely sensed fire data to predictareas of rapid forest change in South America. Appl. Geogr., 23, 189–204.
Ferreira, L. G., H. Yoshioka, A. Huete, and E. E. Sano, 2003: Seasonal landscape and spectralvegetation index dynamics in the Brazilian Cerrado: An analysis within the Large-ScaleBiosphere-Atmosphere Experiment in Amazônia (LBA). Remote Sens. Environ., 87, 534–550.
Figueroa, S. N., and C. A. Nobre, 1990: Precipitation distribution over central and western tropicalSouth America. Climanálise, Vol. 5, No. 6, CPTEC/INPE, 36–45.
França, H., and A. W. Setzer, 2001: AVHRR analysis of a savanna site through a fire season inBrazil. Int. J. Remote Sens., 22, 2449–2461.
França, J. R. A., J.-M. Brustet, and J. Fontan, 1995: Multispectral remote sensing of biomassburning in west Africa. J. Atmos. Chem., 22, 81–110.
Giglio, L., J. D. Kendall, and C. O. Justice, 1999: Evaluation of global fire detection algorithmsusing simulated AVHRR infrared data. Int. J. Remote Sens., 20, 1947–1985.
——, ——, and C. J. Tucker, 2000: Remote sensing of fires with the TRMM VIRS. Int. J. RemoteSens., 21, 203–207.
——, J. Descloitres, C. O. Justice, and Y. Kaufman, 2003: An enhanced contextual fire detectionalgorithm for MODIS. Remote Sens. Environ., 47, 1311–1318.
Gutman, G., C. Elvidge, I. Csiszar, and P. Romanov, 2001: NOAA archives of data from meteo-rological satellites useful for fire products. Global and Regional Wildfire Monitoring fromSpace: Planning a Coordinated International Effort, F. Ahern, J. Goldammer, and C. O.Juctice, Eds., SPB Academic Publishing, 257–266.
Hao, M., and M.-H. Liu, 1994: Spatial and temporal distribution of tropical biomass burning.Global Biol. Cycles, 8, 495–503.
Hoffmann, W. A., W. Schroeder, and R. B. Jackson, 2002: Positive feedbacks of fire, climate, andvegetation and the conversion of tropical savanna. Geophys. Res. Lett., 29, 2052,doi:10.1029/2002GL015424.
——, ——, and ——, 2003: Regional feedbacks among fire, climate and tropical deforestation.J. Geophys. Res., 108, 4721, doi:10.1029/2003JD003494.
Earth Interactions • Volume 9 (2005) • Paper No. 13 • Page 24

Justice, C. O., and Coauthors, 1998: The Moderate Resolution Imaging Spectroradiometer(MODIS): Land remote sensing for global change research. IEEE Trans. Geosci. RemoteSens., 36, 1228–1249.
——, and ——, 2002: The MODIS fire products. Remote Sens. Environ., 83, 244–262.Kaufman, Y. J., C. J. Tucker, and I. Fung, 1990: Remote sensing of biomass burning in the tropics.
J. Geophys. Res., 95, 9927–9939.——, A. Setzer, D. E. Ward, D. Tanre, B. N. Holben, P. Menzel, M. C. Pereira, and R. Rasmussen,
1992: Biomass burning airborne and spaceborne experiment in the Amazon (BASE-A).J. Geophys. Res., 97, 14 581–14 599.
——, C. Justice, L. Flynn, J. Kendall, E. M. Prins, D. E. Ward, and A. Setzer, 1998a: Potentialglobal fire monitoring from EOS-MODIS. J. Geophys. Res., 103, 32 215–32 238.
——, and Coauthors, 1998b: Smoke, Clouds, and Radiation-Brazil (SCAR-B) experiment.J. Geophys. Res., 103 (D24), 31 783–31 808.
Kidwell, K. B., 1991: NOAA Polar Orbiter user’s guide. NOAA/NESDIS.Laurance, W. F., 2003: Slow burn: The insidious effects of surface fires on tropical forests. Trends
Ecol. Evol., 18, 209–212.——, A. K. M. Albernaz, and C. Da Costa, 2001: Is deforestation accelerating in the Brazilian
Amazon? Environ. Conserv., 28, 305–311.——, ——, G. Schroth, P. M. Fearnside, S. Bergen, E. M. Venticinque, and C. Da Costa, 2002:
Predictors of deforestation in the Brazilian Amazon. J. Biogeogr., 29, 737–748.Lenoble, J., 1991: The particulate matter from biomass burning: A tutorial and critical review of
its radiative impact. Global Biomass Burning: Atmospheric, Climatic, and Biospheric Im-plications, J. S. Levine, Ed., MIT Press, 381–386.
Li, Z., S. Wandon, and J. Cihlar, 2000: Satellite-based detection of Canadian boreal forest fires:Development and application of the algorithm. Int. J. Remote Sens., 21, 3057–3069.
——, Y. J. Kaufman, C. Ichoku, R. Fraser, A. Trishchenko, L. Giglio, J.-Z. Jin, and X. Yu, 2001:A review of AVHRR-based fire detection algorithms: Principles, limitation, sand recom-mendations. Global and Regional Wildfire Monitoring from Space: Planning a CoordinatedInternational Effort, F. Ahern, J. Goldammer, and C. O. Juctice, Eds., SPB AcademicPublishing, 199–225.
Menzel, W. P., E. C. Cutrim, and E. M. Prins, 1991: Geostationary satellite estimation of biomassburning in Amazonia during BASE-A. Global Biomass Burning: Atmospheric, Climatic, andBiospheric Implications, J. S. Levine, Ed., MIT Press, 41–46.
Montgomery, D. C., 2001: Design and Analysis of Experiments. 5th ed. John Wiley and Sons,684 pp.
Morisette, J. T., L. Giglio, I. Csiszar, A. Setzer, W. Schroeder, D. Morton, and C. O. Justice, 2005:Validation of MODIS active fire detection products derived from two algorithms. EarthInteractions, in press.
Nepstad, D. C., and Coauthors, 1999: Large-scale impoverishment of Amazonian forests by log-ging and fire. Nature, 398, 505–508.
Nobre, C. A., L. F. Mattos, C. P. Dereczynski, T. A. Tarasova, and I. V. Trosnikov, 1998:Overview of atmospheric conditions during the Smoke, Clouds, and Radiation-Brazil(SCAR-B) field experiment. J. Geophys. Res., 103 (D24), 31 809–31 820.
Phulpin, T., F. Lavenu, M. F. Bellan, B. Mougenot, and F. Blasco, 2002: Using SPOT-4 HRVIRand VEGETATION sensors to asses impact of tropical forest fires in Roraima, Brazil. Int.J. Remote Sens., 23, 1943–1966.
Price, J. C., 1991: Timing of NOAA afternoon passes. Int. J. Remote Sens., 12, 193–198.Prins, E. M., J. M. Feltz, W. P. Menzel, and D. E. Ward, 1998: An overview of GOES-8 diurnal
fire and smoke results for SCAR-B and 1995 fire season in South America. J. Geophys. Res.,103 (D24), 31 821–31 835.
Earth Interactions • Volume 9 (2005) • Paper No. 13 • Page 25

Randriambelo, T., S. Baldy, M. Bessafi, M. Petit, and M. Despinoy, 1998: An improved detectionand characterization of active fires and smoke plumes in South-Eastern Africa and Mada-gascar. Int. J. Remote Sens., 19, 2623–2638.
Reinhardt, T. E., R. D. Ottmar, and C. Castilla, 2001: Smoke impacts from agricultural burning inrural Brazilian Town. J. Air Waste Manage., 51, 443–450.
Ross, J. L., and P. V. Hobbs, 1998: Radiative characteristics of regional hazes dominated by smokefrom biomass burning in Brazil: Closure tests and direct radiative forcing. J. Geophys. Res.,103 (D24), 31 925–31 941.
Schroeder, W., J. A. R. Pereira, J. T. Morisette, I. Csiszar, P. Riggan, and J. W. Hoffman, 2002:A description of the “Firemapper™” airborne sensor validation campaigns in Brazil forquantifying the accuracy of MODIS fire products. Earth Observer, Vol. 14, No. 6, EarthObserving System, 38–42.
Setzer, A. W., and M. C. Pereira, 1991: Operational detection of fires in Brazil with NOAA/AVHRR. 24th Int. Symp. on Remote Sensing of the Environment, Rio de Janeiro, Brazil,ERIM, 469–482.
——, and J. P. Malingreau, 1996: AVHRR monitoring of vegetation fires in the Tropics: Towardthe development of a global product. Remote Sensing, Modeling and Inventory Development,and Biomass Burning in Africa, J. S. Levine, Ed., Vol. 1, Biomass Burning and GlobalChange, MIT Press, 25–39.
——, A. C. Pereira Jr., and M. C. Pereira, 1994: Satellite studies of biomass burning in Amazonia:Some practical aspects. Remote Sens. Rev., 10, 91–103.
Stroppiana, D., S. Pinnock, and J.-M. Grégoire, 2000: The global fire product: Daily fire occur-rence from April 1992 to December 1993 derived from NOAA AVHRR data. Int. J. RemoteSens., 21, 1279–1288.
Ward, D. E., and Coauthors, 1992: Emissions and burning characteristics of biomass fires forcerrado and tropical forest regions of Brazil-BASE-B experiment. J. Geophys. Res., 97,14 601–14 619.
Wolfe, R. E., M. Nishihama, A. J. Fleig, J. A. Kuyper, D. P. Roy, J. C. Storey, and F. S. Patt, 2002:Achieving sub-pixel geolocation accuracy in support of MODIS land science. Remote Sens.Environ., 83, 31–49.
Earth Interactions is published jointly by the American Meteorological Society, the American GeophysicalUnion, and the Association of American Geographers. Permission to use figures, tables, and brief excerptsfrom this journal in scientific and educational works is hereby granted provided that the source is acknowl-edged. Any use of material in this journal that is determined to be “fair use” under Section 107 or thatsatisfies the conditions specified in Section 108 of the U.S. Copyright Law (17 USC, as revised by P.IL.94-553) does not require the publishers’ permission. For permission for any other form of copying, contactone of the copublishing societies.
Earth Interactions • Volume 9 (2005) • Paper No. 13 • Page 26