Embed Size (px)
Citation preview

Charge Carrier Mapping for Z-schemePhotocatalytic Water Splitting Sheet byCategorization of Microscopic Time-resolved ImageSequenceMakoto Ebihara
Chuo UniversityTakeshi Ikeda
TOTO Ltd.Sayuri Okunaka
Japan Technological Research Association of Arti�cial Photosynthetic Chemical Process (ARPChem)Hiromasa Tokudome
Japan Technological Research Association of Arti�cial Photosynthetic Chemical Process (ARPChem)Kazunari Domen
The University of Tokyo https://orcid.org/0000-0001-7995-4832Kenji Katayama ( [email protected] )
Chuo University https://orcid.org/0000-0003-3278-6485
Article
Keywords: z scheme, water splitting, photoexcited carrier dynamics, microscopy, spectral clustering
Posted Date: March 11th, 2021
DOI: https://doi.org/10.21203/rs.3.rs-276945/v1
License: This work is licensed under a Creative Commons Attribution 4.0 International License. Read Full License
Version of Record: A version of this preprint was published at Nature Communications on June 17th,2021. See the published version at https://doi.org/10.1038/s41467-021-24061-4.

1
Charge Carrier Mapping for Z-scheme Photocatalytic Water 1
Splitting Sheet by Categorization of Microscopic Time-resolved 2
Image Sequence 3
4
Makoto Ebihara1 Takeshi Ikeda,2,3 Sayuri Okunaka,2,3 Hiromasa Tokudome,2.3 Kazunari 5
Domen,4,5 and Kenji Katayama1* 6
1 Department of Applied Chemistry, Chuo University, Tokyo 112-8551, Japan 7
2 Research Institute, TOTO Ltd., Kanagawa 253-8577, Japan 8
3 Japan Technological Research Association of Artificial Photosynthetic Chemical Process 9
(ARPChem), Tokyo 101-0032, Japan 10
4 Research Initiative for Supra-Materials, Interdisciplinary Cluster for Cutting Edge Research, 11
Shinshu University, Nagano 380-8553, Japan 12
5 Office of University Professors, The University of Tokyo, Tokyo 113-8656, Japan 13
14
*Corresponding author: 15
K. Katayama, Phone: +81-3-3817-1913, E-mail: [email protected] 16
Abstract 17
Photocatalytic water splitting system using particulate semiconductor materials is a promising 18
strategy for converting solar energy into hydrogen and oxygen. In particular, visible-light-driven ‘Z-19
schematic’ printable photocatalyst sheets are cost-effective and scalable systems. However, little is 20
known about the fundamental photophysical processes, which are key to explain and promote 21
photoactivity. Here, we applied the pattern-illumination time-resolved phase microscopy (PI-PM) for 22
the printed photocatalyst sheet, composed of Mo-doped BiVO4 and Rh-doped SrTiO3, indium tin oxide 23
(ITO) as an electron mediator, to investigate photo-generated charge carrier dynamics. Using the PI-24
PM, we successfully observed for the first time the position- and structure-dependent charge carrier 25
behavior, including visualization of the active/inactive sites in the sheet, under the visible-light 26
irradiation via the time sequence images and the clustering analysis. This combination methodology 27
could not only lead to the maximum performance of photocatalyst sheets but also applicable to other 28
systems involving electron transfer. 29
Keywords: z scheme, water splitting, photoexcited carrier dynamics, microscopy, spectral clustering 30
31

2
Introduction 32
Water splitting into hydrogen and oxygen by sunlight energy is one of the most promising clean 33
energy resources in the future, and tremendous efforts have been made mostly for the development of 34
new materials,1–3 and extended for the device fabrication and large-scale development.4,5 In the overall 35
water splitting, careful selection of the band positions is necessary both for the reduction of proton and 36
the oxidation of water, and co-catalysts are necessary to promote the reactions. New materials have 37
emerged one after another, and one of the materials which can split water using a single semiconductor 38
photocatalyst, aluminum-doped strontium titanate (SrTiO3:Al), showed high efficiency with an 39
apparent quantum efficiency of almost 100% overall water splitting efficiency under UV light 40
illumination in 2020,6 and the mechanism had been studied.7 Alternatively, two different materials are 41
used by combination; each one is used for hydrogen and oxygen generation, and the remaining charges 42
are compensated by charge transfer between two materials, called as ‘Z-scheme water splitting system.’ 43
1,2,8–10 44
In the Z-scheme strategy, various combinations of two different semiconductors were introduced. 45
One of the favored combinations is BiVO4 and Rh doped SrTiO3 (SrTiO3:Rh) as oxygen and hydrogen 46
generation catalysts. In the earlier stage of the Z-scheme researches, the photo-excited electrons in 47
BiVO4 were transferred to SrTiO3:Rh via a redox shuttle in an aqueous solution. Still, the number of 48
candidates for redox shuttles is limited, such as IO3/I-, Fe2+/Fe3+. As a next step, the Z-scheme was 49
demonstrated without using the redox mediator by direct contact between BiVO4 and SrTiO3:Rh 50
semiconductors,11 where the photo-excited electrons and holes in each photocatalyst recombine 51
directly at the interface. The conductive binders have been searched and introduced to promote charge 52
transport between two materials. Alternatively, particulate photocatalyst sheets, wherein the 53
photocatalyst particles are fixed onto a glass substrate, have been reported in recent years. For example, 54
a physical vapor deposition (PVD)-based photocatalyst sheet composed of SrTiO3:Rh,La and 55
BiVO4:Mo embedded in an evaporated Au layer can split water under solar light with solar-to-56
hydrogen conversion efficiency of 1.1 %.12,13 Also, we have recently developed a new-type 57
photocatalyst sheet named a printable photocatalyst sheet, which can be prepared via facile and 58
extensive screen-printing method incorporating a conductive colloidal binder (e.g., Au, ITO) with a 59
highly-packed film structure.13–15 However, the STH was merely 0.4 %,15 and it is necessary to 60
understand the electron transfer process and design the optimal film structure for achieving STH > 61
1 %. 62
In the water splitting by photocatalysts, it is essential how efficiently photo-excited charge 63
carriers are separated and utilized for water oxidation and reduction without losing them due to 64
recombination. So far, charge carrier dynamics in various photocatalyst particles and films, including 65
SrTiO3 or BiVO4, have been studied. Transient absorption and time-resolved photoluminescence have 66

3
been frequently utilized to understand the processes. Concerning SrTiO3, various doping causes trap 67
sites, and the lifetime of the charge carriers was extended from microseconds to milliseconds, and the 68
effect was studied in relevance to the photocatalytic activity. In several reports, doping of a single 69
element induced a recombination center and reduced the charge carriers, but co-doping could suppress 70
the recombination.16–18 The charge carrier dynamics was also studied for BiVO4 on the ultrafast and 71
wide time range. The effects of trap states were discussed mostly for elongation of hole lifetimes,19–22 72
and the effect of active and inactive oxygen defects were clarified.23 Also, a heterojunction of BiVO4 73
with WO3 was studied and revealed that the junction effectively removed electrons at the interband 74
states,24 providing a benefit for water oxidation on a millisecond to second order.25 75
On the other hand, our approach for studying the charge carrier dynamics uses the special 76
combination of the measurement of the refractive index change and its accompanying original analysis 77
method called spectral clustering method, instead of the absorption change or photoluminescence.26,27 78
As for the former measurement approach, the monitorization via the refractive index change has merit 79
to favor the detection of the interfacial charge transfer because the limitation of the detection 80
wavelength is relaxed due to the broad wavelength response. So far, this method has been applied for 81
studying charge transfer at the interfaces of the photocatalyts28 and dye-sensitized solar cells.29 For 82
detecting the refractive index change, we used the transient grating (TG) method and studied the 83
dynamics of the charge carriers for TiO2,30–32 and hematite photoanodes.33–35 84
The charge carrier behavior depends on the local structure and is inhomogeneous in nature for 85
the photocatalysts, typically composed of calcinated particles and aggregates. Many researches have 86
been devoted for studying the spatio-temporal behavior of charge carrier dynamics by using TA and 87
photoluminescence microscopy on micro-scales,36–38 and the photocurrent behavior by microscopic 88
photo-electrochemical measurements.39,40 We also have extended our measurements of the refractive 89
index change for a local mapping of the transient responses of photo-excited charge carriers. (pattern-90
illumination phase microscopy (PI-PM)). By illuminating a pattern of light, the sequence of images 91
due to the refractive index change was obtained, and the image quality was recovered by the image 92
recovery calculation techniques.41 The lifetime distribution of the charge carriers for a TiO2 particulate 93
film was obtained, and the research clarified a broad range of the lifetime of charge carriers.42 94
Furthermore, the local responses of charge carriers were categorized by the spectral clustering method 95
and found the hidden local responses of the non-radiative exciton relaxation for higher pump 96
intensities.43 Thus, using the combination of PI-PM and the spectral clustering method, we can 97
investigate the position- and structure-dependent charge carrier behavior under light irradiation, and 98
also assign the carrier at specific positions. 99
These findings have motivated us to apply this combination of PI-PM and clustering analysis 100
method for one of the most promising Z-scheme water splitting materials, BiVO4:Mo/SrTiO3:Rh with 101
a conductive colloidal binder (ITO), as a printable photocatalyst sheet with a conductive colloidal 102

4
binder (ITO) prepared by the printing method. We could visualize the spatially-resolved photocatalytic 103
activity by the categorization of the charge carrier behaviors. This new methodology could detect the 104
real active and inactive sites in the photocatalytic device and will support the optimization of the active 105
structure of the photocatalyst. 106
107
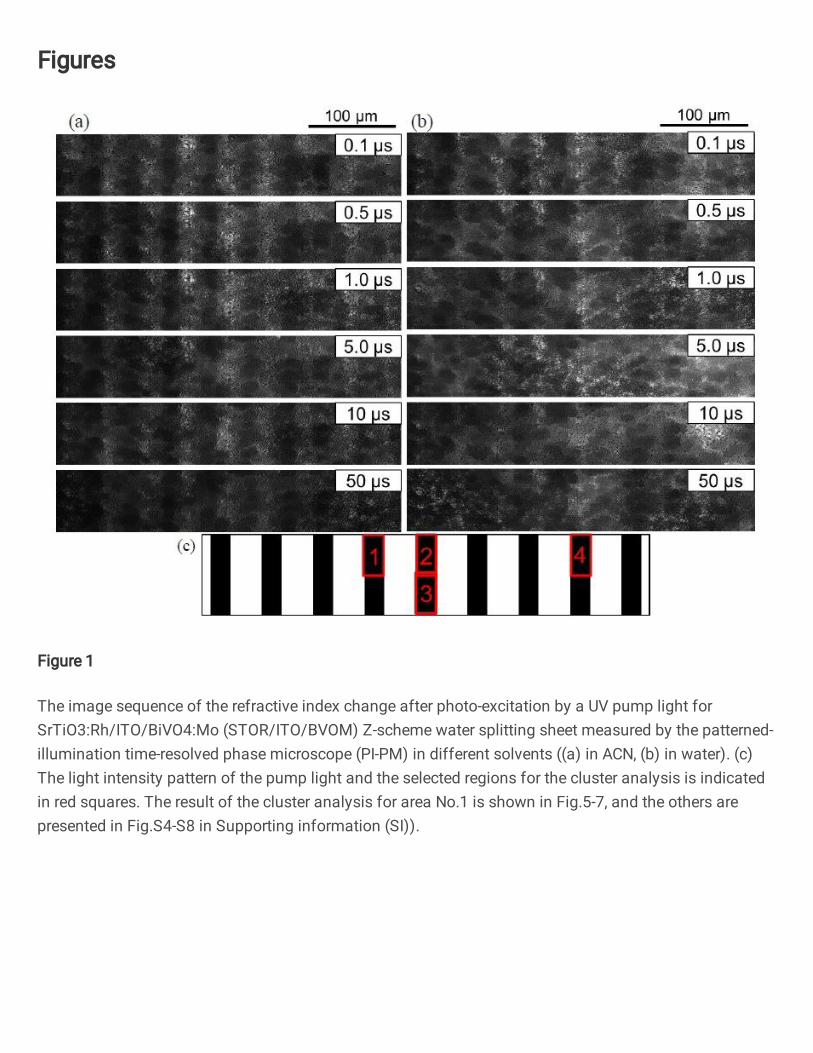
Result and Discussion 108
The time-resolved experiments were performed on the visible-light responsible printed 109
photocatalyst sheet composed of SrTiO3:Rh, BiVO4:Mo, and ITO (STOR/ITO/BVOM) in two 110
different solvents (acetonitrile (ACN) and water). Figure 1 shows the image sequences of the refractive 111
index change for SrTiO3:Rh/ITO/BiVO4:Mo (STOR/ITO/BVOM) in different solvents ((a) in ACN, 112
(b) in water) observed by the PI-PM method. The irradiated region by the pump light corresponds to 113
the brighter regions in the images. The contrast of images originated from the refractive index change 114
due to photo-excited charge carriers in these regions. Although the images in ACN retained overall 115
brightness until 10-100 µs, the bright regions in water gradually faded out for 1 µs. The overall 116
refractive index change decayed due to the charge recombination; however, images in ACN did not 117
show a simple single-component decay. Furthermore, it was noticed that the brightness in the excited 118
regions in images strongly depended on the sample position, meaning that the materials in this sample 119

5
were not homogeneously distributed on the substrate. 120
Fig.1 The image sequence of the refractive index change after photo-excitation by a UV pump 121
light for SrTiO3:Rh/ITO/BiVO4:Mo (STOR/ITO/BVOM) Z-scheme water splitting sheet measured by 122
the patterned-illumination time-resolved phase microscope (PI-PM) in different solvents ((a) in ACN, 123
(b) in water). (c) The light intensity pattern of the pump light and the selected regions for the cluster 124
analysis is indicated in red squares. The result of the cluster analysis for area No.1 is shown in Fig.5-125
7, and the others are presented in Fig.S4-S8 in Supporting information (SI)). 126
127
For the assignment of the response on the STOR/ITO/BVOM photocatalyst sheet in the two 128
different solutions, the temporal changes of the average contrast change of the refractive index images 129
were obtained, which were calculated by taking the Fourier amplitude of the periodic stripe pattern at 130
the spatial frequency corresponding to the inverse of the stripe spacing, and it is shown in Fig.2(a). 131
The detailed calculation process was written in the previous papers.41,42 The signal response for the 132
STOR/ITO/BVOM in ACN were categorized into three response components; rapidly increased for 133
30 ns and decayed for 100 ns (first response), an additional rising for 1 µs and decayed for a couple 134
of µs (second response), a plateau until 10 µs and decay for 100 µs (third response). 135
(a) (b)
(c)

6
136
Fig.2 (a) The average refractive index change response of STOR/ITO/BVOM until 100 μs in 137
acetonitrile (ACN) and water obtained from the PI-PM image sequence (Fig.1). The response was 138
obtained from the signal amplitude at the light irradiated regions. (b) A schematic drawing of the 139
charge transfer/decay processes for STOR/ITO/BVOM in ACN. Surface trapped carriers cannot be 140
transferred to the solution side in ACN, where all the processes of charge dynamics are completed in 141
the system. 142
143
As shown in Fig. 2(b), photo-excited charge carriers were generated in the conduction band and 144
valence band after the excitation because the wavelength of the pump laser was 355 nm, and its energy 145
exceeds the bandgap energy of both materials (BiVO4=2.4 eV, SrTiO3=3.2 eV). Therefore, we 146
monitored the charge carrier dynamics after the interband transition of both materials. These charge 147
carriers were rapidly trapped to shallow or deep trap states originated from multiple types of defect. 148
This trapping process almost finishes within the picosecond time region.21,22,44,45 These trapped charge 149
carriers decayed due to the recombination inside the materials or the extraction outside the materials. 150
The first component can be considered as the mixture of these fast charge carrier dynamics. Since 151
ACN is an inert solvent for charge carriers, they were confined inside the materials. Thus, these 152
carriers remained in a slower time scale, and the response was observed until hundreds of 153
microseconds, which corresponds to the microsecond recombination for BiVO4 and SrTiO3,16,25 154
ITOBiVO4:Mo
In ACN
SrTiO3:Rh
trap
states
trap
statesRh
e-
e- e-
e-e-
h+
h+
h+
h+
h+
e-
h+
Allowed in water
Allowed in water
(a)
(b)

7
included in the third component. 155
On the other hand, the second component in ACN disappeared in the water. It indicates that the 156
second component (100 ns to 1 µs) in ACN was attributed to electrons in STOR or holes in BVOM 157
on the surfaces because these surface trapped charge carriers were consumed by water and utilized for 158
water splitting reactions. The loss of the component by water indicates that the corresponding charge 159
carriers were used for the water-splitting reactions, which are ensured by the fact that this 160
photocatalytic sheet had a high water splitting efficiency even for pure water (Fig. S11 in SI). Vise 161
versa, this result demonstrated that the surface trapped carriers were effectively extracted to water in 162
this system. 163
In terms of the Z-scheme water splitting system, the working mechanism is complicated, and 164
many processes of photo-excited charge carriers are included in the response. To simplify the 165
assignment, we investigated the charge carrier dynamics of BVOM and STOR separately, using the 166
same materials used for the Z-scheme system. Figure 3 shows the refractive index responses obtained 167
for BVOM and STOR in ACN and water, respectively. We could confirm the second components 168
(100 ns to 1 µs) were observed in ACN in both samples, and they disappeared in water in both cases. 169
These results supported that these second components were attributed to the holes in BVOM and 170
electrons in STOR, respectively, and they were utilized for water splitting reactions, as shown in 171
Fig.2(b). It is supposed that the holes in BVOM and electrons in STOR for water splitting were 172
observed as a mixture in the response of the Z-scheme sample because these lifetimes matched by 173
chance. In addition to this finding, we could recognize that the second rising component was delayed 174
until 10 μs in STOR in ACN. STOR has a mid-gap state corresponding to the Rh3+/4+ state within the 175
bandgap. Rh is doped for the visible light absorption via the transition from the Rh3+ state to the 176
conduction band and the valence band to the Rh4+ state, corresponding to 2.3 and 2.7 eV, 177
respectively.18,46 The considerable delay of the response in STOR implies that the response of STOR 178
in ACN included unique components of photo-excited charge carriers due to the loss of the water-179
splitting reactions in ACN instead of water. 180
181

8
Fig.3 The average responses of the refractive index changes for (a) BVOM and (b) STOR until 182
100 μs in ACN and water obtained by the PI-PM image sequences. 183
184
A general understanding of the mechanism of the Z-scheme system is explained here, based on 185
the description provided by Osterloh, et al.47 By irradiation of the visible light, both BVOM and STOR 186
are photo-excited, and the photo-generated holes in BVOM and photo-generated electrons in STOR 187
are used for the water splitting to oxygen and hydrogen, respectively. Photo-excited electrons in 188
BVOM are transferred to the neighboring STOR particles, and the Rh4+ elements are reduced to Rh3+ 189
by the electron transfer. The Rh4+ elements work as the electron acceptor in this case. With regard to 190
STOR, electrons are excited from the Rh3+ state to the conduction band for the visible light absorption, 191
causing Rh4+ species generation. Water splitting continues when these reactions and charge transfer 192
cycles repeatedly occur. It was reported that the Rh4+ states reduce the activity of water splitting by 193
working as the recombination sites for the electrons in the conduction band, and much effort has been 194
made to reduce the Rh4+ states.18,46 In our experiments, it was confirmed that the slow rising until 10 195
μs in STOR in ACN was due to the formation of the Rh4+ state by the hole transfer from the valence 196
band to the Rh3+ states, as understood from the experiment of the methanol (MeOH) scavenger effect, 197
as described in detail in Fig. S1 in Supporting Information (SI). 198
The schematic flow of the whole charge dynamics of STOR/ITO/BVOM is summarized in Fig.4. 199
Based on the series of results, we concluded the response included at least three components. As a first 200
step, photo-excited charge carriers decayed for <100 ns due to the intrinsic recombination processes 201
because the responses in this time region were not influenced by water. During these processes, free 202
charge carriers and trapped charge carriers at shallow trap states recombined inside each material. 203
(a)
(b)
BVOM
STOR

9
(first component) The processes could include the recombination between the electrons in BVOM and 204
the holes in STOR as well because of the smooth charge transfer via the ITO binder. In the second 205
component, until ~1 μs, the response decayed due to the recombination of the surface-trapped charge 206
carriers in ACN. The components were lost for water splitting when the photocatalytic sheets had 207
contact with water. This response includes the contributions from both of the electrons in STOR and 208
the holes in BVOM, considering the responses of STOR and BVOM only (Fig.3). The third component 209
until ~100 µs includes the hole accumulation decayed process from the valence band to Rh3+state in 210
STOR (~10 µs) because this component was observed for STOR only and was quenched well by 211
MeOH. The third component also includes other slower recombination processes. The hole 212
accumulation in STOR contributed less in the Z-scheme system because ITO worked to mediate the 213
electron transfer in BVOM to STOR and effectively reduce the Rh4+ state. However, we could confirm 214
the accumulation of Rh4+ (slow rising component) was enhanced due to inefficient electron transfer 215
from BVOM without the charge transfer mediator (ITO binder) (Refer to Section of ‘The effect of 216
ITO binder’ and Fig.S2 and S3, for the detailed discussion on the ITO binder). In terms of the water 217
splitting, the effective charges on each material in the second process are essential, and the high 218
efficiency of water splitting of this Z-scheme system is possibly due to the well-matching of the 219
lifetimes of the surface-trapped electrons in STOR and holes in BVOM. Furthermore, the oxidized 220
Rh4+ state was reduced effectively by the smooth electron transfer from BVOM; otherwise, the state 221
is well-known to deteriorate the hydrogen-generating electrons in STOR due to the recombination. 222
223
Fig.4 The schematic flow diagram of the whole charge dynamics in STOR/ITO/BVOM in ACN. 224
Step 1 includes intrinsic recombination inside materials and charge transfer between two materials. 225
Step 2 indicates the decay of surface trapped charge carriers in ACN, which are utilized for water 226
splitting reactions with water outside. Step 3 includes the hole trapping to Rh3+/4+ state in STOR and 227
the slower recombination. 228
229
Many types of charge carrier responses were overlapped for the Z-scheme systems because they 230
ITOBiVO4:Mo
SrTiO3:Rh
trap
states
e-
e- e-
e-e-
h+
h+
h+
h+
h+
e-
h+
2. ~1 µs
mid-gap state from Rh
STOR/ITO/BVOM in ACN
2. ~1 µs
3. Rh3+→Rh4+
~10 µs
1. ~100 ns
trap
states

10
consisted of more than one material. Furthermore, we noticed the inhomogeneity of the responses in 231
the image sequences measured by the PI-PM method. Hence, we categorized the position-dependent 232
(local) responses based on their similarity by the clustering analysis of the transient image sequence. 233
A detailed procedure of this analysis was introduced in our previous paper.43 Briefly, one of the local 234
regions in the excited area was selected for the analysis, and the local responses in the selected region 235
were extracted from each pixel in the image sequence. These responses were classified into several 236
categories of the charge carrier responses based on the similarity calculated by the rise and decay 237
profile. We applied this analysis to the local responses in the image sequence of STOR/ITO/BVOM 238
in ACN (Fig.5). The selected position for the analysis is indicated in the red square in Fig.1(c) (No.1). 239
Figure 5(a) shows a sequence of the temporal images of the refractive index change, representing a 240
position-dependent response, where some micron-sized particles showed a large refractive index 241
change with higher brightness, lasting until 1 µs, and fading out for 10 µs. 242
243
Fig.5 (a) An image sequence of the refractive index change for STOR/ITO/BVOM in ACN in a 244
square region (20×50 µm) corresponding to No.1 in Fig.1(c) on the order from nanoseconds to 245
microseconds. The scale bar corresponds to 20 µm. (b) The categorized mapping of the charge carrier 246
responses of (a). An outlier positioned far from all categories were colored in black (#0). (c) A 247
microscopic image in the same area as (a). (d) The averaged responses for each category in (b) are 248
shown. 249
250
From the spectral clustering,48 the transient responses were classified into three categories, 251
and they were mapped out in Fig.5(b). The outliers, far from the three categories, were indicated as #0 252
data1data2data3
10-6 10-4
Time [s]10-8
Sig
nal in
tensity [
a.u
.]
0
250
150
50
0
1
2
3
0.1 μs 0.5 μs 1.0 μs 5.0 μs 10 μs 50 μs
20 µm(a)
(b) (c) (d)

11
(black) in this mapping. The original microscopic phase image of the sample is shown in Fig. 5(c). In 253
the sample image, aggregations with a few microns in diameter were recognized. The bright positions 254
in the transient image sequence were almost overlapped with the positions of the aggregations. In each 255
category, the responses at all the pixels in the same category were averaged and shown in Fig.5(d). 256
From Fig.5(b) and (d), the categorized map was mostly composed of red and blue regions. Based on 257
the assignment in Fig.2(a), the response in the red region was similar to an averaged overall response 258
(data1 in (d)), and the blue response seems to be composed of the first and third responses (data2 in 259
(d)). There was a small portion of green regions in Fig.5(b), and it showed a slow rising component 260
corresponding to the third component (data3 in (d)). Based on the assignment described earlier, the 261
response of data1 in Fig.5(d) was composed of the intrinsic recombination and the decay of the surface 262
trapped carriers until 1 µs utilized for water splitting reactions. Therefore, water splitting reactions 263
should mostly occur in the red region. The blue response was composed of the intrinsic recombination 264
with the hole decay to Rh3+ state (Rh4+ formation) in STOR. The area of the green regions, 265
corresponding to Rh4+ formation in Fig.5(d), was much smaller compared with the red and blue regions. 266
It means that the blue and green regions do not have a water-splitting activity. This analysis was 267
applied to other regions (No.2~No.4 in Fig.1(c)), and the results are shown in Fig.S4-S6 in SI. Figure 268
S4 and S5 had almost the same categories of the responses as Fig.5. However, the red regions mostly 269
occupied the whole area compared with Fig.5. It means that regions No.2 and No.3 were more active 270
for water splitting reactions than that for region No.1. On the other hand, as shown in Fig.S6, t the 271
green region increased for region No.4. It indicated the Rh4+ formation process was observed in a large 272
portion of this region, leading to ineffective water-splitting. Based on these results, each material was 273
not dispersed homogeneously and mixed well on the substrate, indicating that some regions were not 274
an ideal STOR/ITO/BVOM composition. 275
The same analysis was conducted in the case of a Z-scheme sample without the ITO binder 276
(STOR/BVOM) to confirm the effect of ITO (Fig.6). As you can see from these results, the same types 277
of categories for transient responses were found. However, the area of the green regions in the 278
categorized map (Fig.6(b)) drastically increased, while the number of the red region decreased 279
considerably compared with Fig.5(b). The ratio of the blue region remained almost the same. This 280
result indicated that the area of the Rh4+ formation drastically increased if there was no ITO binder in 281
the system. This is exactly the reason why the water splitting reaction was inefficient for this system. 282
Additionally, the green region was observed at the positions of aggregations in the sample image 283
(Fig.5(c)). It implies that the recognized aggregation in the sample image corresponded to the positions 284
of the STOR particle aggregates. The same experiments and analyses were applied to other regions 285
(No.2 and No.3 in Fig.1 (c)), and the results are shown in Fig.S7 and S8. We could confirm that the 286
Rh4+ formation occurred in a large portion of these regions. From the combination of the transient 287
image sequence and the spectral clustering, we could successfully visualize the position where the 288

12
water-splitting reactions proceeded and clarify the role of ITO for higher efficiency. Since the 289
positions for the high and low efficiencies of water splitting reactions were spatially separated, it 290
indicates that the charge transfer between BVOM and STOR were efficient in some regions and not 291
in other regions, and possibly can be improved by the mixing and deposition conditions on the 292
substrate. 293
Fig.6 (a) An image sequence of the refractive index response for STOR/BVOM in ACN in a 294
square region (18×50 µm) corresponding to No.1 in Fig.1(c) on the order from nanoseconds to 295
microseconds. The scale bar corresponds to 20 µm. (b) The categorized mapping of the charge carrier 296
responses of (a). An outlier positioned far from all categories were colored in black (#0). (c) A 297
microscopic image in the same area as (a). (d) The averaged responses for each category in (b) are 298
shown. 299
300
Finally, we studied that the local responses of STOR/ITO/BVOM in water by using the same 301
cluster analysis to compare the difference from the results in ACN, as shown in Fig.7. The analysis 302
was applied for the exactly same region as the region in Fig.5, and only the solvent was replaced with 303
water. From Fig.7 (b) and (d), the categorized map was composed of the blue and green regions, 304
corresponding to the fast decay (data1) and the weak response (data2) regions, and we could not 305
observe the red and green regions found under the ACN condition (Fig.5). This result indicated that 306
all the surface trapped charge carriers in the case of ACN were utilized for water splitting reactions in 307
water. These components were completely removed by water, and only intrinsic recombination was 308
observed. The comparison of the results in Fig.5 and 7 ensures the reaction of water splitting on the 309
surface. 310
data1data2data3
10-6 10-4
Time [s]
Sig
nal in
tensity [
a.u
.]
0
300
200
100
10-8
0
1
2
3
0.1 μs 0.5 μs 1.0 μs 5.0 μs 10 μs 50 μs
20 µm
(a)
(b)
(c) (d)

13
The categorization of local charge carrier responses with a combination of the PI-PM 311
measurements and the clustering analyses reported herein provides useful information for designing 312
and fabricating highly-efficient photocatalytic films or devices that have heterojunctions between 313
different semiconductor particles. This method can positively affect a broad range of physicochemical 314
processes that involve solid-state electron transfer. 315
316
317
Fig.7 (a) An image sequence of the refractive index response for STOR/ITO/BVOM in water in 318
a square region (20×50 µm) corresponding to No.1 on the order from nanoseconds to microseconds. 319
The location of the sample was exactly the same as Fig.5(a). The scale bar corresponds to 20 µm. (b) 320
The categorized mapping of the charge carrier responses of (a). An outlier positioned far from all 321
categories was colored in black (#0) (c) A microscopic image in the same area as (a). (d) The averaged 322
responses for each category in (b) are shown. 323
324
Conclusion 325
This work revealed the origin of the efficient water splitting reactions in STOR/ITO/BVOM 326
photocatalyst sheets that can split water to H2 and O2 under visible light by employing our original 327
clustering analysis of photo-generated charge carrier responses in the transient image sequence. The 328
combination of the observation technique (PI-PM) and the clustering analysis could lead to visualize 329
reactive sites for efficient water-splitting reactions and inactive sites deteriorating water splitting 330
(a)
(b)
(c) (d)
0
1
2
10-6 10-4
Time [s]
Sig
nal in
tensity [
a.u
.]
0
150
100
50
10-8
data1data2
0.1 μs 0.5 μs 1.0 μs 5.0 μs 10 μs 50 μs
20 µm

14
efficiency. From the averaged responses of the refractive index change for different combinations of 331
materials in various solvents, we could find three components, corresponding to the intrinsic 332
recombination of photo-excited charge carriers inside materials (~100 ns), recombination of surface 333
trapped charge carriers which can essentially contribute to split water (~1 µs), and the hole trapping 334
(accumulation) to the Rh state in STOR, generating Rh4+ state (~10 µs). Consequently, we could 335
visually demonstrate that the region of the hole trapping to the Rh state, where is the region to suppress 336
the water splitting reactions in the photocatalyst sheet, decreased in the sheet including ITO mediators 337
at the reaction sites due to the efficient inter-particular charge transfer. This technique will be a 338
powerful tool for the detection of active/inactive sites for the water-splitting materials but also the 339
other materials involving electron transfer reactions, providing swift optimization for photocatalytic 340
materials. 341
342
Method 343
The principle of the PI-PM is described in the previous papers.41,43 In brief, an arbitrary light 344
pattern is irradiated on a sample to excite charge carriers. The charge carriers decay or diffuse as time 345
passes due to the recombination, charge trapping, and transport, and the charge carrier distribution is 346
varied in time. The distribution of the photo-excited charge carriers is observed from the refractive 347
index change by the phase-sensitive imaging. The refractive index was imaged by the Talbot self-348
imaging technique.49 The pattern-illumination is required for applying various image recovery 349
algorithms, as described in a different paper.41 In this study, only the background correction was 350
processed before the analyses to prevent the loss of small features in images. In this optical 351
configuration, the TA responses could also be included in the image, but the refractive index change 352
was the major contribution to the signal, which could be confirmed by optimizing the focus position 353
because the TA signal intensity does not depend on the focus position. 354
The experimental setup is fully described in Fig. S9 in SI. Briefly, the wavelengths of the 355
pump and probe pulse lights were 355 and 532 nm, respectively, with pulse widths of 5 ns. The pump 356
light was illuminated as a Ronchi ruling pattern similar to the transient grating (TG) technique, as we 357
reported previously to understand the refractive index change response easily as the amplitude change 358
by Fourier transform. The width of each line in the ruling-pattern was 25 µm, and the spacing was 45 359
µm. 360
The sample was Rh-doped SrTiO3 and Mo-doped BiVO4, including ITO nanoparticles as a 361
conductive binder, and printed on a glass substrate with a thickness of 1 m. The detailed preparation 362
method is described in SI. The SEM images of Rh-doped SrTiO3 and Mo-doped BiVO4 are shown in 363
Fig. S10 in SI. The average diameters of them were 300 nm and 2 m, respectively. The gas evolution 364
data for this photocatalyst sheet in pure water is shown in Fig. S11 in SI, and the STH was 0.4 %. 365

15
The solid/liquid interface was prepared by putting another glass slide together with a silicon 366
rubber spacer (thickness: 0.5 mm), and liquids were sandwiched within the gap. Each film sample was 367
measured in contact with acetonitrile (ACN) and water. ACN is an inert solvent for photocatalytic 368
reactions, where no charge transfer at the interface is guaranteed,28 while it occurs for water. We used 369
methanol (MeOH) as a hole scavenger for assignment and confirmation of the hole responses. 370
371
Supporting Information 372
Fig. S1 The transient responses of STOM for the scavenger. 373
Fig. S2 The transient responses of Z-scheme sample with and without ITO. 374
Fig. S3 The transient responses of Z-scheme sample without ITO for the scavenger. 375
Fig. S4 Mapping example of the charge responses for Z-scheme sample in region No.2. 376
Fig. S5 Mapping example of the charge responses for Z-scheme sample in region No.3. 377
Fig. S6 Mapping example of the charge responses for Z-scheme sample in region No.4. 378
Fig. S7 Mapping example of the charge responses for Z-scheme sample without ITO in region 379
No.2. 380
Fig. S8 Mapping example of the charge responses for Z-scheme sample without ITO in region 381
No.3. 382
Fig. S9 Experimental setup of PI-PM method. 383
Fig. S10 SEM images of STOR and BVOM. 384
Fig. S11 Oxygen and hydrogen evolution experiment for Z-scheme sample. 385
386
387
Author Contribution Statement 388
ME, HT and KK designed the experiments and made measurements. TI, SO, HT, and KD prepared 389
the photocatalytic sheet. ME analyzed the data, and ME, HT, KD, and KK considered the result. ME 390
and KK wrote the manuscript, and all the authors reviewed it. 391
392
Declaration of competing interests 393
I declare that the authors have no competing interests or other interests that might be 394
perceived to influence the results and/or discussion reported in this article. 395
396
Acknowledgments 397
The research was financially supported by JST PRESTO (#JPMJPR1675), and the Institute of Science 398
and Engineering, Chuo University. 399
400

16
References 401
1. Wang, Z., Li, C. & Domen, K. Recent developments in heterogeneous photocatalysts for solar-402
driven overall water splitting. Chem. Soc. Rev. 48, 2109–2125 (2019). 403
2. Wang, Q. & Domen, K. Particulate Photocatalysts for Light-Driven Water Splitting: Mechanisms, 404
Challenges, and Design Strategies. Chem. Rev. 120, 919–985 (2020). 405
3. Djurišić, A. B., He, Y. & Ng, A. M. C. Visible-light photocatalysts: Prospects and challenges. 406
APL Mater. 8, 030903 (2020). 407
4. Hisatomi, T. & Domen, K. Reaction systems for solar hydrogen production via water splitting 408
with particulate semiconductor photocatalysts. Nat. Catal. 2, 387–399 (2019). 409
5. Goto, Y. et al. A Particulate Photocatalyst Water-Splitting Panel for Large-Scale Solar Hydrogen 410
Generation. Joule 2, 509–520 (2018). 411
6. Takata, T. et al. Photocatalytic water splitting with a quantum efficiency of almost unity. Nature 412
581, 411–414 (2020). 413
7. Zhao, Z. et al. Electronic structure basis for enhanced overall water splitting photocatalysis with 414
aluminum doped SrTiO3 in natural sunlight. Energy Environ. Sci. 12, 1385–1395 (2019). 415
8. Maeda, K. Z-Scheme Water Splitting Using Two Different Semiconductor Photocatalysts. ACS 416
Catal. 3, 1486–1503 (2013). 417
9. Abe, R., Sayama, K., Domen, K. & Arakawa, H. A new type of water splitting system composed 418

17
of two different TiO2 photocatalysts (anatase, rutile) and a IO3−/I− shuttle redox mediator. Chem. 419
Phys. Lett. 344, 339–344 (2001). 420
10. Ng, B.-J. et al. Z-Scheme Photocatalytic Systems for Solar Water Splitting. Adv. Sci. 7, 1903171 421
(2020). 422
11. Full Text PDF. 423
12. Wang, Q. et al. Z-scheme water splitting using particulate semiconductors immobilized onto 424
metal layers for efficient electron relay. J. Catal. 328, 308–315 (2015). 425
13. Wang, Q. et al. Scalable water splitting on particulate photocatalyst sheets with a solar-to-426
hydrogen energy conversion efficiency exceeding 1%. Nat. Mater. 15, 611–615 (2016). 427
14. Wang, Q. et al. Printable Photocatalyst Sheets Incorporating a Transparent Conductive Mediator 428
for Z-Scheme Water Splitting. Joule 2, 2667–2680 (2018). 429
15. Okunaka, S. et al. Z-Scheme Water Splitting under Near-Ambient Pressure using a Zirconium 430
Oxide Coating on Printable Photocatalyst Sheets. ChemSusChem 13, 4906–4910 (2020). 431
16. Yamakata, A., Kawaguchi, M., Murachi, R., Okawa, M. & Kamiya, I. Dynamics of 432
Photogenerated Charge Carriers on Ni- and Ta-Doped SrTiO3 Photocatalysts Studied by Time-433
Resolved Absorption and Emission Spectroscopy. J. Phys. Chem. C 120, 7997–8004 (2016). 434
17. Ichihara, F. et al. Photogenerated Charge Carriers Dynamics on La- and/or Cr-Doped SrTiO3 435
Nanoparticles Studied by Transient Absorption Spectroscopy. J. Phys. Chem. C 124, 1292–1302 436

18
(2020). 437
18. Furuhashi, K., Jia, Q., Kudo, A. & Onishi, H. Time-Resolved Infrared Absorption Study of 438
SrTiO3 Photocatalysts Codoped with Rhodium and Antimony. J. Phys. Chem. C 117, 19101–439
19106 (2013). 440
19. Cooper, J. K. et al. Physical Origins of the Transient Absorption Spectra and Dynamics in Thin-441
Film Semiconductors: The Case of BiVO4. J. Phys. Chem. C 122, 20642–20652 (2018). 442
20. Aiga, N. et al. Electron–Phonon Coupling Dynamics at Oxygen Evolution Sites of Visible-Light-443
Driven Photocatalyst: Bismuth Vanadate. J. Phys. Chem. C 117, 9881–9886 (2013). 444
21. Ravensbergen, J. et al. Unraveling the Carrier Dynamics of BiVO4: A Femtosecond to 445
Microsecond Transient Absorption Study. J. Phys. Chem. C 118, 27793–27800 (2014). 446
22. Suzuki, Y. et al. Rational Interpretation of Correlated Kinetics of Mobile and Trapped Charge 447
Carriers: Analysis of Ultrafast Carrier Dynamics in BiVO4. J. Phys. Chem. C 121, 19044–19052 448
(2017). 449
23. Selim, S. et al. Impact of Oxygen Vacancy Occupancy on Charge Carrier Dynamics in BiVO4 450
Photoanodes. J. Am. Chem. Soc. 141, 18791–18798 (2019). 451
24. Grigioni, I. et al. In Operando Photoelectrochemical Femtosecond Transient Absorption 452
Spectroscopy of WO3/BiVO4 Heterojunctions. ACS Energy Lett. 4, 2213–2219 (2019). 453
25. Selim, S. et al. WO3/BiVO4: impact of charge separation at the timescale of water oxidation. 454

19
Chem. Sci. 10, 2643–2652 (2019). 455
26. Katayama, K., Yamaguchi, M. & Sawada, T. Lens-free heterodyne detection for transient grating 456
experiments. Appl. Phys. Lett. 82, 2775–2777 (2003). 457
27. Okuda, M. & Katayama, K. Selective detection of real and imaginary parts of refractive index 458
change in solutions induced by photoexcitation using near-field heterodyne transient grating 459
method. Chem. Phys. Lett. 443, 158–162 (2007). 460
28. Kuwahara, S. & Katayama, K. Distinction of electron pathways at titanium oxide/liquid interfaces 461
in photocatalytic processes and co-catalyst effects. Phys. Chem. Chem. Phys. 18, 25271–25276 462
(2016). 463
29. Kuwahara, S. et al. Detection of non-absorbing charge dynamics via refractive index change in 464
dye-sensitized solar cells. Phys. Chem. Chem. Phys. 15, 5975–5981 (2013). 465
30. Shen, Q. et al. Photoexcited hole dynamics in TiO2 nanocrystalline films characterized using a 466
lens-free heterodyne detection transient grating technique. Chem. Phys. Lett. 419, 464–468 (2006). 467
31. Hata, H., Katayama, K., Shen, Q. & Toyoda, T. Characterization of Photoexcited Carriers and 468
Thermal Properties of Nanoparticulate TiO2 Film Using Heterodyne Transient Grating Method. 469
Jpn. J. Appl. Phys. 51, 42601 (2012). 470
32. Shingai, D., Ide, Y., Sohn, W. Y. & Katayama, K. Photoexcited charge carrier dynamics of 471
interconnected TiO2 nanoparticles: evidence of enhancement of charge separation at anatase–472

20
rutile particle interfaces. Phys. Chem. Chem. Phys. 20, 3484–3489 (2018). 473
33. Inaba, M., Katayama, K. & Sohn, W. Y. Cooperative effects of surface and interface treatments 474
in a hematite (α-Fe2O3) photo-anode on its photo-electrochemical performance. Sustain. Energy 475
Fuels 4, 2174–2183 (2020). 476
34. Sohn, W. Y. et al. Uncovering Photo-Excited Charge Carrier Dynamics in Hematite (α-Fe2O3) 477
Hidden in the Nanosecond Range by the Heterodyne Transient Grating Technique Combined with 478
the Randomly Interleaved Pulse-Train Method. J. Phys. Chem. C 123, 6693–6700 (2019). 479
35. Sohn, W. Y. et al. Charge carrier kinetics in hematite with NiFeOx coating in aqueous solutions: 480
Dependence on bias voltage. J. Photochem. Photobiol. Chem. 353, 344–348 (2018). 481
36. Zhu, Y. & Cheng, J.-X. Transient absorption microscopy: Technological innovations and 482
applications in materials science and life science. J. Chem. Phys. 152, 020901 (2020). 483
37. Simpson, M. J., Doughty, B., Yang, B., Xiao, K. & Ma, Y.-Z. Imaging Electronic Trap States in 484
Perovskite Thin Films with Combined Fluorescence and Femtosecond Transient Absorption 485
Microscopy. J. Phys. Chem. Lett. 7, 1725–1731 (2016). 486
38. Gao, Y., Nie, W., Wang, X., Fan, F. & Li, C. Advanced space- and time-resolved techniques for 487
photocatalyst studies. Chem. Commun. 56, 1007–1021 (2020). 488
39. Wang, L., Tahir, M., Chen, H. & Sambur, J. B. Probing Charge Carrier Transport and 489
Recombination Pathways in Monolayer MoS2/WS2 Heterojunction Photoelectrodes. Nano Lett. 490

21
19, 9084–9094 (2019). 491
40. Todt, M. A., Isenberg, A. E., Nanayakkara, S. U., Miller, E. M. & Sambur, J. B. Single-Nanoflake 492
Photo-Electrochemistry Reveals Champion and Spectator Flakes in Exfoliated MoSe2 Films. J. 493
Phys. Chem. C 122, 6539–6545 (2018). 494
41. Katayama, K. Photo-excited charge carrier imaging by time-resolved pattern illumination phase 495
microscopy. J. Chem. Phys. 153, 054201 (2020). 496
42. Ebihara, M., Sohn, W. Y. & Katayama, K. Lifetime mapping of photo-excited charge carriers by 497
the transient grating imaging technique for nano-particulate semiconductor films. Rev. Sci. 498
Instrum. 90, 073905 (2019). 499
43. Ebihara, M. & Katayama, K. Anomalous Charge Carrier Decay Spotted by Clustering of a Time-500
Resolved Microscopic Phase Image Sequence. J. Phys. Chem. C 124, 23551–23557 (2020). 501
44. Kato, K., Jiang, J., Sakata, Y. & Yamakata, A. Effect of Na-Doping on Electron Decay Kinetics 502
in SrTiO3 Photocatalyst. ChemCatChem 11, 6349–6354 (2019). 503
45. Kato, K. & Yamakata, A. Defect-Induced Acceleration and Deceleration of Photocarrier 504
Recombination in SrTiO3 Powders. J. Phys. Chem. C 124, 11057–11063 (2020). 505
46. Konta, R., Ishii, T., Kato, H. & Kudo, A. Photocatalytic Activities of Noble Metal Ion Doped 506
SrTiO3 under Visible Light Irradiation. J. Phys. Chem. B 108, 8992–8995 (2004). 507
47. Han, R., Melo, M. A., Zhao, Z., Wu, Z. & Osterloh, F. E. Light Intensity Dependence of 508

22
Photochemical Charge Separation in the BiVO4/Ru-SrTiO3:Rh Direct Contact Tandem 509
Photocatalyst for Overall Water Splitting. J. Phys. Chem. C 124, 9724–9733 (2020). 510
48. von Luxburg, U. A tutorial on spectral clustering. Stat. Comput. 17, 395–416 (2007). 511
49. Koehl, R. M., Adachi, S. & Nelson, K. A. Direct Visualization of Collective Wavepacket 512
Dynamics. J. Phys. Chem. A 103, 10260–10267 (1999). 513
514

23
Figure captions 515
516
Fig.1 The image sequence of the refractive index change after photo-excitation by a UV pump light 517
for SrTiO3:Rh/ITO/BiVO4:Mo (STOR/ITO/BVOM) Z-scheme water splitting sheet measured by the 518
patterned-illumination time-resolved phase microscope (PI-PM) in different solvents ((a) in ACN, (b) 519
in water). (c) The light intensity pattern of the pump light and the selected regions for the cluster 520
analysis is indicated in red squares. The result of the cluster analysis for area No.1 is shown in Fig.5-521
7, and the others are presented in Fig.S4-S8 in Supporting information (SI)). 522
523
Fig.2 (a) The average refractive index change response of STOR/ITO/BVOM until 100 μs in 524
acetonitrile (ACN) and water obtained from the PI-PM image sequence (Fig.1). The response was 525
obtained from the signal amplitude at the light irradiated regions. (b) A schematic drawing of the 526
charge transfer/decay processes for STOR/ITO/BVOM in ACN. Surface trapped carriers cannot be 527
transferred to the solution side in ACN, where all the processes of charge dynamics are completed in 528
the system. 529
530
Fig.3 The average responses of the refractive index changes for (a) BVOM and (b) STOR until 531
100 μs in ACN and water obtained by the PI-PM image sequences. 532
533
Fig.4 The schematic flow diagram of the whole charge dynamics in STOR/ITO/BVOM in ACN. 534
Step 1 includes intrinsic recombination inside materials and charge transfer between two materials. 535
Step 2 indicates the decay of surface trapped charge carriers in ACN, which are utilized for water 536
splitting reactions with water outside. Step 3 includes the hole trapping to Rh3+/4+ state in STOR and 537
the slower recombination. 538
539
Fig.5 (a) An image sequence of the refractive index change for STOR/ITO/BVOM in ACN in a 540
square region (20×50 µm) corresponding to No.1 in Fig.1(c) on the order from nanoseconds to 541
microseconds. The scale bar corresponds to 20 µm. (b) The categorized mapping of the charge carrier 542
responses of (a). An outlier positioned far from all categories were colored in black (#0). (c) A 543
microscopic image in the same area as (a). (d) The averaged responses for each category in (b) are 544
shown. 545
546
Fig.6 (a) An image sequence of the refractive index response for STOR/BVOM in ACN in a 547
square region (18×50 µm) corresponding to No.1 in Fig.1(c) on the order from nanoseconds to 548
microseconds. The scale bar corresponds to 20 µm. (b) The categorized mapping of the charge carrier 549
responses of (a). An outlier positioned far from all categories were colored in black (#0). (c) A 550

24
microscopic image in the same area as (a). (d) The averaged responses for each category in (b) are 551
shown. 552
553
Fig.7 (a) An image sequence of the refractive index response for STOR/ITO/BVOM in water in 554
a square region (20×50 µm) corresponding to No.1 on the order from nanoseconds to microseconds. 555
The location of the sample was exactly the same as the Fig.5(a). The scale bar corresponds to 20 µm. 556
(b) The categorized mapping of the charge carrier responses of (a). An outlier positioned far from all 557
categories were colored in black (#0) (c) A microscopic image in the same area as (a). (d) The 558
averaged responses for each category in (b) are shown. 559
560
Figures
Figure 1
The image sequence of the refractive index change after photo-excitation by a UV pump light forSrTiO3:Rh/ITO/BiVO4:Mo (STOR/ITO/BVOM) Z-scheme water splitting sheet measured by the patterned-illumination time-resolved phase microscope (PI-PM) in different solvents ((a) in ACN, (b) in water). (c)The light intensity pattern of the pump light and the selected regions for the cluster analysis is indicatedin red squares. The result of the cluster analysis for area No.1 is shown in Fig.5-7, and the others arepresented in Fig.S4-S8 in Supporting information (SI)).

Figure 2
(a) The average refractive index change response of STOR/ITO/BVOM until 100 μs in acetonitrile (ACN)and water obtained from the PI-PM image sequence (Fig.1). The response was obtained from the signalamplitude at the light irradiated regions. (b) A schematic drawing of the charge transfer/decay processesfor STOR/ITO/BVOM in ACN. Surface trapped carriers cannot be transferred to the solution side in ACN,where all the processes of charge dynamics are completed in the system.

Figure 3
The average responses of the refractive index changes for (a) BVOM and (b) STOR until 100 μs in ACNand water obtained by the PI-PM image sequences.

Figure 4
The schematic �ow diagram of the whole charge dynamics in STOR/ITO/BVOM in ACN. Step 1 includesintrinsic recombination inside materials and charge transfer between two materials. Step 2 indicates thedecay of surface trapped charge carriers in ACN, which are utilized for water splitting reactions with wateroutside. Step 3 includes the hole trapping to Rh3+/4+ state in STOR and the slower recombination.

Figure 5
(a) An image sequence of the refractive index change for STOR/ITO/BVOM in ACN in a square region(20×50 μm) corresponding to No.1 in Fig.1(c) on the order from nanoseconds to microseconds. The scalebar corresponds to 20 μm. (b) The categorized mapping of the charge carrier responses of (a). An outlierpositioned far from all categories were colored in black (#0). (c) A microscopic image in the same area as(a). (d) The averaged responses for each category in (b) are shown.

Figure 6
(a) An image sequence of the refractive index response for STOR/BVOM in ACN in a square region(18×50 μm) corresponding to No.1 in Fig.1(c) on the order from nanoseconds to microseconds. The scalebar corresponds to 20 μm. (b) The categorized mapping of the charge carrier responses of (a). An outlierpositioned far from all categories were colored in black (#0). (c) A microscopic image in the same area as(a). (d) The averaged responses for each category in (b) are shown.

Figure 7
(a) An image sequence of the refractive index response for STOR/ITO/BVOM in water in a square region(20×50 μm) corresponding to No.1 on the order from nanoseconds to microseconds. The location of thesample was exactly the same as Fig.5(a). The scale bar corresponds to 20 μm. (b) The categorizedmapping of the charge carrier responses of (a). An outlier positioned far from all categories was coloredin black (#0) (c) A microscopic image in the same area as (a). (d) The averaged responses for eachcategory in (b) are shown.
Supplementary Files
This is a list of supplementary �les associated with this preprint. Click to download.
20210225SupportinginformationZscheme.pdf