Embed Size (px)
Citation preview
Charge Storage in Electret Polymers:
Mechanisms, Characterization and
Applications
Habilitationsschrift zur Erlangung des akademischen Grades
doctor rerum naturalium habilitatus
(Dr. rer. nat. habil.)
der Mathematisch-Naturwissenschaftlichen Fakultat
der Universitat Potsdam
vorgelegt von
Dr. Axel Mellinger
geb. am 25. August 1967 in Munchen
Potsdam, 06. Dezember 2004

iii
Abstract
Electrets are materials capable of storing oriented dipoles or an electric surplus charge for longperiods of time. The term “electret” was coined by Oliver Heaviside in analogy to thewell-known word “magnet”. Initially regarded as a mere scientific curiosity, electrets becameincreasingly imporant for applications during the second half of the 20th century. The mostfamous example is the electret condenser microphone, developed in 1962 by Sessler and West.Today, these devices are produced in annual quantities of more than 1 billion, and have becomeindispensable in modern communications technology.
Even though space-charge electrets are widely used in transducer applications, relatively littlewas known about the microscopic mechanisms of charge storage. It was generally accepted thatthe surplus charges are stored in some form of physical or chemical traps. However, trap depthsof less than 2 eV, obtained via thermally stimulated discharge experiments, conflicted with theobserved lifetimes (extrapolations of experimental data yielded more than 100 000 years). Usinga combination of photostimulated discharge spectroscopy and simultaneous depth-profiling ofthe space-charge density, the present work shows for the first time that at least part of the spacecharge in, e. g., polytetrafluoroethylene, polypropylene and polyethylene terephthalate is storedin traps with depths of up to 6 eV, indicating major local structural changes. Based on thisinformation, more efficient charge-storing materials could be developed in the future.
The new experimental results could only be obtained after several techniques for character-izing the electrical, electromechanical and electrical properties of electrets had been enhancedwith in situ capability. For instance, real-time information on space-charge depth-profiles wereobtained by subjecting a polymer film to short laser-induced heat pulses. The high data acqui-sition speed of this technique also allowed the three-dimensional mapping of polarization andspace-charge distributions.
A highly active field of research is the development of piezoelectric sensor films from electretpolymer foams. These materials store charges on the inner surfaces of the voids after havingbeen subjected to a corona discharge, and exhibit piezoelectric properties far superior to thoseof traditional ferroelectric polymers. By means of dielectric resonance spectroscopy, polypropy-lene foams (presently the most widely used ferroelectret) were studied with respect to theirthermal and UV stability. Their limited thermal stability renders them unsuitable for applica-tions above 50 C. Using a solvent-based foaming technique, we found an alternative materialbased on amorphous Teflon® AF, which exhibits a stable piezoelectric coefficient of 600 pC/Nat temperatures up to 120 C.
Zusammenfassung
Elektrete sind Materialien, welche orientierte elektrische Dipole oder eine elektrische Uberschuss-ladung uber langere Zeit speichern konnen. Der Begriff wurde 1885 von Oliver Heaviside inAnlehnung an das Wort ”Magnet“ eingefuhrt. Zunachst nur als wissenschaftliche Kuriositatbetrachtet, wurden sie seit Mitte des 20. Jahrhunderts in zunehmendem Maße fur technischeAnwendungen interessant. Als bekanntestes Beispiel sei hier das 1962 von Sessler und Westentwickelte Elektret-Kondensator-Mikrofon erwahnt, welches in jahrlichen Stuckzahlen von mehrals 1 Milliarde hergestellt wird und aus der modernen Kommunikationstechnik nicht mehr weg-zudenken ist.
Trotz der weit verbreiteten Anwendungen in der Sensorik war bisher nur wenig uber diemikroskopischen Mechanismen der Ladungsspeicherung bekannt. Allgemein wird davon ausge-gangen, dass die Uberschussladungen in physikalischen oder chemischen Haftstellen gespeichertsind. Bisherige Experimente zur thermisch stimulierten Entladung ergaben Bindungsenergienunterhalb von 2 eV, was im Widerspruch zu den beobachteten Lebensdauern (extrapoliert wur-
iv
den Werte von mehr als 100000 Jahren) steht. Mittels photostimulierter Entladung sowie si-multaner Messung des Ladungsprofils konnte nun fur eine Reihe wichtiger Elektret-Polymere(darunter das unter dem Handelsnamen Teflon® bekannte Polytetrafluorethylen, Polypropylenund Polyethylenterephthalat) erstmals gezeigt werden, dass zumindest ein Teil der Ladungenin tiefen Haftstellen von bis zu 6 eV gespeichert wird, was auf eine tiefgreifende lokale Struk-turanderung hinweist. Ausgehend von dieser Information konnten in Zukunft Materialien mitverbesserter Ladungsspeicherung gezielt entwickelt werden.
Die neuen Messungen waren erst moglich, nachdem mehrere Verfahren zur Bestimmung elek-trischer, elektromechanischer und mechanischer Eigenschaften von Elektreten fur einen In Situ-Einsatz weiterentwickelt wurden. So konnten z. B. durch Anregung von kurzen Warmepulsenin der Polymerfolie Informationen uber das Tiefenprofil der Raumladung in Echtzeit gewonnenwerden. Die schnelle Abtastung ermoglichte daruber hinaus die dreidimensionale Kartierung vonPolarisationsprofilen und Raumladungen.
Ein zur Zeit sehr aktives Forschungsgebiet ist die Entwicklung piezoelektrischer Sensorfolienaus geschaumten Elektret-Polymeren. Nach elektrischer Aufladung in einer Korona-Entladungwerden Ladungen an der Innenseite der Gasblaschen gespeichert, wodurch das Material piezo-elektrische Eigenschaften erhalt, welche deutlich besser sind als die der herkommlichen ferro-elektrischen Polymere. Fur die bisher gebrauchlichen Polypropylenschaume wurde neben derTemperaturstabilitat mittels dielektrischer Resonanzspektroskopie auch das Verhalten unterUV-Bestrahlung untersucht. Aufgrund ihrer beschrankten thermischen Stabilitat sind dieseSchaume nicht fur Anwendungen oberhalb von 50 C geeignet. Mittels eines Losungsmittel-basierten Schaumungsverfahrens wurde ein alternativer Werkstoff auf der Basis von amorphemTeflon® entwickelt, welcher einen stabilen piezoelektrischen Koeffizienten von 600 pC/N beiTemperaturen von bis zu 120 C aufweist.
Contents
1 Introduction 1
2 A Brief History of Space Charge Electrets 2
3 Charge Storage Mechanisms 4
4 Characterization 8
4.1 Polarization and Space Charge Profiling . . . . . . . . . . . . . . . . . . . . 9
4.1.1 Acoustic Methods . . . . . . . . . . . . . . . . . . . . . . . . . . . . . 9
4.1.2 Thermal Methods . . . . . . . . . . . . . . . . . . . . . . . . . . . . . 10
4.2 Piezoelectric Resonances . . . . . . . . . . . . . . . . . . . . . . . . . . . . 12
5 Applications 14
6 Conclusions and Outlook 18
References 20
Appendix 32
A Journal and Review Articles 32
Thermally stable dynamic piezoelectricity. . . (Appl. Phys. Lett. 79, 1852 (2001)) 33
Ultraviolet-induced discharge currents. . . (Appl. Phys. Lett. 82, 254 (2003)) . . 36
Dielectric Resonance Spectroscopy. . . (IEEE TDEI 10, 842 (2003)) . . . . . . . 39
Photostimulated discharge in electret polymers. . . (IEEE TDEI 11, 218 (2004)) 59
Unbiased iterative reconstruction. . . (Meas. Sci. Technol. 15, 1347 (2004)) . . . . 69
Fast thermal pulse measurements. . . (Rev. Sci. Instr. 76, in press (2005)) . . . . 77
Three-dim. mapping of polarization. . . (Appl. Phys. Lett., submitted (2004)) . . 83
B ITG Award Certificate 86
C Curriculum Vitae 88
Acknowledgments 89
v

1
1 Introduction
In today’s world of sophisticated mechanical, electromechanical and electronic applica-
tions, polymers are playing an increasingly important part. Their most significant advan-
tage over other materials is their complex structure, which can be physically or chemically
tailored for specific applications. For electrical applications, they can be divided into two
categories: (semi-)conducting and insulating polymers. The former have only recently
started to enter the market on a large scale, but show great promise in applications
ranging from antistatic coatings to optoelectronics and all-polymer integrated circuits.
In 2000, the pioneering work by Heeger, MacDiarmid and Shirakawa was awarded
with the Nobel Prize in Chemistry [1].
In contrast, highly insulating polymers have been used extensively for, e. g., electrical
cable insulation since their invention in the first half of the 20th century. Some of these
materials, such as various fluoropolymers, were shown to store injected electrical charges
for long periods of time [2], even at elevated temperatures. The invention of the electret
condenser microphone [3] and the discovery of piezo- and pyroelectricity in polyvinyli-
dene fluoride [4] opened up a wide market for electromechanical transducer applications.
Additionally, electrets are used in radiation dosimeters and gas filters [5]. In recent years,
non-polar ferroelectrets [6] with high piezoelectric coefficients have received considerable
attention. On the other hand, injected space charge may also have detrimental effects
on the host polymer [7]. For example, oxidation of cross-linked polyethylene is known to
enhance the accumulation of space charge near the electrodes, and in turn lead to electric
breakdown [8], thus causing premature failure of high-voltage cable insulations. Dissado
et al. developed a model based on the reduction of the free-energy barrier to degrada-
tion which is in good agreement with thermo-electrical degradation measurements [9],
although it should be mentioned that there in still some controversy as to whether space
charge is a precursor to aging or merely its consequence [10]. Nevertheless, being able
to characterize, control and limit charge injection appears to be an important factor in
the prevention of high-voltage accidents which pose a severe risk of property damage and
injury.
While applications of space-charge electrets are well established, understanding the
unusually high stability of space charges in some materials is still an evolving topic.
Traditionally, charge transport phenomena in organic semiconductors have been described
using the same continuum descriptions and models originally developed for inorganic
semiconductors [11], such as band theory, space-charge limited currents, etc., although
there now appears to be a consensus that effects of discrete charged particles and their
interactions with their local environments need to be taken into account [12]. Possible
charge trapping mechanisms and experimental evidence will be covered in section 3.
2 2 A BRIEF HISTORY OF SPACE CHARGE ELECTRETS
In view of the importance of space-charge electrets for commercial applications, it
is evident that accurate techniques of characterizing space charge with respect to their
concentration, distribution and stability are needed. Even more important, future electret
research will increasingly depend on a multi-technique approach, combining electrical
with thermal, optical and mechanical methods. It is therefore essential that space-charge
characterization techniques be made compatible with each other. Section 4 summarizes
some recent developments in this area.
A deeper understanding of the mechanisms of charge storage will ultimately lead to
improved materials for applications, particularly in the area of electromechanical trans-
ducers. Already, the new class of non-polar ferroelectrets based on charge-storing polymers
has become available on the market [13]. Recent developments in this area are discussed
in section 5.
2 A Brief History of Space Charge Electrets
Charge storage in dielectric materials can be traced back at least to ancient Greece.
At that time, it was well-known that by rubbing amber against a fur cloth it would
attract other things (such as straw) in its vicinity. In fact, the Greek work for amber,
hlektron (electron), was later used to name not only a fundamental elementary particle
carrying negative charge, but – in various derivatives, such as electricity, electrodynamics
or electronics – entire branches of modern physics and engineering. For more than two
millennia, this effect was regarded as a mere scientific curiosity. However, this did not
prevent people from studying the phenomenon in greater detail. In the 18th century,
Gray [14] investigated the electrostatic attraction of a number of charged materials,
such as resins and waxes. A century later, Faraday [15] gave a definition of electret
materials that still in use today, by describing them as dielectrics “which retain an electric
moment after the externally-applied field has been reduced to zero”. The term electret
was coined by Heaviside in 18851 [16] in analogy to the already established magnet. The
first systematic investigation of electrets was performed by Eguchi in 1919 [18], who
introduced the important technique of thermal charging, where the material is exposed
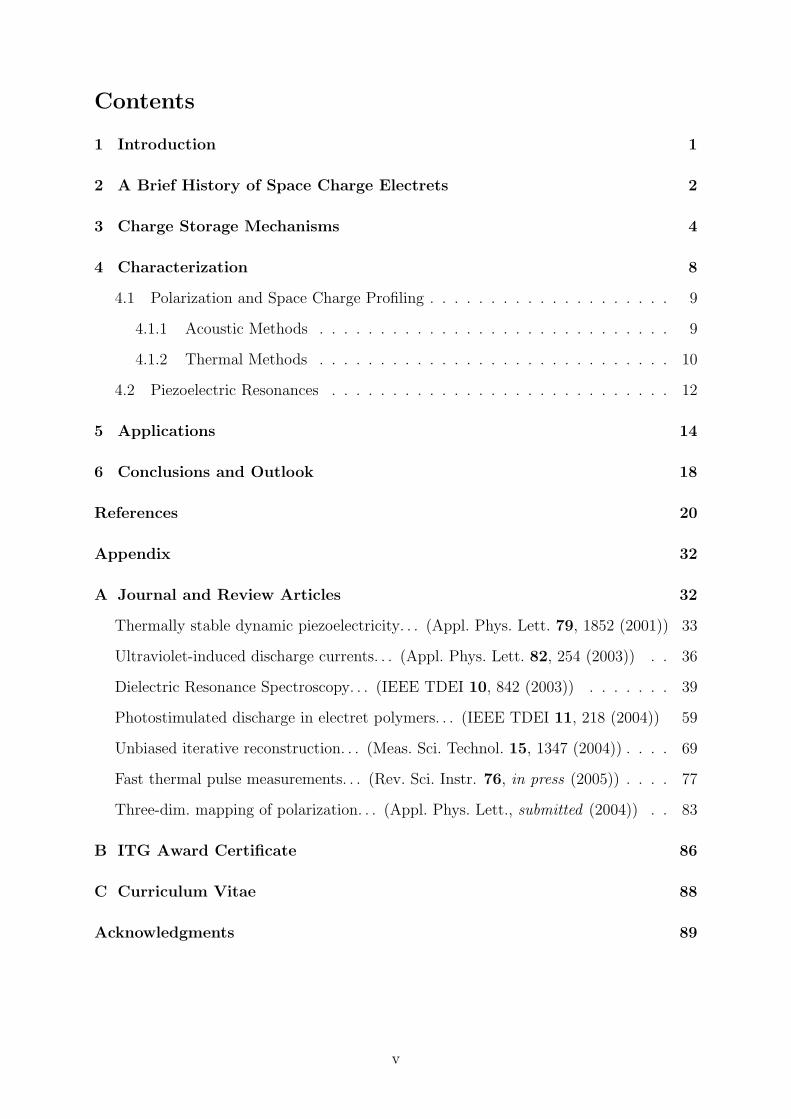
to a high electric field while being cooled down from an elevated temperature (cf. Fig. 1).
He also discovered that the charge adjacent to the electrode may have either the same
sign as than on the electrode (subsequently named homocharge by Gemant [19]) or the
opposite sign (heterocharge). The latter was later shown by Gross [20, 21] to be due to
oriented molecular dipoles while the former results from injected interfacial charges. In
the following years, other charging methods, such as high-energy electrons [22], corona
discharge [23] and liquid contacts [24,25] were introduced.
1The commonly quoted year of 1892 is that of a reprint of the original work [17].
3
t1 t2
time
electric field
temperaturec
aT
T
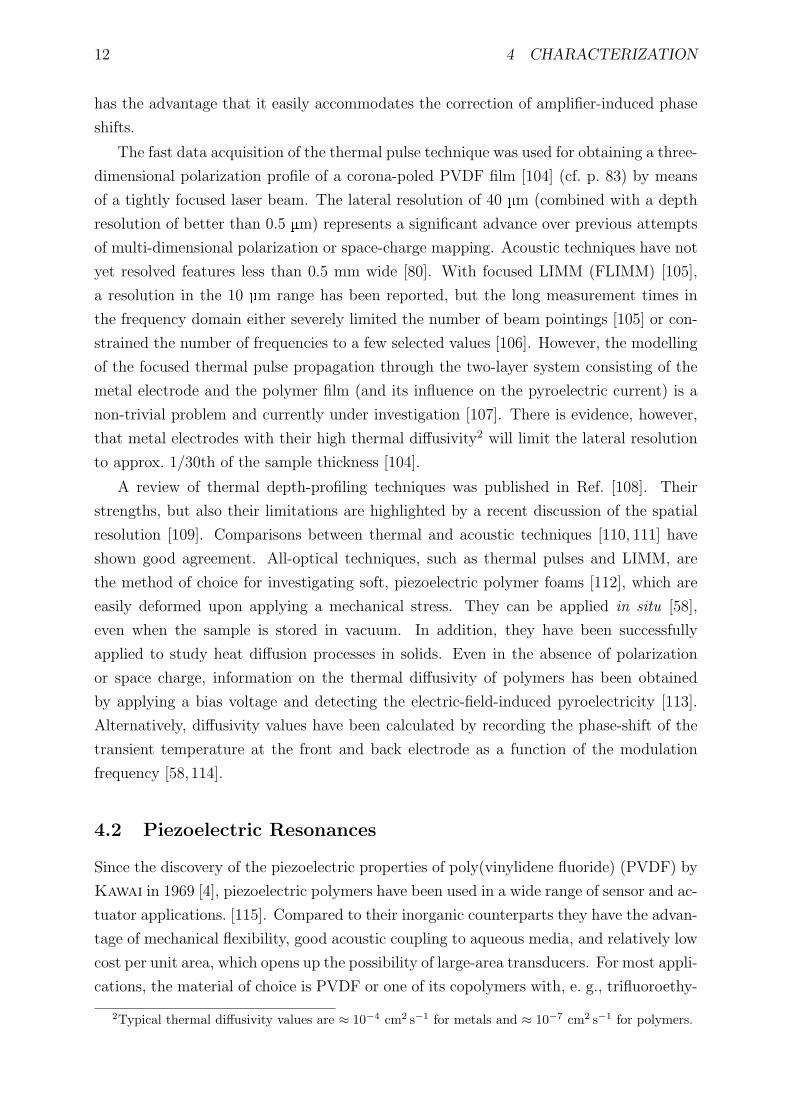
Figure 1: Thermal charging of electrets: the material is heated from ambient temperatureTa to an elevated charging temperature Tc, where an electric field is applied for a time oft1. The electric field is maintained for a time t2 during and after the cool-down phase.
Table 1: Selected insulating polymers. Years indicate the beginning of commercialization.(From [27,28,29].)
Polymer Producer Year conductivity [(Ω cm)−1]Poly(vinyl chloride) (PVC) B. F. Goodrich 1927 10−16
Polystyrene (PS) I. G. Farben/Dow 1930 < 10−16
Polyethylene (PE) ICI 1939 10−15 . . . 10−18
Polyethylene terephthalate (PETP) ICI 1941 < 10−14
Polytetrafluoroethylene (PTFE) Dupont 1945 10−18
Poly(vinylidene fluoride) (PVDF) Dupont 10−14
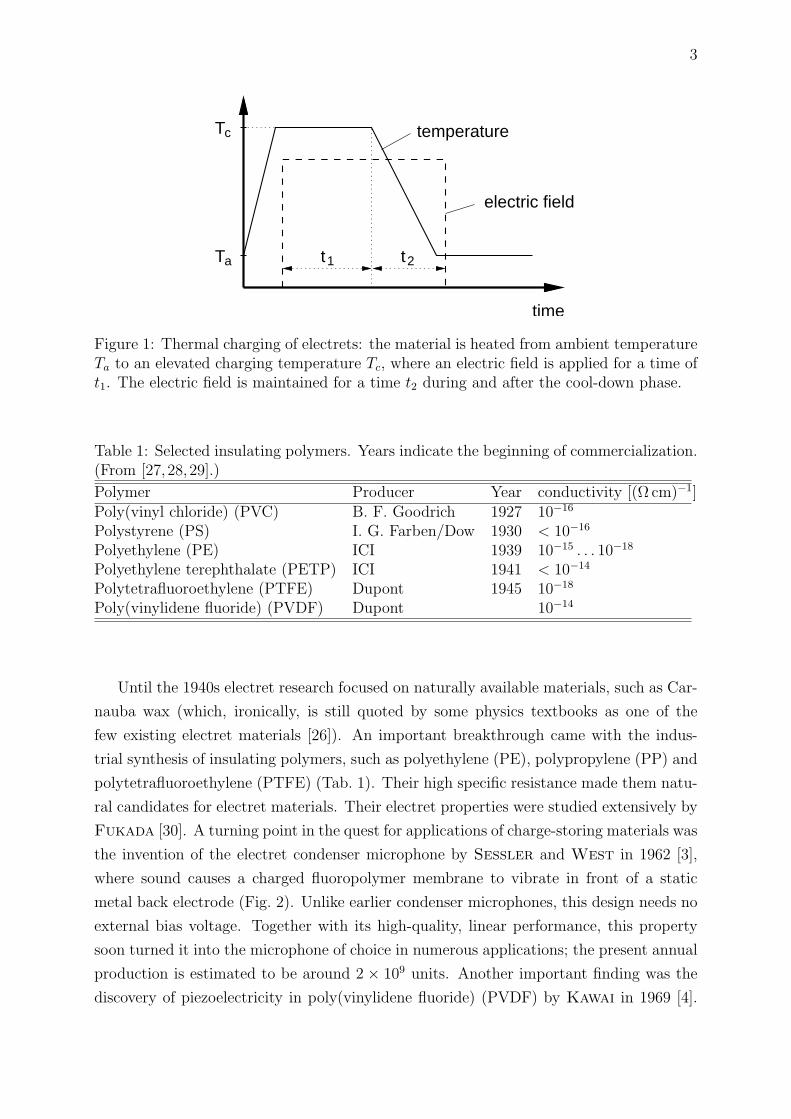
Until the 1940s electret research focused on naturally available materials, such as Car-
nauba wax (which, ironically, is still quoted by some physics textbooks as one of the
few existing electret materials [26]). An important breakthrough came with the indus-
trial synthesis of insulating polymers, such as polyethylene (PE), polypropylene (PP) and
polytetrafluoroethylene (PTFE) (Tab. 1). Their high specific resistance made them natu-
ral candidates for electret materials. Their electret properties were studied extensively by
Fukada [30]. A turning point in the quest for applications of charge-storing materials was
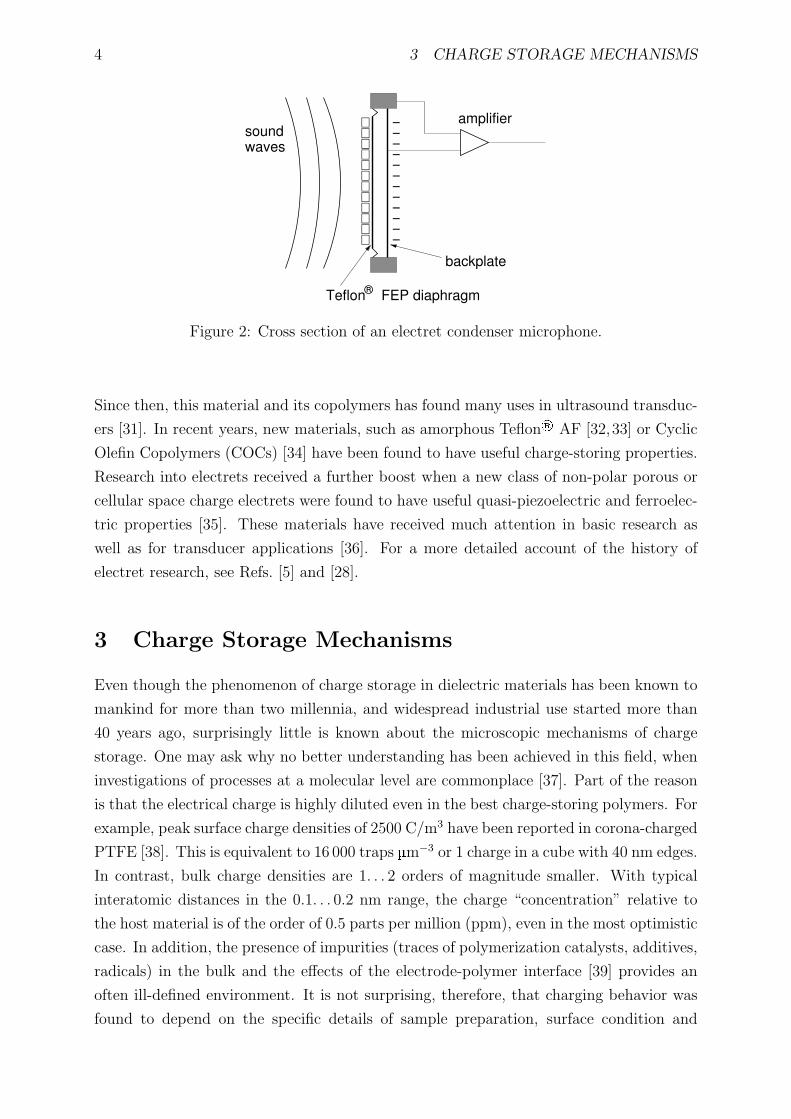
the invention of the electret condenser microphone by Sessler and West in 1962 [3],
where sound causes a charged fluoropolymer membrane to vibrate in front of a static
metal back electrode (Fig. 2). Unlike earlier condenser microphones, this design needs no
external bias voltage. Together with its high-quality, linear performance, this property
soon turned it into the microphone of choice in numerous applications; the present annual
production is estimated to be around 2 × 10⁹ units. Another important finding was the
discovery of piezoelectricity in poly(vinylidene fluoride) (PVDF) by Kawai in 1969 [4].
4 3 CHARGE STORAGE MECHANISMS
++++++++++
++
−
−−−−−−−−−−
−soundwaves
backplate
amplifier
Teflon FEP diaphragm®
Figure 2: Cross section of an electret condenser microphone.
Since then, this material and its copolymers has found many uses in ultrasound transduc-
ers [31]. In recent years, new materials, such as amorphous Teflon® AF [32,33] or Cyclic
Olefin Copolymers (COCs) [34] have been found to have useful charge-storing properties.
Research into electrets received a further boost when a new class of non-polar porous or
cellular space charge electrets were found to have useful quasi-piezoelectric and ferroelec-
tric properties [35]. These materials have received much attention in basic research as
well as for transducer applications [36]. For a more detailed account of the history of
electret research, see Refs. [5] and [28].
3 Charge Storage Mechanisms
Even though the phenomenon of charge storage in dielectric materials has been known to
mankind for more than two millennia, and widespread industrial use started more than
40 years ago, surprisingly little is known about the microscopic mechanisms of charge
storage. One may ask why no better understanding has been achieved in this field, when
investigations of processes at a molecular level are commonplace [37]. Part of the reason
is that the electrical charge is highly diluted even in the best charge-storing polymers. For
example, peak surface charge densities of 2500 C/m3 have been reported in corona-charged
PTFE [38]. This is equivalent to 16 000 traps µm−3 or 1 charge in a cube with 40 nm edges.
In contrast, bulk charge densities are 1. . . 2 orders of magnitude smaller. With typical
interatomic distances in the 0.1. . . 0.2 nm range, the charge “concentration” relative to
the host material is of the order of 0.5 parts per million (ppm), even in the most optimistic
case. In addition, the presence of impurities (traces of polymerization catalysts, additives,
radicals) in the bulk and the effects of the electrode-polymer interface [39] provides an
often ill-defined environment. It is not surprising, therefore, that charging behavior was
found to depend on the specific details of sample preparation, surface condition and
5
residual stresses [40]. In spite of these problems, a number of important observations and
theoretical calculations have recently shed some light onto the problem of charge storage.
Despite its high dilution in the polymer host, space charge is easily detected at the
macroscopic level using sensitive electrometers. For example, in a polymer film of 25 µm
thickness and an area of 1 cm2, the above mentioned charge densities amount to a space
charge in the nC. . .µC range. Many early measurements of charge-storing polymers were
therefore carried out by observing conduction and discharge currents. Thermally stim-
ulated discharge (TSD) and thermally stimulated currents (TSC) have provided a large
amount of information on the thermal stability of space charges in electrets [2, 41]. By
far the most stable space charge was observed in negatively charged Teflon® PTFE and
FEP. From open-circuit TSC data, von Seggern and Remke deduced that the charges
must be located in traps with energies around 0.7-1.25 eV near the surface and up to
1.7 eV in the bulk [42,43]. Charging at temperatures between 200 and 250 C resulted in
a nearly homogeneous volume charge [38]. The nature of these traps, however, remained
unknown. Any trap site must stabilize the charge via interactions with its molecular en-
vironment. Therefore, trap depths may be expected to cover a wide energy range, from
less than 0.1 eV for dipolar and van der Waals interactions, as well as conformational
disorders (sometimes named “physical traps”), up to 8 eV if the trapped charge modifies
the covalent bonding of the polymer (chemical traps). Assuming an Arrhenius behavior,
the charge life-time in the trap is given by
τ = τ0eEtrap/(kT ) , (1)
where Etrap is the trap depth, T is the temperature, k is Boltzmann’s constant and τ−10
is the “attempt-to-escape” frequency, which is of the order of typical molecular vibration
frequencies (1013 Hz). Extrapolated from measurements at elevated temperature [44,
45], room temperature lifetimes in the range of 103 . . . 2.6 × 10⁵ years have been found.
According to Eq. (1), these values require trap-depths of at least 1.5 eV, which is near the
top end of the observed TSD lifetimes and suggests that chemical bond modification plays
an important part. This was further supported by a recent molecular modeling approach:
Meunier et al. calculated trap energies in the presence of impurities commonly found in
the type of polyethylene used for cable insulation [46] and found charge carrier densities
of up to 1017 cm−3 with lifetimes of 30 000 years. In addition, some of the impurities have
been identified through their luminescence spectra [47]. A direct observation of trapped
space charges at a molecular level was reported by Legrand et al. who used electron spin
resonance (ESR) on electron-beam irradiated isotactic polypropylene films [48]. Besides
the formation of radicals, they also observed an extra line in the ESR spectrum which
they attributed to trapped electrons.
6 3 CHARGE STORAGE MECHANISMS
10-2
100
102
104
106
10-24 10-22 10-20 10-18 10-16 10-14
lifet
ime
τ [y
ears
]
conductivity G [(Ωm)-1]
experimentally observed
space-charge lifetimes
10-2
100
102
104
106
10-24 10-22 10-20 10-18 10-16 10-14
lifet
ime
τ [y
ears
]
conductivity G [(Ωm)-1]
experimentally observed
space-charge lifetimes
10-2
100
102
104
106
10-24 10-22 10-20 10-18 10-16 10-14
lifet
ime
τ [y
ears
]
conductivity G [(Ωm)-1]
experimentally observed
space-charge lifetimes
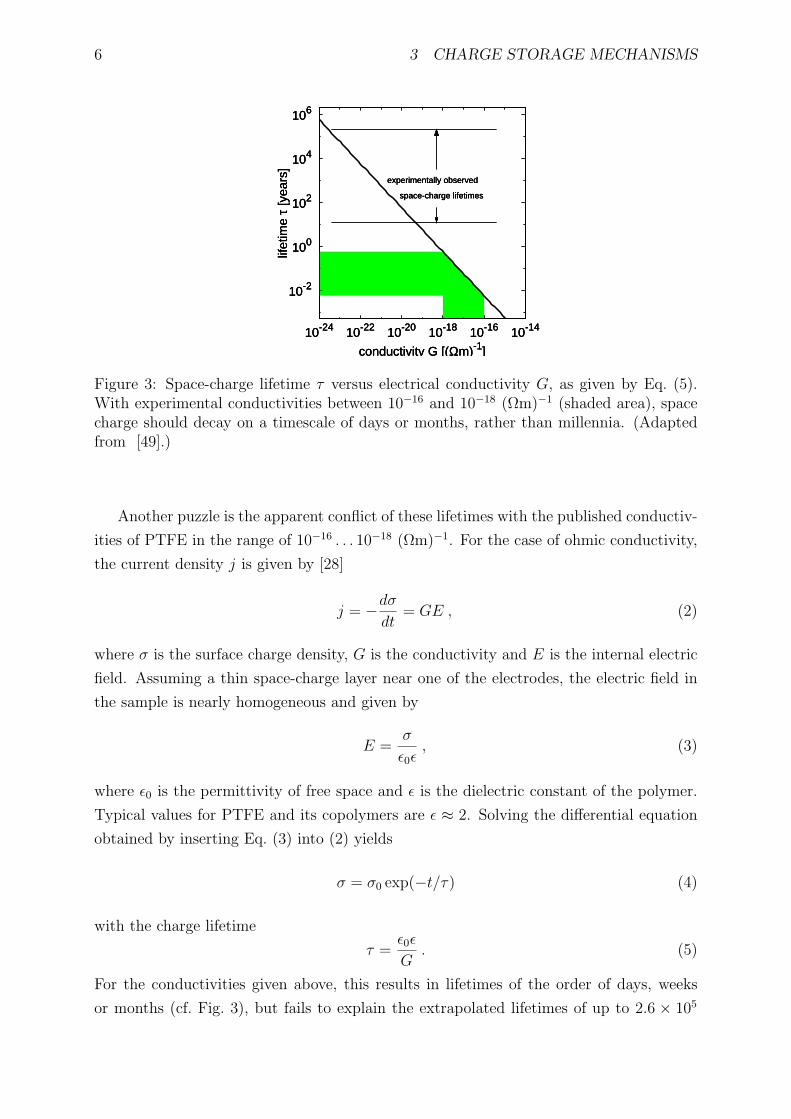
Figure 3: Space-charge lifetime τ versus electrical conductivity G, as given by Eq. (5).With experimental conductivities between 10−16 and 10−18 (Ωm)−1 (shaded area), spacecharge should decay on a timescale of days or months, rather than millennia. (Adaptedfrom [49].)
Another puzzle is the apparent conflict of these lifetimes with the published conductiv-
ities of PTFE in the range of 10−16 . . . 10−18 (Ωm)−1. For the case of ohmic conductivity,
the current density j is given by [28]
j = −dσ
dt= GE , (2)
where σ is the surface charge density, G is the conductivity and E is the internal electric
field. Assuming a thin space-charge layer near one of the electrodes, the electric field in
the sample is nearly homogeneous and given by
E =σ
ε0ε, (3)
where ε0 is the permittivity of free space and ε is the dielectric constant of the polymer.
Typical values for PTFE and its copolymers are ε ≈ 2. Solving the differential equation
obtained by inserting Eq. (3) into (2) yields
σ = σ0 exp(−t/τ) (4)
with the charge lifetime
τ =ε0ε
G. (5)
For the conductivities given above, this results in lifetimes of the order of days, weeks
or months (cf. Fig. 3), but fails to explain the extrapolated lifetimes of up to 2.6 × 10⁵
7
years. Ma lecki suggested an elegant rate equation model [49], where carrier annihilation
at the electrode and by free, implanted charges causes a transition from a short-term,
exponential decay – resulting from ohmic conductivity – to a long-term linear decay over
thousands of years. Again, this model requires the presence of deep traps to minimize
thermal activation of charge carriers.
Due to thermal decomposition of polymers at higher temperatures, trap energies above
1.5 eV are inaccessible by thermal methods. Photostimulated discharge (PSD) spec-
troscopy [50], a technique where charge carriers are excited out of their traps by absorp-
tion of monochromatic visible or UV radiation, can fill in the missing information. PSD
was initially used in the near-infrared and visible spectral range to analyze trap param-
eters in crystalline organic materials, such as anthracene [51]. Its advantages over TSD
are a superior energy resolution (limited, in most cases, by homogeneous line broadening)
and access to energy levels in the range up to 8 eV, similar to those of chemical bonds in
the polymer chain. For example, Oda et al. found evidence for a single trapping level in
Teflon® FEP at 4.9 eV [52]. Special care must be taken, though, to separate the various
sources of photocurrents [53], such as the external photoeffect and photoconductivity. It
is therefore essential that PSD be combined with other techniques to monitor changes in
the space charge density. This was demonstrated on PTFE, PETP and PP, as presented
on p. 59 ff. [54]. The PSD spectrum of PTFE shows an onset of the photocurrent at
λ = 250 nm. Irradiation at 240 nm for 50 min caused a reduction of charge in the bulk,
as measured with the acoustic PPS method (see section 4.1.1). Due to the limited spatial
resolution, it was not possible, though, to distinguish between near-surface charges in the
polymer and compensation charges on the metal electrode. The PSD spectrum and the
observed change in space charge density are consistent with the release of trapped charges
from traps with a depth of 4.6 eV, in fair agreement with Oda’s results [52].
Due to its large band gap of 8.4 eV [55], PTFE is transparent down to the vacuum
ultraviolet (VUV) region. In PETP, on the other hand, the presence of the phenyl ring
gives rise to a strong optical absorption edge near 310 nm, resulting from a transition
derived from the benzene 1A1g →1 B2u (1Lb) absorption band [56]. In the same region,
a pronounced peak appears in the PSD spectrum [54]. Successive irradiation of PETP
at 303 and 310 nm results in a red-shifted current maximum, which can be explained
by preferential de-trapping of charge carriers from traps with energies between 4.0 and
4.2 eV. The observed state-selective detrapping also gives support to the hypothesis of
direct photo-induced detrapping over any indirect process.
The most pronounced case of state-selective detrapping was found in cellular polypropy-
lene [54, 57]. The material exhibits three PSD current maxima at 276, 223 and 198 nm,
which can be (at least partially) selectively bleached by irradiation at the respective
wavelengths. Due to the attenuation of pressure-pulses in this soft material, no space-
charge measurements were performed. Instead, its piezoelectric activity (cf. section 5)
8 4 CHARACTERIZATION
was monitored in situ with the piezoelectric resonance technique described in section 4.2.
No change in its d33 coefficient was found during irradiation at 276 and 223 nm, whereas
irradiation below 210 nm resulted in a gradual reduction of d33. As the piezoelectric prop-
erties are caused by charges trapped on the inner surfaces of the voids, this observation
directly links these charges to the 6.2 eV traps corresponding to the 198 nm maximum
in the PSD spectrum. Recently, UV-induced charge depletion has also been observed in
cyclic olefin copolymer (COC) films [58,59]. Here, the acoustic space-charge profiling was
replaced by the thermal pulse method (cf. section 4.1.2), which can be used while the
sample is being irradiated.
With the increasing evidence for deep-level charge traps, how can this picture be recon-
ciled with the lower activation energies obtained from thermal methods? One possibility
is a distribution of traps over a broad range of energies, from less than 1 eV up to at
least 6 eV. This is supported by the fact that photoinduced removal of space charge from
4. . . 6 eV traps has only led to a partial reduction of the space charge density in PTFE,
PETP and PP [54]. On the other hand, thermally stimulated discharge experiments are
known to quantitatively discharge the polymer, which manifests itself as the so-called ρ
peak in the TSD thermogram [41]. The ρ peak generally appears at a higher tempera-
ture than the α relaxation associated with the glass transition temperature, indicating
the importance of polymer chain mobility in the discharge process [60]. With increasing
chain mobility, charges located in deep traps could be transported through the polymer
matrix and may eventually reach the surface region where detrapping or charge compen-
sation will take place. This “charge transport” mechanism is similar to the “wet dog”
effect described by Kryszewski et al. [61]. A third possible discharge mechanism is
compensation by movable ions.
4 Characterization
Characterization of fundamental material parameters, as well as measurement of specific
sample or device properties, are key elements in the quest for understanding the micro-
scopic mechanisms of charge storage. The progress in electret research would not have
been possible without a wide range of methods to characterize electrets with respect to
their electrical, thermal, mechanical and chemical properties. Ultimately, the improved
understanding of material properties will lead to improved materials and devices, such as
electromechanical transducers or high-voltage cable insulation. In the history of electret
research, numerous characterization techniques have been developed, some of which are
still in active use today. In many cases, the precision and sensitivity can be improved
substantially by implementing them with modern laboratory and computer equipment.
Moreover, progress in this field increasingly depends on combining several methods in
order to gain a complete picture of the chemical, physical and electrical properties of the
4.1 Polarization and Space Charge Profiling 9
material under investigation. In this section, we shall focus on non-destructive, in situ
techniques to map out space charge densities in one and three dimensions, as well as to
obtain electrical, electromechanical and mechanical parameters and monitor their changes
under, e. g., ultraviolet irradiation.
4.1 Polarization and Space Charge Profiling
During the past three decades, numerous techniques for obtaining space charge and po-
larization depth profiles in insulating materials have been developed [62] and applied
to a wide range of topics, such as the accumulation of space charge in high-voltage ca-
ble insulations [63], the development and optimization of pyroelectric and piezoelectric
sensors [64, 65], and basic research into the mechanisms of charge storage [54] in elec-
tret polymers. All depth-profiling methods use an external stimulus (usually thermal,
mechanical, or electrical) to generate a response (electrical or mechanical) which carries
information on the spatial distribution of embedded electric dipoles or space charges.
4.1.1 Acoustic Methods
Acoustic techniques rely on a pressure step or wave, generated via the absorption of an
ultrashort laser pulse (Laser Induced Pressure Pulse, LIPP) [66,67] or a fast piezoelectric
transducer (Pressure Wave Propagation (PWP) method [68, 69], also known as Piezo-
electrically generated Pressure Pulse (PPS) method [70]) to obtain a short-circuit current
which is recorded with a fast oscilloscope. Alternatively, a short electrical pulse applied to
a piezoelectric material or space-charge electret generates a traveling pressure front which
can be picked up with a microphone (Pulsed Electro-Acoustic technique, PEA) [71]. Us-
ing modern laboratory equipment, a time resolution of 1 ns can be achieved for both
PPS [38] and PEA. With a speed of sound of approx. 2 µm/ns (a typical value for many
polymers [72]), this translates into a the spatial resolution of 2 µm, which remains approx-
imately constant throughout the sample. A potential advantage of PEA is the fact that
the detection circuit is electrically decoupled from the sample, so that investigations under
high electric fields can be performed without the risk of damaging expensive and sensitive
amplifier equipment [73]. Very recently, Imai et al. demonstrated an open-electrode PEA
system where the specimen surface is accessible so that surface and internal charge distri-
butions can be measured simultaneously [74]. For all acoustic techniques, extracting po-
larization and space charge profiles from the measured current response is straightforward.
Leal Ferreira and Gerhard-Multhaupt derived first-order response equations [75]
applicable to both acoustic and thermal methods (cf. Section 4.1.2).
Several research groups have combined acoustic depth-profiling with in-plane scanning
to obtain two- or three-dimensional polarization or space charge maps. Alquie et al. used
LIPP to map out the surface distribution of space charges on Teflon® FEP [67] with a
10 4 CHARACTERIZATION
lateral resolution of 0.2 mm, while Imaizumi reported three-dimensional images of the
space-charge distribution in polymethyl methacrylate (PMMA) with a 1 mm resolution
using a PEA setup with spatially confined electrodes [76, 77]. Data acquisition for each
point took about 1 min. A much faster system (3 s acquisition time per point) was
built by Qin et al. who used an acoustic lens to focus a pressure wave on a small region
of approx. 1 mm2 [78, 79]. Acoustic focusing was later applied to PEA by Maeno,
enabling him to probe only a small region (approx. 0.5 mm in diameter) of the sample [80].
Hole and Lewiner compared two approaches, one using LIPP with wedge-shaped target
electrodes at different angles of incidence, the other using PEA with a transducer array,
and visualized the space charge distributions with anaglyph images [81].
Both PWP and PEA usually require an acoustic coupling between generator and
sample on the one hand, and sample and detector on the other hand. This can be a
severe constraint if the charge profile investigation is to be performed in real time and
in situ, especially when at least one of the electrodes must be accessible by, e. g., visible
or UV radiation. Nevertheless, changes in the space charge depth profile of polyethylene
terephthalate have been detected using the PPS technique [54]. No such constraint exists
for LIPP; the only requirement here is that the front electrode be opaque to the laser
light and capable of withstanding the light pulses for at least one shot. Recently, LIPP
has been used to detect surface charges in inhomogeneous dielectrics [82, 83]. Standard
mode-locked Nd:YAG lasers deliver pulse lengths of approx. 5 ns, equivalent to a spatial
resolution of 10 µm. Thus, achieving a resolution on a µm scale already requires the use
of expensive lasers capable of delivering picosecond pulses [66]. In combination with a
new generation of ultra-fast digital storage oscilloscopes achieving bandwidths of up to
10 GHz, a sub-µm resolution appears feasible, albeit at substantial cost.
4.1.2 Thermal Methods
Thermal techniques use the absorption of a short light pulse or a periodically modulated
laser beam by an opaque surface layer to create a time-dependent, spatially varying tem-
perature distribution. In samples that are either pyroelectric or contain an electric space
charge, this gives rise to a short-circuit current, which again carries information on the
polarization or space-charge depth profile. Although initial insights into the potential of
these techniques were obtained by Phelan and Peterson in their investigation of the
frequency response of pyroelectric detectors [84, 85], the first dedicated study of space
charge profiles by means of thermal pulses was reported by Collins [86, 87]. A key
difference to acoustic methods is the fact that the propagation of the thermal pulse or
wave is a diffusion phenomenon rather than a linear propagation, which greatly compli-
cates signal analysis. Initially, it was assumed that thermal pulses are only suitable for
obtaining charge centroids [88], since extracting a charge or polarization profile from the
measured current involves solving a Fredholm integral equation of the first kind, which
4.1 Polarization and Space Charge Profiling 11
is an ill-conditioned problem [89]. Later, however, several deconvolution methods were
shown to yield polarization depth-profiles [90,91,92,93], albeit with decreasing resolution
at larger depths. While the first thermal pulse experiments were carried out with Xenon
flashlamps delivering pulse durations in the µs. . . ms range (which is not short compared
to the diffusion time for distances in the µm range) [87], later implementations used
mode-locked pulsed laser sources with pulse durations in the ns range (and corresponding
diffusion lengths well below 0.1 µm), which simplifies data analysis.
A frequency-domain counterpart to the thermal pulse technique was introduced by
Lang and Das-Gupta [94], now commonly referred to as thermal wave technique or
Laser Intensity Modulation Method (LIMM). Here, the top electrode is irradiated with
an intensity-modulated continuous-wave (cw) laser beam while the short-circuit current
is recorded with a phase-sensitive lock-in amplifier. With relatively modest laboratory
equipment, this technique is capable of achieving a near-surface depth resolution of less
than 0.1 µm [95]. The deconvolution process of the signal is similar to that used for thermal
pulses. The LIMM equation [96] which relates the polarization or space-charge depth pro-
file to the measured current was solved using, e. g., Tikhonov regularization [97,98], poly-
nomial expansion [99], neural networks [100] and a Monte Carlo-based technique [101]. A
particularly simple and straightforward scale transformation technique was introduced by
Ploss et al. who demonstrated that the difference between the real and imaginary part
of the pyroelectric current is proportional to the pyroelectric coefficient [102]. However,
this method is limited to regions near the heated surface. For depths larger than one
quarter of the sample thickness, the accuracy decreases significantly.
Modern computational power permitted a new promising approach using an itera-
tive method [103] (cf. p. 69), previously known from digital image processing and signal
reconstruction. Simulations showed slightly smaller residuals than those obtained using
Tikhonov regularization. In addition, this technique also appeals from an educational
point of view, since it visualizes how the “true” depth profile gradually emerges from a
starting solution as the iteration progresses. One suitable initial distribution is the scale
transformation solution. With increasing number of iterations, its deficiencies at larger
depths are gradually corrected.
A direct comparison between the time- and frequency-domain approaches [59] (cf.
p. 77) showed excellent agreement for a space-charge profile in corona-charged PTFE.
However, the thermal-pulse data was acquired up to 50 times faster than the LIMM
measurement. This allows the real-time monitoring of thermally or optically induced
charge decay on a timescale of minutes, rather than hours, as demonstrated on a pyrene-
doped COC (TOPAS® 8007, Ticona) film, where irradiation at 300 nm significantly
accelerated the space-charge decay [59, 58]. The frequency-domain data analysis, well
established for LIMM, was shown to be also applicable to thermal data which had been
transformed to the frequency domain via a Fast Fourier Transform (FFT). This approach
12 4 CHARACTERIZATION
has the advantage that it easily accommodates the correction of amplifier-induced phase
shifts.
The fast data acquisition of the thermal pulse technique was used for obtaining a three-
dimensional polarization profile of a corona-poled PVDF film [104] (cf. p. 83) by means
of a tightly focused laser beam. The lateral resolution of 40 µm (combined with a depth
resolution of better than 0.5 µm) represents a significant advance over previous attempts
of multi-dimensional polarization or space-charge mapping. Acoustic techniques have not
yet resolved features less than 0.5 mm wide [80]. With focused LIMM (FLIMM) [105],
a resolution in the 10 µm range has been reported, but the long measurement times in
the frequency domain either severely limited the number of beam pointings [105] or con-
strained the number of frequencies to a few selected values [106]. However, the modelling
of the focused thermal pulse propagation through the two-layer system consisting of the
metal electrode and the polymer film (and its influence on the pyroelectric current) is a
non-trivial problem and currently under investigation [107]. There is evidence, however,
that metal electrodes with their high thermal diffusivity2 will limit the lateral resolution
to approx. 1/30th of the sample thickness [104].
A review of thermal depth-profiling techniques was published in Ref. [108]. Their
strengths, but also their limitations are highlighted by a recent discussion of the spatial
resolution [109]. Comparisons between thermal and acoustic techniques [110, 111] have
shown good agreement. All-optical techniques, such as thermal pulses and LIMM, are
the method of choice for investigating soft, piezoelectric polymer foams [112], which are
easily deformed upon applying a mechanical stress. They can be applied in situ [58],
even when the sample is stored in vacuum. In addition, they have been successfully
applied to study heat diffusion processes in solids. Even in the absence of polarization
or space charge, information on the thermal diffusivity of polymers has been obtained
by applying a bias voltage and detecting the electric-field-induced pyroelectricity [113].
Alternatively, diffusivity values have been calculated by recording the phase-shift of the
transient temperature at the front and back electrode as a function of the modulation
frequency [58,114].
4.2 Piezoelectric Resonances
Since the discovery of the piezoelectric properties of poly(vinylidene fluoride) (PVDF) by
Kawai in 1969 [4], piezoelectric polymers have been used in a wide range of sensor and ac-
tuator applications. [115]. Compared to their inorganic counterparts they have the advan-
tage of mechanical flexibility, good acoustic coupling to aqueous media, and relatively low
cost per unit area, which opens up the possibility of large-area transducers. For most appli-
cations, the material of choice is PVDF or one of its copolymers with, e. g., trifluoroethy-
2Typical thermal diffusivity values are ≈ 10−4 cm2 s−1 for metals and ≈ 10−7 cm2 s−1 for polymers.
4.2 Piezoelectric Resonances 13
lene (TrFE) or hexafluoropropylene (HFP) [116]. Several other polymers have been shown
to have potentially useful piezoelectric properties, such as odd-numbered polyamides [117],
copolymers of vinylidene cyanide (VDCN) [118], polyureas [119], polyurethane [120], and
polythioureas [121]. In all these materials, the basis of their piezoelectric behavior is
the orientation of molecular dipoles, either in the form of a remanent polarization in
ferroelectric domains or a frozen-in polarization in the amorphous phase. Typical room-
temperature piezoelectric coefficients are of the order of 20. . . 40 pC/N. Recently, how-
ever, several materials and systems have been described in the literature [36] that contain
macroscopic rather than molecular dipoles and exhibit an electrical response under me-
chanical stress (and, conversely, a mechanical response upon an electrical stimulus) which
matches or exceeds that of traditional piezoelectric polymers3.
The very active research in the field of piezoelectric polymers necessitates efficient
methods for measuring their electrical, electromechanical and mechanical properties. One
technique that has proven to be extremely useful and versatile is the analysis of reso-
nances in the dielectric spectrum [122]. Just as in traditional dielectric or impedance
spectroscopy [123], the electroded sample is subjected to an AC voltage while the current
response is monitored with a phase-sensitive detector. In piezoelectric materials, this
electrically induced stress will excite mechanical resonances at specific frequencies that
depend on the elastic and piezoelectric properties as well as the geometry and density.
Analysis of these resonances and comparison with a theoretical model thus yields a range
of material parameters from a single dielectric spectrum. By using samples with suitable
geometric shapes (such as thin plates, long strips or thin cylinders), individual compo-
nents of the elastic and piezoelectric tensors can be probed. In contrast to traditional
dielectric spectroscopy, where the covered frequency range extends over many orders of
magnitude [124], resonance scans cover only a relatively narrow range (often substantially
less than one decade), but with a much higher frequency resolution.
Piezoelectric resonances have been known since at least 1919 [125], and the first the-
oretical descriptions were given by Cady [126] and von Laue [127]. Soon, this tech-
nique found numerous applications in the study of, e. g., quartz resonators and piezo
ceramics [128]. A systematic collection of equations applicable to simple geometries was
compiled by Berlincourt et al. [129] and later incorporated into the IEEE Standard on
Piezoelectricity [130]. However, its relevance to piezoelectric polymers was not recognized
until 1976 when Ohigashi recorded resonance spectra of PVDF [131] at temperatures
between −170 and 100 C, and was thus able to obtain the temperature dependence of
several piezoelectric coefficients. A similar study was conducted by Schewe [132], while
PVDF copolymers were investigated by Furukawa [133] and Omote et al. [134]. The
relatively few number of publications making use of the resonance technique on piezoelec-
3Some authors use the term quasi-piezoelectricity materials (cf. section 5) to distinguish this propertyfrom that of materials based on molecular dipoles.
14 5 APPLICATIONS
tric polymers may be partly due to the fact that the signal amplitude (i. e., the modulation
of the dielectric frequency spectrum by the resonance) is approximately proportional to
the square of the piezoelectric coefficient. For materials with small coefficients the mea-
surement accuracy may therefore be inferior to that achieved with, e. g., interferometric or
quasistatic techniques. With the advent of electroactive polymer foams with large d33 co-
efficients, however, the lower sensitivity is no longer a limiting factor. On the other hand,
dielectric measurements yield more parameters than interferometric methods. They also
can be performed in situ, without applying a mechanical stress, so that small changes
(< 0.5 %) in the piezoelectric coefficients and elastic moduli can be observed. This has
been used advantageously to characterize very soft porous Teflon® AF films [135], and
to monitor the decay of the piezoelectric activity in cellular polypropylene (PP) under
UV irradiation [57] (cf. p. 36). The latter in particular has led to a new appreciation
of the role of deep trap levels in the microscopic mechanisms of charge storage [54]. In
addition, using modern dielectric spectrometers capable of measuring sample with loss
factors as low as 10−5, d33 coefficients of less than 10 pC/N in odd-numbered polyamides
have been successfully measured via the resonance method [136]. While these values are
not as high as those found in PVDF (let alone the d33 coefficients in cellular materials),
they were shown to be stable up to 200 C and are thus of interest for high-temperature
applications.
The current state of dielectric resonance spectroscopy on piezoelectric polymers has
been summarized in a recent review article [122] (cf. p. 39). Apart from an overview of
recent work in this area, the paper also serves as a tutorial for acquiring and analyzing
resonance data.
5 Applications
As described in section 2, electret condenser microphones are still the most widely used
application of charge-storing polymers, although several recent publications (see, e. g.,
[137,138]) have demonstrated the feasibility of using inorganic SiO2 layers or SiO2/Si3N4
double layers as charge-storing membranes, which are more compatible with silicon-based
semiconductor devices than polymer electret films and can be manufactured in very small
sizes using well-known micro-machining techniques. On the other hand, polymers are
the material of choice for large-scale pyroelectric and piezoelectric transducers. Their
properties most often used are piezoelectricity and pyroelectricity. The former requires
a non-centrosymmetric material, while the presence of oriented dipoles is a prerequisite
for the latter. Traditionally, polymer transducers have been based on ferroelectric poly-
mers, such as PVDF or odd-numbered polyamides (see section 4.2). The good acoustic
impedance match to aqueous environments is widely used in underwater hydrophone
probes [139, 140] and in ultrasound transducers for medical imaging [141]. As thin films
15
biaxial stretchingof polymer film
coating withnon-porous layers
polymer + filler⇒ extrusion
Figure 4: Preparation of cellular polypropylene films. (From [146].)
exhibit a high thickness extension resonance frequency [122], device bandwidths of up
to 24 GHz have been reported [142]. The main drawback of ferroelectric polymers as
compared to ceramic materials are their relatively low piezo- and pyroelectric coefficients.
A major break-through in the quest for polymer films with high piezoelectric coeffi-
cients came when it was realized that a piezoelectricity-like effect can also result from elec-
tric dipoles at a macroscopic, rather than a molecular level. For instance, Kacprzyk de-
scribed a two-layer system of corona-charged PP and elastic polyurethane (PU) films [143],
while Gerhard-Multhaupt et al. investigated stacks of corona-charged porous and
non-porous polytetrafluoroethylene (PTFE) [144] and reported piezoelectric d33 coef-
ficients of up to 35 pC/N. Even higher values of up to 150 pC/N were obtained by
Kunstler et al. with single layers of porous PTFE carrying a bipolar space charge [145].
Perhaps most significant is a new class of cellular space charge electrets [36] based on a
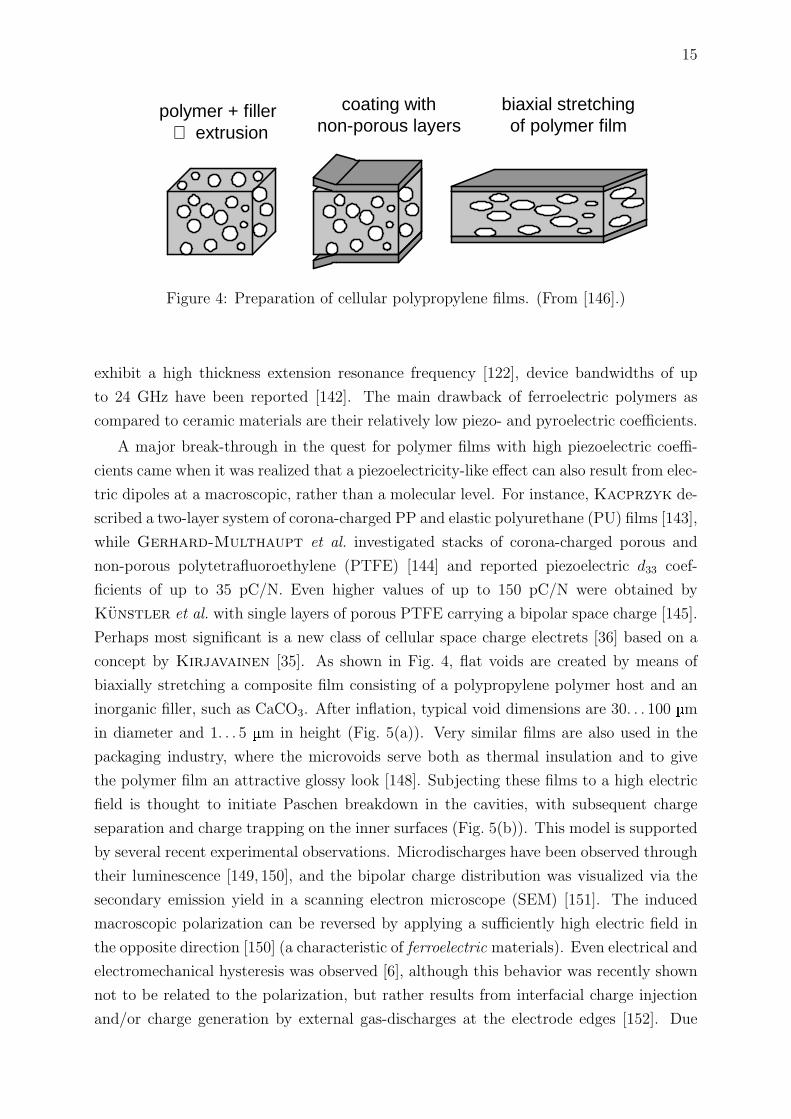
concept by Kirjavainen [35]. As shown in Fig. 4, flat voids are created by means of
biaxially stretching a composite film consisting of a polypropylene polymer host and an
inorganic filler, such as CaCO3. After inflation, typical void dimensions are 30. . . 100 µm
in diameter and 1. . . 5 µm in height (Fig. 5(a)). Very similar films are also used in the
packaging industry, where the microvoids serve both as thermal insulation and to give
the polymer film an attractive glossy look [148]. Subjecting these films to a high electric
field is thought to initiate Paschen breakdown in the cavities, with subsequent charge
separation and charge trapping on the inner surfaces (Fig. 5(b)). This model is supported
by several recent experimental observations. Microdischarges have been observed through
their luminescence [149, 150], and the bipolar charge distribution was visualized via the
secondary emission yield in a scanning electron microscope (SEM) [151]. The induced
macroscopic polarization can be reversed by applying a sufficiently high electric field in
the opposite direction [150] (a characteristic of ferroelectric materials). Even electrical and
electromechanical hysteresis was observed [6], although this behavior was recently shown
not to be related to the polarization, but rather results from interfacial charge injection
and/or charge generation by external gas-discharges at the electrode edges [152]. Due
16 5 APPLICATIONS
(a)
+ + + + + ++ +
- - - - - -- -
+ + + + + ++ +
- - - - - -- -
+ + + + + ++ +
- - - - - -- -
+ + + + + ++ +
- - - - - -- -
+ + + + + + + +
- - - - - -- -
+ + + + + ++ +
- - - - - -- -
+ + + + + + + +
- - - - - -- -
+ + + + + ++ +
- - - - - -- -
+ +
+ +
+ +
+ +
- - -
-- -
- -
+ +
+ +
+ +
+ +
- - -
-- -
- -
- - - - - - - - - - - - - - - - - - - - - - - - -
+ + + + + + + + + + + + + + + + +
- - -
- - -
-
+ +
+ + +
voidpolymer
electrode
electrode
++ ++ +− − −− − 1...5 µm
30...100 µm
(b)
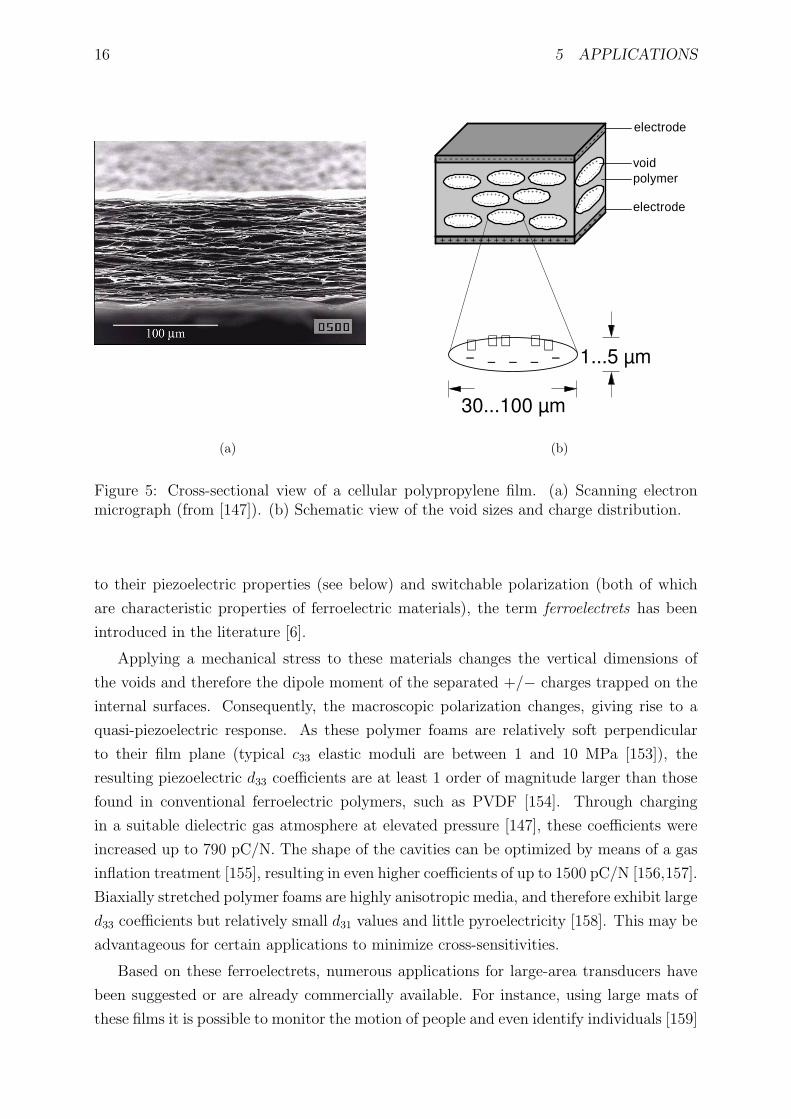
Figure 5: Cross-sectional view of a cellular polypropylene film. (a) Scanning electronmicrograph (from [147]). (b) Schematic view of the void sizes and charge distribution.
to their piezoelectric properties (see below) and switchable polarization (both of which
are characteristic properties of ferroelectric materials), the term ferroelectrets has been
introduced in the literature [6].
Applying a mechanical stress to these materials changes the vertical dimensions of
the voids and therefore the dipole moment of the separated +/− charges trapped on the
internal surfaces. Consequently, the macroscopic polarization changes, giving rise to a
quasi-piezoelectric response. As these polymer foams are relatively soft perpendicular
to their film plane (typical c33 elastic moduli are between 1 and 10 MPa [153]), the
resulting piezoelectric d33 coefficients are at least 1 order of magnitude larger than those
found in conventional ferroelectric polymers, such as PVDF [154]. Through charging
in a suitable dielectric gas atmosphere at elevated pressure [147], these coefficients were
increased up to 790 pC/N. The shape of the cavities can be optimized by means of a gas
inflation treatment [155], resulting in even higher coefficients of up to 1500 pC/N [156,157].
Biaxially stretched polymer foams are highly anisotropic media, and therefore exhibit large
d33 coefficients but relatively small d31 values and little pyroelectricity [158]. This may be
advantageous for certain applications to minimize cross-sensitivities.
Based on these ferroelectrets, numerous applications for large-area transducers have
been suggested or are already commercially available. For instance, using large mats of
these films it is possible to monitor the motion of people and even identify individuals [159]
17
heater platesubstrate
bladepolymersolution
evaporatingsolvent
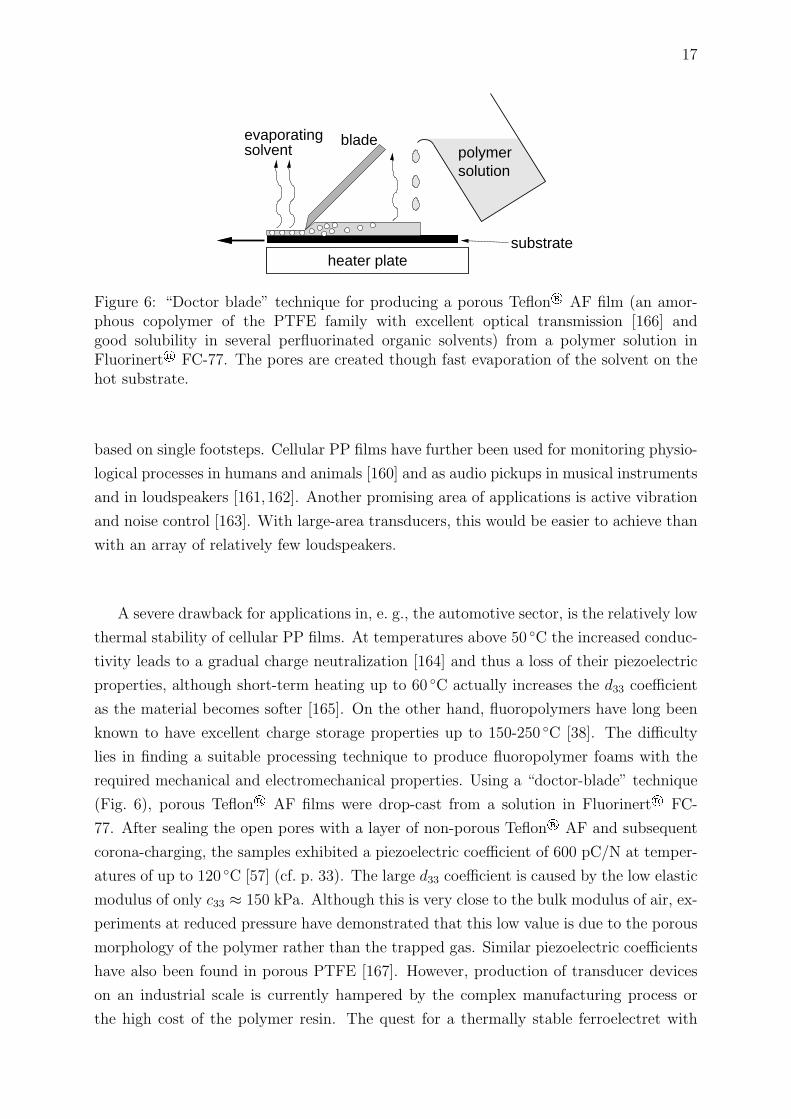
Figure 6: “Doctor blade” technique for producing a porous Teflon® AF film (an amor-phous copolymer of the PTFE family with excellent optical transmission [166] andgood solubility in several perfluorinated organic solvents) from a polymer solution inFluorinert® FC-77. The pores are created though fast evaporation of the solvent on thehot substrate.
based on single footsteps. Cellular PP films have further been used for monitoring physio-
logical processes in humans and animals [160] and as audio pickups in musical instruments
and in loudspeakers [161,162]. Another promising area of applications is active vibration
and noise control [163]. With large-area transducers, this would be easier to achieve than
with an array of relatively few loudspeakers.
A severe drawback for applications in, e. g., the automotive sector, is the relatively low
thermal stability of cellular PP films. At temperatures above 50 C the increased conduc-
tivity leads to a gradual charge neutralization [164] and thus a loss of their piezoelectric
properties, although short-term heating up to 60 C actually increases the d33 coefficient
as the material becomes softer [165]. On the other hand, fluoropolymers have long been
known to have excellent charge storage properties up to 150-250 C [38]. The difficulty
lies in finding a suitable processing technique to produce fluoropolymer foams with the
required mechanical and electromechanical properties. Using a “doctor-blade” technique
(Fig. 6), porous Teflon® AF films were drop-cast from a solution in Fluorinert® FC-
77. After sealing the open pores with a layer of non-porous Teflon® AF and subsequent
corona-charging, the samples exhibited a piezoelectric coefficient of 600 pC/N at temper-
atures of up to 120 C [57] (cf. p. 33). The large d33 coefficient is caused by the low elastic
modulus of only c33 ≈ 150 kPa. Although this is very close to the bulk modulus of air, ex-
periments at reduced pressure have demonstrated that this low value is due to the porous
morphology of the polymer rather than the trapped gas. Similar piezoelectric coefficients
have also been found in porous PTFE [167]. However, production of transducer devices
on an industrial scale is currently hampered by the complex manufacturing process or
the high cost of the polymer resin. The quest for a thermally stable ferroelectret with
18 6 CONCLUSIONS AND OUTLOOK
high piezoelectric activity is a very active field of research, as, e. g., in the DURASMART
cooperation [168].
Apart from terrestrial applications, piezoelectric polymers are also being used in a
variety of space missions. For example, the Dust Flux Monitor Instrument (DFMI),
which is part of the Stardust mission instrument payload [169], uses a PVDF film to
monitor impacting dust particles with a mass of < 10−7 kg. Active vibration damping
with piezoelectric actuators has been considered as an alternative to heavy electromag-
netic systems [170]. Evidently, these systems would benefit from the higher piezoelectric
coefficients of the new ferroelectrets. However, as the material may be exposed to the
extraterrestrial solar radiation field, the stability against ultraviolet (UV) radiation is of
prime concern. Using dielectric resonance spectroscopy as a sensitive probe to monitor
small changes in the electromechanical properties (cf. p. 36 and 59) it was shown [57] that
prolonged irradiation at wavelengths below 210 nm leads to a gradual reduction of the d33
coefficient in cellular PP. For a UV flux similar to that of the standard “air mass zero”
(AM0) solar spectrum [171], a 3.5 h irradiation at 200 nm decreased the piezoelectric
activity by as much as 4 % [54]. Adequate shielding from solar UV radiation is therefore
essential for space-based applications.
6 Conclusions and Outlook
Space-charge electrets have been playing an important part in electromechanical trans-
ducer applications for more than 40 years. Recent developments in cellular space-charge
electrets (the so-called ferroelectrets) will undoubtedly enhance their role and spawn new
applications. On the other hand, much has yet to be learned about the microscopic
mechanisms of charge storage. Recently, evidence has been found for deep-level trapping
of charge carriers in polypropylene, polytetrafluoroethylene, polyethylene terephthalate
and cyclic olefin copolymers. In particular, state-selective bleaching of current peaks in
the photostimulated discharge spectra of PETP and PP indicates a distribution of trap
levels at energies above 4 eV. A picture is now emerging where the long-term lifetime
of surplus charge carriers is governed by their strong binding to the molecular chains,
whereas the lower trap depths measured in thermally stimulated discharge experiments
may result from shallower physical traps, charge compensation by movable ions, or from
the transport of trapped charges along with the moving polymer chains.
Refined space-charge detection techniques allow the in situ monitoring of space charge
distributions, thus permitting a multi-disciplinary approach to study charges as they are
injected, trapped and de-trapped. However, they are limited to measuring the net charge
density, and therefore cannot detect charges that are locally compensated by carriers of
the opposite sign. Despite the recent advances in single-molecule detection, it remains to
be seen whether the study of single charges can be achieved in the near to medium-term
19
future. Once this important goal has been achieved, specially engineered space-charge
electrets with optimized charge storage properties could become reality.
While research into the fundamentals of charge storage is still underway, new piezo-
electric materials based on voided space-charge electrets are already entering the market.
It is very likely that films with a thermal stability up to 100 C will be available within the
next few years, thus opening up a wide range of applications. From active noise control in
cars and airplanes to flat-panel loudspeakers at home, use of cellular electrets may become
as ubiquitous as the electret microphone invented more than 40 years ago.
20 REFERENCES
References
[1] B. Goss Levi, Nobel prize in chemistry salutes the discovery of conducting polymers .Physics Today 53, 19 (2000).
[2] J. van Turnhout, Thermally Stimulated Discharge of Polymer Electrets . Elsevier,Amsterdam (1975).
[3] G. M. Sessler and J. E. West, Self-biased condenser microphone with high capaci-tance. J. Acoust. Soc. Am 34, 1787 (1962).
[4] H. Kawai, The piezoelectricity of poly(vinylidene fluoride). Jpn. J. Appl. Phys. 8,975–977 (1969).
[5] R. Gerhard-Multhaupt (ed.), Electrets , vol. 2. 3rd ed., Laplacian Press, Morgan Hill,CA (1999).
[6] S. Bauer, R. Gerhard-Multhaupt and G. M. Sessler, Ferroelectrets: Soft electroactivefoams for transducers . Physics Today 57, 37–43 (2004).
[7] L. A. Dissado and J. C. Fothergill, Electrical Degradation and Breakdown in Poly-mers . Peter Peregrinus Ltd., London (1992).
[8] T. Mizutani, Space charge measurement techniques and space charge in polyethylene.IEEE Trans. Diel. Electr. Insul. 1, 923–933 (1994).
[9] L. A. Dissado, G. Mazzanti and G. C. Montanari, The role of trapped space chargesin the electrical aging of insulating materials . IEEE Trans. Diel. Electr. Insul. 4,496–506 (1997).
[10] J.-P. Crine, On the interpretation of some electrical aging and relaxation phenomenain solid dielectrics . In: Annual Report, Conference on Electrical Insulation andDielectric Phenomena, pp. 1–16, IEEE Service Center, Piscataway, NJ (2004).
[11] M. Pope and C. E. Swenberg, Electronic processes in organic crystals and polymers .Oxford Univ. Press, New York (1999).
[12] J. C. Fothergill and L. A. Dissado, Fere libenter homines id quod volunt credunt –so what have [we] learnt about space charge? . In: J. C. Fothergill and L. A. Dissado(eds.), Space Charge in Solid Dielectrics , pp. 327–333, Dielectrics Society, Leicester,England (1998).
[13] EMFIT Ltd., Vaajakoski, Finland. http://www.emfit.com/.
[14] S. Gray, A letter from Mr. Stephen to Dr. Mortimer, Secr. R. S., containing a far-ther account of his experiments concerning electricity . Phil. Trans. R. Soc. London,Ser. A 37, 285–291 (1732).
[15] M. Faraday, Experimental Researches in Electricity . Richard and John Edward Tay-lor, London (1839).
[16] O. Heaviside, Electromagnetic induction and its propagation. Electrization and Elec-trification. Natural Electrets . The Electrician pp. 230–231 (7 Aug. 1885).
REFERENCES 21
[17] —, Electromagnetic induction and its propagation. Electrization and Electrification.Natural Electrets . In: O. Heaviside (ed.), Electrical Papers , vol. 1, pp. 488–493,Chelsea, New York (1892).
[18] M. Eguchi, On dielectric polarisation. Proc. Phys. Math. Soc. Jpn., Series 3 1,326–331 (1919).
[19] A. Gemant, Electrets . Philos. Mag. 20, 929 (1935).
[20] B. Gross, Experiments on electrets . Phys. Rev. 66, 26–28 (1944).
[21] —, On permanent charges in solid dielectrics. II. Surface charges and transientcurrents in carnauba wax . J. Chem. Phys. 17, 866–872 (1949).
[22] —, Irradiation effects in plexiglass . J. Polym. Sci. 27, 135–143 (1958).
[23] J. A. Giacometti, S. Fedosov and M. M. Costa, Corona charging of polymers: Recentadvances on constant current charging . Braz. J. Phys. 29, 269–279 (1999).
[24] P. W. Chudleigh, Charging of polymer foils using liquid contacts . Appl. Phys. Lett.21, 547 (1972).
[25] —, Mechanism of charge transfer to a polymer surface by a conducting liquid con-tact . J. Appl. Phys. 47, 4475 (1976).
[26] W. Raith, L. Bergmann, C. Schafer and H. Gobrecht, Lehrbuch der Experimental-physik , vol. 2: Elektromagnetismus. De Gruyter, Berlin (1999).
[27] L. H. Sperling, Introduction to physical polymer science. 3rd ed., Wiley, New York(2001).
[28] G. M. Sessler and R. Gerhard-Multhaupt (eds.), Electrets , vol. 1. 3rd ed., LaplacianPress, Morgan Hill, CA (1999).
[29] Goodfellow Corp. http://www.goodfellow.com.
[30] E. Fukada, Piezoelectricity in polymers and biological materials . Ultrasonics 6, 229(1968).
[31] G. Eberle, H. Schmidt, B. Dehlen and W. Eisenmenger, Piezoelectric polymer elec-trets . In: R. Gerhard-Multhaupt (ed.), Electrets , vol. 2, 3 ed., chap. 11, pp. 81–128,Laplacian Press, Morgan Hill, CA (1999).
[32] P. Gunther and R. Gerhard-Multhaupt, Electret properties of spin-coated Teflon-AF films . In: Annual Report, Conference on Electrical Insulation and DielectricPhenomena, pp. 197–202, IEEE Service Center, Piscataway, NJ (1993).
[33] H. Ding, Charge decay and transportation in Teflon AF films . Proceedings, 8th
International Symposium on Electrets pp. 89–94 (1994).
[34] G. M. Sessler, G. M. Yang and W. Hatke, Electret properties of cycloolefin copoly-mers . In: Annual Report, Conference on Electrical Insulation and Dielectric Phe-nomena, pp. 467–470, IEEE Service Center, Piscataway, NJ (1997).
22 REFERENCES
[35] K. Kirjavainen, Electromechanical film and procedure for manufacturing same. USPatent No. 4,654,546 (1987).
[36] R. Gerhard-Multhaupt, Less can be more: Holes in polymers lead to a new paradigmof piezoelectric materials for electret transducers . IEEE Trans. Diel. Electr. Insul.9, 850–859 (2002).
[37] T. Basche, W. E. Moerner and M. Orrit, Single-Molecule Optical Detection, Imagingand Spectroscopy . Wiley-VCH, Weinheim (1996).
[38] R. Gerhard-Multhaupt, W. Kunstler, G. Eberle, W. Eisenmenger and G. Yang, Highspace-charge densities in the bulk of fluoropolymer electrets detected with piezoelec-trically generated pressure steps . In: J. C. Fothergill and L. A. Dissado (eds.), SpaceCharge in Solid Dielectrics , pp. 123–132, Dielectrics Society, Leicester, England(1998).
[39] H. Wintle, Charge motion in technical insulators: Facts, fancies and simulations .IEEE Trans. Diel. Electr. Insul. 10, 826–841 (2003).
[40] G. Damamme, C. L. Gressus and A. S. DeReggi, Space charge characterization forthe 21th century . IEEE Trans. Diel. Electr. Insul. 4, 558–584 (1997).
[41] J. van Turnhout, Thermally stimulated discharge of electrets . In: Electrets , vol. 1,3 ed., chap. 3, pp. 81–215, Laplacian Press, Morgan Hill, CA (1999).
[42] H. von Seggern, Isothermal and thermally stimulated current studies of positivelycorona charged (Teflon FEP) polyfluoroethylenepropylene. J. Appl. Phys. 52, 4081–4085 (1981).
[43] R. L. Remke and H. von Seggern, Modelling of thermally stimulated currents inpolytetrafluoroethylene. J. Appl. Phys. 54, 5262–5266 (1983).
[44] Z. Xia, R. Gerhard-Multhaupt, W. Kunstler, A. Wedel and R. Danz, High surfacecharge stability of porous polytetrafluoroethylene electret film at room and elevatedtemperatures . J. Phys. D Appl. Phys. 32, L83–L85 (1999).
[45] Z. Xia, A. Wedel and R. Danz, Charge storage and its dynamics in porous polyte-trafluoroethylene (PTFE) film electrets . IEEE Trans. Diel. Electr. Insul. 10, 102–108(2003).
[46] M. Meunier, N. Quirke and A. Aslanides, Molecular modeling of electron traps inpolymer insulators: Chemical defects and impurities . J. Chem. Phys. 115, 2876–2881 (2001).
[47] G. Teyssedre, C. Laurent, A. Aslanides, N. Quirke, L. A. Dissado, G. C. Montanari,A. Campus and L. Martinotto, Deep trapping centers in crosslinked polyethyleneinvestigated by molecular modeling and luminescence techniques . IEEE Trans. Diel.Electr. Insul. 8, 744–752 (2001).
[48] M. Legrand, G. Dreyfus and J. Lewiner, First E.S.R. observation of injected elec-trons trapped in electrets . J. Physique Lett. 38, L439–L440 (1977).
REFERENCES 23
[49] J. A. Ma lecki, Linear decay of charge in electrets . Phys. Rev. B 59, 9954–9960(1999).
[50] J. D. Brodribb, D. O’Colmain and D. M. Hughes, The theory of photon-stimulatedcurrent spectroscopy . J. Phys. D 8, 856–862 (1975).
[51] —, Photon-stimulated current analysis of trap parameters in anthracene. J. Phys.D 9, 256–263 (1976).
[52] T. Oda, T. Utsumi, T. Kumano and M. Itami, Observation of photo-stimulateddetrapping currents of FEP Teflon electrets . In: G. M. Sessler and R. Gerhard-Multhaupt (eds.), Proceedings, 5th International Conference on Electrets , pp. 288–293, IEEE Service Center, Piscataway, NJ (1985).
[53] J. P. Crine and A. Yelon, Photogeneration and transport of carriers in atacticpolystyrene. J. Appl. Phys. 51, 2106–2114 (1980).
[54] A. Mellinger, F. Camacho Gonzalez and R. Gerhard-Multhaupt, Photostimulateddischarge in electret polymers: an alternative approach for investigating deep traps .IEEE Trans. Diel. Electr. Insul. 11, 218–226 (2004).
[55] M. Yun, K. Yoshino, Y. Inuishi and M. Kawatsu, Photoconduction in polytetraflu-oroethylene induced by vacuum-ultraviolet light . Jpn. J. Appl. Phys. 21, 1592–1595(1982).
[56] J. P. LaFemina and G. Arjavalingam, Photophysics of poly(ethylene terephthalate):Ultraviolet absorption and emission. J. Phys. Chem. 95, 984–988 (1991).
[57] A. Mellinger, F. Camacho Gonzalez and R. Gerhard-Multhaupt, Ultraviolet-induceddischarge currents and reduction of the piezoelectric coefficient in cellular polypropy-lene films . Appl. Phys. Lett. 82, 254–256 (2003).
[58] A. Mellinger, R. Singh, F. Camacho Gonzalez, Z. Szamel and I. G lowacki, In situ ob-servation of optically and thermally induced charge depletion in chromophore-dopedcyclic olefin copolymers . In: Annual Report, Conference on Electrical Insulation andDielectric Phenomena, pp. 498–501, IEEE Service Center, Piscataway, NJ (2004).
[59] A. Mellinger, R. Singh and R. Gerhard-Multhaupt, Fast thermal-pulse measure-ments of space charge distributions in electret polymers . Rev. Sci. Instr. 76 (2005,in press).
[60] D. K. Das-Gupta, Molecular processes in polymer electrets . J. Electrostatics 51-52,159–166 (2001).
[61] M. Kryszewski, J. Ulanski, J. K. Jezka and M. Zielinski, Chain and carrier mobil-ity in polymer systems as investigated by thermally stimulated current techniques .Polymer Bull. 8, 187–192 (1982).
[62] S. Bauer and S. Bauer-Gogonea, Current practice in space charge and polarizationprofile measurements using thermal techniques . IEEE Trans. Diel. Electr. Insul. 10,883–902 (2003).
24 REFERENCES
[63] K. R. Bambery and R. J. Fleming, Space charge accumulation in two power cablegrades of XLPE . IEEE Trans. Diel. Electr. Insul. 5, 103–109 (1998).
[64] S. Bauer, Poled polymers for sensors and photonic applications . J. Appl. Phys. 80,5531–5558 (1996).
[65] M. Wegener and R. Gerhard-Multhaupt, Electric poling and electromechanical char-acterization of 0.1-mm-thick sensor films and 0.2-mm-thick cable layers from piezo-electric poly(vinylidene fluoride-trifluoroethylene). IEEE Trans. Ultrason., Ferro-electr., Freq. Contr. 50, 921–931 (2004).
[66] G. M. Sessler, J. E. West, R. Gerhard-Multhaupt and H. von Seggern, Nondestruc-tive laser method for measuring charge profiles in irradiated polymer films . IEEETrans. Nucl. Sci. 29, 1644–1648 (1982).
[67] C. Alquie, G. Charpak and J. Lewiner, Pulsed laser determination of surface electriccharge distributions . J. Physique Lett. 43, L687–L693 (1982).
[68] P. Laurenceau, G. Dreyfus and J. Lewiner, New principle for the determination ofpotential distributions in dielectrics . Phys. Rev. Lett. 38, 46–49 (1977).
[69] C. Alquie and J. Lewiner, A new method for studying piezoelectric materials . RevuePhys. Appl. 20, 395–402 (1985).
[70] W. Eisenmenger and M. Haardt, Observation of charge compensated polarizationzones in polyvinylindenefluoride (PVDF) films by piezoelectric acoustic step-waveresponse. Solid State Communications 41, 917–920 (1982).
[71] T. Takada, T. Maeno and H. Kushibe, An electric stress pulse technique for the mea-surement of charges in a plastic plate irradiated by an electron beam. In: Proceed-ings, 5th International Symposium on Electrets , pp. 450–455, IEEE Service Center,Piscataway, NJ (1985).
[72] D. R. Lide and H. P. R. Frederikse (eds.), CRC Handbook of Chemistry and Physics .75th ed., CRC Press (1995).
[73] T. Takada, Acoustic and optical methods for measuring electric charge distributionsin dielectrics . IEEE Trans. Diel. Electr. Insul. 6, 519–547 (1999).
[74] S. Imai, Y. Tanaka, T. Fukao, T. Takada and T. Maeno, Development of new PEAsystem using open upper electrode. In: Annual Report, Conference on ElectricalInsulation and Dielectric Phenomena, IEEE Service Center, Piscataway, NJ (2004).
[75] G. F. Leal Ferreira and R. Gerhard-Multhaupt, Derivation of response equationsfor the nondestructive probing of charge and polarization profiles . Phys. Rev. B 42,7317–7321 (1990).
[76] Y. Imaizumi, K. Suzuki, Y. Tanakoa and T. Takada, Three-dimensional space chargedistribution measurement in solid dielectrics using pulsed electroacoustic method . In:Proceedings, International Symposium on Electrical Insulating Materials, Tokyo, pp.315–318, IEEE Service Center, Piscataway, NJ (1995).
REFERENCES 25
[77] Y. Imaizumi, K. Suzuki, Y. Tanaka and T. Takada, Three-dimensional space chargedistribution measurement in electron beam irradiated PMMA. Trans. IEEJ 116-A,684–689 (1996).
[78] X. Qin, K. Suzuki, M. Sazaki, Y. Tanaka and T. Takada, Electric charge 3-dimensional profile measurement in dielectrics using acoustic microscope probe head .In: Proceedings, IEEE International Conference on Conduction and Breakdown inSolid Dielectrics , pp. 13–16, IEEE Service Center, Piscataway, NJ (1998).
[79] X. Qin, K. Suzuki, Y. Tanaka and T. Takada, Three-dimensional space-charge mea-surement in a dielectric using the acoustic lens and PWP method . J. Phys. D: Appl.Phys. 32, 157–160 (1999).
[80] T. Maeno, Three-dimensional PEA charge measurement system. IEEE Trans. Diel.Electr. Insul. 8, 845–848 (2001).
[81] S. Hole and J. Lewiner, High-resolution multidimensional space charge measurementusing elastic wave methods . Phys. Rev. B 64, 104106 (2001).
[82] D. Malec and T. Lebey, Laser-induced pressure pulse as a tool to determine surfacecharges in inhomogeneous (solid/gas) dielectric. Appl. Phys. Lett. 80, 1421–1423(2002).
[83] D. Malec, Study of static electricity using the laser-induced pressure pulse method .Meas. Sci. Technol. 15, N1–N5 (2004).
[84] R. J. Phelan Jr., R. L. Peterson, C. A. Hamilton and G. W. Day, The polarizationof PVF and PVF2 pyroelectrics . Ferroelectrics 7, 375–377 (1974).
[85] R. L. Peterson, G. W. Day, P. M. Gruzensky and R. J. Phelan Jr., Analysis ofresponse of pyroelectrical optical detectors . J. Appl. Phys. 45, 3296–3303 (1974).
[86] R. E. Collins, Distribution of charge in electrets . Appl. Phys. Lett. 26, 675–677(1975).
[87] —, Analysis of spatial distribution of charges and dipoles in electrets by a transientheating technique. J. Appl. Phys. 47, 4804–4808 (1976).
[88] H. von Seggern, Thermal-pulse technique for determining charge distributions: Ef-fect of measurement accuracy . Appl. Phys. Lett. 33, 134–137 (1978).
[89] E. W. Weisstein, Fredholm integral equation of the first kind . FromMathWorld – A Wolfram Web Resource, http://mathworld.wolfram.com/
FredholmIntegralEquationoftheFirstKind.html.
[90] F. I. Mopsik and A. S. DeReggi, Numerical evaluation of the dielectric polarizationdistribution from thermal-pulse data. J. Appl. Phys. 53, 4333–4339 (1982).
[91] S. Bauer, Method for the analysis of thermal-pulse data. Phys. Rev. B 47, 11049–11055 (1993).
[92] B. Ploss, Probing of pyroelectric distributions from thermal wave and thermal pulsemeasurements . Ferroelectrics 156, 345–350 (1994).
26 REFERENCES
[93] P. Bloß, A. S. DeReggi and H. Schafer, Electric-field profile and thermal propertiesin substrate-supported dielectric films . Phys. Rev. B. 62, 8517–8530 (2000).
[94] S. B. Lang and D. K. Das-Gupta, A technique for determining the polarizationdistribution in thin polymer electrets using periodic heating . Ferroelectrics 39, 1249–1252 (1981).
[95] T. Sandner, G. Suchaneck, R. Koehler, A. Suchaneck and G. Gerlach, High fre-quency LIMM – a powerful tool for ferroelectric thin film characterization. Integr.Ferroelectr. 46, 243–257 (2002).
[96] S. B. Lang and D. K. Das-Gupta, Laser-intensity-modulation method: A techniquefor determination of spatial distributions of polarization and space charge in polymerelectrets . J. Appl. Phys. 59, 2151–2160 (1986).
[97] A. N. Tikhonov, A. V. Goncharskii, V. V. Stepanov and I. V. Kochikov, Ill-posedimage processing problems . Sov. Phys.-Doklady 32, 456–458 (1987).
[98] J. Weese, A reliable and fast method for the solution of Fredholm integral equationsof the first kind based on Tikhonov regularization. Computer Phys. Commun. 69,99–111 (1992).
[99] S. B. Lang, Polynomial solution of the Fredholm integral equation in the laser in-tensity modulation method (LIMM). Integr. Ferroelectr. 38, 111–118 (2001).
[100] —, Use of neural networks to solve the integral equation of the laser intensity mod-ulation method (LIMM). Ferroelectrics 238, 281–289 (2000).
[101] E. Tuncer and S. B. Lang, Numerical extraction of distributions of space-charge andpolarization from laser intensity modulation method (2004), http://arxiv.org/
abs/cond-mat/0409316.
[102] B. Ploss, R. Emmerich and S. Bauer, Thermal wave probing of pyroelectric distribu-tions in the surface region of ferroelectric materials: A new method for the analysis .J. Appl. Phys. 72, 5363–5370 (1992).
[103] A. Mellinger, Unbiased iterative reconstruction of polarization and space-charge pro-files from thermal-wave experiments . Meas. Sci. Technol. 15, 1347–1353 (2004).
[104] A. Mellinger, R. Singh, M. Wegener, W. Wirges, R. Gerhard-Multhaupt and S. B.Lang, Three-dimensional mapping of polarization profiles with thermal pulses . Appl.Phys. Lett. (2004, submitted).
[105] D. Marty-Dessus, L. Berquez, A. Petre and J. L. Franceschi, Space charge car-tography by FLIMM: a three-dimensional approach. J. Phys. D: Appl. Phys. 35,3249–3256 (2002).
[106] A. Quintel, J. Hulliger and M. Wubbenhorst, Analysis of the polarization distri-bution in a polar perhydrotriphenylene inclusion compound by scanning pyroelectricmicroscopy . J. Phys. Chem. B 102, 4277–4283 (1998).
[107] A. Mellinger, R. Singh, M. Wegener, W. Wirges, R. Gerhard-Multhaupt and S. B.Lang. J. Appl. Phys. (in preparation).
REFERENCES 27
[108] S. B. Lang, Laser intensity modulation method (LIMM): Review of the fundamentalsand a new method for data analysis . IEEE Trans. Diel. Electr. Insul. 11, 3–12 (2004).
[109] B. Ploss, The resolution of thermal profiling techniques . In: Proceedings, 11th Inter-national Symposium on Electrets , pp. 177–180, IEEE Service Center, Piscataway,NJ (2002).
[110] D. K. Das-Gupta, J. S. Hornsby, G. M. Yang and G. M. Sessler, Comparison ofcharge distributions in FEP measured with thermal wave and pressure pulse tech-niques . J. Phys. D: Appl. Phys. 29, 3113–3116 (1996).
[111] P. Bloß, M. Steffen, H. Schafer, G.-M. Yang and G. M. Sessler, Determination of thepolarization distribution in electron-beam-poled PVDF using heat wave and pressurepulse techniques . IEEE Trans. Diel. Electr. Insul. 3, 182–190 (1996).
[112] J. van Turnhout, R. E. Staal, M. Wubbenhorst and P. H. de Haan, Distribution andstability of charges in porous polypropylene films . In: Proceedings, 10th InternationalSymposium on Electrets , pp. 785–788, IEEE Service Center, Piscataway, NJ (1999).
[113] S. Bauer and A. S. DeReggi, Pulsed electrothermal technique for measuring thethermal diffusivity of dielectric films on conducting substrates . J. Appl. Phys. 80,6124–6128 (1996).
[114] S. Bauer and B. Ploss, A method for the measurement of the thermal, dielectric, andpyroelectric properties of thin pyroelectric films and their applications for integratedheat sensors . J. Appl. Phys. 68, 6361–6367 (1990).
[115] E. Fukada, History and recent progress in piezoelectric polymers . IEEE Trans. Ul-trason., Ferroelectr., Freq. Contr. 47, 1277–1290 (2000).
[116] H. Nalwa (ed.), Ferroelectric Polymers . Marcel Dekker Inc., New York (1995).
[117] B. Newman, J. Scheinbeim, J. Lee and Y. Takase, A new class of ferroelectricpolymers, the odd-numbered nylons . Ferroelectrics 127, 229–234 (1992).
[118] S. Miyata, M. Yoshikawa, S. Tasaka and M. Ko, Piezoelectricity revealed in thecopolymer of vinylidene cyanide and vinyl acetate. Polym. J. 12, 857–860 (1980).
[119] S. Tasaka, T. Shouko and N. Inagaki, Ferroelectric polarization reversal in polyureaswith odd number of CH2 groups . Jpn. J. Appl. Phys. 31, L1086–L1088 (1992).
[120] S. Tasaka, T. Shouko, K. Asami and N. Inagaki, Ferroelectric behavior in aliphaticpolyurethanes . Jpn. J. Appl. Phys. 33, 1376–1379 (1994).
[121] S. Tasaka, K. Ohishi and N. Inagaki, Ferroelectric behavior in aliphatic poly-thioureas . Ferroelectrics pp. 203–210 (1995).
[122] A. Mellinger, Dielectric resonance spectroscopy: a versatile tool in the quest forbetter piezoelectric polymers . IEEE Trans. Diel. Electr. Insul. 10, 842–861 (2003).
[123] A. K. Jonscher, Dielectric Relaxation in Solids . Chelsea Dielectrics Press, London(1983).
28 REFERENCES
[124] F. Kremer and A. Schonhals (eds.), Broadband Dielectric Spectroscopy . Springer,Heidelberg (2003).
[125] A. M. Nicolson, The piezo electric effect in the composite rochelle salt crystal . AIEETransactions 38, 1467–1485 (1919).
[126] W. G. Cady, Theory of longitudinal vibrations of viscous rods . Phys. Rev. Lett. 19,1–6 (1922).
[127] M. v. Laue, Piezoelektrisch erzwungene Schwingungen von Quarzstaben. Z. furPhysik 34, 347–361 (1925).
[128] W. G. Cady, Piezoelectricity . Dover Publications (1962).
[129] D. A. Berlincourt, D. R. Currand and H. Jaffe, Piezoelectric and piezomagneticmaterials . In: W. P. Mason (ed.), Physical Acoustics , vol. I, Pt. A, Academic, NewYork (1967).
[130] IEEE standard on piezoelectricity . ANSI/IEEE Std. 176-1987 (1987).
[131] H. Ohigashi, Electromechanical properties of polarized polyvinylidene fluoride filmsas studied by the piezoelectric resonance method . J. Appl. Phys. 47, 949–955 (1976).
[132] H. Schewe, Piezoelectricity of uniaxially oriented polyvinylidene fluoride. In: IEEEInternational Ultrasonics Symposium, pp. 519–524, IEEE Service Center, Piscat-away, NJ (1982).
[133] T. Furukawa, Structure and functional properties of ferroelectric polymers . Adv.Coll. Interf. Sci. 71-72, 183–208 (1997).
[134] K. Omote, H. Ohigashi and K. Koga, Temperature dependence of elastic, dielec-tric, and piezoelectric properties of “single crystalline” films of vinylidene fluoridetrifluoroethylene copolymer . J. Appl. Phys. 81, 2760–2768 (1997).
[135] A. Mellinger, M. Wegener, W. Wirges and R. Gerhard-Multhaupt, Thermally sta-ble dynamic piezoelectricity in sandwich films of porous and nonporous amorphousfluoropolymer . Appl. Phys. Lett. 79, 1852–1854 (2001).
[136] P. Frubing, A. Kremmer, W. Neumann, R. Gerhard-Multhaupt and I. L. Guy,Dielectric relaxation of polyamide 11 in relation to piezo- and pyroelectricity . IEEETrans. Diel. Electr. Insul. 11, 271–279 (2004).
[137] H. Amjadi and G. M. Sessler, Inorganic electret layers for miniaturized devices . In:Annual Report, Conference on Electrical Insulation and Dielectric Phenomena, pp.668–671, IEEE Service Center, Piscataway, NJ (1995).
[138] H. Amjadi, Electret membranes and backelectrodes for application in micromechan-ical transducers . J. Electrostatics 48, 179–191 (2000).
[139] P. A. Howie and H. R. Gallantree, Transducer applications of PVDF . In: Pro-ceedings, IEEE International Ultrasonics Symposium, pp. 566–569, IEEE ServiceCenter, Piscataway, NJ (1983).
REFERENCES 29
[140] R. H. Tancrell, D. T. Wilson and D. Rickets, Properties of PVDF for sonar . In:IEEE International Ultrasonics Symposium, pp. 624–629, IEEE Service Center,Piscataway, NJ (1985).
[141] F. S. Foster, K. A. Harasiewicz and M. D. Sherar, A history of medical and biologicalimaging with polyvinylidene fluoride (PVDF) transducers . IEEE Trans. Ultrason.,Ferroelectr., Freq. Contr. 47, 1363–1371 (2000).
[142] A. Ambrosy and K. Holdik, Piezoelectric PVDF films as ultrasonic transducers . J.Phys. E - Sci. Instr. 17, 856–859 (1984).
[143] R. Kacprzyk, Piezoelectric properties of nonuniform electrets . J. Electrostatics 35,161–166 (1995).
[144] R. Gerhard-Multhaupt, Z. Xia, W. Kunstler and A. Pucher, Preliminary study ofmulti-layer space-charge electrets with piezoelectric properties from porous and non-porous Teflon films . In: Proceedings, 10th International Symposium on Electrets ,IEEE Service Center, Piscataway, NJ (1999).
[145] W. Kunstler, Z. Xia, T. Weinhold, A. Pucher and R. Gerhard-Multhaupt, Piezoelec-tricity of porous polytetrafluoroethylene single- and multiple-film electrets containinghigh charge densities of both polarities . App. Phys. A 70, 5–8 (2000).
[146] M. Wegener and W. Wirges, Optimized electromechanical properties and applicationsof cellular polypropylene, a new voided space-charge electret material . In: H.-J. Fechtand M. Werner (eds.), The Nano Micro Interface: Bringing the Nano and MicroWorlds Together , pp. 303–317, Wiley-VCH (2004).
[147] M. Paajanen, M. Wegener and R. Gerhard-Multhaupt, Charging of cellular space-charge electret films in various gas atmospheres . In: Annual Report, Conference onElectrical Insulation and Dielectric Phenomena, pp. 24–27, IEEE Service Center,Piscataway, NJ (2001).
[148] Treofan, Raunheim, Germany. http://www.treofan.com.
[149] M. Wegener, M. Paajanen, W. Wirges and R. Gerhard-Multhaupt, Corona-inducedpartial discharges, internal charge separation and electromechanical transducer prop-erties in cellular polymer films . In: Proceedings, 11th International Symposium onElectrets , pp. 54–57, IEEE Service Center, Piscataway, NJ (2002).
[150] M. Lindner, S. Bauer-Gogonea, S. Bauer, M. Paajanen and J. Raukola, Dielec-tric barrier microdischarges: Mechanism for the charging of cellular piezoelectricpolymers . J. Appl. Phys. 91, 5283–5287 (2002).
[151] J. Hillenbrand and G. M. Sessler, Piezoelectric properties of polypropylene/air andpoly(vinylidene fluoride)/air composites . In: Annual Report, Conference on Elec-trical Insulation and Dielectric Phenomena, pp. 161–165, IEEE Service Center,Piscataway, NJ (2000).
[152] S. Bauer, S. Bauer-Gogonea, M. Dansachmuller, I. Graz, G. Leonhartsberger andR. Schwodiauer, Do ferroelectrets always behave like ferroelectrics? . In: Annual Re-port, Conference on Electrical Insulation and Dielectric Phenomena, IEEE ServiceCenter, Piscataway, NJ (2004).
30 REFERENCES
[153] M. Wegener, W. Wirges, R. Gerhard-Multhaupt, M. Dansachmuller, R. Schwodi-auer, S. Bauer-Gogonea, S. Bauer, M. Paajanen, H. Minkkinen and J. Raukola,Controlled inflation of voids in cellular polymer ferroelectrets: Optimizing electrome-chanical transducer properties . Appl. Phys. Lett. 84, 392–394 (2004).
[154] R. Kressmann, Linear and nonlinear piezoelectric response of charged cellularpolypropylene. J. Appl. Phys. 90, 3489–3496 (2001).
[155] M. Wegener, W. Wirges, J. Fohlmeister, B. Tiersch and R. Gerhard-Multhaupt,Two-step inflation of cellular polypropylene films: void-thickness increase and en-hanced electromechanical properties . J. Phys. D: Appl. Phys. 37, 623–627 (2004).
[156] X. Zhang, J. Hillenbrand and G. M. Sessler, Piezoelectric d33 coefficient of cellularpolypropylene subjected to expansion by pressure treatment . Appl. Phys. Lett. 85,1226–1228 (2004).
[157] —, Improvement of piezoelectric activity of cellular polymers using a double-expansion process . J. Phys. D: Appl. Phys. 37, 2146–2150 (2004).
[158] G. S. Neugschwandtner, R. Schwodiauer, S. Bauer-Gogonea, S. Bauer, M. Paajanenand J. Lekkala, Piezo- and pyroelectricity of a smart polymer-foam space-chargeelectret . J. Appl. Phys. 89, 4503–4511 (2001).
[159] J. Suutala and J. Roning, Towards the adaptive identification of walkers: Automatedfeature selection of footsteps using distinction-sensitive lvq . In: Int’l. Workshop onProcessing Sensory Information for Proactive Systems (PSIPS 2004), Oulu, Finland(June 14-15, 2004).
[160] J. Lekkala, R. Poramo, K. Nyholm and T. Kaikkonen, EMF-force sensor – a flex-ible and sensitive electret film for physiological applications . Medical & BiologicalEngineering & Computing 34, Supplement 1, Part 1 (1996).
[161] J. Backman, Audio applications of electrothermomechanical film (ETMF). J. AudioEng. Soc. 38, 364–371 (1990).
[162] J. Backman and M. Karjalainen, Audio and ultrasonic transducers based on elec-trothermomechanical film ETMF). In: Proceedings, IEEE International Conferenceon Acoustics, Speech, and Signal Processing , vol. 2, pp. 1173–1176, IEEE ServiceCenter, Piscataway, NJ (1990).
[163] H. Nykanen, M. Antila, J. Kataja, J. Lekkala and S. Uosukainen, Active controlof sound based on utilizing EMFi-technology . In: Proceedings, ACTIVE 99 , pp.1159–1170, Ft. Lauderdale (Dec. 4-6, 1999).
[164] J. Lekkala and M. Paajanen, EMFi – new electret material for sensors and actua-tors . In: A. A. Konsta, A. Vassilikou-Dova and K. Vartzeli-Nikaki (eds.), Proceed-ings, 10th International Symposium on Electrets , pp. 743–746, IEEE Service Center,Piscataway, NJ (1999).
[165] A. Mellinger and F. Camacho Gonzalez, Verhalten von quasi-piezoelektrischen Sen-sorfolien aus geschaumtem Polypropylen unter Warme- und Lichteinwirkung . In:Sensoren und Messsysteme 2004. 12. GMA/ITG-Fachtagung , Ludwigsburg (2004).
REFERENCES 31
[166] J. H. Lowry, J. S. Mendlowitz and N. S. Subramanian, Optical characteristics ofTeflon AF fluoroplastic materials . Optical Engineering 31, 1982–1985 (1992).
[167] R. Gerhard-Multhaupt, W. Kunstler, T. Gorne, A. Pucher, T. Weinhold, M. Seiß,Z. Xia, A. Wedel and R. Danz, Porous PTFE space-charge electrets for piezoelectricapplications . IEEE Trans. Diel. Electr. Insul. 7, 480–488 (2000).
[168] DURASMART: Durable cellular polymer films with giant electromechanical responsefor smart transducer applications . http://www.vtt.fi/virtual/durasmart/.
[169] A. J. Tuzzolino, T. E. Economou, R. B. McKibben, J. A. Simpson, J. A. M. Mc-Donnell, M. J. Burchell, B. A. M. Vaughan, P. Tsou, M. S. Hanner, B. C. Clarkand D. E. Brownlee, Dust flux monitor instrument for the Stardust mission to cometWild 2 . J. Geophys. Res. - Planets 108 (E10), 8115 (2003).
[170] G. Bohannan, H. Schmidt, D. Brandt and M. Mooibroek, Piezoelectric polymeractuators for active vibration isolation in space applications . Ferroelectrics 224,639–645 (1999).
[171] C. Wehrli, Extraterrestrial solar spectrum. Publication 615, Physikalisch-Meteorologisches Observatorium and World Radiation Center, Davos Dorf, Switzer-land (1985).
32 A JOURNAL AND REVIEW ARTICLES
Appendix
A Journal and Review Articles
The following articles represent relevant contributions to the field of charge-storing electret
polymers:
1. A. Mellinger, M. Wegener, W. Wirges and R. Gerhard-Multhaupt, “Thermally sta-
ble dynamic piezoelectricity in sandwich films of porous and nonporous amorphous
fluoropolymer”, Appl. Phys. Lett. 79, 1852-1854 (2001).
2. A. Mellinger, F. Camacho Gonzalez and R. Gerhard-Multhaupt, “Ultraviolet-in-
duced discharge currents and reduction of piezoelectric coefficient in cellular poly-
propylene films”, Appl. Phys. Lett. 82, 254-256 (2003).
3. A. Mellinger, “Dielectric resonance spectroscopy: a versatile tool in the quest for
better piezoelectric polymers”, IEEE Trans. Diel. Electr. Insul. 10, 842-861 (2003).
This review article won the 2004 award of the Informationstechnische
Gesellschaft in the German Association of Electrical Engineers (VDE).
4. A. Mellinger, F. Camacho Gonzalez, and R. Gerhard-Multhaupt, “Photostimulated
discharge in electret polymers: an alternative approach for investigating deep traps,”
IEEE Trans. Diel. Electr. Insul., 11, 218- 226 (2004).
5. A. Mellinger, “Unbiased iterative reconstruction of polarization and space-charge
profiles from thermal-wave experiments”, Meas. Sci. Technology 15, 1347-1353
(2004).
6. A. Mellinger, R. Singh and R. Gerhard-Multhaupt, “Fast thermal-pulse measure-
ments of space charge distributions in electret polymers”, Rev. Sci. Instr. 76, in
press (2005).
7. A. Mellinger, R. Singh, M. Wegener, W. Wirges, R. Gerhard-Multhaupt and S. B.
Lang, “Three-dimensional mapping of polarization profiles with thermal pulses”,
Appl. Phys. Lett., submitted (2004).
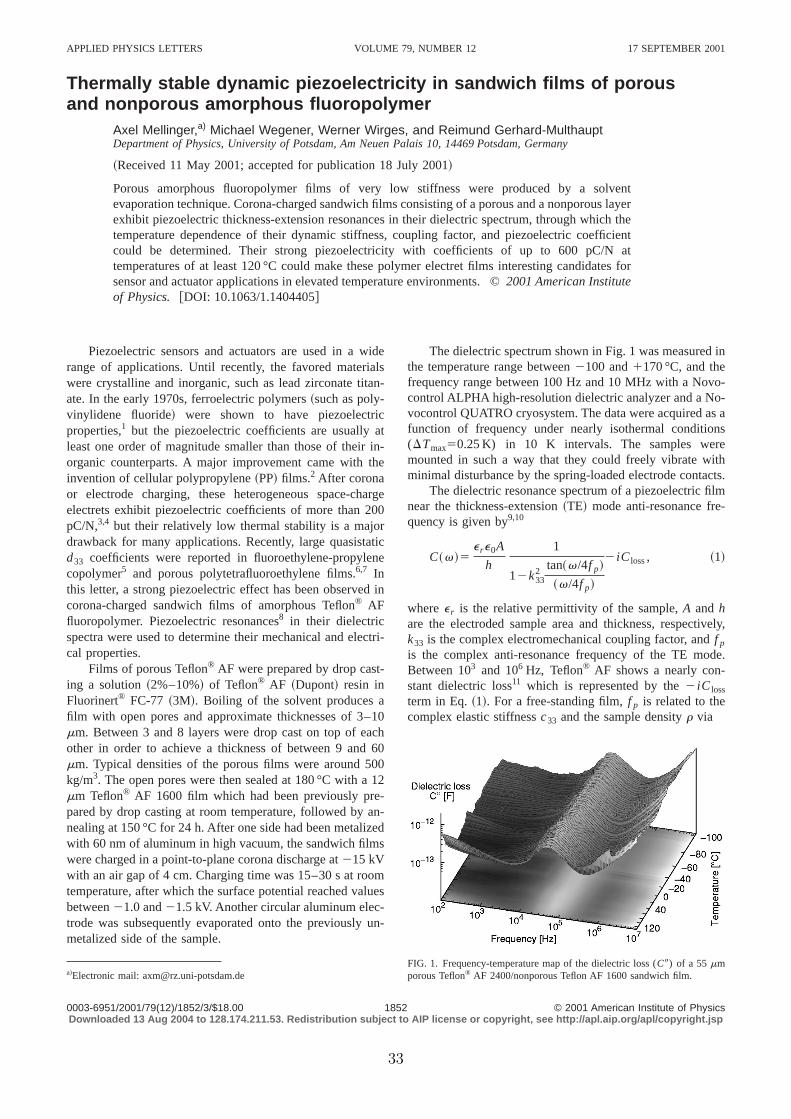
Thermally stable dynamic piezoelectricity in sandwich films of porousand nonporous amorphous fluoropolymer
Axel Mellinger,a) Michael Wegener, Werner Wirges, and Reimund Gerhard-MulthauptDepartment of Physics, University of Potsdam, Am Neuen Palais 10, 14469 Potsdam, Germany
~Received 11 May 2001; accepted for publication 18 July 2001!
Porous amorphous fluoropolymer films of very low stiffness were produced by a solventevaporation technique. Corona-charged sandwich films consisting of a porous and a nonporous layerexhibit piezoelectric thickness-extension resonances in their dielectric spectrum, through which thetemperature dependence of their dynamic stiffness, coupling factor, and piezoelectric coefficientcould be determined. Their strong piezoelectricity with coefficients of up to 600 pC/N attemperatures of at least 120 °C could make these polymer electret films interesting candidates forsensor and actuator applications in elevated temperature environments. ©2001 American Instituteof Physics. @DOI: 10.1063/1.1404405#
Piezoelectric sensors and actuators are used in a widerange of applications. Until recently, the favored materialswere crystalline and inorganic, such as lead zirconate titan-ate. In the early 1970s, ferroelectric polymers~such as poly-vinylidene fluoride! were shown to have piezoelectricproperties,1 but the piezoelectric coefficients are usually atleast one order of magnitude smaller than those of their in-organic counterparts. A major improvement came with theinvention of cellular polypropylene~PP! films.2 After coronaor electrode charging, these heterogeneous space-chargeelectrets exhibit piezoelectric coefficients of more than 200pC/N,3,4 but their relatively low thermal stability is a majordrawback for many applications. Recently, large quasistaticd33 coefficients were reported in fluoroethylene-propylenecopolymer5 and porous polytetrafluoroethylene films.6,7 Inthis letter, a strong piezoelectric effect has been observed incorona-charged sandwich films of amorphous Teflon® AFfluoropolymer. Piezoelectric resonances8 in their dielectricspectra were used to determine their mechanical and electri-cal properties.
Films of porous Teflon® AF were prepared by drop cast-ing a solution~2%–10%! of Teflon® AF ~Dupont! resin inFluorinert® FC-77 ~3M!. Boiling of the solvent produces afilm with open pores and approximate thicknesses of 3–10mm. Between 3 and 8 layers were drop cast on top of eachother in order to achieve a thickness of between 9 and 60mm. Typical densities of the porous films were around 500kg/m3. The open pores were then sealed at 180 °C with a 12mm Teflon® AF 1600 film which had been previously pre-pared by drop casting at room temperature, followed by an-nealing at 150 °C for 24 h. After one side had been metalizedwith 60 nm of aluminum in high vacuum, the sandwich filmswere charged in a point-to-plane corona discharge at215 kVwith an air gap of 4 cm. Charging time was 15–30 s at roomtemperature, after which the surface potential reached valuesbetween21.0 and21.5 kV. Another circular aluminum elec-trode was subsequently evaporated onto the previously un-metalized side of the sample.
The dielectric spectrum shown in Fig. 1 was measured inthe temperature range between2100 and1170 °C, and thefrequency range between 100 Hz and 10 MHz with a Novo-control ALPHA high-resolution dielectric analyzer and a No-vocontrol QUATRO cryosystem. The data were acquired as afunction of frequency under nearly isothermal conditions(DTmax50.25 K) in 10 K intervals. The samples weremounted in such a way that they could freely vibrate withminimal disturbance by the spring-loaded electrode contacts.
The dielectric resonance spectrum of a piezoelectric filmnear the thickness-extension~TE! mode anti-resonance fre-quency is given by9,10
C~v!5e re0A
h
1
12k332 tan~v/4f p!
~v/4f p!
2 iC loss, ~1!
wheree r is the relative permittivity of the sample,A and hare the electroded sample area and thickness, respectively,k33 is the complex electromechanical coupling factor, andf p
is the complex anti-resonance frequency of the TE mode.Between 103 and 106 Hz, Teflon® AF shows a nearly con-stant dielectric loss11 which is represented by the2 iC loss
term in Eq.~1!. For a free-standing film,f p is related to thecomplex elastic stiffnessc33 and the sample densityr via
a!Electronic mail: [email protected]. 1. Frequency-temperature map of the dielectric loss (C9) of a 55mmporous Teflon® AF 2400/nonporous Teflon AF 1600 sandwich film.
APPLIED PHYSICS LETTERS VOLUME 79, NUMBER 12 17 SEPTEMBER 2001
18520003-6951/2001/79(12)/1852/3/$18.00 © 2001 American Institute of PhysicsDownloaded 13 Aug 2004 to 128.174.211.53. Redistribution subject to AIP license or copyright, see http://apl.aip.org/apl/copyright.jsp
33
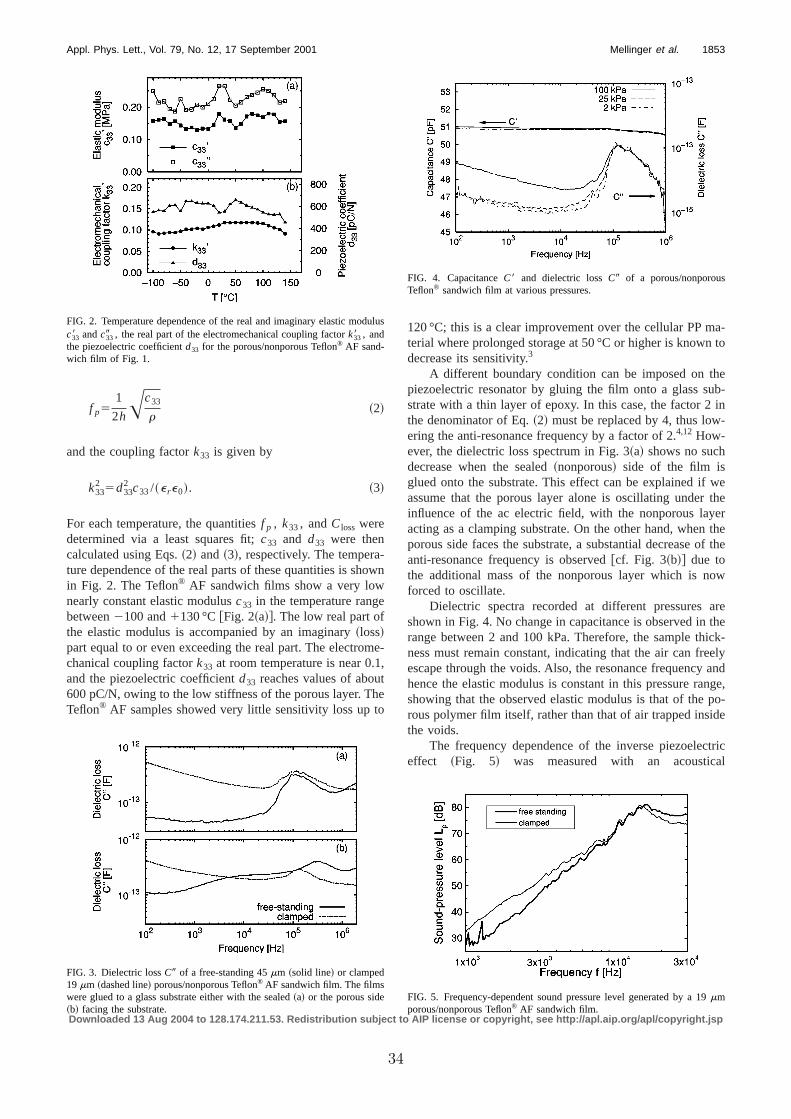
f p51
2hAc33
r~2!
and the coupling factork33 is given by
k332 5d33
2 c33/~e re0!. ~3!
For each temperature, the quantitiesf p , k33, andCloss weredetermined via a least squares fit;c33 and d33 were thencalculated using Eqs.~2! and~3!, respectively. The tempera-ture dependence of the real parts of these quantities is shownin Fig. 2. The Teflon® AF sandwich films show a very lownearly constant elastic modulusc33 in the temperature rangebetween2100 and1130 °C@Fig. 2~a!#. The low real part ofthe elastic modulus is accompanied by an imaginary~loss!part equal to or even exceeding the real part. The electrome-chanical coupling factork33 at room temperature is near 0.1,and the piezoelectric coefficientd33 reaches values of about600 pC/N, owing to the low stiffness of the porous layer. TheTeflon® AF samples showed very little sensitivity loss up to
120 °C; this is a clear improvement over the cellular PP ma-terial where prolonged storage at 50 °C or higher is known todecrease its sensitivity.3
A different boundary condition can be imposed on thepiezoelectric resonator by gluing the film onto a glass sub-strate with a thin layer of epoxy. In this case, the factor 2 inthe denominator of Eq.~2! must be replaced by 4, thus low-ering the anti-resonance frequency by a factor of 2.4,12 How-ever, the dielectric loss spectrum in Fig. 3~a! shows no suchdecrease when the sealed~nonporous! side of the film isglued onto the substrate. This effect can be explained if weassume that the porous layer alone is oscillating under theinfluence of the ac electric field, with the nonporous layeracting as a clamping substrate. On the other hand, when theporous side faces the substrate, a substantial decrease of theanti-resonance frequency is observed@cf. Fig. 3~b!# due tothe additional mass of the nonporous layer which is nowforced to oscillate.
Dielectric spectra recorded at different pressures areshown in Fig. 4. No change in capacitance is observed in therange between 2 and 100 kPa. Therefore, the sample thick-ness must remain constant, indicating that the air can freelyescape through the voids. Also, the resonance frequency andhence the elastic modulus is constant in this pressure range,showing that the observed elastic modulus is that of the po-rous polymer film itself, rather than that of air trapped insidethe voids.
The frequency dependence of the inverse piezoelectriceffect ~Fig. 5! was measured with an acoustical
FIG. 2. Temperature dependence of the real and imaginary elastic modulusc338 andc339 , the real part of the electromechanical coupling factork338 , andthe piezoelectric coefficientd33 for the porous/nonporous Teflon® AF sand-wich film of Fig. 1.
FIG. 3. Dielectric lossC9 of a free-standing 45mm ~solid line! or clamped19 mm ~dashed line! porous/nonporous Teflon® AF sandwich film. The filmswere glued to a glass substrate either with the sealed~a! or the porous side~b! facing the substrate.
FIG. 4. CapacitanceC8 and dielectric lossC9 of a porous/nonporousTeflon® sandwich film at various pressures.
FIG. 5. Frequency-dependent sound pressure level generated by a 19mmporous/nonporous Teflon® AF sandwich film.
1853Appl. Phys. Lett., Vol. 79, No. 12, 17 September 2001 Mellinger et al.
Downloaded 13 Aug 2004 to 128.174.211.53. Redistribution subject to AIP license or copyright, see http://apl.aip.org/apl/copyright.jsp
34
technique.6,13,14 The sound pressure levelLp was recordedwith a 1/2 in. electret microphone~Bruel & Kjær! in the nearfield ~distance,1 mm! of the sample in a noise-reducingbox. A sine generator in the measuring system~AudioTeknology LMS! and an amplifier~Metra LV 102! were usedto apply a voltage of 10 V in the frequency range between 1and 30 kHz to the film. At a frequency of about 16 kHz, wedetermined a sound pressure level of 81 dB for both thefree-standing and the clamped films. From these values, wecalculated an absolute sound pressure amplitude of 0.23 Pa,and therefore a transducer sensitivity of 23 mPa/V. From theeffective displacement amplitude of 5.5 nm at a frequency of16 kHz, an inverse piezoelectric coefficient of 550 pC/N wasderived, which is in good agreement with the result obtainedfrom the dielectric spectra.
In conclusion, we have demonstrated that corona-charged sandwich films of porous and nonporous Teflon®AF can be produced with a simple solvent evaporation tech-nique and show a large piezoelectric response at tempera-tures up to 120 °C.
The authors are indebted to A. Pucher for his experimen-tal support.
1Electrets, 3rd ed., edited by G. M. Sessler and R. Gerhard-Multhaupt~Laplacian, Morgan Hill, CA, 1999!.
2K. Kirjavainen, US Patent No. 4,654,546~31 March 1987!.3J. Lekkala and M. Paajanen, inProceedings, 10th International Sympo-sium on Electrets, edited by A. A. Konsta, A. Vassilikou-Dova, and K.Vartzeli-Nikaki ~IEEE Service Center, Piscataway, NJ, 1999!, pp. 743–746.
4G. S. Neugschwandtner, R. Schwo¨diauer, M. Vieytes, S. Bauer-Gogonea,S. Bauer, J. Hillenbrand, R. Kressmann, G. M. Sessler, M. Paajanen, andJ. Lekkala, Appl. Phys. Lett.77, 3827~2000!.
5R. M. Faria, Appl. Phys. Lett.69, 1972~1996!.6R. Gerhard-Multhaupt, W. Ku¨nstler, T. Go¨rne, A. Pucher, T. Weinhold, M.Seiß, Z. Xia, A. Wedel, and R. Danz, IEEE Trans. Dielectr. Electr. Insul.7,480 ~2000!.
7W. Kunstler, Z. Xia, T. Weinhold, A. Pucher, and R. Gerhard-Multhaupt,Appl. Phys. A: Mater. Sci. Process.70, 5 ~2000!.
8K. Omote, H. Ohigashi, and K. Koga, J. Appl. Phys.81, 2760~1997!.9IEEE Standard on Piezoelectricity, ANSI/IEEE Std. 176-1987~1987!.
10W. P. Mason,Physical Acoustics~Academic, New York, 1967!, Vol. I, PartA.
11P. Avakian, J. H. W. Starkweather, J. J. Fontanella, and M. C. Wintersgill,in Dielectric Spectroscopy of Polymeric Materials, edited by J. P. Runtand J. J. Fitzgerald~American Chemical Society, Washington, DC, 1997!.
12G. S. Neugschwandtner, R. Schwo¨diauer, S. Bauer-Gogonea, S. Bauer, M.Paajanen, and J. Lekkala, J. Appl. Phys.89, 4503~2001!.
13J. Backman, J. Audio Eng. Soc.38, 364 ~1990!.14J. Backman and M. Karjalainen, inProceedings, IEEE International Con-
ference on Acoustics, Speech, and Signal Processing~IEEE Service Cen-ter, Piscataway, NJ, 1990!, Vol. 2, pp. 1173–1176.
1854 Appl. Phys. Lett., Vol. 79, No. 12, 17 September 2001 Mellinger et al.
Downloaded 13 Aug 2004 to 128.174.211.53. Redistribution subject to AIP license or copyright, see http://apl.aip.org/apl/copyright.jsp
35
Ultraviolet-induced discharge currents and reduction of the piezoelectriccoefficient in cellular polypropylene films
Axel Mellinger,a) Francisco Camacho Gonzalez,b) and Reimund Gerhard-Multhauptc)
Department of Physics, University of Potsdam, Am Neuen Palais 10, D-14469 Potsdam, Germany
~Received 27 September 2002; accepted 21 November 2002!
Photostimulated discharge spectroscopy of cellular polypropylene films between 200 and 400 nmshowed the existence of at least three distinct trapping levels at 4.6, 5.6, and 6.3 eV. The effects ofUV irradiation on the piezoelectricd33 coefficient was studied by monitoring thickness-extensionresonances in the dielectric spectrum. Prolonged irradiation at wavelengths below 210 nm led to areduction of the piezoelectric coefficient, caused by partial discharge of the polymer foam. ©2003American Institute of Physics.@DOI: 10.1063/1.1537051#
In recent years, cellular polypropylene~PP! films withhigh piezoelectric coefficients have become commerciallyavailable.1,2 Unlike conventional materials, such as polyvi-nylidene fluoride~PVDF!, their piezoelectric activity is notbased on the presence of molecular dipoles. Instead, symme-try breaking occurs on a macroscopic scale, when the poly-mer foam is exposed to a high electric field in, e.g., a coronadischarge, resulting in Paschen breakdown inside the voids,followed by charge separation and trapping at the internalsurfaces of the cellular structure. At room temperature, pi-ezoelectric coefficients of up to 230 pC/N have been reportedfor the high-sensitivity 70mm films.3 This value is aroundten times higher than the piezoelectric activity found inPVDF, and can be enhanced up to 790 pC/N if the samplesare treated in dielectric gases during or before coronacharging.4 A drawback of cellular PP is its low thermalstability,2 which restricts its use to temperatures below60 °C.
While the thermal stability has been addressed in severalarticles, little is known about the short-term effects of UVradiation on the piezoelectric properties of cellular PP, al-though the long-term UV degradation of PP is wellunderstood.5 In addition, the mechanism of charge trappingin highly insulating electret polymers is still subject todebate.6 Very recently, research on polyethylene has demon-strated the coexistence of physical~conformational! traps~trap depths<0.3 eV) and deep chemical traps~trap depths>1 eV).7,8 In the present work, the photostimulated dis-charge~PSD! current of cellular PP was studied under irra-diation with monochromatic UV light in order to obtain in-formation on the trap energies. Unlike the frequently usedtechnique of thermally stimulated discharge, PSD spectros-copy yields direct information on the depth and population oftrapping levels.9 For example, Odaet al. inferred the pres-ence of a single trapping level at 4.9 eV in Teflon® FEP fromphotostimulated detrapping currents10 and concluded that anindirect process~charge injection from the electrodes! ratherthan direct detrapping is the principal mechanism throughwhich the photocurrent is generated in this material.11
Samples of cellular PP~nominal thickness 70mm! werecoated with a 40 nm gold back electrode in high vacuum andcharged in a point-to-plane corona discharge at a needle volt-age of228 kV. Subsequently, a semitransparent 16 nm goldelectrode was deposited on the front side. The films wereirradiated with monochromatic light~Fig. 1! generated by a450 W Xe arc lamp~Oriel! and a monochromator~PhotonTechnology International, bandwidth between 2 and 20 nm!equipped with an UV-enhanced grating~blaze angle for 250nm!. The UV flux was monitored with an UV-sensitive pho-todiode ~Hamamatsu S1336-BQ!. At the sample position,the photon irradiance at 400 nm was about 331014 cm22 s21 nm21. The short-circuit discharge currentwas measured with a Keithley 6517A electrometer. Dielec-tric spectra were recorded using a Novocontrol ALPHAhigh-resolution dielectric analyzer with a modified opensample holder, where the samples were mounted so that theycould freely vibrate in the thickness direction. Unlike Debyerelaxations, where the full width at half maximum is 1.14decades, resonance peaks are much narrower, requiring a fre-quency resolution ofD f / f <0.02.
Figure 2~a! shows the photostimulated discharge currentof cellular polypropylene. The initial scan shows three dis-tinct current peaks at 276, 223, and 198 nm, corresponding toenergies of 4.6, 5.6, and 6.3 eV, respectively. For all threewavelengths, a decaying discharge current was observed@Fig. 2~b!#, ruling out photoconductivity as the major sourceof the photocurrent. Instead, the discharge peaks can be at-tributed to charge traps being emptied upon irradiation. Irra-diation at a fixed wavelength leads to preferential bleaching.
a!Electronic mail: [email protected]!Electronic mail: [email protected]!Electronic mail: [email protected] FIG. 1. Experimental setup for photostimulated discharge spectroscopy.
APPLIED PHYSICS LETTERS VOLUME 82, NUMBER 2 13 JANUARY 2003
2540003-6951/2003/82(2)/254/3/$20.00 © 2003 American Institute of PhysicsDownloaded 09 Jan 2003 to 141.89.177.73. Redistribution subject to AIP license or copyright, see http://ojps.aip.org/aplo/aplcr.jsp
36
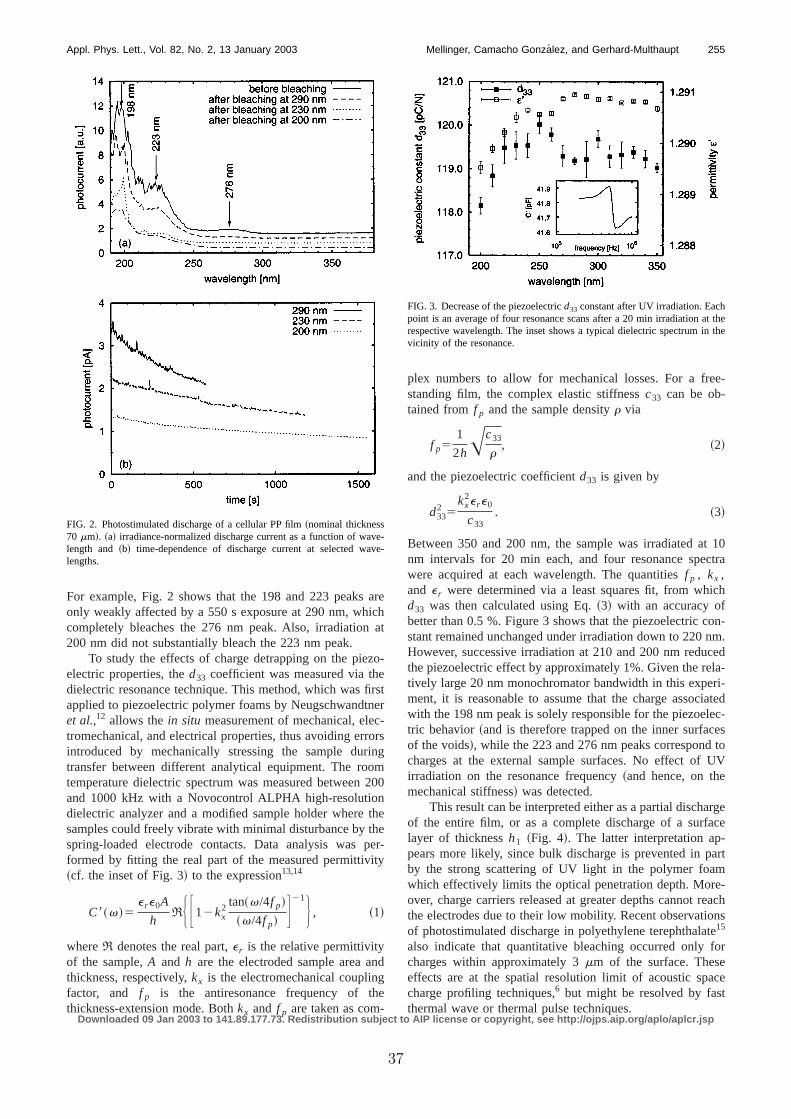
For example, Fig. 2 shows that the 198 and 223 peaks areonly weakly affected by a 550 s exposure at 290 nm, whichcompletely bleaches the 276 nm peak. Also, irradiation at200 nm did not substantially bleach the 223 nm peak.
To study the effects of charge detrapping on the piezo-electric properties, thed33 coefficient was measured via thedielectric resonance technique. This method, which was firstapplied to piezoelectric polymer foams by Neugschwandtneret al.,12 allows thein situ measurement of mechanical, elec-tromechanical, and electrical properties, thus avoiding errorsintroduced by mechanically stressing the sample duringtransfer between different analytical equipment. The roomtemperature dielectric spectrum was measured between 200and 1000 kHz with a Novocontrol ALPHA high-resolutiondielectric analyzer and a modified sample holder where thesamples could freely vibrate with minimal disturbance by thespring-loaded electrode contacts. Data analysis was per-formed by fitting the real part of the measured permittivity~cf. the inset of Fig. 3! to the expression13,14
C8~v!5e re0A
hRH F12kx
2 tan~v/4f p!
~v/4f p! G21J , ~1!
whereR denotes the real part,e r is the relative permittivityof the sample,A and h are the electroded sample area andthickness, respectively,kx is the electromechanical couplingfactor, and f p is the antiresonance frequency of thethickness-extension mode. Bothkx and f p are taken as com-
plex numbers to allow for mechanical losses. For a free-standing film, the complex elastic stiffnessc33 can be ob-tained fromf p and the sample densityr via
f p51
2hAc33
r, ~2!
and the piezoelectric coefficientd33 is given by
d332 5
kx2e re0
c33. ~3!
Between 350 and 200 nm, the sample was irradiated at 10nm intervals for 20 min each, and four resonance spectrawere acquired at each wavelength. The quantitiesf p , kx ,and e r were determined via a least squares fit, from whichd33 was then calculated using Eq.~3! with an accuracy ofbetter than 0.5 %. Figure 3 shows that the piezoelectric con-stant remained unchanged under irradiation down to 220 nm.However, successive irradiation at 210 and 200 nm reducedthe piezoelectric effect by approximately 1%. Given the rela-tively large 20 nm monochromator bandwidth in this experi-ment, it is reasonable to assume that the charge associatedwith the 198 nm peak is solely responsible for the piezoelec-tric behavior~and is therefore trapped on the inner surfacesof the voids!, while the 223 and 276 nm peaks correspond tocharges at the external sample surfaces. No effect of UVirradiation on the resonance frequency~and hence, on themechanical stiffness! was detected.
This result can be interpreted either as a partial dischargeof the entire film, or as a complete discharge of a surfacelayer of thicknessh1 ~Fig. 4!. The latter interpretation ap-pears more likely, since bulk discharge is prevented in partby the strong scattering of UV light in the polymer foamwhich effectively limits the optical penetration depth. More-over, charge carriers released at greater depths cannot reachthe electrodes due to their low mobility. Recent observationsof photostimulated discharge in polyethylene terephthalate15
also indicate that quantitative bleaching occurred only forcharges within approximately 3mm of the surface. Theseeffects are at the spatial resolution limit of acoustic spacecharge profiling techniques,6 but might be resolved by fastthermal wave or thermal pulse techniques.
FIG. 2. Photostimulated discharge of a cellular PP film~nominal thickness70 mm!. ~a! irradiance-normalized discharge current as a function of wave-length and ~b! time-dependence of discharge current at selected wave-lengths.
FIG. 3. Decrease of the piezoelectricd33 constant after UV irradiation. Eachpoint is an average of four resonance scans after a 20 min irradiation at therespective wavelength. The inset shows a typical dielectric spectrum in thevicinity of the resonance.
255Appl. Phys. Lett., Vol. 82, No. 2, 13 January 2003 Mellinger, Camacho Gonzalez, and Gerhard-Multhaupt
Downloaded 09 Jan 2003 to 141.89.177.73. Redistribution subject to AIP license or copyright, see http://ojps.aip.org/aplo/aplcr.jsp
37
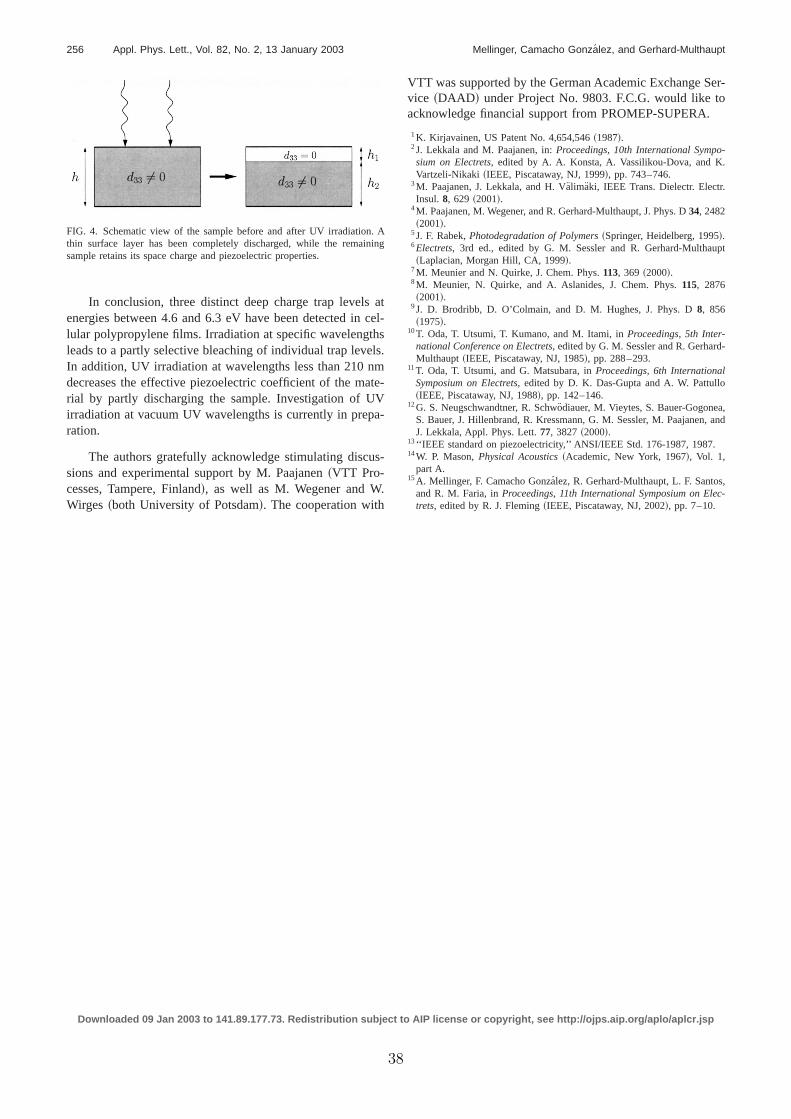
In conclusion, three distinct deep charge trap levels atenergies between 4.6 and 6.3 eV have been detected in cel-lular polypropylene films. Irradiation at specific wavelengthsleads to a partly selective bleaching of individual trap levels.In addition, UV irradiation at wavelengths less than 210 nmdecreases the effective piezoelectric coefficient of the mate-rial by partly discharging the sample. Investigation of UVirradiation at vacuum UV wavelengths is currently in prepa-ration.
The authors gratefully acknowledge stimulating discus-sions and experimental support by M. Paajanen~VTT Pro-cesses, Tampere, Finland!, as well as M. Wegener and W.Wirges ~both University of Potsdam!. The cooperation with
VTT was supported by the German Academic Exchange Ser-vice ~DAAD ! under Project No. 9803. F.C.G. would like toacknowledge financial support from PROMEP-SUPERA.
1K. Kirjavainen, US Patent No. 4,654,546~1987!.2J. Lekkala and M. Paajanen, in:Proceedings, 10th International Sympo-sium on Electrets, edited by A. A. Konsta, A. Vassilikou-Dova, and K.Vartzeli-Nikaki ~IEEE, Piscataway, NJ, 1999!, pp. 743–746.
3M. Paajanen, J. Lekkala, and H. Va¨limaki, IEEE Trans. Dielectr. Electr.Insul. 8, 629 ~2001!.
4M. Paajanen, M. Wegener, and R. Gerhard-Multhaupt, J. Phys. D34, 2482~2001!.
5J. F. Rabek,Photodegradation of Polymers~Springer, Heidelberg, 1995!.6Electrets, 3rd ed., edited by G. M. Sessler and R. Gerhard-Multhaupt~Laplacian, Morgan Hill, CA, 1999!.
7M. Meunier and N. Quirke, J. Chem. Phys.113, 369 ~2000!.8M. Meunier, N. Quirke, and A. Aslanides, J. Chem. Phys.115, 2876~2001!.
9J. D. Brodribb, D. O’Colmain, and D. M. Hughes, J. Phys. D8, 856~1975!.
10T. Oda, T. Utsumi, T. Kumano, and M. Itami, inProceedings, 5th Inter-national Conference on Electrets, edited by G. M. Sessler and R. Gerhard-Multhaupt ~IEEE, Piscataway, NJ, 1985!, pp. 288–293.
11T. Oda, T. Utsumi, and G. Matsubara, inProceedings, 6th InternationalSymposium on Electrets, edited by D. K. Das-Gupta and A. W. Pattullo~IEEE, Piscataway, NJ, 1988!, pp. 142–146.
12G. S. Neugschwandtner, R. Schwo¨diauer, M. Vieytes, S. Bauer-Gogonea,S. Bauer, J. Hillenbrand, R. Kressmann, G. M. Sessler, M. Paajanen, andJ. Lekkala, Appl. Phys. Lett.77, 3827~2000!.
13‘‘IEEE standard on piezoelectricity,’’ ANSI/IEEE Std. 176-1987, 1987.14W. P. Mason,Physical Acoustics~Academic, New York, 1967!, Vol. 1,
part A.15A. Mellinger, F. Camacho Gonza´lez, R. Gerhard-Multhaupt, L. F. Santos,
and R. M. Faria, inProceedings, 11th International Symposium on Elec-trets, edited by R. J. Fleming~IEEE, Piscataway, NJ, 2002!, pp. 7–10.
FIG. 4. Schematic view of the sample before and after UV irradiation. Athin surface layer has been completely discharged, while the remainingsample retains its space charge and piezoelectric properties.
256 Appl. Phys. Lett., Vol. 82, No. 2, 13 January 2003 Mellinger, Camacho Gonzalez, and Gerhard-Multhaupt
Downloaded 09 Jan 2003 to 141.89.177.73. Redistribution subject to AIP license or copyright, see http://ojps.aip.org/aplo/aplcr.jsp
38
Mellinger: Dielectric Resonance Spectroscopy: Versatile Tool in Quest for Better Piezoelectric Polymers842
Dielectric Resonance Spectroscopy: a Versatile Tool in theQuest for Better Piezoelectric Polymers
Axel MellingerDepartment of Physics
University of Potsdam, Am Neuen Palais 10,14469 Potsdam, Germany
ABSTRACTPiezoelectric polymers are widely used in sensor and actuator applications. Com-pared to ceramic materials, they have the advantage of mechanical flexibility andan acoustic impedance similar to those of water or air. Their electrical, electrome-chanical and mechanical properties can be investigated by analyzing piezoelectricresonances in their dielectric spectrum. Apart from its ability to reveal the high-frequency behavior of piezoelectric polymer films, this technique is appealing froma practical point of view because several important parameters can be measuredwith a single scan that only requires standard dielectric spectroscopy equipmentcommonly found in many laboratories. This article outlines the theoretical founda-tions of piezoelectric resonance, examines the experimental aspects, and reviewsrecent applications in the field of piezoelectric polymers.
Index Terms — piezoelectricity, piezoelectric resonances, piezoelectric coeffi-cient, coupling factor, polypropylene, polyvinylidene fluoride, polyvinylidene fluo-ride–trifluoroethylene, polyamide, thickness extension resonance, shear mode,voided polymer, cellular polymer, porous polymer, space-charge electret, coronacharging, dielectric spectroscopy.
1 INTRODUCTIONOR many years, piezoelectric materials have been usedFin a wide range of sensor and actuator applications.
Among these materials, piezoelectric polymers have theadvantage of being usable in mechanically flexible sensorsand actuators with large areas and various shapes as wellas in transducers with good acoustical coupling to air orwater. Furthermore these polymers are interesting be-cause of their various microscopic mechanisms of piezo-electricity as well as pyro- and ferroelectricity. A polariza-tion in the polymer results in breaking of the symmetry,which is a prerequisite for piezoelectric properties. Sym-
Žmetry-breaking is observed in both polar polymers usu-.ally non-porous and in the new class of voided porous or
cellular space charge electrets.
The basis of piezoelectricity in polar polymers is theorientation of molecular dipoles, e.g. a remanent polariza-tion in ferroelectric domains or a frozen-in polarization inthe glassy phase. Piezoelectricity occurs based on a changeof the dipole density during application of mechanicalstress or an electric field. The commercially most impor-
Ž .tant example is polyvinylidene fluoride PVDF , wherepiezoelectric properties were discovered more than thirty
Manuscript recei®ed on 7 February 2003, in final form 16 July 2003.
w xyears ago 1,2 . The structure of polymer chains, the dif-ferent phases, the preparation and the orientation pro-cesses as well as the resulting properties have been well
w xinvestigated in PVDF 35 and some of its copolymers,Ž .e.g. with trifluoroethylene TrFE and tetrafluoroethylene
w x Ž . w x4,6,7 or hexafluoropropylene P VDF-HFP 810 . Sincetheir acoustic impedance is similar to that of water, thesematerials are widely used in ultrasound hydrophone
w xprobes 11,12 and have found their way into medicalw ximaging at high frequencies up to 100 MHz 13,14 .
w xOdd-numbered polyamides 15 , several copolymers ofŽ . w x w xvinylidene cyanide VDCN 16 , polyureas 17 ,
w x w xpolyurethane 18 , and polythioureas 19 are further ex-amples for piezoelectric properties based on an orienta-tion process of molecular dipoles. Recently, a new class ofnon-polar porous or cellular space charge electrets has re-
w xceived considerable attention in the literature 20 . Com-pared to PVDF, these materials are significantly morecompressible, resulting in piezoelectric coefficients of sev-eral hundred pCrN and an acoustic impedance muchcloser to that of air, which makes them excellent candi-
w xdates for use in loudspeakers and microphones 21,22 .Focusing devices, such as spherical sound generators or
w xFresnel zone and phase plates 23 , are a particularly in-teresting application.
1070-9878rrrrr1rrrrr$17.00 2003 IEEE842
39

IEEE Transactions on Dielectrics and Electrical Insulation Vol. 10, No. 5; October 2003 843
The demand for materials with high piezoelectric coef-ficients and a broad operating temperature range fromy25C to at least 120C has triggered a very active re-search, thus necessitating the availability of reliable exper-imental techniques to characterize the mechanical, elec-tromechanical and electrical properties. Typically, samplecharacterization requires many separate experiments,which is not only time-consuming but also increases therisk of altering essential properties during measurementor transfer. Some experiments require accurate in situmethods for measuring the piezoelectric coefficient dur-ing UV irradiation or thermal treatment. A very versatiletechnique is the analysis of piezoelectric resonances in thedielectric spectrum. Compared to static or dynamic me-chanical measurements or optical interferometry, dielec-tric spectroscopy has the advantage of yielding several im-portant material parameters in a single measurement withreadily available laboratory equipment, as long as thesample can be accessed under stress-free or certain lim-ited mechanical boundary conditions. In a typical experi-ment, the theoretical expression for the frequency depen-
Ž .dence of the complex capacitance C is fitted to theexperimental data. From the fitted parameters, the mate-
rial parameters in the small signal limit are then easilycalculated.
This paper provides an introduction into the theoreticaland experimental aspects of measuring piezoelectric reso-nances. After a brief historical overview, the expressionsfor the complex sample capacitance as a function of fre-quency are derived in Section 3. This part also discusseshow to incorporate various losses, and gives equations re-lating some key mechanical and electromechanical quanti-ties to experimentally measured values. Section 4 com-pares dielectric resonance spectroscopy to other experi-mental techniques and outlines the analysis of dielectricresonance data. Finally, Section 5 discusses some recentapplications of resonance spectroscopy in the field ofpiezoelectric polymers.
2 HISTORY OF PIEZOELECTRICRESONANCES
Piezoelectricity in crystals was discovered in 1880 by thew xCurie brothers 24,25 . Perhaps the earliest report of a
piezoelectric resonance can be found in the work ofw xNicolson 26 on the frequency dependence of the capac-
ity, current and conductance of a rochelle salt crystal. At
Table 1. Summary of symbols used in this work; alternate symbols commonly found in the literature are also listed. Indices are within thefollowing bounds: i, js1 . . . 6; m, ns1 . . . 3.
SymbolPhysical quantity This work Other SI unitŽElastic stiffness Young’s modulus, elastic modulus
y2.elastic modulus c C, Y, E N mi jy1 y1Heat capacity c J kg K
y1˜Complex capacitance CsC y iC FsCVy1Electric field E, E V mm
y1 y1Ž .Piezoelectric strain or charge coefficient d CN smVm iy2Electric displacement D, D Cmmy2Piezoelectric stress coefficient e Cmm i
2 y1Piezoelectric voltage coefficient g m Cm iy3Gibbs free energy density G g Jm
Sample thickness h t my1 y1Inverse piezoelectric strain coefficient h NC sVmm iy3Enthalpy density H h Jm
Electromechanical coupling factor k , k , k 1i j p tSample length l m
y2 y1Pyroelectric coefficient p Cm KmMechanical quality factor Q 1m
2 y1Elastic compliance s m Ni jy1 y3Entropy density S , s JK m
Temperature T Ky3Internal energy density U u J my1Speed of sound ©, ® c m sm
Sample width w my1˜Admittance YsGq iB Ss
˜Impedance ZsRq iX y1Thermal expansion coefficient Ki
y1 y1Dielectric impermeability Vm A sm ny1 y1Dielectric constant As V mm n
Poisson’s ratio 1y3Density kg m
y2Mechanical stress , T , S, X NmiMechanical strain , e, S, 1i
1070-9878rrrrr1rrrrr$17.00 2003 IEEE 843
40
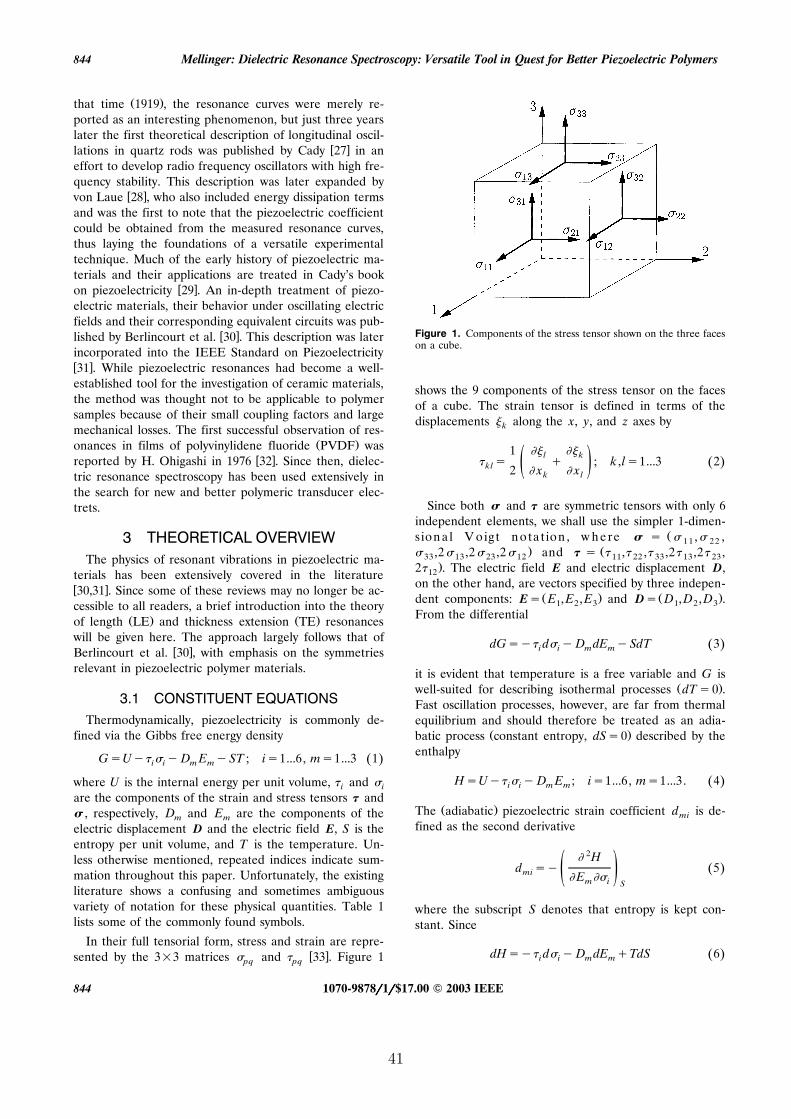
Mellinger: Dielectric Resonance Spectroscopy: Versatile Tool in Quest for Better Piezoelectric Polymers844
Ž .that time 1919 , the resonance curves were merely re-ported as an interesting phenomenon, but just three yearslater the first theoretical description of longitudinal oscil-
w xlations in quartz rods was published by Cady 27 in aneffort to develop radio frequency oscillators with high fre-quency stability. This description was later expanded by
w xvon Laue 28 , who also included energy dissipation termsand was the first to note that the piezoelectric coefficientcould be obtained from the measured resonance curves,thus laying the foundations of a versatile experimentaltechnique. Much of the early history of piezoelectric ma-terials and their applications are treated in Cady’s book
w xon piezoelectricity 29 . An in-depth treatment of piezo-electric materials, their behavior under oscillating electricfields and their corresponding equivalent circuits was pub-
w xlished by Berlincourt et al. 30 . This description was laterincorporated into the IEEE Standard on Piezoelectricityw x31 . While piezoelectric resonances had become a well-established tool for the investigation of ceramic materials,the method was thought not to be applicable to polymersamples because of their small coupling factors and largemechanical losses. The first successful observation of res-
Ž .onances in films of polyvinylidene fluoride PVDF wasw xreported by H. Ohigashi in 1976 32 . Since then, dielec-
tric resonance spectroscopy has been used extensively inthe search for new and better polymeric transducer elec-trets.
3 THEORETICAL OVERVIEWThe physics of resonant vibrations in piezoelectric ma-
terials has been extensively covered in the literaturew x30,31 . Since some of these reviews may no longer be ac-cessible to all readers, a brief introduction into the theory
Ž . Ž .of length LE and thickness extension TE resonanceswill be given here. The approach largely follows that of
w xBerlincourt et al. 30 , with emphasis on the symmetriesrelevant in piezoelectric polymer materials.
3.1 CONSTITUENT EQUATIONSThermodynamically, piezoelectricity is commonly de-
fined via the Gibbs free energy density
GsUy yD E yST ; is1...6, ms1...3 1Ž .i i m m
where U is the internal energy per unit volume, and i i
are the components of the strain and stress tensors and , respectively, D and E are the components of them m
electric displacement D and the electric field E, S is theentropy per unit volume, and T is the temperature. Un-less otherwise mentioned, repeated indices indicate sum-mation throughout this paper. Unfortunately, the existingliterature shows a confusing and sometimes ambiguousvariety of notation for these physical quantities. Table 1lists some of the commonly found symbols.
In their full tensorial form, stress and strain are repre-w xsented by the 33 matrices and 33 . Figure 1pq pq
Figure 1. Components of the stress tensor shown on the three faceson a cube.
shows the 9 components of the stress tensor on the facesof a cube. The strain tensor is defined in terms of thedisplacements along the x, y, and z axes byk
1 l k s q ; k ,ls1...3 2Ž .kl ž /2 x xk l
Since both and are symmetric tensors with only 6independent elements, we shall use the simpler 1-dimen-
Žsion a l V oigt n ota tion , w h ere s , ,11 22. Ž ,2 ,2 ,2 and s , , ,2 ,2 ,33 13 23 12 11 22 33 13 23
.2 . The electric field E and electric displacement D,12
on the other hand, are vectors specified by three indepen-Ž . Ž .dent components: Es E , E , E and Ds D , D , D .1 2 3 1 2 3
From the differential
dGsy d yD dE ySdT 3Ž .i i m m
it is evident that temperature is a free variable and G isŽ .well-suited for describing isothermal processes dTs0 .
Fast oscillation processes, however, are far from thermalequilibrium and should therefore be treated as an adia-
Ž .batic process constant entropy, dSs0 described by theenthalpy
HsUy yD E ; is1...6, ms1...3. 4Ž .i i m m
Ž .The adiabatic piezoelectric strain coefficient d is de-mi
fined as the second derivative
2Hd sy 5Ž .mi ž / E m i S
where the subscript S denotes that entropy is kept con-stant. Since
dHsy d yD dE qTdS 6Ž .i i m m
1070-9878rrrrr1rrrrr$17.00 2003 IEEE844
41
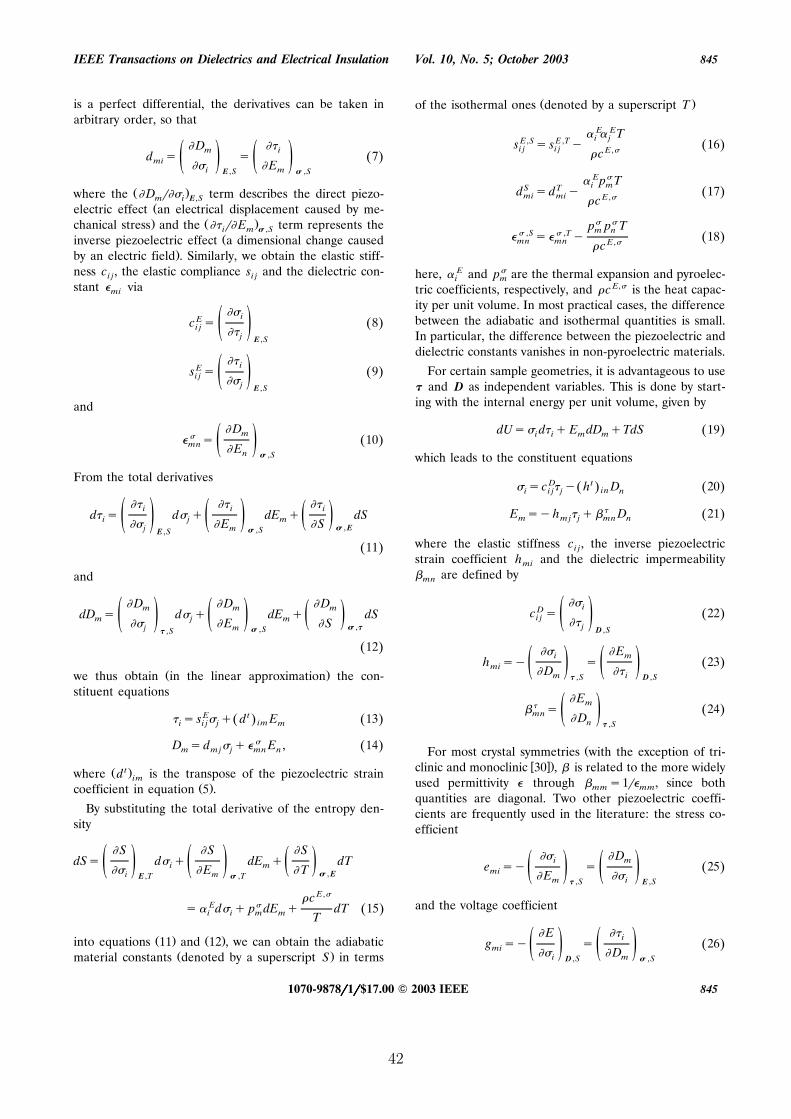
IEEE Transactions on Dielectrics and Electrical Insulation Vol. 10, No. 5; October 2003 845
is a perfect differential, the derivatives can be taken inarbitrary order, so that
D m id s s 7Ž .mi ž / ž / Ei mE ,S ,S
Ž .where the D r term describes the direct piezo-m i E,SŽelectric effect an electrical displacement caused by me-. Ž .chanical stress and the r E term represents thei m ,S
Žinverse piezoelectric effect a dimensional change caused.by an electric field . Similarly, we obtain the elastic stiff-
ness c , the elastic compliance s and the dielectric con-i j i j
stant viami
iEc s 8Ž .i j ž / j E ,S
iEs s 9Ž .i j ž /j E ,S
and
Dm s 10Ž .mn ž / En ,S
From the total derivatives
i i id s d q dE q dSi j m ž /ž /ž / E S , Ej m ,SE ,S
11Ž .
and
D D Dm m mdD s d q dE q dSm j m ž /ž /ž / E S ,j m ,S ,S
12Ž .
Ž .we thus obtain in the linear approximation the con-stituent equations
s s E q dt E 13Ž . Ž .imi i j j m
D sd q E , 14Ž .m m j j mn n
Ž t.where d is the transpose of the piezoelectric strainimŽ .coefficient in equation 5 .
By substituting the total derivative of the entropy den-sity
S S SdSs d q dE q dTi m ž /ž / ž / E T , Ei mE ,T ,T
c E,E s d q p dE q dT 15Ž .i i m m T
Ž . Ž .into equations 11 and 12 , we can obtain the adiabaticŽ .material constants denoted by a superscript S in terms
Ž .of the isothermal ones denoted by a superscript T
E ETi jE,S E ,Ts s s y 16Ž .i j i j E,c
Ep Ti mS Td sd y 17Ž .mi mi E,c
p p Tm n ,S ,T s y 18Ž .mn mn E,c
here, E and p are the thermal expansion and pyroelec-i m
tric coefficients, respectively, and c E, is the heat capac-ity per unit volume. In most practical cases, the differencebetween the adiabatic and isothermal quantities is small.In particular, the difference between the piezoelectric anddielectric constants vanishes in non-pyroelectric materials.
For certain sample geometries, it is advantageous to use and D as independent variables. This is done by start-ing with the internal energy per unit volume, given by
dUs d qE dD qTdS 19Ž .i i m m
which leads to the constituent equations
sc D y ht D 20Ž . Ž .ini i j j n
E syh q D 21Ž .m m j j mn n
where the elastic stiffness c , the inverse piezoelectrici j
strain coefficient h and the dielectric impermeabilitymi
are defined bymn
iDc s 22Ž .i j ž / j D ,S
Ei mh sy s 23Ž .mi ž / ž / D m i ,S D ,S
Em s 24Ž .mn ž / Dn ,S
ŽFor most crystal symmetries with the exception of tri-w x.clinic and monoclinic 30 , is related to the more widely
used permittivity through s1r , since bothmm mm
quantities are diagonal. Two other piezoelectric coeffi-cients are frequently used in the literature: the stress co-efficient
Di me sy s 25Ž .mi ž / ž / E m i ,S E ,S
and the voltage coefficient
E ig sy s 26Ž .mi ž / ž / Di mD ,S ,S
1070-9878rrrrr1rrrrr$17.00 2003 IEEE 845
42
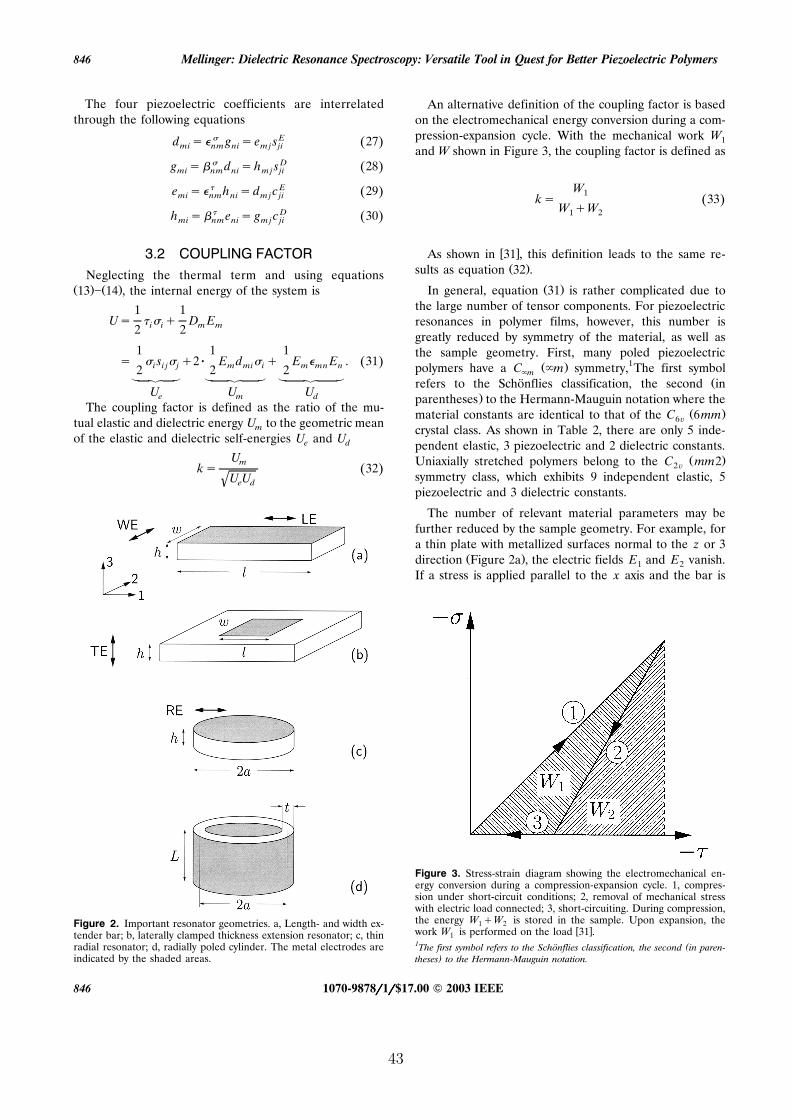
Mellinger: Dielectric Resonance Spectroscopy: Versatile Tool in Quest for Better Piezoelectric Polymers846
The four piezoelectric coefficients are interrelatedthrough the following equations
d s g s e s E 27Ž .mi nm ni m j ji
g s d sh s D 28Ž .mi nm ni m j ji
e s h sd c E 29Ž .mi nm ni m j ji
h s e s g c D 30Ž .mi nm ni m j ji
3.2 COUPLING FACTORNeglecting the thermal term and using equations
Ž . Ž .13 14 , the internal energy of the system is
1 1Us q D Ei i m m2 2
1 1 1s s q2 E d q E E . 31Ž .i i j j m mi i m mn n2 2 2^ ` _ ^ ` _ ^ ` _
U U Ue m d
The coupling factor is defined as the ratio of the mu-tual elastic and dielectric energy U to the geometric meanm
of the elastic and dielectric self-energies U and Ue d
Umks 32Ž .
U U' e d
Figure 2. Important resonator geometries. a, Length- and width ex-tender bar; b, laterally clamped thickness extension resonator; c, thinradial resonator; d, radially poled cylinder. The metal electrodes areindicated by the shaded areas.
An alternative definition of the coupling factor is basedon the electromechanical energy conversion during a com-pression-expansion cycle. With the mechanical work W1
and W shown in Figure 3, the coupling factor is defined as
W1ks 33Ž .
W qW1 2
w xAs shown in 31 , this definition leads to the same re-Ž .sults as equation 32 .
Ž .In general, equation 31 is rather complicated due tothe large number of tensor components. For piezoelectricresonances in polymer films, however, this number isgreatly reduced by symmetry of the material, as well asthe sample geometry. First, many poled piezoelectric
Ž . 1polymers have a C m symmetry, The first symbolmŽrefers to the Schonflies classification, the second in¨
.parentheses to the Hermann-Mauguin notation where theŽ .material constants are identical to that of the C 6mm6®
crystal class. As shown in Table 2, there are only 5 inde-pendent elastic, 3 piezoelectric and 2 dielectric constants.
Ž .Uniaxially stretched polymers belong to the C mm22®
symmetry class, which exhibits 9 independent elastic, 5piezoelectric and 3 dielectric constants.
The number of relevant material parameters may befurther reduced by the sample geometry. For example, fora thin plate with metallized surfaces normal to the z or 3
Ž .direction Figure 2a , the electric fields E and E vanish.1 2
If a stress is applied parallel to the x axis and the bar is
Figure 3. Stress-strain diagram showing the electromechanical en-ergy conversion during a compression-expansion cycle. 1, compres-sion under short-circuit conditions; 2, removal of mechanical stresswith electric load connected; 3, short-circuiting. During compression,the energy W qW is stored in the sample. Upon expansion, the1 2
w xwork W is performed on the load 31 .11 (The first symbol refers to the Schonflies classification, the second in paren-¨
)theses to the Hermann-Mauguin notation.
1070-9878rrrrr1rrrrr$17.00 2003 IEEE846
43
IEEE Transactions on Dielectrics and Electrical Insulation Vol. 10, No. 5; October 2003 847
free to cross-expand, then all stresses except will be1Ž .zero. In this case, equation 31 becomes
1 1E 2 2Us s qE d q E 34Ž .11 1 3 31 1 33 32 2
and the corresponding coupling factor is
d31k s 35Ž .31 E' s33 11
For circular disks cut from materials with C symme-m
try, we have s and s0. Since the stress is1 2 3
isotropic in the xy plane, the corresponding coupling fac-tor
2 d 231k s s k 36Ž .( (p 31E E E1y 1y' s33 11
is called the planar coupling factor. The quantity
s E12E sy 37Ž .Es11
is Poisson’s ratio at constant electric field.
Let us now apply the stress parallel to the z axis. Wenow have s s0, 0, whereas there is no con-1 2 3
straint on the values of . This leads to
1 1E 2 2Us s qE d q E 38Ž .11 3 3 33 3 33 32 2
and the corresponding coupling factor is
d33k s 39Ž .33 E' s33 33
A slightly different geometry is shown in Figure 2b. Here,the electrodes are smaller than the total surface of thesample, so that the electroded area can be considered lat-erally clamped by the unmetallized parts and all straincomponents vanish with the exception of . Usually,3
thickness vibrations in thin films can be treated as later-
ally clamped even when the electrodes cover the entiresample surface, since the thickness extension resonancefrequency is at least 1 order of magnitude higher than thatof any lateral extension mode. If the sample is free ofspace charge, Maxwell’s equations dictate that Ds0.Therefore it is advantageous to use and D as indepen-
Ž . Ž . Ž .dent variables. Inserting equations 13 14 into 31 weobtain
1 1D 2 2Us c q h D q D 40Ž .33 3 3 33 3 33 32 2
with the thickness coupling factor k given byt
h e33 33k s s 41Ž .t D D' 'c c33 33 33 33
Ž .In the last equation, use was made of equation 29 andthe fact that and are diagonal for all crystal classes
w xexcept triclinic and monoclinic 30 , so that s1rmm mm
and e s h . Furthermore, in samples with small d33 33 33 31
and d coefficients we have32
e fd c 42Ž .33 33 33
so thatc33
k fd 43Ž .t 33( 33
3.3 EQUATIONS OF MOTION FORVIBRATING PLATES, DISKS AND
CYLINDERSTo describe the dielectric response of piezoelectric
polymer films, we need to obtain and solve the equationof motion. We begin with the most important case of
Ž .thickness extension TE resonances.
3.3.1 THICKNESS-EXTENSION RESONANCE
For TE resonances, the sample can generally be treatedas laterally clamped, for the following reason: As will be
Table 2. Elastic, piezoelectric and dielectric matrices for the important cases of C and C symmetry.2 m m
s s s d s s s d° ¶ ° ¶C C11 12 13 31 11 12 13 312m m
s s s d s s s d12 22 23 32 12 11 13 31
s s s d s s s d13 23 33 33 13 13 33 33
s d s d44 24 44 15
s d s d55 15 44 15
Ž .s 2 s yS66 11 12
d d 15 11 15 11
d d 24 22 15 11
d d d d d d 31 32 33 33 31 31 33 33¢ ß ¢ ß
1070-9878rrrrr1rrrrr$17.00 2003 IEEE 847
44
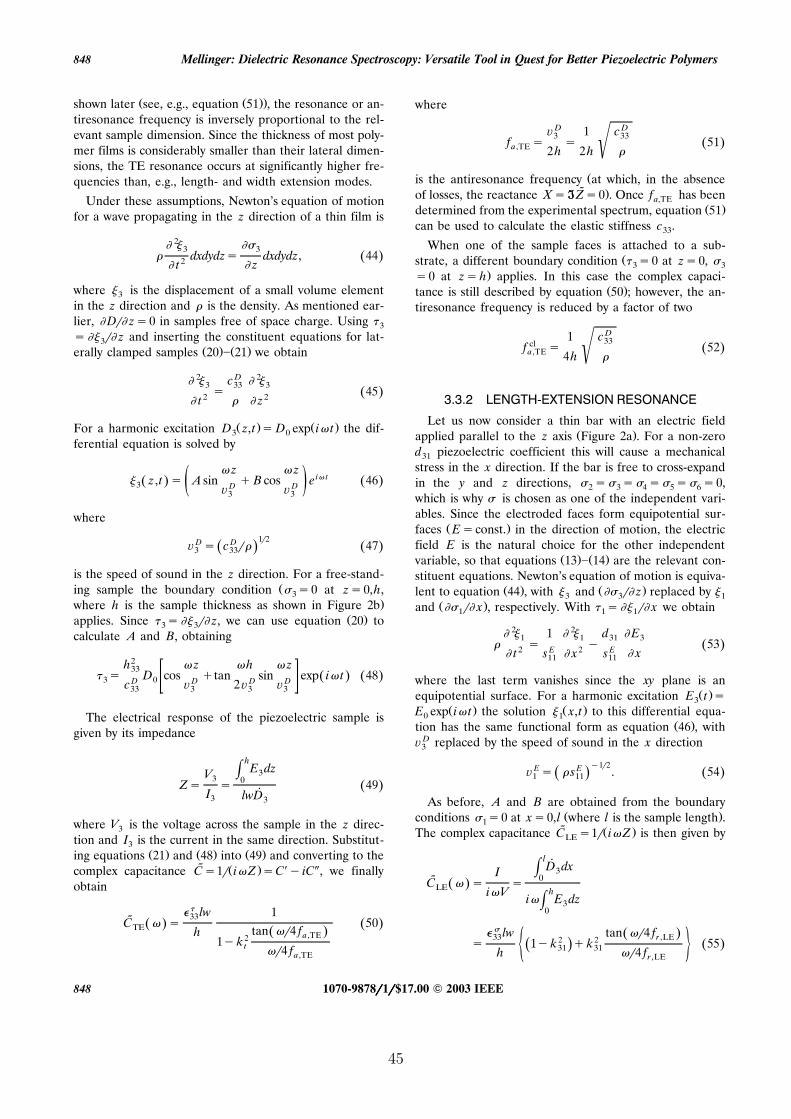
Mellinger: Dielectric Resonance Spectroscopy: Versatile Tool in Quest for Better Piezoelectric Polymers848
Ž Ž ..shown later see, e.g., equation 51 , the resonance or an-tiresonance frequency is inversely proportional to the rel-evant sample dimension. Since the thickness of most poly-mer films is considerably smaller than their lateral dimen-sions, the TE resonance occurs at significantly higher fre-quencies than, e.g., length- and width extension modes.
Under these assumptions, Newton’s equation of motionfor a wave propagating in the z direction of a thin film is
2 3 3 dxdydzs dxdydz, 44Ž .2 z t
where is the displacement of a small volume element3
in the z direction and is the density. As mentioned ear-lier, Dr zs0 in samples free of space charge. Using 3
s r z and inserting the constituent equations for lat-3Ž . Ž .erally clamped samples 20 21 we obtain
2 c D 2 3 33 3s 45Ž .2 2 t z
Ž . Ž .For a harmonic excitation D z,t sD exp i t the dif-3 0
ferential equation is solved by
z zi t z ,t s A sin qB cos e 46Ž . Ž .3 D Dž /® ®3 3
where
1r2D D® s c r 47Ž .Ž .3 33
is the speed of sound in the z direction. For a free-stand-Žing sample the boundary condition s0 at zs0,h,3
.where h is the sample thickness as shown in Figure 2bŽ .applies. Since s r z, we can use equation 20 to3 3
calculate A and B, obtaining
2h z h z33 s D cos qtan sin exp i t 48Ž . Ž .3 0D D D Dc ® 2® ®33 3 3 3
The electrical response of the piezoelectric sample isgiven by its impedance
hE dzH 3V3 0Zs s 49Ž .˙I lwD3 3
where V is the voltage across the sample in the z direc-3
tion and I is the current in the same direction. Substitut-3Ž . Ž . Ž .ing equations 21 and 48 into 49 and converting to the
˜ Ž .complex capacitance Cs1r iZ sC y iC , we finallyobtain
lw 133C s 50Ž . Ž .TE tan r4 fŽ .h a,TE21ykt r4 fa,TE
where
D D® 1 c3 33f s s 51Ž .(a,TE 2h 2h
Žis the antiresonance frequency at which, in the absence˜ .of losses, the reactance XsTTZs0 . Once f has beena,TE
Ž .determined from the experimental spectrum, equation 51can be used to calculate the elastic stiffness c .33
When one of the sample faces is attached to a sub-Žstrate, a different boundary condition s0 at zs0, 3 3
.s0 at zsh applies. In this case the complex capaci-Ž .tance is still described by equation 50 ; however, the an-
tiresonance frequency is reduced by a factor of two
D1 c33clf s 52Ž .(a,TE 4h
3.3.2 LENGTH-EXTENSION RESONANCE
Let us now consider a thin bar with an electric fieldŽ .applied parallel to the z axis Figure 2a . For a non-zero
d piezoelectric coefficient this will cause a mechanical31
stress in the x direction. If the bar is free to cross-expandin the y and z directions, s s s s s0,2 3 4 5 6
which is why is chosen as one of the independent vari-ables. Since the electroded faces form equipotential sur-
Ž .faces Esconst. in the direction of motion, the electricfield E is the natural choice for the other independent
Ž . Ž .variable, so that equations 13 14 are the relevant con-stituent equations. Newton’s equation of motion is equiva-
Ž . Ž .lent to equation 44 , with and r z replaced by 3 3 1Ž .and r x , respectively. With s r x we obtain1 1 1
2 1 2 d E1 1 31 3 s y 53Ž .2 E 2 E x t s x s11 11
where the last term vanishes since the xy plane is anŽ .equipotential surface. For a harmonic excitation E t s3
Ž . Ž .E exp i t the solution x,t to this differential equa-0 1Ž .tion has the same functional form as equation 46 , with
®D replaced by the speed of sound in the x direction3
y1r2E E® s s . 54Ž .Ž .1 11
As before, A and B are obtained from the boundaryŽ .conditions s0 at xs0,l where l is the sample length .1
˜ Ž .The complex capacitance C s1r iZ is then given byLE
lD dxH 3I 0C s sŽ .LE hiV i E dzH 30
lw tan r4 fŽ .33 r ,LE2 2s 1yk qk 55Ž .Ž .31 31½ 5h r4 fr ,LE
1070-9878rrrrr1rrrrr$17.00 2003 IEEE848
45
IEEE Transactions on Dielectrics and Electrical Insulation Vol. 10, No. 5; October 2003 849
The impedance Z reaches a minimum at the resonancefrequency
® E 11f s s 56Ž .r ,LE E2 l '2 l s11
3.3.3 WIDTH-EXTENSION RESONANCE
Samples of significantly different length l and width wŽ .show both LE and width extension WE resonances that
are separated in the spectrum by a factor of lrw. At firstglance, one might expect that the complex capacitance is
Ž .described by a relation completely analogous to 55 .However, there is a subtle difference: since the resonancefrequency for the WE resonator is higher than the LEresonance frequency, the sample can be consideredclamped in the x direction, so that both and are1 2
generally non-zero, whereas s s s s0. Con-3 4 5 6
sequently, the solution to the equation of motion is slightlydifferent compared to the previous case of LE resonancesw x34 . The speed of sound in the y direction is
1r2Es11E® s 57Ž .2 2E E Ež / s s y sŽ .ž /11 22 12
and the complex capacitance
lw33 2 2C s 1yk 1ykŽ . Ž . Ž .WE 31 WE½h
tan r4 fŽ .r ,WE2qk 58Ž .WE 5r4 fr ,WE
where the WE resonance frequency and coupling factorare defined by
® E2
f s 59Ž .r ,W E 2wand
2E Es s11 122k s d y d 60Ž .WE 32 31E2 E E E ž /s1yk s s y sŽ . Ž . 1131 33 11 22 12
respectively.
3.3.4 RADIAL RESONATORS
A frequently used geometry is that of thin circular disksŽ .electroded on their major faces Figure 2c . The equations
of motion in cylindrical geometry were treated extensivelyw xby Mason 35 and summarized in the IEEE Standard on
w xPiezoelectricity 31 . For brevity, only the final result willbe presented here. The capacitance of a thin circular plateof radius a and thickness h is given by
2p 2 p a 2 kŽ .33C sy 61Ž . Ž .R h 1y y J rJ Ž . Ž .0 1
where J and J are the 0th and 1st order Bessel func-0 1
tions of the first kind,
as 62Ž .p®
and k p is the planar radial coupling factor, related to theŽ .planar coupling factor defined in equation 36 by
E k21q p2pk s 63Ž . Ž .2ž /2 1ykp
Furthermore,
1p® s 64Ž .2E E) s 1y Ž .11
Ž Eis the planar radial speed of sound equal to ® from2Ž . .equation 57 if s s s and11 22
y2 d231p s q 65Ž .33 33E Es y s11 12
is the planar radial permittivity.
3.3.5 RADIALLY POLED CYLINDERS
Certain transducer applications, such as piezoelectricw xcables 36 , use cylindrical shells, also known as radially
Ž .poled cylinders RPC . This resonator geometry, shown inw xFigure 2d, was first treated by Haskins and Walsh 37 and
used in the calculation of material parameters by Taskerw xet al. 38 . This case is more complicated than the previ-
ously discussed geometries as coupling between the LEand the radial mode must be taken into account. The fre-quency dependence of the complex capacitance is givenby
2 22 aL 1y 1q tan Lr2Ž . Ž .33 2C s kŽ .RPC 31 2½t Lr21yŽ .
2 2 2q1yk y 1q 1y y2k 66Ž . Ž .Ž .31 31 5with
as 67Ž .
®
s1y 1y 2 2 68Ž . Ž . Ž .and
1r2 Ž .
s 69Ž .2® 1y
ŽHere, a is the radius of the cylinder more precisely,.the arithmetic mean of the inner and outer radius , t is its
1070-9878rrrrr1rrrrr$17.00 2003 IEEE 849
46
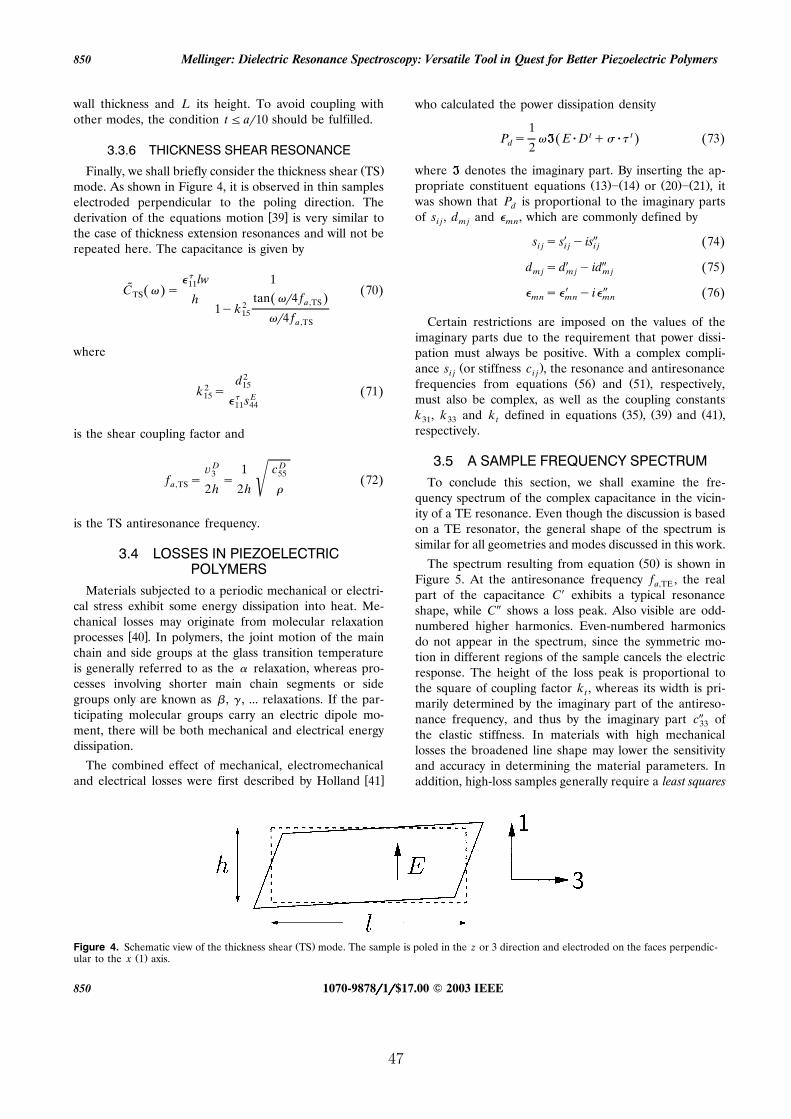
Mellinger: Dielectric Resonance Spectroscopy: Versatile Tool in Quest for Better Piezoelectric Polymers850
wall thickness and L its height. To avoid coupling withother modes, the condition tFar10 should be fulfilled.
3.3.6 THICKNESS SHEAR RESONANCE
Ž .Finally, we shall briefly consider the thickness shear TSmode. As shown in Figure 4, it is observed in thin sampleselectroded perpendicular to the poling direction. The
w xderivation of the equations motion 39 is very similar tothe case of thickness extension resonances and will not berepeated here. The capacitance is given by
lw 111C s 70Ž . Ž .TS tan r4 fŽ .h a,TS21yk15 r4 fa,TS
where
d2152k s 71Ž .15 E s11 44
is the shear coupling factor and
D D® 1 c3 55f s s 72Ž .(a,TS 2h 2h
is the TS antiresonance frequency.
3.4 LOSSES IN PIEZOELECTRICPOLYMERS
Materials subjected to a periodic mechanical or electri-cal stress exhibit some energy dissipation into heat. Me-chanical losses may originate from molecular relaxation
w xprocesses 40 . In polymers, the joint motion of the mainchain and side groups at the glass transition temperatureis generally referred to as the relaxation, whereas pro-cesses involving shorter main chain segments or sidegroups only are known as , , ... relaxations. If the par-ticipating molecular groups carry an electric dipole mo-ment, there will be both mechanical and electrical energydissipation.
The combined effect of mechanical, electromechanicalw xand electrical losses were first described by Holland 41
who calculated the power dissipation density
1t tP s TT E D q 73Ž . Ž .d 2
where TT denotes the imaginary part. By inserting the ap-Ž . Ž . Ž . Ž .propriate constituent equations 13 14 or 20 21 , it
was shown that P is proportional to the imaginary partsd
of s , d and , which are commonly defined byi j m j mn
s s s y is 74Ž .i j i j i j
d sd y id 75Ž .m j m j m j
s y i 76Ž .mn mn mn
Certain restrictions are imposed on the values of theimaginary parts due to the requirement that power dissi-pation must always be positive. With a complex compli-
Ž .ance s or stiffness c , the resonance and antiresonancei j i jŽ . Ž .frequencies from equations 56 and 51 , respectively,
must also be complex, as well as the coupling constantsŽ . Ž . Ž .k , k and k defined in equations 35 , 39 and 41 ,31 33 t
respectively.
3.5 A SAMPLE FREQUENCY SPECTRUMTo conclude this section, we shall examine the fre-
quency spectrum of the complex capacitance in the vicin-ity of a TE resonance. Even though the discussion is basedon a TE resonator, the general shape of the spectrum issimilar for all geometries and modes discussed in this work.
Ž .The spectrum resulting from equation 50 is shown inFigure 5. At the antiresonance frequency f , the reala,TE
part of the capacitance C exhibits a typical resonanceshape, while C shows a loss peak. Also visible are odd-numbered higher harmonics. Even-numbered harmonicsdo not appear in the spectrum, since the symmetric mo-tion in different regions of the sample cancels the electricresponse. The height of the loss peak is proportional tothe square of coupling factor k , whereas its width is pri-t
marily determined by the imaginary part of the antireso-nance frequency, and thus by the imaginary part c of33
the elastic stiffness. In materials with high mechanicallosses the broadened line shape may lower the sensitivityand accuracy in determining the material parameters. Inaddition, high-loss samples generally require a least squares
Ž .Figure 4. Schematic view of the thickness shear TS mode. The sample is poled in the z or 3 direction and electroded on the faces perpendic-Ž .ular to the x 1 axis.
1070-9878rrrrr1rrrrr$17.00 2003 IEEE850
47
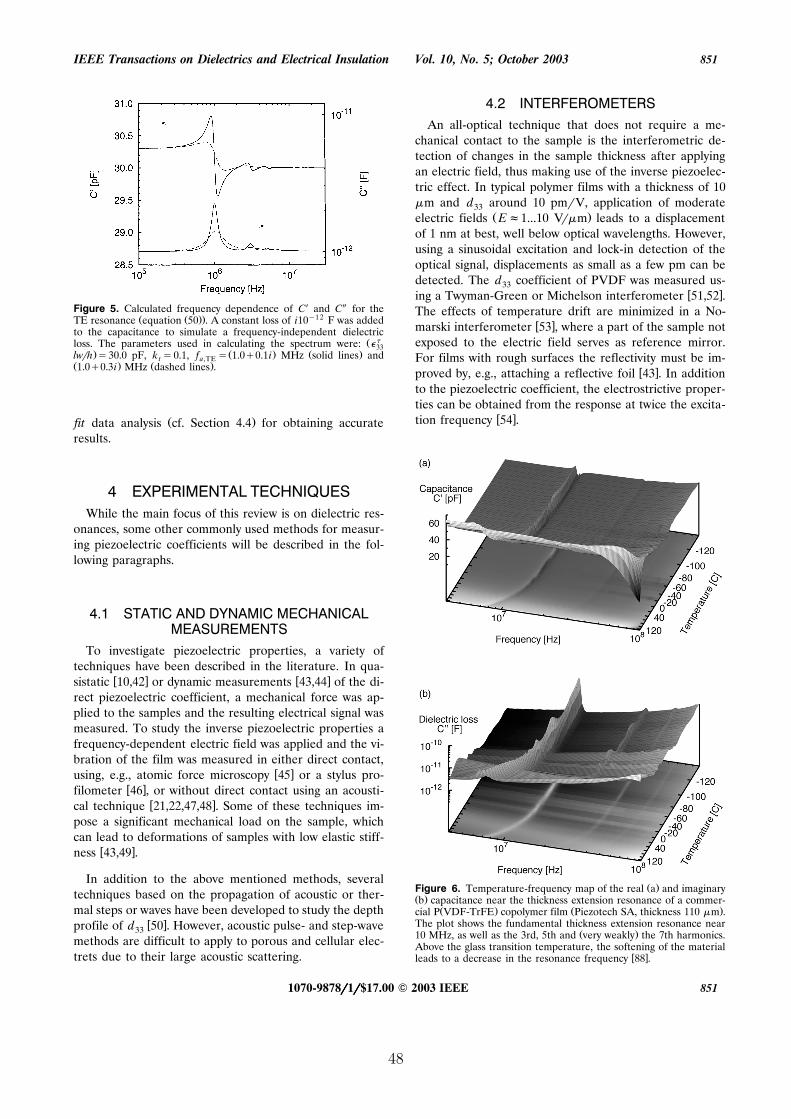
IEEE Transactions on Dielectrics and Electrical Insulation Vol. 10, No. 5; October 2003 851
Figure 5. Calculated frequency dependence of C and C for theŽ Ž .. y1 2TE resonance equation 50 . A constant loss of i10 F was added
to the capacitance to simulate a frequency-independent dielectricŽ loss. The parameters used in calculating the spectrum were: 33
. Ž . Ž .lwrh s30.0 pF, k s0.1, f s 1.0q0.1i MHz solid lines andt a,TEŽ . Ž .1.0q0.3i MHz dashed lines .
Ž .fit data analysis cf. Section 4.4 for obtaining accurateresults.
4 EXPERIMENTAL TECHNIQUESWhile the main focus of this review is on dielectric res-
onances, some other commonly used methods for measur-ing piezoelectric coefficients will be described in the fol-lowing paragraphs.
4.1 STATIC AND DYNAMIC MECHANICALMEASUREMENTS
To investigate piezoelectric properties, a variety oftechniques have been described in the literature. In qua-
w x w xsistatic 10,42 or dynamic measurements 43,44 of the di-rect piezoelectric coefficient, a mechanical force was ap-plied to the samples and the resulting electrical signal wasmeasured. To study the inverse piezoelectric properties afrequency-dependent electric field was applied and the vi-bration of the film was measured in either direct contact,
w xusing, e.g., atomic force microscopy 45 or a stylus pro-w xfilometer 46 , or without direct contact using an acousti-
w xcal technique 21,22,47,48 . Some of these techniques im-pose a significant mechanical load on the sample, whichcan lead to deformations of samples with low elastic stiff-
w xness 43,49 .
In addition to the above mentioned methods, severaltechniques based on the propagation of acoustic or ther-mal steps or waves have been developed to study the depth
w xprofile of d 50 . However, acoustic pulse- and step-wave33
methods are difficult to apply to porous and cellular elec-trets due to their large acoustic scattering.
4.2 INTERFEROMETERSAn all-optical technique that does not require a me-
chanical contact to the sample is the interferometric de-tection of changes in the sample thickness after applyingan electric field, thus making use of the inverse piezoelec-tric effect. In typical polymer films with a thickness of 10m and d around 10 pmrV, application of moderate33
Ž .electric fields Ef1...10 Vrm leads to a displacementof 1 nm at best, well below optical wavelengths. However,using a sinusoidal excitation and lock-in detection of theoptical signal, displacements as small as a few pm can bedetected. The d coefficient of PVDF was measured us-33
w xing a Twyman-Green or Michelson interferometer 51,52 .The effects of temperature drift are minimized in a No-
w xmarski interferometer 53 , where a part of the sample notexposed to the electric field serves as reference mirror.For films with rough surfaces the reflectivity must be im-
w xproved by, e.g., attaching a reflective foil 43 . In additionto the piezoelectric coefficient, the electrostrictive proper-ties can be obtained from the response at twice the excita-
w xtion frequency 54 .
Ž .Figure 6. Temperature-frequency map of the real a and imaginaryŽ .b capacitance near the thickness extension resonance of a commer-
Ž . Ž .cial P VDF-TrFE copolymer film Piezotech SA, thickness 110 m .The plot shows the fundamental thickness extension resonance near
Ž .10 MHz, as well as the 3rd, 5th and very weakly the 7th harmonics.Above the glass transition temperature, the softening of the material
w xleads to a decrease in the resonance frequency 88 .
1070-9878rrrrr1rrrrr$17.00 2003 IEEE 851
48
Mellinger: Dielectric Resonance Spectroscopy: Versatile Tool in Quest for Better Piezoelectric Polymers852
4.3 DIELECTRIC SPECTROSCOPYDielectric spectroscopy is a well-established research
w xtool for investigating molecular dipole relaxations 55,56 .Typically, the real and imaginary capacitance of the sam-ple are recorded over a broad range of frequencies
w xstretching from the Hz range up to several GHz 57 .The same equipment can be used to study the piezoelec-tric resonances described in Section 3. Unlike molecularrelaxations, where the full width at half maximumŽ . ŽFWHM is at least 1.14 decades for a pure Debye-type
.relaxation , resonance peaks are often much narrower,depending on the mechanical quality factor Q defined inm
Ž .equation 77 . Therefore, a higher frequency resolution isŽ .required, so that frf 1rQ . The thickness extensionm
resonance typically occurs at frequencies between 100 kHzand 100 MHz, depending on the elastic stiffness and
Ž .thickness of the sample, according to equation 51 . BelowŽ30 MHz, standard dielectric analyzers such as LCR
.bridges and frequency response analyzers can be used. Athigher frequencies, stray capacitances and inductancessignificantly affect the accuracy of the measuredimpedance or capacitance. However, impedance analyzersmeasuring the complex reflection coefficient of a coaxialline terminated by the sample have been successfully used
w xto study resonances around 100 MHz 58 .
In contrast to mechanical or interferometric measure-ments, a single dielectric spectrum yields three important
Žmaterial parameters elastic modulus or compliance, per-.mittivity and electromechanical coupling factor , from
which the piezoelectric coefficient can be deduced. More-over, by acquiring dielectric spectra at different tempera-tures the temperature dependence of these parameters iseasily obtained. As an example, Figure 6 shows the real
Žand imaginary capacitance of a poly vinylidene-trifluoro-.ethylene copolymer film as a function of both frequency
and temperature.
Depending on the piezoelectric coefficient under inves-w xtigation, different sample geometries must be used 32,59 .
As shown in Figure 7, square or circular electrodes withan area between 1 and 3 cm2 are commonly utilized formeasuring d or e via TE resonances. Narrow strips33 33
are suitable for analyzing LE and WE resonances, yield-ing d and d . However, care must be taken to ensure31 32
w xthe absence of mode coupling 60 . A length-to-width ratioof 8 is often considered sufficient to separate the LE and
Ž .Figure 7. Electrode geometries for measuring d , d a and b31 32Ž . w xand d piezoelectric coefficients c 32 .33
w xWE modes 61 , although higher harmonics of the LEmode could affect the WE resonance in materials with ahigh mechanical quality factor Q .m
Often there is a preferential direction in the polymerŽ .such as the draw axis for uniaxially stretched films alongwhich the electrodes should be oriented. The evaporatedelectrodes should have sufficient thickness to minimizetheir resistance. Otherwise, this resistance, together withthe sample capacitance, will give rise to a Debye relax-ation spectrum at high frequencies, leading to a substan-tial increase in the dielectric loss and reducing the overallsensitivity to detect small piezoelectric resonances. Spe-cial care should be taken to ensure a uniform samplethickness across the electroded area. Non-uniformities willlead to a dampened and broadened resonance spectrum,resulting in underestimated coupling factors k or k .t 31
A potential disadvantage of the resonance method is itslower sensitivity compared to the previously discussed me-chanical and interferometric techniques. This is due to thefact that the resonance amplitude is proportional to the
Ž Ž . Ž ..square of the coupling factor cf. equations 50 and 55Ž Ž . Ž . Ž ..and hence according to equations 35 , 39 and 41 to
the square of the piezoelectric coefficient. For small coef-ficients, the height of the resonance profile will thereforeapproach the resolution limit of the dielectric spectrome-ter, especially in the presence of high mechanical losses.Nevertheless, values as low as 2 pCrN have been success-
w x w xfully observed 61 . Ohigashi 32 estimated that piezoelec-tric resonances can be observed and analyzed if the quan-tity k2Q is larger than approx. 0.005. Here, Q repre-m m
sents the mechanical quality factor given by
cy1Q s tan s 77Ž .Ž . m m c
where tan is the mechanical loss tangent and c and cm
are the real and imaginary parts of the elastic stiffness.
4.4 ANALYSIS OF DIELECTRICRESONANCE DATA
The dielectric measurement yields the real and imagi-˜ ˜nary components of the impedance Z, admittance Y or
˜capacitance C. The former quantities are commonly usedŽin electrical engineering, while the latter or the permittiv-
ity, which for a parallel plate capacitor with an electrode˜ ˜ .area A is related to C via Cs Arh is the preferred33
representation in dielectric spectroscopy, since there is no˜inherent frequency dependence in C, whereas both
˜ ˜Ys iC 78Ž .and
y1˜ ˜Zs iC 79Ž .Ž .
are frequency-dependent even in the absence of molecu-lar relaxations or resonances.
1070-9878rrrrr1rrrrr$17.00 2003 IEEE852
49
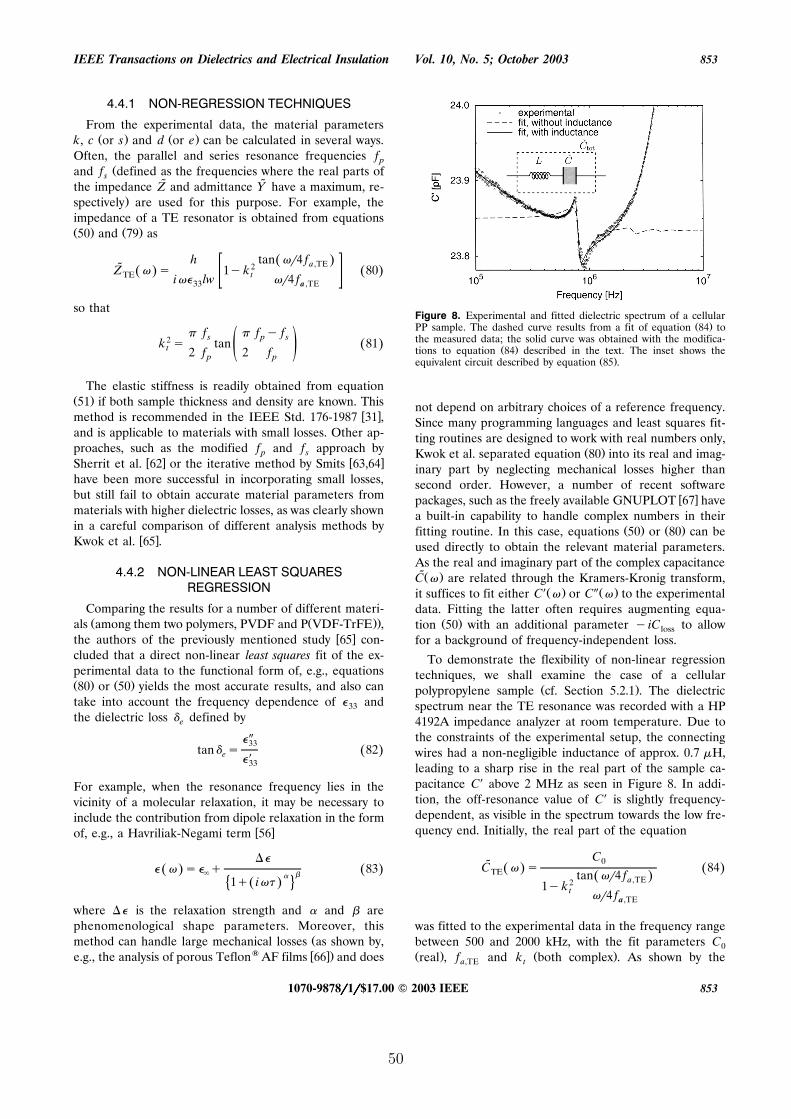
IEEE Transactions on Dielectrics and Electrical Insulation Vol. 10, No. 5; October 2003 853
4.4.1 NON-REGRESSION TECHNIQUES
From the experimental data, the material parametersŽ . Ž .k, c or s and d or e can be calculated in several ways.
Often, the parallel and series resonance frequencies fpŽand f defined as the frequencies where the real parts ofs
˜ ˜the impedance Z and admittance Y have a maximum, re-.spectively are used for this purpose. For example, the
impedance of a TE resonator is obtained from equationsŽ . Ž .50 and 79 as
h tan r4 fŽ .a,TE2Z s 1yk 80Ž . Ž .TE ti lw r4 f33 a ,TE
so that
f y f f p ss2k s tan 81Ž .t ž /2 f 2 fp p
The elastic stiffness is readily obtained from equationŽ .51 if both sample thickness and density are known. This
w xmethod is recommended in the IEEE Std. 176-1987 31 ,and is applicable to materials with small losses. Other ap-proaches, such as the modified f and f approach byp s
w x w xSherrit et al. 62 or the iterative method by Smits 63,64have been more successful in incorporating small losses,but still fail to obtain accurate material parameters frommaterials with higher dielectric losses, as was clearly shownin a careful comparison of different analysis methods by
w xKwok et al. 65 .
4.4.2 NON-LINEAR LEAST SQUARESREGRESSION
Comparing the results for a number of different materi-Ž Ž ..als among them two polymers, PVDF and P VDF-TrFE ,
w xthe authors of the previously mentioned study 65 con-cluded that a direct non-linear least squares fit of the ex-perimental data to the functional form of, e.g., equationsŽ . Ž .80 or 50 yields the most accurate results, and also cantake into account the frequency dependence of and33
the dielectric loss defined bye
33
tan s 82Ž .e 33
For example, when the resonance frequency lies in thevicinity of a molecular relaxation, it may be necessary toinclude the contribution from dipole relaxation in the form
w xof, e.g., a Havriliak-Negami term 56
s q 83Ž . Ž .
1q iŽ . 4
where is the relaxation strength and and arephenomenological shape parameters. Moreover, this
Žmethod can handle large mechanical losses as shown by, w x.e.g., the analysis of porous Teflon AF films 66 and does
Figure 8. Experimental and fitted dielectric spectrum of a cellularŽ .PP sample. The dashed curve results from a fit of equation 84 to
the measured data; the solid curve was obtained with the modifica-Ž .tions to equation 84 described in the text. The inset shows the
Ž .equivalent circuit described by equation 85 .
not depend on arbitrary choices of a reference frequency.Since many programming languages and least squares fit-ting routines are designed to work with real numbers only,
Ž .Kwok et al. separated equation 80 into its real and imag-inary part by neglecting mechanical losses higher thansecond order. However, a number of recent software
w xpackages, such as the freely available GNUPLOT 67 havea built-in capability to handle complex numbers in their
Ž . Ž .fitting routine. In this case, equations 50 or 80 can beused directly to obtain the relevant material parameters.As the real and imaginary part of the complex capacitanceŽ .C are related through the Kramers-Kronig transform,
Ž . Ž .it suffices to fit either C or C to the experimentaldata. Fitting the latter often requires augmenting equa-
Ž .tion 50 with an additional parameter y iC to allowloss
for a background of frequency-independent loss.
To demonstrate the flexibility of non-linear regressiontechniques, we shall examine the case of a cellular
Ž .polypropylene sample cf. Section 5.2.1 . The dielectricspectrum near the TE resonance was recorded with a HP4192A impedance analyzer at room temperature. Due tothe constraints of the experimental setup, the connectingwires had a non-negligible inductance of approx. 0.7 H,leading to a sharp rise in the real part of the sample ca-pacitance C above 2 MHz as seen in Figure 8. In addi-tion, the off-resonance value of C is slightly frequency-dependent, as visible in the spectrum towards the low fre-quency end. Initially, the real part of the equation
C0C s 84Ž . Ž .TE tan r4 fŽ .a,TE21ykt r4 fa,TE
was fitted to the experimental data in the frequency rangebetween 500 and 2000 kHz, with the fit parameters C0Ž . Ž .real , f and k both complex . As shown by thea,TE t
1070-9878rrrrr1rrrrr$17.00 2003 IEEE 853
50

Mellinger: Dielectric Resonance Spectroscopy: Versatile Tool in Quest for Better Piezoelectric Polymers854
dashed curve in Figure 8, agreement with the experimen-tal data was only fair. A significant improvement was ob-tained with two modifications:
A frequency-dependent C , as described by the poly-0
nomial
C sC 1qa logŽ .0 00 10 ž /½ 2 RRfa,TE
2
qb log10 ž / 52 RRfa,TE
with the phenomenological parameters a and b. The termsŽ .were chosen so that C sC when the frequency0 00
Ž .r2 equals the real part RRf of the anti-resonancea,TE
frequency. Inductance was taken into account by calculating the
effective capacitance
1C s 85Ž . Ž .tot y12 ˜y LqC Ž .TE
of an inductor in series with the sample capacitor, as de-picted in the inset of Figure 8.
Ž .With equation 85 as the new model function and afrequency-dependent C , there is good agreement be-0
tween the solid curve and the experimental data acrossthe entire recorded frequency range. The remaining devi-ation around 900 kHz most likely results from a non-uni-form sample thickness, thus stressing the need for high-quality samples.
4.4.3 EQUIVALENT CIRCUITS
Even though a least squares fit is the method of choicefor obtaining material parameters, it is sometimes advan-
Ž .tageous particularly for transducer applications to de-scribe the dielectric spectrum in terms of lumped circuit
w xmodels. The widely used Van Dyke circuit model 31shown in Figure 9a has four real circuit parameters. This
Ž .is insufficient to model the dielectric function 50 of apiezoelectric resonance which has three complex parame-
Ž .ters , c and k and hence six independent material33 33 tw xconstants. Recently, Sherrit et al. 68 successfully approx-
imated the piezoelectric resonance spectrum using a cir-cuit with three complex elements shown in Figure 9b.Their work gives conversion formulae between the lumpedconstants and the material parameters.
4.5 OTHER EXPERIMENTALTECHNIQUES
Although most dielectric spectroscopy experiments arecarried out in the frequency domain, experiments can and
w xhave also been performed in the time domain 55 . There-fore it is not surprising that time-domain techniques have
Figure 9. Lumped circuit models. a, Van Dyke model, where allcircuit elements are real; b, Butterworth circuit model with complex
w xcircuit elements 68 .
been successfully used to study the piezoelectric proper-ties of polymer films. When the opaque surface of a poly-mer sample is instantaneously heated by a fast laser pulseŽ .duration F10 ns , dampened oscillations are observed in
w xthe short-circuit current, as shown in Figure 10 69 . Caremust be taken, though, to separate the piezoelectric from
w xthe pyroelectric contribution 70 .
One limitation of the piezoelectric resonance techniqueis the fact that the elastic and piezoelectric material pa-rameters can only be determined at a fixed frequencywhich depends on the dimensions and elastic stiffness ofthe sample. In most cases, however, this is not a majorconcern since they exhibit only a weak frequency depen-
w xdence 71 . For samples with low mechanical losses, thefrequency dependence of the capacitance in the vicinity ofhigher odd-numbered harmonics may be used to obtainthese parameters at a number of different frequenciesfrom the same data. When the frequency dependence is amajor concern, several samples with different width orthickness must be analyzed. In addition, other techniques
Ž .such as surface acoustic waves SAW have successfullybeen used to determine material parameters at several
w xfrequencies for a single sample 71,72 .
5 POLYMER MATERIALS5.1 POLAR POLYMERS
( )5.1.1 POLY VINYLIDENE FLUORIDE AND ITSCOPOLYMERS
As mentioned earlier, the first report of piezoelectricresonances in polymer materials was in Ohigashi’s work
w xon PVDF 32 . The dielectric spectra were recorded in acryostat at temperatures between y170 and 100C. Usingdifferent sample geometries, the author was able to mea-
1070-9878rrrrr1rrrrr$17.00 2003 IEEE854
51
IEEE Transactions on Dielectrics and Electrical Insulation Vol. 10, No. 5; October 2003 855
Figure 10. Thermal pulse response of a charged cellular polypropy-lene film. Top: time domain signal; bottom: frequency domain re-
Ž .sponse fast Fourier transform of time domain signal . The transientsignal shows oscillations from TE, LE and WE resonances, as well as
w xa pyroelectric contribution 69 .
sure the temperature dependence of the piezoelectric co-efficients e , e , d and d , as well as of the elastic31 33 31 33
constants s and c and the coupling factors k , k11 33 31 33
and k . While k remained at a constant value of 0.1922 33
over a wide range of temperatures, k exhibited a strong31
increase above the glass transition temperature at approx.y40C. Since LE resonances parallel to the y or 2 axiswere very weak for PVDF stretched uniaxially in the xdirection, k and d were determined from samples cut32 32
at various angles with the x axis. The effective piezo-electric coefficient d and elastic compliance s E
are ex-31 1 1
pressed by
d sd cos2qd sin2 86Ž .31 31 32
and
s E s s E cos4q s E sin4q 2 s E q s E sin2 cos2 . 87Ž .Ž .1 1 11 22 12 16
A similar study, combined with quasistatic and interfer-w xometric measurements was done by Schewe 73 , who used
a lumped-circuit approach rather than hand-matching thematerial parameters.
Copolymerization of trifluoroethylene with vinylidenefluoride produces a random copolymer with piezoelectric
Ž .properties similar to PVDF. However, P VDF-TrFE isferroelectric directly after extrusion from the melt anddoes not require stretching. Also, it exhibits a Curie tem-
Žperature which depends on the TrFE content unlikePVDF, which melts before reaching the Curie tempera-
.ture . Generally, the piezoelectric coefficients and cou-pling constants are slightly larger than those found in
w xPVDF 74 . Even higher values were observed by OmoteŽ .et al. in ‘‘single crystalline’’ P VDF-TrFE formed by crys-
tallization of uniaxially stretched films under stress-freew xconditions 75 . The effects of electrode clamping on com-
Ž .mercial P VDF-TrFE tiles was studied by Sherrit et al.who compared the TE resonance spectra of flexiblecopolymer films to those of sandwich tiles with stiff elec-
w x Dtrodes 76 . They reported lower values of c and h , as33 33
well as a slight increase in , although they point out33
that these are only effective material constants for thecopolymer-electrode system.
Other shapes besides the usual planar geometries mayalso be investigated with the resonance technique. We-
w xgener and Gerhard-Multhaupt 36 studied the poling be-havior of commercial piezoelectric polymer cables made
Ž .of a P VDF-TrFE layer between an inner and outer con-Ž .ductor Figure 11 . The resonance spectra acquired at dif-
ferent temperatures are shown in Figure 12. For cablespoled under optimized conditions, only a weak decreasein d was observed between 30 and 120C, indicating a33
Ž .thermal stability similar to that of P VDF-TrFE films.
In addition to pure polymer films, ceramic-polymerŽ .composites such as lead zirconate titanate PZT rPVDF-
TrFE have been widely used in medical ultrasound imag-ing. Due to their complex geometry, coupling between dif-ferent modes of vibration must be taken into accountw x77,78 .
5.1.2 ODD-NUMBERED POLYAMIDES
Another class of ferroelectric polymers with greatpromise for transducer applications are odd-numbered
w xpolyamides 4 , also known under their trade nameNylon. While they do not yet offer the same piezoelec-tric coefficients as PVDF and its copolymers, they can be
w xFigure 11. Schematic view of a piezoelectric polymer cable 36 .
1070-9878rrrrr1rrrrr$17.00 2003 IEEE 855
52
Mellinger: Dielectric Resonance Spectroscopy: Versatile Tool in Quest for Better Piezoelectric Polymers856
Figure 12. Frequency-temperature map of the capacitance C for acommercial piezoelectric polymer cable. The TE resonance fre-
w xquency shifts from 5.2 MHz at 30C to 3.6 MHz at 120C 36 .
used at temperatures in excess of 200C without signifi-cant degradation. The highest d values were reported33
for films prepared by melt-quenching in ice water andsubsequent uniaxial stretching. Resonance spectroscopywas successfully applied to study the behavior of k andt
Q in both polyamide 7 and polyamide 11 at tempera-mw xtures between 20 and 160C 79 . With a value of about
0.11, the coupling factor k was lower than in PVDF, butt
stable up to 160C. Also, the lower mechanical quality fac-Žtor 8 in polyamide 7 and polyamide 11 compared to 25 in
.PVDF-TrFE offers a greater bandwidth for transducerapplications in an aqueous environment. Due to its higherremanent polarization, the coupling factor of polyamide 7was expected to be higher than that of polyamide 11. Thiswas not observed, although the authors note that an un-even film thickness could have affected the accuracy ofthe experiment. Very recently, Frubing et al. reported a¨mechanical quality factor of 11.5 in their own study of
w xmelt-quenched, cold-drawn polyamide 77 80 , which ap-pears to confirm the importance of thickness uniformity.They also reported a piezoelectric coefficient of 5.3 pCrNat room temperature, which rapidly dropped to 3.8 pCafter 30 min of annealing at 170C, but remained un-changed upon further annealing. This decrease was at-tributed to a thermally unstable rigid amorphous phasewhich manifests itself in the dielectric spectrum throughan relaxation above 90C.r
5.2 POROUS AND CELLULAR ELECTRETPOLYMERS
In recent years, a new group of non-polar porous orcellular space charge electrets has received much atten-tion in basic research as well as for transducer applica-
w xtions 20 . In contrast to polar non-porous polymers, theycontain no microscopic dipoles. Instead, symmetry break-
Figure 13. Schematic cross-section of a cellular polypropylene film.The charged voids act as macroscopic dipoles. Their flat shape givesrise to a low elastic stiffness c perpendicular to the film plane.33
ing occurs on a macroscopic scale, resulting from chargeseparation inside the voids and trapping at the internal
Ž .surfaces of the cellular structure cf. Figure 13 . Thechange in dipole moment upon application of a mechani-
Ž .cal stress on the polymer surfaces gives rise to the quasi-piezoelectric behavior of these materials. Several exam-ples will be discussed in this section.
5.2.1 CELLULAR POLYPROPYLENE
In cellular PP, which has become commercially avail-w xable in recent years 81 , a layer of biaxially stretched PP
foam with a thickness between 30 and 120 m is sand-wiched between thin, non-porous PP films. The lens-likevoids in the inner layer are between 10 and 100 m long,but only a few m thick, resulting in a substantial
w xanisotropy in the elastic stiffness 61 . While the in-planestiffness does not substantially differ from that of thecompact polymer, the c elastic stiffness is only 2.2 MPa.33
Several types of PP foams with different thickness and voidŽsizes have been developed by VTT Processes formerly
. w xVTT Chemical Technology 82 .
The cellular PP films are electrically charged in a coronadischarge, where the high electric field leads to Paschenbreakdown inside the voids. This was recently demon-strated by recording the electroluminescence during
w xcharging using a bipolar poling field 46 . The assumedcharging process of the internal surfaces was proved byimaging the charge distribution in obliquely cut cross sec-tions of a charged film using a scanning electron micro-
w xscope 83 . For the most sensitive HS01 type of cellularPP, electrical charging with a point-to-plane corona charg-ing technique at normal atmosphere and room tempera-ture yields quasistatic and dynamic d coefficients of 25033
w xpCrN and 140 pCrN, respectively 59,84 . These valuesare around ten times higher than the piezoelectric activityfound in PVDF, and can be enhanced up to 790 pCrN ifthe samples are treated in dielectric gases during or be-
w xfore corona charging 85 . The high d coefficients are33
the result of the low elastic modulus in the z direction.Ž Ž ..Since e fd c cf. equation 42 , it is evident from33 33 33
Table 3 that even though the stress coefficient e is 2333
1070-9878rrrrr1rrrrr$17.00 2003 IEEE856
53
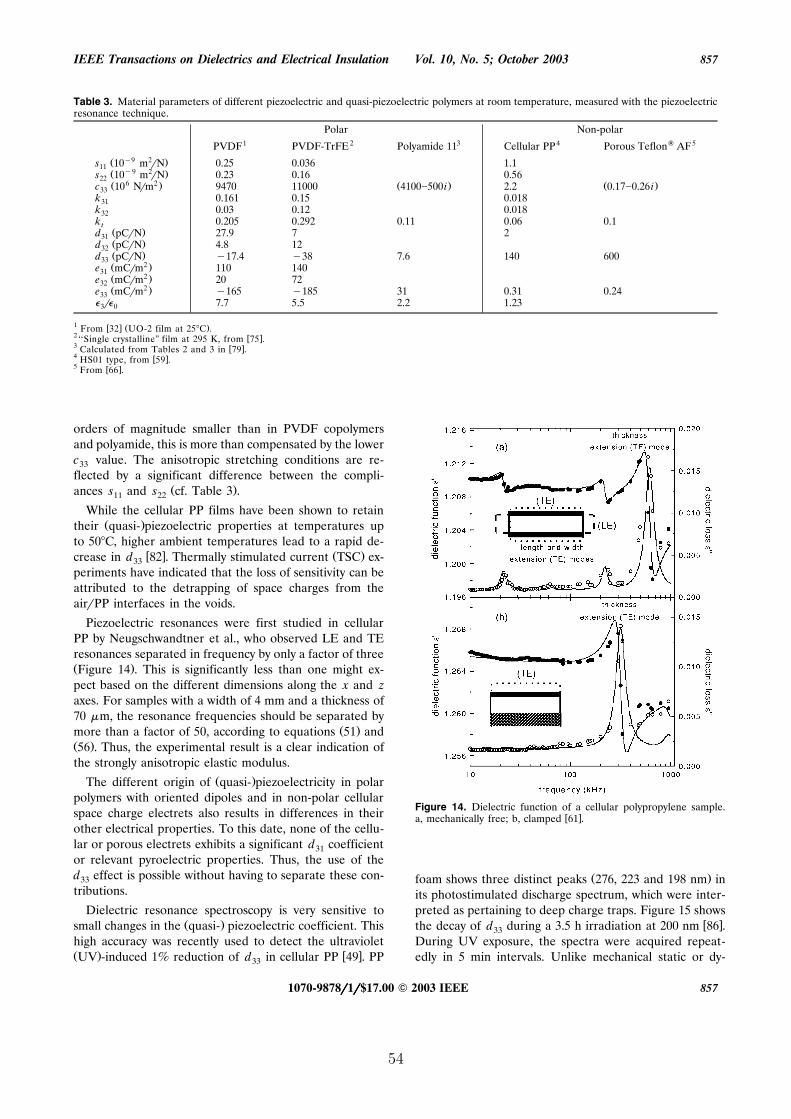
IEEE Transactions on Dielectrics and Electrical Insulation Vol. 10, No. 5; October 2003 857
Table 3. Material parameters of different piezoelectric and quasi-piezoelectric polymers at room temperature, measured with the piezoelectricresonance technique.
Polar Non-polar1 2 3 4 5PVDF PVDF-TrFE Polyamide 11 Cellular PP Porous Teflon AF
y9 2Ž .s 10 m rN 0.25 0.036 1.111y9 2Ž .s 10 m rN 0.23 0.16 0.56226 2Ž . Ž . Ž .c 10 Nrm 9470 11000 4100500 i 2.2 0.170.26 i33
k 0.161 0.15 0.01831k 0.03 0.12 0.01832k 0.205 0.292 0.11 0.06 0.1t
Ž .d pCrN 27.9 7 231Ž .d pCrN 4.8 1232Ž .d pCrN y17.4 y38 7.6 140 60033
2Ž .e mCrm 110 140312Ž .e mCrm 20 72322Ž .e mCrm y165 y185 31 0.31 0.2433
r 7.7 5.5 2.2 1.233 0
1 w x Ž .From 32 UO-2 film at 25C .2 w x‘‘Single crystalline’’ film at 295 K, from 75 .3 w xCalculated from Tables 2 and 3 in 79 .4 w xHS01 type, from 59 .5 w xFrom 66 .
orders of magnitude smaller than in PVDF copolymersand polyamide, this is more than compensated by the lowerc value. The anisotropic stretching conditions are re-33
flected by a significant difference between the compli-Ž .ances s and s cf. Table 3 .11 22
While the cellular PP films have been shown to retainŽ .their quasi- piezoelectric properties at temperatures up
to 50C, higher ambient temperatures lead to a rapid de-w x Ž .crease in d 82 . Thermally stimulated current TSC ex-33
periments have indicated that the loss of sensitivity can beattributed to the detrapping of space charges from theairrPP interfaces in the voids.
Piezoelectric resonances were first studied in cellularPP by Neugschwandtner et al., who observed LE and TEresonances separated in frequency by only a factor of threeŽ .Figure 14 . This is significantly less than one might ex-pect based on the different dimensions along the x and zaxes. For samples with a width of 4 mm and a thickness of70 m, the resonance frequencies should be separated by
Ž .more than a factor of 50, according to equations 51 andŽ .56 . Thus, the experimental result is a clear indication ofthe strongly anisotropic elastic modulus.
Ž .The different origin of quasi- piezoelectricity in polarpolymers with oriented dipoles and in non-polar cellularspace charge electrets also results in differences in theirother electrical properties. To this date, none of the cellu-lar or porous electrets exhibits a significant d coefficient31
or relevant pyroelectric properties. Thus, the use of thed effect is possible without having to separate these con-33
tributions.
Dielectric resonance spectroscopy is very sensitive toŽ .small changes in the quasi- piezoelectric coefficient. This
high accuracy was recently used to detect the ultravioletŽ . w xUV -induced 1% reduction of d in cellular PP 49 . PP33
Figure 14. Dielectric function of a cellular polypropylene sample.w xa, mechanically free; b, clamped 61 .
Ž .foam shows three distinct peaks 276, 223 and 198 nm inits photostimulated discharge spectrum, which were inter-preted as pertaining to deep charge traps. Figure 15 shows
w xthe decay of d during a 3.5 h irradiation at 200 nm 86 .33
During UV exposure, the spectra were acquired repeat-edly in 5 min intervals. Unlike mechanical static or dy-
1070-9878rrrrr1rrrrr$17.00 2003 IEEE 857
54
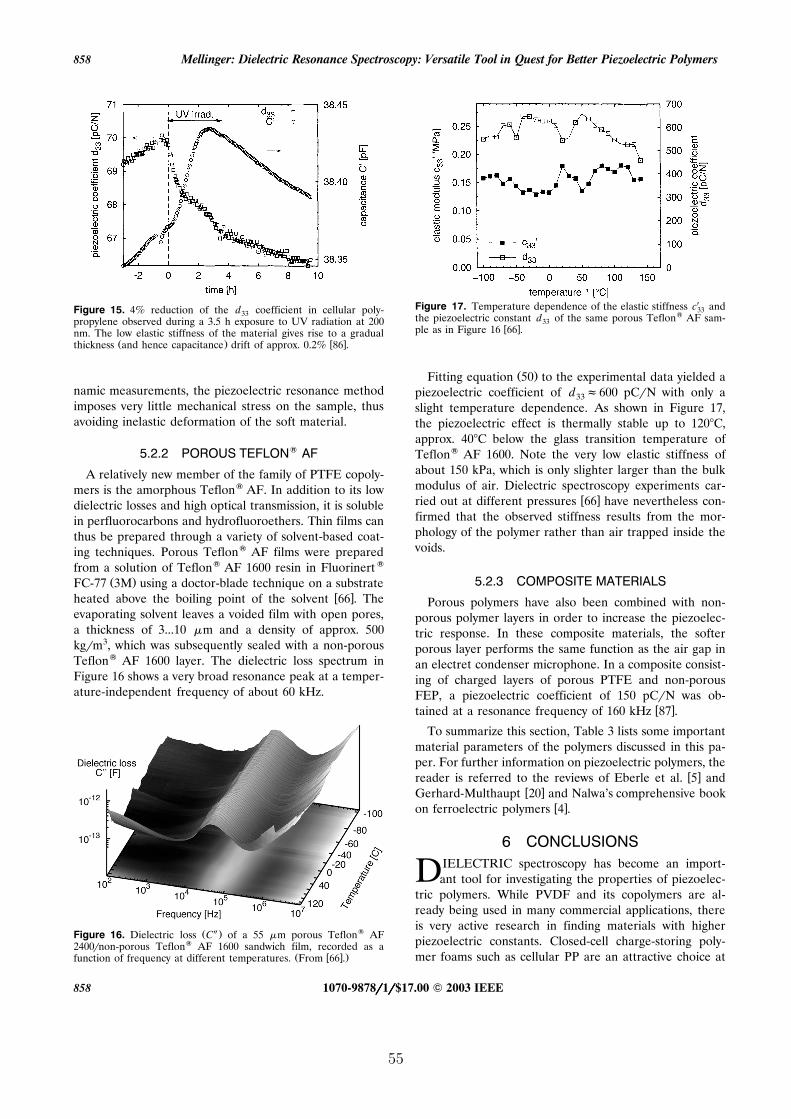
Mellinger: Dielectric Resonance Spectroscopy: Versatile Tool in Quest for Better Piezoelectric Polymers858
Figure 15. 4% reduction of the d coefficient in cellular poly-33propylene observed during a 3.5 h exposure to UV radiation at 200nm. The low elastic stiffness of the material gives rise to a gradual
Ž . w xthickness and hence capacitance drift of approx. 0.2% 86 .
namic measurements, the piezoelectric resonance methodimposes very little mechanical stress on the sample, thusavoiding inelastic deformation of the soft material.
5.2.2 POROUS TEFLON AF
A relatively new member of the family of PTFE copoly-mers is the amorphous Teflon AF. In addition to its lowdielectric losses and high optical transmission, it is solublein perfluorocarbons and hydrofluoroethers. Thin films canthus be prepared through a variety of solvent-based coat-ing techniques. Porous Teflon AF films were preparedfrom a solution of Teflon AF 1600 resin in Fluorinert
Ž .FC-77 3M using a doctor-blade technique on a substratew xheated above the boiling point of the solvent 66 . The
evaporating solvent leaves a voided film with open pores,a thickness of 3...10 m and a density of approx. 500kgrm3, which was subsequently sealed with a non-porousTeflon AF 1600 layer. The dielectric loss spectrum inFigure 16 shows a very broad resonance peak at a temper-ature-independent frequency of about 60 kHz.
Ž . Figure 16. Dielectric loss C of a 55 m porous Teflon AF2400rnon-porous Teflon AF 1600 sandwich film, recorded as a
Ž w x .function of frequency at different temperatures. From 66 .
Figure 17. Temperature dependence of the elastic stiffness c and33the piezoelectric constant d of the same porous Teflon AF sam-33
w xple as in Figure 16 66 .
Ž .Fitting equation 50 to the experimental data yielded apiezoelectric coefficient of d f600 pCrN with only a33
slight temperature dependence. As shown in Figure 17,the piezoelectric effect is thermally stable up to 120C,approx. 40C below the glass transition temperature ofTeflon AF 1600. Note the very low elastic stiffness ofabout 150 kPa, which is only slighter larger than the bulkmodulus of air. Dielectric spectroscopy experiments car-
w xried out at different pressures 66 have nevertheless con-firmed that the observed stiffness results from the mor-phology of the polymer rather than air trapped inside thevoids.
5.2.3 COMPOSITE MATERIALS
Porous polymers have also been combined with non-porous polymer layers in order to increase the piezoelec-tric response. In these composite materials, the softerporous layer performs the same function as the air gap inan electret condenser microphone. In a composite consist-ing of charged layers of porous PTFE and non-porousFEP, a piezoelectric coefficient of 150 pCrN was ob-
w xtained at a resonance frequency of 160 kHz 87 .
To summarize this section, Table 3 lists some importantmaterial parameters of the polymers discussed in this pa-per. For further information on piezoelectric polymers, the
w xreader is referred to the reviews of Eberle et al. 5 andw xGerhard-Multhaupt 20 and Nalwa’s comprehensive book
w xon ferroelectric polymers 4 .
6 CONCLUSIONSIELECTRIC spectroscopy has become an import-Dant tool for investigating the properties of piezoelec-
tric polymers. While PVDF and its copolymers are al-ready being used in many commercial applications, thereis very active research in finding materials with higherpiezoelectric constants. Closed-cell charge-storing poly-mer foams such as cellular PP are an attractive choice at
1070-9878rrrrr1rrrrr$17.00 2003 IEEE858
55
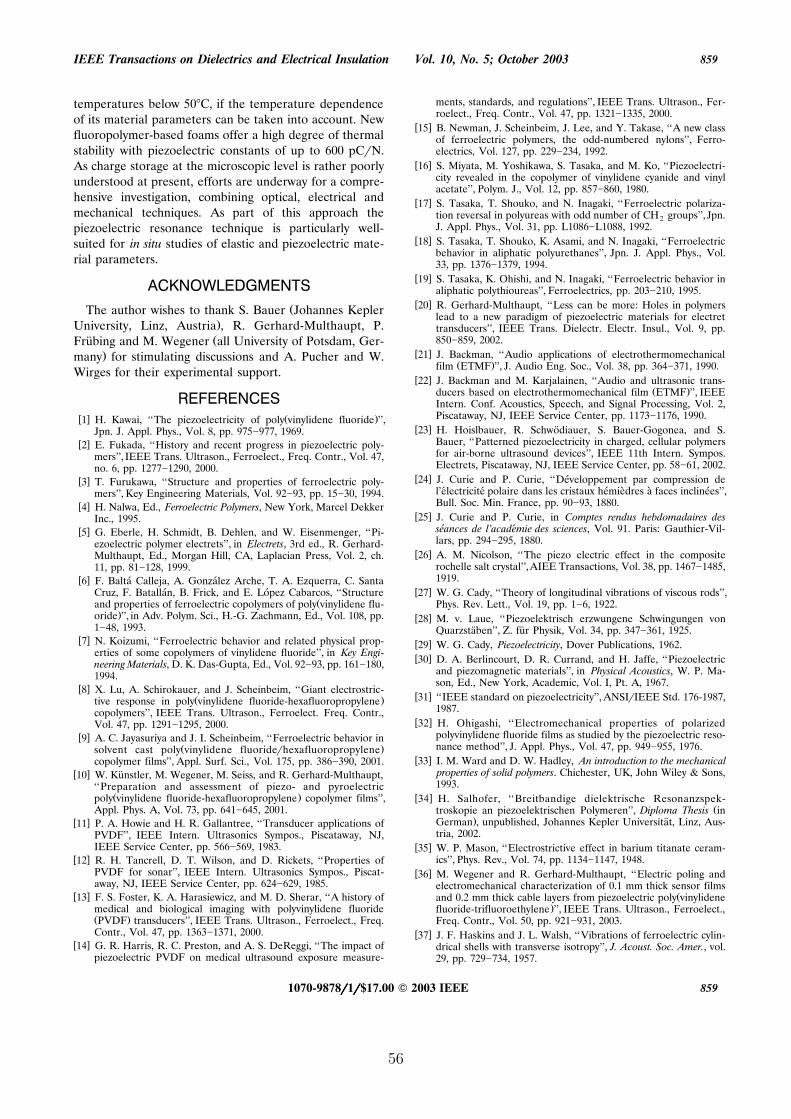
IEEE Transactions on Dielectrics and Electrical Insulation Vol. 10, No. 5; October 2003 859
temperatures below 50C, if the temperature dependenceof its material parameters can be taken into account. Newfluoropolymer-based foams offer a high degree of thermalstability with piezoelectric constants of up to 600 pCrN.As charge storage at the microscopic level is rather poorlyunderstood at present, efforts are underway for a compre-hensive investigation, combining optical, electrical andmechanical techniques. As part of this approach thepiezoelectric resonance technique is particularly well-suited for in situ studies of elastic and piezoelectric mate-rial parameters.
ACKNOWLEDGMENTSŽThe author wishes to thank S. Bauer Johannes Kepler
.University, Linz, Austria , R. Gerhard-Multhaupt, P.ŽFrubing and M. Wegener all University of Potsdam, Ger-¨
.many for stimulating discussions and A. Pucher and W.Wirges for their experimental support.
REFERENCESw x Ž .1 H. Kawai, ‘‘The piezoelectricity of poly vinylidene fluoride ’’,
Jpn. J. Appl. Phys., Vol. 8, pp. 975977, 1969.w x2 E. Fukada, ‘‘History and recent progress in piezoelectric poly-
mers’’, IEEE Trans. Ultrason., Ferroelect., Freq. Contr., Vol. 47,no. 6, pp. 12771290, 2000.
w x3 T. Furukawa, ‘‘Structure and properties of ferroelectric poly-mers’’, Key Engineering Materials, Vol. 9293, pp. 1530, 1994.
w x4 H. Nalwa, Ed., Ferroelectric Polymers, New York, Marcel DekkerInc., 1995.
w x5 G. Eberle, H. Schmidt, B. Dehlen, and W. Eisenmenger, ‘‘Pi-ezoelectric polymer electrets’’, in Electrets, 3rd ed., R. Gerhard-Multhaupt, Ed., Morgan Hill, CA, Laplacian Press, Vol. 2, ch.11, pp. 81128, 1999.
w x6 F. Balta Calleja, A. Gonzalez Arche, T. A. Ezquerra, C. Santa´ ´Cruz, F. Batallan, B. Frick, and E. Lopez Cabarcos, ‘‘Structure´ ´
Žand properties of ferroelectric copolymers of poly vinylidene flu-.oride ’’, in Adv. Polym. Sci., H.-G. Zachmann, Ed., Vol. 108, pp.
148, 1993.w x7 N. Koizumi, ‘‘Ferroelectric behavior and related physical prop-
erties of some copolymers of vinylidene fluoride’’, in Key Engi-neering Materials, D. K. Das-Gupta, Ed., Vol. 9293, pp. 161180,1994.
w x8 X. Lu, A. Schirokauer, and J. Scheinbeim, ‘‘Giant electrostric-Ž .tive response in poly vinylidene fluoride-hexafluoropropylene
copolymers’’, IEEE Trans. Ultrason., Ferroelect. Freq. Contr.,Vol. 47, pp. 12911295, 2000.
w x9 A. C. Jayasuriya and J. I. Scheinbeim, ‘‘Ferroelectric behavior inŽ .solvent cast poly vinylidene fluoriderhexafluoropropylene
copolymer films’’, Appl. Surf. Sci., Vol. 175, pp. 386390, 2001.w x10 W. Kunstler, M. Wegener, M. Seiss, and R. Gerhard-Multhaupt,¨
‘‘Preparation and assessment of piezo- and pyroelectricŽ .poly vinylidene fluoride-hexafluoropropylene copolymer films’’,
Appl. Phys. A, Vol. 73, pp. 641645, 2001.w x11 P. A. Howie and H. R. Gallantree, ‘‘Transducer applications of
PVDF’’, IEEE Intern. Ultrasonics Sympos., Piscataway, NJ,IEEE Service Center, pp. 566569, 1983.
w x12 R. H. Tancrell, D. T. Wilson, and D. Rickets, ‘‘Properties ofPVDF for sonar’’, IEEE Intern. Ultrasonics Sympos., Piscat-away, NJ, IEEE Service Center, pp. 624629, 1985.
w x13 F. S. Foster, K. A. Harasiewicz, and M. D. Sherar, ‘‘A history ofmedical and biological imaging with polyvinylidene fluorideŽ .PVDF transducers’’, IEEE Trans. Ultrason., Ferroelect., Freq.Contr., Vol. 47, pp. 13631371, 2000.
w x14 G. R. Harris, R. C. Preston, and A. S. DeReggi, ‘‘The impact ofpiezoelectric PVDF on medical ultrasound exposure measure-
ments, standards, and regulations’’, IEEE Trans. Ultrason., Fer-roelect., Freq. Contr., Vol. 47, pp. 13211335, 2000.
w x15 B. Newman, J. Scheinbeim, J. Lee, and Y. Takase, ‘‘A new classof ferroelectric polymers, the odd-numbered nylons’’, Ferro-electrics, Vol. 127, pp. 229234, 1992.
w x16 S. Miyata, M. Yoshikawa, S. Tasaka, and M. Ko, ‘‘Piezoelectri-city revealed in the copolymer of vinylidene cyanide and vinylacetate’’, Polym. J., Vol. 12, pp. 857860, 1980.
w x17 S. Tasaka, T. Shouko, and N. Inagaki, ‘‘Ferroelectric polariza-tion reversal in polyureas with odd number of CH groups’’, Jpn.2J. Appl. Phys., Vol. 31, pp. L1086L1088, 1992.
w x18 S. Tasaka, T. Shouko, K. Asami, and N. Inagaki, ‘‘Ferroelectricbehavior in aliphatic polyurethanes’’, Jpn. J. Appl. Phys., Vol.33, pp. 13761379, 1994.
w x19 S. Tasaka, K. Ohishi, and N. Inagaki, ‘‘Ferroelectric behavior inaliphatic polythioureas’’, Ferroelectrics, pp. 203210, 1995.
w x20 R. Gerhard-Multhaupt, ‘‘Less can be more: Holes in polymerslead to a new paradigm of piezoelectric materials for electrettransducers’’, IEEE Trans. Dielectr. Electr. Insul., Vol. 9, pp.850859, 2002.
w x21 J. Backman, ‘‘Audio applications of electrothermomechanicalŽ .film ETMF ’’, J. Audio Eng. Soc., Vol. 38, pp. 364371, 1990.
w x22 J. Backman and M. Karjalainen, ‘‘Audio and ultrasonic trans-Ž .ducers based on electrothermomechanical film ETMF ’’, IEEE
Intern. Conf. Acoustics, Speech, and Signal Processing, Vol. 2,Piscataway, NJ, IEEE Service Center, pp. 11731176, 1990.
w x23 H. Hoislbauer, R. Schwodiauer, S. Bauer-Gogonea, and S.¨Bauer, ‘‘Patterned piezoelectricity in charged, cellular polymersfor air-borne ultrasound devices’’, IEEE 11th Intern. Sympos.Electrets, Piscataway, NJ, IEEE Service Center, pp. 5861, 2002.
w x24 J. Curie and P. Curie, ‘‘Developpement par compression de´l’electricite polaire dans les cristaux hemiedres a faces inclinees’’,´ ´ ´ ` ` ´Bull. Soc. Min. France, pp. 9093, 1880.
w x25 J. Curie and P. Curie, in Comptes rendus hebdomadaires desseances de l’academie des sciences, Vol. 91. Paris: Gauthier-Vil-´ ´lars, pp. 294295, 1880.
w x26 A. M. Nicolson, ‘‘The piezo electric effect in the compositerochelle salt crystal’’,AIEE Transactions, Vol. 38, pp. 14671485,1919.
w x27 W. G. Cady, ‘‘Theory of longitudinal vibrations of viscous rods’’,Phys. Rev. Lett., Vol. 19, pp. 16, 1922.
w x28 M. v. Laue, ‘‘Piezoelektrisch erzwungene Schwingungen vonQuarzstaben’’, Z. fur Physik, Vol. 34, pp. 347361, 1925.¨ ¨
w x29 W. G. Cady, Piezoelectricity, Dover Publications, 1962.w x30 D. A. Berlincourt, D. R. Currand, and H. Jaffe, ‘‘Piezoelectric
and piezomagnetic materials’’, in Physical Acoustics, W. P. Ma-son, Ed., New York, Academic, Vol. I, Pt. A, 1967.
w x31 ‘‘IEEE standard on piezoelectricity’’, ANSIrIEEE Std. 176-1987,1987.
w x32 H. Ohigashi, ‘‘Electromechanical properties of polarizedpolyvinylidene fluoride films as studied by the piezoelectric reso-nance method’’, J. Appl. Phys., Vol. 47, pp. 949955, 1976.
w x33 I. M. Ward and D. W. Hadley, An introduction to the mechanicalproperties of solid polymers. Chichester, UK, John Wiley & Sons,1993.
w x34 H. Salhofer, ‘‘Breitbandige dielektrische Resonanzspek-Žtroskopie an piezoelektrischen Polymeren’’, Diploma Thesis in
.German , unpublished, Johannes Kepler Universitat, Linz, Aus-¨tria, 2002.
w x35 W. P. Mason, ‘‘Electrostrictive effect in barium titanate ceram-ics’’, Phys. Rev., Vol. 74, pp. 11341147, 1948.
w x36 M. Wegener and R. Gerhard-Multhaupt, ‘‘Electric poling andelectromechanical characterization of 0.1 mm thick sensor films
Žand 0.2 mm thick cable layers from piezoelectric poly vinylidene.fluoride-trifluoroethylene ’’, IEEE Trans. Ultrason., Ferroelect.,
Freq. Contr., Vol. 50, pp. 921931, 2003.w x37 J. F. Haskins and J. L. Walsh, ‘‘Vibrations of ferroelectric cylin-
drical shells with transverse isotropy’’, J. Acoust. Soc. Amer., vol.29, pp. 729734, 1957.
1070-9878rrrrr1rrrrr$17.00 2003 IEEE 859
56
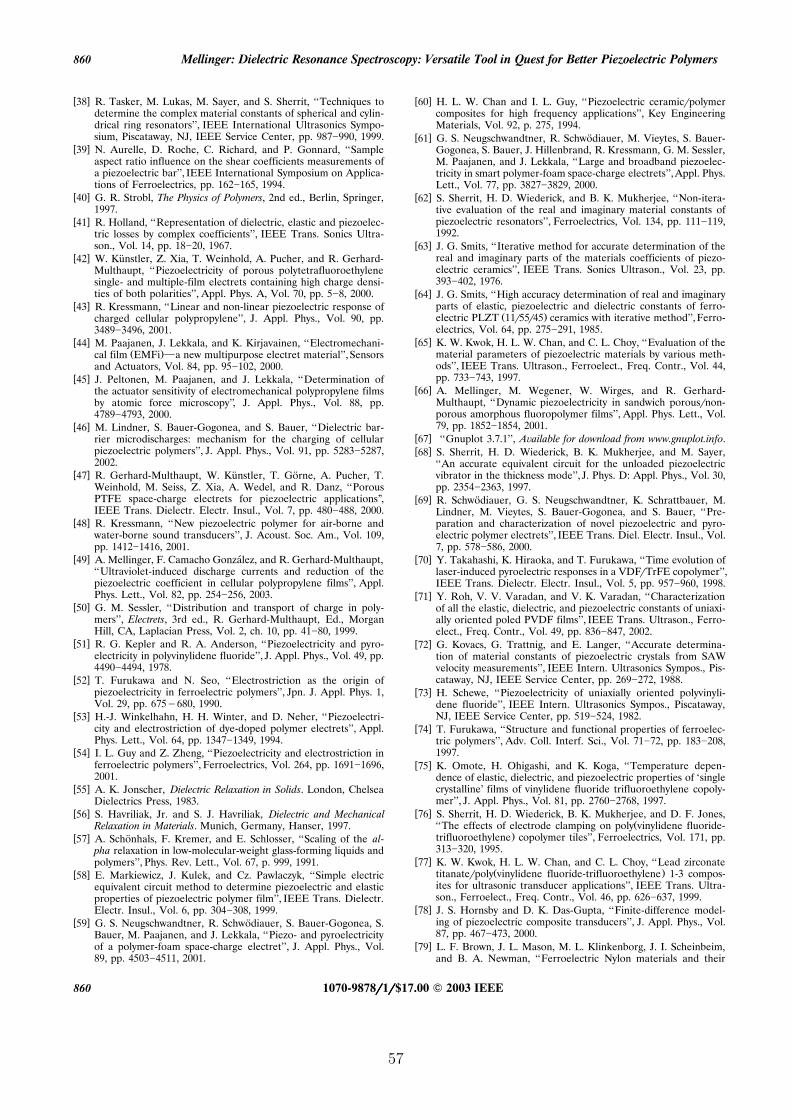
Mellinger: Dielectric Resonance Spectroscopy: Versatile Tool in Quest for Better Piezoelectric Polymers860
w x38 R. Tasker, M. Lukas, M. Sayer, and S. Sherrit, ‘‘Techniques todetermine the complex material constants of spherical and cylin-drical ring resonators’’, IEEE International Ultrasonics Sympo-sium, Piscataway, NJ, IEEE Service Center, pp. 987990, 1999.
w x39 N. Aurelle, D. Roche, C. Richard, and P. Gonnard, ‘‘Sampleaspect ratio influence on the shear coefficients measurements ofa piezoelectric bar’’, IEEE International Symposium on Applica-tions of Ferroelectrics, pp. 162165, 1994.
w x40 G. R. Strobl, The Physics of Polymers, 2nd ed., Berlin, Springer,1997.
w x41 R. Holland, ‘‘Representation of dielectric, elastic and piezoelec-tric losses by complex coefficients’’, IEEE Trans. Sonics Ultra-son., Vol. 14, pp. 1820, 1967.
w x42 W. Kunstler, Z. Xia, T. Weinhold, A. Pucher, and R. Gerhard-¨Multhaupt, ‘‘Piezoelectricity of porous polytetrafluoroethylenesingle- and multiple-film electrets containing high charge densi-ties of both polarities’’, Appl. Phys. A, Vol. 70, pp. 58, 2000.
w x43 R. Kressmann, ‘‘Linear and non-linear piezoelectric response ofcharged cellular polypropylene’’, J. Appl. Phys., Vol. 90, pp.34893496, 2001.
w x44 M. Paajanen, J. Lekkala, and K. Kirjavainen, ‘‘Electromechani-Ž .cal film EMFi a new multipurpose electret material’’, Sensors
and Actuators, Vol. 84, pp. 95102, 2000.w x45 J. Peltonen, M. Paajanen, and J. Lekkala, ‘‘Determination of
the actuator sensitivity of electromechanical polypropylene filmsby atomic force microscopy’’, J. Appl. Phys., Vol. 88, pp.47894793, 2000.
w x46 M. Lindner, S. Bauer-Gogonea, and S. Bauer, ‘‘Dielectric bar-rier microdischarges: mechanism for the charging of cellularpiezoelectric polymers’’, J. Appl. Phys., Vol. 91, pp. 52835287,2002.
w x47 R. Gerhard-Multhaupt, W. Kunstler, T. Gorne, A. Pucher, T.¨ ¨Weinhold, M. Seiss, Z. Xia, A. Wedel, and R. Danz, ‘‘PorousPTFE space-charge electrets for piezoelectric applications’’,IEEE Trans. Dielectr. Electr. Insul., Vol. 7, pp. 480488, 2000.
w x48 R. Kressmann, ‘‘New piezoelectric polymer for air-borne andwater-borne sound transducers’’, J. Acoust. Soc. Am., Vol. 109,pp. 14121416, 2001.
w x49 A. Mellinger, F. Camacho Gonzalez, and R. Gerhard-Multhaupt,´‘‘Ultraviolet-induced discharge currents and reduction of thepiezoelectric coefficient in cellular polypropylene films’’, Appl.Phys. Lett., Vol. 82, pp. 254256, 2003.
w x50 G. M. Sessler, ‘‘Distribution and transport of charge in poly-mers’’, Electrets, 3rd ed., R. Gerhard-Multhaupt, Ed., MorganHill, CA, Laplacian Press, Vol. 2, ch. 10, pp. 4180, 1999.
w x51 R. G. Kepler and R. A. Anderson, ‘‘Piezoelectricity and pyro-electricity in polyvinylidene fluoride’’, J. Appl. Phys., Vol. 49, pp.44904494, 1978.
w x52 T. Furukawa and N. Seo, ‘‘Electrostriction as the origin ofpiezoelectricity in ferroelectric polymers’’, Jpn. J. Appl. Phys. 1,Vol. 29, pp. 675y680, 1990.
w x53 H.-J. Winkelhahn, H. H. Winter, and D. Neher, ‘‘Piezoelectri-city and electrostriction of dye-doped polymer electrets’’, Appl.Phys. Lett., Vol. 64, pp. 13471349, 1994.
w x54 I. L. Guy and Z. Zheng, ‘‘Piezoelectricity and electrostriction inferroelectric polymers’’, Ferroelectrics, Vol. 264, pp. 16911696,2001.
w x55 A. K. Jonscher, Dielectric Relaxation in Solids. London, ChelseaDielectrics Press, 1983.
w x56 S. Havriliak, Jr. and S. J. Havriliak, Dielectric and MechanicalRelaxation in Materials. Munich, Germany, Hanser, 1997.
w x57 A. Schonhals, F. Kremer, and E. Schlosser, ‘‘Scaling of the al-¨pha relaxation in low-molecular-weight glass-forming liquids andpolymers’’, Phys. Rev. Lett., Vol. 67, p. 999, 1991.
w x58 E. Markiewicz, J. Kulek, and Cz. Pawlaczyk, ‘‘Simple electricequivalent circuit method to determine piezoelectric and elasticproperties of piezoelectric polymer film’’, IEEE Trans. Dielectr.Electr. Insul., Vol. 6, pp. 304308, 1999.
w x59 G. S. Neugschwandtner, R. Schwodiauer, S. Bauer-Gogonea, S.¨Bauer, M. Paajanen, and J. Lekkala, ‘‘Piezo- and pyroelectricityof a polymer-foam space-charge electret’’, J. Appl. Phys., Vol.89, pp. 45034511, 2001.
w x60 H. L. W. Chan and I. L. Guy, ‘‘Piezoelectric ceramicrpolymercomposites for high frequency applications’’, Key EngineeringMaterials, Vol. 92, p. 275, 1994.
w x61 G. S. Neugschwandtner, R. Schwodiauer, M. Vieytes, S. Bauer-¨Gogonea, S. Bauer, J. Hillenbrand, R. Kressmann, G. M. Sessler,M. Paajanen, and J. Lekkala, ‘‘Large and broadband piezoelec-tricity in smart polymer-foam space-charge electrets’’,Appl. Phys.Lett., Vol. 77, pp. 38273829, 2000.
w x62 S. Sherrit, H. D. Wiederick, and B. K. Mukherjee, ‘‘Non-itera-tive evaluation of the real and imaginary material constants ofpiezoelectric resonators’’, Ferroelectrics, Vol. 134, pp. 111119,1992.
w x63 J. G. Smits, ‘‘Iterative method for accurate determination of thereal and imaginary parts of the materials coefficients of piezo-electric ceramics’’, IEEE Trans. Sonics Ultrason., Vol. 23, pp.393402, 1976.
w x64 J. G. Smits, ‘‘High accuracy determination of real and imaginaryparts of elastic, piezoelectric and dielectric constants of ferro-
Ž .electric PLZT 11r55r45 ceramics with iterative method’’, Ferro-electrics, Vol. 64, pp. 275291, 1985.
w x65 K. W. Kwok, H. L. W. Chan, and C. L. Choy, ‘‘Evaluation of thematerial parameters of piezoelectric materials by various meth-ods’’, IEEE Trans. Ultrason., Ferroelect., Freq. Contr., Vol. 44,pp. 733743, 1997.
w x66 A. Mellinger, M. Wegener, W. Wirges, and R. Gerhard-Multhaupt, ‘‘Dynamic piezoelectricity in sandwich porousrnon-porous amorphous fluoropolymer films’’, Appl. Phys. Lett., Vol.79, pp. 18521854, 2001.
w x67 ‘‘Gnuplot 3.7.1’’, A®ailable for download from www.gnuplot.info.w x68 S. Sherrit, H. D. Wiederick, B. K. Mukherjee, and M. Sayer,
‘‘An accurate equivalent circuit for the unloaded piezoelectricvibrator in the thickness mode’’, J. Phys. D: Appl. Phys., Vol. 30,pp. 23542363, 1997.
w x69 R. Schwodiauer, G. S. Neugschwandtner, K. Schrattbauer, M.¨Lindner, M. Vieytes, S. Bauer-Gogonea, and S. Bauer, ‘‘Pre-paration and characterization of novel piezoelectric and pyro-electric polymer electrets’’, IEEE Trans. Diel. Electr. Insul., Vol.7, pp. 578586, 2000.
w x70 Y. Takahashi, K. Hiraoka, and T. Furukawa, ‘‘Time evolution oflaser-induced pyroelectric responses in a VDFrTrFE copolymer’’,IEEE Trans. Dielectr. Electr. Insul., Vol. 5, pp. 957960, 1998.
w x71 Y. Roh, V. V. Varadan, and V. K. Varadan, ‘‘Characterizationof all the elastic, dielectric, and piezoelectric constants of uniaxi-ally oriented poled PVDF films’’, IEEE Trans. Ultrason., Ferro-elect., Freq. Contr., Vol. 49, pp. 836847, 2002.
w x72 G. Kovacs, G. Trattnig, and E. Langer, ‘‘Accurate determina-tion of material constants of piezoelectric crystals from SAWvelocity measurements’’, IEEE Intern. Ultrasonics Sympos., Pis-cataway, NJ, IEEE Service Center, pp. 269272, 1988.
w x73 H. Schewe, ‘‘Piezoelectricity of uniaxially oriented polyvinyli-dene fluoride’’, IEEE Intern. Ultrasonics Sympos., Piscataway,NJ, IEEE Service Center, pp. 519524, 1982.
w x74 T. Furukawa, ‘‘Structure and functional properties of ferroelec-tric polymers’’, Adv. Coll. Interf. Sci., Vol. 7172, pp. 183208,1997.
w x75 K. Omote, H. Ohigashi, and K. Koga, ‘‘Temperature depen-dence of elastic, dielectric, and piezoelectric properties of ‘singlecrystalline’ films of vinylidene fluoride trifluoroethylene copoly-mer’’, J. Appl. Phys., Vol. 81, pp. 27602768, 1997.
w x76 S. Sherrit, H. D. Wiederick, B. K. Mukherjee, and D. F. Jones,Ž‘‘The effects of electrode clamping on poly vinylidene fluoride-
.trifluoroethylene copolymer tiles’’, Ferroelectrics, Vol. 171, pp.313320, 1995.
w x77 K. W. Kwok, H. L. W. Chan, and C. L. Choy, ‘‘Lead zirconateŽ .titanaterpoly vinylidene fluoride-trifluoroethylene 1-3 compos-
ites for ultrasonic transducer applications’’, IEEE Trans. Ultra-son., Ferroelect., Freq. Contr., Vol. 46, pp. 626637, 1999.
w x78 J. S. Hornsby and D. K. Das-Gupta, ‘‘Finite-difference model-ing of piezoelectric composite transducers’’, J. Appl. Phys., Vol.87, pp. 467473, 2000.
w x79 L. F. Brown, J. L. Mason, M. L. Klinkenborg, J. I. Scheinbeim,and B. A. Newman, ‘‘Ferroelectric Nylon materials and their
1070-9878rrrrr1rrrrr$17.00 2003 IEEE860
57
IEEE Transactions on Dielectrics and Electrical Insulation Vol. 10, No. 5; October 2003 861
feasibility for ultrasound transducers’’, IEEE Trans. Ultrason.,Ferroelect., Freq. Contr., Vol. 44, pp. 10491059, 1997.
w x80 P. Frubing, A. Kremmer, W. Neumann, R. Gerhard-Multhaupt,¨and I. L. Guy, ‘‘Dielectric relaxation of polyamide 11 in relationto piezo- and pyroelectricity’’, IEEE Trans. Diel. Electr. Insul.Ž .in press .
w x81 K. Kirjavainen, ‘‘Electromechanical film and procedure formanufacturing same’’, US Patent No. 4,654,546, 1987.
w x82 J. Lekkala and M. Paajanen, ‘‘EMFinew electret material forsensors and actuators’’, IEEE 10th International Symposium onElectrets, A. A. Konsta, A. Vassilikou-Dova, and K. Vartzeli-Nikaki, Eds., Piscataway, NJ, IEEE Service Center, pp. 743746,1999.
w x83 J. Hillenbrand and G. Sessler, ‘‘Piezoelectric properties ofŽ .polypropylenerair and poly vinylidene fluoride rair composites’’,
Ž .IEEE Conf. Electr. Insul. Dielectr. Phenomena CEIDP , pp.161165, 2000.
w x84 M. Paajanen, H. Valimaki, and J. Lekkala, ‘‘Modelling the elec-¨ ¨Ž .tromechanical film EMFi ’’, J. of Electrostatics, Vol. 48, pp.
193204, 2000.w x85 M. Paajanen, M. Wegener, and R. Gerhard-Multhaupt, ‘‘Un-
derstanding the role of the gas in the voids during corona charg-ing of cellular electret filmsa way to enhance their piezoelec-tricity’’, J. Phys. D: Appl. Phys., Vol. 34, pp. 24822488, 2001.
w x86 A. Mellinger, F. Camacho Gonzalez, and R. Gerhard-Multhaupt,´‘‘Photostimulated discharge in electret polymers: an alternative
approach for investigating deep traps’’, IEEE Trans. Diel. Electr.Ž .Insul., in press .
w x87 S. Bauer, S. Bauer-Gogonea, M. Dansachmuller, and R.¨Schwodiauer, ‘‘Charge in heterogeneous materials: a new route¨for piezoelectricity’’, 4th Intern. Conf. Electric Charges in Non-Conductive Materials, Paris, France, Societe Francaise du Vide,´ ´Paris, pp. 124131, 2001.
w x88 A. Mellinger, unpublished results, 2001.
1070-9878rrrrr1rrrrr$17.00 2003 IEEE 861
58
Mellinger et al. : Photostimulated Discharge in Electret Polymers218
Photostimulated Discharge in Electret Polymers: anAlternative Approach for Investigating Deep Traps
Axel Mellinger, Francisco Camacho Gonzalez and Reimund Gerhard-Multhaupt´Department of Physics
University of Potsdam, Am Neuen Palais 10,14469 Potsdam, Germany
ABSTRACT( )The stability of space charge in electrets such as polytetrafluoroethylene PTFE ,
( ) ( )polyethylene terephthalate PETP and polypropylene PP under ultraviolet irra-diation has been investigated using photostimulated discharge spectroscopy. Whileonly weak discharge currents were observed in PTFE coated with semitransparentgold electrodes, up to 15 pArrrrrcm2 were found in PETP around the UV absorptionedge near 310 nm. Space charge profiles obtained with the piezoelectrically gener-ated pressure step method indicate that near-surface charges were almost com-pletely removed. In PP foam, recent findings of a UV-reduced d coefficient were33confirmed for exposure times of up to 3.5 h, and a discharge peak at 200 nm couldbe assigned to the charges stored on the surfaces of the voids. The unique mor-
( )phology and the quasi- piezoelectric properties of cellular PP make it a role modelfor the future investigation of charge storage in electrets.
Index Terms — Electret polymers, photostimulated discharge, polytetrafluo-roethylene, polyethylene terephthalate, polypropylene, UV spectroscopy, piezoelec-tricity, piezoelectric resonances, piezoelectric coefficient, thickness extension reso-nance, voided polymer, cellular polymer, porous polymer, space-charge electret,corona charging, dielectric spectroscopy.
1 INTRODUCTIONINCE the invention of the electret condenser micro-S w xphone 1 space-charge electrets have played an im-
w xportant part in a variety of commercial applications 2,3 .Their unique property is their capability to store spacecharge near the surface or in the bulk for long periods of
Ž .time. In particular, polytetrafluoroethylene PTFE and itsŽ copolymers often known under their trade names Teflon
.TFE, FEP, PFA and AF have been shown to have excel-lent charge-retention properties. Other examples ofspace-charge electret polymers include polyeth-
Ž .ylene terephthalate PETP , cycloolefin copolymers,Ž .polyethylene and polypropylene PP . The latter has re-
ceived considerable attention in the last few years, follow-ing the development of electromechanical transducers
w xbased on polypropylene electret foams 4 .
Despite the widespread applications of space chargeelectrets, the microscopic mechanisms of charge storageare still poorly understood. For PTFE and its copolymers,it is generally accepted that charges generated by a room-temperature corona discharge are stored in relatively shal-
Manuscript recei®ed on 4 February 2003, in final form 10 July 2003.
low traps, while either charging at elevated temperatureor exposure to a mono-energetic electron beam at roomtemperature produces deeper traps, resulting in a higher
w xthermal stability 2 . Space charge profiles in PTFE andFEP obtained by the piezoelectrically generated pressure
Ž .step PPS method indicate that shallow traps are locatednear the surface, whereas deeper traps are distributed ho-
w xmogeneously in the bulk 5 . In the same work, spacecharge densities of up to 2500 Crm3 were reported.
Ž .Thermally stimulated discharge TSD experimentsw xyielded trap depths between 0.5 and 1.5 eV 6 . However,
this does not fully explain the exceptional long-term sta-bility of space charge electrets. Deep chemical traps withdepths between 3 and 8 eV, comparable to the bondstrengths between the constituent atoms could be the sta-
w xbilizing factor. A recent molecular modeling approach 7highlighted the role of chemical impurities in creating deepŽ .1 eV chemical traps.
One promising method for studying the electric and di-Želectric processes in solids is optical excitation photo-
.stimulated discharge, PSD , where trapped charge carri-ers are released by irradiating the sample with monochro-
Žmatic light. Initial PSD also named photostimulated cur-
1070-9878rrrrr04rrrrr$20.00 2004 IEEE218
59
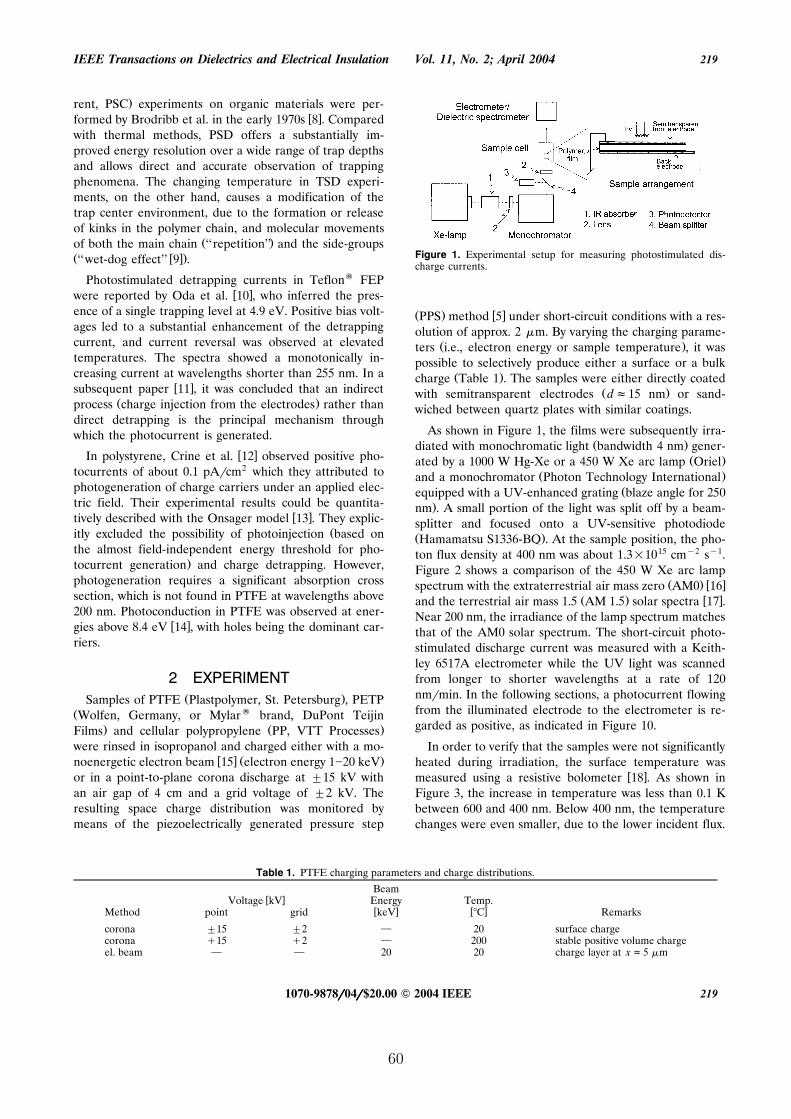
IEEE Transactions on Dielectrics and Electrical Insulation Vol. 11, No. 2; April 2004 219
.rent, PSC experiments on organic materials were per-w xformed by Brodribb et al. in the early 1970s 8 . Compared
with thermal methods, PSD offers a substantially im-proved energy resolution over a wide range of trap depthsand allows direct and accurate observation of trappingphenomena. The changing temperature in TSD experi-ments, on the other hand, causes a modification of thetrap center environment, due to the formation or releaseof kinks in the polymer chain, and molecular movements
Ž .of both the main chain ‘‘repetition’’ and the side-groupsŽ w x.‘‘wet-dog effect’’ 9 .
Photostimulated detrapping currents in Teflon FEPw xwere reported by Oda et al. 10 , who inferred the pres-
ence of a single trapping level at 4.9 eV. Positive bias volt-ages led to a substantial enhancement of the detrappingcurrent, and current reversal was observed at elevatedtemperatures. The spectra showed a monotonically in-creasing current at wavelengths shorter than 255 nm. In a
w xsubsequent paper 11 , it was concluded that an indirectŽ .process charge injection from the electrodes rather than
direct detrapping is the principal mechanism throughwhich the photocurrent is generated.
w xIn polystyrene, Crine et al. 12 observed positive pho-tocurrents of about 0.1 pArcm2 which they attributed tophotogeneration of charge carriers under an applied elec-tric field. Their experimental results could be quantita-
w xtively described with the Onsager model 13 . They explic-Žitly excluded the possibility of photoinjection based on
the almost field-independent energy threshold for pho-.tocurrent generation and charge detrapping. However,
photogeneration requires a significant absorption crosssection, which is not found in PTFE at wavelengths above200 nm. Photoconduction in PTFE was observed at ener-
w xgies above 8.4 eV 14 , with holes being the dominant car-riers.
2 EXPERIMENTŽ .Samples of PTFE Plastpolymer, St. Petersburg , PETP
Ž Wolfen, Germany, or Mylar brand, DuPont Teijin. Ž .Films and cellular polypropylene PP, VTT Processes
were rinsed in isopropanol and charged either with a mo-w x Ž .noenergetic electron beam 15 electron energy 120 keV
or in a point-to-plane corona discharge at 15 kV withan air gap of 4 cm and a grid voltage of 2 kV. Theresulting space charge distribution was monitored bymeans of the piezoelectrically generated pressure step
Figure 1. Experimental setup for measuring photostimulated dis-charge currents.
Ž . w xPPS method 5 under short-circuit conditions with a res-olution of approx. 2 m. By varying the charging parame-
Ž .ters i.e., electron energy or sample temperature , it waspossible to selectively produce either a surface or a bulk
Ž .charge Table 1 . The samples were either directly coatedŽ .with semitransparent electrodes df15 nm or sand-
wiched between quartz plates with similar coatings.
As shown in Figure 1, the films were subsequently irra-Ž .diated with monochromatic light bandwidth 4 nm gener-
Ž .ated by a 1000 W Hg-Xe or a 450 W Xe arc lamp OrielŽ .and a monochromator Photon Technology International
Žequipped with a UV-enhanced grating blaze angle for 250.nm . A small portion of the light was split off by a beam-
splitter and focused onto a UV-sensitive photodiodeŽ .Hamamatsu S1336-BQ . At the sample position, the pho-ton flux density at 400 nm was about 1.31015 cmy2 sy1.Figure 2 shows a comparison of the 450 W Xe arc lamp
Ž . w xspectrum with the extraterrestrial air mass zero AM0 16Ž . w xand the terrestrial air mass 1.5 AM 1.5 solar spectra 17 .
Near 200 nm, the irradiance of the lamp spectrum matchesthat of the AM0 solar spectrum. The short-circuit photo-stimulated discharge current was measured with a Keith-ley 6517A electrometer while the UV light was scannedfrom longer to shorter wavelengths at a rate of 120nmrmin. In the following sections, a photocurrent flowingfrom the illuminated electrode to the electrometer is re-garded as positive, as indicated in Figure 10.
In order to verify that the samples were not significantlyheated during irradiation, the surface temperature was
w xmeasured using a resistive bolometer 18 . As shown inFigure 3, the increase in temperature was less than 0.1 Kbetween 600 and 400 nm. Below 400 nm, the temperaturechanges were even smaller, due to the lower incident flux.
Table 1. PTFE charging parameters and charge distributions.
Beamw xVoltage kV Energy Temp.
w x w xMethod point grid keV C Remarks
corona 15 2 20 surface chargecorona q15 q2 200 stable positive volume chargeel. beam 20 20 charge layer at xf5 m
1070-9878rrrrr04rrrrr$20.00 2004 IEEE 219
60
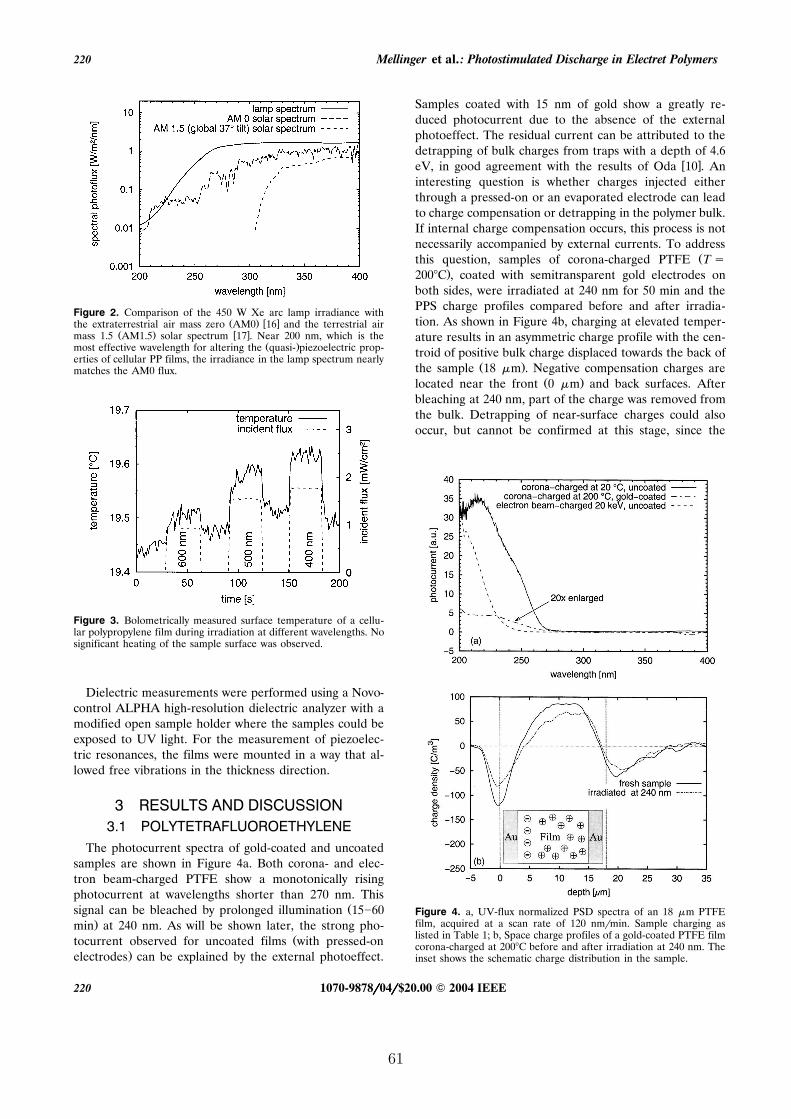
Mellinger et al. : Photostimulated Discharge in Electret Polymers220
Figure 2. Comparison of the 450 W Xe arc lamp irradiance withŽ . w xthe extraterrestrial air mass zero AM0 16 and the terrestrial air
Ž . w xmass 1.5 AM1.5 solar spectrum 17 . Near 200 nm, which is theŽ .most effective wavelength for altering the quasi- piezoelectric prop-
erties of cellular PP films, the irradiance in the lamp spectrum nearlymatches the AM0 flux.
Figure 3. Bolometrically measured surface temperature of a cellu-lar polypropylene film during irradiation at different wavelengths. Nosignificant heating of the sample surface was observed.
Dielectric measurements were performed using a Novo-control ALPHA high-resolution dielectric analyzer with amodified open sample holder where the samples could beexposed to UV light. For the measurement of piezoelec-tric resonances, the films were mounted in a way that al-lowed free vibrations in the thickness direction.
3 RESULTS AND DISCUSSION3.1 POLYTETRAFLUOROETHYLENE
The photocurrent spectra of gold-coated and uncoatedsamples are shown in Figure 4a. Both corona- and elec-tron beam-charged PTFE show a monotonically risingphotocurrent at wavelengths shorter than 270 nm. This
Žsignal can be bleached by prolonged illumination 1560.min at 240 nm. As will be shown later, the strong pho-
Žtocurrent observed for uncoated films with pressed-on.electrodes can be explained by the external photoeffect.
Samples coated with 15 nm of gold show a greatly re-duced photocurrent due to the absence of the externalphotoeffect. The residual current can be attributed to thedetrapping of bulk charges from traps with a depth of 4.6
w xeV, in good agreement with the results of Oda 10 . Aninteresting question is whether charges injected eitherthrough a pressed-on or an evaporated electrode can leadto charge compensation or detrapping in the polymer bulk.If internal charge compensation occurs, this process is notnecessarily accompanied by external currents. To address
Žthis question, samples of corona-charged PTFE T s.200C , coated with semitransparent gold electrodes on
both sides, were irradiated at 240 nm for 50 min and thePPS charge profiles compared before and after irradia-tion. As shown in Figure 4b, charging at elevated temper-ature results in an asymmetric charge profile with the cen-troid of positive bulk charge displaced towards the back of
Ž .the sample 18 m . Negative compensation charges areŽ .located near the front 0 m and back surfaces. After
bleaching at 240 nm, part of the charge was removed fromthe bulk. Detrapping of near-surface charges could alsooccur, but cannot be confirmed at this stage, since the
Figure 4. a, UV-flux normalized PSD spectra of an 18 m PTFEfilm, acquired at a scan rate of 120 nmrmin. Sample charging aslisted in Table 1; b, Space charge profiles of a gold-coated PTFE filmcorona-charged at 200C before and after irradiation at 240 nm. Theinset shows the schematic charge distribution in the sample.
1070-9878rrrrr04rrrrr$20.00 2004 IEEE220
61

IEEE Transactions on Dielectrics and Electrical Insulation Vol. 11, No. 2; April 2004 221
PPS method cannot distinguish between near-surfaceŽ .charges in the polymer and compensation charges on the
metal electrodes. The inset of the figure shows theschematic representation of the charge distribution in thesample.
3.2 POLYETHYLENE TEREPHTHALATEFigure 5 shows the photo-stimulated discharge spec-
trum of a 16 m PETP film negatively corona-charged atroom temperature. To prevent premature removal of thesurface charge, an asymmetric electrode arrangement waschosen, as depicted in the inset. The sample was coatedwith a semitransparent Cu electrode, which was con-nected to the grounded anode during the charging pro-
Žcess. The spectrum shows a single broadened peak peak2.current density y15 pArcm near 305 nm, equivalent to
a trap depth of 4.1 eV. After 12 min of irradiation at 303Ž .nm shown in Figure 6a , the photocurrent peak decreases
substantially, while its centroid is red-shifted to 310 nm.The residual peak can be permanently bleached by irradi-ation with 310 nm light. As with PTFE, the transient na-ture of the photocurrent indicates the presence of a chargedetrapping mechanism, rather than photoinduced conduc-tivity. The onset of the photocurrent coincides with theoptical absorption edge of PETP, resulting from a transi-
1 1 Ž1 .tion derived from the A ™ B L benzene transi-1 g 2 u bw xtion 19 . This suggests that trapped charges are either as-
sociated with aromatic groups on the polymer chain orthat detrapping is an indirect process, where, in a firststep, photon absorption leads to the generation of an exci-ton, which is dissociated by the internal electric field. Thecharges resulting from the dissociated exciton could thenneutralize or detrap charges located at other positionsalong the polymer chain. The fact that preferentialbleaching was observed when the sample was irradiated at
Figure 5. UV-flux normalized PSD spectrum of corona-chargedPETP immediately after corona-charging and after optical bleachingat 303 and 310 nm. The peak current density near 305 nm was ap-prox. y15 pArcm2. Bleaching times were 720 and 780 s, respectivelyŽ .Figure 6a . The dotted curve shows the UV absorption spectrum.The inset shows the electrode arrangement and orientation of thesample.
Figure 6. a, Discharge current distribution; b, charge density distri-bution. 16 m PETP film corona-charged for 1 min at room temper-
Ž .ature V sy12 kV . Total integrated discharge current is 12.6needlenC. During the PPS measurement, the uncoated surface was coveredwith an uncharged PETP layer of the same thickness in order toprotect the surface charge. The space charge density is given by thederivative of the electric displacement. The schematic charge distri-bution is shown in the inset.
303 nm gives some support to the first point of view, sinceonly a direct process would allow state-selective detrap-ping.
As shown in Figure 6a, the integrated discharge currentamounts to a total charge of 12.6 nC. Independent infor-mation on the removed charge can be obtained from PPSmeasurements before and after bleaching, depicted inFigure 6b. To protect the surface charge, the uncoatedside was covered with an uncharged PETP layer of the
Ž .same thickness 16 m . All space charge is located nearthe surfaces, at depths of 3 m or less. After the freshlycharged sample was connected to the electrometer, an ini-tial decay of surface charge was observed for approxi-mately 1 h. Subsequent irradiation at 303 and 310 nm re-moved almost all surface charge. Only a slight decrease insurface charge was found after irradiation at 303 nm whilenearly complete depletion is seen after exposure to 310nm light. This can be explained by the different opticalpenetration depth, which is a factor of 2.5 larger at 310nm according to the UV absorption spectrum shown in
1070-9878rrrrr04rrrrr$20.00 2004 IEEE 221
62
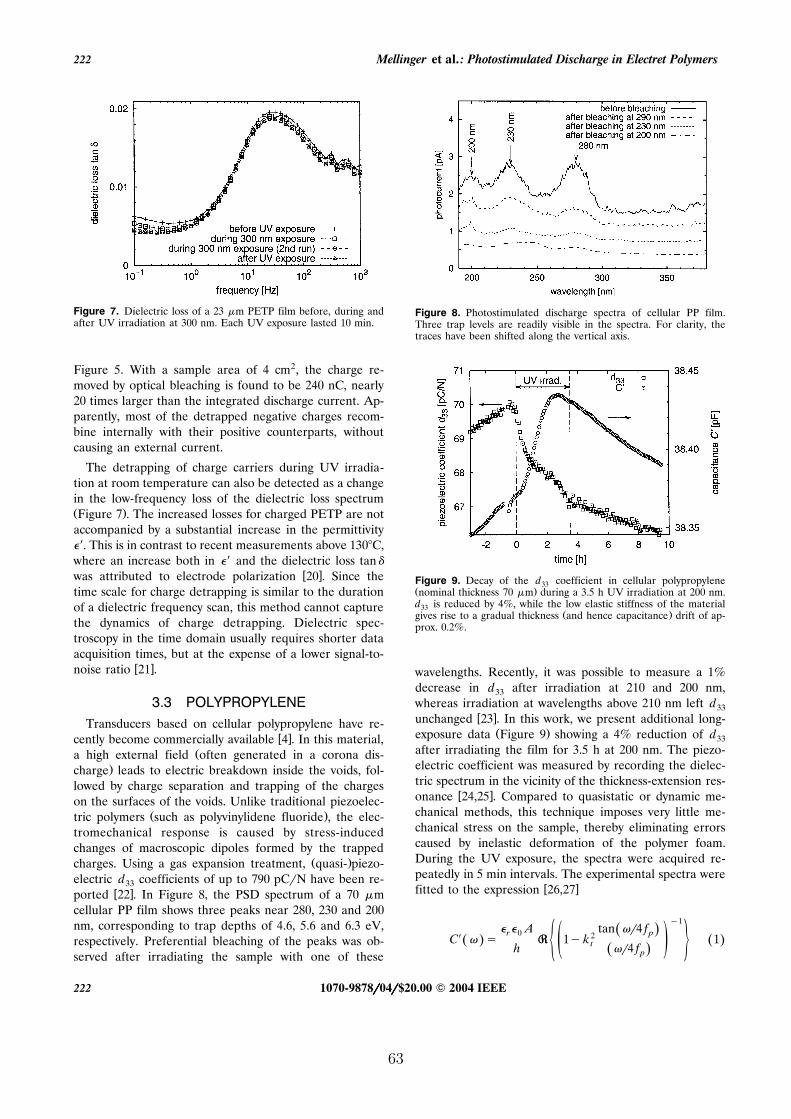
Mellinger et al. : Photostimulated Discharge in Electret Polymers222
Figure 7. Dielectric loss of a 23 m PETP film before, during andafter UV irradiation at 300 nm. Each UV exposure lasted 10 min.
Figure 5. With a sample area of 4 cm2, the charge re-moved by optical bleaching is found to be 240 nC, nearly20 times larger than the integrated discharge current. Ap-parently, most of the detrapped negative charges recom-bine internally with their positive counterparts, withoutcausing an external current.
The detrapping of charge carriers during UV irradia-tion at room temperature can also be detected as a changein the low-frequency loss of the dielectric loss spectrumŽ .Figure 7 . The increased losses for charged PETP are notaccompanied by a substantial increase in the permittivity . This is in contrast to recent measurements above 130C,where an increase both in and the dielectric loss tan
w xwas attributed to electrode polarization 20 . Since thetime scale for charge detrapping is similar to the durationof a dielectric frequency scan, this method cannot capturethe dynamics of charge detrapping. Dielectric spec-troscopy in the time domain usually requires shorter dataacquisition times, but at the expense of a lower signal-to-
w xnoise ratio 21 .
3.3 POLYPROPYLENETransducers based on cellular polypropylene have re-
w xcently become commercially available 4 . In this material,Ža high external field often generated in a corona dis-
.charge leads to electric breakdown inside the voids, fol-lowed by charge separation and trapping of the chargeson the surfaces of the voids. Unlike traditional piezoelec-
Ž .tric polymers such as polyvinylidene fluoride , the elec-tromechanical response is caused by stress-inducedchanges of macroscopic dipoles formed by the trapped
Ž .charges. Using a gas expansion treatment, quasi- piezo-electric d coefficients of up to 790 pCrN have been re-33
w xported 22 . In Figure 8, the PSD spectrum of a 70 mcellular PP film shows three peaks near 280, 230 and 200nm, corresponding to trap depths of 4.6, 5.6 and 6.3 eV,respectively. Preferential bleaching of the peaks was ob-served after irradiating the sample with one of these
Figure 8. Photostimulated discharge spectra of cellular PP film.Three trap levels are readily visible in the spectra. For clarity, thetraces have been shifted along the vertical axis.
Figure 9. Decay of the d coefficient in cellular polypropylene33Ž .nominal thickness 70 m during a 3.5 h UV irradiation at 200 nm.d is reduced by 4%, while the low elastic stiffness of the material33
Ž .gives rise to a gradual thickness and hence capacitance drift of ap-prox. 0.2%.
wavelengths. Recently, it was possible to measure a 1%decrease in d after irradiation at 210 and 200 nm,33
whereas irradiation at wavelengths above 210 nm left d33w xunchanged 23 . In this work, we present additional long-
Ž .exposure data Figure 9 showing a 4% reduction of d33
after irradiating the film for 3.5 h at 200 nm. The piezo-electric coefficient was measured by recording the dielec-tric spectrum in the vicinity of the thickness-extension res-
w xonance 24,25 . Compared to quasistatic or dynamic me-chanical methods, this technique imposes very little me-chanical stress on the sample, thereby eliminating errorscaused by inelastic deformation of the polymer foam.During the UV exposure, the spectra were acquired re-peatedly in 5 min intervals. The experimental spectra were
w xfitted to the expression 26,27
y1tan r4 f A Ž .pr 0 2C s RR 1yk 1Ž . Ž .t½ 5ž /h r4 fŽ .p
1070-9878rrrrr04rrrrr$20.00 2004 IEEE222
63
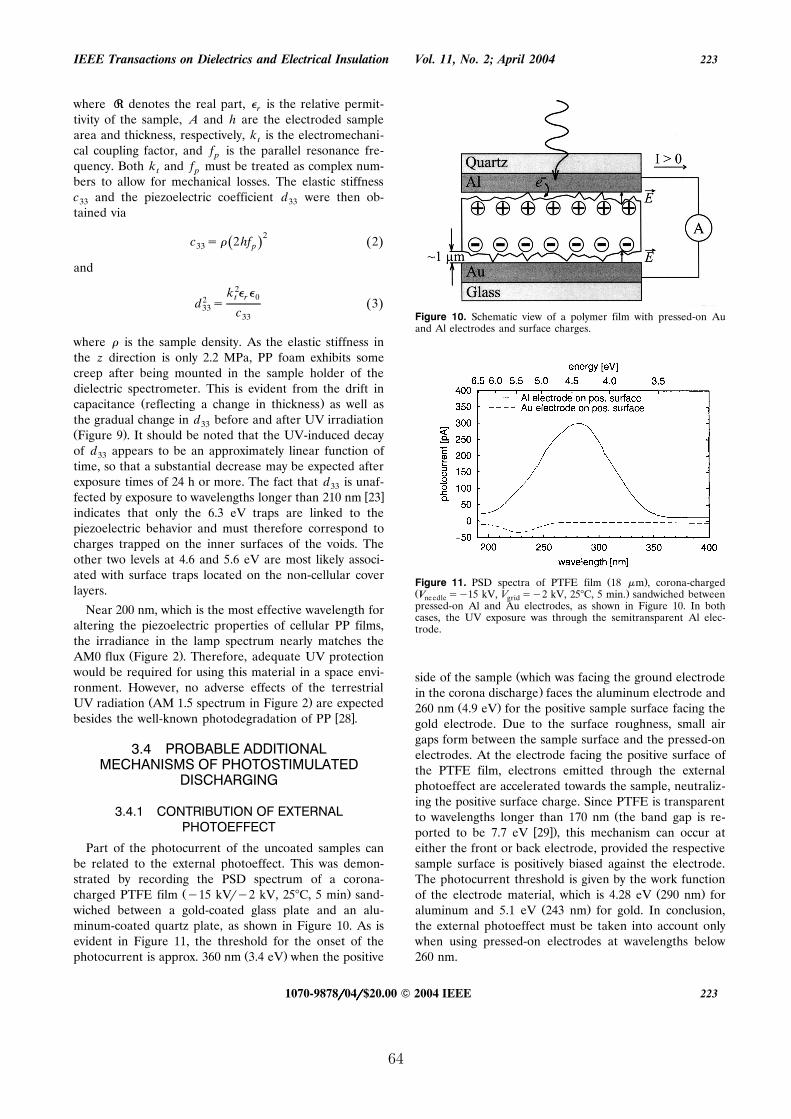
IEEE Transactions on Dielectrics and Electrical Insulation Vol. 11, No. 2; April 2004 223
where RR denotes the real part, is the relative permit-r
tivity of the sample, A and h are the electroded samplearea and thickness, respectively, k is the electromechani-t
cal coupling factor, and f is the parallel resonance fre-p
quency. Both k and f must be treated as complex num-t p
bers to allow for mechanical losses. The elastic stiffnessc and the piezoelectric coefficient d were then ob-33 33
tained via
2c s 2hf 2Ž .Ž .33 p
and
k2 t r 02d s 3Ž .33 c33
where is the sample density. As the elastic stiffness inthe z direction is only 2.2 MPa, PP foam exhibits somecreep after being mounted in the sample holder of thedielectric spectrometer. This is evident from the drift in
Ž .capacitance reflecting a change in thickness as well asthe gradual change in d before and after UV irradiation33Ž .Figure 9 . It should be noted that the UV-induced decayof d appears to be an approximately linear function of33
time, so that a substantial decrease may be expected afterexposure times of 24 h or more. The fact that d is unaf-33
w xfected by exposure to wavelengths longer than 210 nm 23indicates that only the 6.3 eV traps are linked to thepiezoelectric behavior and must therefore correspond tocharges trapped on the inner surfaces of the voids. Theother two levels at 4.6 and 5.6 eV are most likely associ-ated with surface traps located on the non-cellular coverlayers.
Near 200 nm, which is the most effective wavelength foraltering the piezoelectric properties of cellular PP films,the irradiance in the lamp spectrum nearly matches the
Ž .AM0 flux Figure 2 . Therefore, adequate UV protectionwould be required for using this material in a space envi-ronment. However, no adverse effects of the terrestrial
Ž .UV radiation AM 1.5 spectrum in Figure 2 are expectedw xbesides the well-known photodegradation of PP 28 .
3.4 PROBABLE ADDITIONALMECHANISMS OF PHOTOSTIMULATED
DISCHARGING
3.4.1 CONTRIBUTION OF EXTERNALPHOTOEFFECT
Part of the photocurrent of the uncoated samples canbe related to the external photoeffect. This was demon-strated by recording the PSD spectrum of a corona-
Ž .charged PTFE film y15 kVry2 kV, 25C, 5 min sand-wiched between a gold-coated glass plate and an alu-minum-coated quartz plate, as shown in Figure 10. As isevident in Figure 11, the threshold for the onset of the
Ž .photocurrent is approx. 360 nm 3.4 eV when the positive
Figure 10. Schematic view of a polymer film with pressed-on Auand Al electrodes and surface charges.
Ž .Figure 11. PSD spectra of PTFE film 18 m , corona-chargedŽ .V sy15 kV, V sy2 kV, 25C, 5 min. sandwiched betweenneedle gridpressed-on Al and Au electrodes, as shown in Figure 10. In bothcases, the UV exposure was through the semitransparent Al elec-trode.
Žside of the sample which was facing the ground electrode.in the corona discharge faces the aluminum electrode and
Ž .260 nm 4.9 eV for the positive sample surface facing thegold electrode. Due to the surface roughness, small airgaps form between the sample surface and the pressed-onelectrodes. At the electrode facing the positive surface ofthe PTFE film, electrons emitted through the externalphotoeffect are accelerated towards the sample, neutraliz-ing the positive surface charge. Since PTFE is transparent
Žto wavelengths longer than 170 nm the band gap is re-w x.ported to be 7.7 eV 29 , this mechanism can occur at
either the front or back electrode, provided the respectivesample surface is positively biased against the electrode.The photocurrent threshold is given by the work function
Ž .of the electrode material, which is 4.28 eV 290 nm forŽ .aluminum and 5.1 eV 243 nm for gold. In conclusion,
the external photoeffect must be taken into account onlywhen using pressed-on electrodes at wavelengths below260 nm.
1070-9878rrrrr04rrrrr$20.00 2004 IEEE 223
64
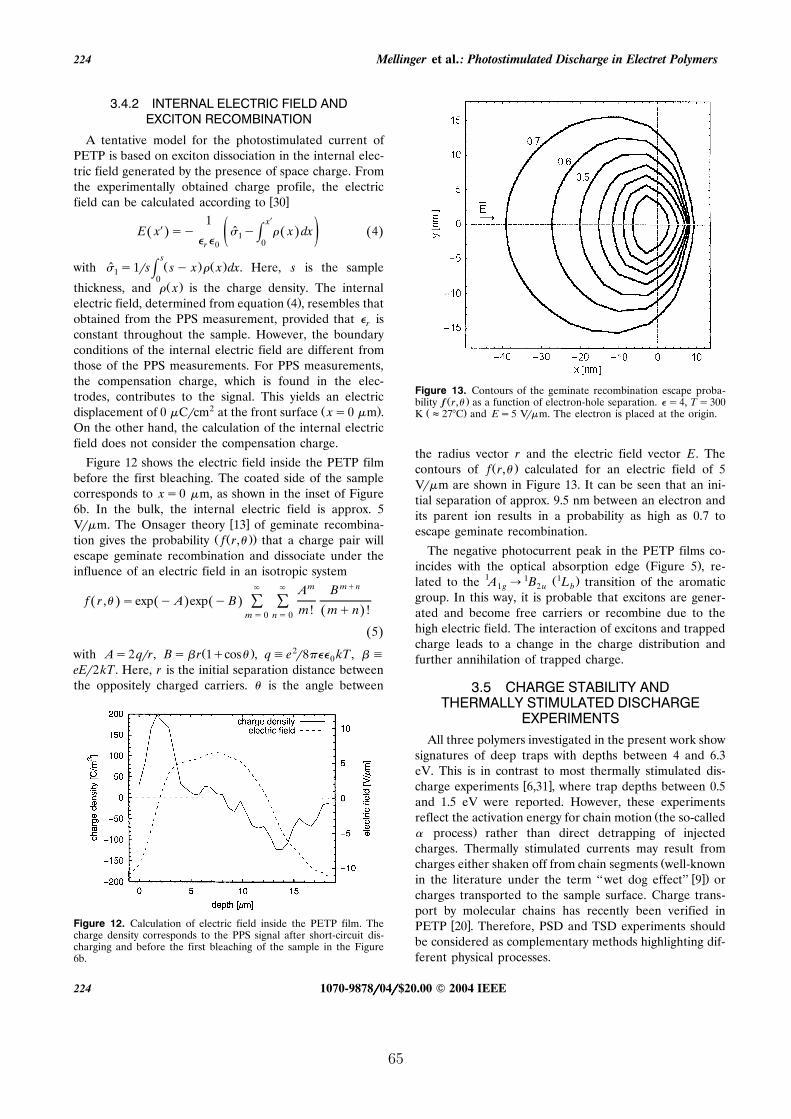
Mellinger et al. : Photostimulated Discharge in Electret Polymers224
3.4.2 INTERNAL ELECTRIC FIELD ANDEXCITON RECOMBINATION
A tentative model for the photostimulated current ofPETP is based on exciton dissociation in the internal elec-tric field generated by the presence of space charge. Fromthe experimentally obtained charge profile, the electric
w xfield can be calculated according to 30x1
E x sy y x dx 4Ž . Ž . Ž .ˆ H1ž / 0r 0
sŽ . Ž .with s1rs sy x x dx. Here, s is the sampleˆ H1
0Ž .thickness, and x is the charge density. The internal
Ž .electric field, determined from equation 4 , resembles thatobtained from the PPS measurement, provided that isr
constant throughout the sample. However, the boundaryconditions of the internal electric field are different fromthose of the PPS measurements. For PPS measurements,the compensation charge, which is found in the elec-trodes, contributes to the signal. This yields an electric
2 Ž .displacement of 0 Crcm at the front surface xs0 m .On the other hand, the calculation of the internal electricfield does not consider the compensation charge.
Figure 12 shows the electric field inside the PETP filmbefore the first bleaching. The coated side of the samplecorresponds to xs0 m, as shown in the inset of Figure6b. In the bulk, the internal electric field is approx. 5
w xVrm. The Onsager theory 13 of geminate recombina-Ž Ž ..tion gives the probability f r, that a charge pair will
escape geminate recombination and dissociate under theinfluence of an electric field in an isotropic system
m mqnA Bf r , sexp y A exp yBŽ . Ž . Ž . Ý Ý m! mqn !Ž .ms 0 ns 0
5Ž .Ž . 2with As2 qrr, Bs r 1qcos , q e r8 kT , 0
eEr2kT. Here, r is the initial separation distance betweenthe oppositely charged carriers. is the angle between
Figure 12. Calculation of electric field inside the PETP film. Thecharge density corresponds to the PPS signal after short-circuit dis-charging and before the first bleaching of the sample in the Figure6b.
Figure 13. Contours of the geminate recombination escape proba-Ž .bility f r, as a function of electron-hole separation. s4, Ts300
Ž .K f27C and Es5 Vrm. The electron is placed at the origin.
the radius vector r and the electric field vector E. TheŽ .contours of f r, calculated for an electric field of 5
Vrm are shown in Figure 13. It can be seen that an ini-tial separation of approx. 9.5 nm between an electron andits parent ion results in a probability as high as 0.7 toescape geminate recombination.
The negative photocurrent peak in the PETP films co-Ž .incides with the optical absorption edge Figure 5 , re-
1 1 Ž1 .lated to the A ™ B L transition of the aromatic1 g 2 u b
group. In this way, it is probable that excitons are gener-ated and become free carriers or recombine due to thehigh electric field. The interaction of excitons and trappedcharge leads to a change in the charge distribution andfurther annihilation of trapped charge.
3.5 CHARGE STABILITY ANDTHERMALLY STIMULATED DISCHARGE
EXPERIMENTSAll three polymers investigated in the present work show
signatures of deep traps with depths between 4 and 6.3eV. This is in contrast to most thermally stimulated dis-
w xcharge experiments 6,31 , where trap depths between 0.5and 1.5 eV were reported. However, these experiments
Žreflect the activation energy for chain motion the so-called. process rather than direct detrapping of injected
charges. Thermally stimulated currents may result fromŽcharges either shaken off from chain segments well-known
w x.in the literature under the term ‘‘wet dog effect’’ 9 orcharges transported to the sample surface. Charge trans-port by molecular chains has recently been verified in
w xPETP 20 . Therefore, PSD and TSD experiments shouldbe considered as complementary methods highlighting dif-ferent physical processes.
1070-9878rrrrr04rrrrr$20.00 2004 IEEE224
65
IEEE Transactions on Dielectrics and Electrical Insulation Vol. 11, No. 2; April 2004 225
4 CONCLUSIONSHOTOSTIMULATED discharge spectroscopy inPcombination with depth-resolved space charge mea-
surements has been used to obtain data on trap depths invarious charge-storing polymer electrets. Only a weak dis-charge current was found in PTFE, whereas individualtrapping levels could be observed in PETP and cellularPP. In the latter, the reduction of the piezoelectric coeffi-cient under UV irradiation was also studied. A trap levelnear 6.3 eV could be assigned to charges located insidethe voids.
ACKNOWLEDGMENTSThe authors gratefully acknowledge partial support from
Ž .the PROBRAL program CAPESrDAAD and from theEuropean Community within the GROWTH projectDURASMART. Our thanks go to L. F. Santos and R. M.
ŽFaria Instituto de Fısica de Sao Carlos, Universidade de´ ˜. ŽSao Paulo, Brazil and W. Wirges Universitat Potsdam,˜ ¨
.Germany for their experimental support and many stimu-lating discussions. The cellular PP samples were kindlyprovided by M. Paajanen of VTT Processes in Tampere,Finland. F.C.G. acknowledges financial support from
Ž .PROMEP-SUPERA Mexico .
REFERENCESw x1 G. M. Sessler and J. E. West, ‘‘Self-biased Condenser Micro-
phone with High Capacitance’’, J. Acoust. Soc., Vol. 34, pp.17871788, 1962.
w x2 R. Kressmann, G. Sessler, and P. Gunther, ‘‘Space Charge Elec-¨trets’’, in Electrets, 3rd ed., R. Gerhard-Multhaupt, Ed., MorganHill, CA, Laplacian Press, Vol. 2, ch. 9, pp. 140, 1999.
w x3 V. N. Kestelman, L. S. Pinchuk, and V. A. Goldade, Electrets inEngineering. Fundamentals and Applications, 1st ed., Norwell,Massachusetts, Kluwer Academic Publishers, 2000.
w x4 M. Paajanen, H. Valimaki, and J. Lekkala, ‘‘Modelling the Elec-¨ ¨Ž .tromechanical Film EMFi ’’, J. of Electrostatics, Vol. 48, pp.
193204, 2000.w x5 R. Gerhard-Multhaupt, W. Kunstler, G. Eberle, W. Eisen-¨
menger, and G. Yang, ‘‘High Space-charge Densities in the Bulkof Fluoropolymer Electrets Detected with Piezoelectrically Gen-erated Pressure Steps’’, Space Charge in Solid Dielectrics, pp.123132, 1997.
w x6 H. von Seggern, ‘‘Isothermal and Thermally Stimulated CurrentŽ .Studies of Positively Corona Charged Teflon FEP Polyfluo-
roethylenepropylene’’, J. Appl. Phys., Vol. 52, pp. 40814085,1981.
w x7 M. Meunier, N. Quirke, and A. Aslanides, ‘‘Molecular Model-ing of Electron Traps in Polymer Insulators: Chemical Defectsand Impurities’’, J. Chem. Phys., Vol. 115, pp. 28762881, 2001.
w x8 J. D. Brodribb, D. M. Hughes, and T. J. Lewis, ‘‘The EnergySpectrum of Traps in Insulators by Photon-induced CurrentSpectroscopy’’, in Electrets: Charge Storage and Transport in Di-electrics, M. Perlman, Ed., 177187, 1972.
w x9 M. Kryszewski, J. Ulanski, J. K. Jezka, and M. Zielinski, ‘‘Chain´and Carrier Mobility in Polymer Systems as Investigated byThermally Stimulated Current Techniques’’, Polymer Bull., Vol.8, pp. 187192, 1982.
w x10 T. Oda, T. Utsumi, T. Kumano, and M. Itami, ‘‘Observation ofPhoto-stimulated Detrapping Currents of FEP Teflon Electrets’’,IEEE 5th Intern. Conf. Electrets, G. M. Sessler and R. Ger-hard-Multhaupt, Eds., Piscataway, NJ, IEEE Service Center, pp.288293, 1985.
w x11 T. Oda, T. Utsumi, and G. Matsubara, ‘‘Observation of UVPhoto-stimulated Currents of Teflon Electrets’’, IEEE 6th In-tern. Sympos. Electrets, D. K. Das-Gupta and A. W. Pattullo,Eds., Piscataway, NJ, IEEE Service Center, pp. 142146, 1988.
w x12 J. P. Crine and A. Yelon, ‘‘Photogeneration and Transport ofCarriers in Atactic Polystyrene’’, J. Appl. Phys., Vol. 51, pp.21062114, 1980.
w x13 L. Onsager, ‘‘Initial Recombination of Ions’’, Phys. Rev., Vol.54, pp. 554557, 1938.
w x14 M. Yun, K. Yoshino, Y. Inuishi, and M. Kawatsu, ‘‘Photocon-duction in Polytetrafluoroethylene Induced by Vacuum-ultra-violet Light’’, Jpn. J. Appl. Phys., Vol. 21, pp. 15921595, 1982.
w x15 B. Gross, ‘‘Radiation-induced Charge Storage and PolarizationEffects’’, in Electrets, 3rd ed., G. M. Sessler, Ed., Morgan Hill,CA, Laplacian Press, Vol. 1, ch. 4, pp. 217284, 1999.
w x16 C. Wehrli, ‘‘Extraterrestrial Solar Spectrum’’, Physikalisch-Meteorologisches Observatorium and World Radiation Center,Davos Dorf, Switzerland, Publication 615, 1985.
w x17 ‘‘Standard Tables for References Solar Spectral Irradiance atAir Mass 1.5: Direct Normal and Hemispherical for a 37 TiltedSurface,’’ ASTM, Document G159-98, 1999.
w x18 R. Emmerich, S. Bauer, and B. Ploss, ‘‘Temperature Distribu-tion in a Film Heated with a Laser Spot: Theory and Measure-ment’’, Appl. Phys. A, Vol. 54, pp. 334339, 1992.
w x Ž19 J. P. LaFemina and G. Arjavalingam, ‘‘Photophysics of Poly eth-.ylene terephthalate : Ultraviolet Absorption and Emission’’, J.
Phys. Chem., Vol. 95, pp. 984988, 1991.w x20 E. Neagu, P. Pissis, and L. Apekis, ‘‘Electrical Conductivity Ef-
fects in Polyethylene Terephthalate Films’’, J. Appl. Phys., Vol.87, pp. 29142922, 2000.
w x21 A. K. Jonscher, Dielectric Relaxation in Solids, London, ChelseaDielectrics Press, 1983.
w x22 M. Paajanen, M. Wegener, and R. Gerhard-Multhaupt, ‘‘Un-derstanding the Role of the Gas in the Voids during CoronaCharging of Cellular Electret Filmsa Way to Enhance theirPiezoelectricity,’’ J. Phys. D: Appl. Phys., Vol. 34, pp. 24822488,2001.
w x23 A. Mellinger, F. Camacho Gonzalez, and R. Gerhard-Multhaupt,´‘‘Ultraviolet-induced Discharge Currents and Reduction of thePiezoelectric Coefficient in Cellular Polypropylene Films’’, Appl.Phys. Lett., Vol. 82, pp. 254256, 2003.
w x24 G. S. Neugschwandtner, R. Schwodiauer, M. Vieytes, S. Bauer-¨Gogonea, S. Bauer, J. Hillenbrand, R. Kressmann, G. M. Sessler,M. Paajanen, and J. Lekkala, ‘‘Large and Broadband Piezoelec-tricity in Smart Polymer-foam Space-charge Electrets’’, Appl.Phys. Lett., Vol. 77, pp. 38273829, 2000.
w x25 A. Mellinger, M. Wegener, W. Wirges, and R. Gerhard-Multhaupt, ‘‘Thermally Stable Dynamic Piezoelectricity inSandwich Films of Porous and Nonporous Amorphous Fluo-ropolymer’’, Appl. Phys. Lett., Vol. 79, pp. 18521854, 2001.
w x26 ‘‘IEEE Standard on Piezoelectricity,’’ANSIrIEEE Std. 176-1987,1987.
w x27 D. A. Berlincourt, D. R. Currand, and H. Jaffe, ‘‘Piezoelectricand Piezomagnetic Materials’’, in Physical Acoustics, W. P. Ma-son, Ed., New York, Academic, Vol. I, Pt. A, pp. 168269, 1967.
w x28 J. F. Rabek, Photodegradation of Polymers, Heidelberg, Springer,1995.
w x29 K. Seki, H. Tanaka, T. Ohta, Y. Aoki, A. Imamura, H. Fuji-moto, H. Yamamoto, and H. Inokuchi, ‘‘Electronic Structure of
Ž .Poly tetrafluoroethylene Studied by UPS, VUV Absorption, andBand Calculations’’, Physica Scripta, Vol. 41, pp. 167171, 1990.
w x30 G. M. Sessler, ‘‘Physical Principles of Electrets’’, in Electrets, 3rded., G. M. Sessler, Ed., Morgan Hill, CA, Laplacian Press, Vol.1, ch. 2, pp. 1380, 1999.
w x31 J. van Turnhout, ‘‘Thermally Stimulated Discharge of Electrets’’,in Electrets, 3rd ed., G. M. Sessler, Ed., Morgan Hill, CA,Laplacian Press, Vol. 1, ch. 3, pp. 81215, 1999.
This paper is based on a presentation gi®en at the 11th IEEE InternationalSymposiun on Electrets, Melbourne, Australia, 1-3 October 2002.
1070-9878rrrrr04rrrrr$20.00 2004 IEEE 225
66
Mellinger et al. : Photostimulated Discharge in Electret Polymers226
1070-9878rrrrr04rrrrr$20.00 2004 IEEE226
67

68 A JOURNAL AND REVIEW ARTICLES
INSTITUTE OF PHYSICS PUBLISHING MEASUREMENT SCIENCE AND TECHNOLOGY
Meas. Sci. Technol. 15 (2004) 1347–1353 PII: S0957-0233(04)71534-9
Unbiased iterative reconstruction ofpolarization and space-charge profilesfrom thermal-wave experiments
Axel Mellinger
Department of Physics, University of Potsdam, Am Neuen Palais 10,
D-14469 Potsdam, Germany
E-mail: [email protected]
Received 6 November 2003, in final form 18 May 2004Published 16 June 2004Online at stacks.iop.org/MST/15/1347doi:10.1088/0957-0233/15/7/017
AbstractThe thermal-wave technique or laser-intensity modulation method is animportant tool for the non-destructive probing of space-charge andpolarization profiles in electrets. Analysing the experimental data requiressolving a Fredholm integral equation which is known to be anill-conditioned problem. This paper presents an iterative approach that iscapable of reconstructing inherently unsmooth distributions. The deviationsfrom the true profiles are slightly smaller than those obtained with Tikhonovregularization, while the computational burden is not a limiting factor onmodern personal computers. The optimum number of iterations is estimatedusing the randomized generalized cross-validation technique. Results areshown for a number of model distributions, as well as for experimental datafrom a layered polyvinylidene fluoride film sandwich.
Keywords: pyroelectric coefficient, space charge density, laser-intensitymodulation method (LIMM), thermal waves, dielectric materials, spacecharge electrets, polarization depth profiles
1. Introduction
A key problem in electret research is the non-destructive
measurement of polarization and space-charge profiles [1].
During the past two decades, several techniques have been
developed to probe dielectric materials with a thickness
ranging from a few µm to several mm. They all rely
on the propagation of acoustic or thermal waves through
the sample, where they cause a space- and time-dependent
compression or expansion, leading to an electrical response
under short-circuit conditions. Thermal waves may also
cause an electrical response due to temperature-dependent
polarization and permittivity. Acoustic techniques use the
propagation of a pressure pulse or step, generated either with
a quartz crystal (pressure-step propagation method, PPS [2])
or through the absorption of a short laser pulse (laser-induced
pressure-pulse method, LIPP [3]). Alternatively, the acoustic
response to a voltage pulse applied between the sample
electrodes has been recorded with a piezoelectric transducer
(pulsed electroacoustic method, PEA [4]). While acoustic
techniques have the advantage of nearly uniform resolution
throughout the sample, it is difficult and costly to achieve
a resolution better than approx. 1 µm, as both the pulse
generation and detection equipment must have risetimes in
the sub-ns range. Moreover, acoustic-pulse and pressure-step
methods are difficult to apply to porous and cellular electrets
due to their large acoustic scattering.
Thermal techniques, on the other hand, use the diffusion
process of a thermal pulse or thermal wave in order to locally
change the density and/or the dielectric constant. In addition,
a pyroelectric current results in the presence of a temperature-
dependent polarization. The thermal pulse method was first
demonstrated in 1975 [5], while the thermal wave method
was introduced in 1981 [6]. The latter is also known as the
laser-intensity modulation method (LIMM), since the periodic
heating is usually performed with an intensity-modulated laser
beam. With heat diffusion being a slower process than the
propagation of sound waves, the time resolution requirements
0957-0233/04/071347+07$30.00 © 2004 IOP Publishing Ltd Printed in the UK 1347
69
A Mellinger
for the apparatus are less demanding. Conversely, with fast
detection techniques, a spatial resolution of less than 1 µm is
easily achieved [7]. A key advantage of the all-optical LIMM
technique is its ability to investigate samples without requiring
a mechanical contact. This is an important feature for, e.g.,
the study of soft polymer foams [8] which are easily deformed
upon application of a mechanical stress [9]. Very recently, an
in-depth review on thermal techniques was given by Bauer and
Bauer-Gogonea [10].
Unlike with acoustic techniques, the electrical response
of the sample to a thermal pulse, step or wave is not a simple
function of the polarization or space-charge distribution, and
sophisticated deconvolution methods must be used to solve
the ill-conditioned problem of reconstructing the profile of
the internal electric field [11]. In the following sections, we
present an unbiased method for reconstructing distributions
penetrating deep into the sample without requiring the extra
constraints (e.g., smoothness) necessary with the widely used
regularization techniques [12].
2. Theory
The propagation of the thermal wave in the sample is described
by the heat-conduction equation
D∂2T (z, t)
∂z2=
∂T (z, t)
∂t, (1)
where T (z, t) is the temperature and D is the thermal
diffusivity of the material. For thin samples, a one-
dimensional analysis is usually sufficient, as shown by
Emmerich et al [13] and Lang [14]. For polymer films with
evaporated metal electrodes, only the polymer itself needs
to be considered, as the electrodes are usually 2–3 orders of
magnitude thinner than the polymer film. If the sinusoidally
modulated light is absorbed at z = 0, the boundary conditions
are [15]
ηj∼ eiωt − G0T = −κ∂T
∂z
∣
∣
∣
∣
z=0
(2)
and
Gd = κ∂T
∂z
∣
∣
∣
∣
z=d
, (3)
where G0 and Gd are the heat loss coefficients at the front and
rear surface, κ is the thermal conductivity of the sample and
ηj∼ eiωt is the absorbed power per unit area. For a free-standing
film, both G0 and Gd can usually be neglected, whereas
samples thermally connected to a substrate may exhibit a
substantial heat loss Gd . Under these conditions, equation (1)
is solved by [15, 16]
T (z, t) = T∼(k, z) eiωt
=ηj∼
κk
cosh[k(d − z)] + Gd
κksinh[k(d − z)]
(
1 + G0Gd
κ2k2
)
sinh(kd) + G0+Gd
κkcosh(kd)
, (4)
where the complex thermal wave vector is given by
k = (1 + i)
√
ω
2D. (5)
In the presence of a polarization p or space-charge ρ, the
thermal wave in a sample with an electrode area A gives rise
to the current [1]
I∼(ω) =iωA
d
∫ d
0
g(z)T∼(k, z) dz, (6)
with the distribution function
g(z) = (αε − αz)
∫ z
0
ρ(ξ) dξ + p(z), (7)
where αε is the temperature coefficient of the permittivity, αx is
the thermal expansion coefficient and p(z) is the pyroelectric
coefficient.
The key problem in the analysis of LIMM data is the
reconstruction of the distribution function g(z) from the
experimentally observed frequency spectrum I∼(ω).
The LIMM equation (6) is a Fredholm integral equation
of the first kind, for which the finding of a solution is an
ill-conditioned problem [17]. Within the experimental errors,
the observed current I∼(ω) can result from an infinite number
of distributions g(z), most of which are strongly oscillating
functions. Over the past 15 years, a number of techniques
have been applied to obtain a unique solution of the LIMM
equation [11]. Two widely used methods are the scanning-
function method [18] and Tikhonov regularization [12, 19].
The former approach is an approximation applicable at
frequencies where the penetration depth
zr =√
2D/ω (8)
is small compared to the sample thickness d. The approximate
distribution is then given by
ga(zr) ≈κd
ηj∼AD[Re I∼(ω) − Im I∼(ω)]. (9)
While highly effective in probing the surface region, this
technique provides little information about the polarization
or charge distribution in the bulk of the sample. Tikhonov
regularization, on the other hand, has proven to be capable of
extracting this information [20, 21]. A solution for g(z) is
obtained by minimizing the expression
χ2r =
∑
ν
∣
∣
∣
∣
I (ων)exp − I (ων)calc
σν
∣
∣
∣
∣
2
+ λ
∫ d
0
∣
∣
∣
∣
d2g(z)
dz2
∣
∣
∣
∣
2
dz,
(10)
where σν is the estimated error of the current at the frequency
ων and λ is the regularization parameter. Finding the optimum
value of λ is a non-trivial problem [19]. Recently, a new
technique based on a combination of polynomial expansion
and regularization was presented [11, 22].
A potential disadvantage of regularization methods is their
bias towards smooth solutions, as imposed by the second term
in equation (10). For sandwiched systems consisting of layers
with different polarization, as well as for polymer films with
injected space-charge layers, this often leads to an excessively
smoothed reconstruction of g(z).
In the quest for unbiased deconvolution techniques,
one finds numerous examples in the field of digital image
processing [23]. Here, the task is to restore blurred
images with a known point-spread function (PSF). Interest
in these techniques arose particularly after the launch of the
1348
70
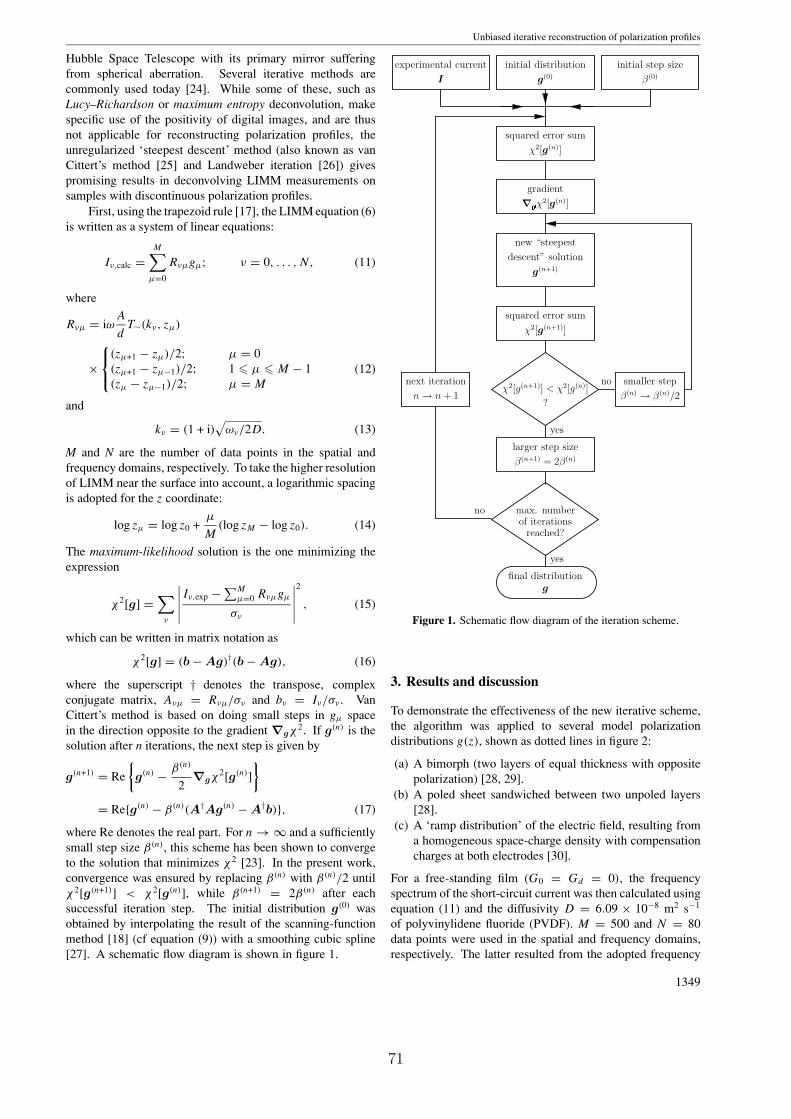
Unbiased iterative reconstruction of polarization profiles
Hubble Space Telescope with its primary mirror suffering
from spherical aberration. Several iterative methods are
commonly used today [24]. While some of these, such as
Lucy–Richardson or maximum entropy deconvolution, make
specific use of the positivity of digital images, and are thus
not applicable for reconstructing polarization profiles, the
unregularized ‘steepest descent’ method (also known as van
Cittert’s method [25] and Landweber iteration [26]) gives
promising results in deconvolving LIMM measurements on
samples with discontinuous polarization profiles.
First, using the trapezoid rule [17], the LIMM equation (6)
is written as a system of linear equations:
Iν,calc =
M∑
µ=0
Rνµgµ; ν = 0, . . . , N, (11)
where
Rνµ = iωA
dT∼(kν, zµ)
×
(zµ+1 − zµ)/2; µ = 0
(zµ+1 − zµ−1)/2; 1 µ M − 1
(zµ − zµ−1)/2; µ = M
(12)
and
kν = (1 + i)√
ων/2D. (13)
M and N are the number of data points in the spatial and
frequency domains, respectively. To take the higher resolution
of LIMM near the surface into account, a logarithmic spacing
is adopted for the z coordinate:
log zµ = log z0 +µ
M(log zM − log z0). (14)
The maximum-likelihood solution is the one minimizing the
expression
χ2[g] =∑
ν
∣
∣
∣
∣
∣
Iν,exp −∑M
µ=0 Rνµgµ
σν
∣
∣
∣
∣
∣
2
, (15)
which can be written in matrix notation as
χ2[g] = (b − Ag)†(b − Ag), (16)
where the superscript † denotes the transpose, complex
conjugate matrix, Aνµ = Rνµ/σν and bν = Iν/σν . Van
Cittert’s method is based on doing small steps in gµ space
in the direction opposite to the gradient ∇gχ2. If g(n) is the
solution after n iterations, the next step is given by
g(n+1) = Re
g(n) −β(n)
2∇gχ
2[g(n)]
= Reg(n) − β(n)(A†Ag(n) − A†b), (17)
where Re denotes the real part. For n → ∞ and a sufficiently
small step size β(n), this scheme has been shown to converge
to the solution that minimizes χ2 [23]. In the present work,
convergence was ensured by replacing β(n) with β(n)/2 until
χ2[g(n+1)] < χ2[g(n)], while β(n+1) = 2β(n) after each
successful iteration step. The initial distribution g(0) was
obtained by interpolating the result of the scanning-function
method [18] (cf equation (9)) with a smoothing cubic spline
[27]. A schematic flow diagram is shown in figure 1.
squared error sum
χ2[g(n)]
gradient
∇ χ2[g(n)]
g(n+1)
new “steepest
descent” solution
χ2[g(n+1)]
squared error sum
larger step size
β(n+1) = 2β(n)
of iterationsreached?
max. number
experimental current
I
initial distribution
g(0)
initial step size
β(0)
?
χ2[g(n+1)] < χ2[g(n)]no
yes
yes
smaller step
β(n) → β(n)/2
final distributiong
no
n → n + 1
next iteration
Figure 1. Schematic flow diagram of the iteration scheme.
3. Results and discussion
To demonstrate the effectiveness of the new iterative scheme,
the algorithm was applied to several model polarization
distributions g(z), shown as dotted lines in figure 2:
(a) A bimorph (two layers of equal thickness with opposite
polarization) [28, 29].
(b) A poled sheet sandwiched between two unpoled layers
[28].
(c) A ‘ramp distribution’ of the electric field, resulting from
a homogeneous space-charge density with compensation
charges at both electrodes [30].
For a free-standing film (G0 = Gd = 0), the frequency
spectrum of the short-circuit current was then calculated using
equation (11) and the diffusivity D = 6.09 × 10⁻⁸ m2 s−1
of polyvinylidene fluoride (PVDF). M = 500 and N = 80
data points were used in the spatial and frequency domains,
respectively. The latter resulted from the adopted frequency
1349
71

A Mellinger
–1
0
1
2(a)
originaln=10
n=1000n=10000
0
1
po
lari
za
tio
n [
a.u
.]
(b)original
n=10n=100
n=1000
–1
0
1
0 5 10 15 20
depth z [µm]
(c )
originaln=10
n=100n=1000
Figure 2. Iterative solution of the LIMM equation using syntheticdistributions. (a) Bimorph, (b) poled layer, (c) uniform space-chargedensity with compensation charges at the electrodes. The insetsshow the schematic layer structure.
range of 10 Hz to 100 kHz with 20 data points per decade,
which represents typical experimental conditions. At 10 Hz,
the penetration depth (2D/ω)1/2 of the thermal wave is
significantly larger than the assumed film thickness of 20 µm,
while 100 kHz represents the upper frequency limit of many
commercial lock-in amplifiers. To simulate experimental
conditions, two random-noise contributions with a Gaussian
distribution were added:
• standard deviation of 2% of the signal strength (to simulate
fluctuations in the laser intensity), and
• standard deviation of 5 pA (to simulate background noise).
As an example, figure 3 shows the calculated current spectrum
for a bimorph sample. All calculations were carried out with
Octave [31] programs on a 1.5 GHz Intel R© Pentium 4 personal
computer. The typical execution speed was ten iterations per
second.
The reconstructed profiles are shown in figure 2 for
different numbers of iterations. Initially, the curves converge
to the true profile, but develop increasing artefacts for higher
n. It is therefore essential that the iteration process be
stopped before achieving full convergence. To compare the
reconstructed profile gµ against the original distribution g(orig)µ
(shown as dotted lines in figure 2), the quantity
ψ2 =
M∑
µ=0
[
zµ
zM
(
gµ − g(orig)µ
)
]2
(18)
10–14
10–13
10–12
10–11
10–10
10–9
101
102
103
104
105
curr
ent [A
]
frequency [Hz]
real
imag
Figure 3. Calculated frequency spectrum of the pyroelectric currentfor a bimorph sample. The open squares and circles show the realand imaginary parts of the current calculated from the distributionplotted in figure 2(a) with additional Gaussian noise (see text fordetails). The solid and dashed lines represent the current calculatedfrom the reconstructed profile after 10 000 iterations.
100
101
102
101
102
103
104
(a): bimorph
Vminχ2=N
10–1
100
101
101
102
103
ψ2
χ2
(b): layer
Vmin
10–1
100
101
100
101
102
103
104
10510
1
102
103
104
niter
(c ): space charge
Vminχ2=N
Figure 4. Squared error sums for the polarization profile (ψ2, solidlines) and the pyroelectric current (χ 2, dashed lines) versus numberof iterations. The arrows indicate the termination points given bythe two methods discussed in the text: χ 2 = N (not reached in case(b)) and the minimum of V (n) defined in equation (19) and depictedin figure 5.
was used as a figure-of-merit. Here, the error differences
are scaled with the factor zµ/zM in order to assign equal
weights to all depths, even though the zµ values are scaled
logarithmically according to equation (14). The dependence
of ψ2 and χ2 on the number of iterations is shown in figure 4.
Evidently, the optimum number of iterations nopt (where ψ2
reaches a minimum) is very different for the three model
profiles. Reconstructing the bimorph profile required approx.
4400 iteration steps, whereas for the space-charge profile,
ψ2 was minimized after only 200 iterations. Obviously,
ψ2 cannot be calculated from experimental data, since the
true polarization profile is unknown. Even though the broad
1350
72
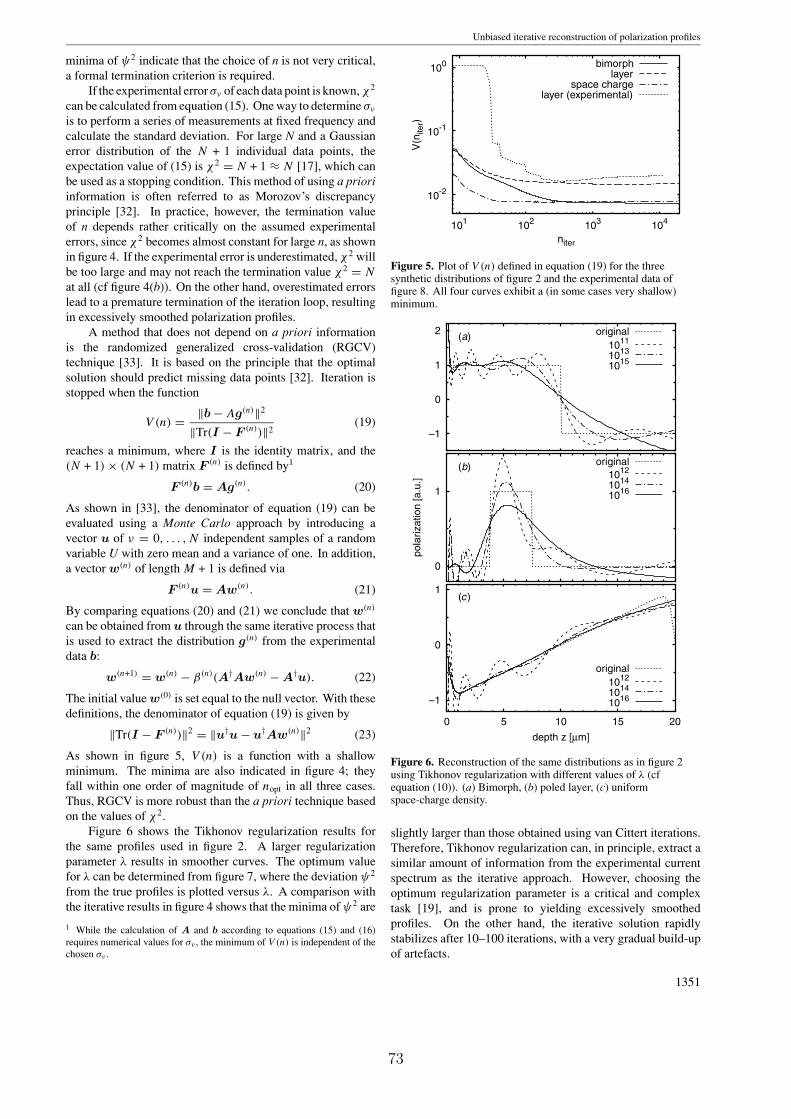
Unbiased iterative reconstruction of polarization profiles
minima of ψ2 indicate that the choice of n is not very critical,
a formal termination criterion is required.
If the experimental error σν of each data point is known, χ2
can be calculated from equation (15). One way to determine σν
is to perform a series of measurements at fixed frequency and
calculate the standard deviation. For large N and a Gaussian
error distribution of the N + 1 individual data points, the
expectation value of (15) is χ2 = N + 1 ≈ N [17], which can
be used as a stopping condition. This method of using a priori
information is often referred to as Morozov’s discrepancy
principle [32]. In practice, however, the termination value
of n depends rather critically on the assumed experimental
errors, since χ2 becomes almost constant for large n, as shown
in figure 4. If the experimental error is underestimated, χ2 will
be too large and may not reach the termination value χ2 = N
at all (cf figure 4(b)). On the other hand, overestimated errors
lead to a premature termination of the iteration loop, resulting
in excessively smoothed polarization profiles.
A method that does not depend on a priori information
is the randomized generalized cross-validation (RGCV)
technique [33]. It is based on the principle that the optimal
solution should predict missing data points [32]. Iteration is
stopped when the function
V (n) =‖b − Ag(n)‖2
‖Tr(I − F (n))‖2(19)
reaches a minimum, where I is the identity matrix, and the
(N + 1) × (N + 1) matrix F (n) is defined by1
F (n)b = Ag(n). (20)
As shown in [33], the denominator of equation (19) can be
evaluated using a Monte Carlo approach by introducing a
vector u of ν = 0, . . . , N independent samples of a random
variable U with zero mean and a variance of one. In addition,
a vector w(n) of length M + 1 is defined via
F (n)u = Aw(n). (21)
By comparing equations (20) and (21) we conclude that w(n)
can be obtained from u through the same iterative process that
is used to extract the distribution g(n) from the experimental
data b:
w(n+1) = w(n) − β(n)(A†Aw(n) − A†u). (22)
The initial value w(0) is set equal to the null vector. With these
definitions, the denominator of equation (19) is given by
‖Tr(I − F (n))‖2 = ‖u†u − u†Aw(n)‖2 (23)
As shown in figure 5, V (n) is a function with a shallow
minimum. The minima are also indicated in figure 4; they
fall within one order of magnitude of nopt in all three cases.
Thus, RGCV is more robust than the a priori technique based
on the values of χ2.
Figure 6 shows the Tikhonov regularization results for
the same profiles used in figure 2. A larger regularization
parameter λ results in smoother curves. The optimum value
for λ can be determined from figure 7, where the deviation ψ2
from the true profiles is plotted versus λ. A comparison with
the iterative results in figure 4 shows that the minima of ψ2 are
1 While the calculation of A and b according to equations (15) and (16)
requires numerical values for σν , the minimum of V (n) is independent of the
chosen σν .
10-2
10-1
100
101
102
103
104
V(n
ite
r)
niter
bimorphlayer
space chargelayer (experimental)
Figure 5. Plot of V (n) defined in equation (19) for the threesynthetic distributions of figure 2 and the experimental data offigure 8. All four curves exhibit a (in some cases very shallow)minimum.
–1
0
1
2(a)
original
1011
1013
1015
0
1
po
lari
za
tio
n [
a.u
.]
(b)original
1012
1014
1016
–1
0
1
0 5 10 15 20
depth z [µm]
(c )
original
1012
1014
1016
Figure 6. Reconstruction of the same distributions as in figure 2using Tikhonov regularization with different values of λ (cfequation (10)). (a) Bimorph, (b) poled layer, (c) uniformspace-charge density.
slightly larger than those obtained using van Cittert iterations.
Therefore, Tikhonov regularization can, in principle, extract a
similar amount of information from the experimental current
spectrum as the iterative approach. However, choosing the
optimum regularization parameter is a critical and complex
task [19], and is prone to yielding excessively smoothed
profiles. On the other hand, the iterative solution rapidly
stabilizes after 10–100 iterations, with a very gradual build-up
of artefacts.
1351
73
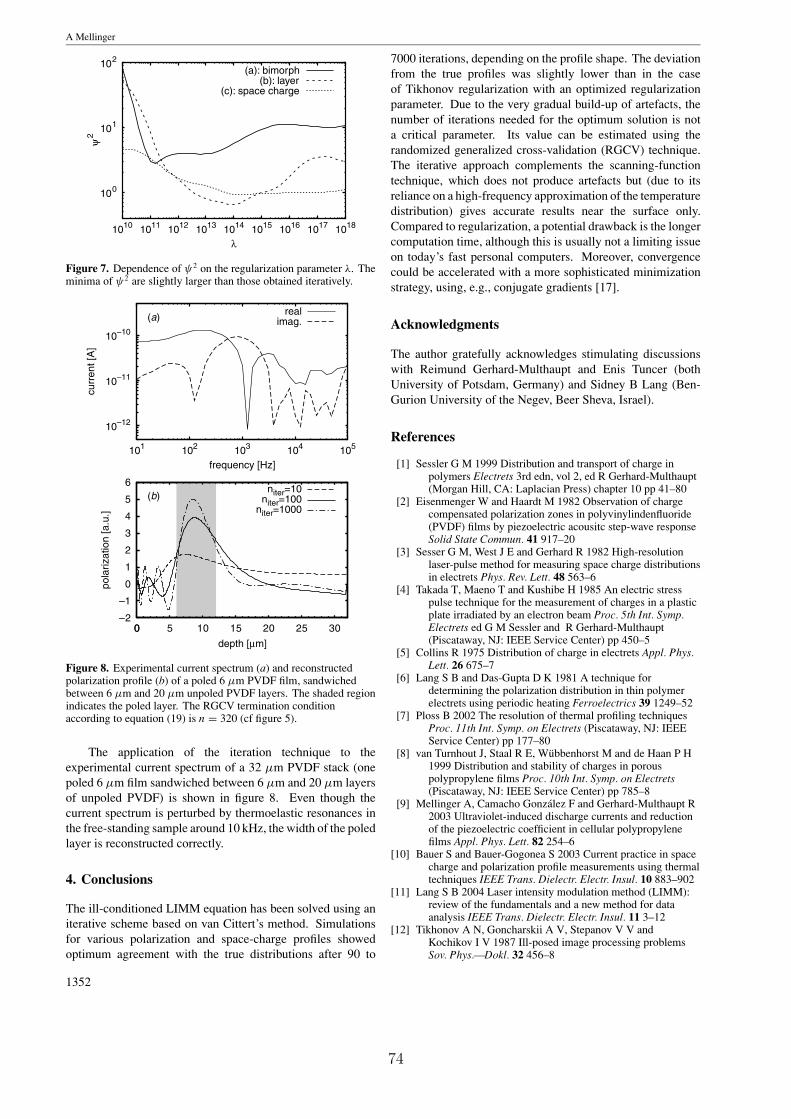
A Mellinger
100
101
102
1010
1011
1012
1013
1014
1015
1016
1017
1018
ψ2
λ
(a): bimorph(b): layer
(c): space charge
Figure 7. Dependence of ψ2 on the regularization parameter λ. Theminima of ψ2 are slightly larger than those obtained iteratively.
10–12
10–11
10–10
101
102
103
104
105
cu
rre
nt
[A]
frequency [Hz]
(a)real
imag.
–2
–1
0
1
2
3
4
5
6
0 5 10 15 20 25 30
po
lari
za
tio
n [
a.u
.]
depth [µm]
(b)
0
niter=10niter=100
niter=1000
Figure 8. Experimental current spectrum (a) and reconstructedpolarization profile (b) of a poled 6 µm PVDF film, sandwichedbetween 6 µm and 20 µm unpoled PVDF layers. The shaded regionindicates the poled layer. The RGCV termination conditionaccording to equation (19) is n = 320 (cf figure 5).
The application of the iteration technique to the
experimental current spectrum of a 32 µm PVDF stack (one
poled 6 µm film sandwiched between 6 µm and 20 µm layers
of unpoled PVDF) is shown in figure 8. Even though the
current spectrum is perturbed by thermoelastic resonances in
the free-standing sample around 10 kHz, the width of the poled
layer is reconstructed correctly.
4. Conclusions
The ill-conditioned LIMM equation has been solved using an
iterative scheme based on van Cittert’s method. Simulations
for various polarization and space-charge profiles showed
optimum agreement with the true distributions after 90 to
7000 iterations, depending on the profile shape. The deviation
from the true profiles was slightly lower than in the case
of Tikhonov regularization with an optimized regularization
parameter. Due to the very gradual build-up of artefacts, the
number of iterations needed for the optimum solution is not
a critical parameter. Its value can be estimated using the
randomized generalized cross-validation (RGCV) technique.
The iterative approach complements the scanning-function
technique, which does not produce artefacts but (due to its
reliance on a high-frequency approximation of the temperature
distribution) gives accurate results near the surface only.
Compared to regularization, a potential drawback is the longer
computation time, although this is usually not a limiting issue
on today’s fast personal computers. Moreover, convergence
could be accelerated with a more sophisticated minimization
strategy, using, e.g., conjugate gradients [17].
Acknowledgments
The author gratefully acknowledges stimulating discussions
with Reimund Gerhard-Multhaupt and Enis Tuncer (both
University of Potsdam, Germany) and Sidney B Lang (Ben-
Gurion University of the Negev, Beer Sheva, Israel).
References
[1] Sessler G M 1999 Distribution and transport of charge inpolymers Electrets 3rd edn, vol 2, ed R Gerhard-Multhaupt(Morgan Hill, CA: Laplacian Press) chapter 10 pp 41–80
[2] Eisenmenger W and Haardt M 1982 Observation of chargecompensated polarization zones in polyvinylindenfluoride(PVDF) films by piezoelectric acousitc step-wave responseSolid State Commun. 41 917–20
[3] Sesser G M, West J E and Gerhard R 1982 High-resolutionlaser-pulse method for measuring space charge distributionsin electrets Phys. Rev. Lett. 48 563–6
[4] Takada T, Maeno T and Kushibe H 1985 An electric stresspulse technique for the measurement of charges in a plasticplate irradiated by an electron beam Proc. 5th Int. Symp.Electrets ed G M Sessler and R Gerhard-Multhaupt(Piscataway, NJ: IEEE Service Center) pp 450–5
[5] Collins R 1975 Distribution of charge in electrets Appl. Phys.Lett. 26 675–7
[6] Lang S B and Das-Gupta D K 1981 A technique fordetermining the polarization distribution in thin polymerelectrets using periodic heating Ferroelectrics 39 1249–52
[7] Ploss B 2002 The resolution of thermal profiling techniquesProc. 11th Int. Symp. on Electrets (Piscataway, NJ: IEEEService Center) pp 177–80
[8] van Turnhout J, Staal R E, Wubbenhorst M and de Haan P H1999 Distribution and stability of charges in porouspolypropylene films Proc. 10th Int. Symp. on Electrets(Piscataway, NJ: IEEE Service Center) pp 785–8
[9] Mellinger A, Camacho Gonzalez F and Gerhard-Multhaupt R2003 Ultraviolet-induced discharge currents and reductionof the piezoelectric coefficient in cellular polypropylenefilms Appl. Phys. Lett. 82 254–6
[10] Bauer S and Bauer-Gogonea S 2003 Current practice in spacecharge and polarization profile measurements using thermaltechniques IEEE Trans. Dielectr. Electr. Insul. 10 883–902
[11] Lang S B 2004 Laser intensity modulation method (LIMM):review of the fundamentals and a new method for dataanalysis IEEE Trans. Dielectr. Electr. Insul. 11 3–12
[12] Tikhonov A N, Goncharskii A V, Stepanov V V andKochikov I V 1987 Ill-posed image processing problemsSov. Phys.—Dokl. 32 456–8
1352
74
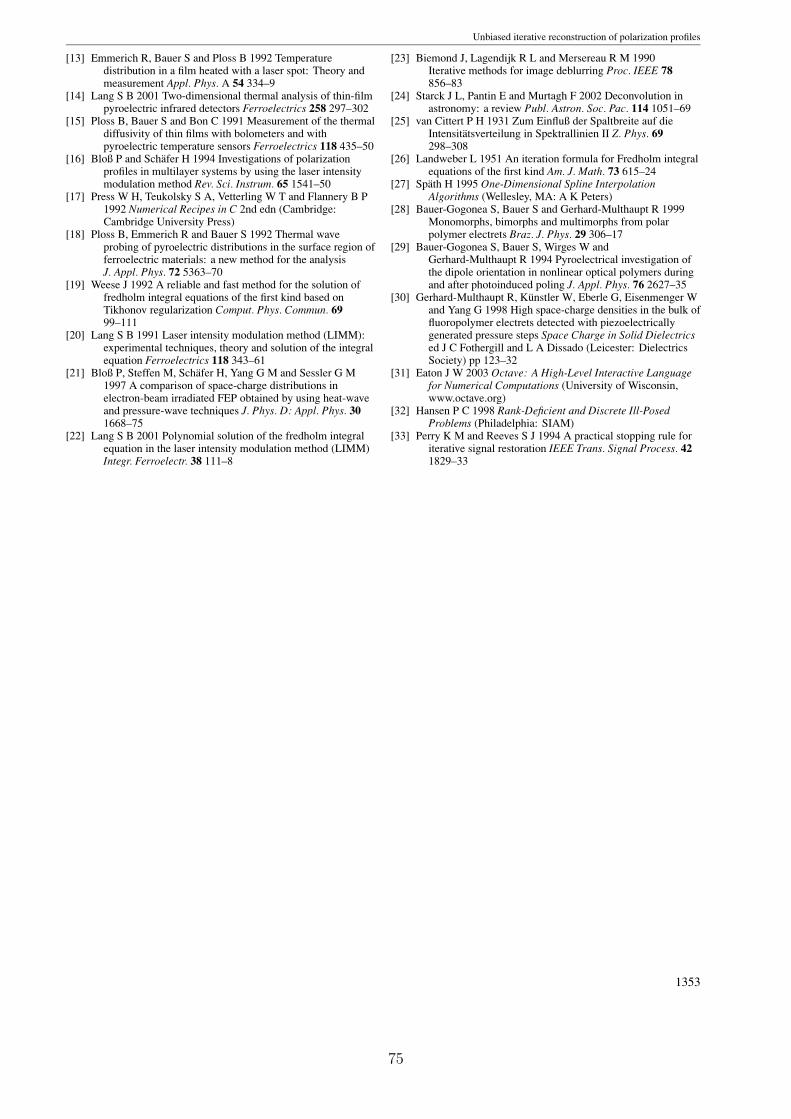
Unbiased iterative reconstruction of polarization profiles
[13] Emmerich R, Bauer S and Ploss B 1992 Temperaturedistribution in a film heated with a laser spot: Theory andmeasurement Appl. Phys. A 54 334–9
[14] Lang S B 2001 Two-dimensional thermal analysis of thin-filmpyroelectric infrared detectors Ferroelectrics 258 297–302
[15] Ploss B, Bauer S and Bon C 1991 Measurement of the thermaldiffusivity of thin films with bolometers and withpyroelectric temperature sensors Ferroelectrics 118 435–50
[16] Bloß P and Schafer H 1994 Investigations of polarizationprofiles in multilayer systems by using the laser intensitymodulation method Rev. Sci. Instrum. 65 1541–50
[17] Press W H, Teukolsky S A, Vetterling W T and Flannery B P1992 Numerical Recipes in C 2nd edn (Cambridge:Cambridge University Press)
[18] Ploss B, Emmerich R and Bauer S 1992 Thermal waveprobing of pyroelectric distributions in the surface region offerroelectric materials: a new method for the analysisJ. Appl. Phys. 72 5363–70
[19] Weese J 1992 A reliable and fast method for the solution offredholm integral equations of the first kind based onTikhonov regularization Comput. Phys. Commun. 6999–111
[20] Lang S B 1991 Laser intensity modulation method (LIMM):experimental techniques, theory and solution of the integralequation Ferroelectrics 118 343–61
[21] Bloß P, Steffen M, Schafer H, Yang G M and Sessler G M1997 A comparison of space-charge distributions inelectron-beam irradiated FEP obtained by using heat-waveand pressure-wave techniques J. Phys. D: Appl. Phys. 301668–75
[22] Lang S B 2001 Polynomial solution of the fredholm integralequation in the laser intensity modulation method (LIMM)Integr. Ferroelectr. 38 111–8
[23] Biemond J, Lagendijk R L and Mersereau R M 1990Iterative methods for image deblurring Proc. IEEE 78856–83
[24] Starck J L, Pantin E and Murtagh F 2002 Deconvolution inastronomy: a review Publ. Astron. Soc. Pac. 114 1051–69
[25] van Cittert P H 1931 Zum Einfluß der Spaltbreite auf dieIntensitatsverteilung in Spektrallinien II Z. Phys. 69298–308
[26] Landweber L 1951 An iteration formula for Fredholm integralequations of the first kind Am. J. Math. 73 615–24
[27] Spath H 1995 One-Dimensional Spline InterpolationAlgorithms (Wellesley, MA: A K Peters)
[28] Bauer-Gogonea S, Bauer S and Gerhard-Multhaupt R 1999Monomorphs, bimorphs and multimorphs from polarpolymer electrets Braz. J. Phys. 29 306–17
[29] Bauer-Gogonea S, Bauer S, Wirges W andGerhard-Multhaupt R 1994 Pyroelectrical investigation ofthe dipole orientation in nonlinear optical polymers duringand after photoinduced poling J. Appl. Phys. 76 2627–35
[30] Gerhard-Multhaupt R, Kunstler W, Eberle G, Eisenmenger Wand Yang G 1998 High space-charge densities in the bulk offluoropolymer electrets detected with piezoelectricallygenerated pressure steps Space Charge in Solid Dielectricsed J C Fothergill and L A Dissado (Leicester: DielectricsSociety) pp 123–32
[31] Eaton J W 2003 Octave: A High-Level Interactive Languagefor Numerical Computations (University of Wisconsin,www.octave.org)
[32] Hansen P C 1998 Rank-Deficient and Discrete Ill-PosedProblems (Philadelphia: SIAM)
[33] Perry K M and Reeves S J 1994 A practical stopping rule foriterative signal restoration IEEE Trans. Signal Process. 421829–33
1353
75
76 A JOURNAL AND REVIEW ARTICLES
Errata
to: A. Mellinger, “Unbiased iterative reconstruction of polarization and space-charge
profiles from thermal-wave experiments”, Meas. Sci. Technology 15, 1347-1353 (2004).
On p. 1348, Eq. (3) should read
GdT = κ∂T
∂z
∣∣∣∣∣z=d
On p. 1348, Eq. (4) should read
T (z, t) = T∼(k, z)eiωt
=ηj∼κk
cosh[k(d− z)] + Gdκk sinh[k(d− z)](
1 + G0Gd
κ2k2
)sinh(kd) + G0 + Gd
κk cosh(kd)eiωt
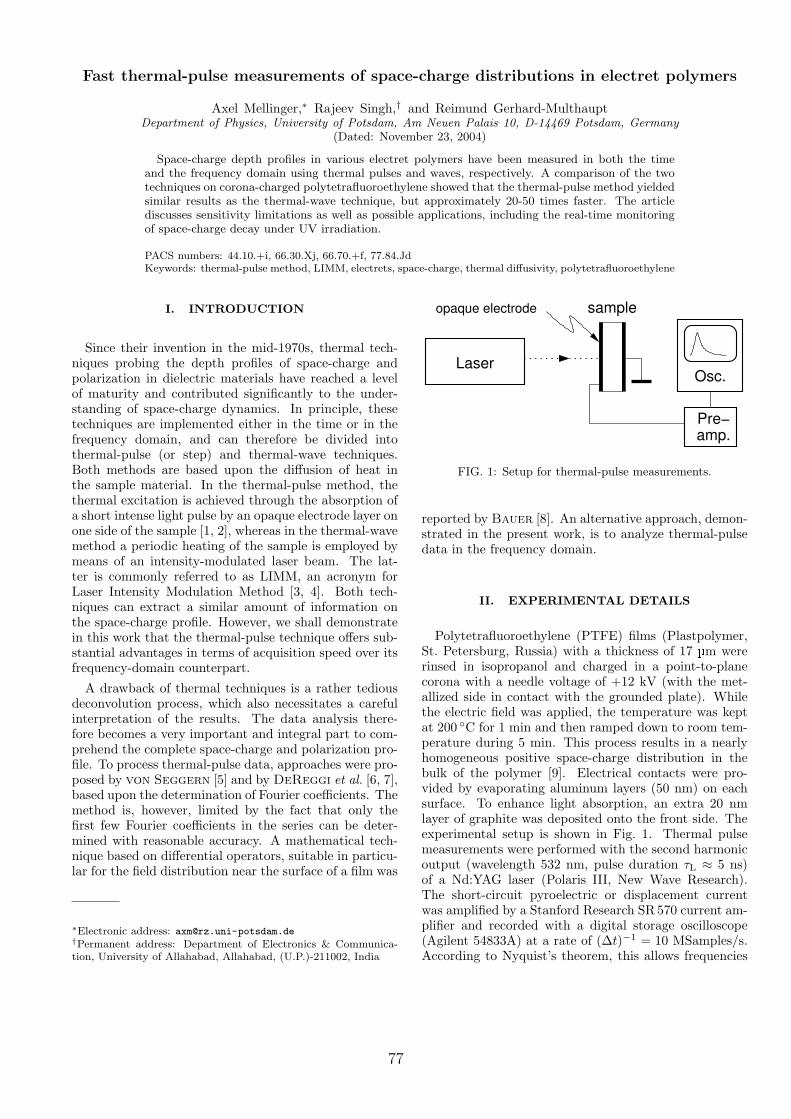
Fast thermal-pulse measurements of space-charge distributions in electret polymers
Axel Mellinger,∗ Rajeev Singh,† and Reimund Gerhard-MulthauptDepartment of Physics, University of Potsdam, Am Neuen Palais 10, D-14469 Potsdam, Germany
(Dated: November 23, 2004)
Space-charge depth profiles in various electret polymers have been measured in both the timeand the frequency domain using thermal pulses and waves, respectively. A comparison of the twotechniques on corona-charged polytetrafluoroethylene showed that the thermal-pulse method yieldedsimilar results as the thermal-wave technique, but approximately 20-50 times faster. The articlediscusses sensitivity limitations as well as possible applications, including the real-time monitoringof space-charge decay under UV irradiation.
PACS numbers: 44.10.+i, 66.30.Xj, 66.70.+f, 77.84.JdKeywords: thermal-pulse method, LIMM, electrets, space-charge, thermal diffusivity, polytetrafluoroethylene
I. INTRODUCTION
Since their invention in the mid-1970s, thermal tech-niques probing the depth profiles of space-charge andpolarization in dielectric materials have reached a levelof maturity and contributed significantly to the under-standing of space-charge dynamics. In principle, thesetechniques are implemented either in the time or in thefrequency domain, and can therefore be divided intothermal-pulse (or step) and thermal-wave techniques.Both methods are based upon the diffusion of heat inthe sample material. In the thermal-pulse method, thethermal excitation is achieved through the absorption ofa short intense light pulse by an opaque electrode layer onone side of the sample [1, 2], whereas in the thermal-wavemethod a periodic heating of the sample is employed bymeans of an intensity-modulated laser beam. The lat-ter is commonly referred to as LIMM, an acronym forLaser Intensity Modulation Method [3, 4]. Both tech-niques can extract a similar amount of information onthe space-charge profile. However, we shall demonstratein this work that the thermal-pulse technique offers sub-stantial advantages in terms of acquisition speed over itsfrequency-domain counterpart.
A drawback of thermal techniques is a rather tediousdeconvolution process, which also necessitates a carefulinterpretation of the results. The data analysis there-fore becomes a very important and integral part to com-prehend the complete space-charge and polarization pro-file. To process thermal-pulse data, approaches were pro-posed by von Seggern [5] and by DeReggi et al. [6, 7],based upon the determination of Fourier coefficients. Themethod is, however, limited by the fact that only thefirst few Fourier coefficients in the series can be deter-mined with reasonable accuracy. A mathematical tech-nique based on differential operators, suitable in particu-lar for the field distribution near the surface of a film was
∗Electronic address: [email protected]†Permanent address: Department of Electronics & Communica-tion, University of Allahabad, Allahabad, (U.P.)-211002, India
LaserOsc.
Pre−
opaque electrode
amp.
sample
FIG. 1: Setup for thermal-pulse measurements.
reported by Bauer [8]. An alternative approach, demon-strated in the present work, is to analyze thermal-pulsedata in the frequency domain.
II. EXPERIMENTAL DETAILS
Polytetrafluoroethylene (PTFE) films (Plastpolymer,St. Petersburg, Russia) with a thickness of 17 µm wererinsed in isopropanol and charged in a point-to-planecorona with a needle voltage of +12 kV (with the met-allized side in contact with the grounded plate). Whilethe electric field was applied, the temperature was keptat 200 C for 1 min and then ramped down to room tem-perature during 5 min. This process results in a nearlyhomogeneous positive space-charge distribution in thebulk of the polymer [9]. Electrical contacts were pro-vided by evaporating aluminum layers (50 nm) on eachsurface. To enhance light absorption, an extra 20 nmlayer of graphite was deposited onto the front side. Theexperimental setup is shown in Fig. 1. Thermal pulsemeasurements were performed with the second harmonicoutput (wavelength 532 nm, pulse duration τL ≈ 5 ns)of a Nd:YAG laser (Polaris III, New Wave Research).The short-circuit pyroelectric or displacement currentwas amplified by a Stanford Research SR 570 current am-plifier and recorded with a digital storage oscilloscope(Agilent 54833A) at a rate of (∆t)−1 = 10 MSamples/s.According to Nyquist’s theorem, this allows frequencies
77
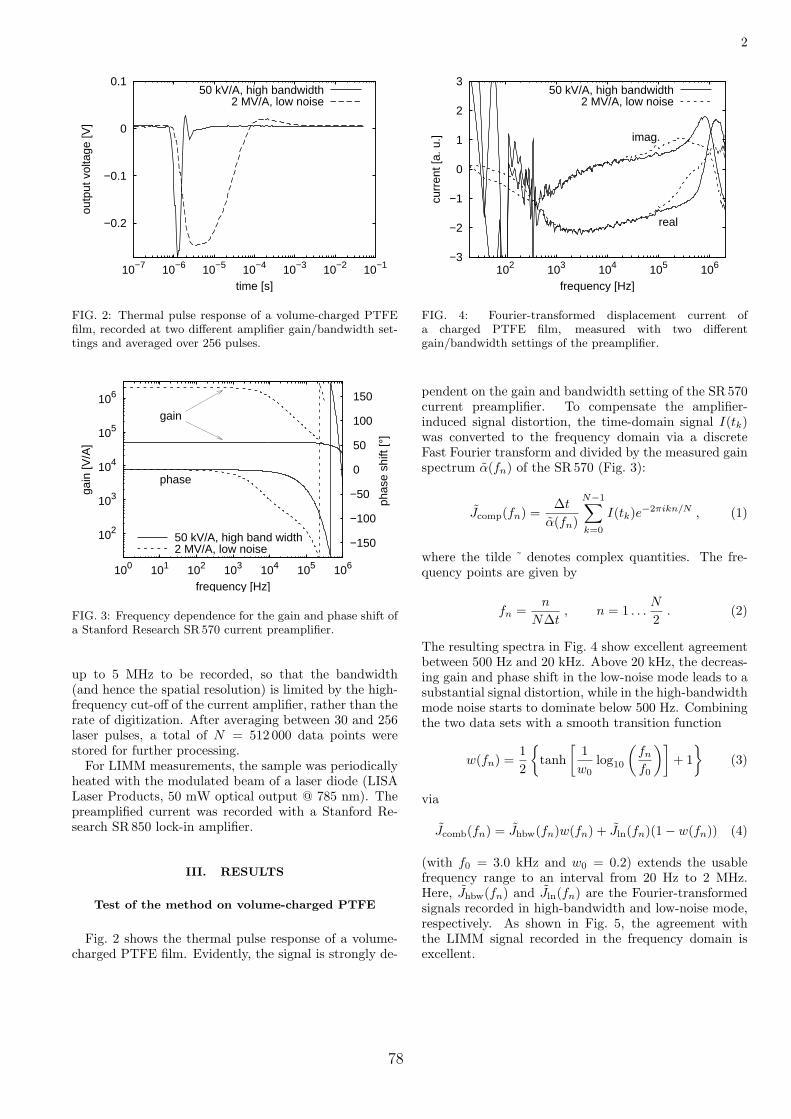
2
−0.2
−0.1
0
0.1
10−7 10−6 10−5 10−4 10−3 10−2 10−1
outp
ut v
olta
ge [V
]
time [s]
50 kV/A, high bandwidth2 MV/A, low noise
FIG. 2: Thermal pulse response of a volume-charged PTFEfilm, recorded at two different amplifier gain/bandwidth set-tings and averaged over 256 pulses.
102
103
104
105
106
100 101 102 103 104 105 106
−150
−100
−50
0
50
100
150
gain
[V/A
]
phas
e sh
ift [°
]
frequency [Hz]
gain
phase
50 kV/A, high band width2 MV/A, low noise
FIG. 3: Frequency dependence for the gain and phase shift ofa Stanford Research SR 570 current preamplifier.
up to 5 MHz to be recorded, so that the bandwidth(and hence the spatial resolution) is limited by the high-frequency cut-off of the current amplifier, rather than therate of digitization. After averaging between 30 and 256laser pulses, a total of N = 512 000 data points werestored for further processing.
For LIMM measurements, the sample was periodicallyheated with the modulated beam of a laser diode (LISALaser Products, 50 mW optical output @ 785 nm). Thepreamplified current was recorded with a Stanford Re-search SR850 lock-in amplifier.
III. RESULTS
Test of the method on volume-charged PTFE
Fig. 2 shows the thermal pulse response of a volume-charged PTFE film. Evidently, the signal is strongly de-
−3
−2
−1
0
1
2
3
102 103 104 105 106
curr
ent [
a. u
.]
frequency [Hz]
real
imag.
50 kV/A, high bandwidth2 MV/A, low noise
FIG. 4: Fourier-transformed displacement current ofa charged PTFE film, measured with two differentgain/bandwidth settings of the preamplifier.
pendent on the gain and bandwidth setting of the SR 570current preamplifier. To compensate the amplifier-induced signal distortion, the time-domain signal I(tk)was converted to the frequency domain via a discreteFast Fourier transform and divided by the measured gainspectrum α(fn) of the SR 570 (Fig. 3):
Jcomp(fn) =∆t
α(fn)
N−1∑k=0
I(tk)e−2πikn/N , (1)
where the tilde ˜ denotes complex quantities. The fre-quency points are given by
fn =n
N∆t, n = 1 . . .
N
2. (2)
The resulting spectra in Fig. 4 show excellent agreementbetween 500 Hz and 20 kHz. Above 20 kHz, the decreas-ing gain and phase shift in the low-noise mode leads to asubstantial signal distortion, while in the high-bandwidthmode noise starts to dominate below 500 Hz. Combiningthe two data sets with a smooth transition function
w(fn) =12
tanh
[1w0
log10
(fn
f0
)]+ 1
(3)
via
Jcomb(fn) = Jhbw(fn)w(fn) + Jln(fn)(1− w(fn)) (4)
(with f0 = 3.0 kHz and w0 = 0.2) extends the usablefrequency range to an interval from 20 Hz to 2 MHz.Here, Jhbw(fn) and Jln(fn) are the Fourier-transformedsignals recorded in high-bandwidth and low-noise mode,respectively. As shown in Fig. 5, the agreement withthe LIMM signal recorded in the frequency domain isexcellent.
78
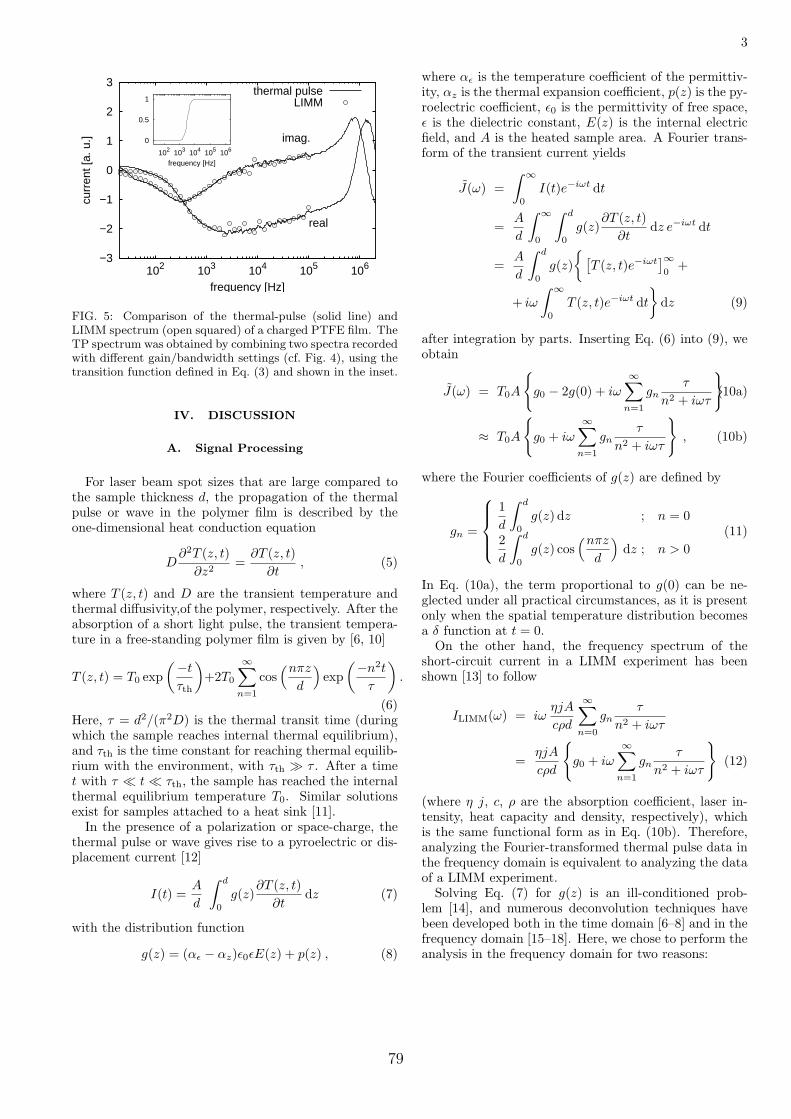
3
−3
−2
−1
0
1
2
3
102 103 104 105 106
curr
ent [
a. u
.]
frequency [Hz]
real
imag.
thermal pulseLIMM
0
0.5
1
102 103 104 105 106
frequency [Hz]
FIG. 5: Comparison of the thermal-pulse (solid line) andLIMM spectrum (open squared) of a charged PTFE film. TheTP spectrum was obtained by combining two spectra recordedwith different gain/bandwidth settings (cf. Fig. 4), using thetransition function defined in Eq. (3) and shown in the inset.
IV. DISCUSSION
A. Signal Processing
For laser beam spot sizes that are large compared tothe sample thickness d, the propagation of the thermalpulse or wave in the polymer film is described by theone-dimensional heat conduction equation
D∂2T (z, t)
∂z2=
∂T (z, t)∂t
, (5)
where T (z, t) and D are the transient temperature andthermal diffusivity,of the polymer, respectively. After theabsorption of a short light pulse, the transient tempera-ture in a free-standing polymer film is given by [6, 10]
T (z, t) = T0 exp(−t
τth
)+2T0
∞∑n=1
cos(nπz
d
)exp
(−n2t
τ
).
(6)Here, τ = d2/(π2D) is the thermal transit time (duringwhich the sample reaches internal thermal equilibrium),and τth is the time constant for reaching thermal equilib-rium with the environment, with τth τ . After a timet with τ t τth, the sample has reached the internalthermal equilibrium temperature T0. Similar solutionsexist for samples attached to a heat sink [11].
In the presence of a polarization or space-charge, thethermal pulse or wave gives rise to a pyroelectric or dis-placement current [12]
I(t) =A
d
∫ d
0
g(z)∂T (z, t)
∂tdz (7)
with the distribution function
g(z) = (αε − αz)ε0εE(z) + p(z) , (8)
where αε is the temperature coefficient of the permittiv-ity, αz is the thermal expansion coefficient, p(z) is the py-roelectric coefficient, ε0 is the permittivity of free space,ε is the dielectric constant, E(z) is the internal electricfield, and A is the heated sample area. A Fourier trans-form of the transient current yields
J(ω) =∫ ∞
0
I(t)e−iωt dt
=A
d
∫ ∞
0
∫ d
0
g(z)∂T (z, t)
∂tdz e−iωt dt
=A
d
∫ d
0
g(z) [
T (z, t)e−iωt]∞0
+
+ iω
∫ ∞
0
T (z, t)e−iωt dt
dz (9)
after integration by parts. Inserting Eq. (6) into (9), weobtain
J(ω) = T0A
g0 − 2g(0) + iω
∞∑n=1
gnτ
n2 + iωτ
(10a)
≈ T0A
g0 + iω
∞∑n=1
gnτ
n2 + iωτ
, (10b)
where the Fourier coefficients of g(z) are defined by
gn =
1d
∫ d
0
g(z) dz ; n = 0
2d
∫ d
0
g(z) cos(nπz
d
)dz ; n > 0
(11)
In Eq. (10a), the term proportional to g(0) can be ne-glected under all practical circumstances, as it is presentonly when the spatial temperature distribution becomesa δ function at t = 0.
On the other hand, the frequency spectrum of theshort-circuit current in a LIMM experiment has beenshown [13] to follow
ILIMM(ω) = iωηjA
cρd
∞∑n=0
gnτ
n2 + iωτ
=ηjA
cρd
g0 + iω
∞∑n=1
gnτ
n2 + iωτ
(12)
(where η j, c, ρ are the absorption coefficient, laser in-tensity, heat capacity and density, respectively), whichis the same functional form as in Eq. (10b). Therefore,analyzing the Fourier-transformed thermal pulse data inthe frequency domain is equivalent to analyzing the dataof a LIMM experiment.
Solving Eq. (7) for g(z) is an ill-conditioned prob-lem [14], and numerous deconvolution techniques havebeen developed both in the time domain [6–8] and in thefrequency domain [15–18]. Here, we chose to perform theanalysis in the frequency domain for two reasons:
79
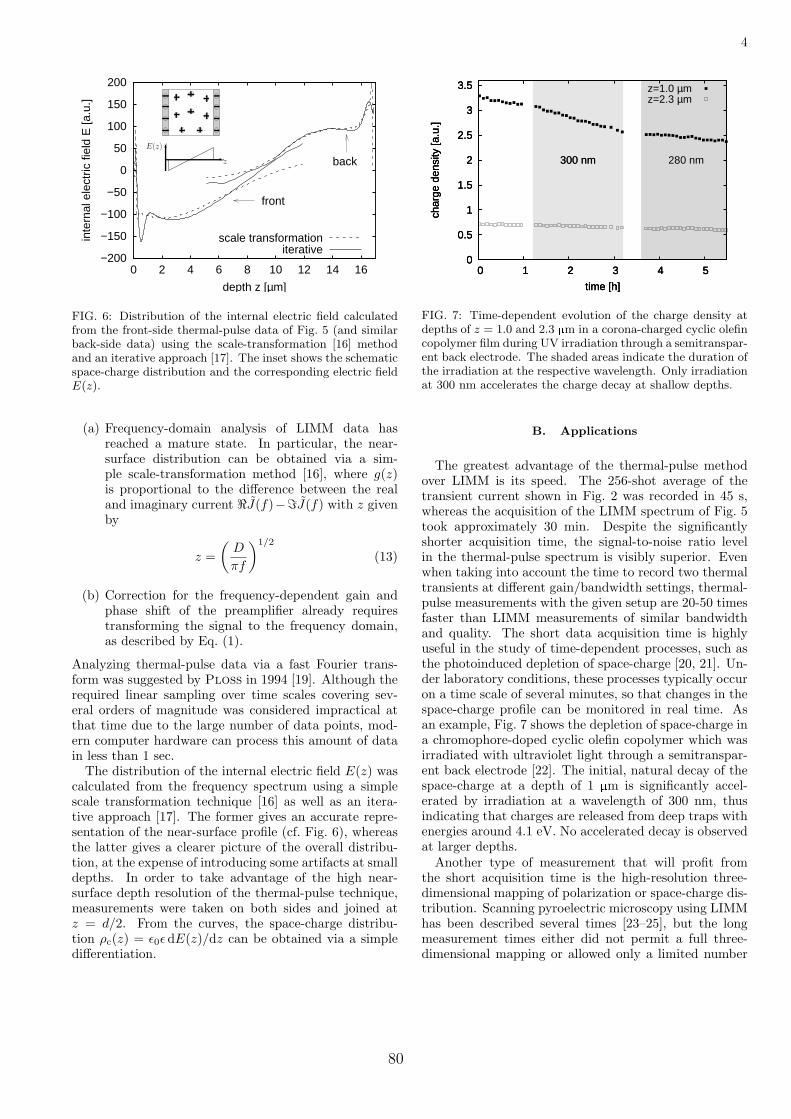
4
−200
−150
−100
−50
0
50
100
150
200
0 2 4 6 8 10 12 14 16
inte
rnal
ele
ctric
fiel
d E
[a.u
.]
depth z [µm]
back
front
scale transformationiterative
E(z)
z
FIG. 6: Distribution of the internal electric field calculatedfrom the front-side thermal-pulse data of Fig. 5 (and similarback-side data) using the scale-transformation [16] methodand an iterative approach [17]. The inset shows the schematicspace-charge distribution and the corresponding electric fieldE(z).
(a) Frequency-domain analysis of LIMM data hasreached a mature state. In particular, the near-surface distribution can be obtained via a sim-ple scale-transformation method [16], where g(z)is proportional to the difference between the realand imaginary current <J(f)−=J(f) with z givenby
z =(
D
πf
)1/2
(13)
(b) Correction for the frequency-dependent gain andphase shift of the preamplifier already requirestransforming the signal to the frequency domain,as described by Eq. (1).
Analyzing thermal-pulse data via a fast Fourier trans-form was suggested by Ploss in 1994 [19]. Although therequired linear sampling over time scales covering sev-eral orders of magnitude was considered impractical atthat time due to the large number of data points, mod-ern computer hardware can process this amount of datain less than 1 sec.
The distribution of the internal electric field E(z) wascalculated from the frequency spectrum using a simplescale transformation technique [16] as well as an itera-tive approach [17]. The former gives an accurate repre-sentation of the near-surface profile (cf. Fig. 6), whereasthe latter gives a clearer picture of the overall distribu-tion, at the expense of introducing some artifacts at smalldepths. In order to take advantage of the high near-surface depth resolution of the thermal-pulse technique,measurements were taken on both sides and joined atz = d/2. From the curves, the space-charge distribu-tion ρc(z) = ε0ε dE(z)/dz can be obtained via a simpledifferentiation.
0
0.5
1
1.5
2
2.5
3
3.5
0 1 2 3 4 5
char
ge d
ensi
ty [a
.u.]
time [h]
300 nm
0
0.5
1
1.5
2
2.5
3
3.5
0 1 2 3 4 5
char
ge d
ensi
ty [a
.u.]
time [h]
300 nm 280 nm
0
0.5
1
1.5
2
2.5
3
3.5
0 1 2 3 4 5
char
ge d
ensi
ty [a
.u.]
time [h]
300 nm 280 nm
z=1.0 µmz=2.3 µm
FIG. 7: Time-dependent evolution of the charge density atdepths of z = 1.0 and 2.3 µm in a corona-charged cyclic olefincopolymer film during UV irradiation through a semitranspar-ent back electrode. The shaded areas indicate the duration ofthe irradiation at the respective wavelength. Only irradiationat 300 nm accelerates the charge decay at shallow depths.
B. Applications
The greatest advantage of the thermal-pulse methodover LIMM is its speed. The 256-shot average of thetransient current shown in Fig. 2 was recorded in 45 s,whereas the acquisition of the LIMM spectrum of Fig. 5took approximately 30 min. Despite the significantlyshorter acquisition time, the signal-to-noise ratio levelin the thermal-pulse spectrum is visibly superior. Evenwhen taking into account the time to record two thermaltransients at different gain/bandwidth settings, thermal-pulse measurements with the given setup are 20-50 timesfaster than LIMM measurements of similar bandwidthand quality. The short data acquisition time is highlyuseful in the study of time-dependent processes, such asthe photoinduced depletion of space-charge [20, 21]. Un-der laboratory conditions, these processes typically occuron a time scale of several minutes, so that changes in thespace-charge profile can be monitored in real time. Asan example, Fig. 7 shows the depletion of space-charge ina chromophore-doped cyclic olefin copolymer which wasirradiated with ultraviolet light through a semitranspar-ent back electrode [22]. The initial, natural decay of thespace-charge at a depth of 1 µm is significantly accel-erated by irradiation at a wavelength of 300 nm, thusindicating that charges are released from deep traps withenergies around 4.1 eV. No accelerated decay is observedat larger depths.
Another type of measurement that will profit fromthe short acquisition time is the high-resolution three-dimensional mapping of polarization or space-charge dis-tribution. Scanning pyroelectric microscopy using LIMMhas been described several times [23–25], but the longmeasurement times either did not permit a full three-dimensional mapping or allowed only a limited number
80
5
TABLE I: Material parameters for PTFE and two commonlyused electrode materials [26]. The thermal diffusivity wascalculated from D = κ/(cρ).
PTFE Al Cu
thermal conductivity κ [W m−1 K−1] 0.25 237 401
specific heat c [J kg−1 K−1] 1000 897 385
density ρ [kg m−3] 2200 2700 8960
diffusivity D [m2 s−1] ×10−7 1.1 979 1162
enthalpy of vaporization [MJ kg−1] 10.9 4.79
of individual beam pointings. A focused beam version ofthe thermal-pulse technique, on the other hand, could de-liver images with several hundred pixels in a comparabletime.
For small space-charge densities, both the thermal-pulse and the LIMM signal will eventually reach the ex-perimental noise level. To increase the detection sensitiv-ity, one can enhance the absorption coefficient of the frontelectrode and the laser power. However, this puts an ad-ditional thermal stress on the polymer film. Irradiationwith cw lasers heats the entire sample to temperaturesabove ambient, which may eventually lead to damage oreven destruction of the polymer. In a one-dimensionalapproximation, the rise in temperature ∆T at the frontelectrode is given by
∆T =η〈j〉d
κ(14)
if the rear surface of the sample is in thermal contactwith a heat sink. Here, 〈j〉 is the average laser inten-sity and κ is the thermal conductivity, listed in Tab. Ifor PTFE and some frequently used electrode materials.Diode lasers commonly used in LIMM experiments pro-vide output powers of 10-50 mW and beam diameters of1-5 mm, in which case ∆T remains below 1 K. However,for free-standing films, more powerful laser sources or fo-cused beams, the bulk temperature may rise by tens ofKelvins, leading to physical or chemical modifications ofthe polymer.
With pulsed lasers, on the other hand, the limitingfactor is ablation of the front electrode and possibly athin surface layer of the polymer, rather than heating ofbulk material. Strong ablation occurs at laser fluenceshigher than [27]
φth = ρΩ√
DτL (15)
where Ω is the specific enthalpy (per unit mass) of evap-oration. For electrode materials such as aluminum orcopper (cf. Tab. I), the heat diffusion length l =
√DτL
(where D is the thermal diffusivity and τL ≈ 5 ns is thepulse duration) in the electrode material is several hun-dred nm, and thus larger than the thickness of typicalelectrodes. The resulting ablation fluences for aluminum
and copper are 0.9 and 3.4 J cm−2, although partial ab-lation may already occur at lower values. Additionally,the peak fluence on the beam axis may significantly ex-ceed the average value for, e. g., Gaussian or irregularlyshaped laser beam profiles. Finally, damage to the sur-face layers of the underlying polymer material may occurwell below the ablation threshold.
Acknowledgments
The work was funded in part by the European RegionalDevelopment Fund. R.S. acknowledges financial supportfrom the German Academic Exchange Service (DAAD).The authors wish to thank Sidney B. Lang (Beer Sheva,Israel) and Siegfried Bauer (Linz, Austria) for stimulat-ing discussions and a critical reading of the manuscript.
81
6
[1] R. E. Collins, J. Appl. Phys. 47, 4804 (1976).[2] R. E. Collins, J. Appl. Phys. 51, 2973 (1980).[3] S. B. Lang and D. K. Das-Gupta, Ferroelectrics 39, 1249
(1981).[4] S. B. Lang and D. K. Das-Gupta, Ferroelectrics 60, 23
(1984).[5] H. von Seggern, Appl. Phys. Lett. 33, 134 (1978).[6] A. S. DeReggi, C. M. Guttman, F. I. Mopsik, G. T. Davis,
and M. G. Broadhurst, Phys. Rev. Lett. 40, 413 (1978).[7] F. I. Mopsik and A. S. DeReggi, J. Appl. Phys. 53, 4333
(1982).[8] S. Bauer, Phys. Rev. B 47, 11049 (1993).[9] R. Gerhard-Multhaupt, W. Kunstler, G. Eberle,
W. Eisenmenger, and G. Yang, in Space Charge in SolidDielectrics, edited by J. C. Fothergill and L. A. Dissado(Dielectrics Society, Leicester, England, 1998), pp. 123–132.
[10] S. Bauer and B. Ploss, Ferroelectrics 118, 363 (1991).[11] S. Bauer and A. S. De Reggi, J. Appl. Phys. 80, 6124
(1996).[12] G. M. Sessler, in Electrets, edited by R. Gerhard-
Multhaupt (Laplacian Press, Morgan Hill, CA, 1999),vol. 2, chap. 10, pp. 41–80, 3rd ed.
[13] S. B. Lang and D. K. Das-Gupta, J. Appl. Phys. 59, 2151(1986).
[14] S. Bauer and S. Bauer-Gogonea, IEEE Trans. Diel.Electr. Insul. 10, 883 (2003).
[15] S. B. Lang, IEEE Trans. Diel. Electr. Insul. 11, 3 (2004).
[16] B. Ploss, R. Emmerich, and S. Bauer, J. Appl. Phys. 72,5363 (1992).
[17] A. Mellinger, Meas. Sci. Technol. 15, 1347 (2004).[18] E. Tuncer and S. B. Lang (2004),
arXiv:cond-mat/0409183.[19] B. Ploss, Ferroelectrics 156, 345 (1994).[20] A. Mellinger, F. Camacho Gonzalez, and R. Gerhard-
Multhaupt, Appl. Phys. Lett. 82, 254 (2003).[21] A. Mellinger, F. Camacho Gonzalez, and R. Gerhard-
Multhaupt, IEEE Trans. Diel. Electr. Insul. 11, 218(2004).
[22] A. Mellinger, R. Singh, F. Camacho Gonzalez, Z. Szamel,and I. G lowacki, in 2004 Annual Report, Conference onElectrical Insulation and Dielectric Phenomenta (IEEEService Center, Piscataway, NJ, 2004).
[23] S. Yılmaz, S. Bauer, W. Wirges, and R. Gerhard-Multhaupt, Appl. Phys. Lett. 63, 1724 (1993).
[24] A. Quintel, J. Hulliger, and M. Wubbenhorst, J. Phys.Chem. B 102, 4277 (1998).
[25] D. Marty-Dessus, L. Berquez, A. Petre, and J. L.Franceschi, J. Phys. D: Appl. Phys. 35, 3249 (2002).
[26] D. R. Lide and H. P. R. Frederikse, eds., CRC Handbookof Chemistry and Physics (CRC Press, 1995), 75th ed.
[27] B. N. Chichkov, C. Momma, S. Nolte, F. von Al-vensleben, and A. Tunnermann, Appl. Phys. A 63, 109(1996).
82
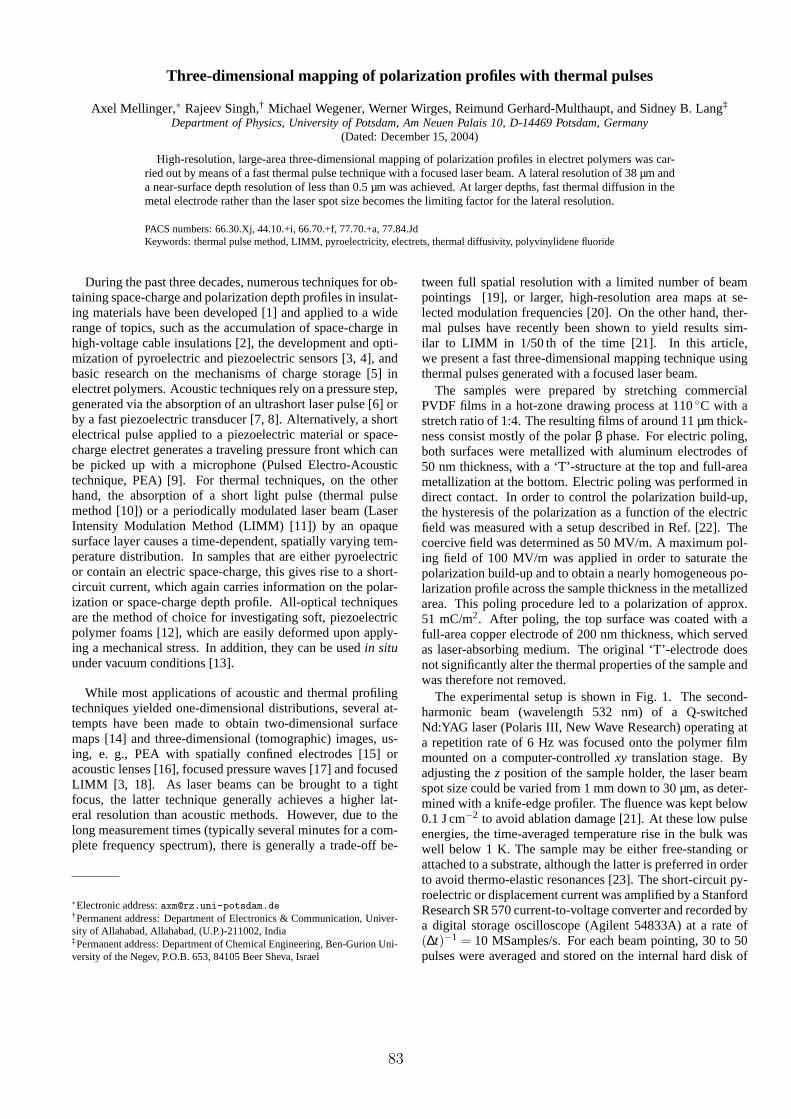
Three-dimensional mapping of polarization profiles with thermal pulses
Axel Mellinger,∗ Rajeev Singh,† Michael Wegener, Werner Wirges, Reimund Gerhard-Multhaupt, and Sidney B. Lang‡
Department of Physics, University of Potsdam, Am Neuen Palais 10, D-14469 Potsdam, Germany(Dated: December 15, 2004)
High-resolution, large-area three-dimensional mapping of polarization profiles in electret polymers was car-ried out by means of a fast thermal pulse technique with a focused laser beam. A lateral resolution of 38 µm anda near-surface depth resolution of less than 0.5 µm was achieved. At larger depths, fast thermal diffusion in themetal electrode rather than the laser spot size becomes the limiting factor for the lateral resolution.
PACS numbers: 66.30.Xj, 44.10.+i, 66.70.+f, 77.70.+a, 77.84.JdKeywords: thermal pulse method, LIMM, pyroelectricity, electrets, thermal diffusivity, polyvinylidene fluoride
During the past three decades, numerous techniques for ob-taining space-charge and polarization depth profiles in insulat-ing materials have been developed [1] and applied to a widerange of topics, such as the accumulation of space-charge inhigh-voltage cable insulations [2], the development and opti-mization of pyroelectric and piezoelectric sensors [3, 4], andbasic research on the mechanisms of charge storage [5] inelectret polymers. Acoustic techniques rely on a pressure step,generated via the absorption of an ultrashort laser pulse [6] orby a fast piezoelectric transducer [7, 8]. Alternatively, a shortelectrical pulse applied to a piezoelectric material or space-charge electret generates a traveling pressure front which canbe picked up with a microphone (Pulsed Electro-Acoustictechnique, PEA) [9]. For thermal techniques, on the otherhand, the absorption of a short light pulse (thermal pulsemethod [10]) or a periodically modulated laser beam (LaserIntensity Modulation Method (LIMM) [11]) by an opaquesurface layer causes a time-dependent, spatially varying tem-perature distribution. In samples that are either pyroelectricor contain an electric space-charge, this gives rise to a short-circuit current, which again carries information on the polar-ization or space-charge depth profile. All-optical techniquesare the method of choice for investigating soft, piezoelectricpolymer foams [12], which are easily deformed upon apply-ing a mechanical stress. In addition, they can be usedin situunder vacuum conditions [13].
While most applications of acoustic and thermal profilingtechniques yielded one-dimensional distributions, several at-tempts have been made to obtain two-dimensional surfacemaps [14] and three-dimensional (tomographic) images, us-ing, e. g., PEA with spatially confined electrodes [15] oracoustic lenses [16], focused pressure waves [17] and focusedLIMM [3, 18]. As laser beams can be brought to a tightfocus, the latter technique generally achieves a higher lat-eral resolution than acoustic methods. However, due to thelong measurement times (typically several minutes for a com-plete frequency spectrum), there is generally a trade-off be-
∗Electronic address:[email protected]†Permanent address: Department of Electronics & Communication, Univer-sity of Allahabad, Allahabad, (U.P.)-211002, India‡Permanent address: Department of Chemical Engineering, Ben-Gurion Uni-versity of the Negev, P.O.B. 653, 84105 Beer Sheva, Israel
tween full spatial resolution with a limited number of beampointings [19], or larger, high-resolution area maps at se-lected modulation frequencies [20]. On the other hand, ther-mal pulses have recently been shown to yield results sim-ilar to LIMM in 1/50 th of the time [21]. In this article,we present a fast three-dimensional mapping technique usingthermal pulses generated with a focused laser beam.
The samples were prepared by stretching commercialPVDF films in a hot-zone drawing process at 110C with astretch ratio of 1:4. The resulting films of around 11 µm thick-ness consist mostly of the polarβ phase. For electric poling,both surfaces were metallized with aluminum electrodes of50 nm thickness, with a ‘T’-structure at the top and full-areametallization at the bottom. Electric poling was performed indirect contact. In order to control the polarization build-up,the hysteresis of the polarization as a function of the electricfield was measured with a setup described in Ref. [22]. Thecoercive field was determined as 50 MV/m. A maximum pol-ing field of 100 MV/m was applied in order to saturate thepolarization build-up and to obtain a nearly homogeneous po-larization profile across the sample thickness in the metallizedarea. This poling procedure led to a polarization of approx.51 mC/m2. After poling, the top surface was coated with afull-area copper electrode of 200 nm thickness, which servedas laser-absorbing medium. The original ‘T’-electrode doesnot significantly alter the thermal properties of the sample andwas therefore not removed.
The experimental setup is shown in Fig. 1. The second-harmonic beam (wavelength 532 nm) of a Q-switchedNd:YAG laser (Polaris III, New Wave Research) operating ata repetition rate of 6 Hz was focused onto the polymer filmmounted on a computer-controlledxy translation stage. Byadjusting thez position of the sample holder, the laser beamspot size could be varied from 1 mm down to 30 µm, as deter-mined with a knife-edge profiler. The fluence was kept below0.1 J cm−2 to avoid ablation damage [21]. At these low pulseenergies, the time-averaged temperature rise in the bulk waswell below 1 K. The sample may be either free-standing orattached to a substrate, although the latter is preferred in orderto avoid thermo-elastic resonances [23]. The short-circuit py-roelectric or displacement current was amplified by a StanfordResearch SR 570 current-to-voltage converter and recorded bya digital storage oscilloscope (Agilent 54833A) at a rate of(∆t)−1 = 10 MSamples/s. For each beam pointing, 30 to 50pulses were averaged and stored on the internal hard disk of
83
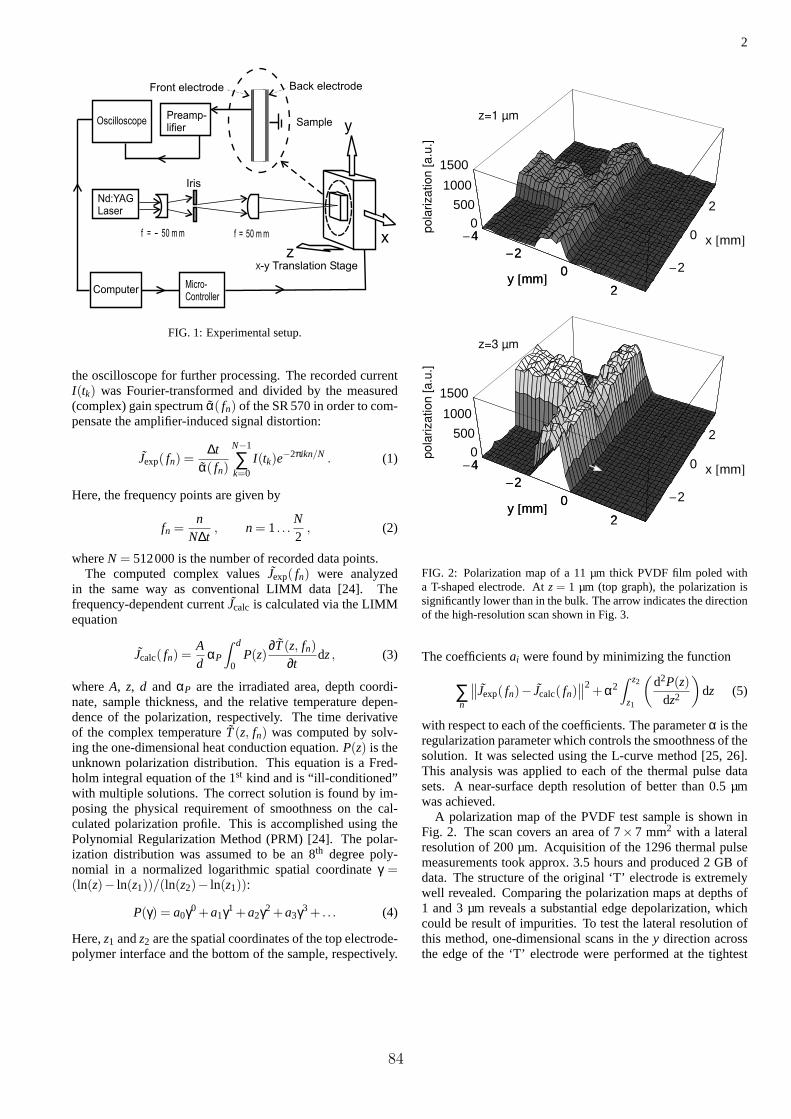
2
OscilloscopePreamp-lifier
Nd:YAGLaser
f = 50 m mf = 50 m m-
y
xz
Micro-Controller
Sample
Computer
x-y Translation Stage
Iris
Front electrode Back electrode
FIG. 1: Experimental setup.
the oscilloscope for further processing. The recorded currentI(tk) was Fourier-transformed and divided by the measured(complex) gain spectrumα( fn) of the SR 570 in order to com-pensate the amplifier-induced signal distortion:
Jexp( fn) =∆t
α( fn)
N−1
∑k=0
I(tk)e−2πikn/N . (1)
Here, the frequency points are given by
fn =n
N∆t, n = 1. . .
N2
, (2)
whereN = 512000 is the number of recorded data points.The computed complex valuesJexp( fn) were analyzed
in the same way as conventional LIMM data [24]. Thefrequency-dependent currentJcalc is calculated via the LIMMequation
Jcalc( fn) =Ad
αP
Z d
0P(z)
∂T(z, fn)∂t
dz, (3)
whereA, z, d and αP are the irradiated area, depth coordi-nate, sample thickness, and the relative temperature depen-dence of the polarization, respectively. The time derivativeof the complex temperatureT(z, fn) was computed by solv-ing the one-dimensional heat conduction equation.P(z) is theunknown polarization distribution. This equation is a Fred-holm integral equation of the 1st kind and is “ill-conditioned”with multiple solutions. The correct solution is found by im-posing the physical requirement of smoothness on the cal-culated polarization profile. This is accomplished using thePolynomial Regularization Method (PRM) [24]. The polar-ization distribution was assumed to be an 8th degree poly-nomial in a normalized logarithmic spatial coordinateγ =(ln(z)− ln(z1))/(ln(z2)− ln(z1)):
P(γ) = a0γ0 +a1γ1 +a2γ2 +a3γ3 + . . . (4)
Here,z1 andz2 are the spatial coordinates of the top electrode-polymer interface and the bottom of the sample, respectively.
-4-2
0
2y @mmD
-2
0
2
x @mmD0
500
1000
1500
-4-2
0
2y @mmD
-4-2
0
2y @mmD
-2
0
2
x @mmD0
500
1000
1500
-4-2
0
2y @mmD
po
lariza
tio
n [
a.u
.]p
ola
riza
tio
n [
a.u
.]
z=3 µm
z=1 µm
FIG. 2: Polarization map of a 11 µm thick PVDF film poled witha T-shaped electrode. Atz = 1 µm (top graph), the polarization issignificantly lower than in the bulk. The arrow indicates the directionof the high-resolution scan shown in Fig. 3.
The coefficientsai were found by minimizing the function
∑n
∥∥Jexp( fn)− Jcalc( fn)∥∥2 +α2
Z z2
z1
(d2P(z)
dz2
)dz (5)
with respect to each of the coefficients. The parameterα is theregularization parameter which controls the smoothness of thesolution. It was selected using the L-curve method [25, 26].This analysis was applied to each of the thermal pulse datasets. A near-surface depth resolution of better than 0.5 µmwas achieved.
A polarization map of the PVDF test sample is shown inFig. 2. The scan covers an area of 7×7 mm2 with a lateralresolution of 200 µm. Acquisition of the 1296 thermal pulsemeasurements took approx. 3.5 hours and produced 2 GB ofdata. The structure of the original ‘T’ electrode is extremelywell revealed. Comparing the polarization maps at depths of1 and 3 µm reveals a substantial edge depolarization, whichcould be result of impurities. To test the lateral resolution ofthis method, one-dimensional scans in they direction acrossthe edge of the ‘T’ electrode were performed at the tightest
84
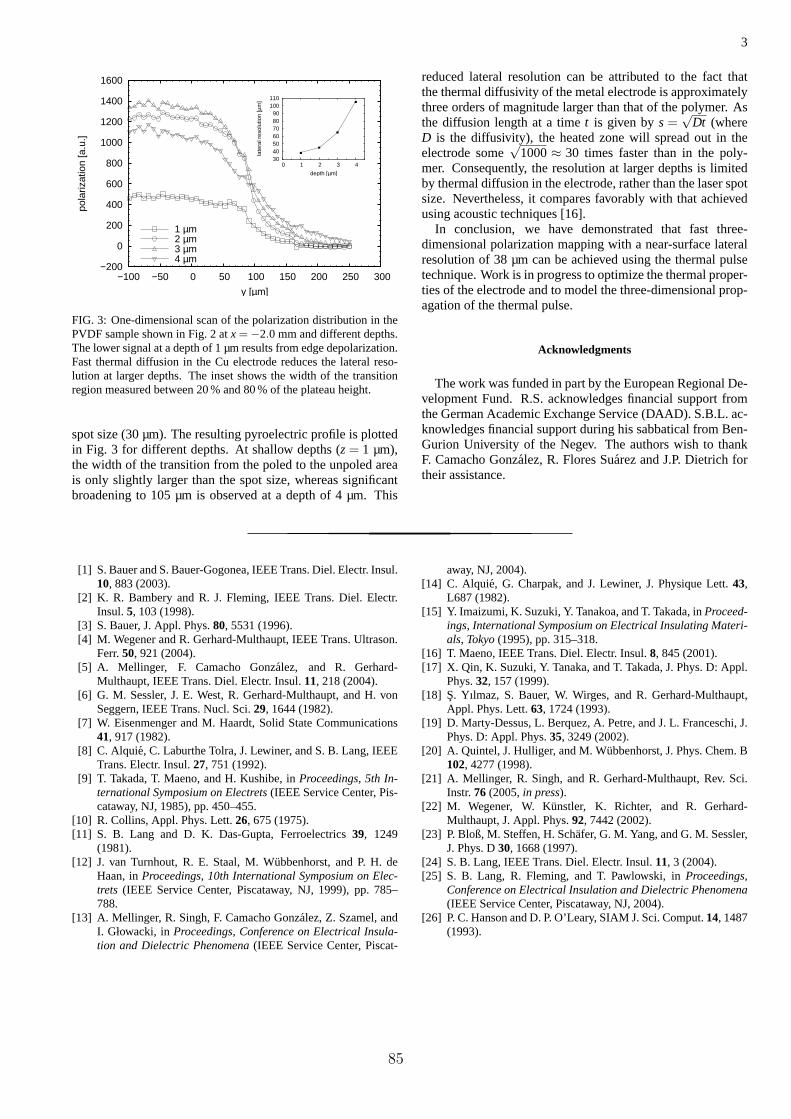
3
−200
0
200
400
600
800
1000
1200
1400
1600
−100 −50 0 50 100 150 200 250 300
pola
rizat
ion
[a.u
.]
y [µm]
1 µm2 µm3 µm4 µm
30 40 50 60 70 80 90
100 110
0 1 2 3 4
late
ral r
esol
utio
n [µ
m]
depth [µm]
FIG. 3: One-dimensional scan of the polarization distribution in thePVDF sample shown in Fig. 2 atx =−2.0 mm and different depths.The lower signal at a depth of 1 µm results from edge depolarization.Fast thermal diffusion in the Cu electrode reduces the lateral reso-lution at larger depths. The inset shows the width of the transitionregion measured between 20 % and 80 % of the plateau height.
spot size (30 µm). The resulting pyroelectric profile is plottedin Fig. 3 for different depths. At shallow depths (z= 1 µm),the width of the transition from the poled to the unpoled areais only slightly larger than the spot size, whereas significantbroadening to 105 µm is observed at a depth of 4 µm. This
reduced lateral resolution can be attributed to the fact thatthe thermal diffusivity of the metal electrode is approximatelythree orders of magnitude larger than that of the polymer. Asthe diffusion length at a timet is given bys =
√Dt (where
D is the diffusivity), the heated zone will spread out in theelectrode some
√1000≈ 30 times faster than in the poly-
mer. Consequently, the resolution at larger depths is limitedby thermal diffusion in the electrode, rather than the laser spotsize. Nevertheless, it compares favorably with that achievedusing acoustic techniques [16].
In conclusion, we have demonstrated that fast three-dimensional polarization mapping with a near-surface lateralresolution of 38 µm can be achieved using the thermal pulsetechnique. Work is in progress to optimize the thermal proper-ties of the electrode and to model the three-dimensional prop-agation of the thermal pulse.
Acknowledgments
The work was funded in part by the European Regional De-velopment Fund. R.S. acknowledges financial support fromthe German Academic Exchange Service (DAAD). S.B.L. ac-knowledges financial support during his sabbatical from Ben-Gurion University of the Negev. The authors wish to thankF. Camacho Gonzalez, R. Flores Suarez and J.P. Dietrich fortheir assistance.
[1] S. Bauer and S. Bauer-Gogonea, IEEE Trans. Diel. Electr. Insul.10, 883 (2003).
[2] K. R. Bambery and R. J. Fleming, IEEE Trans. Diel. Electr.Insul.5, 103 (1998).
[3] S. Bauer, J. Appl. Phys.80, 5531 (1996).[4] M. Wegener and R. Gerhard-Multhaupt, IEEE Trans. Ultrason.
Ferr.50, 921 (2004).[5] A. Mellinger, F. Camacho Gonzalez, and R. Gerhard-
Multhaupt, IEEE Trans. Diel. Electr. Insul.11, 218 (2004).[6] G. M. Sessler, J. E. West, R. Gerhard-Multhaupt, and H. von
Seggern, IEEE Trans. Nucl. Sci.29, 1644 (1982).[7] W. Eisenmenger and M. Haardt, Solid State Communications
41, 917 (1982).[8] C. Alquie, C. Laburthe Tolra, J. Lewiner, and S. B. Lang, IEEE
Trans. Electr. Insul.27, 751 (1992).[9] T. Takada, T. Maeno, and H. Kushibe, inProceedings, 5th In-
ternational Symposium on Electrets(IEEE Service Center, Pis-cataway, NJ, 1985), pp. 450–455.
[10] R. Collins, Appl. Phys. Lett.26, 675 (1975).[11] S. B. Lang and D. K. Das-Gupta, Ferroelectrics39, 1249
(1981).[12] J. van Turnhout, R. E. Staal, M. Wubbenhorst, and P. H. de
Haan, inProceedings, 10th International Symposium on Elec-trets (IEEE Service Center, Piscataway, NJ, 1999), pp. 785–788.
[13] A. Mellinger, R. Singh, F. Camacho Gonzalez, Z. Szamel, andI. Głowacki, in Proceedings, Conference on Electrical Insula-tion and Dielectric Phenomena(IEEE Service Center, Piscat-
away, NJ, 2004).[14] C. Alquie, G. Charpak, and J. Lewiner, J. Physique Lett.43,
L687 (1982).[15] Y. Imaizumi, K. Suzuki, Y. Tanakoa, and T. Takada, inProceed-
ings, International Symposium on Electrical Insulating Materi-als, Tokyo(1995), pp. 315–318.
[16] T. Maeno, IEEE Trans. Diel. Electr. Insul.8, 845 (2001).[17] X. Qin, K. Suzuki, Y. Tanaka, and T. Takada, J. Phys. D: Appl.
Phys.32, 157 (1999).[18] S. Yılmaz, S. Bauer, W. Wirges, and R. Gerhard-Multhaupt,
Appl. Phys. Lett.63, 1724 (1993).[19] D. Marty-Dessus, L. Berquez, A. Petre, and J. L. Franceschi, J.
Phys. D: Appl. Phys.35, 3249 (2002).[20] A. Quintel, J. Hulliger, and M. Wubbenhorst, J. Phys. Chem. B
102, 4277 (1998).[21] A. Mellinger, R. Singh, and R. Gerhard-Multhaupt, Rev. Sci.
Instr.76 (2005,in press).[22] M. Wegener, W. Kunstler, K. Richter, and R. Gerhard-
Multhaupt, J. Appl. Phys.92, 7442 (2002).[23] P. Bloß, M. Steffen, H. Schafer, G. M. Yang, and G. M. Sessler,
J. Phys. D30, 1668 (1997).[24] S. B. Lang, IEEE Trans. Diel. Electr. Insul.11, 3 (2004).[25] S. B. Lang, R. Fleming, and T. Pawlowski, inProceedings,
Conference on Electrical Insulation and Dielectric Phenomena(IEEE Service Center, Piscataway, NJ, 2004).
[26] P. C. Hanson and D. P. O’Leary, SIAM J. Sci. Comput.14, 1487(1993).
85
86 B ITG AWARD CERTIFICATE
B ITG Award Certificate
88 C CURRICULUM VITAE
C Curriculum Vitae
Name Axel Peter Lutz Mellinger
Geburtsdatum/-
ort
25. August 1967 in Munchen
Familienstand ledig
Schulbesuch 1973 – 1975 Grundschule Leutershausen/Bergstr.
1975 – 1977 Grundschule Vaterstetten
1977 – 1986 Gymnasium Vaterstetten
Abitur 27.06.1986, Pradikat: sehr gut
Studium 1986 – 1992 Physikstudium an der Technischen Universitat
Munchen
Juni 1991 – Juni 1992 Diplomarbeit am Max-Planck-Institut fur
extraterrestrische Physik in Garching. Studienabschluß 15.07.1992,
Pradikat: sehr gut
Promotion 01.07.1992 – 31.12.1995 Doktorand am Max-Planck-Institut fur ex-
traterrestrische Physik in Garching
Dissertation: Untersuchung hochangeregter Triplettzustande des
CO-Molekuls
Doktorprufung: 15.11.1995, Pradikat: mit Auszeichnung bestanden
Post-doc 02.01.1996 – 13.12.1997 am Department of Chemistry, University
of California, Berkeley, USA (mit DFG-Forschungsstipendium)
Experimentelle Untersuchung der Dynamik unimolekularer Reak-
tionen am Beispiel des Keten-Molekuls (CH2CO).
Aufbau einer gepulsten Laser-Quelle, die durch Vierwellenmischung
in einem Heatpipe-Ofen koharente, abstimmbare Vakuum-UV-
Strahlung erzeugt
Wissenschaftl.
Mitarbeiter
seit 15.12.1997 am Institut fur Physik der Universitat Potsdam
Untersuchung mikroskopischer Mechanismen der Ladungsspeiche-
rung in Elektret-Polymeren
Entwicklung piezoelektrischer Polymerschaume mit hoher Tempe-
raturstabilitat
Stipendien 1987 – 1992: Stipendiat der Studienstiftung des Deutschen Volkes
1996 – 1997: DFG-Forschungsstipendium
Preise 2000: Alfred Eisenstaedt Award (2. Preis) fur ein Milchstraßen-
Panoramabild
2004: Preis der Informationstechnischen Gesellschaft im VDE
Acknowledgments
This thesis would not have been possible without the support of the “Applied Condensed
Matter Physics” group at the Department of Physics, University of Potsdam. First and
foremost, my thanks go to Prof. Reimund Gerhard-Multhaupt, whose stimulating
comments and suggestions were a constant source of encouragement. My Ph.D. students
Francisco Camacho Gonzalez and Rajeev Singh spent countless hours of acquiring
and analyzing the data that went into our joint publications. Dr. Peter Frubing guided
me through dielectric spectroscopy, while Dr. Michael Wegener, Dr. Enis Tuncer
and Dr. Wolfgang Kunstler were very helpful discussion partners for everything
concerning ferroelectric and ferroelectret materials, theoretical aspects, poling techniques,
and space-charge measurements. Dr. Denis Rollik introduced me to thermal-wave
probing of polarization profiles. Our engineers Andreas Pucher and Werner Wirges
provided invaluable help when new equipment had to be designed and built, or broken
equipment needed fast repair. Our secretary Sandra Zeretzke helped me turning
administrative chaos into order. And, of course, I would like to thank all other (past and
present) group members – it was a great pleasure to work with you!
Many other people at our department (too numerous to be listed individually) were
helpful whenever I needed their support. I would like to mention, though, that much
of our experimental setup would not exist in its present form without the dedicated
work of Stefan Kleinschmidt and his machine shop staff. Any modern experiment
relies on computer control, which was made possible in part through the tireless effort of
Mirko Krumpe, Alexander Kremmer, Sebastian Bange and Lakshmi Meena
Ganesan.
I am grateful to Marita Dorrwand, who often helped me navigate around the
pitfalls of administrative burocracy.
I would also like to thank our national and international cooperation partners. Spe-
cial thanks go to Prof. Siegfried Bauer (University of Linz, Austria) for his inspir-
ing thoughts and critical reading of my publications. Prof. Sidney B. Lang gave me
many new insights into pyroelectricity and thermal space-charge measurement techniques
during his visits to the University of Potsdam. It is my pleasure to acknowledge the
hospitality of Prof. Roberto M. Faria, Dr. Lucas Fugikawa Santos (Instituto de
Fısica de Sao Carlos, Brazil) and Dr. Dante Luis Chinaglia (Universidade Estadual
Paulista, Brazil), as well as their help in introducing me to electron-beam charging. I am
also grateful to Prof. Jacek Ulanski (Technical University of Lodz, Poland) and his
group members Dr. Ireneusz G lowacki, Beata Luszczynska and Zbigniew Sza-
mel for performing thermally stimulated current and thermoluminescence experiments,
Prof. Polycarpos Pissis (National Technical University of Athens, Greece) for his co-
operation in the investigation of humidity effects on polypropylene foams, and Prof. Xia

Zhongfu for his hospitality during my visit to his laboratory at Tongji University in
Shanghai, China.
Finally, my special thanks go to my parents for their love and support.
Potsdam, 06 December 2004 Axel Mellinger