Embed Size (px)
Citation preview
1
Lipson, A.G., et al. Charged Particle Emissions Upon Electron Beam Excitation of Deuterium Subsystem in the Pdand Ti- Deuteride Targets. in ICCF-14 International Conference on Condensed Matter Nuclear Science. 2008.Washington, DC.
Charged Particle Emission during Electron Beam Excitationof Deuterium Subsystem in Pd and Ti- Deuteride Targets
Andrei Lipson1, Ivan Chernov2, Alexei Roussetski3, Yuri Chardantsev2, Boris Lyakhov1, EugenySaunin1 and Michael Melich4
1 A.N. Frumkin Institute of Physical Chemistry and Electrochemistry, Russian Academy ofSciences, 119991 Moscow, Russia
2 Tomsk Polytechnic University, 634050 Tomsk, Russia3 P. N. Lebedev Physics Insitute, Russian Academy of Sciences, 119991 Moscow, Russia
4 Naval Postgraduate School, Monterey, CA 93943-5000 USA
AbstractEnergetic charged particle emissions accompanying deuterium desorption fromspecially prepared Pd/PdO:Dx and TiDx targets in vacuum, stimulated by electronbeam (J ~ 0.6 mA/cm2, U = 30 keV) have been studied using a set of CR-39plastic track detectors covered with various metal foil filters. It was found that theelectron bombardment of those targets is caused by statistically significantemissions of DD-reaction product (3 MeV protons), as well as high energy alphaparticles (11-20 MeV). At the same time the Pd/PdO:Dx and the TiDx samplesshow no sign of nuclear emissions during vacuum exposure without e-beamstimulation. Extrapolation of both the DD-reaction cross section and theenhancement factor (consistent with calculated screening potential Ue = 750 eV)to very low deuteron energy allowed us to satisfactorily describe the detected DD-reaction yield in Pd/PdO:Dx target, assuming “hot” deuteron (Ed ~ 3.0 eV)generation under e-beam bombardment. This result strongly supports thetheoretical prediction [1,2] with regards to electron excitation of the D- subsystemin Pd- deuterides
1. IntroductionRecent ab-initio theoretical studies of hydrogen desorption from metal hydrides/deuterides
with a high hydrogen solubility have shown that excitation of the hydrogen subsystem in thosedeuterides results in plasmon formation leading to electron density oscillations producing astrong electric field (F ~ 108 V/cm) within a lattice parameter scale (a ~ 0.3-0.4 nm) [1,2]. As aresult, a mean energy of desorbed protons/deuterons (Ed), escaping from the hydride surfacewould effectively be increased from kT to the several eV values (Ed = Fa ~ 3-4 eV) or twoorders of magnitude, effectively producing “hot” deuterons. This deuteron accelerationmechanism, alongside a possible large electron screening in the metal targets with high hydrogendiffusivity [3-5] could potentially strongly enhance the yield of DD-reaction in metal deuterides,even at the extremely low energy of their excitation. In order to verify the hypothesis on the roleof excitation of the hydrogen subsystem in metal deuterides to enhance the yield of low energynuclear reactions (LENR), we have carried out a series of experiments on charged particle
2
detection with plastic track detectors CR-39, using electron-beam (in vacuum) stimulation ofvarious metal deuterides during spontaneous deuterium desorption (if any) from the deuteratedsamples.
Here we show that electron beam stimulation of the D-desorption process from speciallyprepared Pd/PdO:Dx and TiDx targets is caused by statistically significant emissions of DD-reaction product (3 MeV protons), as well as high energy alpha particles. It is important that thesame Pd/PdO:Dx and TiDx samples show no sign of nuclear emissions in vacuum without e-beam stimulation. Extrapolation of both DD-reaction cross section and the enhancement factor(consistent with calculated screening potential Ue = 750 eV) to very low deuteron energy (Ed
~ 1.0 eV) allowed to describe satisfactorily the detected DD-reaction yield in Pd/PdO:Dx targetunder e-beam excitation. This result strongly supports the theoretical prediction [1,2] withregards to electron excitation of the D- subsystem in Pd/PdO deuteride.
2. ExperimentalThe experiments with e-beam stimulation have been performed in TPU, Tomsk. The samples
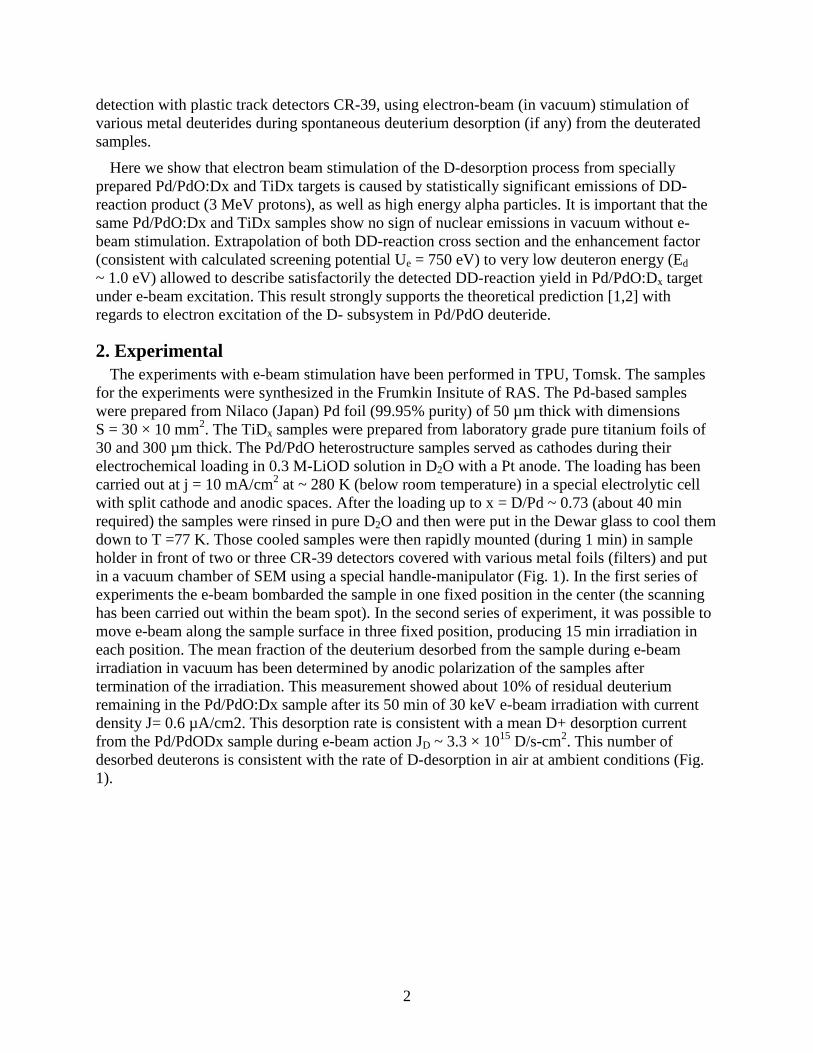
for the experiments were synthesized in the Frumkin Insitute of RAS. The Pd-based sampleswere prepared from Nilaco (Japan) Pd foil (99.95% purity) of 50 µm thick with dimensionsS = 30 × 10 mm2. The TiDx samples were prepared from laboratory grade pure titanium foils of30 and 300 µm thick. The Pd/PdO heterostructure samples served as cathodes during theirelectrochemical loading in 0.3 M-LiOD solution in D2O with a Pt anode. The loading has beencarried out at j = 10 mA/cm2 at ~ 280 K (below room temperature) in a special electrolytic cellwith split cathode and anodic spaces. After the loading up to x = D/Pd ~ 0.73 (about 40 minrequired) the samples were rinsed in pure D2O and then were put in the Dewar glass to cool themdown to T =77 K. Those cooled samples were then rapidly mounted (during 1 min) in sampleholder in front of two or three CR-39 detectors covered with various metal foils (filters) and putin a vacuum chamber of SEM using a special handle-manipulator (Fig. 1). In the first series ofexperiments the e-beam bombarded the sample in one fixed position in the center (the scanninghas been carried out within the beam spot). In the second series of experiment, it was possible tomove e-beam along the sample surface in three fixed position, producing 15 min irradiation ineach position. The mean fraction of the deuterium desorbed from the sample during e-beamirradiation in vacuum has been determined by anodic polarization of the samples aftertermination of the irradiation. This measurement showed about 10% of residual deuteriumremaining in the Pd/PdO:Dx sample after its 50 min of 30 keV e-beam irradiation with currentdensity J= 0.6 µA/cm2. This desorption rate is consistent with a mean D+ desorption currentfrom the Pd/PdODx sample during e-beam action JD ~ 3.3 × 10¹⁵ D/s-cm2. This number ofdesorbed deuterons is consistent with the rate of D-desorption in air at ambient conditions (Fig.1).
3
0 10 20 30 40 50 60 70
0,0
0,1
0,2
0,3
0,4
0,5
0,6
0,7
0,8x
=D
/Pd
Elapsed time, [min]
Pd/PdO:Dx-air desorption T = 290KPd/PdO:Dx - vacuum desorption T = 77-293K
Figure 1. D-desorption rate from the Pd/PdO:Dx samples in vacuum (electrolysis at T=280 K with coolingdown to T = 77K after electrolysis termination)) and in air at ambient conditions (electrolysis at T=290K).
In contrast to Pd/PdO samples, the Ti samples have been loaded in a 1 M solution of D2SO4 inD2O during t = 35 hr at J = 30 mA/cm2, in order to dissolve the TiO2 oxide layer at the Ti-surfaceand to provide D-penetration. This technique is able to provide TiD1 compound formation at theTi cathode surface layer of several microns thick. The average loading here has been determinedby weight balance of the sample before and after e-beam irradiation. It was found that the D-desorption rate in case of TiD irradiation is consistent with the JD ~ 1.0 × 10¹⁴ D/s-cm2.Important that TiD1 compound is very stable and does not loose deuterium below t = 400 C.Thus, all desorbed deuterons in TiD has been caused only by e-beam irradiation.
The set of noiseless plastic track detectors has been used to detect charged particles emittedduring exposure of deuterated samples under electron excitation. In order to identify type andenergy of emitted particles we used simultaneously two or three CR-39 detectors covered withvarious foils with known stopping ranges (this arrangement can be considered as a simple dE-Edetector without a temporal data channel). Similar reference experiments were performed in theFrumkin Institute. These were carried out in vacuum with open and Cu-covered CR-39 detectors,but with no electron beam excitation.
4
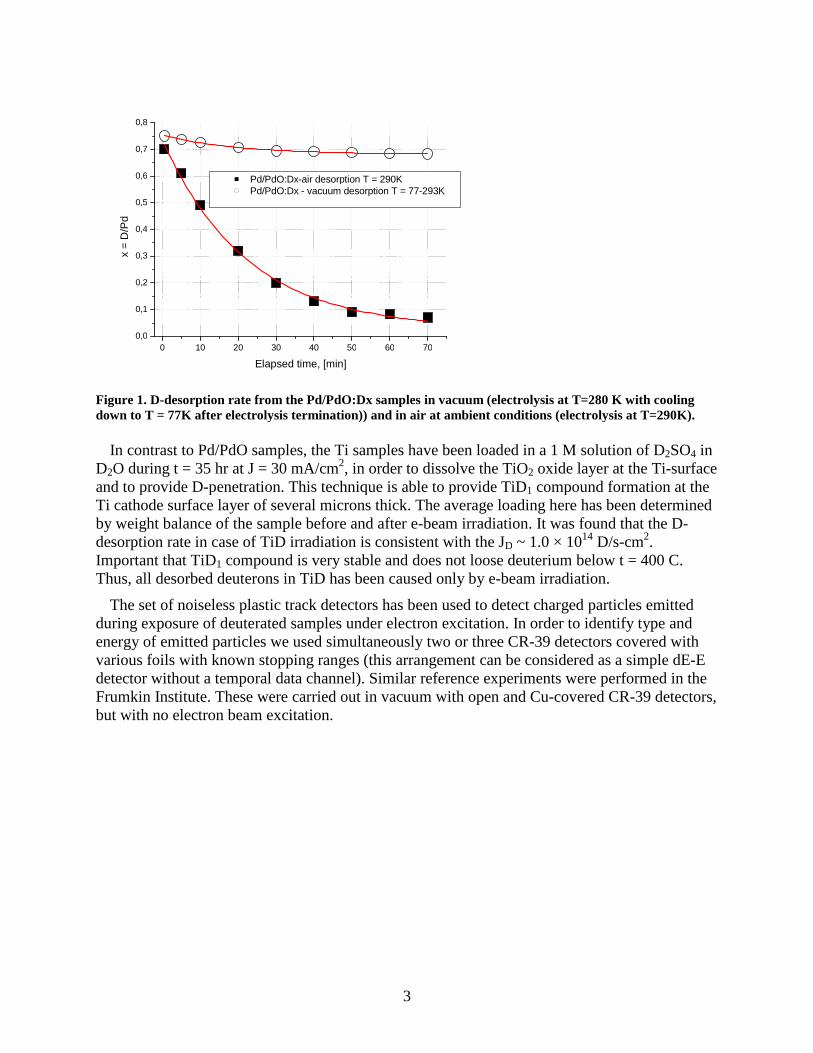
Figure 2. Experimental sample-detector holder mounted in the SEM vacuum chamber (p = 10-6 torr) andirradiated by collimated electron beam of EDS electron gun (J = 100-300 nA, E = 30 keV): where 1,2 and 3 –are the CR-39 detectors covered with the 11 µm Al (1), 25 µm Cu (2) and 33 µm Al (3) foil filters, respectively,4 – is the deuterated sample. 5-manipulator, 6-electron gun, 7- stainless steel support
The desorbed deuterium and generated charged particles reach the detectors from the spotproduced by e-beam with dimensions S = 8 × 6 mm2. The effective distance between the centerof the spot and the detectors 1 and 2 is about <Reff> = 12 mm. The background counts are alwaystaken from the rear side of CR-39 (opposite to the side directed to the sample’s surface). TheForeground counts have been read out from the CR-39 surface of detectors 1, 2 and 3 faced thesample, while the background counts have been taken from the rear sides of these same detectorsfaced to the vacuum chamber (1, 2) or to the stainless support (3). The resulting counts caused bycharged particle emission from the sample, were thus derived by subtracting of the backgroundread out data (rear side) from the foreground (the front side faced to the sample) of the same CR-39 detector. The subtracting of the rear side reading data could provide more precise result incase if CR-39 detectors are irradiated by fast neutrons. Unfortunately, this batch of CR-39 trackdetectors was irradiated by weak fast neutron flux en route to Moscow from USA, most probablyin an airport security facility. As a result, the background level in the track diameter range ofinterest (4-8 µm) was found to be 4-5 times above the usual 4-8 µm track diameter background,which is normally show N < 10 track/cm2.
Only tracks close to the normal incidence (with respect to the CR-39 surface, such thatincidence angle with respect to the perpendicular to the detector’s surface would be = 0 ± 10).The effective read out area of the CR-39 detector chips with dimensions 2x1 cm2 was normallyof 1 cm2 (to avoid severely defective edge detector’s sites).
In such a condition the effective geometrical efficiency of the detectors 1 and 2 was calculatedas following: g = 1/4<Reff>
2S = 2.6x10⁻², where S = 0.48 cm2 is the effective area of theirradiated spot at the surface of the sample, which is taken equal to the area of the e-beam.
5
Earlier we showed that the efficiency of the detectors that are in tight contact with sample (the#3 detector case) is calculated as ½(1-cosc), where c is the critical angle for chargedparticle of the given type and energy, the ~ 1/2 is the numerical coefficient counting for theincluding into consideration also the “non-circular” tracks, (i.e. the tracks with the smalldeviations from their circular shape). The detectors were etched in 6 N NaOH at t = 70 C withthe rate of ~ 1.3 μ/hr.
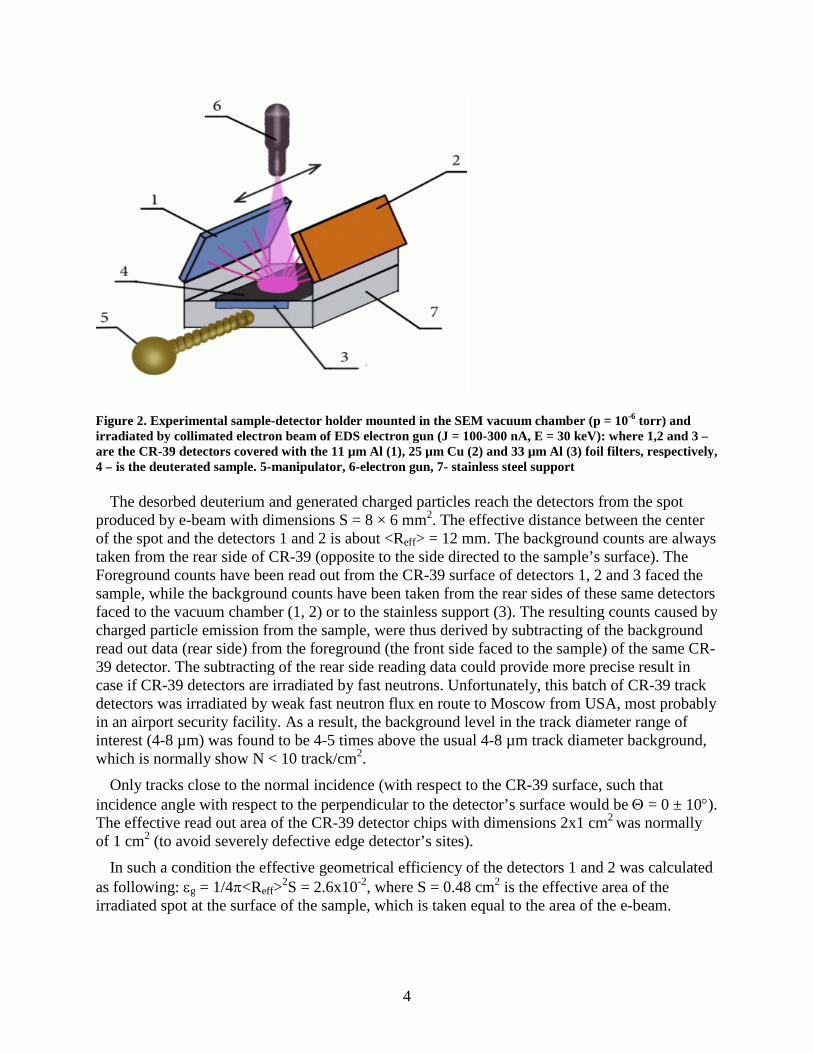
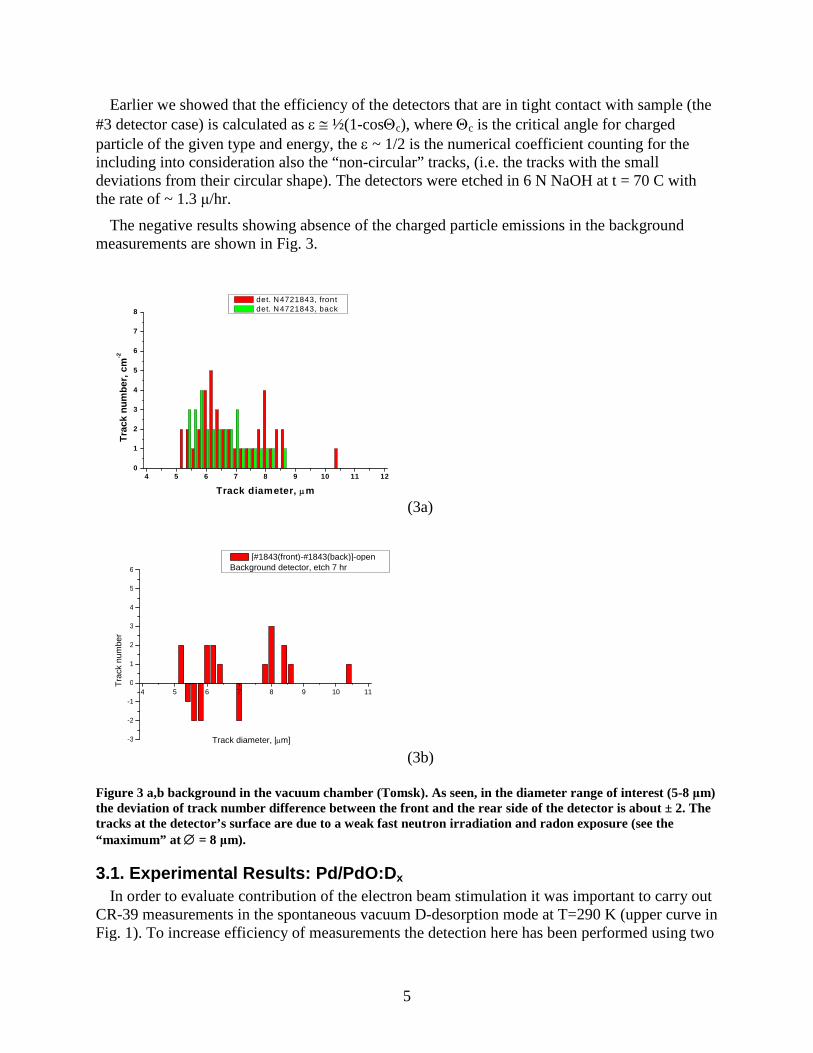
The negative results showing absence of the charged particle emissions in the backgroundmeasurements are shown in Fig. 3.
4 5 6 7 8 9 10 11 120
1
2
3
4
5
6
7
8
Tra
ck
nu
mb
er,
cm
-2
Track diameter, m
det. N4721843, frontdet. N4721843, back
(3a)
4 5 6 7 8 9 10 11
-3
-2
-1
0
1
2
3
4
5
6
Tra
ck
nu
mbe
r
Track diameter, [m]
[#1843(front)-#1843(back)]-openBackground detector, etch 7 hr
(3b)
Figure 3 a,b background in the vacuum chamber (Tomsk). As seen, in the diameter range of interest (5-8 μm)the deviation of track number difference between the front and the rear side of the detector is about ± 2. Thetracks at the detector’s surface are due to a weak fast neutron irradiation and radon exposure (see the“maximum” at = 8 μm).
3.1. Experimental Results: Pd/PdO:Dx
In order to evaluate contribution of the electron beam stimulation it was important to carry outCR-39 measurements in the spontaneous vacuum D-desorption mode at T=290 K (upper curve inFig. 1). To increase efficiency of measurements the detection here has been performed using two
6
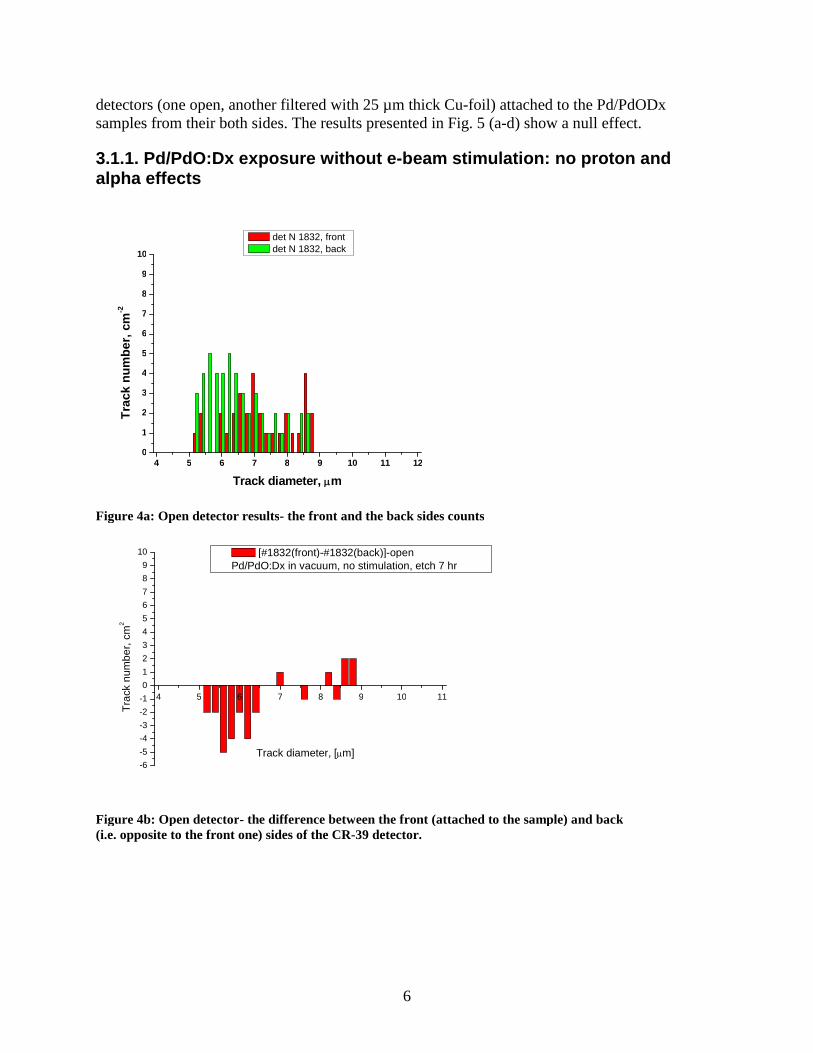
detectors (one open, another filtered with 25 µm thick Cu-foil) attached to the Pd/PdODxsamples from their both sides. The results presented in Fig. 5 (a-d) show a null effect.
3.1.1. Pd/PdO:Dx exposure without e-beam stimulation: no proton andalpha effects
4 5 6 7 8 9 10 11 120
1
2
3
4
5
6
7
8
9
10
Tra
ck
nu
mb
er,
cm
-2
Track diameter, m
det N 1832, frontdet N 1832, back
Figure 4a: Open detector results- the front and the back sides counts
4 5 6 7 8 9 10 11
-6
-5
-4
-3
-2
-1
0
1
2
3
4
5
6
7
8
9
10
Tra
ckn
um
be
r,cm
2
Track diameter, [m]
[#1832(front)-#1832(back)]-openPd/PdO:Dx in vacuum, no stimulation, etch 7 hr
Figure 4b: Open detector- the difference between the front (attached to the sample) and back(i.e. opposite to the front one) sides of the CR-39 detector.
7
4 5 6 7 8 9 10 11 120
1
2
3
4
5
6
7
8
9
10
Tra
ck
nu
mb
er,
cm
-2
Track diameter,m
det N1837, frontdet N1837, back
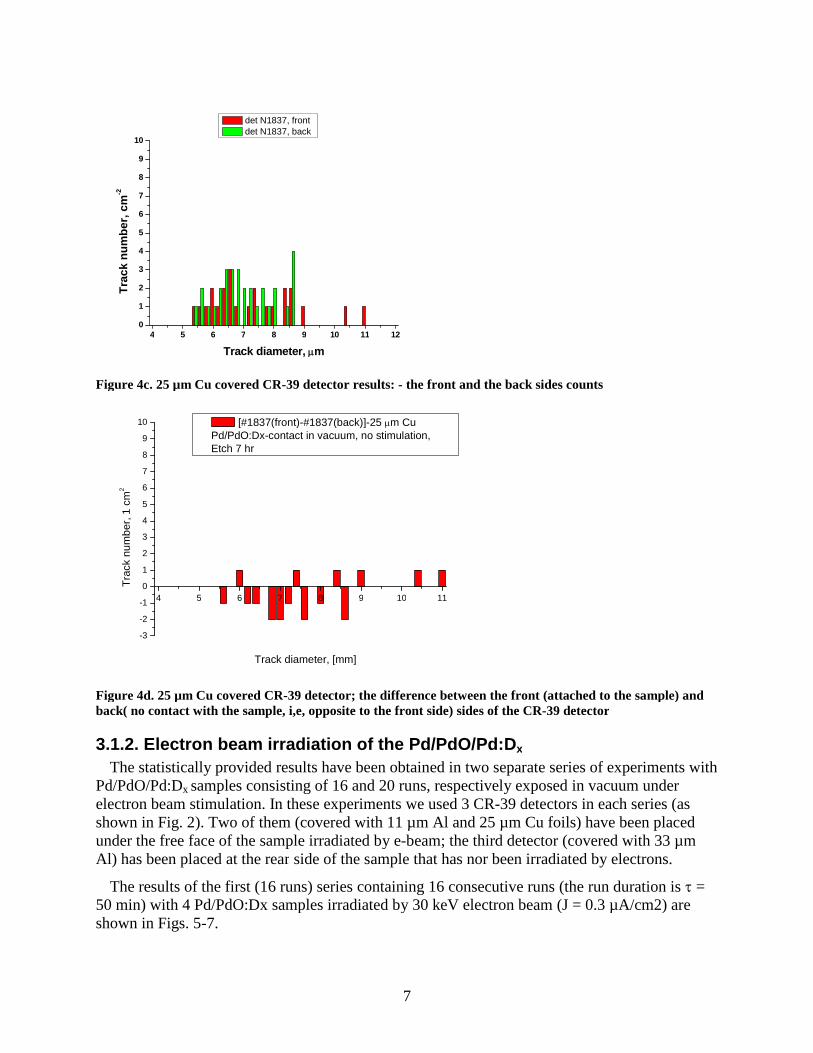
Figure 4c. 25 µm Cu covered CR-39 detector results: - the front and the back sides counts
4 5 6 7 8 9 10 11
-3
-2
-1
0
1
2
3
4
5
6
7
8
9
10
Tra
ck
nu
mb
er,
1cm
2
Track diameter, [mm]
[#1837(front)-#1837(back)]-25 m CuPd/PdO:Dx-contact in vacuum, no stimulation,Etch 7 hr
Figure 4d. 25 µm Cu covered CR-39 detector; the difference between the front (attached to the sample) andback( no contact with the sample, i,e, opposite to the front side) sides of the CR-39 detector
3.1.2. Electron beam irradiation of the Pd/PdO/Pd:Dx
The statistically provided results have been obtained in two separate series of experiments withPd/PdO/Pd:Dx samples consisting of 16 and 20 runs, respectively exposed in vacuum underelectron beam stimulation. In these experiments we used 3 CR-39 detectors in each series (asshown in Fig. 2). Two of them (covered with 11 µm Al and 25 µm Cu foils) have been placedunder the free face of the sample irradiated by e-beam; the third detector (covered with 33 µmAl) has been placed at the rear side of the sample that has nor been irradiated by electrons.
The results of the first (16 runs) series containing 16 consecutive runs (the run duration is =50 min) with 4 Pd/PdO:Dx samples irradiated by 30 keV electron beam (J = 0.3 µA/cm2) areshown in Figs. 5-7.
8
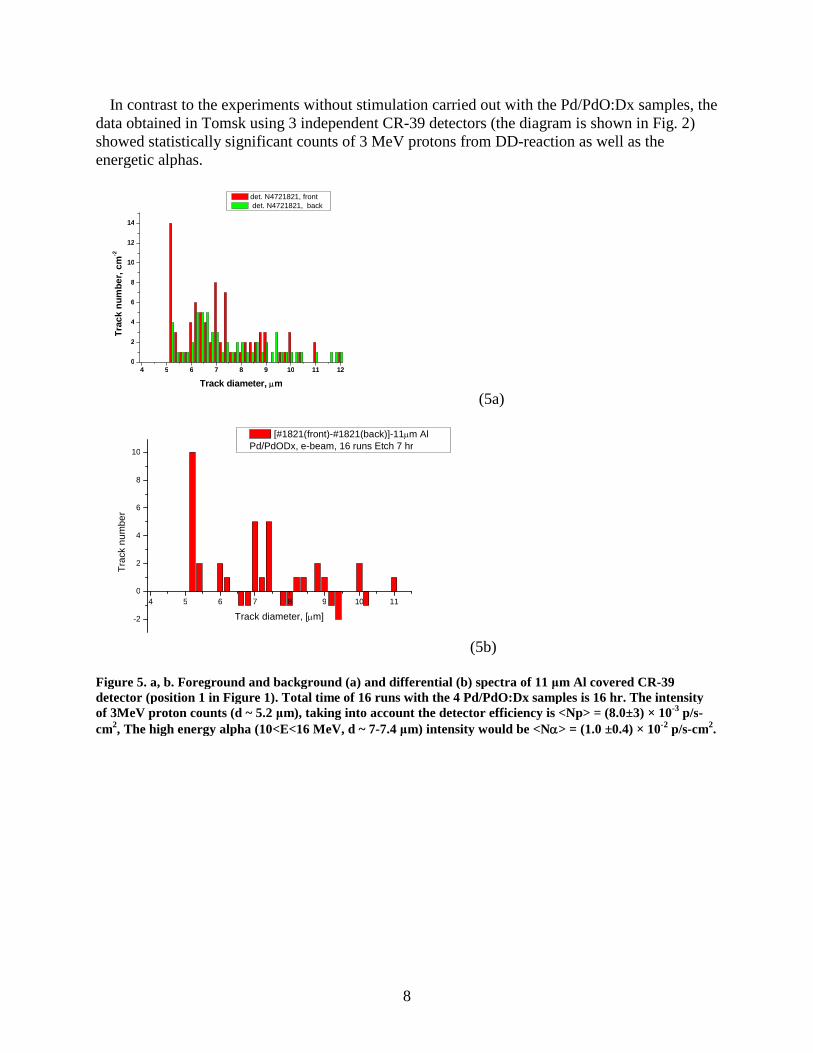
In contrast to the experiments without stimulation carried out with the Pd/PdO:Dx samples, thedata obtained in Tomsk using 3 independent CR-39 detectors (the diagram is shown in Fig. 2)showed statistically significant counts of 3 MeV protons from DD-reaction as well as theenergetic alphas.
4 5 6 7 8 9 10 11 120
2
4
6
8
10
12
14
Tra
ck
nu
mb
er,
cm
-2
Track diameter, m
det. N4721821, frontdet. N4721821, back
(5a)
4 5 6 7 8 9 10 11
-2
0
2
4
6
8
10
Tra
ckn
um
be
r
Track diameter, [m]
[#1821(front)-#1821(back)]-11m AlPd/PdODx, e-beam, 16 runs Etch 7 hr
(5b)
Figure 5. a, b. Foreground and background (a) and differential (b) spectra of 11 μm Al covered CR-39detector (position 1 in Figure 1). Total time of 16 runs with the 4 Pd/PdO:Dx samples is 16 hr. The intensityof 3MeV proton counts (d ~ 5.2 μm), taking into account the detector efficiency is <Np> = (8.0±3) × 10-3 p/s-cm2, The high energy alpha (10<E<16 MeV, d ~ 7-7.4 μm) intensity would be <N> = (1.0 ±0.4) × 10-2 p/s-cm2.
9
4 5 6 7 8 9 10 11 120
1
2
3
4
5
6
Tra
ck
nu
mb
er,
cm
-2
Track diameter, m
det. N4721839, frontdet. N4721839, back
(6a)
4 5 6 7 8 9 10 11
-1
0
1
2
3
4
5
Tra
ck
nu
mb
er
Track diameter, [m]
[#1839(front)-#1839(back)]-25m Cu4 Pd/PdO:Dx samples- e-beam, 16 runs, 7h etch
3MeV p 15MeV alpha
11 MeV alpha
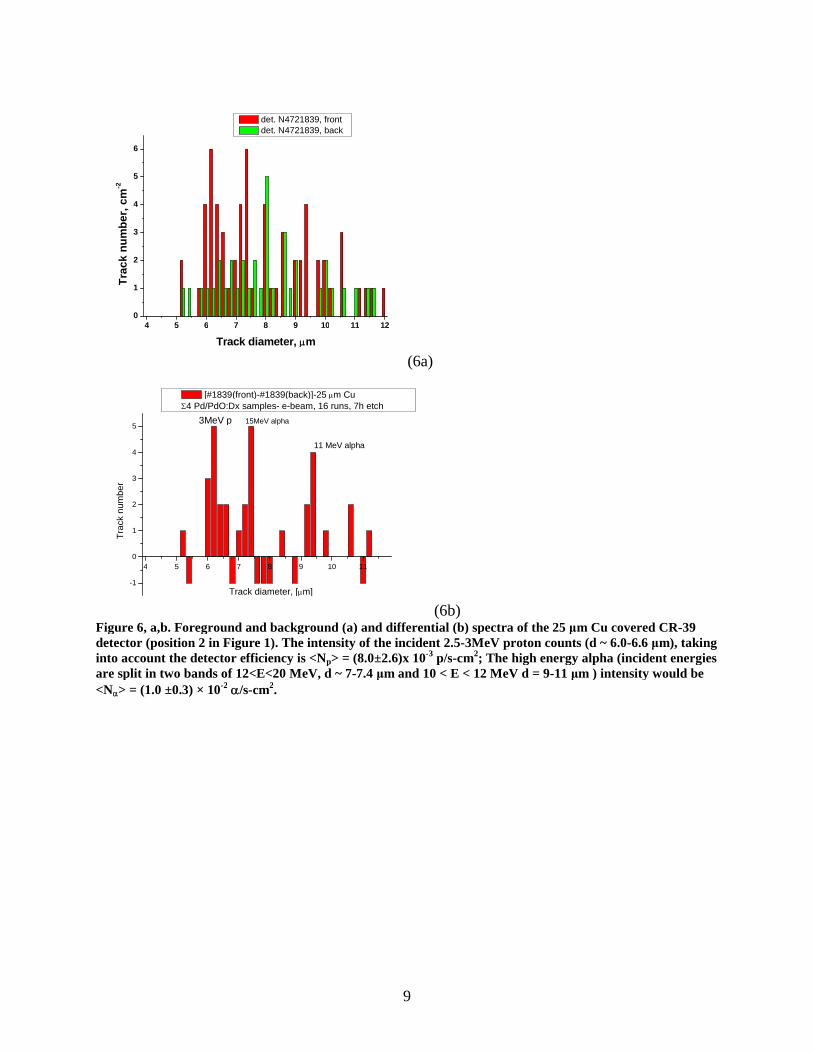
(6b)Figure 6, a,b. Foreground and background (a) and differential (b) spectra of the 25 μm Cu covered CR-39detector (position 2 in Figure 1). The intensity of the incident 2.5-3MeV proton counts (d ~ 6.0-6.6 μm), takinginto account the detector efficiency is <Np> = (8.0±2.6)x 10-3 p/s-cm2; The high energy alpha (incident energiesare split in two bands of 12<E<20 MeV, d ~ 7-7.4 μm and 10 < E < 12 MeV d = 9-11 μm ) intensity would be<N> = (1.0 ±0.3) × 10-2 /s-cm2.
10
4 5 6 7 8 9 10 11 120
2
4
6
8
10
12
14
16
Tra
ck
nu
mb
er,
cm
-2
Track diameter, m
det. N4721866, frontdet. N4721866, back
(7 a)
4 5 6 7 8 9 10 11
-2
0
2
4
6
8
10
12
14
Tra
ckn
um
ber
Track diameter, [m]
[#1866(front)-#1866(back)]-33m AlPd/PdO:Dx (rare side, no e-beam)-16 runs, etch 7 hr
(7 b)
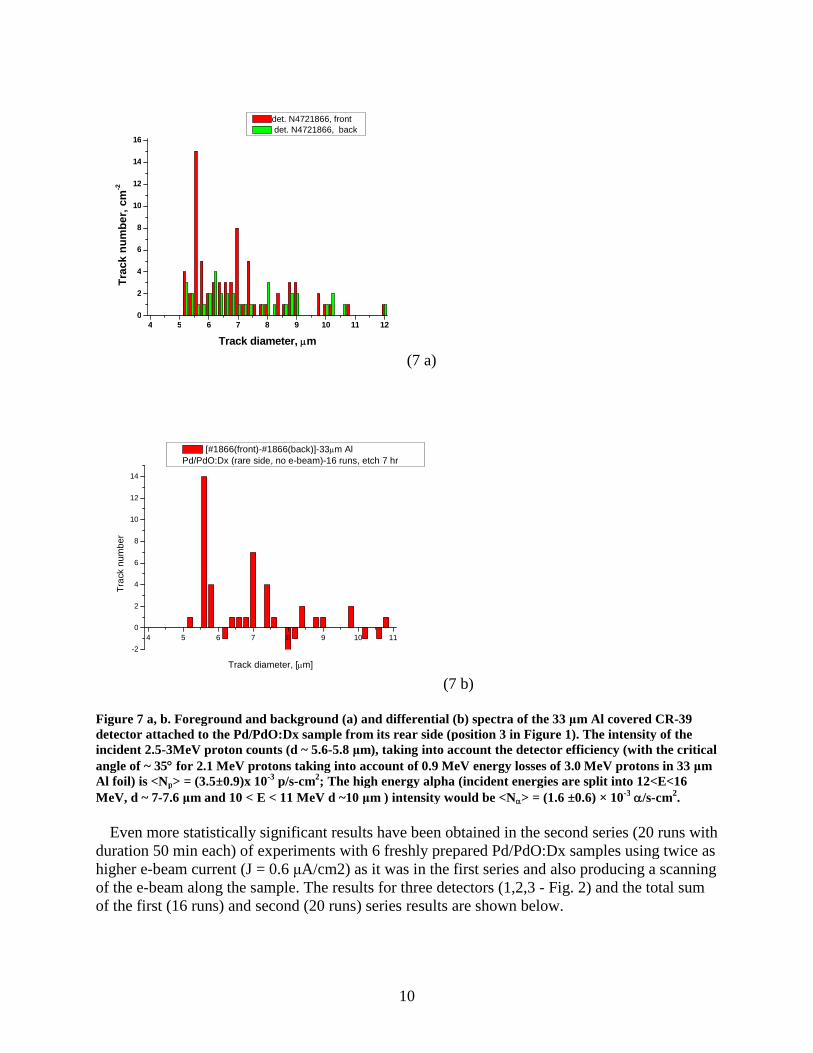
Figure 7 a, b. Foreground and background (a) and differential (b) spectra of the 33 μm Al covered CR-39detector attached to the Pd/PdO:Dx sample from its rear side (position 3 in Figure 1). The intensity of theincident 2.5-3MeV proton counts (d ~ 5.6-5.8 μm), taking into account the detector efficiency (with the criticalangle of ~ 35 for 2.1 MeV protons taking into account of 0.9 MeV energy losses of 3.0 MeV protons in 33 μmAl foil) is <Np> = (3.5±0.9)x 10-3 p/s-cm2; The high energy alpha (incident energies are split into 12<E<16MeV, d ~ 7-7.6 μm and 10 < E < 11 MeV d ~10 μm ) intensity would be <N> = (1.6 ±0.6) × 10-3 /s-cm2.
Even more statistically significant results have been obtained in the second series (20 runs withduration 50 min each) of experiments with 6 freshly prepared Pd/PdO:Dx samples using twice ashigher e-beam current (J = 0.6 μA/cm2) as it was in the first series and also producing a scanningof the e-beam along the sample. The results for three detectors (1,2,3 - Fig. 2) and the total sumof the first (16 runs) and second (20 runs) series results are shown below.
11
4 5 6 7 8 9 10 11
0
5
10
15
20
25
30
Tra
ckn
um
be
r/1
cm2
Track diameter, [m]
#1816-11 mAl: Pd/PdO:Dx20 runs, t = 1000 min, Etch 7 h,
2.75 NeV p
(8 a)
4 5 6 7 8 9 10 11
0
10
20
30
40
Tra
ckn
um
be
r/2
cm2
Track diameter, [m]
[1816+1821]-11 m Al: Pd/PdO:Dx
(8b)
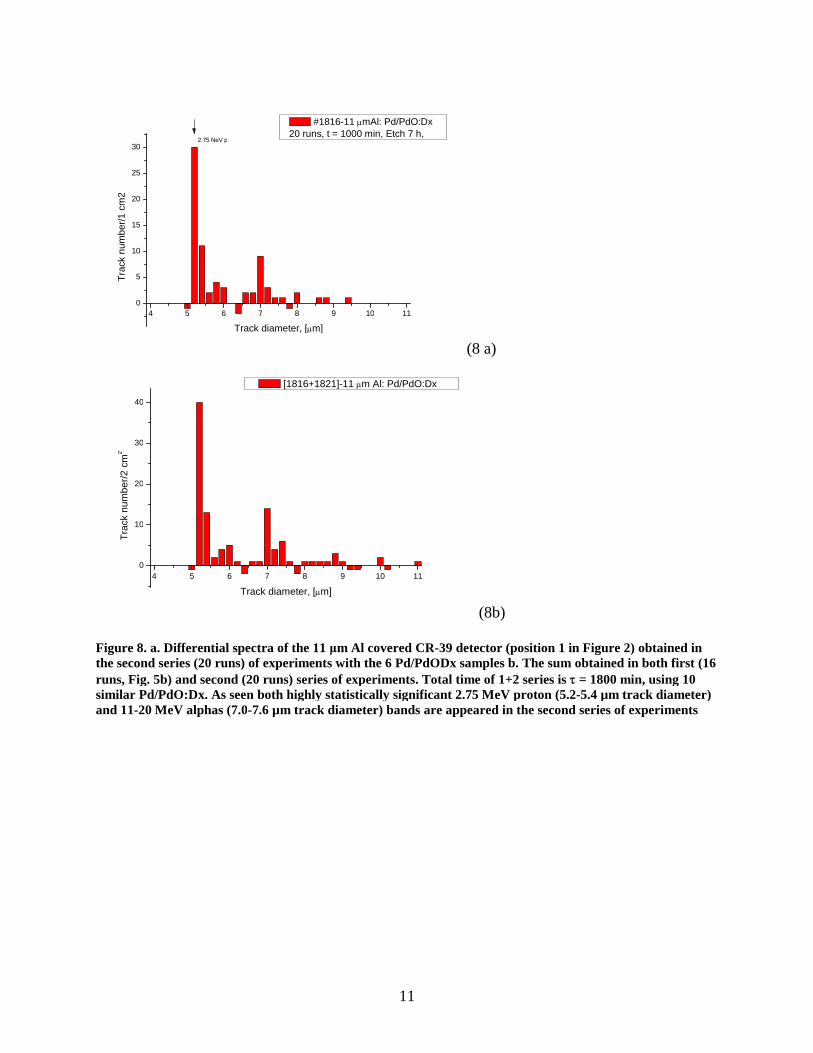
Figure 8. a. Differential spectra of the 11 μm Al covered CR-39 detector (position 1 in Figure 2) obtained inthe second series (20 runs) of experiments with the 6 Pd/PdODx samples b. The sum obtained in both first (16runs, Fig. 5b) and second (20 runs) series of experiments. Total time of 1+2 series is = 1800 min, using 10similar Pd/PdO:Dx. As seen both highly statistically significant 2.75 MeV proton (5.2-5.4 µm track diameter)and 11-20 MeV alphas (7.0-7.6 µm track diameter) bands are appeared in the second series of experiments
12
4 5 6 7 8 9 10 11
-2
0
2
4
6
8
10
Tra
ck
nu
mbe
r/1
cm2
Track diameter, [m]
#1851- Cu 25m, Pd/PdO:DX20 runs, t = 1000 min, Etch 7 hr
1.4 MeV p
(a)
4 5 6 7 8 9 10 11
-4
-2
0
2
4
6
8
10
12
Tra
ck
nu
mb
er/
2cm
2
Track diameter, [m]
[1851+1839]-Cu: Pd-PdO:Dx
(b)
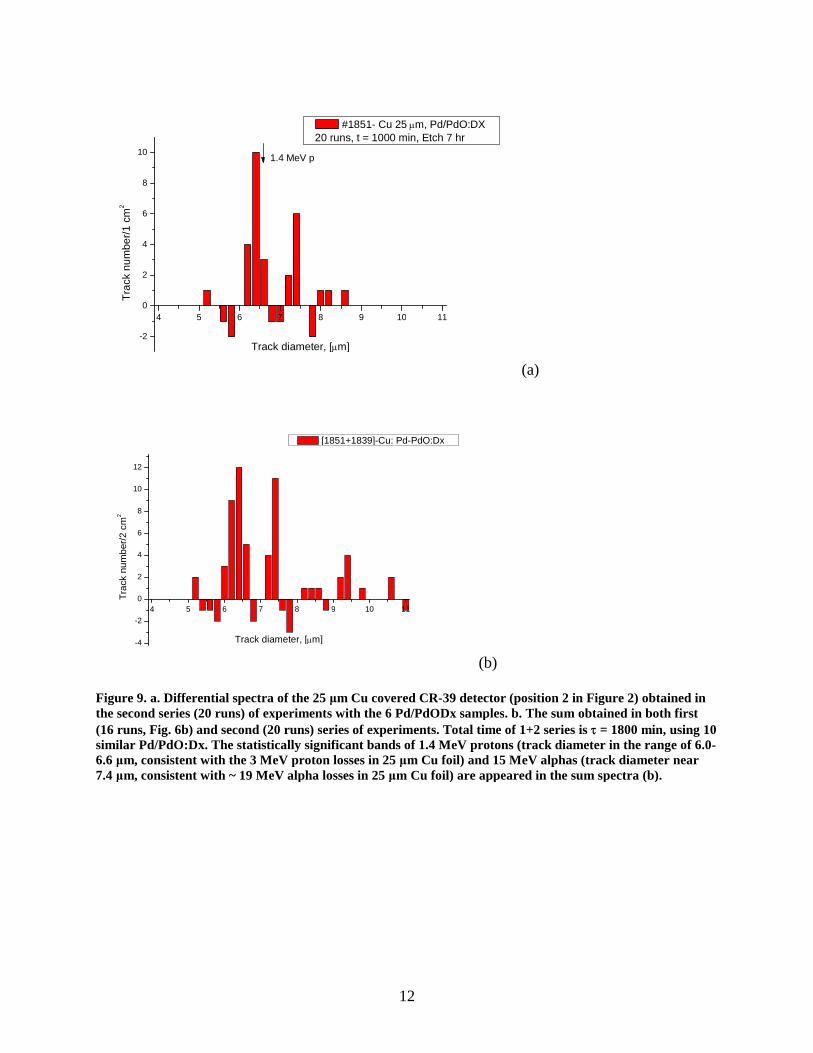
Figure 9. a. Differential spectra of the 25 μm Cu covered CR-39 detector (position 2 in Figure 2) obtained inthe second series (20 runs) of experiments with the 6 Pd/PdODx samples. b. The sum obtained in both first(16 runs, Fig. 6b) and second (20 runs) series of experiments. Total time of 1+2 series is = 1800 min, using 10similar Pd/PdO:Dx. The statistically significant bands of 1.4 MeV protons (track diameter in the range of 6.0-6.6 μm, consistent with the 3 MeV proton losses in 25 μm Cu foil) and 15 MeV alphas (track diameter near7.4 μm, consistent with ~ 19 MeV alpha losses in 25 μm Cu foil) are appeared in the sum spectra (b).
13
4 5 6 7 8 9 10 11
-4
-2
0
2
4
6
Tra
ckn
um
be
r/1
cm
2
Track diameter, [m]
#1822-33mAl-back side Pd/PdO:Dx20 runs, t = 1000 min Etch 7 hr
(10a)
4 5 6 7 8 9 10 11
-5
0
5
10
15
20
Tra
ck
nu
mb
er/
2cm
2
Track diameter, [m]
[1822+1866] 33m Al-back-Pd/PdO:Dx
2.1 MeV p
(10b)
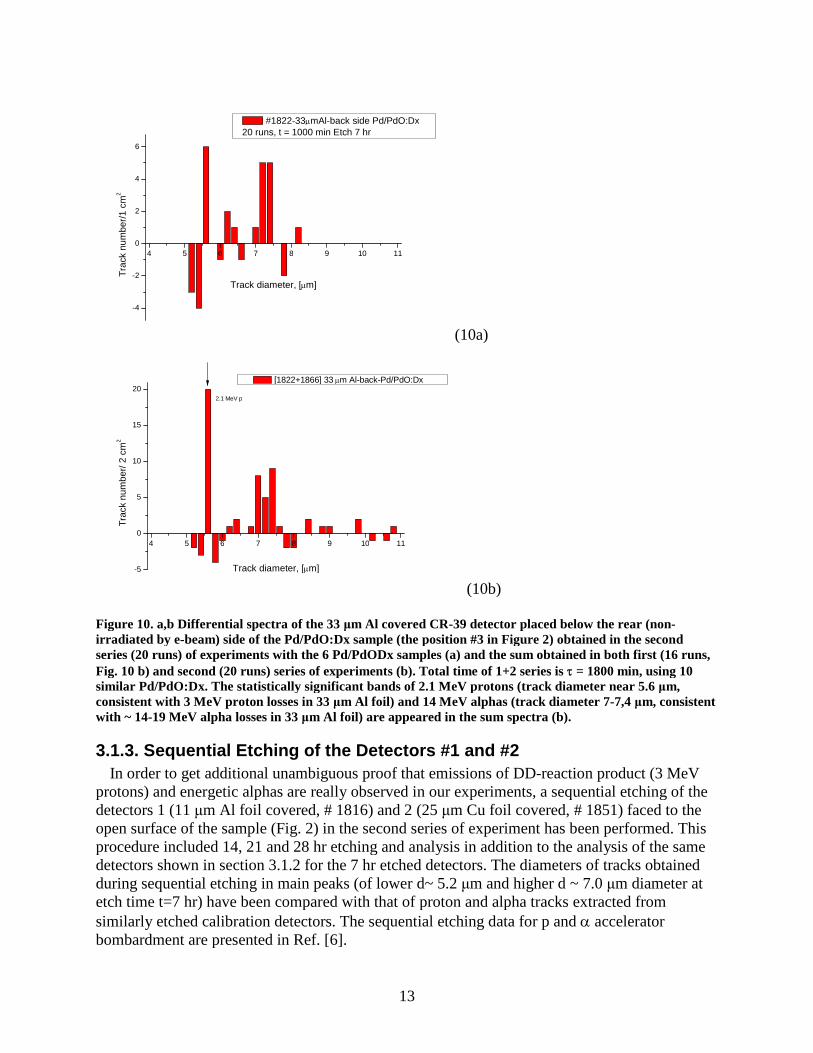
Figure 10. a,b Differential spectra of the 33 μm Al covered CR-39 detector placed below the rear (non-irradiated by e-beam) side of the Pd/PdO:Dx sample (the position #3 in Figure 2) obtained in the secondseries (20 runs) of experiments with the 6 Pd/PdODx samples (a) and the sum obtained in both first (16 runs,Fig. 10 b) and second (20 runs) series of experiments (b). Total time of 1+2 series is = 1800 min, using 10similar Pd/PdO:Dx. The statistically significant bands of 2.1 MeV protons (track diameter near 5.6 μm,consistent with 3 MeV proton losses in 33 μm Al foil) and 14 MeV alphas (track diameter 7-7,4 μm, consistentwith ~ 14-19 MeV alpha losses in 33 μm Al foil) are appeared in the sum spectra (b).
3.1.3. Sequential Etching of the Detectors #1 and #2
In order to get additional unambiguous proof that emissions of DD-reaction product (3 MeVprotons) and energetic alphas are really observed in our experiments, a sequential etching of thedetectors 1 (11 μm Al foil covered, # 1816) and 2 (25 μm Cu foil covered, # 1851) faced to theopen surface of the sample (Fig. 2) in the second series of experiment has been performed. Thisprocedure included 14, 21 and 28 hr etching and analysis in addition to the analysis of the samedetectors shown in section 3.1.2 for the 7 hr etched detectors. The diameters of tracks obtainedduring sequential etching in main peaks (of lower d~ 5.2 μm and higher d ~ 7.0 μm diameter atetch time t=7 hr) have been compared with that of proton and alpha tracks extracted fromsimilarly etched calibration detectors. The sequential etching data for p and acceleratorbombardment are presented in Ref. [6].
14
4 5 6 7 8 9 10 11 12 13 14 15 16 17 18
0
5
10
15
20
25
30
Tra
ck
num
be
r/1
cm
2
Track diameter, [m]
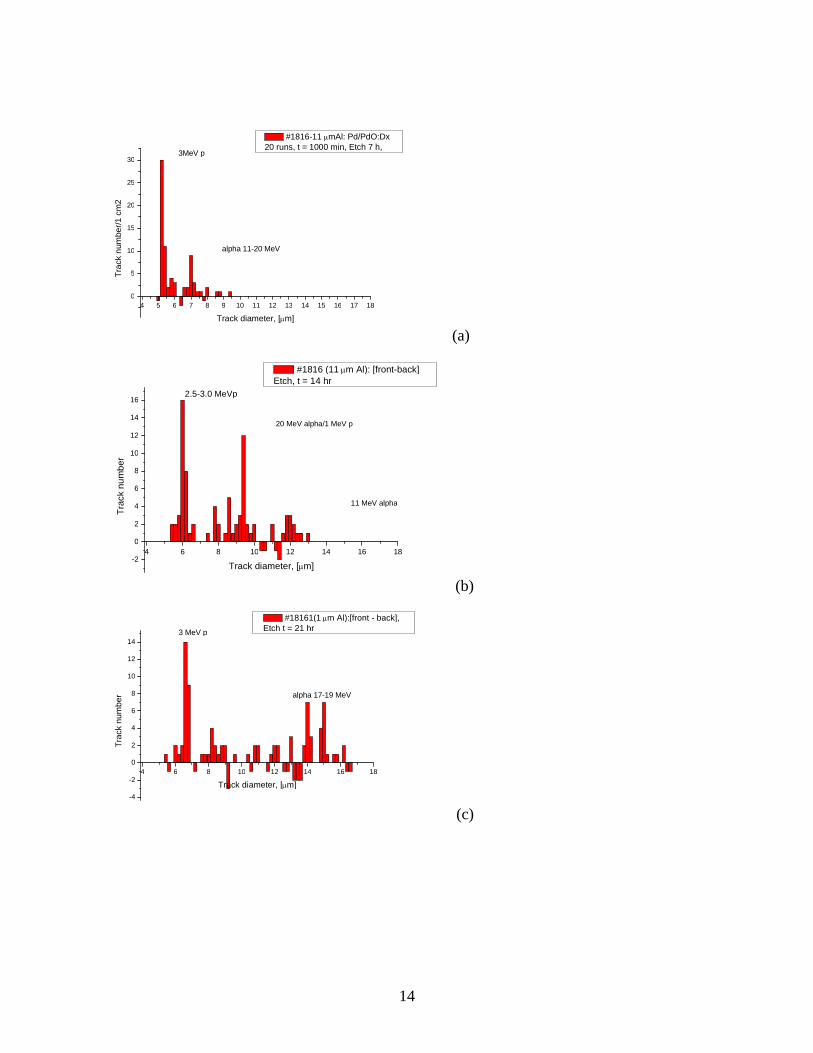
#1816-11 mAl: Pd/PdO:Dx20 runs, t = 1000 min, Etch 7 h,
3MeV p
alpha 11-20 MeV
(a)
4 6 8 10 12 14 16 18-2
0
2
4
6
8
10
12
14
16
Tra
ck
nu
mb
er
Track diameter, [m]
#1816 (11m Al): [front-back]Etch, t = 14 hr
2.5-3.0 MeVp
20 MeV alpha/1 MeV p
11 MeV alpha
(b)
4 6 8 10 12 14 16 18
-4
-2
0
2
4
6
8
10
12
14
Tra
ck
nu
mb
er
Track diameter, [m]
#18161(1m Al):[front - back],Etch t = 21 hr
3 MeV p
alpha 17-19 MeV
(c)
15
4 6 8 10 12 14 16 18
-4
-2
0
2
4
6
8
10
12
14
Tra
ck
num
be
r
Track diameter, [m]
#1816(11m Al): [front-back]Etch, t = 28 hr
3MeV p
alpha > 20 MeV
(d)
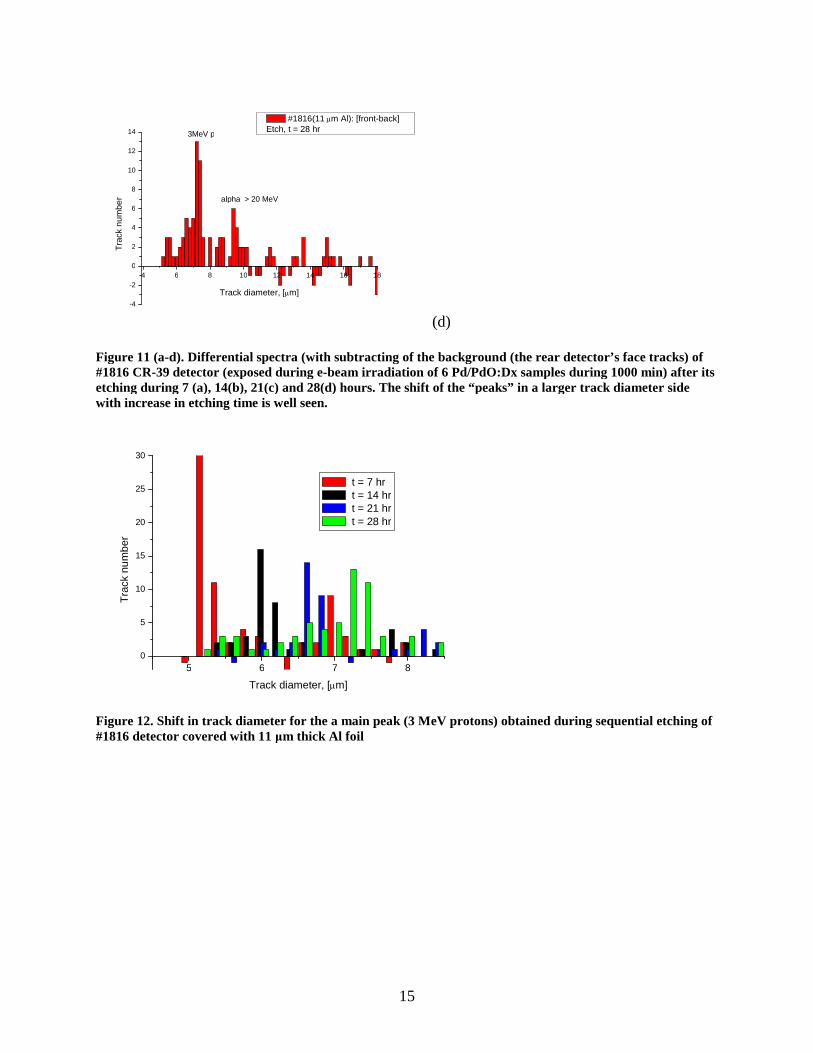
Figure 11 (a-d). Differential spectra (with subtracting of the background (the rear detector’s face tracks) of#1816 CR-39 detector (exposed during e-beam irradiation of 6 Pd/PdO:Dx samples during 1000 min) after itsetching during 7 (a), 14(b), 21(c) and 28(d) hours. The shift of the “peaks” in a larger track diameter sidewith increase in etching time is well seen.
5 6 7 8
0
5
10
15
20
25
30
Tra
ck
nu
mb
er
Track diameter, [m]
t = 7 hrt = 14 hrt = 21 hrt = 28 hr
Figure 12. Shift in track diameter for the a main peak (3 MeV protons) obtained during sequential etching of#1816 detector covered with 11 μm thick Al foil
16
4 5 6 7 8 9 10 11 12 13 14 15 16 17 18
-2
0
2
4
6
8
10
Tra
ck
nu
mb
er/
1cm
2
Track diameter, [m]
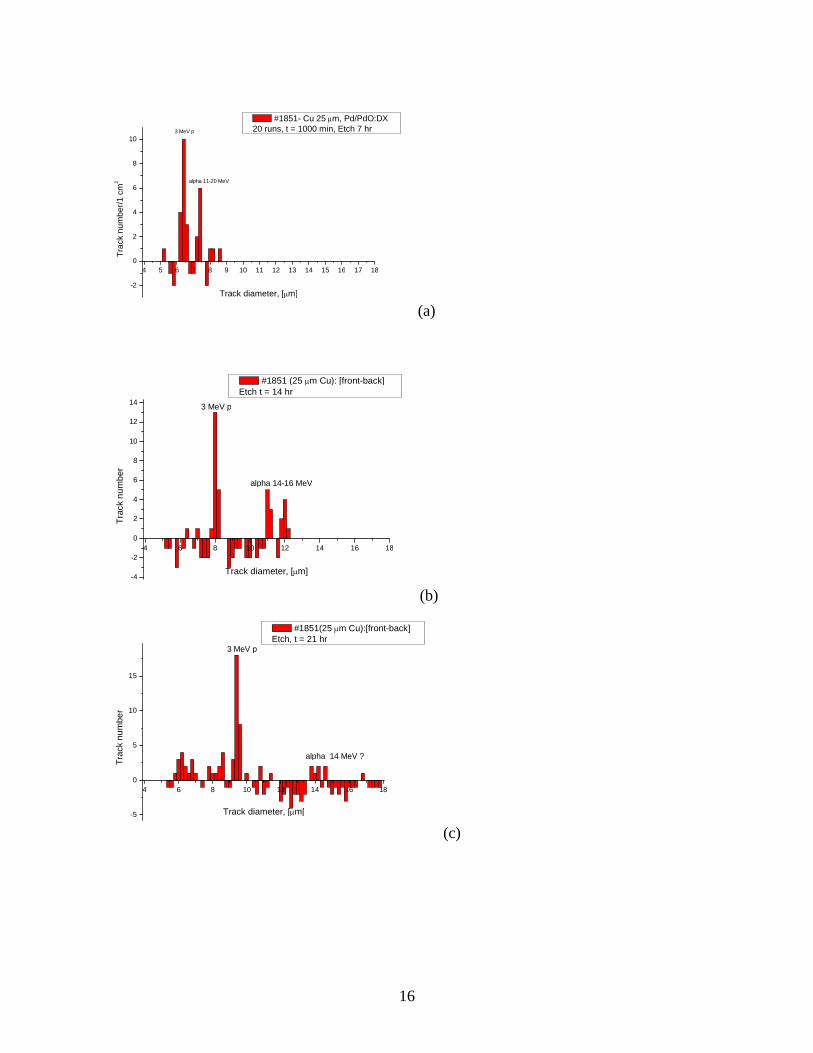
#1851- Cu 25m, Pd/PdO:DX20 runs, t = 1000 min, Etch 7 hr3 MeV p
alpha 11-20 MeV
(a)
4 6 8 10 12 14 16 18
-4
-2
0
2
4
6
8
10
12
14
Tra
ck
nu
mb
er
Track diameter, [m]
#1851 (25 m Cu): [front-back]Etch t = 14 hr
3 MeV p
alpha 14-16 MeV
(b)
4 6 8 10 12 14 16 18
-5
0
5
10
15
Tra
ck
nu
mbe
r
Track diameter, [m[
#1851(25 m Cu):[front-back]Etch, t = 21 hr
3 MeV p
alpha 14 MeV ?
(c)
17
4 6 8 10 12 14 16 18
-4
-2
0
2
4
6
8
10
12
14
Tra
cknu
mb
er
Track diameter, [m]
#1851 (25 mm Cu): [front-back]Etch, t = 28 hr
3eV p
alpha 16-18 MeV
(d)
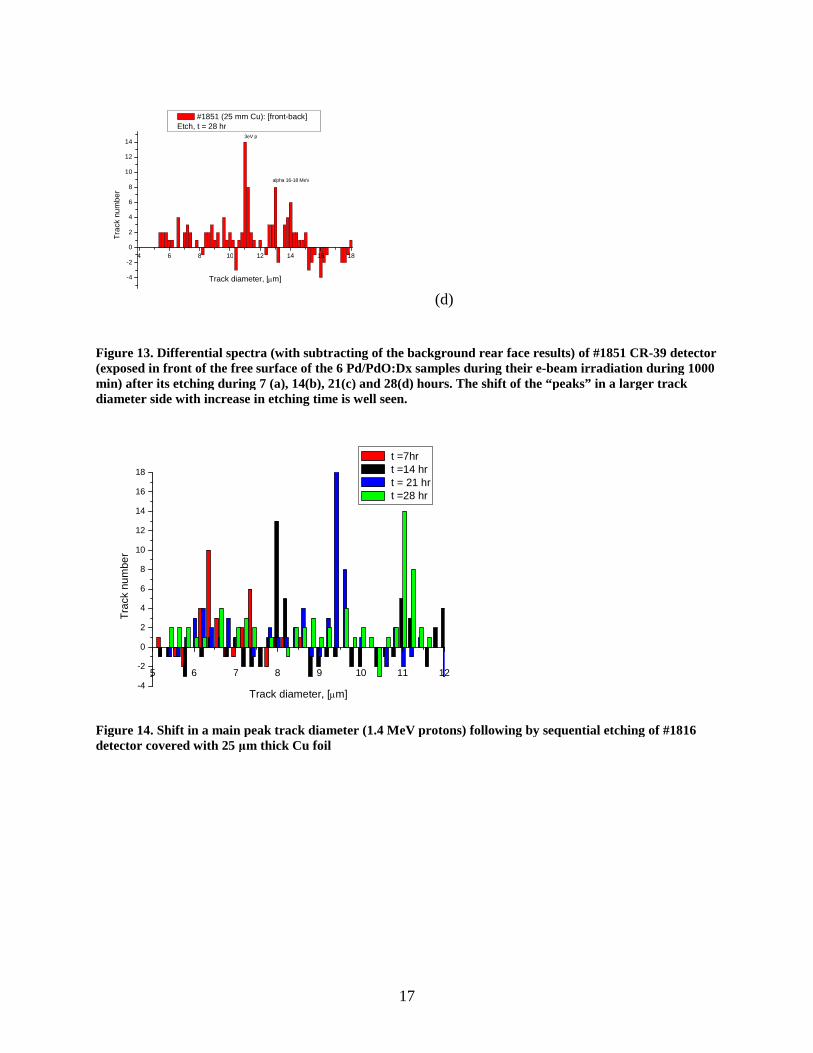
Figure 13. Differential spectra (with subtracting of the background rear face results) of #1851 CR-39 detector(exposed in front of the free surface of the 6 Pd/PdO:Dx samples during their e-beam irradiation during 1000min) after its etching during 7 (a), 14(b), 21(c) and 28(d) hours. The shift of the “peaks” in a larger trackdiameter side with increase in etching time is well seen.
5 6 7 8 9 10 11 12
-4
-2
0
2
4
6
8
10
12
14
16
18
Tra
ck
nu
mbe
r
Track diameter, [m]
t =7hrt =14 hrt = 21 hrt =28 hr
Figure 14. Shift in a main peak track diameter (1.4 MeV protons) following by sequential etching of #1816detector covered with 25 μm thick Cu foil
18
5 10 15 20 25 30 35 40
5
6
7
8
9
10
11
12
Tra
ckd
iam
ete
r,m
Removed depth, m
2.75 MeV Proton calibration11 m Al /detector tracks1.4 MeV Proton calibration25 m Cu /detector tracks
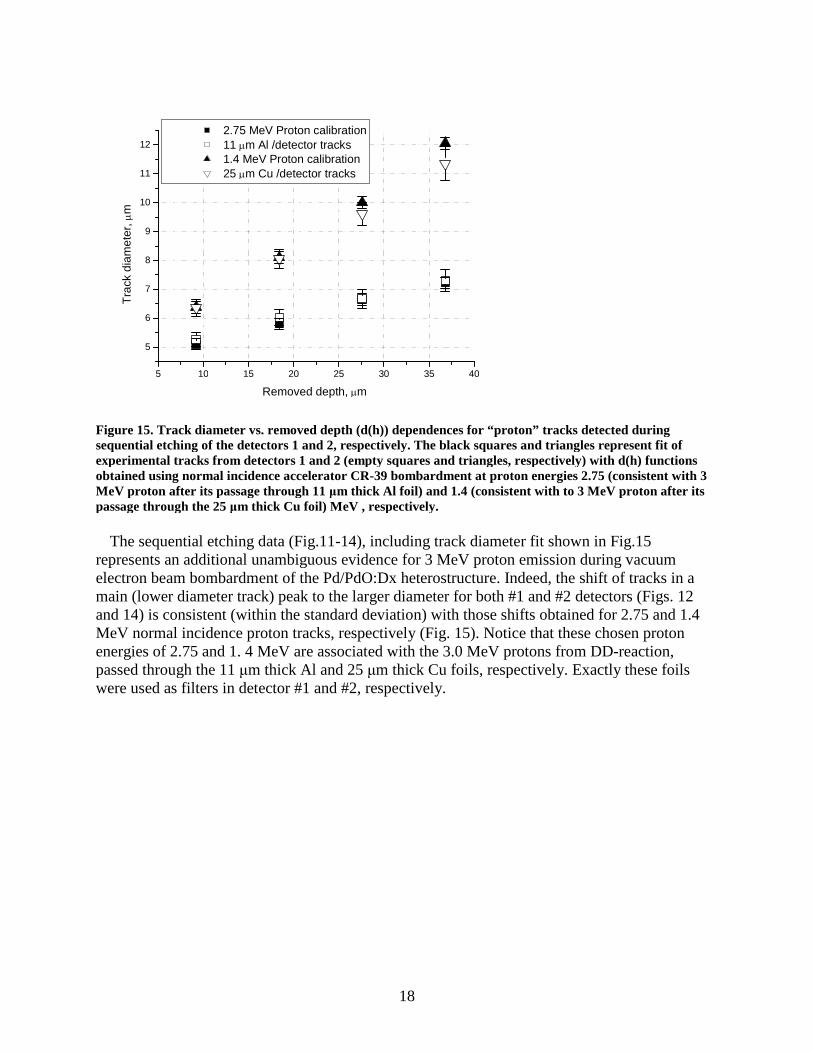
Figure 15. Track diameter vs. removed depth (d(h)) dependences for “proton” tracks detected duringsequential etching of the detectors 1 and 2, respectively. The black squares and triangles represent fit ofexperimental tracks from detectors 1 and 2 (empty squares and triangles, respectively) with d(h) functionsobtained using normal incidence accelerator CR-39 bombardment at proton energies 2.75 (consistent with 3MeV proton after its passage through 11 μm thick Al foil) and 1.4 (consistent with to 3 MeV proton after itspassage through the 25 μm thick Cu foil) MeV , respectively.
The sequential etching data (Fig.11-14), including track diameter fit shown in Fig.15represents an additional unambiguous evidence for 3 MeV proton emission during vacuumelectron beam bombardment of the Pd/PdO:Dx heterostructure. Indeed, the shift of tracks in amain (lower diameter track) peak to the larger diameter for both #1 and #2 detectors (Figs. 12and 14) is consistent (within the standard deviation) with those shifts obtained for 2.75 and 1.4MeV normal incidence proton tracks, respectively (Fig. 15). Notice that these chosen protonenergies of 2.75 and 1. 4 MeV are associated with the 3.0 MeV protons from DD-reaction,passed through the 11 μm thick Al and 25 μm thick Cu foils, respectively. Exactly these foilswere used as filters in detector #1 and #2, respectively.
19
10 15 20 25 30 35
6
7
8
9
10
11
12
13
14
15T
rack
Dia
me
ter,
[m
]
Removed Depth, H [m]
alpha 20 MeValpha 15,7 MeV11 m Al/detector25 m Cu/detector
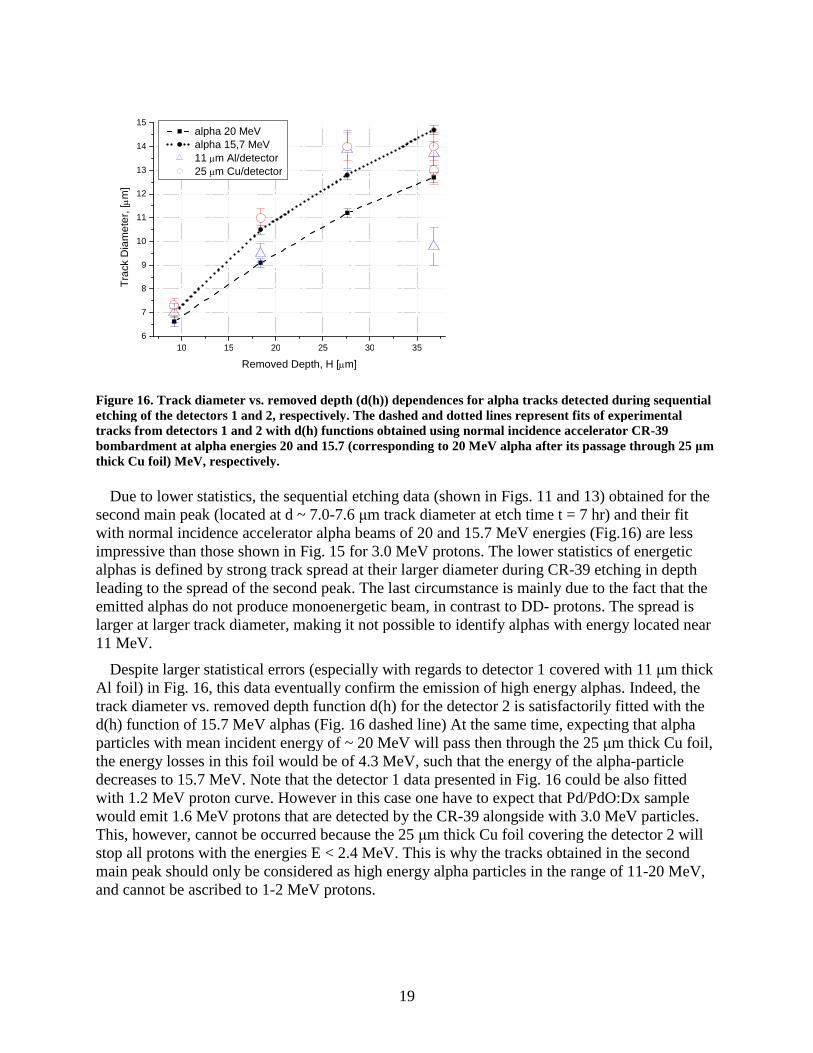
Figure 16. Track diameter vs. removed depth (d(h)) dependences for alpha tracks detected during sequentialetching of the detectors 1 and 2, respectively. The dashed and dotted lines represent fits of experimentaltracks from detectors 1 and 2 with d(h) functions obtained using normal incidence accelerator CR-39bombardment at alpha energies 20 and 15.7 (corresponding to 20 MeV alpha after its passage through 25 μmthick Cu foil) MeV, respectively.
Due to lower statistics, the sequential etching data (shown in Figs. 11 and 13) obtained for thesecond main peak (located at d ~ 7.0-7.6 μm track diameter at etch time t = 7 hr) and their fitwith normal incidence accelerator alpha beams of 20 and 15.7 MeV energies (Fig.16) are lessimpressive than those shown in Fig. 15 for 3.0 MeV protons. The lower statistics of energeticalphas is defined by strong track spread at their larger diameter during CR-39 etching in depthleading to the spread of the second peak. The last circumstance is mainly due to the fact that theemitted alphas do not produce monoenergetic beam, in contrast to DD- protons. The spread islarger at larger track diameter, making it not possible to identify alphas with energy located near11 MeV.
Despite larger statistical errors (especially with regards to detector 1 covered with 11 μm thickAl foil) in Fig. 16, this data eventually confirm the emission of high energy alphas. Indeed, thetrack diameter vs. removed depth function d(h) for the detector 2 is satisfactorily fitted with thed(h) function of 15.7 MeV alphas (Fig. 16 dashed line) At the same time, expecting that alphaparticles with mean incident energy of ~ 20 MeV will pass then through the 25 μm thick Cu foil,the energy losses in this foil would be of 4.3 MeV, such that the energy of the alpha-particledecreases to 15.7 MeV. Note that the detector 1 data presented in Fig. 16 could be also fittedwith 1.2 MeV proton curve. However in this case one have to expect that Pd/PdO:Dx samplewould emit 1.6 MeV protons that are detected by the CR-39 alongside with 3.0 MeV particles.This, however, cannot be occurred because the 25 μm thick Cu foil covering the detector 2 willstop all protons with the energies E < 2.4 MeV. This is why the tracks obtained in the secondmain peak should only be considered as high energy alpha particles in the range of 11-20 MeV,and cannot be ascribed to 1-2 MeV protons.

20
Thus, the sequential etching data shows that during e-beam irradiation of the Pd/PdO:Dx
heterostructure the 3 MeV protons and high energy alphas (in the range, roughly of 11-20 MeV)really have been emitted.
3.1.4. Charged particle emission rate in the Pd/PdO:Dx
The results for e-beam irradiated face of the Pd/PdO:Dx heterostructure sample, obtained byaveraging of 11 μm Al and 25 μm Cu data, taken for detectors 1 and 2 respectively in total 36runs (t = 1800 min) are following:
a. For 3 MeV protons <Np> = (3.71 ± 0.48) × 10-4 cps/cm2 of CR-39, or taking intoaccount total efficiency of the detection ( = 0.026) Np = (1.39 ± 0.18) × 10-2 p/s-cm2 ofPd/PdO:Dx sample. (the significance level above the background is L = 7.7 )
b. For alpha particles with the energy in the range of 11-20 MeV. <N> = (1.87 ± 0.32) ×10-4 cps/cm2 of CR-39 or taking into account total efficiency of the detection ( = 0.026),N = (0.71 ± 0.12) × 10-2 /s-cm2 of Pd/PdO:Dx sample. (the significance level is L = 6.0)
The yield of DD-reaction in the Pd/PdO:Dx target under e-beam bombardment, taken only formovable deuterons (the desorbed flux Jd = 3x10¹⁵ D/s-cm2) is found to be DD ~ 3.3x10⁻¹⁸ p/D.
For the detector in position #3 (Fig 2) placed under the rear (non-irradiated by e-beam) side ofthe Pd/PdO:Dx sample the average result in total 36 runs (t = 1800 min) during e-beamirradiation of the front side of the Pd/PdO:Dx:
a. For 3 MeV protons <Np> = (1.81 ± 0.40)x 10-4 cps/cm2 of CR-39, or taking into accounttotal efficiency of the track detection for 1.9 MeV protons after permeation of 3 MeV pthrough 33 μm Al ( = 0.11), Np = (1.68 ± 0,37) × 10-3 p/s-cm2 of the Pd/PdO:Dx sample.(significance L = 4.5 )
b. For alpha particles with the energy in the range of 11-19 MeV <N> = (2,49 ± 0.45) ×10-4 cps/cm2 of CR-39 or taking into account total efficiency of the track detection forhigh energy (> 11 MeV) alphas ( = 0.17) N = (1.46 ± 0.27) × 10-3 /s-cm2 of thePd/PdO:Dx sample. (significance L = 5.5 ).
The count rate calculation results show that the front side of the sample irradiated by electronbeam provides an excess (5-8 times) in the absolute intensity of the proton and alpha emissionscompared to that detected at the rear side of the sample, which has not been irradiated directly.At the same time both the front and the rear side of the Pd/PdO:Dx sample under e-beamstimulation show a large excess in the proton and alpha emission bands, compared to the samePd/PdO:Dx target that have been run in vacuum without excitation of their D-subsystem (i.e. inthe spontaneous D-desorption mode). Observation of nuclear emissions from the rear side of thetarget, under e-beam irradiation of its front side, indicates some D-desorption enhancement invacuum also at the rear side of the e-irradiated Pd/PdO:Dx sample
21
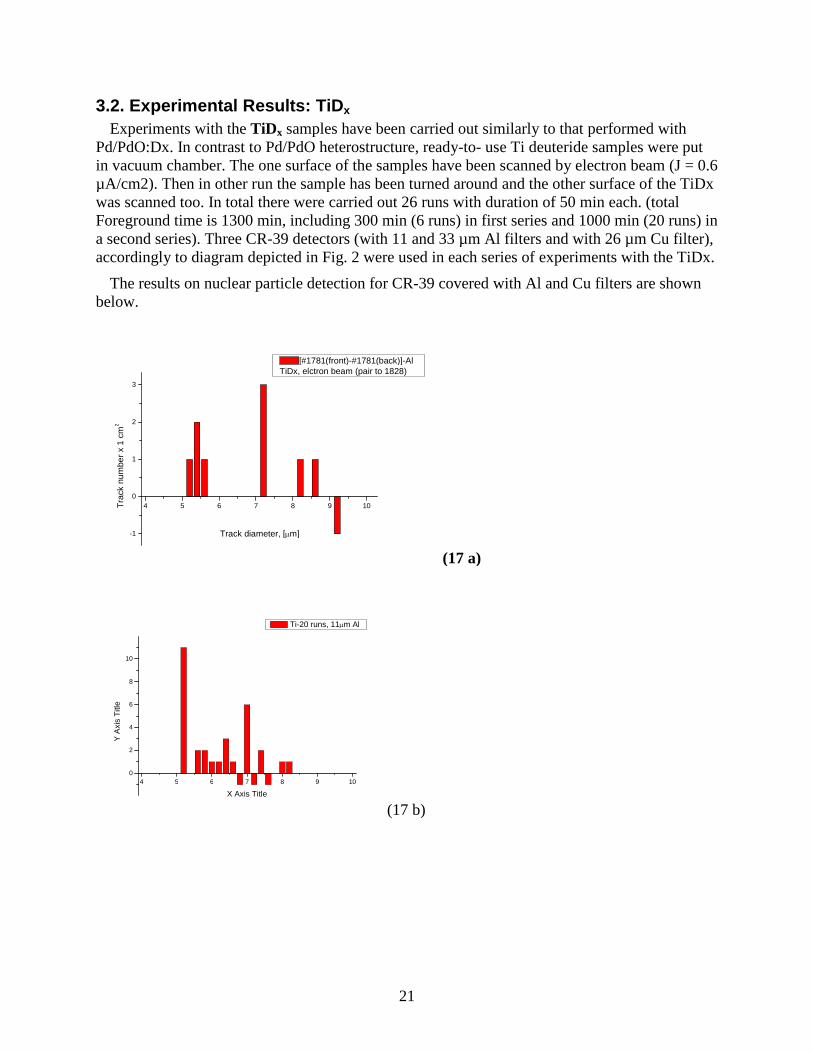
3.2. Experimental Results: TiDx
Experiments with the TiDx samples have been carried out similarly to that performed withPd/PdO:Dx. In contrast to Pd/PdO heterostructure, ready-to- use Ti deuteride samples were putin vacuum chamber. The one surface of the samples have been scanned by electron beam (J = 0.6µA/cm2). Then in other run the sample has been turned around and the other surface of the TiDxwas scanned too. In total there were carried out 26 runs with duration of 50 min each. (totalForeground time is 1300 min, including 300 min (6 runs) in first series and 1000 min (20 runs) ina second series). Three CR-39 detectors (with 11 and 33 µm Al filters and with 26 µm Cu filter),accordingly to diagram depicted in Fig. 2 were used in each series of experiments with the TiDx.
The results on nuclear particle detection for CR-39 covered with Al and Cu filters are shownbelow.
4 5 6 7 8 9 10
-1
0
1
2
3
Tra
ck
num
be
rx
1cm
2
Track diameter, [m]
[#1781(front)-#1781(back)]-AlTiDx, elctron beam (pair to 1828)
(17 a)
4 5 6 7 8 9 10
0
2
4
6
8
10
YA
xis
Title
X Axis Title
Ti-20 runs, 11m Al
(17 b)
22
4 5 6 7 8 9 10
-2
0
2
4
6
8
10
12
YA
xis
Title
X Axis Title
TiDx-26 runs [1829+1781] -11m Al
(17c)
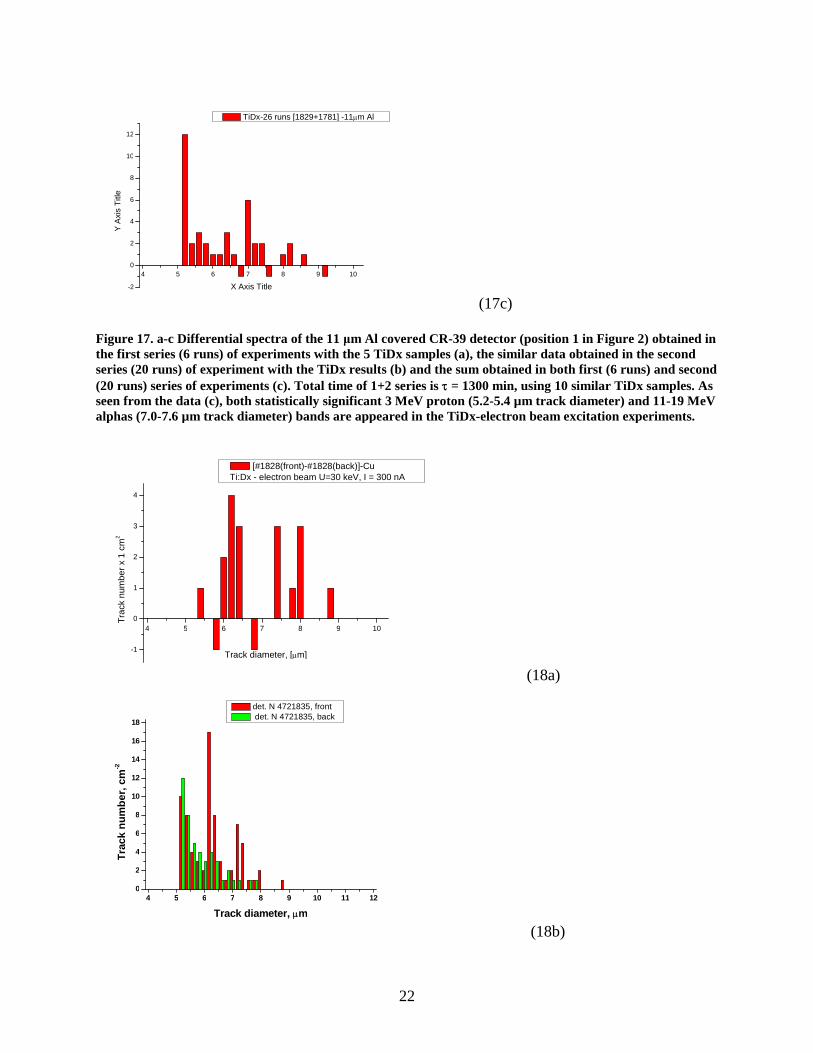
Figure 17. a-c Differential spectra of the 11 μm Al covered CR-39 detector (position 1 in Figure 2) obtained inthe first series (6 runs) of experiments with the 5 TiDx samples (a), the similar data obtained in the secondseries (20 runs) of experiment with the TiDx results (b) and the sum obtained in both first (6 runs) and second(20 runs) series of experiments (c). Total time of 1+2 series is = 1300 min, using 10 similar TiDx samples. Asseen from the data (c), both statistically significant 3 MeV proton (5.2-5.4 µm track diameter) and 11-19 MeValphas (7.0-7.6 µm track diameter) bands are appeared in the TiDx-electron beam excitation experiments.
4 5 6 7 8 9 10
-1
0
1
2
3
4
Tra
ck
num
be
rx
1cm
2
Track diameter, [m]
[#1828(front)-#1828(back)]-CuTi:Dx - electron beam U=30 keV, I = 300 nA
(18a)
4 5 6 7 8 9 10 11 120
2
4
6
8
10
12
14
16
18
Tra
ck
nu
mb
er,
cm
-2
Track diameter, m
det. N 4721835, frontdet. N 4721835, back
(18b)
23
4 5 6 7 8 9 10
-2
0
2
4
6
8
10
12
14
YA
xis
Titl
e
X Axis Title
Ti-20 runs, 27 m Cu
(18c)
4 5 6 7 8 9 10
0
5
10
15
YA
xis
Title
X Axis Title
TiDx {1835+1828] -26 runs, Cu 26m
(18d)
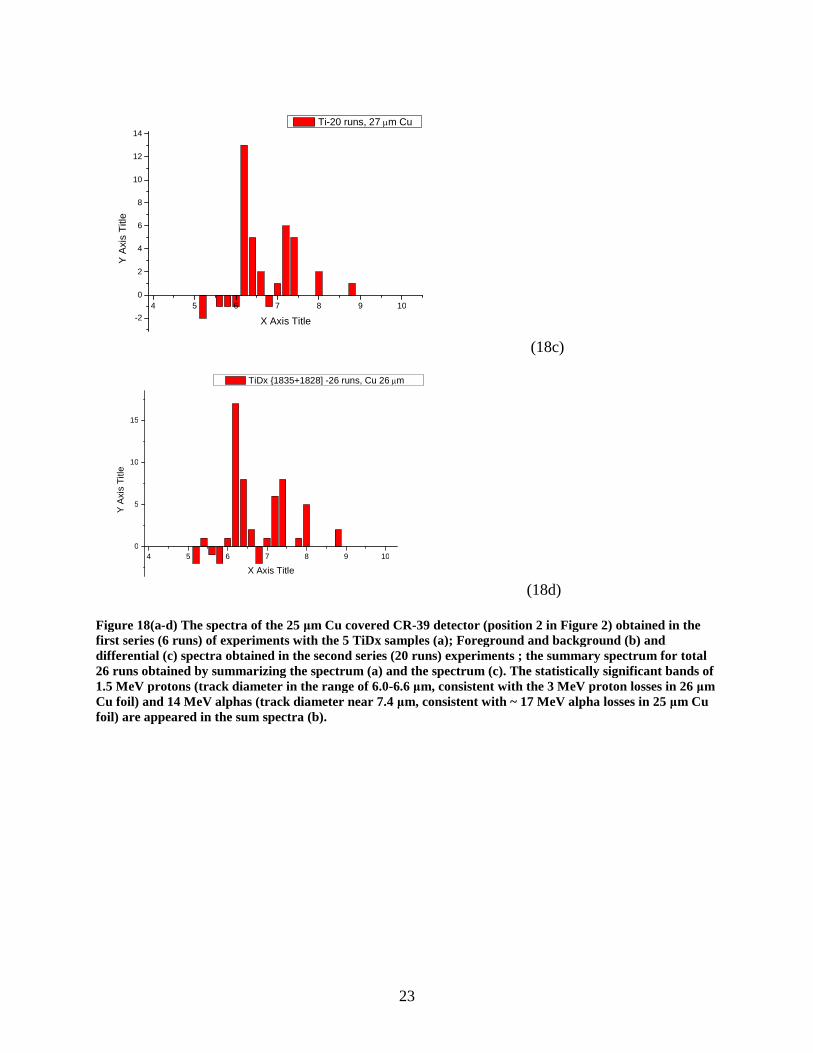
Figure 18(a-d) The spectra of the 25 μm Cu covered CR-39 detector (position 2 in Figure 2) obtained in thefirst series (6 runs) of experiments with the 5 TiDx samples (a); Foreground and background (b) anddifferential (c) spectra obtained in the second series (20 runs) experiments ; the summary spectrum for total26 runs obtained by summarizing the spectrum (a) and the spectrum (c). The statistically significant bands of1.5 MeV protons (track diameter in the range of 6.0-6.6 μm, consistent with the 3 MeV proton losses in 26 μmCu foil) and 14 MeV alphas (track diameter near 7.4 μm, consistent with ~ 17 MeV alpha losses in 25 μm Cufoil) are appeared in the sum spectra (b).
24
4 5 6 7 8 9 10 11 120
2
4
6
8
10
12
14
Tra
ck
nu
mb
er,
cm
-2
Track diameter, m
det. N4721827, frontdet. N4721827, back
(19a)
4 5 6 7 8 9 10
-3
-2
-1
0
1
2
3
4
5
6
7
8
9
10
Tra
ck
num
ber
/1cm
2
Track diameter, [m]
[#1827 (front)-#1827(back)], rae side ofthe TiDx sample 20 runs, t=1000 min, etch 7 hr
(19b)
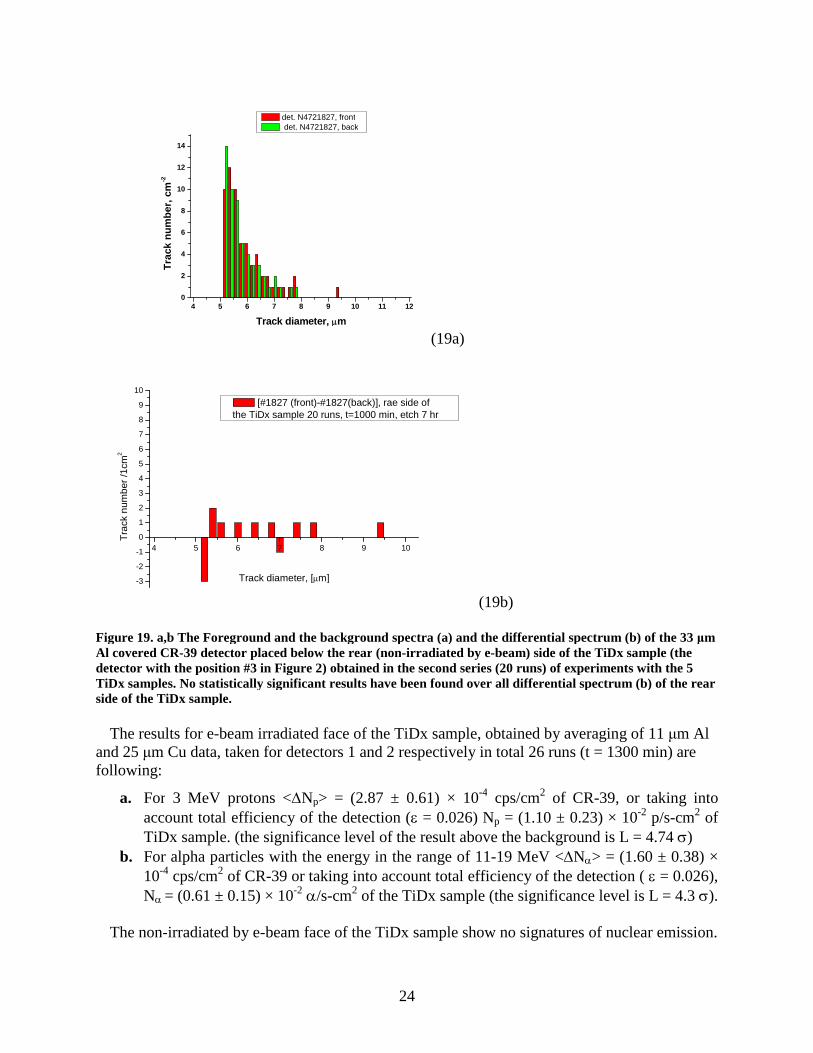
Figure 19. a,b The Foreground and the background spectra (a) and the differential spectrum (b) of the 33 μmAl covered CR-39 detector placed below the rear (non-irradiated by e-beam) side of the TiDx sample (thedetector with the position #3 in Figure 2) obtained in the second series (20 runs) of experiments with the 5TiDx samples. No statistically significant results have been found over all differential spectrum (b) of the rearside of the TiDx sample.
The results for e-beam irradiated face of the TiDx sample, obtained by averaging of 11 μm Aland 25 μm Cu data, taken for detectors 1 and 2 respectively in total 26 runs (t = 1300 min) arefollowing:
a. For 3 MeV protons <Np> = (2.87 ± 0.61) × 10-4 cps/cm2 of CR-39, or taking intoaccount total efficiency of the detection ( = 0.026) Np = (1.10 ± 0.23) × 10-2 p/s-cm2 ofTiDx sample. (the significance level of the result above the background is L = 4.74 )
b. For alpha particles with the energy in the range of 11-19 MeV <N> = (1.60 ± 0.38) ×10-4 cps/cm2 of CR-39 or taking into account total efficiency of the detection ( = 0.026),N = (0.61 ± 0.15) × 10-2 /s-cm2 of the TiDx sample (the significance level is L = 4.3 ).
The non-irradiated by e-beam face of the TiDx sample show no signatures of nuclear emission.
25
The yield of DD-reaction in the TiDx target under e-beam bombardment, taken only formovable deuterons (the desorbed flux Jd = 1014 D/s-cm2) is found to be DD ~ 1.1x10⁻¹⁶ p/D.
Thus, the e-beam excitation of the TiDx samples results in initiation of DD-reaction(producing 3 MeV protons) as well as high energy alpha particles. The intensity of the nuclearemissions is quite comparable to that of the Pd/PdO:Dx samples, but provide lower statisticalsignificance. In contrast to Pd/PdO:Dx system the TiDx samples show no emissions from theface opposite to the e-beam irradiated side. This only proofs that no nuclear emissions occurwithout D-desorption from the rear face of the TiDx samples, while the Pd/PdO:Dxheterostructure provides weak spontaneous D-desorption from its rear side. Such a desorptioncould be partially stimulated by e-beam interaction with the front (irradiated) face of thePd/PdO:Dx sample.
4. DiscussionThus, we have shown experimentally that charged particle emission in Pd/PdO:Dx abd TiDx in
vacuum can be stimulated by relatively weak (J< 1 µA/cm2, E=30 keV) electron beam. Wefound that e-beam excitation of D-subsytem in those deuterides with a high affinity to hydrogenis resulted in origination of DD-reaction (3 MeV proton emission) as well as energetic alphaparticles with energies in the range of 11-19 MeV. The yield of DD-reaction for Pd/PdO:Dx andTiDx targets taken per movable (desorbed) deuteron is found to be 10-18-10-16 per 1 D. Thisfigure exceeds the so-called “Jones level” by 5 to 7 orders of magnitude.
The alpha particle emission effect has been observed previously in experiments on D-desorption from the Pd/PdO:Dx [7-9] system and high-current deuterium glow dischargebombardment of the Ti cathode [5]. The origin of energetic alphas still remains puzzling, andfurther experiments are required in order to shed a light on the mechanism of high energy alphaemission in deuterated solids. In this work we do not consider the alpha emission mechanism.Instead, we are going to discuss possible factors of the DD-reaction enhancement, providing ameasurable 3 MeV proton yield.
In this connection, below we show that extrapolation of both DD-reaction cross section and theenhancement factor to very low deuteron energy (Ed ~ 3.0 eV) with a reasonable screeningpotential Ue = 750 eV, allowed to describe satisfactorily the detected DD-reaction yield inPd/PdO:Dx target under e-beam excitation. This result strongly supports the theoreticalprediction [1,2] with regards to electron excitation of hydrogen subsystem in Pd deuteride.
In order to estimate the DD-reaction rate in the Pd/PdO:Dx target under electron bombardmentwe use a simple model of the process, taking into account that D-deosrption stimulated by e-beam results in deuterium flux moving toward the Pd/PdO:Dx surface. Thus the movingdeuteron flux can be considered a low energy projectile or “deuteron beam,” while the deuteratedsurface of the Pd/PdO sample we consider a deuterated “target.” The deuteron (D+) current,estimated via D-desorption rate (see Experimental part) would be of Jd = 0.5 mA/cm2, while themean concentration of deuteron at the surface is corresponded to mean D/Pd ratio during e-beambombardment (<x> ~ 0.15 or Nd = 1.1x1022 cm-3).
In order to estimate DD-reaction rate we use a so-called thick target yield expression, normallyemployed in accelerator physics [3-5], recently developed and modified for lower energyapplications [10]:
26
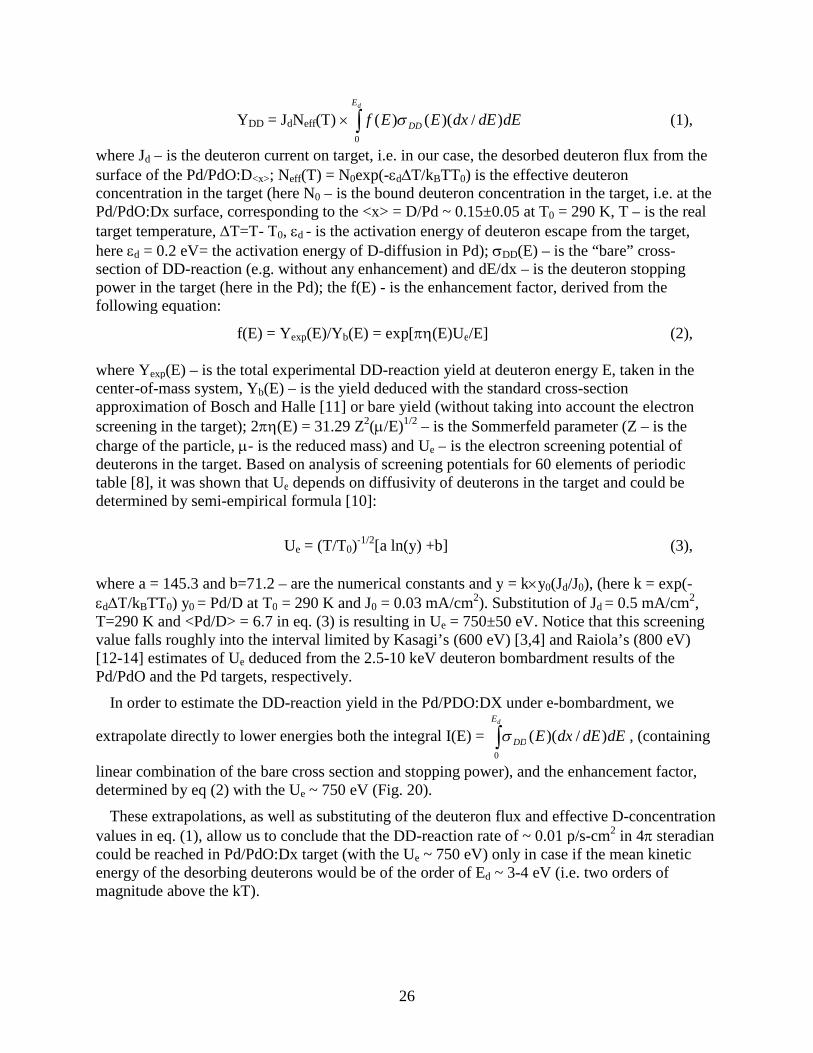
YDD = JdNeff(T) dEdEdxEEfdE
DD )/)(()(0
(1),
where Jd – is the deuteron current on target, i.e. in our case, the desorbed deuteron flux from thesurface of the Pd/PdO:D<x>; Neff(T) = N0exp(-dT/kBTT0) is the effective deuteronconcentration in the target (here N0 – is the bound deuteron concentration in the target, i.e. at thePd/PdO:Dx surface, corresponding to the <x> = D/Pd ~ 0.15±0.05 at T0 = 290 K, T – is the realtarget temperature, T=T- T0, d - is the activation energy of deuteron escape from the target,here d = 0.2 eV= the activation energy of D-diffusion in Pd); DD(E) – is the “bare” cross-section of DD-reaction (e.g. without any enhancement) and dE/dx – is the deuteron stoppingpower in the target (here in the Pd); the f(E) - is the enhancement factor, derived from thefollowing equation:
f(E) = Yexp(E)/Yb(E) = exp[(E)Ue/E] (2),
where Yexp(E) – is the total experimental DD-reaction yield at deuteron energy E, taken in thecenter-of-mass system, Yb(E) – is the yield deduced with the standard cross-sectionapproximation of Bosch and Halle [11] or bare yield (without taking into account the electronscreening in the target); 2(E) = 31.29 Z2(/E)1/2 – is the Sommerfeld parameter (Z – is thecharge of the particle, - is the reduced mass) and Ue – is the electron screening potential ofdeuterons in the target. Based on analysis of screening potentials for 60 elements of periodictable [8], it was shown that Ue depends on diffusivity of deuterons in the target and could bedetermined by semi-empirical formula [10]:
Ue = (T/T0)-1/2[a ln(y) +b] (3),
where a = 145.3 and b=71.2 – are the numerical constants and y = ky0(Jd/J0), (here k = exp(-dT/kBTT0) y0 = Pd/D at T0 = 290 K and J0 = 0.03 mA/cm2). Substitution of Jd = 0.5 mA/cm2,T=290 K and <Pd/D> = 6.7 in eq. (3) is resulting in Ue = 750±50 eV. Notice that this screeningvalue falls roughly into the interval limited by Kasagi’s (600 eV) [3,4] and Raiola’s (800 eV)[12-14] estimates of Ue deduced from the 2.5-10 keV deuteron bombardment results of thePd/PdO and the Pd targets, respectively.
In order to estimate the DD-reaction yield in the Pd/PDO:DX under e-bombardment, we
extrapolate directly to lower energies both the integral I(E) = dEdEdxEdE
DD )/)((0
, (containing
linear combination of the bare cross section and stopping power), and the enhancement factor,determined by eq (2) with the Ue ~ 750 eV (Fig. 20).
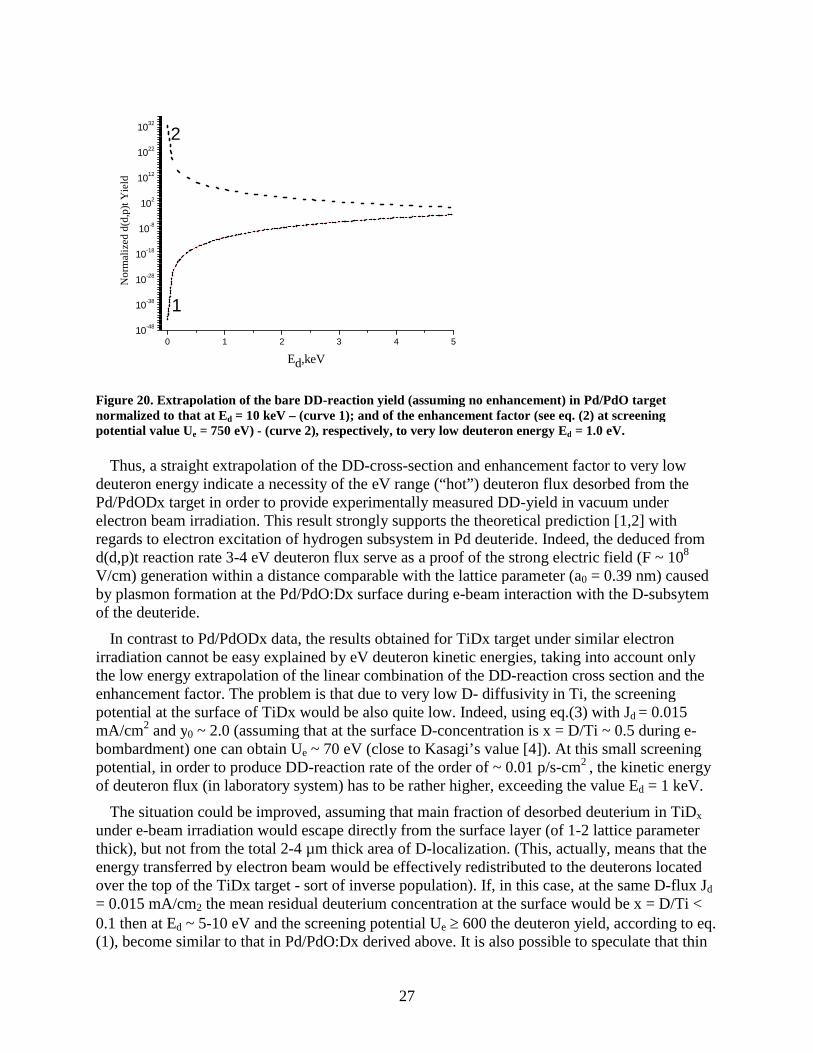
These extrapolations, as well as substituting of the deuteron flux and effective D-concentrationvalues in eq. (1), allow us to conclude that the DD-reaction rate of ~ 0.01 p/s-cm2 in 4 steradiancould be reached in Pd/PdO:Dx target (with the Ue ~ 750 eV) only in case if the mean kineticenergy of the desorbing deuterons would be of the order of Ed ~ 3-4 eV (i.e. two orders ofmagnitude above the kT).
27
0 1 2 3 4 510
-48
10-38
10-28
10-18
10-8
102
1012
1022
1032
No
rmal
ized
d(d
,p)t
Yie
ld
Ed,keV
2
1
Figure 20. Extrapolation of the bare DD-reaction yield (assuming no enhancement) in Pd/PdO targetnormalized to that at Ed = 10 keV – (curve 1); and of the enhancement factor (see eq. (2) at screeningpotential value Ue = 750 eV) - (curve 2), respectively, to very low deuteron energy Ed = 1.0 eV.
Thus, a straight extrapolation of the DD-cross-section and enhancement factor to very lowdeuteron energy indicate a necessity of the eV range (“hot”) deuteron flux desorbed from thePd/PdODx target in order to provide experimentally measured DD-yield in vacuum underelectron beam irradiation. This result strongly supports the theoretical prediction [1,2] withregards to electron excitation of hydrogen subsystem in Pd deuteride. Indeed, the deduced fromd(d,p)t reaction rate 3-4 eV deuteron flux serve as a proof of the strong electric field (F ~ 108
V/cm) generation within a distance comparable with the lattice parameter (a0 = 0.39 nm) causedby plasmon formation at the Pd/PdO:Dx surface during e-beam interaction with the D-subsytemof the deuteride.
In contrast to Pd/PdODx data, the results obtained for TiDx target under similar electronirradiation cannot be easy explained by eV deuteron kinetic energies, taking into account onlythe low energy extrapolation of the linear combination of the DD-reaction cross section and theenhancement factor. The problem is that due to very low D- diffusivity in Ti, the screeningpotential at the surface of TiDx would be also quite low. Indeed, using eq.(3) with Jd = 0.015mA/cm2 and y0 ~ 2.0 (assuming that at the surface D-concentration is x = D/Ti ~ 0.5 during e-bombardment) one can obtain Ue ~ 70 eV (close to Kasagi’s value [4]). At this small screeningpotential, in order to produce DD-reaction rate of the order of ~ 0.01 p/s-cm2 , the kinetic energyof deuteron flux (in laboratory system) has to be rather higher, exceeding the value Ed = 1 keV.
The situation could be improved, assuming that main fraction of desorbed deuterium in TiDx
under e-beam irradiation would escape directly from the surface layer (of 1-2 lattice parameterthick), but not from the total 2-4 µm thick area of D-localization. (This, actually, means that theenergy transferred by electron beam would be effectively redistributed to the deuterons locatedover the top of the TiDx target - sort of inverse population). If, in this case, at the same D-flux Jd
= 0.015 mA/cm2 the mean residual deuterium concentration at the surface would be x = D/Ti <0.1 then at Ed ~ 5-10 eV and the screening potential Ue 600 the deuteron yield, according to eq.(1), become similar to that in Pd/PdO:Dx derived above. It is also possible to speculate that thin
28
TiO2 strong dielectric layer (in contrast to semi-metallic PdO) always existing on top of the TiDxtarget can be negatively charged under the electron bombardment. This macroscopic electricfield would accelerate D+ ions passing through the surface, thus increasing their kinetic energyfrom several to hundreds eV. Such a process could certainly increase the yield of DD-reaction inTiDx target. In order to make clear mechanism of high DD-reaction yield in the TiDx targetunder electron bombardment, further experimental and theoretical studies are required.
5. Conclusions- Taking into consideration total obtained experimental data, including vacuum experiments
with and without e-beam irradiation, we come to the conclusion that electron beam (J ~ 100-300 nA, E = 30 keV) stimulation of the Pd and Ti based deuteride targets (cathodes) surfacereally can nhance the intensity of the emissions of nuclear charged particles.
- Both the products of DD-reaction (3 MeV protons) and high energy alphas (11-20 MeV) areclear distinguished in e-beam stimulation experiment with the Pd/PdO:Dx and TiDx targets.
- An important point is that signatures of 3 MeV and energetic alphas are appearedsimultaneously at the surface of all (two or three) independent detectors used in the sameexperiment and covered by metallic foil filters with different stopping ranges/powers. Toincrease accuracy of measurements the rear detector side background results have beensubtracted from the Foreground data obtained at the CR-39 side facing the sample’s surface.
- Sequential etching of the detectors 1 and 2 during 7, 14, 21 and 28 hr show an appropriatetrack diameter shift (an increase), in accordance with the calibration curves obtained by CR-39 proton and alpha accelerator bombardment. This powerful technique allows us to identifyunambiguously the emission of 3 MeV protons from DD-reaction as well as indicate apresence of energetic alpha particles with energies in the range 11-20 MeV.
- Total statistics obtained in experiments with the Pd/PdO:Dx heterostructure under e-beamirradiation show 3MeV/DD proton emission intensity in 4 ster.: Np = (1.39 ± 0.18) × 10-2
p/s-cm2 of the Pd/PdO:Dx sample, with the significance level above the background L = 7.7. The intensity of energetic alphas is found to be: N = (0.71 ± 0.12) × 10-2 /s-cm2 ofPd/PdO:Dx sample (the significance level is L = 6.0 ). The yield of DD-reaction in thePd/PdO:Dx target under e-beam bombardment, taken only for movable deuterons (thedesorbed flux Jd = 3 × 10¹⁵ D/s-cm2) is found to be DD ~ 3.3x10⁻¹⁸ p/D.
- Total statistics obtained in experiments with the TiDx foils under e-beam irradiation show3MeV/DD proton emission intensity in 4 ster.: Np = (1.10 ± 0.23) × 10-2 p/s-cm2 of theTiDx sample. (the significance level above the background is L = 4.74 ) and alpha intensityN = (0.61 ± 0.15) × 10-2 /s-cm2 of the TiDx sample (the significance level is L = 4.3 ).
- The yield of DD-reaction in the TiDx target under e-beam bombardment, taken only formovable deuterons (the desorbed flux Jd = 1014 D/s-cm2) is found to be DD ~ 1.1x10⁻¹⁶ p/D.
- No signatures of nuclear emissions have been found in case of Pd/PdO:Dx and TiDx samplesexposed in vacuum at T=290K in absence of e-beam stimulation.
- The rear side of the Pd/PdO:Dx sample (opposite to e-beam irradiated side) show Np = (1.68± 0,37) × 10-3 p/s-cm2 of the Pd/PdO:Dx sample. (significance L = 4.5 ) and N = (1.46 ±0.27) × 10-3 /s-cm2 of the Pd/PdO:Dx sample. (significance L = 5.5 ). These values are 5-8 times less than charged particle emissions intensities from the e-beam bombarded side.
- The results presented here could be even more statistically significant; however, the batch ofCR-39 track detectors used in this study has been irradiated by weak fast neutron flux on theroute to Moscow from USA, most probably in an airport security facility. As a result the
29
background level in the track diameter range of interest (4-8 µm) was found to be 4-5 timesabove the usual 4-8 µm track diameter background, which normally shows N < 10 track/cm2.This important feature further convinces us that the CR-39 batches should be transportedpersonally on board aircraft and cannot be placed in a baggage facility.
- Data analysis has been performed for Pd/PdO:Dx target. Extrapolation of both DD-reactioncross section and the enhancement factor to very low deuteron energy (Ed ~ 3.0 eV) with areasonable screening potential Ue = 750 eV, allowed to describe satisfactorily the detectedDD-reaction yield in Pd/PdO:Dx target under e-beam excitation. This result stronglysupports the theoretical prediction [1,2] with regard to electron excitation of hydrogensubsystem in the Pd deuteride.
References1. Yu. Tyurin and I. Chernov, Int. J. Hydrogen Energy 27, 829 (2002).2. V. Silikin, I.Chernov et al, Phys.Rev.B, 76, 245105 (2007).3. H. Yuki, J. Kasagi , A. G. Lipson et al, JETP Lett, 68(11) , 785, (1998).4. J. Kasagi, H.Yuki, T. Baba, et al, J. Phys. Soc. Jpn., v. 71(12), 2881 (2002).5. A.G. Lipson, A.S. Roussetski, A.B. Karabut and G.H. Miley., JETP, 100, 1175 (2005).6. A.G. Lipson, A.S. Roussetski and E.I. Saunin, “Analysis of #2 W. Williams’s detector after
SPAWAR/Galileo type electrolysis experiment”, Proc. of 8-th Int. Workshop on Anomaliesin Hydrogen/Deuterium Loaded Metals, 13-18 Oct., 2007, Catania, Italy.
7. A.G. Lipson, A.S. Roussetski et al., “Observation of long-range alpha-particles duringdeuterium/hydrogen desorption from Au/Pd/PdO:D(H) heterostructure”, Bulletin of theLebedev Physical Institute (Russian Academy of Sciences)] #10, pp. 22-29 (2001).
8. A.G. Lipson, G.H. Miley, A.S. Roussetski, Trans. Amer. Nuclear. Soc.. 88, 638 (2003).9. A.G. Lipson et al, ICCF-12 proc., Yokohama, Japan (2005).10. A.G. Lipson et al, High Energy Chemistry, 42(4), 361 (2008).11. H.S. Bosch and G.M. Halle, Nuclear. Fusion 32, 611, (1992).12. F. Raiola, P. Migliardi, L. Gang, et al. Phys. Lett B 547, 193 (2002).13. F. Raiola, L. Gang, C. Bonomo et al, Europhys. J.A19, 283 (2004).14. F. Raiola, B. Burchard, Z. Fulop et al, J. Phys. G: Nucl. Part. Phys., 31, 1141 (2005).