Embed Size (px)
Citation preview

Charging Infrastructure Strategies:Maximizing the Deployment of Electric Drayage Trucks in Southern California
Libby Bradley • Naseem Golestani • Kazutaka Izumi • Kento Tanaka • Tsuyoshi Yamakawa

1
A. Client This report is prepared for Southern California Edison (SCE), one of the nation’s largest electric
utilities, providing power for 15 million residents. The company has a service territory of
approximately 50,000 square miles that covers many of the cities in central, coastal, and
Southern California.
In June 2018, SCE received approval from the California Public Utilities Commission (CPUC)
for a program to invest over $300 million on medium- and heavy-duty electric vehicle charging
infrastructure (CPUC, 2018). This investment program, known as “Charge Ready Transport,” is
designed to help broaden California’s electric transportation market over five years, from 2019 to
2024. The Charge Ready Transport program will dedicate 25% of its budget to vehicles
operating out of the Long Beach and Los Angeles ports and warehouses.
2
B. Acknowledgments This report would not be possible without the support and assistance of many individuals. We are
eternally grateful for the time each of them took to educate and guide our analysis.
Dr. Wesley Yin, APP Adviser (Primary)
Dr. John D. Villasenor, APP Advisor (Secondary)
Katie Sloan, Eric Seilo, Mauro Dresti, Southern California Edison
Dr. J.R. De Shazo, James Di Filippo, and Colleen Callahan, UCLA Luskin Center for Innovation
Renee Moilanen, Port of Long Beach
David Reich, Los Angeles Mayor’s Office of Economic Development
Michael Samulon, Los Angeles Mayor’s Sustainability, Budget, and Innovation Team
Weston LaBar, Harbor Trucking Association
Austin Benzinger, Thor Trucks
Melissa Infusino, Long Beach City College
Peer Reviewers: Nikki Lewis, Shota Kenmochi, Susan Baik, Lindsey Graef, Oceana Gilliam

3
C. Disclaimer This report was prepared in partial fulfillment of the requirements for the Master in Public Policy
degree in the Department of Public Policy at the University of California, Los Angeles. The
views expressed herein are those of the authors and not necessarily those of the Department, the
UCLA Luskin Center for Innovation, UCLA as a whole, the client, or the aforementioned
individuals.

4
D. Glossary of Terms
3PL 3rd Party Logistics company
AC Alternating Current
CAAP Clean Air Action Plan
CALeVIP California Electric Vehicle Infrastructure Project
CAM Criteria Alternative Matrix
CARB California Air Resources Board
CEC California Energy Commission
CNG Compressed Natural Gas
CO2 Carbon Dioxide
CPUC California Public Utilities Commission
DAC Disadvantaged Community
DC Direct Current
DPM Diesel Particulate Matter
DRPEP Distribution Resources Plan External Portal
Drayage Truck Heavy duty class 8 trucks carrying cargo for short-haul distances, to
and from ports to other nearby locations, including warehouses
DTNA Daimler Trucks North America
EMFAC CARB Emission Factor model
EPA U.S. Environmental Protection Agency
FC Fast-Charging
GHG Greenhouse Gas
HDEV Heavy-Duty Electric Vehicle
HTA Harbor Trucking Association
HVIP Hybrid and Zero-Emission Truck and Bus Voucher Incentive Project

5
IOO Independent Owner-Operator
LNG Liquefied Natural Gas
LADWP Los Angeles Department of Water and Power
NGV Natural Gas Vehicles
NOx Nitrogen Oxides
IOO Independent Owner Operator
OD Origin-Destination
OEM Original Equipment Manufacturer
PEV Plug-in Electric Vehicle
PM Particulate Matter
POLA Port of Los Angeles
POLB Port of Long Beach
SCAG Southern California Association of Governments
SCE Southern California Edison
SCAQMD South Coast Air Quality Management District
SO2 Sulfur Dioxide
TAZ Transportation Analysis Zone
VAP Vehicle Acquisition Plan
VMT Vehicle Miles Traveled
ZEV Zero-Emission Vehicle

6
E. Table of Contents A. Client 1
B. Acknowledgments 2
C. Disclaimer 3
D. Glossary of Terms 4
E. Table of Contents 6
1. Executive Summary 9
2. Introduction 10
2.1. Policy Goal 10
3. Background 11
3.1. Emissions at the Ports 11
3.2. Public Health and Disadvantaged Communities 12
3.3. Policy Support and Potential Emissions Reductions 14
3.3.1. Clean Air Action Plan 14
3.3.2. Statewide Initiatives 15
3.4. Transition to Electric Trucks 15
3.4.1. Heavy-Duty Electric Trucks 16
3.4.2. Heavy-Duty Electric Truck Market 16
3.4.3. Heavy-Duty Electric Chargers 16
3.4.4. Heavy-Duty Electric Charging Stations Market 17
4. Methodology 18
4.1. Literature Review 18
4.2. Interviews 19
4.2.1. Utility Company 19
4.2.2. Trucking Companies 19
4.2.3. Battery and Electric Drayage Truck Manufacturers 20
4.2.4. Ports 20
4.2.5. Local Government 20
4.2.6. Local Community 20
4.3. Data 20
5. Results 21

7
5.1. Key Challenges: Truck Adoption and Station Placement 21
5.2. Policy Goals 22
5.3. Key Findings 22
5.3.1. Natural Gas Vehicles at the San Pedro Bay Ports 22
5.3.2. SCAG, SCE, and Port of Long Beach Data 23
5.3.3. Drayage Industry Structure 24
5.3.4. Overnight and Opportunity Charging 27
5.3.5. Charging Station Business Models: Private, Public, Shared 28
5.3.6. Economies of Scale 28
5.3.7. Short- and Long-Term Strategy 29
5.4. Criteria 30
5.4.1. Emissions Reduction 30
5.4.2. Constraints 30
6. Policy Recommendations 32
6.1. Charging Station Placement Optimization Algorithm 32
6.1.1. Key Assumptions 32
6.1.1.1. Electric Drayage Truck Specifications 32
6.1.1.2. Drayage Truck Duty Cycle 33
6.1.1.3. Charger Type 33
6.1.1.4. Overnight and Opportunity Charging 34
6.1.1.5. Short- and Long-Term Charging Station Ownership and Locations 34
6.1.1.6. Installation Cost and Economies of Scale 35
6.1.2. Short-Term Placement Algorithm 36
Step 1. Set Target Area 36
Step 2. Identify Truck Yard Locations 36
Step 3. Estimate Number of Active Port Trucks and Take-Up Rate 37
Step 4. Distribute Charging Stations 38
Step 5. Apply Power Grid Constraint 38
Step 6. Apply DAC Coverage Constraint 38
Step 7. Apply Budget Constraint 38
Step 8. Compute Emission Reductions 39

8
6.1.3. Short-Term Algorithm Application 40
6.1.4. Long-Term Placement Algorithm 46
Step 1. Determine Number of Charging Stations Fleetwide 46
Step 2. Allocate Overnight Charging Stations to Small Trucking Companies 47
Step 3. Allocate Opportunity Charging Stations 47
Step 4. Measure VMT 47
Step 5. Rank TAZs 47
Step 6. Consider Constraints 48
Step 7. Compute Emission Reductions 48
6.1.5. Long-Term Application 48
6.1.6. Summary of Algorithm Results 54
6.2. Business & Outreach Strategy Options 55
6.2.1. Proactive Outreach and Education 55
6.2.2. Address Needs and Concerns of Disadvantaged Communities 55
6.2.3. Collaboration with Ports and Regulatory/Governmental Partners 56
6.2.4. Collaboration with Trucking Associations 56
6.3. Evaluation of Business & Outreach Strategies 57
6.3.1. Evaluative Criteria 57
6.3.2. Business & Outreach Strategy: Final Recommendation 58
7. Conclusions 60
8. Appendix 61
8.1. Appendix A: Short-Term Placement within 5 miles from the Ports 61
8.2. Appendix B: Short-term Placement within 10 miles from the Ports 62
8.3. Appendix C: Short-Term Placement within 10 miles of the Ports (Considering Grid
Capacity) 64
8.4. Appendix D: Short-term Emission Reduction 66
8.5. Appendix E: Long-term Placement 68
Appendix G: High VMT Ranking for Long-term Placement (SCE Territory) 73
Appendix F: Long-term Emission Reduction 75
9. References 76

9
1. Executive Summary The ports of Los Angeles and Long Beach are the largest container shipping ports in the nation
and support thousands of jobs in Southern California. Unfortunately, the emissions produced by
drayage trucks that transport cargo have significant impacts on regional air quality and
greenhouse gas emissions, with the greatest impact felt by surrounding communities. In response
to this issue, local community leaders have been pushing for a transition to zero-emission heavy-
duty trucks. In 2017, the Mayors of Los Angeles and Long Beach stated a goal of zero emissions
from drayage trucks entering the ports by 2035.
In June 2018, SCE received approval from the CPUC to invest over $300 million in electric-
vehicle charging infrastructure, with a portion of the budget allocated to heavy-duty trucks
operating out of the ports of Los Angeles and Long Beach. Our goal is to develop a strategy for
rolling out heavy-duty electric vehicle charging stations that best supports the conversion of
diesel port drayage trucks to electric.
In this analysis, we created an algorithm that can be used to identify optimal placement for
drayage truck electric charging stations in the short- and long-term. After establishing drayage
industry travel patterns and charger and electric truck capabilities, we identified where trucks
dwell overnight and assigning a likely electric truck adoption rate in the early phase of adoption.
We further assessed each location by conducting a circuit analysis to identify which locations
could support charging stations and whether they were located in disadvantaged communities
(DACs).
In the short-term, our findings indicate that optimal placement will be in truck yards nearest to
the ports, where a majority of them are aggregated. Using a constraint-optimization algorithm,
we estimated that 404 trucks can be electrified in the short run, which would result in an
estimated regional reduction of 46,206.75 metric tons of carbon dioxide (CO2), 43.20 metric
tons of nitrous oxides (NO2), and 0.21 metric tons of particulate matter (PM) annually.
For the long term (year 2035), we identified drayage trip destinations using Los Angeles County
origin/destination trip data to determine which zones in Southern California will have the highest
demand for day time opportunity chargers. Our findings indicate that optimal placement should
take place at both truck yards and warehouses, the primary destinations for cargo transported by
drayage trucks. Destinations are mainly concentrated in the 710 Corridor and areas surrounding
the I-10/I-15 interchange in San Bernardino County. We estimate that 4,941 trucks can be
electrified, which would decrease CO2 emissions by 565,117.66 metric tons, NOx by 528.39
metric tons, and PM by 2.55 metric tons per year. The majority of these stations would be placed
in communities that would experience the greatest health and well-being impacts of reduced
emissions.
Our recommended strategy also includes a program of outreach and education to truck drivers,
trucking companies, and local communities. This latter approach can help better ensure that the
charging station rollout addresses trucking company and community concerns, thereby
increasing the likelihood that the supply of charging stations will be met by sufficient demand
via the uptake of electric trucks.

10
2. Introduction The ports of Los Angeles and Long Beach, also known as the San Pedro Bay Ports, are the
largest container shipping ports in the nation (San Pedro Bay Ports, 2017). Approximately
13,000 heavy-duty diesel trucks, also known as drayage trucks, work out of these ports, moving
the majority of cargo that passes through them. Unfortunately, the emissions produced by
drayage trucks have significant impacts on regional air quality — especially within nearby
disadvantaged communities (DACs) — and on global climate change (EPA, n.d.).
The ports have made concerted efforts over the past decade to reduce emissions. However,
additional measures must be taken if they are to reach the ambitious emission-reduction goals set
by the state (CalEPA, 2018). Moreover, as globalization and international trading activity
increase, the challenge to reduce emissions at the ports will only increase. These goals are
achievable, but only if meaningful coordination takes place between the ports, government
agencies, the community, and the private sector.
One solution to address the negative impacts of drayage truck emissions is to convert these fleets
to electric-powered vehicles, or electric drayage trucks. These trucks would emit fewer
greenhouse gases (GHG) and air pollutants when compared to diesel-powered trucks. Electric
drayage trucks could offer the comparable cargo-carrying capacity to conventional drayage
vehicles, while utilizing the same transportation infrastructure.
However, a significant difference between electric drayage trucks and diesel-powered trucks is
fueling infrastructure. Unlike the convenient and established market of readily-available diesel
stations, the electric vehicle charging station market is still in the early stages of development.
Accordingly, the convenient availability of electric truck charging stations will be of paramount
importance if drayage trucks are to make the switch from diesel to electric.
2.1. Policy Goal
The focus of our report is motivated by two primary factors: one, the drayage industry’s outsized
contribution to harmful emissions in the region; and two, the burgeoning interest in, and support
for, electric vehicles as a solution to support a cleaner environment. The potential for electric
vehicles to reduce emissions at the ports is, however, contingent upon the private decision to
convert, which will largely be determined by investments and location of charging infrastructure.
As such, our policy analysis will seek to achieve the following: Develop a strategy for rolling
out heavy-duty electric vehicle charging stations that best supports the conversion to
electric drayage trucks that serve the San Pedro Bay Ports.
To achieve this goal, we develop an algorithm that optimizes the placement of electric truck
charging stations to best support the drayage industry and its travel patterns. In addition, we
provide complementary business and outreach strategies to address local community and drayage
industry concerns, thereby increasing the likelihood that the supply of charging stations will be
met by sufficient demand via the uptake of electric trucks.
11
3. Background This chapter provides a more in-depth analysis of the substantial negative impacts imposed by
port drayage activities. We explain the severity and negative societal impacts posed by pollution
at the ports, as well as state and local initiatives to combat these negative impacts. Finally, we
give an overview of the current drayage truck landscape and heavy-duty electric truck industry.
3.1. Emissions at the Ports
The San Pedro Bay Port complex is the single largest fixed source of air pollution in Southern
California (South Coast Air Quality Management District, 2013). Freight movement accounts for
about 42% of NOx emissions in this region, and drayage trucks that service the ports are the
single largest source within that category (South Coast Air Quality Management District, 2015).
Drayage trucks account for 0.1 percent of vehicles in the South Coast but 5 percent of NOx
emissions from the transportation sector, emitting approximately 4,000 tons of NOx per year in
the region (California Air Resources Board, 2017). Specific to the Ports’ inventory, heavy-duty
trucks are responsible for 23% of NOx emissions.
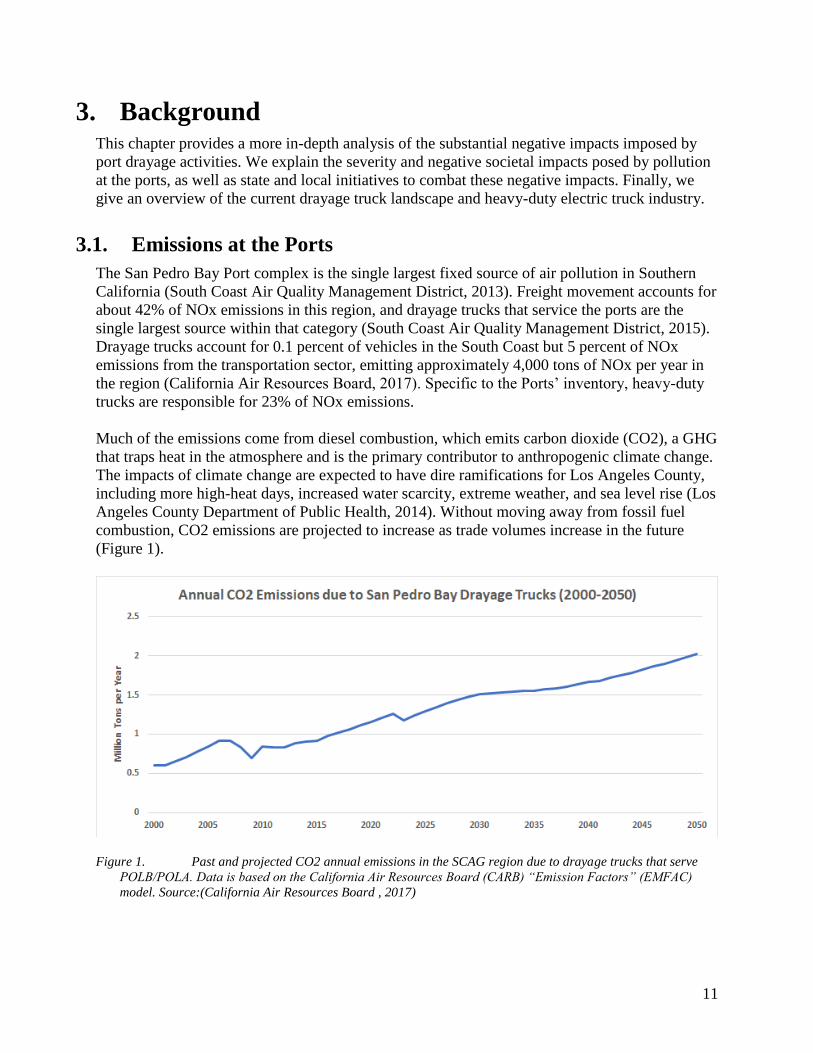
Much of the emissions come from diesel combustion, which emits carbon dioxide (CO2), a GHG
that traps heat in the atmosphere and is the primary contributor to anthropogenic climate change.
The impacts of climate change are expected to have dire ramifications for Los Angeles County,
including more high-heat days, increased water scarcity, extreme weather, and sea level rise (Los
Angeles County Department of Public Health, 2014). Without moving away from fossil fuel
combustion, CO2 emissions are projected to increase as trade volumes increase in the future
(Figure 1).
Figure 1. Past and projected CO2 annual emissions in the SCAG region due to drayage trucks that serve
POLB/POLA. Data is based on the California Air Resources Board (CARB) “Emission Factors” (EMFAC)
model. Source:(California Air Resources Board , 2017)

12
3.2. Public Health and Disadvantaged Communities
The compromised air quality due to freight operations at the ports, including drayage truck
activities, contributes tremendously to local health risks. According to the Environmental
Protection Agency (EPA) (EPA, n.d.), air pollution can negatively impact public health in the
following ways, both in the short term and long term:
● Aggravating respiratory and cardiovascular disease
● Reducing lung function
● Increasing the severity and frequency of respiratory symptoms and infections
● Impacting the nervous system, including the brain
● Increasing the risk of cancer
● Contributing to premature death
Due to all of these negative health externalities, residents near the ports face higher pollution-
related health risks than the rest of the Southern California population. Due to this pronounced
exposure to pollutants, these areas are classified as DACs under SB 535 (De Leon, Statutes,
2012). Health risk increases as one gets closer to the source of pollution, and as a result,
communities closest to the ports experience greater health impacts than those further away.
Figure 2 shows that the pollutants are most harmful within 1,500 feet of freeways. The
population closer to freeways tends to be poorer and more nonwhite than areas not in close
proximity to freeways (Figure 3). Figure 4 displays the high air toxic risk near the ports,
according to MATES IV (South Coast Air Quality Management District, 2012).
Figure 2. Motor Vehicle Pollutants and Their Known Health Impacts (Manville and Goldman, 2018,
Houston et al. (2004), and Brugge, Durant, and Rioux (2007))

13
Figure 3. Selected Characteristics of Populations within 750 and 1,250 Feet of Freeways (Manville and
Goldman, 2018 and American Community Survey 2008–2012)
Figure 4. Modeled Air Toxics Risk (South Coast Air Quality Management District, 2012)

14
The harmful health effects of port activities are borne out in the numbers. Approximately 15% of
children in Long Beach have asthma, compared to 9% of children in the United States (City of
Long Beach Department of Health and Human Services, 2013). Also, asthma-related
hospitalization rates are greater in West Long Beach near the ports and the 710 freeway than in
East Long Beach. In the communities adjacent to the ports, including Wilmington, San Pedro,
and the Harbor Gateway, asthma-related emergency department visit rates greatly exceed the city
average, with Los Angeles totaling 39 visits per 10,000 residents and port communities seeing 72
visits per 10,000 residents (LA Healthy, n.d.). The direct costs of hospitalization are significant;
the average cost of an asthma-related hospitalization was $33,749 in 2010, according to the
California Public Health Department (The California Department of Public Health, 2015).
These adverse social impacts make apparent that, when it comes to addressing emissions at the
ports, the cost of doing nothing is not nothing. The health and well-being impacts are paid by
local communities who will continue to suffer from higher health care costs, hospitalizations,
missed days of work and school, and potentially premature death in the direst scenarios. The
ports recognize this, so in 2017 they created a San Pedro Bay-wide health risk reduction goal to
reduce residential cancer risk from port-related diesel particulate matter (DPM) emissions by
85% by 2020 (The San Pedro Bay Ports, 2017).
3.3. Policy Support and Potential Emissions Reductions 3.3.1. Clean Air Action Plan
In its 2017 Clean Air Action Plan (CAAP), the San Pedro Bay Ports laid out emission targets to
address the negative environmental impacts of port activities. These goals include a reduction in
residential cancer risk of port-related diesel particulate matter (DPM) emissions by 85% by 2020,
and a decrease in GHGs from port-related sources to 40% below 1990 levels by 2030 (San Pedro
Bay Ports, 2017).
One of the central goals outlined in the CAAP is an all zero emission drayage fleet at the ports
by 2035. The ports will charge a fee on all drayage trucks that do not convert to near- zero
emissions or zero-emissions trucks by 2020 (San Pedro Bay Ports, 2017). The ports have not
established the fee, but depending on the amount, it may make financial sense for a trucking
company to pay the fee rather than replace the truck with a cleaner option. This possibility means
it will be crucial to identify additional ways to encourage the take-up of electric trucks.
Replacing diesel-powered drayage trucks with electric-powered trucks will help significantly
with the ports’ emission reduction goals. This is because electric trucks would cause far fewer
adverse environmental impacts compared to their diesel counterparts. These vehicles would have
zero exhaust pipe emissions of criteria and GHG air pollutants during all phases of port-related
drayage operations (EPA, n.d.).
The forecasted reductions of truck-related pollutants as a result of the CAAP strategy could be
immense. Figure 5 below shows the percentage reductions of these pollutants, based on
anticipated emissions in the selected years compared to the emissions that would have occurred
in those years without this strategy.

15
Figure 5. Forecasted Reductions of Truck-Related Pollutants from the 2017 CAAP Strategy Proposal
*Range depends on the 2023 rate, zero emissions truck penetration, and emissions standards (i.e.,
the Ports forecasted .02 grams NOx and .05 grams NOx).
3.3.2. Statewide Initiatives
Fortunately, the ports’ emission reduction efforts do not stand alone. They are complemented by,
and in large part inspired by, similar efforts at the state level. In January 2018, Governor Brown
issued an executive order calling for five million zero-emission vehicles (ZEVs) by 2030 and the
installation of 250,000 electric vehicle chargers and 200 hydrogen refueling stations by 2025
(Office of Governor, 2018).
Over the past decade, California has implemented various clean truck and infrastructure
incentive programs. Most recently, the state’s Hybrid and Zero-Emission Truck and Bus
Voucher Incentive Project (HVIP) is slated to receive $68 million for the 2019 fiscal year, up
$41 million from 2018 (California HVIP, 2019). The funds include incentives for the purchase of
medium-and heavy-duty all-electric trucks. HVIP is a part of California Climate Investments, a
statewide program using cap-and-trade dollars to reduce GHG emissions (California HVIP,
2019). The program also aims to improve public health and the environment in DACs.
Additionally, in late 2017, the state’s Energy Commission and Center for Sustainable Energy
launched the California Electric Vehicle Infrastructure Project (CALeVIP), which provides a
streamlined incentive process for installing electric vehicle charging infrastructure (Center for
Sustainable Energy, n.d.). The state’s Carl Moyer Program also offers funding to help vehicle
fleet owners replace, repower, or convert their trucks with newer, lower-emission equipment
(California Air Resources Board, 2018). As part of this program, applicants can request funding
to install, convert, or expand battery-charging fueling stations.
3.4. Transition to Electric Trucks
Port drayage trucks are those used in short-haul distances to and from ports to other nearby
locations, including warehouses and rail ramps. As of late 2018, there were approximately
17,500 registered heavy-duty trucks in the San Pedro Bay Ports’ drayage fleet (Tetra Tech,
2018). However, only 11,000 to 13,000 trucks actively perform drayage on any given day, due to
seasonal demand changes and other factors. These trucks drive approximately 238 miles per day
(Tetra Tech, 2018).

16
3.4.1. Heavy-Duty Electric Trucks
Heavy-duty electric trucks are defined as those whose gross weight exceeds 33,000 pounds and
have 3 or more axles (EPA, 2019). Heavy-duty electric trucks are characterized by their power
source, an onboard battery pack. Battery pack recharging is accomplished by plugging into the
electric power grid or other off-grid electric power sources to recharge the battery pack while the
truck is not operating.
The earliest iterations of these vehicles have ranges from 120 to 200 miles on a single full charge
and weigh around 15,000 pounds (Clevenger, 2018). All of the major original equipment
manufacturers (OEMs) are investing in electric vehicle technology to compete in this emerging
segment of the truck market. These OEMs include Daimler Trucks North America (DTNA),
Volvo, Peterbilt Motor Co., and Navistar, Inc. However, as of early 2019, only BYD, a Chinese
vehicle manufacturer, offers a commercially available heavy-duty electric truck model, with a
range of 125 to 220 miles per full battery charge (Tetra Tech, 2018).
3.4.2. Heavy-Duty Electric Truck Market
Experts agree that the deployment of HDEVs of any sizable capacity is still years away. In the
near term, electric trucks will be limited to specific applications that are well-suited to their
technology. These applications include short-haul trips, such as urban pick-up and delivery,
refuse trucks, and the topic of our policy project — port drayage.
OEMs are beginning to partner with companies in the freight and delivery business on pilot
projects to test these earliest iterations of medium- and heavy-duty electric trucks (Adler, 2019).
In 2017, BYD deployed 23 of these trucks to two Southern-California based customers —
Daylight Transport, located in Lancaster, and BNSF Railway, which has yards in the counties of
San Bernardino and Los Angeles (Field, 2017).
3.4.3. Heavy-Duty Electric Chargers
Electric charging stations for heavy-duty trucks are a rapidly-evolving landscape. In general,
these stations can utilize one of three types of chargers, which are defined by their rate of charge
in kilowatts (kW). The higher the kW, the faster the charger can recharge a battery.
The first type of charger is Fast-Charging (FC). While this type has the quickest time to charge,
it has significant drawbacks, including expense (both the hardware and the utility costs) and
battery deterioration. Most industry experts do not recommend using fast charging if their routes
allow. Alternating current (AC) is another type of charger and is available for charging rates of
20 kW or less and requires both an on- and off-board charger (EV Safe Charge Inc., n.d.).
Current AC charger models take about 20 hours to fully charge a heavy-duty vehicle and cost on
average $2,000. Finally, a direct current (DC) charger is used for speeds of 20 kW or more and
does not require an onboard charging component (EV Safe Charge Inc., n.d.). Current models of
DC chargers range widely in charge rate and cost. The less expensive models cost around
17
$25,000 and take 14 hours to charge a heavy-duty truck. The most expensive model costs over
$100,000 but can complete a full charge in 1 hour.1
3.4.4. Heavy-Duty Electric Charging Stations Market
Because electric trucks are still in their project test phases, there is not yet a substantial market
for charging stations. However, some trucking fleets are preparing for the eventual mass
production of heavy-duty electric trucks by evaluating existing power capabilities and charging
station needs at their terminal locations. Both UPS Inc. and rental truck company Ryder System
Inc. are working with electric car maker Tesla to develop charging infrastructure to support the
Tesla trucks that these companies’ fleets have preordered (Long, 2018).
1 Another key component of the charging station is the connector. The main charging station connector used by
most OEMs is the J1772, however, some manufacturers require custom or proprietary connectors.

18
4. Methodology The overarching goals of our methodology were to identify the key factors and challenges to
both rolling out electric vehicle charging stations for the ports, as well as encouraging the take-
up of electric trucks. To do this, we carried out a set of systematic steps, including a literature
review and interviews with key stakeholders. We also conducted robust research and data-
gathering efforts to glean all relevant information on current technology for electric batteries,
trucks, and infrastructure; capabilities within the local power grid; locations of truck yards; and,
utilization of transportation analysis zones (TAZ) to determine the placement of charging
stations.
A Methodology Roadmap
In later sections we provide an in-depth description of our research results. These findings relate
to the drayage industry structure; the appropriate time of day to charge trucks; the benefits of
privately- versus publicly-owned and operated charging stations; the presence of economies of
scale for charging infrastructure; and, the need for a short- and long-term charging station
deployment strategy. This information is used to inform our station placement criteria, which
accounts for emissions reduction benefits, proximity to disadvantaged communities and SCE’s
budget.
We then present the culmination of our work from the above steps in the form of a charging
station placement optimization algorithm. This algorithm utilizes a several key assumptions
derived from the research described above: the types and ownership structure of trucks and
chargers to be utilized, time of day for charging, as well as associated costs to identify the
optimal placement of charging stations. These assumptions are integrated into a series of steps
that optimize the cost and number of trucks that can be electrified within our defined target area.
We also factor in electricity capacity by performing a circuit analysis of target areas.
Upon locating the optimal placement of charging stations, our final step considered business
strategies: how to encourage trucking companies to convert to electric trucks, a necessary
precursor to creating strong demand for electric charging stations. We relied primarily on our
accrued knowledge of the drayage industry’s and local community’s concerns and needs to
develop these recommendations. Our final recommendations are based on a uniform set of
relevant criteria, which include effectiveness, financial feasibility, and administrative feasibility.
4.1. Literature Review
No port authority in the world has carried out a large-scale transition from diesel or gas-powered
vehicles to heavy-duty electric vehicles within its port’s fleet. While this provides an opportunity
for the San Pedro Bay Ports to be at the forefront of environmental policy, it also means that
there are no test cases from which to learn best practices.
Absent any real-world cases of expansive drayage fleet electrification, we reviewed the San
Pedro Bay Ports’ transition to natural gas vehicles (NGV). Natural gas vehicles produce 20 to
30% fewer greenhouse gas emissions than gasoline- or diesel-powered vehicles and the fuel

19
comes in the form of liquefied natural gas (LNG), or compressed natural gas (CNG) (Southern
California Gas Company, n.d.). CNGs are not a perfectly comparable test case to use, given that
electric vehicles are both more costly than CNGs and require an entirely new type of “fueling”
infrastructure – an electric charging station. However, this case provides valuable information on
the challenges faced by trucking companies in their transition to newer, cleaner vehicles.
4.2. Interviews
Transportation electrification of Southern California’s drayage sector involves many parties. The
success of heavy-duty drayage electrification depends on factors such as the state of technology
and its cost, infrastructure that supports travel patterns, local policies that support electrification,
and the structure of the drayage industry itself. Our goal is to gain a broad representation of
diverse knowledge bases and perspectives on this issue. To do this, we identified key
stakeholders that will play a role in pushing electrification forward or are impacted by its
consequences. They were identified as follows:
● Utility companies
● Trucking companies
● Technology manufacturers (trucks and batteries)
● Ports of Los Angeles and Long Beach
● Real estate agents, property owners
● Local government
● Local community
A combination of literature review and interviews were conducted to identify the role of each
stakeholder in the heavy-duty electrification process, as well as their perspectives on what factors
and challenges must be considered for electrification and optimal charging infrastructure
placement.
4.2.1. Utility Company
First and foremost, we spoke to SCE to get a clear understanding of their Charge Ready
Transport program. Through a series of conversations and a presentation, we identified SCE’s
objectives and what their goals are for the program. This helped us define what goal our charging
infrastructure placement should achieve, as well as policy criteria to consider. Further
discussions with SCE provided answers to technical questions regarding their electric grid, as
well as relevant factors related to their administrative and policy framework.
4.2.2. Trucking Companies
When a mandate is set for emission reductions and industry fleet changes, it is crucial to have a
clear understanding of how the industry functions, its daily travel patterns, and its business
model. Policies must be tailored to fit the industry in question in order to be most effective. We
spoke with trucking companies as well as the Harbor Trucking Association (HTA), a local
trucking trade group, to understand drayage duty cycles and travel patterns.
20
4.2.3. Battery and Electric Drayage Truck Manufacturers
What makes heavy-duty electrification particularly challenging is that electric trucks are an
emerging technology still in the project phase. We spoke to a truck manufacturing company,
battery manufacturer, and charger development company to understand the current state of
technology and future vehicle range projections. Specific organizations we spoke to include
Thor, a heavy-duty vehicle battery manufacturer, and EVgo, a charging infrastructure company.
We also relied on SCE’s discussions with truck manufacturing companies.
4.2.4. Ports
As the center of the drayage industry in the Southern California Association of Governments’
(SCAG) region, it was crucial to understanding the ports’ perspective on heavy-duty
electrification and charger placement. Discussions with Renee Moilanen, Air Quality Practices
Manager at the Port of Long Beach, clarified drayage travel patterns, the frequency of visits to
the ports, and pilot projects that the ports are participating in. According to Moilanen, the Port of
Long Beach is not considering drayage charger placement within the port property, which
narrowed the spatial boundaries of our analysis (personal communication, November 5, 2018).
4.2.5. Local Government
Given the joint directive by the mayors of Los Angeles and Long Beach to reach a zero-
emissions drayage fleet by 2035, we wanted to meet with city representatives who could provide
us their understanding of how the ports would achieve this goal. We met with both the Los
Angeles Mayor’s port representative and the lead for the city’s electrification and sustainability
programs. As one of our earlier meetings, this discussion created our foundational understanding
of the port’s drayage industry – the total number of trucks, the largest trucking companies, truck
duty cycles, cargo capacity, routes, and destinations.
4.2.6. Local Community
The main goal of both SCE’s transportation electrification program and the Mayors’ 2035 goal is
to reduce criteria pollutant emissions, particularly in communities that are most impacted by air
pollution and climate change. To that end, interviews were conducted with Environmental
Justice advocacy groups who are at the forefront of air quality improvements for local
communities. These interviews also revealed potential consequences (positive and negative) of
our analysis and charging infrastructure placement.
4.3. Data
Understanding travels pattern was a key element of determining optimal charging infrastructure
placement. Electric truck deployment is maximized by placing chargers in a way that supports
the drayage industry’s current travel patterns. Modeled truck travel pattern data, SCE territory
boundary data, SCE circuit map and DAC boundary data were obtained to constrain our analysis
and understand the drayage sector spatially. Given that trucking operators and companies must
be registered in order to enter the port property, the Port of Long Beach was able to provide this
information.

21
5. Results After carrying out the steps outlined above, we considered the overarching challenges involved
in identifying the optimal placement of charging stations. We then used these specific
challenges, as well as our general findings, to identify the criteria by which we would measure
the success of a given policy outcome. This process informed our ultimate decision to frame the
problem of charging station placement as one of constraint-optimization.
5.1. Key Challenges: Truck Adoption and Station Placement
Electric drayage truck adoption rates play a significant role in charger demand and placement.
As a new technology that will impact industry operations and fueling patterns, operators have
concerns that make them reluctant to switch to electric trucks despite the Mayors’ 2035 zero-
emission goal. This analysis addresses some of these concerns. Interviews with several trucking
companies revealed that operators are concerned about the following issues (V. LaRosa, personal
communication, June 18, 2018, and K. Pruitt, personal communication, January 31, 2019):
● Range and charging ability: Since drayage industry revenue depends on transporting
cargo to customer locations throughout Southern California and beyond, having enough
range to carry out current routes is particularly important to operators (Husing, Brightbill,
& Crosby, 2007). Trucks will want to charge in convenient locations during dwell times.
● Truck and infrastructure cost: electric truck capital costs are higher than their diesel
counterpart (Chandler, Espino, O’Dea, 2017). Companies are wary of the extra cost early
technology adopters face and are concerned with having stranded assets if electric trucks
do not perform correctly.
● Vehicle weight: according to the California Department of Transportation, heavy-duty
trucks have a weight limit of 80,000 pounds on California roads (Caltrans, n.d.). This
presents a trade-off: utilize a heavier battery that increases range and power but decreases
cargo weight; or, use a lighter battery which allows for more onboard freight.
In addition to the challenges faced by trucking companies, we identified the following as the core
hurdles in rolling out a viable and sustainable charging station program:
● Siting constraints: most diesel fleets enjoy existing onsite access to fueling infrastructure
or can conveniently fuel off-site at public or private stations. However, no model or best
practice for the siting of heavy-duty charging stations exists today. Establishing this new
infrastructure will require tremendous land and power grid capacity, the consent of host
property owners, and consideration of relevant zoning regulations.
● Cost-effectiveness: electric vehicle infrastructure would need to be installed with an
extensive redesign, reconfiguration, and operational disruptions, whether publicly- or
privately-located. Economies of scale will need to be considered when determining the
optimal number of chargers per selected site.

22
● Short-term vs. long-term: two types of placement strategies – one for the short-term and
one for the long-term – must also be addressed. This is due to a compilation of factors,
including the type of applicants SCE is considering for its five-year program, the trucking
companies most likely to adopt electric trucks within the first five years, and assumptions
about the rate of technological change in electric trucks and chargers from now until
2035.
5.2. Policy Goals
Given the general challenges we identified above, we identified two goals that will serve to guide
our policy recommendations. The first goal addresses the supply side issue of SCE’s program:
how to establish optimal charging station placement. The second goal, although related, focuses
on the demand side by considering how to encourage truck drivers to adopt electric trucks.
● Goal 1: Develop a framework for optimal placement of charging stations to encourage
electric truck conversion, and
● Goal 2: Create complementary strategies for the rollout of charging stations to enhance
electric truck take-up
5.3. Key Findings 5.3.1. Natural Gas Vehicles at the San Pedro Bay Ports
At the end of 2008, the San Pedro Bay Ports launched the Clean Trucks Program. This program
banned pre-2007 trucks to encourage the utilization of cleaner, less polluting vehicles. As an
incentive to comply with the new standard, truck drivers received a subsidy from the ports to
purchase new trucks.
Unfortunately, those who purchased LNG or CNG vehicles faced challenges both in the short
term and long term. One key challenge was the unreliable technology of the trucks. Drivers
would report new vehicles not starting, sensor malfunctions, and breakdowns within weeks of
purchase (Clark, 2012). Trucks also lacked enough power to haul cargo up even the slightest
grades (Clark, 2012). The ports neglected to do thorough field testing of the low emissions
vehicles in real-world, drayage activities. Instead, they relied on information from regulatory
agencies and manufacturers, which did not know whether the technology was capable of
withstanding the rigors of hundreds of miles of heavy cargo travel per day.
The other problem was financial. Despite funding assistance from the ports, individual truck
drivers faced substantial financial burdens to pay for the new trucks, oftentimes taking out
expensive loans. At the time of the plan’s implementation, the average cost of a natural gas truck
was $200,000, approximately twice the cost of the newer diesel trucks (Nero, 2018). And, under
the terms of the port’s subsidy, drivers had to keep their trucks for five years, providing yet
another administrative and financial burden on drivers.

23
Due to these challenges, the use of natural gas trucks fell dramatically at the ports, as shown in
figure 6. By 2017, LNG trucks were moving 70 % less cargo at the ports than 2012 and made up
only 5 % of the drayage fleet (Guerin, 2017).
Figure 6. Percentage of Los Angeles port cargo moved by LNG trucks, 2009-2016
These difficulties have left drayage truck drivers reluctant to try any new vehicle technology
being proposed by port officials. To convince truck drivers to adopt electric vehicle technology,
it will be of paramount importance to avoid the mistakes made with natural gas vehicles.
5.3.2. SCAG, SCE, and Port of Long Beach Data
In order to designate the optimal placement for charging infrastructure, origin and destination
data were obtained from SCAG Travel Demand Model (SCAG, 2012) that describe heavy-duty
truck travel patterns in the SCAG region. Information was used from the model’s 2020 travel
pattern projections. The Origin-Destination (OD) matrix contains information on the number of
trips taken between each TAZ, which was developed based on Tiger Census Block and released
by SCAG. Specific area of each TAZ can be found on SCAG GIS & DATA services. Using
spatial information including distances from OpenStreetMap data (Geofabrik, 2018), we were
able to calculate the vehicle miles traveled (VMT) per day by drayage trucks as well as identify
areas within the SCAG region that have the highest VMT. Areas with the highest VMT have the
heaviest truck traffic and therefore highest demand for chargers. In order to confirm that the
number of trips is related with the location of warehouses, which are the potential destination of
trucks, we also use data from SCAG (2014) that shows the total building area of rentable
warehouses in each TAZ.
Since this is an industry with a defined number of vehicles that carry out drayage operations, we
needed information on trucking companies serving the ports and the size of each company.

24
Outside of the ports, there is no list or inventory of companies with drayage operations in the
region. The Port of Long Beach Drayage Truck Registry (POLB, personal communication, 2018)
provides a list of trucking companies that are registered and allowed to enter the port property.
The list includes their address which is used to locate their truck yards. They also provided data
on the number of trucks allowed to enter the ports per company as well as the number of trips or
moves made to the ports per year for each company. This information was used to calculate the
number of trucks that actively served the San Pedro Bay Ports and gave an estimate of the
number of trucks charging infrastructure will need to support.
Southern California Edison territory and DAC region spatial data was also obtained from SCE
(2019) and the California Environmental Protection Agency (2018) respectively. These data
were used to establish the spatial boundaries of our analysis. Finally, grid capacity data was
obtained from Southern California Edison’s Distribution Resources Plan External Portal
(DEREP) (2019) to indicate where sufficient power supply was located.
5.3.3. Drayage Industry Structure
5.3.3.1. Drayage Industry Business Models
According to Melissa Infusino (M. Infusino, personal communication, October 12, 2018),
drayage industry labor expert, the current drayage industry business model is mixed and
controversial, with several ongoing lawsuits. In the first model, companies own trucks and
drivers are paid hourly and have workers compensation. The second is Independent Owner
Operators (IOO), where individuals own or lease their trucks from a company and work as
contractors for trucking companies. Within this model, drivers also tend to “buddy up” - two
drivers tradeoff the use of one truck for each shift. The final model is mixed, where companies
have employees as well as contracted operators. IOO and operators make money by the load,
while company drivers are paid by the hour. However, company revenue depends on delivering
cargo to customers (Husing, Brightbill & Crosby, 2007 and M. Infusino, personal
communication, October 12, 2018).
5.3.3.2. Daily Duty Cycles and Travel Patterns
The typical daily travel pattern of a drayage truck is as follows. In the early morning, trucks
leave company truck yards or individual rented parking and head to either the ports or other
distribution warehouses to pick up cargo. Throughout the day, drayage trucks pick up cargo at
the ports and drop off at customer warehouses, other 3rd Party Logistics companies (3PL), and
intermodal rail yards. According to Kurt Pruitt (personal communication, January 31, 2019),
Vice President of Strategy & Business Development for Pacifica Trucks LLC, customers most
often own the warehouses, not trucking companies. Also, operators often travel to and from the
ports for their first and second shift and then do distribution work when the ports are closed (M.
Infusino, personal communication, October 12, 2018). After finishing a shift, trucks from larger
fleets go back to their company truck yards while small fleet and independent owner-operators
(IOOs) park their vehicles in lots or other locations.

25
Figure 7. Drayage Truck Duty Cycle
Although drayage operations usually refer to short-haul trips, there are several types of
operations based on trip distance as shown in Figure 8 (TIAX, 2011 and W. LaBar, personal
communication, October 22, 2018).
Figure 8. Drayage operation, * TIAX, 2011, ** Weston LaBar
According to the Tetra Tech Feasibility Assessment for Drayage Trucks, (Tetra Tech, 2018), the
average drayage truck drives approximately 238 miles per day (Figure 9). However, the true
average is likely to be less because infrequent long trips can skew the distribution, as less than
5% of one-way trips are greater than 200 miles (Figure 10). Given the industry duty cycle and
down times described above, operators require the range to cover industry travel patterns and for
charging infrastructure to be placed in a way that does not require operators to stray too far from
routes or require long charging times outside of break times.

26
Figure 9. Operational Assumptions for Average Drayage Trucks at San Pedro Bay Ports (Tetra Tech, 2018)
Figure 10. One Way Trip Mileage of Drayage Trucks (CGR Management Consultants LLC, 2007)
5.3.3.3. Where trucks dwell at night
An important question to answer in this analysis was where trucks dwell at night. According to
M. Infusino (personal communication, October 12, 2018), company employees can park their
trucks overnight on company yards while IOOs park in rented spaces or on surface streets such
as in front of their homes. According to Pruitt (personal communication, January 31, 2019), for
all three ownership models discussed above, company yards and IOOs parking is typically
located closer to the ports in the 710 Freeway Corridor. Trucks typically do not dwell at
distribution warehouses and depots.
27
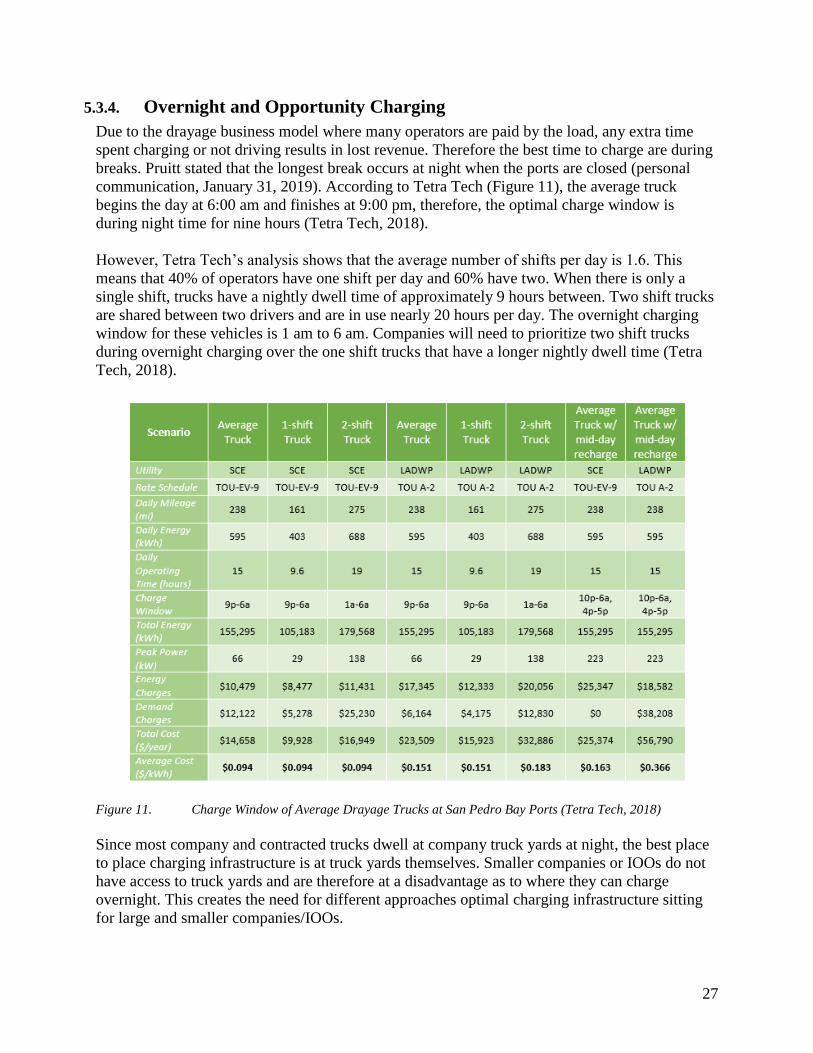
5.3.4. Overnight and Opportunity Charging
Due to the drayage business model where many operators are paid by the load, any extra time
spent charging or not driving results in lost revenue. Therefore the best time to charge are during
breaks. Pruitt stated that the longest break occurs at night when the ports are closed (personal
communication, January 31, 2019). According to Tetra Tech (Figure 11), the average truck
begins the day at 6:00 am and finishes at 9:00 pm, therefore, the optimal charge window is
during night time for nine hours (Tetra Tech, 2018).
However, Tetra Tech’s analysis shows that the average number of shifts per day is 1.6. This
means that 40% of operators have one shift per day and 60% have two. When there is only a
single shift, trucks have a nightly dwell time of approximately 9 hours between. Two shift trucks
are shared between two drivers and are in use nearly 20 hours per day. The overnight charging
window for these vehicles is 1 am to 6 am. Companies will need to prioritize two shift trucks
during overnight charging over the one shift trucks that have a longer nightly dwell time (Tetra
Tech, 2018).
Figure 11. Charge Window of Average Drayage Trucks at San Pedro Bay Ports (Tetra Tech, 2018)
Since most company and contracted trucks dwell at company truck yards at night, the best place
to place charging infrastructure is at truck yards themselves. Smaller companies or IOOs do not
have access to truck yards and are therefore at a disadvantage as to where they can charge
overnight. This creates the need for different approaches optimal charging infrastructure sitting
for large and smaller companies/IOOs.

28
Overnight charging would provide most of an electric truck’s charging needs. If daily mileage is
higher than the electric truck range, trucks will need to do opportunity charging during the day.
Opportunity charging should take place in a location that minimizes deviation from a drayage
truck’s daily route. In the early stages of electric drayage truck adoption where there are fewer
electric trucks in the fleet, there will not be many charging stations placed at warehouses
operators will travel to. Since operators will not want to limit their routes before there are more
charging stations available, charging infrastructure can be placed close to the ports where trucks
will travel to and from on a regular basis in the near term. Opportunity charging can occur in
larger company facilities that are closer to the ports (where overnight charging also takes place).
IOOs and small companies can also use charging stations closer to the ports in the near term,
however they will still have to contend with a lack of private property to use.
Given the drayage fleet’s complex, and at times unpredictable, travel times due to traffic and
other factors, there is a chance that chargers might not be available when electric trucks arrive to
charge. It is a potential issue for opportunity charging at both company facilities and for other
charging models. This issue is an opportunity for new technology that will optimize and schedule
truck arrival to charging stations in a way that minimizes charger wait time.
5.3.5. Charging Station Business Models: Private, Public, Shared
According to Weston LaBar (personal communication, December 19, 2018), CEO of the Harbor
Trucking Association, there are three different charger placement models to consider:
● Private model: chargers are placed in company-owned facilities. Companies favor this
approach in order to avoid waiting in line and competing against other operators for
access to chargers (Vic LaRosa, personal communication, June 18, 2018). This is model
is also preferred by SCE because property owners will not have to become involved in
the process.
● Companies lease locations: This has the benefit of companies not having to compete for
access, however, it might not be clear who is in charge of charging station costs —
property owners or trucking companies. It will also be more difficult for a Vehicle
Acquisition Plan (VAP) to be completed as vehicle ownership must be established.
● Public charging infrastructure/charging lot model: This model would give small scale
operators access to overnight and opportunity charging. However, challenges include
funding source and what charger type would be used since universal technology is
currently an issue for heavy-duty chargers.
5.3.6. Economies of Scale
When considering the number of charging stations to place at a given site, we will need to
confront the inherent tradeoffs that economies of scale can present. It might be most cost-
effective to place many charging stations at one site if economies of scale exist. However, this
might limit the program’s ability to include all interested trucking company applicants, due to the
limited number of charging stations that can be placed at different sites within a constrained
budget.

29
For charging stations, economies of scale exist because the capital expenditures necessary to
build charging infrastructure - permits, grid connection, equipment, construction, installation and
project management - are very expensive, costing tens of thousands of dollars (Lee and Clark,
2018). The more cost-effective option is to build many stations at one site with one high capital
expenditure. The alternative is to build few stations at separate sites which all require separate
capital expenditures that, when aggregated, greatly exceed the cost of the first option.
Furthermore, operational expenditures on technical maintenance and cleaning are only slightly
higher for sites with more stations. Energy capacity thus rises faster than costs do. Therefore the
cost per kWh can decrease.
5.3.7. Short- and Long-Term Strategy
We found there are crucial aspects of the drayage industry and electrification that vary over time.
Therefore, we have taken a short and long term approach to this analysis to take temporal
changes into account. These factors include:
● Electric truck fleet size: The number of electric drayage trucks varies as there is higher
adoption of this new technology over time. As operator concerns are addressed, adoption
rates will increase. Electric drayage trucks costs will decrease and capabilities such as
range will increase over time. According to Thor (A. Benzinger, personal
communication, December 19, 2018), electric drayage trucks range growth is estimated
to be 5% per year barring breakthroughs and advancements in battery chemistry.
● Grid capacity: According to SCE, expanding beyond current grid capacity is very
expensive and has a lengthy permitting process that must be approved by the CPUC
(SCE, personal communication, February 19, 2019). Therefore, going beyond the current
grid capacity in the short term is not feasible and is a constraint on infrastructure
placement. SCE can plan to expand grid capacity for long term energy needs.
Overall, in the short-term (the first five years), electric truck early adopters are expected to be
mainly large trucking companies since they have more capability to invest in the new
technologies and to apply with SCE’s stringent guidelines. For example, trucking companies
need to be able to complete the VAP requirements which require information on vehicle
ownership and the projected company electric truck ownership in the next ten years. Larger
companies are also motivated by advertising themselves as sustainable companies according to
Vic La Rosa of TTSI (personal communication, June 18, 2018).
In the long term, the majority of truck companies, including small-sized firms, will convert to
electric to meet the ports’ 2035 zero-emissions goal. At this time, trucks still conduct overnight
charging at truck yards, however, daytime charging can take place at warehouses for the
following reasons: the mutual convenience of location; available land capacity; and, an overall
increase in charging station demand.
30
5.4. Criteria
As a first step toward electrification of Southern California’s heavy-duty drayage sector, we
identified locations for SCE to place charging infrastructure in order to maximize the adoption
and use of heavy-duty electric vehicles and emissions reductions as a result. Our analysis
includes two types of criteria: the first is the reduction of emissions, and the second is a set of
constraints within which the emissions reduction must occur.
5.4.1. Emissions Reduction
The central goal of SCE’s Charge Ready Transport program is reducing emissions from the
combustion of diesel fuel and to improve air quality, particularly in communities most impacted
by air pollution. Therefore, the main objective of our analysis is to identify charging station
locations that will reduce emissions via the transition of drayage trucks from diesel to electric. In
the initial phase of SCE’s program, this will occur by targeting truck companies with both the
largest fleets and which own or lease truck yards near the ports with sufficient capacity to build
out charging infrastructure. In the longer term, maximum emissions reduction can be achieved
by building out public charging stations along drayage truck routes.
5.4.2. Constraints
Our optimal charging station locations will be identified by subjecting them to a set of
constraints. These constraints include the following: (1) the program budget; (2) whether a truck
yard or TAZ is located (in part or in whole) in a DAC; and, (3) the zone’s grid capacity.
5.4.2.1. Program Budget
Our first constraint is the budget. SCE’s Charge Ready Transport program includes over $340
million for medium- and heavy-duty charging infrastructure, however only a portion of this
budget, $35 million, is allocated for drayage trucks at the San Pedro Bay Ports. The budget
includes both the cost of the charging stations, of which SCE will be paying up to 50 %, as well
as the costs to build out the stations. SCE is paying 100 % of the buildout expenditures, which
include permitting, labor, and trenching. To determine the most cost-effective option, we will
account for economies of scale; this is an especially important consideration given that buildout
costs can easily cost five to ten times more than the cost of the charging station itself. Ultimately
we will seek to identify the number and type of charging locations that maximize emissions
reductions while staying within the budget constraint.
5.4.2.2. Locations in Disadvantaged Communities
California’s DACs are often the most affected by the harmful environmental impacts associated
with the transportation sector (CPUC, 2018). Not only are these communities located within
areas of high air pollution caused by vehicle emissions, but the residents are typically low-
income and minority groups. The near and long-term impacts of climate change are expected to
fall more heavily on DACs (U.S. EPA, 2015). DACs often lack the necessary financial resources
and political capital to invest in pollution-mitigating strategies (Kameri-Mbote et al., 2016).
Furthermore, they may face barriers to equitable participation in environmental policymaking,

31
which may result in fewer benefits for their communities from environmental programs (Kameri-
Mtobe et al., 2016).
A determining factor in the CPUC’s approval of SCE’s Charge Ready Transport program was
the inclusion of DACs as beneficiaries of any new charging infrastructure. Specifically, SCE has
committed to reserving 40 % of its budget for investments in DACs (CPUC, 2018). This means
that a key constraint criterion in determining optimal charging site locations will be to ensure
that a minimum of 40 % of these sites is located in DACs.
5.4.2.3. Power Grid Capacity
Charging heavy-duty all-electric drayage trucks with large battery packs will require a
tremendous amount of power and support from local utilities. Existing locations have a set
capacity for how much electricity is available via the existing electricity grid. Drayage truck
fleets may need to make significant upgrades to their electrical panels and the actual power lines
from the poles. Also, unlike the economies of scale for fueling diesel vehicles, costs increase as
fleets add scale to their electric infrastructure. Grid power is a significant issue when charging
larger vehicles due to the demand of each vehicle. According to one electric truck company CEO
(Long 2018), an existing grid could require the construction of an entirely new power plant just
to charge 50-100 trucks.
However, given the short-term scope of our recommendations, we limit our focus to the current
electrical grid capacity. Therefore, another defining constraint in our considerations will be
whether a given site has the electrical grid capacity to support the electricity needs of drayage
truck charging. Those sites that do not have capacity will be eliminated from consideration,
while those that do will remain options for charging site placement, but then subject to the
additional constraints outlined.
The policy goals outlined at the beginning of this chapter — to develop a framework for optimal
placement of charging stations, as well as a complementary strategy to enhance electric truck
take-up — informed our decision to develop policies aimed at following these two approaches.

32
6. Policy Recommendations The policy recommendations below are segmented into two parts. While separate in practice, the
two types of policies complement one another and are part of a larger strategy to maximize the
use of charging stations and the take-up of electric trucks. The first part of our recommendation
is an algorithm based on quantitative data analysis, and it seeks to fulfill our policy goal of
identifying the optimal placement of electric charging stations. The complementary strategy to
our algorithm is a set of potential business and outreach strategies, whose goal is to encourage
the take-up of electric trucks, thereby creating robust demand for charging stations.
6.1. Charging Station Placement Optimization Algorithm
Our first recommendation is an algorithm for finding the optimal locations for charging
infrastructure, based on the constraints discussed above as well as key assumptions. This
algorithm can be used to site charging stations in both the short and long term.
6.1.1. Key Assumptions
To evaluate potential charging station placement scenarios, we used various assumptions deemed
most realistic from a technological and logistical standpoint. Assumptions are based on research
and interviews discussed above and the most recent data from primary sources wherever
possible.
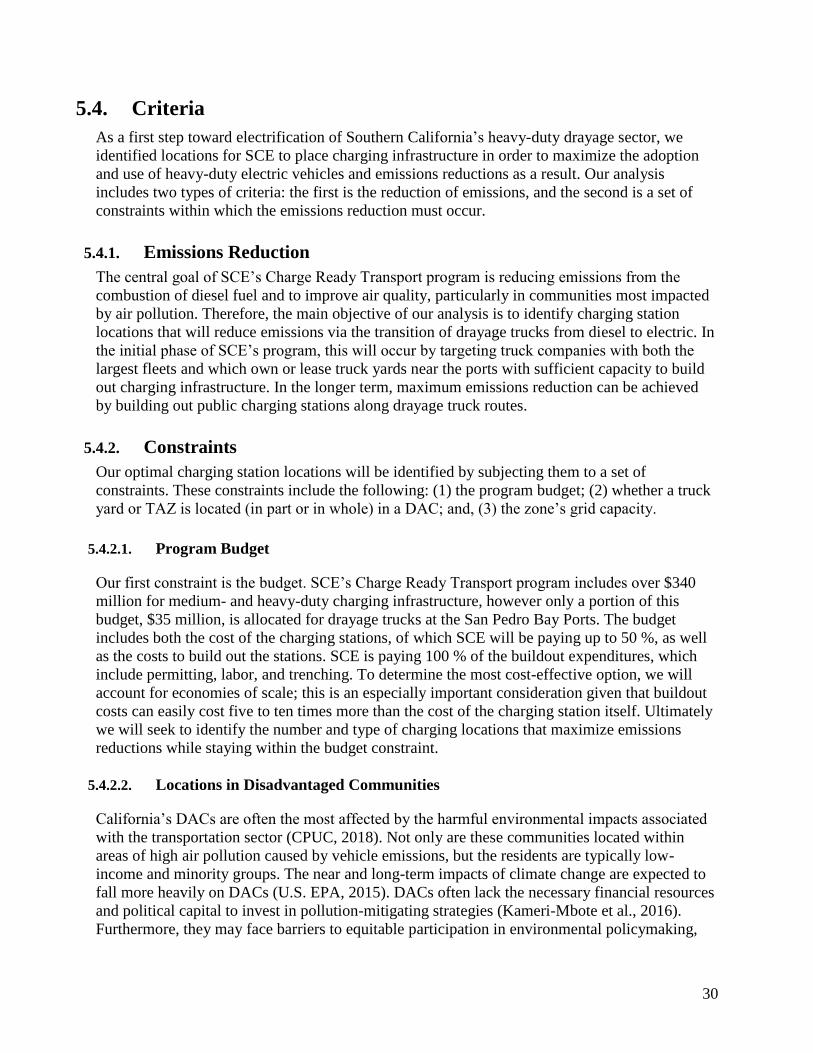
6.1.1.1. Electric Drayage Truck Specifications
This analysis uses Daimler’s Freightliner eCascadia class 8 heavy-duty truck specifications
(Daimler, n.d.). Daimler presented the fully-electric truck in 2018, and it is expected to be
commercially available in 2021 (Wilde, 2018). The model is based on the Cascadia, the most
successful heavy-duty long-distance truck (class 8) in the North-American market (Daimler,
n.d.). Figure 12 lists the electric truck’s specifications. Since the average monthly electricity
consumption for a U.S. residential utility customer was 867 kWh (U.S. Energy Information
Administration, 2018), the battery capacity of the truck is nearly 20-day electricity consumption
for a household.
Figure 12. Daimler Freightliner eCascadia key specifications (Daimler, n.d.)
33
Figure 13. Daimler’s Freightliner eCascadia (Daimler, n.d.)
6.1.1.2. Drayage Truck Duty Cycle
We assume the average miles traveled by electric trucks per day is 273.7 miles. It is calculated as
follows:
Average miles traveled per day = Average daily miles + Safety margin
= 238 miles2 + electric drayage truck range x 15%
= 238 miles + 250 miles x 15% = 273.7 miles
This calculation uses the range of the eCascadia heavy-duty truck, including an additional 15%
margin of safety to account for potential upward deviations in daily mileage. We also assume
that trucks begin their shift at the truck yard, drive to the ports, pick up cargo, and drive to
warehouses for cargo drop-off or pick-up (Figure 7). Trucks then return to the ports for
additional trips. In other words, we do not assume trucks carry out direct warehouse-to-
warehouse travel. This assumption is based on the limited available data on all trucking routes.
After finishing a shift, trucks from larger fleets return to their company truck yards, while small-
fleet and IOOs park their vehicles in lots or other locations.
6.1.1.3. Charger Type
Since we assume the overnight charging window is only nine hours, high-capacity chargers are
needed to charge as many trucks as possible. Therefore, we assume trucking companies will use
DC fast chargers, as opposed to the slower-to-charge AC chargers. One possible model is
BTCPower L4M200 (BTCPower, n.d.). This charger has a capacity of 200 kW and costs
$44,200. With this charger, heavy-duty trucks can get a full charge in a minimum of 1 hour and
45 minutes. As stated above, trucking companies will want to minimize the amount of time spent
charging and will, therefore, want this type of faster charger.
2 Source: (Tetra Tech 2018)

34
Figure 14. BTC Power L4M200 charger (BTCPower, n.d.)
6.1.1.4. Overnight and Opportunity Charging
As discussed in Section 5, we assume the optimal charging time for the average truck is 9 pm to
6 am, as the longest break occurs at night when ports are closed. Since we assume one DC fast
charger can charge four trucks overnight in the nine-hour charge window, one truck can occupy a
charger for 2 hours and 15 minutes. With the 2 hours and 15 minutes of charging, electric trucks
can drive up to 202.5 miles according to the following calculation:
2.25 hour charging = 200 kW x 2.25 hour x 0.45 miles/kWh = 202.5 miles
For trucking companies to utilize this efficient four-truck-per-night charging model, they will
need to utilize current employees or new hires for overnight attendance to the charging stations.
This is because, once the first “shift” of two trucks completes their charging cycle, an attendant
will need to replace this first shift with the second shift of two trucks to charge.
Since the average miles traveled by electric trucks per day is 273.7 miles, trucks would run out
of battery during their daily routes without additional charging during the day. Therefore,
opportunity charging must be accounted for when placing charging infrastructure.
6.1.1.5. Short- and Long-Term Charging Station Ownership and Locations
In the short term, the first five years, we assume early adopters will be larger companies that
have the resources to invest in the new technologies and comply with SCE guidelines. On the
other hand, owners of warehouses could have shared chargers for short, opportunity charging.
Smaller companies and IOOs will electrify in the longer term. While our recommendations for
opportunity charging in the long term also apply to small companies, optimal overnight
infrastructure siting for smaller operators is beyond the scope of this analysis.
We assume that large companies will place chargers in their privately owned truck yards for
overnight charging to avoid competition and also use them for opportunity charging during
daytime if they are close to ports. As discussed in Section 5, opportunity charging at warehouses
is not expected in the short term. In the long term (the year 2035), we assume that the majority of
large and small trucking firms will convert to electric to meet the port’s 2035 zero emission
goals. At that time, opportunity charging can take place in warehouses. Finally, we assume that
the grid capacity will expand to meet this greater demand in the long run.

35
Chargers are not permitted on the port property due to technical and spatial constraints (R.
Moilanen, personal communication, November 5, 2018). We do not consider a public shared
model (e.g., a conventional gas station model), because this type is precluded by the conditions
set out in SCE’s Charge Ready Transport program application.
6.1.1.6. Installation Cost and Economies of Scale
We estimate the installation cost and economies of scale based on existing literature in the DGS
General Service “Electric Vehicle Supply Equipment Guidance Document” (California
Department of General Services, 2014) and our interview with SCE (personal communication,
February 24,2019). We assume that the installation cost, which includes a site development cost
separate from the actual equipment, is $150,000 to $250,000. Since the diseconomy scale caused
by energy consumption greatly differs between each site, we assume that there will be economies
of scale for the installation cost, but the installment cost per charger is stable if the number of
chargers per site is more than five.
# of chargers
per site
Installment Cost per Charger
(excluding charging equipment)
1 $250,000
2 $225,000
3 $200,000
4 $175,000
5 and more $150,000
Figure 15. Estimate of Installment Cost (California Department of General Services, 2014 and SCE, personal
communication, February 24,2019)

36
6.1.2. Short-Term Placement Algorithm
Figure 16. Overview of Short-term Placement Algorithm
Step 1. Set Target Area
Our project target area is within 100 miles of the ports. We consider three factors in choosing
this range: electric truck battery capacity and range, truck travel behavior, and DAC coverage.
Our model drayage truck drives 202.5 miles, which means about 100 miles per one-way trip.
Also, 88% of drayage trucks have one-way trips of under 100 miles away from the ports (CGR
Management Consultants LLC, 2007). Lastly, the 100-mile radius area covers a large number of
DACs, where SCE is required to invest at least 40% of its total program funding for deployment
(CPUC, 2018).
Step 2. Identify Truck Yard Locations
Truck yard locations were identified using POLB’s drayage company registry which included the
addresses of all of the companies registered at the ports. Company addresses were geocoded and
converted into geographic coordinates by researcher James Di Filippo from the UCLA Luskin
37
Center for Innovation. We then visually verified truck yard coordinates using Google satellite
images.
ESRI’s ArcGIS spatial analysis software was then used to import coordinate points and map
truck yard locations. Further analysis was conducted using these points. Truck yard locations
were identified in this way based on the data we obtained. However, if SCE were able to acquire
comprehensive truck yard data after speaking to individual customers, the result would be more
accurate.
There is limited data on all of the truck routes and the warehouses drayage trucks travel to;
moreover, these locations are constantly changing. Therefore, we cannot identify specific
warehouses for opportunity charging. In the short term, opportunity charging will have to take
place at a company’s truck yard. To limit the extra distance trucks have to drive to go back to
their yards for opportunity charging, chargers should be placed in yards that are closer to the
ports (within 10 miles), the most common and consistent destination for drayage trucks.
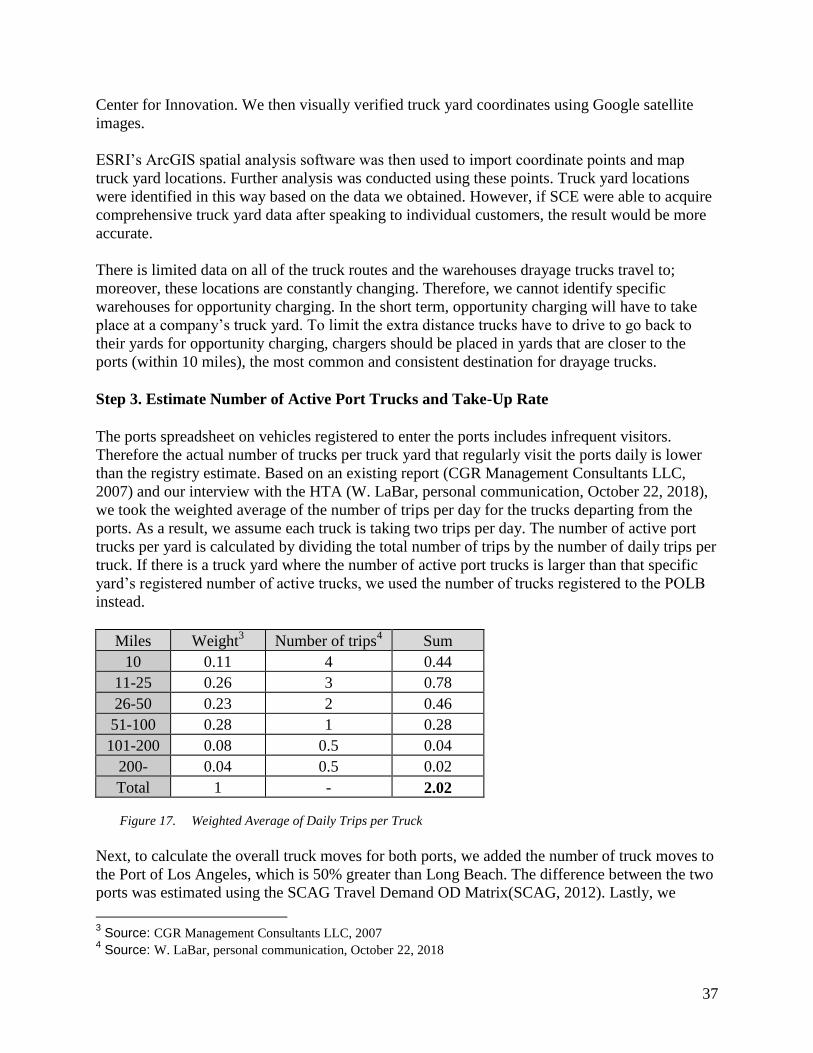
Step 3. Estimate Number of Active Port Trucks and Take-Up Rate
The ports spreadsheet on vehicles registered to enter the ports includes infrequent visitors.
Therefore the actual number of trucks per truck yard that regularly visit the ports daily is lower
than the registry estimate. Based on an existing report (CGR Management Consultants LLC,
2007) and our interview with the HTA (W. LaBar, personal communication, October 22, 2018),
we took the weighted average of the number of trips per day for the trucks departing from the
ports. As a result, we assume each truck is taking two trips per day. The number of active port
trucks per yard is calculated by dividing the total number of trips by the number of daily trips per
truck. If there is a truck yard where the number of active port trucks is larger than that specific
yard’s registered number of active trucks, we used the number of trucks registered to the POLB
instead.
Miles Weight3 Number of trips
4 Sum
10 0.11 4 0.44
11-25 0.26 3 0.78
26-50 0.23 2 0.46
51-100 0.28 1 0.28
101-200 0.08 0.5 0.04
200- 0.04 0.5 0.02
Total 1 - 2.02
Figure 17. Weighted Average of Daily Trips per Truck
Next, to calculate the overall truck moves for both ports, we added the number of truck moves to
the Port of Los Angeles, which is 50% greater than Long Beach. The difference between the two
ports was estimated using the SCAG Travel Demand OD Matrix(SCAG, 2012). Lastly, we
3 Source: CGR Management Consultants LLC, 2007
4 Source: W. LaBar, personal communication, October 22, 2018

38
assume 25% of active port trucks will convert to electric since we assume that even the larger
companies will not convert their entire fleet in the first five years.
Total # of active port trucks = [Total POLB truck moves] /2 (daily trips) x 1.5 (total
POLA truck moves)] x (conversion rate)
Step 4. Distribute Charging Stations
As stated above, we assume that the time window for overnight charging is nine hours, which
accounts for almost fully charging four trucks. Thus, the number of chargers needed in each
truck yard is calculated by dividing the number of active trucks in each truck yards by four.
Then, we distribute chargers to the yards with the highest demand for chargers5. In this process,
we eliminate those yards with less than four active trucks to omit small companies and to make
sure that all chargers are fully used overnight.
Step 5. Apply Power Grid Constraint
After calculating the number of chargers needed in each truck yard, we checked the grid capacity
to make sure that the electricity demand of chargers did not exceed the capacity. The electricity
demand of each truck yard was calculated as shown:
Total truck yard electric demand = [Total number of chargers in each truck yard] x [200 kW]
As for the grid capacity, we searched for the “Integration Capacity (Uniform Load)” of the
circuit node closest to each truck yard by using Southern California Edison’s DRPEP. The
electricity demand and integration capacity are compared for each truck yard, and if the
integration capacity is smaller than electricity demand, the number of chargers is reduced. It is
important to note that integration capacity in DRPEP assumes uniform load; however, our model
assumes electricity demand for chargers increases mainly during the night time when electricity
demand is low. Therefore, the grid capacity examined using this method is stricter than the actual
grid constraint.
Step 6. Apply DAC Coverage Constraint
SCE is mandated to spend over 40% of its budget in DACs. If the expenditure for chargers
placed within DACs is less than 40% of the total expenditure for all chargers, the chargers placed
outside of DACs will be redistributed to truck yards in DACs until the requirement is fulfilled.
Step 7. Apply Budget Constraint
Since we determined that economies of scale exist, it is more cost-effective to place chargers in
truck yards with higher charger demand. Therefore, chargers are placed in high-demand truck
yards until the budget ($35,812,407) is reached. The installation cost for each truck yard is 5 For the number of chargers in each yard, decimals are rounded down so that the chargers are fully used by four
trucks overnight.

39
calculated using values introduced in Figure 15. Under SCE’s Charge Ready Transport program,
100% of the electricity infrastructure and charger installation are covered. A rebate also covers
up to 50% of charger cost, which the customer is responsible for purchasing. To be conservative,
100% of the installation cost and 50% of the charger’s cost was included.
Figure 18. SCE estimated Heavy-Duty Infrastructure Program budget (CPUC, 2018)
Step 8. Compute Emission Reductions
Replacing diesel and LNG trucks with electric trucks reduces emissions since electric drayage
trucks have zero tailpipe emissions. While generating electricity for such vehicles emits
pollutants, lifecycle emissions are beyond the scope of this analysis. We use the following
calculation to estimate emission reductions:
Emission reduction (replacing diesel truck) [metric tons/year] = T x PD x (VMT/day) x
(operational days per year) x [EFD – EFE]
Where T = total number of electric trucks supported with charging station placement
PD = proportion of the current fleet that is diesel
EFD = diesel heavy-duty truck emission factor [metric tons per mile]
EFE = electric heavy-duty truck emission factor [metric tons per mile]
Emission reduction (replacing LNG truck) = T x PLNG x (VMT/day) x (operational days per year)
x [EFLNG – EFE]
Where PLNG = proportion of the current fleet that is LNG

40
EFLNG = LNG heavy-duty truck emission factor [metric tons per mile]
We use the diesel and LNG truck emission factor in Figure 19. The CO2 emission factor is found
through the following calculation:
CO2 Emission Factor (diesel truck) = (grams CO2 /gallon diesel combusted) / (average miles /
gallon diesel)
= (10,151 grams per gallon6) / (6.5 miles per gallon
7) = 1,561.7 grams/mile
We also assume that 95 % of all drayage trucks replaced by electric drayage trucks are diesel-
fueled, and the other 5% are LNG-fueled. This ratio is the same as a market composition in 2017
(Guerin, 2017).
Pollutant LNG emission
reduction compared
to diesel trucks
Electric truck emission
reduction compared to
diesel trucks
New diesel truck
emission rate
(grams per mile)
LNG truck
emission rate
(grams per mile)
Electric truck
emission rate
(grams per mile)
CO2 27%8 100% 1,561.70 1132.79
9 0
NOx 90% 100% 1.508 0.15080 0
PM2.5 16% 100% 0.007 0.00588 0
Figure 19. Average Heavy Duty Truck Tailpipe Emission Rates (grams per mile). Source: EMFAC 2017,
POLA and UBUS vehicle categories were used.
6.1.3. Short-Term Algorithm Application
6.1.3.1. Truck Yard Locations
The location of truck yards with more than four active trucks is as follows. The majority of them
are located within 10 miles of the ports.
6 Source: US Energy Information Administration, 2014
7 Source: Rentar Environmental Solutions, Inc., 2017
8 Source: US Energy Information Administration, 2016
9 Source: US Energy Information Administration, 2016

41
Figure 20. Truck Yard Location
6.1.3.2. Number of Chargers Needed in Each Truck Yard
After locating the address of truck yards, chargers were distributed in proportion to the number
of estimated electric trucks in each truck yard within the SCE service area. If the overnight
chargers are placed within 10 miles from the ports and the conversion rate is 25% at maximum,
the total cost is under the proposed budget.
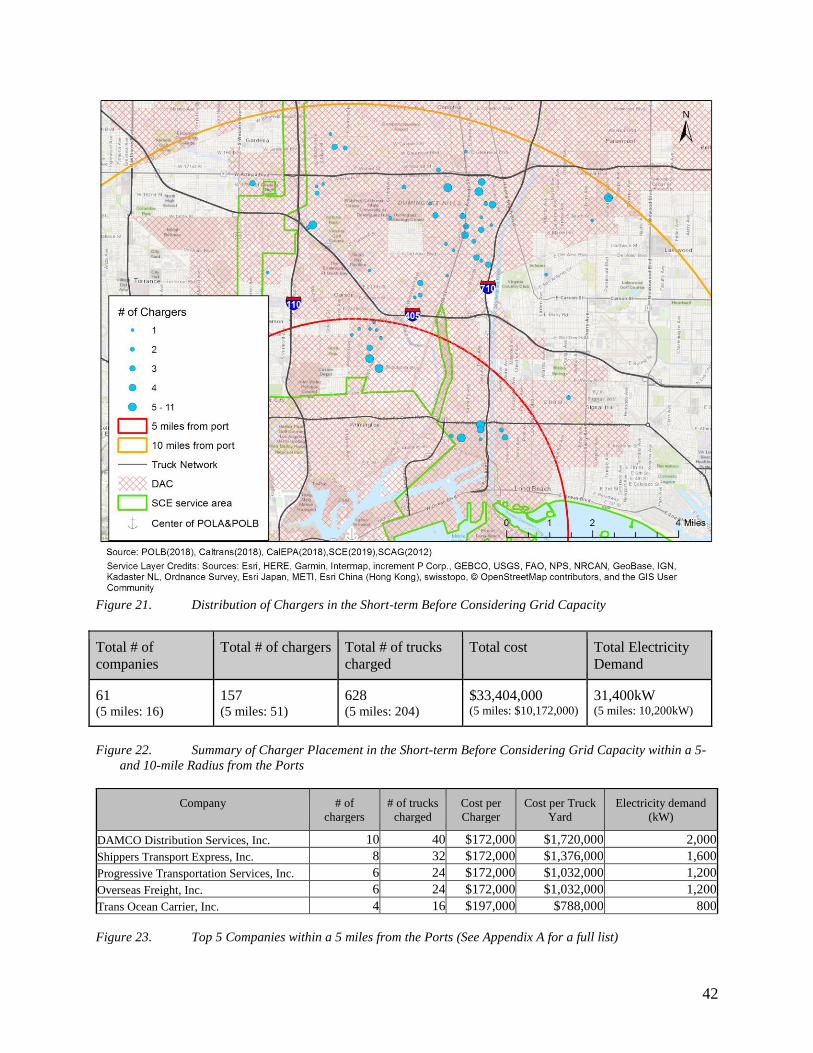
42
Figure 21. Distribution of Chargers in the Short-term Before Considering Grid Capacity
Total # of
companies
Total # of chargers Total # of trucks
charged
Total cost Total Electricity
Demand
61 (5 miles: 16)
157 (5 miles: 51)
628 (5 miles: 204)
$33,404,000 (5 miles: $10,172,000)
31,400kW (5 miles: 10,200kW)
Figure 22. Summary of Charger Placement in the Short-term Before Considering Grid Capacity within a 5-
and 10-mile Radius from the Ports
Company # of
chargers
# of trucks
charged
Cost per
Charger
Cost per Truck
Yard
Electricity demand
(kW)
DAMCO Distribution Services, Inc. 10 40 $172,000 $1,720,000 2,000
Shippers Transport Express, Inc. 8 32 $172,000 $1,376,000 1,600
Progressive Transportation Services, Inc. 6 24 $172,000 $1,032,000 1,200
Overseas Freight, Inc. 6 24 $172,000 $1,032,000 1,200
Trans Ocean Carrier, Inc. 4 16 $197,000 $788,000 800
Figure 23. Top 5 Companies within a 5 miles from the Ports (See Appendix A for a full list)

43
Company # of
chargers
# of trucks
charged
Cost per
Charger
Cost per Truck
Yard
Electricity demand
(kW)
Southern Counties Express, Inc. 11 44 $172,000 $1,892,000 2,200
DAMCO Distribution Services, Inc. 10 40 $172,000 $1,720,000 2,000
Shippers Transport Express, Inc. 8 32 $172,000 $1,376,000 1,600
Lincoln Transportation Services, Inc. 7 28 $172,000 $1,204,000 1,400
Container Freight EIT, LLC 6 24 $172,000 $1,032,000 1,200
Progressive Transportation Services, Inc. 6 24 $172,000 $1,032,000 1,200
Overseas Freight, Inc. 6 24 $172,000 $1,032,000 1,200
Sho Hai, Inc. 5 20 $172,000 $860,000 1,000
Green Fleet Systems, LLC 4 16 $197,000 $788,000 800
Trans Ocean Carrier, Inc. 4 16 $197,000 $788,000 800
National Retail Transportation, Inc. 4 16 $197,000 $788,000 800
Mano Delivery Corp. 4 16 $197,000 $788,000 800
Figure 24. Top 10 Companies within a 10-mile radius of the Ports (See Appendix B for a full list)
6.1.3.3. Application of Constraints (Grid Capacity / DAC / Budget)
Several truck yards were located in areas with zero additional grid capacity. As a result, the
number of chargers was reduced for those locations. Many of the truck yards without grid
capacity were close to the circuits connected to substations in the cities of Carson, Alon, and
Watson.
As for DAC coverage, there was only one charger that was located outside of the DAC area in
the short term. The DAC coverage rate was 100% within 5 miles from the ports, and 99% within
10 miles from the ports. Therefore, the placements exceed SCE’s minimum 40% DAC
investment requirement.
6.1.3.4. Distribution of Chargers within Budget
As mentioned above in 6.1.3.2, the total cost was less than the project budget even before
considering the constraints. Therefore, all of the chargers needed were distributed within the
budget in the short term. There will be 101 chargers placed in 40 truck yards, serving 404 trucks
at a cost of $21,522,000 for SCE.

44
Figure 25. Distribution of Chargers in the Short-term After Considering Grid Capacity

45
Company Electricity
Demand
(kW)
Integration
Capacity
(kW)
# of
Chargers
# of
Chargers
(with
Grid)
# of
Trucks
Charged
Cost per
Charger
Cost per
Truck Yard Substation
Southern
Counties
Express, Inc. 2,200 0 11 0 0 $172,000 $0 Carson
DAMCO
Distribution
Services, Inc. 2,000 3,510 10 10 40 $172,000 $1,720,000 Watson
Shippers
Transport
Express, Inc. 1,600 0 8 0 0 $172,000 $0 Watson
Lincoln
Transportation
Services, Inc. 1,400 3,610 7 7 28 $172,000 $1,204,000 Jersey
Container
Freight EIT,
LLC 1,200 1,400 6 6 24 $172,000 $1,032,000 Sunnyside
Progressive
Transportation
Services, Inc. 1,200 1,720 6 6 24 $172,000 $1,032,000 State Street
Overseas
Freight, Inc. 1,200 1,680 6 6 24 $172,000 $1,032,000 State Street
Sho Hai, Inc. 1,000 11,250 5 5 20 $172,000 $860,000 Nola
Green Fleet
Systems, LLC 800 0 4 0 0 $197,000 $0 Carson
Trans Ocean
Carrier, Inc. 800 1,710 4 4 16 $197,000 $788,000 State Street
National Retail
Transportation,
Inc. 800 0 4 0 0 $197,000 $0 Carson
Mano Delivery
Corp. 800 4,470 4 4 16 $197,000 $788,000 Carson
Figure 26. Top 10 Companies within a 10-mile radius of the Ports after Considering Grid Capacity (See
Appendix C for a full list)
Figure 27. Summary of Short-Term Charger Placement after Considering Grid Capacity within a 10-mile
Radius from the Ports
6.1.3.5. Emission Reductions
Using the number of trucks replaced through this project, the estimated emission reductions
would be as follows (for full calculations, see Appendix D).

46
Emission reduction in metric
tons per year
Short-term placement within
5 miles of the ports
Short-term placement within
10 miles of the ports
Short-term placement within
10 miles of the ports
(considering grid capacity)
CO2 23,332.12 71,826.33 46,206.75
NOx 21.82 67.16 43.20
PM2.5 0.11 0.32 0.21
Figure 28. Summary of short-term emission reductions (metric tons per year)
6.1.4. Long-Term Placement Algorithm
Figure 29. Overview of Long-term Placement Algorithm
Step 1. Determine Number of Charging Stations Fleetwide
For the short-term, we assume that only 25% of the trucks in each company convert to electric.
For the long term, we assume that all trucks, except those owned by small truck companies,
convert to electric. The location and number of active trucks for each truck yard are already
calculated in the short-term application above. We use this data to then calculate the number of
stations that can charge such trucks by adding the necessary number of charging stations (total
47
number of electric trucks divided by 4) in each truck yard. Decimals are rounded up so that all
the electric truck are charged overnight.
Step 2. Allocate Overnight Charging Stations to Small Trucking Companies
Ideally, all electric trucks should be covered by overnight chargers. However, each truck yard is
for trucks owned by each company’s own vehicles, so smaller truck companies would not be
able to charge in truck yards belonging to other larger companies. Furthermore, small company
yards might not be located near the ports, and it is not realistic for them to return to their yards
for opportunity charging. Thus, we consider placing chargers in areas other than truck yards for
small companies and IOOs.
For truck companies that own more than four trucks, we will continue to add overnight chargers
to their yards with a new budget as mentioned in the previous step. For smaller trucking
companies, their trucks’ overnight dwelling location must be identified in order to consider the
placement of overnight chargers to cover their trucks.
Step 3. Allocate Opportunity Charging Stations
After equipping all trucks with overnight chargers, we consider placing opportunity chargers in
warehouses so that trucks can charge away from the ports. With this allocation, trucks with
longer shifts exceeding the average mileage will be able to charge away from the port. Even
though battery capacity is expected to increase in the long-term, opportunity charging will still
be needed during the day because smaller companies are likely to use second-hand electric trucks
which can run up to 200 miles due to battery degradation and the use of old models. For
determining allocation, we conducted VMT analysis by using OD matrix data.
Step 4. Measure VMT
To determine potential demand for opportunity chargers, we calculated total VMT between the
ports and each TAZ.
VMT = (number of trips) x (distance)
The number of trips between the ports to each TAZ was obtained from SCAG’s Origin-
Destination Matrix model(SCAG, 2012), and the distance between the center of each zone (ports
and TAZ) was calculated by conducting network analysis using ArcGIS. Instead of using the
simple Euclid distance between two points, network analysis calculates distances based on the
actual road network, prioritizing roads with higher classification (motorway, primary, etc.) that
trucks can actually travel on.
Step 5. Rank TAZs
To determine the optimal allocation for opportunity chargers, we ranked zones by VMT from
highest to lowest (which indicates highest to lowest charger demand). Within the future budget,
SCE can put chargers in zones with a larger volume of VMT.

48
Step 6. Consider Constraints
In the long term, SCE would not have to consider DAC coverage if this criterion is met in the
short term and budgets will have changed in the future. Grid capacity constraints will have also
changed as SCE would have time to upgrade grid systems to meet energy demands if necessary.
Therefore, this step is not in our application. However, if SCE needs to consider these
constraints, the methods introduced in the Short-Term Placement Algorithm Step 5- 7 can be
applied.
Step 7. Compute Emission Reductions
We employ the same method as explained in Step 8 in the Short-Term Placement Algorithm.
6.1.5. Long-Term Application
6.1.5.1. Location of the Truck Yards
Our short-term analysis is based on the location of truck yards within 10 miles from the ports. In
the long-term, we will include all truck yards within our target area (100 miles from the ports).

49
Figure 30. Truck Yard Location
6.1.5.2. Number of Chargers Needed in Each Truck Yard
After locating truck yards addresses, we distribute the chargers in proportion to the number of
active trucks in each yard within the SCE service area for overnight charging. For the long term,
although a budget does not exist as of yet, SCE should allocate necessary overnight chargers for
charging all-electric trucks entering the ports. Based on this analysis, the estimated number of
electric trucks served is 4,941 with 1,313 overnight chargers needed to support those trucks in
the future.
As for small truck companies without truck yards, the overnight parking locations need to be
identified to consider the placement of overnight chargers. We do not consider the grid constraint
for long-term placement due to its uncertainty. However, there will be 262,600 kW of electricity
demand (see Figure 33) and the majority of chargers will be aggregated within 10 miles from the
ports. It is highly likely that SCE will need to upgrade the grid capacity if all drayage trucks are
converted to electric in the future.

50
Figure 31. Charger Placement in the Long-term
Although it is beyond the scope of this analysis, there is also a certain amount of demand for
chargers outside of SCE’s service territory, since many truck yards are also located in the Los
Angeles Department of Water and Power (LADWP) service area.

51
Figure 32. Charger Placement in the Long-term (including non-SCE Area)
Total # of
companies
Total # of chargers Total # of trucks
charged
Total cost Total Electricity
Demand
211 1,313 4,941 $245,208,000 262,600kW
Figure 33. Summary of Charger Placement in the Long-term (within SCE service area)

52
Company # of
chargers
# of trucks
charged
Cost per
Charger
Cost per
Truck Yard
Electricity
demand (kW)
Deco Logistics, Inc. 51 204 $172,000 $8,772,000 10,200
Southern Counties Express, Inc. 45 179 $172,000 $7,740,000 9,000
DAMCO Distribution Services, Inc. 43 172 $172,000 $7,396,000 8,600
CMI Transportation, LLC 41 164 $172,000 $7,052,000 8,200
Shippers Transport Express, Inc. 34 133 $172,000 $5,848,000 6,800
Lincoln Transportation Services, Inc. 29 113 $172,000 $4,988,000 5,800
Container Freight EIT, LLC 27 107 $172,000 $4,644,000 5,400
Progressive Transportation Services, Inc. 27 105 $172,000 $4,644,000 5,400
Overseas Freight, Inc. 25 98 $172,000 $4,300,000 5,000
American Pacific Forwarders, Inc. 23 89 $172,000 $3,956,000 4,600
Sho Hai, Inc. 21 83 $172,000 $3,612,000 4,200
Versa Logistics, LLC 21 82 $172,000 $3,612,000 4,200
Green Fleet Systems, LLC 19 76 $172,000 $3,268,000 3,800
Trans Ocean Carrier, Inc. 19 76 $172,000 $3,268,000 3,800
National Retail Transportation, Inc. 18 72 $172,000 $3,096,000 3,600
Mano Delivery Corp. 18 70 $172,000 $3,096,000 3,600
Figure 34. Top 15 Companies with Highest Demand within SCE service area (See Appendix E for a full list)
6.1.5.3. Ranking Zones by VMT for Opportunity Charger Allocation
As discussed above, the priority of location for opportunity charging at warehouses is determined
by the VMT for each zone. Appendix G shows the complete list of TAZs within SCE territory
ranked by VMT. Based on its future budget, SCE can allocate opportunity chargers at
warehouses in TAZs with the highest VMT.
Figure 35 illustrates the distribution of zones with higher daily VMT for heavy-duty drayage
trucks entering or departing the ports. The distribution of these zones is similar to Figure 36,
which shows TAZs with a greater number of warehouses. Through our VMT analysis, we
identified the following clusters of TAZs with high VMT that are potential locations for
opportunity charger placement:
● 710 Corridor: neighborhoods surrounding the I-710 and I-5 have high VMT. These
include the City of Commerce, Compton and, Carson. These cities have a high number of
truck yards as well as warehouses.
● The area surrounding I-10 / I-15 interchange: the I-10 / I-15 interchange is the center of
the high-VMT zones, includes the cities of Rancho Cucamonga, Ontario, and Fontana.
The relatively close cities of Jurupa Valley, Chino, and Corona are also ranked high.
● Other than these two clusters, the following areas also have high VMT: Pomona, Moreno
Valley, Perris, Redlands, and Victorville.

53
Figure 35. TAZs with High VMT of Heavy-duty Drayage Trucks Entering or Departing the Ports
Figure 36. TAZs with High Volume of Warehouses
6.1.5.4. Emission Reductions
Using the number of trucks replaced through this project, the estimated emission reductions
would be as follows (for full calculations, see Appendix F).

54
Emission reduction in metric tons per year Long-term placement
CO2 56,5117.66
NOx 528.39
PM2.5 2.55
Figure 37. Summary of Long-term Emission Reductions (metric tons per year)
6.1.6. Summary of Algorithm Results
Based on our estimate from POLB truck data, our placement algorithm can cover 628 trucks in
the short term (404 trucks with grid capacity) and 4,941 trucks in the long term. However, more
trucks are operating in the SCAG region. According to the CAAP, the total number of registered
port trucks is about 17,500. Approximately 11,000 to 13,000 of these trucks are considered
“active,” meaning they make multiple daily trips to the ports (The San Pedro Bay Ports, 2018).
Among them, we identified 4,941 trucks as our long-term target. These trucks are owned by
companies that have four or more trucks, have truck yards located within 100 miles from the
ports, and are within SCE territory. The remaining trucks would be owned by companies located
outside the 100-mile radius from the ports, outside SCE territory, or owned by very small
trucking companies. For these trucks, additional measures outlined in the next chapter should be
considered.
Number of trucks
Total number of port trucks 17,500 From
CAAP* Total number of active port trucks 11,000 - 13,000
Total estimated number of active port trucks 9,549
Our
Estimate
Trucks owned by companies within 100 miles and with
companies with 4 or more active port drayage trucks 8,876
Long-Term Target: Trucks owned by companies within 100
miles, have 4 or more active drayage port trucks, and yards
located within SCE area
4,941
Short-Term target: within 10 miles 628
Short-Term target: within 10 miles (considering grid capacity) 404
Short-Term target: within 5 miles 204
Figure 38. Summary of the Number of Trucks (*The San Pedro Bay Ports, 2018)
55
6.2. Business & Outreach Strategy Options
In addition to locating the optimal placement of charging stations, our strategy provides
recommendations to address our second stated policy goal: how to encourage trucking
companies to convert to electric trucks, a necessary precursor to creating strong demand for
electric charging stations.
SCE can play a valuable role in helping companies overcome financial, as well as administrative
and logistical, concerns and barriers. While our recommendations are by no means exhaustive,
they are all opportunities to bring certainty and confidence into trucking companies’ decisions to
transition to a cleaner, electric fleet.
Below we outline the most practical, impactful business strategies SCE can implement beginning
now, and through the life of their program. We then evaluate these different strategies based on a
uniform set of relevant criteria, which include effectiveness, financial feasibility, and
administrative feasibility.
6.2.1. Proactive Outreach and Education
As a first step, we recommend proactively reaching out to the drayage trucking companies with
the largest fleets and greatest financial resources. Most of these companies are identified in our
report’s analysis. Instead of waiting for individual companies to apply for SCE’s charging station
grants, reaching out early and often to the most likely candidates will not only encourage a
quicker start to the program but also prove to these companies that SCE is a willing and
enthusiastic partner.
We also recommend offering as much education to trucking companies throughout this process,
but especially in the beginning. Trucking companies would benefit tremendously from SCE’s
knowledge of state and regional subsidies for truck ownership; reputable charging infrastructure
and electric truck companies; and, opportunities and incentives offered by the ports to incentivize
fleets’ transition from diesel to electric.
6.2.2. Address Needs and Concerns of Disadvantaged Communities
In addition to trucking company education and outreach, SCE can ensure a more impactful and
credible program rollout through early and consistent engagement with impacted communities.
This type of engagement might include presentations at the neighborhood and city council
meetings; dispersion of informational flyers or surveys to residents within DACs; or, invitations
for site visits to potential charging station sites. Indeed, research shows that the most successful
community health improvement programs are those that emphasize community participation,
trust-building, and empowerment through education.
Angelo Logan, co-founder of the East Yard Communities for Environmental Justice recommends
the participation of environmental justice leaders in an advisory committee where SCE can
consult community leaders on where resources would be best allocated (personal
communication, March 12, 2019). Potential advisory committee partners include the Moving
56
Forward Network and THE Impact Project, a coalition of community leaders working towards
100% zero-emission freight and goods movement in Southern California.
A primary goal of SCE’s program, and state and local efforts generally, is to improve health
outcomes for those most negatively impacted by pollution and emissions in and around the ports.
Without feedback, trust, and buy-in from the communities SCE is attempting to help, this
program will be falling short of its potential.
6.2.3. Collaboration with Ports and Regulatory/Governmental Partners
We also recommend maintaining (or, in some cases, forming) relationships and consistent
communication with relevant entities during the life of this program. At the more local level,
these groups include the San Pedro Bay Ports, the South Coast Air Quality Management District
(SCAQMD), and the cities of Los Angeles and Long Beach. At the state and national levels, this
list should include the California Air Resources Board, the California Energy Commission, and
the U.S. Environmental Protection Agency.
Many of these entities have ample experience working collaboratively with one another on
successful joint environmental policies and initiatives. Keeping in contact and collaborating with
these groups will only serve to strengthen SCE’s positioning as a key player in the regional
expansion of electric-vehicle technology and infrastructure.
SCE can partner with local, state, and national entities to secure additional funding for truck
owners in this program who want to convert to zero-emission trucks. Furthermore, these
agencies can provide SCE with information on opportunities to work with private companies in
the electric vehicle and charging station manufacturing industries, as well as current and ongoing
local zero-emission truck demonstration projects. These efforts will ensure that SCE’s program
is not operating in a vacuum and that it can benefit from relevant regional efforts by private
companies and government agencies alike.
6.2.4. Collaboration with Trucking Associations
Our application of the algorithm above relies on the best available spatial data on company truck
yard addresses. However, data limitations prevent us from identifying all trucking company sites,
sites that have the necessary space to fit charging infrastructure, and the grid capacity therein.
We were especially limited from identifying where smaller companies and IOOs dwell at night.
SCE would benefit from communication with local trucking associations (such as the Harbor
Trucking Association and the California Trucking Association) which have deeper relationships
with trucking companies. Trucking associations would also be a way for SCE to communicate
with smaller-scale operators and learn where their trucks dwell at night. Using this information,
SCE can make optimal siting decisions to provide overnight charging for this segment of the
drayage fleet.
As discussed in Section 5.1, trucking companies are concerned about a lack of convenient and
readily-available access to charging stations. Optimizing drayage truck routes will be paramount
for companies to ensure that their trucks always have access to a charging station for opportunity

57
charging at their facilities (see Section 5.3.4). To that end, SCE can address this concern by
informing companies of available route optimization systems on the market.
6.3. Evaluation of Business & Outreach Strategies
To evaluate which business strategies best address our goal of promoting the conversion to
electric trucks, we apply three key criteria: effectiveness, financial feasibility, and administrative
feasibility. The point of the criteria is to set the “rules” to follow in analyzing and comparing our
recommended strategies, thus giving us more measurable dimensions of our stated goal.
6.3.1. Evaluative Criteria
Below, we provide explanations of the specific criteria and their relevance to our policy goal.
Next, we use a Criteria Alternative Matrix (CAM) to provide a visual comparison of the
strategies, assigning values to each one based on how well it performs under each criterion.
Evaluative Criteria 1: Effectiveness
We want to know if implementing the proposed policies would promote the conversion to
electric trucks at the ports, and, if so, at what potential scale. In this way, we are evaluating
whether a particular type of outreach, partnership, or information-gathering tactic encourages
truck companies to convert their fleets from diesel to electric. Because the strategies above vary
by activity type, our evaluation considers what types of activities each strategy entails, and what
is likely to be the costs and benefits. Moreover, because we are not working with specific data or
dollar amounts in these evaluations, all benefits and costs are in terms of expected outcomes.
Evaluative Criteria 2: Financial Feasibility
We want to know if implementing the proposed policies would be financially feasible for SCE.
An obvious limitation of this evaluation is a lack of access to SCE’s annual budgets or
knowledge of where this program fits among the company’s many goals and priorities in the
years to come. However, we can surmise where expenditures would be spent on a given
program, and if the level of funding is relatively high or low compared to the alternatives.
Evaluative Criteria 3: Administrative Feasibility
Our third and final criterion measures the level of potential company administration necessary to
carry out the strategy. We consider the presence and magnitude of specific administrative factors
or tasks, which could include commitment and capacity. The commitment of SCE management
and all relevant team members for this specific program will be crucial. The company’s overall
capacity – including staff, skills, and expertise – to achieve a given strategy must also be
considered.
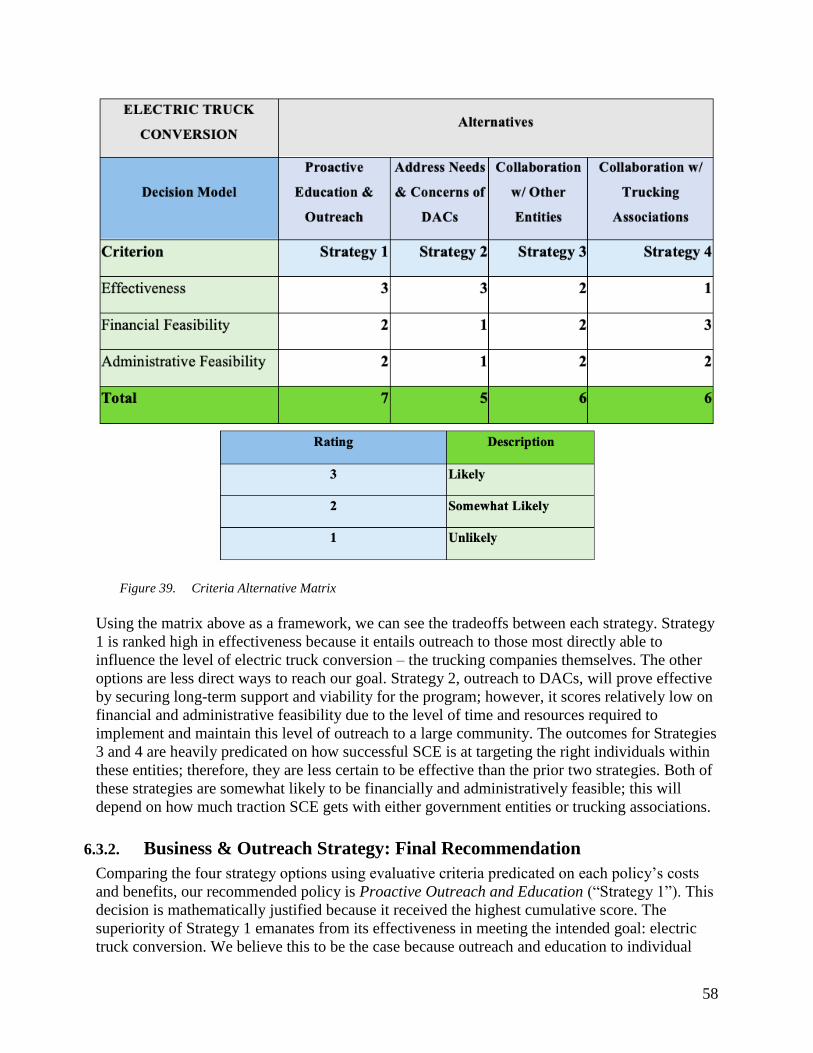
58
Figure 39. Criteria Alternative Matrix
Using the matrix above as a framework, we can see the tradeoffs between each strategy. Strategy
1 is ranked high in effectiveness because it entails outreach to those most directly able to
influence the level of electric truck conversion – the trucking companies themselves. The other
options are less direct ways to reach our goal. Strategy 2, outreach to DACs, will prove effective
by securing long-term support and viability for the program; however, it scores relatively low on
financial and administrative feasibility due to the level of time and resources required to
implement and maintain this level of outreach to a large community. The outcomes for Strategies
3 and 4 are heavily predicated on how successful SCE is at targeting the right individuals within
these entities; therefore, they are less certain to be effective than the prior two strategies. Both of
these strategies are somewhat likely to be financially and administratively feasible; this will
depend on how much traction SCE gets with either government entities or trucking associations.
6.3.2. Business & Outreach Strategy: Final Recommendation
Comparing the four strategy options using evaluative criteria predicated on each policy’s costs
and benefits, our recommended policy is Proactive Outreach and Education (“Strategy 1”). This
decision is mathematically justified because it received the highest cumulative score. The
superiority of Strategy 1 emanates from its effectiveness in meeting the intended goal: electric
truck conversion. We believe this to be the case because outreach and education to individual

59
trucking companies is the most direct way to influence electric truck up-take. Ultimately, it will
be this group that decides whether or not to transition from diesel to electric.
This strategy will, however, necessitate considerable time and resources. SCE must identify the
trucking companies with the largest fleets, contact and provide them information about the
electric charging station program, and carry out follow-up communications to encourage them to
participate in the program.
60
7. Conclusions The San Pedro Bay Ports’ goal for a zero-emission drayage fleet by 2035 presents a tremendous
opportunity for the ports and the drayage industry. SCE’s electric charging station program will
play a critical role in achieving this goal, by helping trucking companies overcome the
formidable challenges of converting from diesel to electric.
We believe our two-pronged strategy, addressing both charging station placement and electric
truck adoption, suits the complexity of the issue: rapidly-changing electric technology, coupled
with a trucking industry unwilling to relive their ill-fated experiences with natural gas trucks. We
hope our recommendations, and the general findings from this report, will equip SCE with the
tools and understanding to make informed decisions in the rollout of its Charge Ready Transport
program.

61
8. Appendix 8.1. Appendix A: Short-Term Placement within 5 miles from the
Ports
Company
# of
chargers
# of trucks
charged
Cost per
Charger
Cost per Truck
Yard
Electricity
demand
(kW)
DAMCO Distribution Services, Inc. 10 40 $172,000 $1,720,000 2,000
Shippers Transport Express, Inc. 8 32 $172,000 $1,376,000 1,600
Progressive Transportation Services, Inc. 6 24 $172,000 $1,032,000 1,200
Overseas Freight, Inc. 6 24 $172,000 $1,032,000 1,200
Trans Ocean Carrier, Inc. 4 16 $197,000 $788,000 800
Quik Pick Express, LLC 3 12 $222,000 $666,000 600
Pac Anchor Transportation, Inc. 3 12 $222,000 $666,000 600
GST Transport, Inc. 2 8 $247,000 $494,000 400
Western Maritime Express, Inc. 2 8 $247,000 $494,000 400
Freight Horse Express, LLC 1 4 $272,000 $272,000 200
Sterling Express Services, Inc. 1 4 $272,000 $272,000 200
Custom Air Trucking, Inc. 1 4 $272,000 $272,000 200
Primo Express Line, Inc. 1 4 $272,000 $272,000 200
Calko Transport Company, Inc. 1 4 $272,000 $272,000 200
Sky Distribution Express, Inc. 1 4 $272,000 $272,000 200
Pierpoint Trans Line, Inc. 1 4 $272,000 $272,000 200
TOTAL 51 204 $10,172,000 10,200
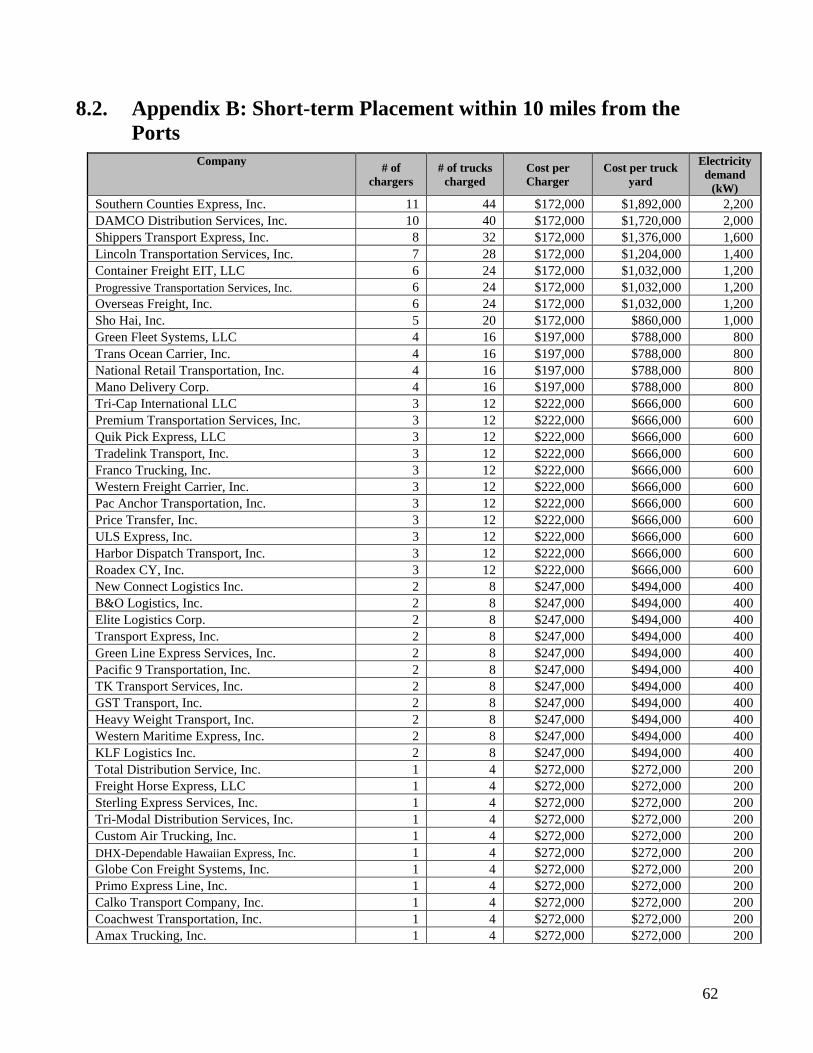
62
8.2. Appendix B: Short-term Placement within 10 miles from the
Ports
Company
# of
chargers
# of trucks
charged
Cost per
Charger
Cost per truck
yard
Electricity
demand
(kW)
Southern Counties Express, Inc. 11 44 $172,000 $1,892,000 2,200
DAMCO Distribution Services, Inc. 10 40 $172,000 $1,720,000 2,000
Shippers Transport Express, Inc. 8 32 $172,000 $1,376,000 1,600
Lincoln Transportation Services, Inc. 7 28 $172,000 $1,204,000 1,400
Container Freight EIT, LLC 6 24 $172,000 $1,032,000 1,200
Progressive Transportation Services, Inc. 6 24 $172,000 $1,032,000 1,200
Overseas Freight, Inc. 6 24 $172,000 $1,032,000 1,200
Sho Hai, Inc. 5 20 $172,000 $860,000 1,000
Green Fleet Systems, LLC 4 16 $197,000 $788,000 800
Trans Ocean Carrier, Inc. 4 16 $197,000 $788,000 800
National Retail Transportation, Inc. 4 16 $197,000 $788,000 800
Mano Delivery Corp. 4 16 $197,000 $788,000 800
Tri-Cap International LLC 3 12 $222,000 $666,000 600
Premium Transportation Services, Inc. 3 12 $222,000 $666,000 600
Quik Pick Express, LLC 3 12 $222,000 $666,000 600
Tradelink Transport, Inc. 3 12 $222,000 $666,000 600
Franco Trucking, Inc. 3 12 $222,000 $666,000 600
Western Freight Carrier, Inc. 3 12 $222,000 $666,000 600
Pac Anchor Transportation, Inc. 3 12 $222,000 $666,000 600
Price Transfer, Inc. 3 12 $222,000 $666,000 600
ULS Express, Inc. 3 12 $222,000 $666,000 600
Harbor Dispatch Transport, Inc. 3 12 $222,000 $666,000 600
Roadex CY, Inc. 3 12 $222,000 $666,000 600
New Connect Logistics Inc. 2 8 $247,000 $494,000 400
B&O Logistics, Inc. 2 8 $247,000 $494,000 400
Elite Logistics Corp. 2 8 $247,000 $494,000 400
Transport Express, Inc. 2 8 $247,000 $494,000 400
Green Line Express Services, Inc. 2 8 $247,000 $494,000 400
Pacific 9 Transportation, Inc. 2 8 $247,000 $494,000 400
TK Transport Services, Inc. 2 8 $247,000 $494,000 400
GST Transport, Inc. 2 8 $247,000 $494,000 400
Heavy Weight Transport, Inc. 2 8 $247,000 $494,000 400
Western Maritime Express, Inc. 2 8 $247,000 $494,000 400
KLF Logistics Inc. 2 8 $247,000 $494,000 400
Total Distribution Service, Inc. 1 4 $272,000 $272,000 200
Freight Horse Express, LLC 1 4 $272,000 $272,000 200
Sterling Express Services, Inc. 1 4 $272,000 $272,000 200
Tri-Modal Distribution Services, Inc. 1 4 $272,000 $272,000 200
Custom Air Trucking, Inc. 1 4 $272,000 $272,000 200
DHX-Dependable Hawaiian Express, Inc. 1 4 $272,000 $272,000 200
Globe Con Freight Systems, Inc. 1 4 $272,000 $272,000 200
Primo Express Line, Inc. 1 4 $272,000 $272,000 200
Calko Transport Company, Inc. 1 4 $272,000 $272,000 200
Coachwest Transportation, Inc. 1 4 $272,000 $272,000 200
Amax Trucking, Inc. 1 4 $272,000 $272,000 200

63
OSE Trucking, LLC 1 4 $272,000 $272,000 200
Edmunds Resources Management Corporation 1 4 $272,000 $272,000 200
Arrowlink USA, Inc. 1 4 $272,000 $272,000 200
Mainfreight, Inc. 1 4 $272,000 $272,000 200
RC Transportation, Inc. 1 4 $272,000 $272,000 200
United Global Express, Inc. 1 4 $272,000 $272,000 200
Long Beach Container Transport 1 4 $272,000 $272,000 200
Best Premium Logistics, Inc. 1 4 $272,000 $272,000 200
West Coast Container Services Inc. 1 4 $272,000 $272,000 200
World Logistics US Inc. 1 4 $272,000 $272,000 200
Hight Logistics, Inc. 1 4 $272,000 $272,000 200
Inet Trans, Inc. 1 4 $272,000 $272,000 200
Pacific Coast Cartage, Inc. 1 4 $272,000 $272,000 200
Sky Distribution Express, Inc. 1 4 $272,000 $272,000 200
Pierpoint Trans Line, Inc. 1 4 $272,000 $272,000 200
DDR Transport, Inc. 1 4 $272,000 $272,000 200
TOTAL 157 628 - $33,404,000 31,400

64
8.3. Appendix C: Short-Term Placement within 10 miles of the Ports
(Considering Grid Capacity)
Company
Electrici
ty
Demand
(kW)
Integrati
on
Capacity
(kW)
# of
Charge
rs
# of
Charge
rs (with
Grid)
# of
Trucks
Charge
d
Cost per
Charger
Cost per
Truck Yard Substation
Southern Counties Express, Inc. 2,200 0 11 0 0 $172,000 $0 Carson
DAMCO Distribution Services, Inc. 2,000 3,510 10 10 40 $172,000 $1,720,000 Watson
Shippers Transport Express, Inc. 1,600 0 8 0 0 $172,000 $0 Watson
Lincoln Transportation Services, Inc. 1,400 3,610 7 7 28 $172,000 $1,204,000 Jersey
Container Freight EIT, LLC 1,200 1,400 6 6 24 $172,000 $1,032,000 Sunnyside
Progressive Transportation Services, Inc. 1,200 1,720 6 6 24 $172,000 $1,032,000 State Street
Overseas Freight, Inc. 1,200 1,680 6 6 24 $172,000 $1,032,000 State Street
Sho Hai, Inc. 1,000 11,250 5 5 20 $172,000 $860,000 Nola
Green Fleet Systems, LLC 800 0 4 0 0 $197,000 $0 Carson
Trans Ocean Carrier, Inc. 800 1,710 4 4 16 $197,000 $788,000 State Street
National Retail Transportation, Inc. 800 0 4 0 0 $197,000 $0 Carson
Mano Delivery Corp. 800 4,470 4 4 16 $197,000 $788,000 Carson
Tri-Cap International LLC 600 4,860 3 3 12 $222,000 $666,000 Carson
Premium Transportation Services, Inc. 600 4,820 3 3 12 $222,000 $666,000 Carson
Quik Pick Express, LLC 600 2,920 3 3 12 $222,000 $666,000 Watson
Tradelink Transport, Inc. 600 0 3 0 0 $222,000 $0 Carson
Franco Trucking, Inc. 600 0 3 0 0 $222,000 $0 Alon
Western Freight Carrier, Inc. 600 4,850 3 3 12 $222,000 $666,000 Jersey
Pac Anchor Transportation, Inc. 600 4,190 3 3 12 $222,000 $666,000 State Street
Price Transfer, Inc. 600 0 3 0 0 $222,000 $0 Carson
ULS Express, Inc. 600 2,990 3 3 12 $222,000 $666,000 Cameron
Harbor Dispatch Transport, Inc. 600 0 3 0 0 $222,000 $0 Carson
Roadex CY, Inc. 600 0 3 0 0 $222,000 $0 La Fresa
New Connect Logistics Inc. 400 3,730 2 2 8 $247,000 $494,000 Jersey
B&O Logistics, Inc. 400 1,040 2 2 8 $247,000 $494,000 Nola
Elite Logistics Corp. 400 3,730 2 2 8 $247,000 $494,000 Carson
Transport Express, Inc. 400 3,660 2 2 8 $247,000 $494,000 Carson
Green Line Express Services, Inc. 400 3,420 2 2 8 $247,000 $494,000 Jersey
Pacific 9 Transportation, Inc. 400 0 2 0 0 $247,000 $0 Alon
TK Transport Services, Inc. 400 7,630 2 2 8 $247,000 $494,000 Carson
GST Transport, Inc. 400 1,680 2 2 8 $247,000 $494,000 State Street
Heavy Weight Transport, Inc. 400 0 2 0 0 $247,000 $0 Bowl
Western Maritime Express, Inc. 400 1,630 2 2 8 $247,000 $494,000 State Street
KLF Logistics Inc. 400 1,020 2 2 8 $247,000 $494,000 Nola
Total Distribution Service, Inc. 200 0 1 0 0 $272,000 $0 Sunnyside
Freight Horse Express, LLC 200 3,430 1 1 4 $272,000 $272,000 Neptune
Sterling Express Services, Inc. 200 3,700 1 1 4 $272,000 $272,000 Watson
Tri-Modal Distribution Services, Inc. 200 0 1 0 0 $272,000 $0 Alon
Custom Air Trucking, Inc. 200 2,730 1 1 4 $272,000 $272,000 Watson
DHX-Dependable Hawaiian Express, Inc. 200 8,270 1 1 4 $272,000 $272,000 Carson
Globe Con Freight Systems, Inc. 200 3,670 1 1 4 $272,000 $272,000 Carson
Primo Express Line, Inc. 200 2,330 1 1 4 $272,000 $272,000 Watson
Calko Transport Company, Inc. 200 1,500 1 1 4 $272,000 $272,000 Neptune
Coachwest Transportation, Inc. 200 3,610 1 1 4 $272,000 $272,000 Alon
Amax Trucking, Inc. 200 0 1 0 0 $272,000 $0 Carson
OSE Trucking, LLC 200 4,520 1 1 4 $272,000 $272,000 Nola
Edmunds Resources Management 200 0 1 0 0 $272,000 $0 Carson

65
Corporation
Arrowlink USA, Inc. 200 0 1 0 0 $272,000 $0 Jersey
Mainfreight, Inc. 200 6,090 1 1 4 $272,000 $272,000 Nola
RC Transportation, Inc. 200 0 1 0 0 $272,000 $0 Nola
United Global Express, Inc. 200 0 1 0 0 $272,000 $0 Neptune
Long Beach Container Transport 200 1,400 1 1 4 $272,000 $272,000 Sunnyside
Best Premium Logistics, Inc. 200 3,950 1 1 4 $272,000 $272,000 Carson
West Coast Container Services Inc. 200 0 1 0 0 $272,000 $0 Carson
World Logistics US Inc. 200 0 1 0 0 $272,000 $0 Alon
Hight Logistics, Inc. 200 580 1 1 4 $272,000 $272,000 Oldfield
Inet Trans, Inc. 200 700 1 1 4 $272,000 $272,000 Nola
Pacific Coast Cartage, Inc. 200 0 1 0 0 $272,000 $0 Fremont
Sky Distribution Express, Inc. 200 1,710 1 1 4 $272,000 $272,000 State Street
Pierpoint Trans Line, Inc. 200 1,490 1 1 4 $272,000 $272,000 Neptune
DDR Transport, Inc. 200 3,990 1 1 4 $272,000 $272,000 Nola
TOTAL 31,400 - 157 101 404 - $21,522,000 -

66
8.4. Appendix D: Short-term Emission Reduction
The following two equations were used to calculate emission reductions due to electric truck conversion:
Emission reduction (replacing diesel truck) [metric tons/year] = T x PD x (VMT/day) x
(operational days per year)10
x [EFD – EFE]
Where T = total number of electric trucks supported with charging station placement
PD = proportion of the current fleet that is diesel
EFD = diesel heavy-duty truck emission factor [metric tons per mile]
EFE = electric heavy-duty truck emission factor [metric tons per mile]
Emission reduction (replacing LNG truck) = T x PLNG x (VMT/day) x (operational days per year)
x [EFLNG – EFE]
Where PLNG = proportion of the current fleet that is LNG
EFLNG = LNG heavy-duty truck emission factor [metric tons per mile]
The emission factors used to calculate reductions can be found in Figure 19 above. Natural gas
combustion CO2 emissions was found by multiplying diesel fuel CO2 emission factor by the
following conversion factor:
Diesel fuel CO2 emission = 161.30 grams/million BTU11
Natural gas CO2 emission = 117.00 grams/million BTU
Conversion factor = CO2 emission factor/Natural gas emission emission factor = 72.5%
● Short-term Placement within 5 miles from the ports
○ CO2: 204 trucks x 238 miles/day x 312 operation days/year x 0.95 x (1561.70
grams/mile - 0 grams/mile) + 238 miles/day x 312 days/year x 0.05 x (1,132.79
grams/mile - 0 grams/mile) = 23,332.12 metric tons per year
○ NOx: 204 trucks x 238 miles/day x 312 operation days/year x 0.95 x (1.508
grams/mile - 0 grams/mile) + 238 miles/day x 312 days/year x 0.05 x (0.1508
grams/mile - 0 grams/mile) = 21.82 metric tons per year
○ PM2.5: 204 trucks x 238 miles per day x 312 days/year x 0.95 x (0.007
grams/mile - 0 grams/mile) + 204 trucks x 238 miles x 312 days/year x 0.05 x
(0.00588 grams/mile - 0 grams/mile) = 0.11 metric tons per year
10
We assume drayage trucks operate six days a week, 312 days per year. 11
Source: US Energy Information Administration, 2016.
67
● Short-term Placement within 10 miles from the ports
○ CO2: 628 trucks x 238 miles/day * 312 days/year x 0.95 x (1,561.70 grams/mile -
0 grams/mile) + 628 trucks x 238 miles x 365 x 0.05 x (1,132.79 grams/mile - 0
grams/mile) = 71,826.33 metric tons per year
○ NOx: 628 trucks x 238 miles/day x 312 days/year x 0.95 x (1.508 grams/mile - 0
grams/mile) + 628 trucks x 238 miles x 312 days/year x 0.05 x (0.1508
grams/mile - 0 grams/mile) = 67.16 metric tons per year
○ PM2.5: 628 trucks x 238 miles/day x 312 operation days/year x 0.95 x (0.007
grams/mile - 0 grams/mile)+ 628 trucks x 238 miles x 312 days/year x 0.05 x
(0.00588 grams/mile - 0 grams/mile) = 0.32 metric tons per year
● Short-term Placement within 10 miles from the Ports (Considering grid capacity)
○ CO2: 404 trucks x 238 miles/day x 312 days/year x 0.95 x (0.202 grams/mile - 0
grams/mile)+ 404 trucks x 238 miles x 312 days/year x 0.05 x (0.0101 grams/mile
- 0 grams/mile) = 46,206.75 metric tons per year
○ NOx: 404 trucks x 238 miles/day x 312 days/year x 0.95 x (1.508 grams/mile - 0
grams/mile)+ 404 trucks x 238 miles x 312 days/year x 0.05 x (0.1508 grams/mile
- 0 grams/mile) = 43.20 metric tons per year
○ PM2.5: 404 trucks x 238 miles/day x 312 days/year x 0.95 x (0.007 grams/mile - 0
grams/mile)+ 404 trucks x 238 miles x 312 days/year x 0.05 x (0.00588
grams/mile - 0 grams/mile) = 0.21 metric tons per year
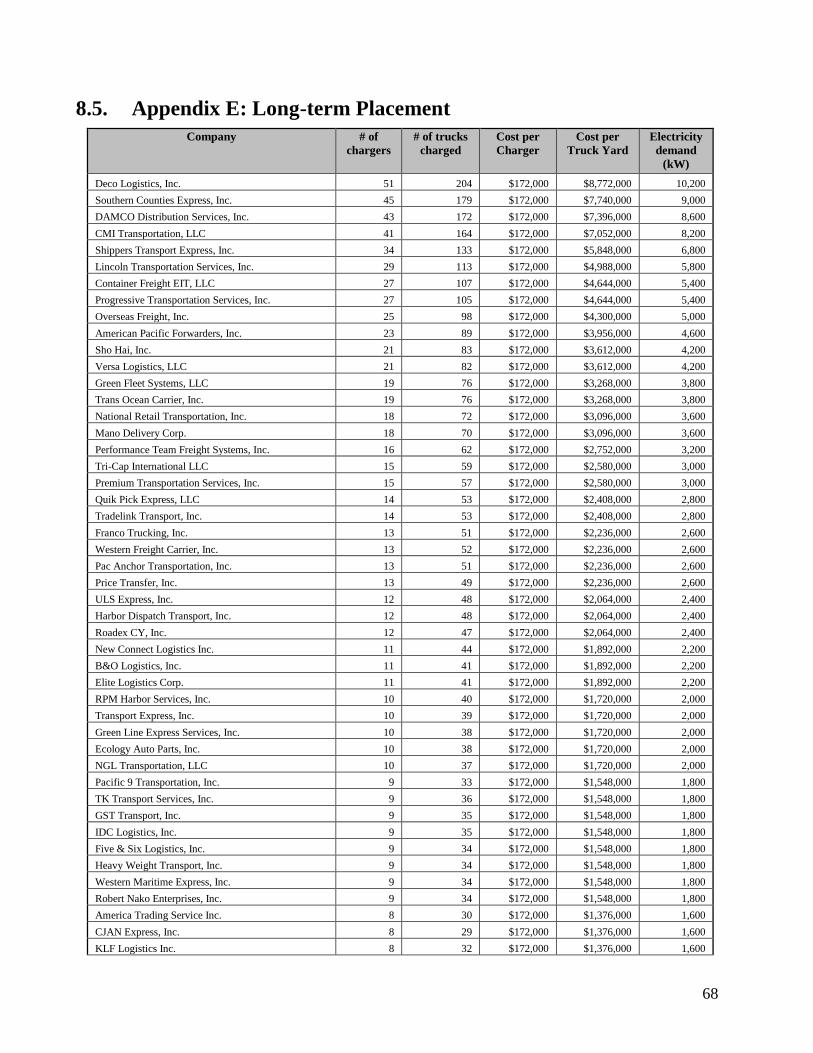
68
8.5. Appendix E: Long-term Placement
Company # of
chargers
# of trucks
charged
Cost per
Charger
Cost per
Truck Yard
Electricity
demand
(kW)
Deco Logistics, Inc. 51 204 $172,000 $8,772,000 10,200
Southern Counties Express, Inc. 45 179 $172,000 $7,740,000 9,000
DAMCO Distribution Services, Inc. 43 172 $172,000 $7,396,000 8,600
CMI Transportation, LLC 41 164 $172,000 $7,052,000 8,200
Shippers Transport Express, Inc. 34 133 $172,000 $5,848,000 6,800
Lincoln Transportation Services, Inc. 29 113 $172,000 $4,988,000 5,800
Container Freight EIT, LLC 27 107 $172,000 $4,644,000 5,400
Progressive Transportation Services, Inc. 27 105 $172,000 $4,644,000 5,400
Overseas Freight, Inc. 25 98 $172,000 $4,300,000 5,000
American Pacific Forwarders, Inc. 23 89 $172,000 $3,956,000 4,600
Sho Hai, Inc. 21 83 $172,000 $3,612,000 4,200
Versa Logistics, LLC 21 82 $172,000 $3,612,000 4,200
Green Fleet Systems, LLC 19 76 $172,000 $3,268,000 3,800
Trans Ocean Carrier, Inc. 19 76 $172,000 $3,268,000 3,800
National Retail Transportation, Inc. 18 72 $172,000 $3,096,000 3,600
Mano Delivery Corp. 18 70 $172,000 $3,096,000 3,600
Performance Team Freight Systems, Inc. 16 62 $172,000 $2,752,000 3,200
Tri-Cap International LLC 15 59 $172,000 $2,580,000 3,000
Premium Transportation Services, Inc. 15 57 $172,000 $2,580,000 3,000
Quik Pick Express, LLC 14 53 $172,000 $2,408,000 2,800
Tradelink Transport, Inc. 14 53 $172,000 $2,408,000 2,800
Franco Trucking, Inc. 13 51 $172,000 $2,236,000 2,600
Western Freight Carrier, Inc. 13 52 $172,000 $2,236,000 2,600
Pac Anchor Transportation, Inc. 13 51 $172,000 $2,236,000 2,600
Price Transfer, Inc. 13 49 $172,000 $2,236,000 2,600
ULS Express, Inc. 12 48 $172,000 $2,064,000 2,400
Harbor Dispatch Transport, Inc. 12 48 $172,000 $2,064,000 2,400
Roadex CY, Inc. 12 47 $172,000 $2,064,000 2,400
New Connect Logistics Inc. 11 44 $172,000 $1,892,000 2,200
B&O Logistics, Inc. 11 41 $172,000 $1,892,000 2,200
Elite Logistics Corp. 11 41 $172,000 $1,892,000 2,200
RPM Harbor Services, Inc. 10 40 $172,000 $1,720,000 2,000
Transport Express, Inc. 10 39 $172,000 $1,720,000 2,000
Green Line Express Services, Inc. 10 38 $172,000 $1,720,000 2,000
Ecology Auto Parts, Inc. 10 38 $172,000 $1,720,000 2,000
NGL Transportation, LLC 10 37 $172,000 $1,720,000 2,000
Pacific 9 Transportation, Inc. 9 33 $172,000 $1,548,000 1,800
TK Transport Services, Inc. 9 36 $172,000 $1,548,000 1,800
GST Transport, Inc. 9 35 $172,000 $1,548,000 1,800
IDC Logistics, Inc. 9 35 $172,000 $1,548,000 1,800
Five & Six Logistics, Inc. 9 34 $172,000 $1,548,000 1,800
Heavy Weight Transport, Inc. 9 34 $172,000 $1,548,000 1,800
Western Maritime Express, Inc. 9 34 $172,000 $1,548,000 1,800
Robert Nako Enterprises, Inc. 9 34 $172,000 $1,548,000 1,800
America Trading Service Inc. 8 30 $172,000 $1,376,000 1,600
CJAN Express, Inc. 8 29 $172,000 $1,376,000 1,600
KLF Logistics Inc. 8 32 $172,000 $1,376,000 1,600

69
JVC Truck Lines, Inc. 8 31 $172,000 $1,376,000 1,600
Total Distribution Service, Inc. 8 30 $172,000 $1,376,000 1,600
Henean Trucking, Inc. 7 27 $172,000 $1,204,000 1,400
Freight Horse Express, LLC 7 28 $172,000 $1,204,000 1,400
Sterling Express Services, Inc. 7 26 $172,000 $1,204,000 1,400
Tri-Modal Distribution Services, Inc. 7 25 $172,000 $1,204,000 1,400
Custom Air Trucking, Inc. 6 24 $172,000 $1,032,000 1,200
DHX-Dependable Hawaiian Express, Inc. 6 24 $172,000 $1,032,000 1,200
Globe Con Freight Systems, Inc. 6 24 $172,000 $1,032,000 1,200
Primo Express Line, Inc. 6 24 $172,000 $1,032,000 1,200
Calko Transport Company, Inc. 6 24 $172,000 $1,032,000 1,200
Coachwest Transportation, Inc. 6 23 $172,000 $1,032,000 1,200
National Distribution Centers LLC 6 22 $172,000 $1,032,000 1,200
Amax Trucking, Inc. 6 22 $172,000 $1,032,000 1,200
Phoenix PDQ, Inc. 6 22 $172,000 $1,032,000 1,200
Global Freight Services, Inc. 6 22 $172,000 $1,032,000 1,200
OSE Trucking, LLC 5 18 $172,000 $860,000 1,000
Edmunds Resources Management Corporation 5 20 $172,000 $860,000 1,000
All Ports Logistics, Inc. 5 20 $172,000 $860,000 1,000
Arrowlink USA, Inc. 5 19 $172,000 $860,000 1,000
Cano Logistics, Inc. 5 19 $172,000 $860,000 1,000
Mainfreight, Inc. 5 19 $172,000 $860,000 1,000
East Coast Transport, Inc. 5 17 $172,000 $860,000 1,000
RC Transportation, Inc. 5 17 $172,000 $860,000 1,000
Gateway Logistics LLC 5 17 $172,000 $860,000 1,000
United Global Express, Inc. 4 15 $197,000 $788,000 800
Long Beach Container Transport 4 15 $197,000 $788,000 800
Best Premium Logistics, Inc. 4 14 $197,000 $788,000 800
West Coast Container Services Inc. 4 16 $197,000 $788,000 800
La Canada Logistics, Inc. 4 16 $197,000 $788,000 800
Aracely Tapia Hernandez 4 16 $197,000 $788,000 800
Online Trucking, Inc. 4 16 $197,000 $788,000 800
World Logistics US Inc. 4 16 $197,000 $788,000 800
Hight Logistics, Inc. 4 16 $197,000 $788,000 800
Three Rivers Trucking 4 16 $197,000 $788,000 800
Precise Transport, Inc. 4 16 $197,000 $788,000 800
Fox Transportation, Inc. 4 15 $197,000 $788,000 800
Inet Trans, Inc. 4 15 $197,000 $788,000 800
Inter-City Delivery Service 4 15 $197,000 $788,000 800
Pacific Coast Cartage, Inc. 4 14 $197,000 $788,000 800
Sky Distribution Express, Inc. 4 14 $197,000 $788,000 800
Pierpoint Trans Line, Inc. 4 14 $197,000 $788,000 800
DDR Transport, Inc. 4 14 $197,000 $788,000 800
Green Trucking LLC 4 14 $197,000 $788,000 800
Talon Logistics, Inc. 4 14 $197,000 $788,000 800
CY Logistics, Inc. 4 14 $197,000 $788,000 800
Seldat Distribution, Inc. 4 14 $197,000 $788,000 800
CTC Logistics, LLC 4 14 $197,000 $788,000 800
G&D Transportation 4 13 $197,000 $788,000 800
Topland Trucking, Inc. 4 13 $197,000 $788,000 800
Dependable Freight & Container Transport, Inc. 4 13 $197,000 $788,000 800

70
Silver Point Trucking, Inc. 4 13 $197,000 $788,000 800
Estenson Logistics, LLC 3 12 $222,000 $666,000 600
A.J. Transport Inc. 3 12 $222,000 $666,000 600
Union County Transport, Inc. 3 12 $222,000 $666,000 600
Starling Freight, Inc. 3 12 $222,000 $666,000 600
Great Central Transport, Inc. 3 12 $222,000 $666,000 600
Cargo Logistics Services, Inc. 3 11 $222,000 $666,000 600
Freight Advisor Corp. 3 10 $222,000 $666,000 600
Prime Trans, Inc. 3 10 $222,000 $666,000 600
Global Transport Enterprise, Inc. 3 9 $222,000 $666,000 600
Main Street Fibers, Inc. 3 9 $222,000 $666,000 600
Atlas Marine, Inc. 3 12 $222,000 $666,000 600
Nova Transportation Services, Inc. 3 12 $222,000 $666,000 600
Tiptop Express, Inc. 3 12 $222,000 $666,000 600
Pier West Transportation, Inc. 3 11 $222,000 $666,000 600
KCC Global Logistics, Inc. 3 11 $222,000 $666,000 600
MTL Express, LLC 3 11 $222,000 $666,000 600
A Speed Transportation, Inc. 3 11 $222,000 $666,000 600
Arms Trans, Inc. 3 11 $222,000 $666,000 600
Golden State Express, Inc. 3 11 $222,000 $666,000 600
Sunflower Transport, Inc. 3 10 $222,000 $666,000 600
CR&R, Inc. 3 10 $222,000 $666,000 600
Westcoast Trucking, Inc. 3 10 $222,000 $666,000 600
MASA Trucking Co. 3 10 $222,000 $666,000 600
Stream Links Express, Inc. 3 10 $222,000 $666,000 600
ACI Trucking, Inc. 3 9 $222,000 $666,000 600
Ventura Transfer Company 3 9 $222,000 $666,000 600
A.D.D. Distribution 3 9 $222,000 $666,000 600
Eagle Freight Express, Inc. 3 9 $222,000 $666,000 600
Alpha Total Solutions, Inc. 3 9 $222,000 $666,000 600
Cal-West Express Co., LTD 3 9 $222,000 $666,000 600
Shoreline Transportation, Inc. 3 9 $222,000 $666,000 600
Weber Distribution, LLC 3 9 $222,000 $666,000 600
Goldenrod Equipment 3 9 $222,000 $666,000 600
Progressive Freight Systems, Inc. 3 9 $222,000 $666,000 600
Vinamar, Inc. 3 9 $222,000 $666,000 600
A-1 Trucking, Inc. 3 9 $222,000 $666,000 600
Commercial Cartage, Inc. 3 9 $222,000 $666,000 600
Pacific Global Consolidators 3 9 $222,000 $666,000 600
Krisda, Inc. 3 9 $222,000 $666,000 600
Leon's Freight Services, Inc. 2 8 $247,000 $494,000 400
Oak Transport, Inc. 2 8 $247,000 $494,000 400
Schafer Bros. Transfer & Piano Movers, Inc. 2 8 $247,000 $494,000 400
Uni Trans, LLC 2 8 $247,000 $494,000 400
LJ Express, Inc. 2 8 $247,000 $494,000 400
Aerologic, Inc. 2 7 $247,000 $494,000 400
Torres Container Connection 2 6 $247,000 $494,000 400
GG Express, Inc. 2 6 $247,000 $494,000 400
Long Beach Trucking, Inc. 2 6 $247,000 $494,000 400
Pactrans, LLC 2 6 $247,000 $494,000 400
Hot Wheels Trucking, Inc. 2 6 $247,000 $494,000 400

71
Union Express, Inc. 2 6 $247,000 $494,000 400
Orbit Int'l, Inc. 2 6 $247,000 $494,000 400
IMAGE Transport 2 6 $247,000 $494,000 400
Vasquez Trucking, Inc. 2 5 $247,000 $494,000 400
ASAP Trucking, Inc. 2 5 $247,000 $494,000 400
Whisk Logistics, LLC 2 8 $247,000 $494,000 400
J&M Zalez Transportation, LLC 2 8 $247,000 $494,000 400
Door 2 Door Transport, Inc. 2 8 $247,000 $494,000 400
United Logistic Services Group, Inc. 2 8 $247,000 $494,000 400
Sassy Trucking Co. 2 8 $247,000 $494,000 400
Valueplus Transportation, Inc. 2 8 $247,000 $494,000 400
E&J TL Corp. 2 8 $247,000 $494,000 400
Total Trucking Services, Inc. 2 8 $247,000 $494,000 400
States Logistics Services, Inc. 2 8 $247,000 $494,000 400
Unique Freight Transport, Inc. 2 8 $247,000 $494,000 400
High Quality Express, Inc. 2 8 $247,000 $494,000 400
MDB Transportation, Inc. 2 8 $247,000 $494,000 400
Fargo Trucking Company, Inc. 2 8 $247,000 $494,000 400
LMD Integrated Logistic Services, Inc. 2 8 $247,000 $494,000 400
HBC Distributors, Inc. 2 8 $247,000 $494,000 400
SPE Equities, LLC 2 7 $247,000 $494,000 400
Dynamic Express, Inc. 2 7 $247,000 $494,000 400
Monk Transportation, LTD. 2 7 $247,000 $494,000 400
California Intermodal Associates, Inc. 2 7 $247,000 $494,000 400
Latin American Carriers, Inc. 2 7 $247,000 $494,000 400
Scrap Hauling, Inc. 2 7 $247,000 $494,000 400
JST Systems, Inc. 2 7 $247,000 $494,000 400
All United Transport, Inc. 2 7 $247,000 $494,000 400
Nexus Pacific Transport 2 7 $247,000 $494,000 400
Future International, Inc. 2 7 $247,000 $494,000 400
Max Express, Inc. 2 7 $247,000 $494,000 400
DWC Transportation Services, LLC 2 7 $247,000 $494,000 400
Tang Logistics 2 7 $247,000 $494,000 400
LBC Logistics LLC 2 6 $247,000 $494,000 400
Absolute Freight, Inc. 2 6 $247,000 $494,000 400
Golden State Drayage Company 2 6 $247,000 $494,000 400
3T Holding, Inc. 2 6 $247,000 $494,000 400
GS Express Logistics, LLC 2 6 $247,000 $494,000 400
Kargo Transportation, Inc. 2 6 $247,000 $494,000 400
William's Logistics, Inc. 2 5 $247,000 $494,000 400
Los Angeles Superior Transportation, Inc. 2 5 $247,000 $494,000 400
James Cass 2 5 $247,000 $494,000 400
Bestway Recycling Co., Inc. 2 5 $247,000 $494,000 400
Jess Diaz Trucking, Inc. 2 5 $247,000 $494,000 400
Konaian, Inc. 2 5 $247,000 $494,000 400
Orion Freight Services, Inc. 2 5 $247,000 $494,000 400
Cloud Trucking, Inc. 2 5 $247,000 $494,000 400
Marosi, Inc. 2 5 $247,000 $494,000 400
GD Trans, Inc. 2 5 $247,000 $494,000 400
Metro Worldwide, Inc. 2 5 $247,000 $494,000 400
DLS International Services, LLC 2 5 $247,000 $494,000 400

72
Chady Express Corporation 2 5 $247,000 $494,000 400
Harvest Global International, Inc. 2 5 $247,000 $494,000 400
Tristate Logistics Company, LLC 2 5 $247,000 $494,000 400
Anova Transport Group LLC 2 5 $247,000 $494,000 400
Joaquin Menjivar Cruz 2 5 $247,000 $494,000 400
Pace Freight Systems 1 4 $272,000 $272,000 200
Jaspem Truck Line, Inc. 1 4 $272,000 $272,000 200
Pacific National Transportation Corp. 1 4 $272,000 $272,000 200
F.R.T. International, Inc. 1 4 $272,000 $272,000 200
Elite Lighting Corp. 1 4 $272,000 $272,000 200
Western Pacific Pulp & Paper 1 4 $272,000 $272,000 200
GB Trucking, Inc. 1 4 $272,000 $272,000 200
TOTAL 1313 4941 - $245,208,000 262,600

73
Appendix G: High VMT Ranking for Long-term Placement (SCE
Territory) *Calculated and located by the centroid of each TAZ
Rank Total VMT / Day TAZ City County
1 14,564 21359000 Unincorporated Los Angeles County
2 13,426 22278000 Unincorporated Los Angeles County
3 12,729 21357000 Carson Los Angeles County
4 12,242 21363000 Unincorporated Los Angeles County
5 11,575 53704000 Fontana San Bernardino County
6 10,803 53834000 Redlands San Bernardino County
7 10,115 53615000 Chino San Bernardino County
8 9,703 43312000 Perris Riverside County
9 9,637 43181000 Corona Riverside County
10 9,623 21731000 Commerce Los Angeles County
11 9,584 21355000 Carson Los Angeles County
12 9,390 53929000 Victorville San Bernardino County
13 9,344 53692000 Rancho Cucamonga San Bernardino County
14 8,865 21362000 Carson Los Angeles County
15 8,659 21495000 Unincorporated Los Angeles County
16 8,591 60002000 Unincorporated Ventura County
17 8,537 21358000 Unincorporated Los Angeles County
18 7,860 53662000 Ontario San Bernardino County
19 7,637 53687000 Ontario San Bernardino County
20 7,142 21530000 Compton Los Angeles County
21 6,984 53630000 Chino San Bernardino County
22 6,838 53706000 Unincorporated San Bernardino County
23 6,720 21369000 Long Beach Los Angeles County
24 6,713 53613000 Chino San Bernardino County
25 6,682 53699000 Ontario San Bernardino County
26 6,664 53694000 Rancho Cucamonga San Bernardino County
27 6,361 53674000 Rancho Cucamonga San Bernardino County
28 6,353 43144000 Jurupa Valley Riverside County
29 6,126 22414000 Pomona Los Angeles County
30 6,113 43264000 Moreno Valley Riverside County
31 6,080 53702000 Rancho Cucamonga San Bernardino County
32 6,000 53685000 Ontario San Bernardino County
33 5,820 21702000 Commerce Los Angeles County
34 5,658 21745000 Montebello Los Angeles County
35 5,644 53680000 Rancho Cucamonga San Bernardino County
36 5,587 43277000 Moreno Valley Riverside County
37 5,459 21724000 Commerce Los Angeles County
38 5,344 53675000 Rancho Cucamonga San Bernardino County
39 5,311 21312000 Unincorporated Los Angeles County
40 5,295 53713000 Fontana San Bernardino County
41 5,257 21872000 Santa Fe Springs Los Angeles County
42 4,866 53700000 Rancho Cucamonga San Bernardino County
43 4,722 21739000 Commerce Los Angeles County
44 4,469 53721000 Fontana San Bernardino County
45 4,396 53741000 Rialto San Bernardino County
46 4,336 43125000 Jurupa Valley Riverside County
47 4,255 60056000 Unincorporated Ventura County
48 4,077 53715000 Unincorporated San Bernardino County

74
49 4,040 53708000 Unincorporated San Bernardino County
50 4,021 53696000 Rancho Cucamonga San Bernardino County
51 3,801 21695000 South Gate Los Angeles County
52 3,794 21852000 Santa Fe Springs Los Angeles County
53 3,693 21740000 Commerce Los Angeles County
54 3,688 53753000 Rialto San Bernardino County
55 3,653 21227000 Gardena Los Angeles County
56 3,610 21843000 Santa Fe Springs Los Angeles County
57 3,594 21169000 Inglewood Los Angeles County
58 3,587 21496000 Carson Los Angeles County
59 3,550 53686000 Ontario San Bernardino County
60 3,511 60070000 Oxnard Ventura County
61 3,457 32917000 Santa Ana Orange County
62 3,428 21865000 Whittier Los Angeles County
63 3,377 22300000 La Puente Los Angeles County
64 3,357 21621000 Compton Los Angeles County
65 3,345 22213000 El Monte Los Angeles County
66 3,309 53771000 San Bernardino San Bernardino County
67 3,296 21714000 South Gate Los Angeles County
68 3,272 60049000 Santa Paula Ventura County
69 3,222 21734000 Commerce Los Angeles County
70 3,157 53698000 Ontario San Bernardino County
71 3,129 32479000 Buena Park Orange County
72 3,098 53663000 Ontario San Bernardino County
73 3,084 20225000 Unincorporated Los Angeles County
74 3,077 53688000 Rancho Cucamonga San Bernardino County
75 3,039 53619000 Montclair San Bernardino County
76 2,960 21381000 Long Beach Los Angeles County
77 2,949 60092000 Oxnard Ventura County
78 2,947 21569000 Compton Los Angeles County
79 2,941 33082000 Irvine Orange County
80 2,875 21353000 Carson Los Angeles County
81 2,854 53761000 San Bernardino San Bernardino County
82 2,814 21597000 Compton Los Angeles County
83 2,755 22420000 Pomona Los Angeles County
84 2,707 53825000 Redlands San Bernardino County
85 2,694 21445000 Long Beach Los Angeles County
86 2,627 53653000 Ontario San Bernardino County
87 2,600 53621000 Chino San Bernardino County
88 2,580 53644000 Chino San Bernardino County
89 2,555 53652000 Ontario San Bernardino County
90 2,544 53711000 Unincorporated San Bernardino County
91 2,452 21443000 Long Beach Los Angeles County
92 2,355 21339000 Carson Los Angeles County
93 2,281 21623000 Compton Los Angeles County
94 2,208 53773000 San Bernardino San Bernardino County
95 2,206 43320000 Perris Riverside County
96 2,191 21795000 Pico Rivera Los Angeles County
97 2,174 53717000 Fontana San Bernardino County
98 2,157 21759000 Paramount Los Angeles County
99 2,129 53710000 Fontana San Bernardino County
100 2,107 21791000 Downey Los Angeles County

75
Appendix F: Long-term Emission Reduction
● Long-term Placement
○ CO2: 4,941 trucks x 238 miles/day x 312 days/year x 0.95 x (1,561.70 grams/mile
- 0 grams/mile)+ 4,941 trucks x 238 miles x 312 days/year x 0.05 x
(1,132.79grams/mile - 0 grams/mile) = 565,117.66 metric tons per year
○ NOx: 4,941 trucks x 238 miles/day x 312 days/year x 0.95 x (1.508 grams/mile - 0
grams/mile)+ 4,941 trucks x 238 miles x 312 days/year x 0.05 x (0.1508
grams/mile - 0 grams/mile) = 528.39 metric tons per year
○ PM2.5: 4,941 trucks x 238 miles/day x 312 days/year x 0.95 x (0.007 grams/mile -
0 grams/mile)+ 4,941 trucks x 238 miles x 312 days/year x 0.05 x (0.00588
grams/mile - 0 grams/mile) = 2.55 metric tons per year

76
9. References Brugge D., Durant J. L., Rioux C. 2007. “Near-Highway Pollutants in Motor Vehicle Exhaust: A Review of
Epidemiologic Evidence of Cardiac and Pulmonary Health Risks.” Environmental Health 6 (1): 1–12.
BTCPower (n.d.). 150kW-350kW DCFC - BTCPower. Retrieved March 14, 2019, from
http://www.btcpower.com/index.php?action=150kw_350kw
California Air Resources Board. (2017). Emission Factor (EMFAC) model. Retrieved from
https://www.arb.ca.gov/emfac/2017/
CalEPA (2018). SB 535 ArcGIS Geodatabase [geodatabase]. Retrieved March 1, 2019, from
https://calepa.ca.gov/envjustice/ghginvest/
California Department of General Services (2014, January). Electric Vehicle Supply Equipment Guidance
Document. Retrieved March 16, 2019, from
https://www.documents.dgs.ca.gov/resd/pubs/EVSEGuidanceDocument012814.pdf
California Open Data (2016). CA County Boundaries[shapefile]. Retrieved December 14,2019, from
https://data.ca.gov/dataset/ca-geographic-boundaries/resource/091ff50d-bb24-4537-a974-2ce89c6e8663
Caltrans (n.d.). Weight Limitation. CA.gov. Retrieved March 16, 2019, from
http://www.dot.ca.gov/trafficops/trucks/weight.html
Caltrans (June 13, 2018). Truck Network(2018) [shapefile]. Retrieved December 14, 2018, from
http://www.dot.ca.gov/hq/tsip/gis/datalibrary/Metadata/Trknet.html
Center for Sustainable Energy (n.d.). Southern California Incentive Project (SCIP). Retrieved March 16, 2019, from
https://calevip.org/incentive-project/southern-california
CGR Management Consultants LLC (2007, March 26). A SURVEY OF DRAYAGE DRIVERS SERVING THE
SAN PEDRO BAY PORTS. Port of Long Beach. Retrieved March 16, 2019, from
http://www.polb.com/civica/filebank/blobdload.asp?BlobID=3724
CGR Management Consultants LLC (2007, March). A survey of Drayage Drivers Serving the San Pedro Bay Ports,
Page 14
S. Chandler, S., Espino, J., O’Dea, J. (2017). Delivering Opportunity: How Electric Buses and Trucks Can Create
Jobs and Improve Public Health in California. Union of Concerned Scientists, 1-51
City of Long Beach Department of Health and Human Services (2013). “Health Statistics 2010.” 2013. City of Long
Beach Department of Health and Human Services. Retrieved March 15, 2019, from
http://www.longbeach.gov/globalassets/health/media-library/documents/planning-and-
research/reports/2010-health-statistics/2010-health-statistics
Clark, Krissy (2012, January 18). Cleaner Air In L.A. Ports Comes At A Cost To Truckers: NPR. Retrieved March
16, 2019, from https://www.npr.org/2012/01/18/145338359/cleaner-air-in-l-a-ports-comes-at-a-cost-to-
truckers
CPUC (2018, June 6). DECISION ON THE TRANSPORTATION ELECTRIFICATION STANDARD REVIEW
PROJECTS. CA.gov. Retrieved March 15, 2019, from
http://docs.cpuc.ca.gov/PublishedDocs/Published/G000/M214/K985/214985772.PDF
Daimler (n. d.). E-Mobility Group and two electric trucks for the US market. - Daimler. Retrieved March 14, 2019,
from https://www.daimler.com/products/trucks/freightliner/e-mobility-group.html

77
EV Safe Charge Inc. (n.d.). DC Fast Charging Explained. Retrieved from https://evsafecharge.com/dc-fast-charging-
explained/
EPA (2008, October). Average In-Use Emissions from Heavy-Duty Trucks. The EPA National Library Catalog.
Retrieved March 16, 2019, from
https://nepis.epa.gov/Exe/ZyPDF.cgi/P100EVY6.PDF?Dockey=P100EVY6.PDF
EPA (n.d.). Draft A Ports Primer for Communities 2016. United States Environmental Protection Agency. Retrieved
March 15, 2019, from https://nepis.epa.gov/Exe/ZyPDF.cgi?Dockey=P100P1UQ.pdf
EPA (2019, February 11). Vehicle Weight Classifications for the Emission Standards Reference Guide. Retrieved
from https://www.epa.gov/emission-standards-reference-guide/vehicle-weight-classifications-emission-
standards-reference-guide
Esri (2019, March 13). World Topographic Map[basemap]. Retrieved March 19, 2019, from
https://www.arcgis.com/home/item.html?id=30e5fe3149c34df1ba922e6f5bbf808f
Geofabrik. (2018).OpenStreetMap Northern California [shapefile]. Retrieved November 26, 2018, from
http://download.geofabrik.de/north-america/us/california.html
Guerin, Emily (2017, March 13). Slideshow: How local ports reduced pollution but lost trust among truck drivers
along the way. KPCC. Retrieved March 16, 2019, from https://www.scpr.org/news/2017/03/13/69667/how-
local-ports-reduced-pollution-but-lost-trust-a/
Houston Douglas, Hu Jun, Ong Paul, Winer Arthur. 2004. “Structural Disparities of Urban Traffic in Southern
California.” Journal of Urban Affairs 26 (5): 565–92.
Husing, J.E., Brightbill, T. E, Crosby, P.A. (2007). San Pedro Bay Ports Clean Air Action Plan - Economic
Analysis: Proposed Clean Truck Program. Economics & Politics, Inc. Redlands, CA, USA. CGR
Management Consultants, LLC, Los Angeles, CA, USA
LA Healthy (n.d.). “Health Profiles – Harbor Gateway.” Plan for a Healthy Los Angeles. Retrieved March 15, 2019,
from http://healthyplan.la/interactive/neighborhoods/#id=11
Lee, Henry and Clark, Alex (2018, September). Charging the Future: Challenges and Opportunities for Electric
Vehicle Adoption. HKS Faculty Research Working Paper Series. Retrieved March 16, 2019, from
https://projects.iq.harvard.edu/files/energyconsortium/files/rwp18-026_lee_1.pdf
Manville, M., & Goldman, E. (2018). Would Congestion Pricing Harm the Poor? Do Free Roads Help the Poor?
Journal of Planning Education and Research, 38(3), 329–344. https://doi.org/10.1177/0739456X17696944
Nero, Edward Mark (2018, November 23). LA, Long Beach ports poised to give up to $100,000 each to truck
drivers for cleaner rigs. Press Telegram. Retrieved March 16, 2019, from
https://www.presstelegram.com/2018/11/23/la-long-beach-ports-poised-to-give-up-to-100000-each-to-
truck-drivers-for-cleaner-rigs/
Office of Governor (2018, January 26). Governor Brown Takes Action to Increase Zero-Emission Vehicles, Fund
New Climate Investments. CA.gov. Retrieved March 16, 2019, from
https://www.ca.gov/archive/gov39/2018/01/26/governor-brown-takes-action-to-increase-zero-emission-
vehicles-fund-new-climate-investments/index.html
Rentar Environmental Solutions, Inc. (2017, December 21). The MPG of Diesel Trucks Largely Unknown. And,
Varies Greatly Based on a Number of Factors. Retrieved March 19, 2019, from https://rentar.com/diesel-
truck-miles-per-gallon-mpg/.

78
South Coast Air Quality Management District (2012). “Multiple Air Toxics Exposure Study in the South Coast Air
Basin, MATES IV.”
South Coast Air Quality Management District (2013) “Air Quality Management Plan 2012: Appendix IV-A. Page
IV-A-37. http://www.aqmd.gov/docs/default-source/clean-air-plans/air-quality-management-plans/2012-
air-quality-management-plan/final-2012-aqmp-(february-2013)/appendix-iv-(a)-final-2012.pdf
South Coast Air Quality Management District (2015). “2016 Air Quality Management Plan: Goods Movement
White Paper.” Pages 7 and 8. www.aqmd.gov/docs/default-source/Agendas/aqmp/white-paper-working-
groups/wp-goodsmvmt-final.pdf?sfvrsn=2
South Coast Air Quality Management District (2017, March). “Final 2016 Air Quality Management Plan,”South
Coast Air Quality Management District. Retrieved March 16, 2019, from
http://www.aqmd.gov/docs/default-source/clean-air-plans/air-quality-management-plans/2016-air-quality-
management-plan/final-2016-aqmp/final2016aqmp.pdf
Southern California Gas Company (n.d.). Benefits of Natural Gas Vehicles | SoCalGas. Retrieved March 16, 2019,
from https://www.socalgas.com/for-your-business/natural-gas-vehicles/benefits
Southern California Edison (n.d.). Distribution Resources Plan External Portal (DEREP)” Retrieved March 15,
2019, from https://ltmdrpep.sce.com/drpep/
Southern California Edison (2019, March 16). SCE Service Territory ”[shapefile]. Retrieved March 19, 2019, from
http://data-sce2.opendata.arcgis.com/datasets/93bdba093c7f43e09fe14c37b033d179_4
Southern California Edison (2019, March 16). Substations ”[shapefile]. Retrieved March 19, 2019, from http://data-
sce2.opendata.arcgis.com/datasets/93bdba093c7f43e09fe14c37b033d179_0
Southern California Association of Governments (2014). “Warehouses in SCAG region” Unpublished raw data
Southern California Association of Governments (2012). “SCAG Regional Travel Demand Model” Unpublished
raw data
Tetra Tech (2018, December). DRAFT 2018 FEASIBILITY ASSESSMENT for DRAYAGE TRUCKS. Retrieved
March 16, 2019, from http://www.cleanairactionplan.org/documents/draft-drayage-truck-feasibility-
assesment.pdf
The California Air Resources Board (2018, March 26). Carl Moyer Memorial Air Quality Standards Attainment
Program. Retrieved March 16, 2019, from https://www.arb.ca.gov/msprog/moyer/moyer.htm
The California Department of Public Health (2015). “Strategic Plan for Asthma in California 2015-2018.” Retrieved
March 15, 2019, from
https://www.cdph.ca.gov/Programs/CCDPHP/DEODC/EHIB/CPE/CDPH%20Document%20Library/SPA
C2014_7-28-15APR.pdf
The Port of Long Beach (2018). “Trucking Companies” [Data file]. Retrieved from
http://www.polb.com/environment/cleantrucks/
The San Pedro Bay Ports (2017). “2017 Clean Air Action Plan Update.” Retrieved March 15, 2019, from
http://www.cleanairactionplan.org/documents/final-2017-clean-air-action-plan-update.pdf/
The San Pedro Bay Ports (2018). “Clean Air Action Plan Draft 2018 Feasibility Assessment for Drayage Trucks.”
Retrieved March 18, 2019, from http://www.cleanairactionplan.org/documents/draft-drayage-truck-
feasibility-assesment.pdf/

79
TIAX (2011). “Characterization of Drayage Truck Duty Cycles at the Port of Long Beach and Port of Los Angeles”,
page 1 and 2.
US Census Bureau . 2014, November. “Summary File.” In 2008–2012 American Community Survey. Washington,
DC: US Census Bureau’s American Community Survey Office. http://ftp2.census.gov/.
U.S. Energy Information Administration (2014, May 21). How much carbon dioxide is produced by burning
gasoline and diesel fuel?. Retrieved March 19, 2019, from http://www.patagoniaalliance.org/wp-
content/uploads/2014/08/How-much-carbon-dioxide-is-produced-by-burning-gasoline-and-diesel-fuel-
FAQ-U.S.-Energy-Information-Administration-EIA.pdf.
U.S. Energy Information Administration (2016, February 2). “Carbon Dioxide Emission Coefficients.” Retrieved
May 1, 2019, from https://www.eia.gov/environment/emissions/co2_vol_mass.php;
U.S. Energy Information Administration (2018, October 26). “How much electricity does an American home use?”
Retrieved April 30, 2019, from https://www.eia.gov/tools/faqs/faq.php?id=97&t=3;
Wilde, Dominik (2018, June 10). Daimler Unveils Freightliner eCascadia, A Tesla Semi Rival - Inside EVs.
Retrieved March 14, 2019, from https://insideevs.com/daimler-freightliner-ecascadia-tesla-semi-rival/


![TRUCKING INDUSTRY · [ 6 ] TRUCKING INDUSTRY ENVIRONMENTAL BEST PRACTICE GUIDE ThE AUSTRALIAN TRUCKING ASSOCIATION The Australian Trucking Association (ATA) is the national peak body](https://img.pdfslide.net/doc/110x75/5e6e335355a7c4346213f0b4/trucking-6-trucking-industry-environmental-best-practice-guide-the-australian.jpg)