Embed Size (px)
Citation preview
Analysis of Graphs for Digital Preservation Suitability
Charles L. CartledgeMichael L. Nelson
Old Dominion UniversityDepartment of Computer Science
Norfolk, VA 23529 USA
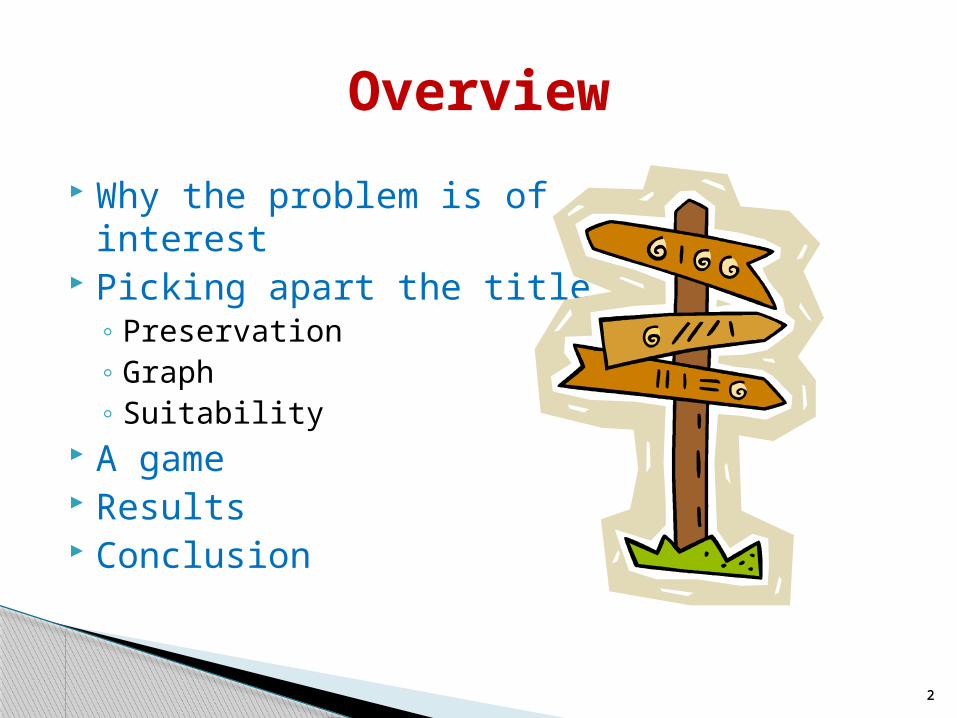
Why the problem is of interest
Picking apart the title◦ Preservation◦ Graph◦ Suitability
A game Results Conclusion
Overview
22
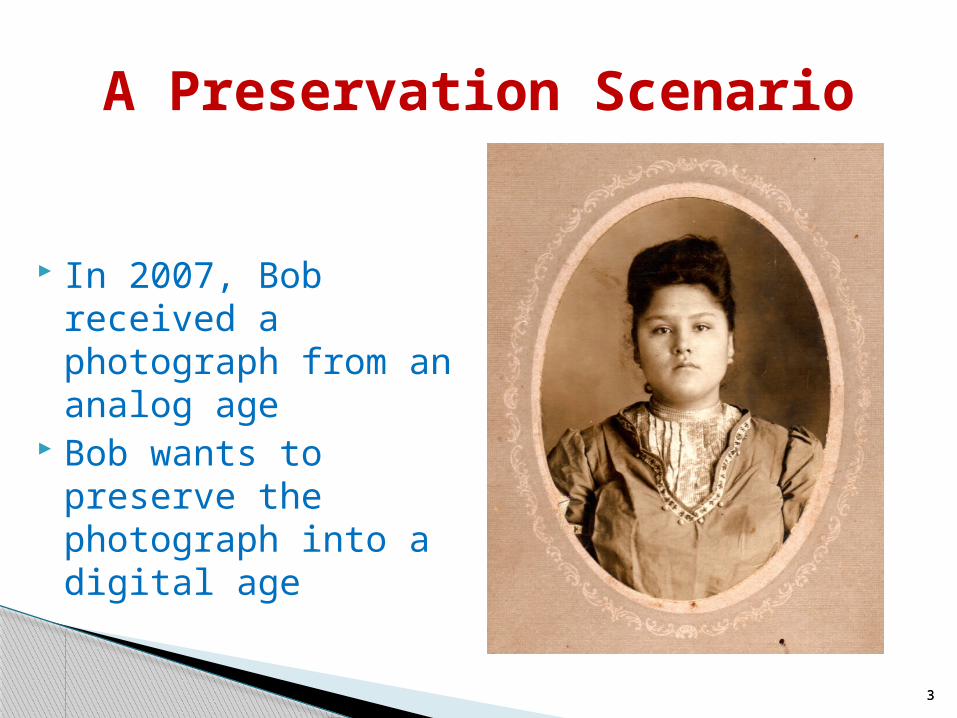
In 2007, Bob received a photograph from an analog age
Bob wants to preserve the photograph into a digital age
A Preservation Scenario
33
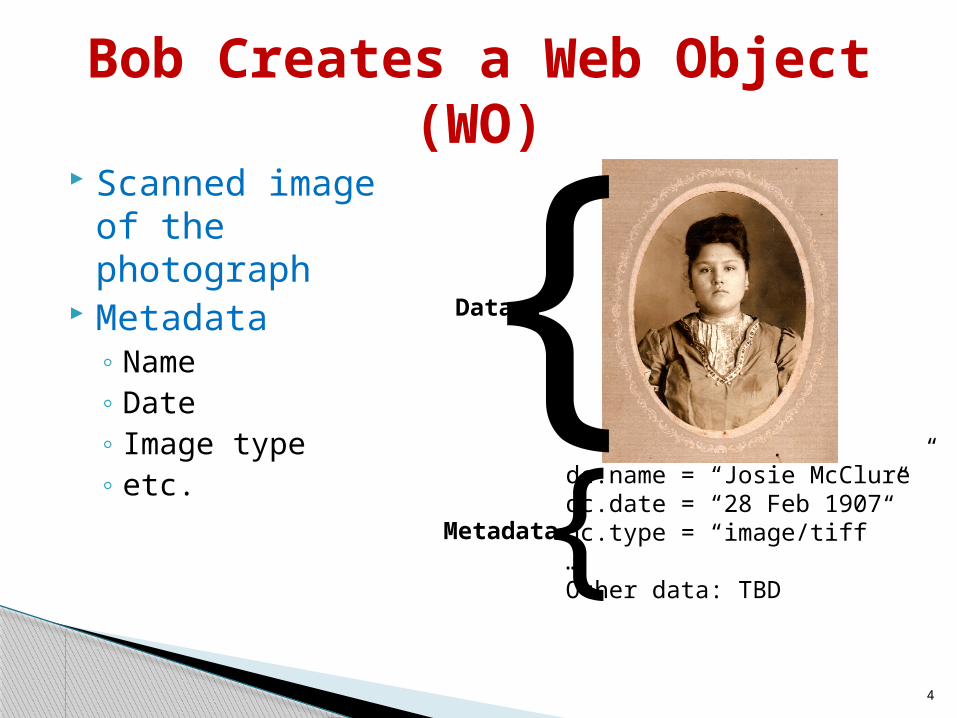
Scanned image of the photograph
Metadata◦ Name◦ Date◦ Image type◦ etc.
Bob Creates a Web Object (WO)
4
dc.name = “Josie McClure”dc.date = “28 Feb 1907”dc.type = “image/tiff”…Other data: TBD
{Metadata
Data{
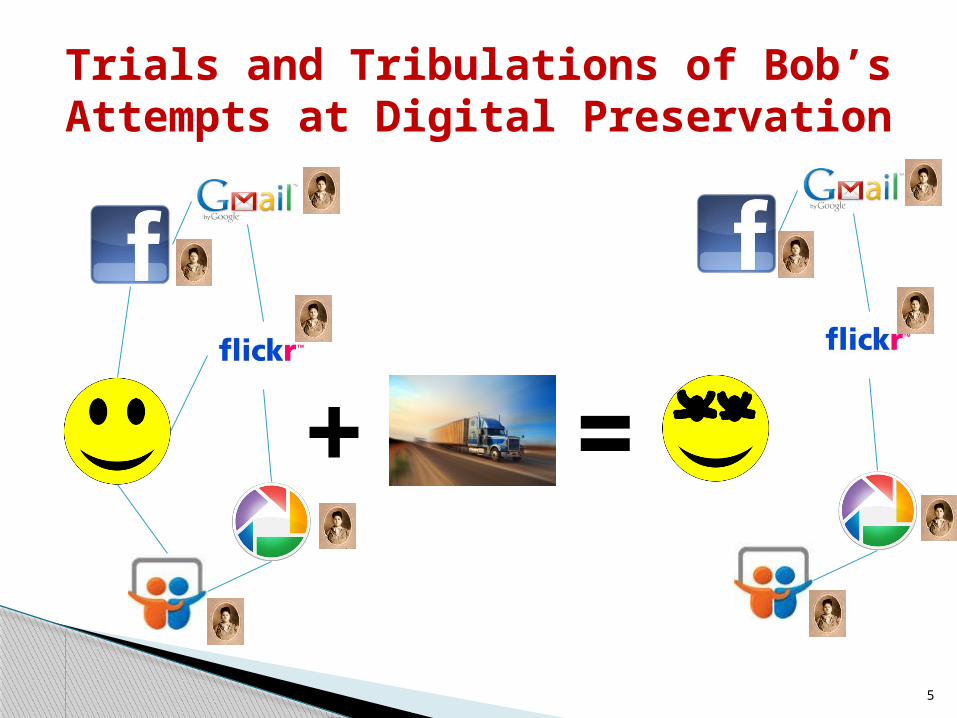
Trials and Tribulations of Bob’s Attempts at Digital Preservation
5
+ =
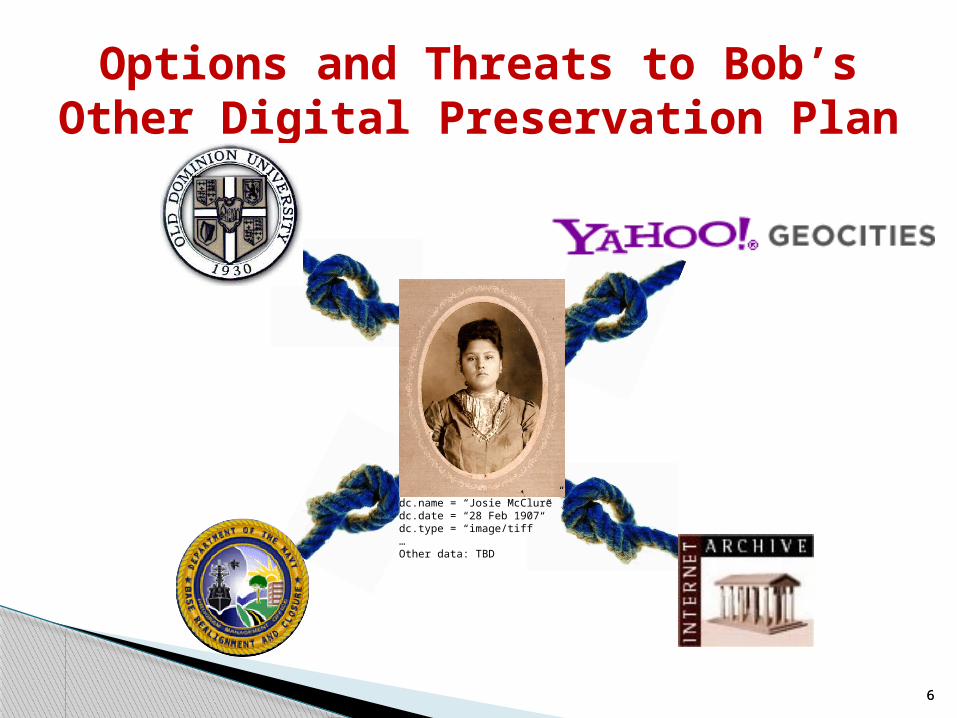
Options and Threats to Bob’s Other Digital Preservation Plan
66
dc.name = “Josie McClure”dc.date = “28 Feb 1907”dc.type = “image/tiff”…Other data: TBD
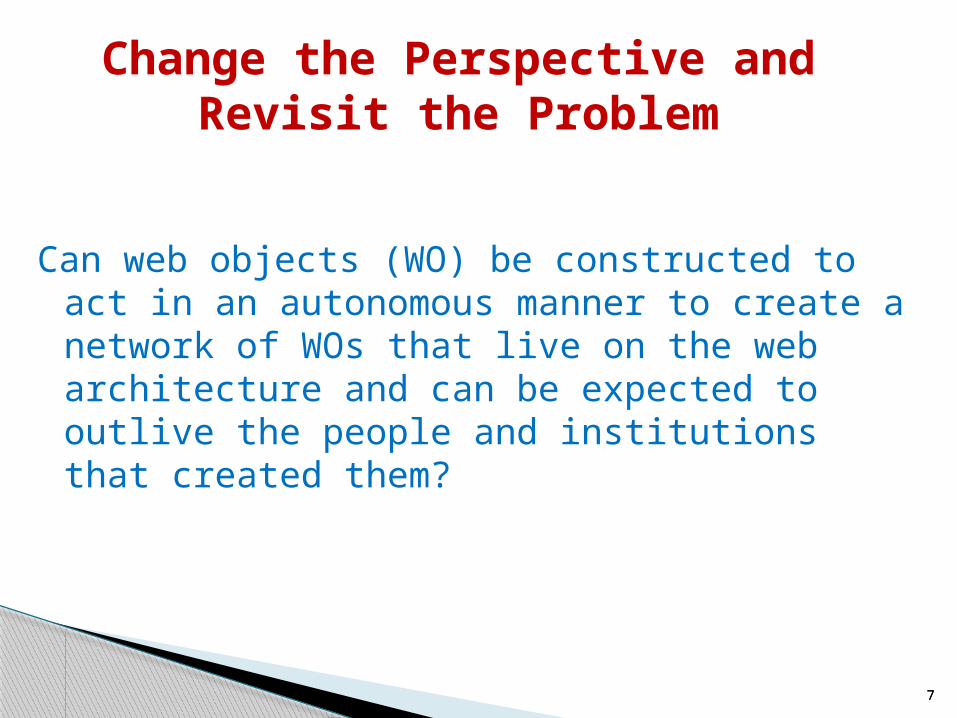
Change the Perspective and Revisit the Problem
77
Can web objects (WO) be constructed to act in an autonomous manner to create a network of WOs that live on the web architecture and can be expected to outlive the people and institutions that created them?
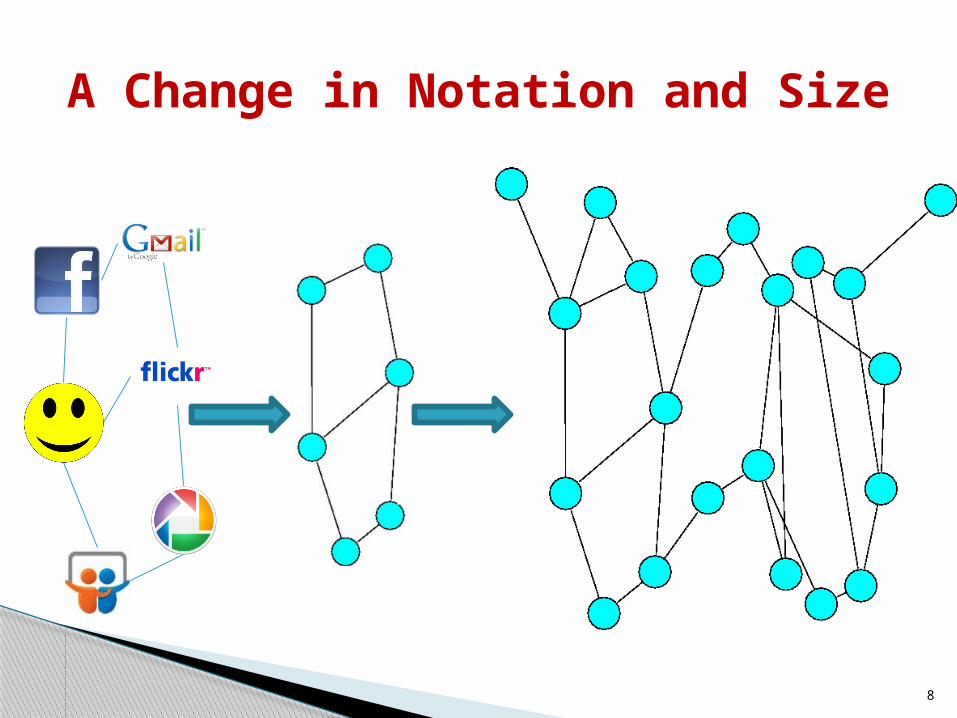
A Change in Notation and Size
8
Now on to Suitability
9
Repurpose one thing to do something else
To revisit how something works and utilize it in a new and novel way
“To bravely go where no one …”
9
Title: Analysis of Graphs for Digital Preservation Suitability

Random – global construction
Power Law – global construction
Small World – global construction
Unsupervised Small World (USW) – local construction
Types of Graphs Based on “Degreeness”
1010
Title: Analysis of Graphs for Digital Preservation Suitability
“The number of systems of terminology presently used in graph theory is equal, to a close approximation, to the number of graph theorists.”Enumerative Combinatorics, 1986
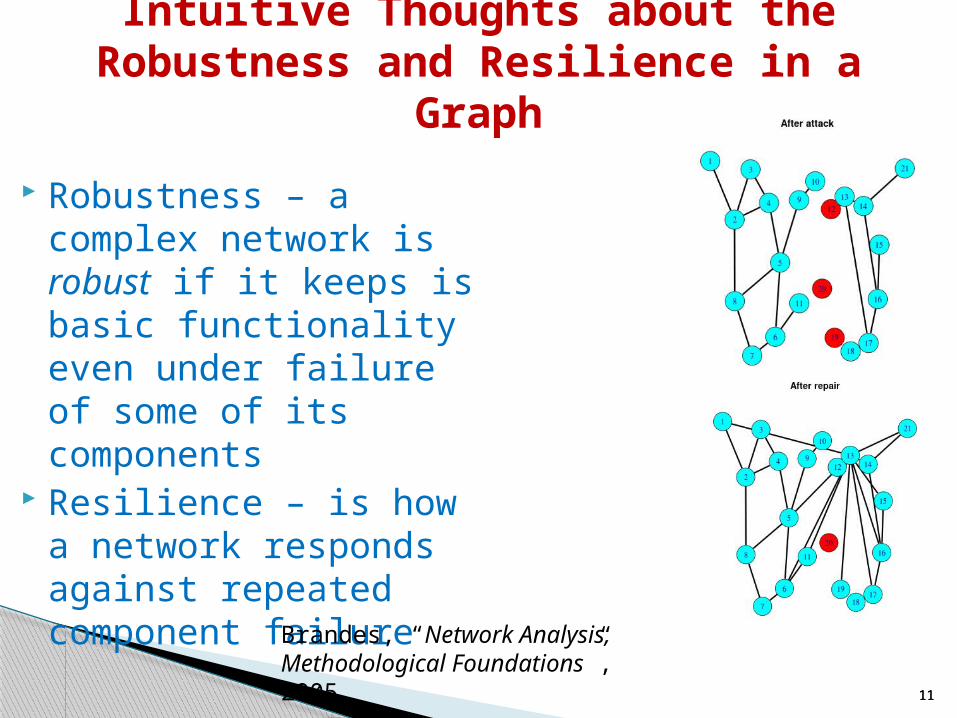
Robustness – a complex network is robust if it keeps is basic functionality even under failure of some of its components
Resilience – is how a network responds against repeated component failure
Intuitive Thoughts about the Robustness and Resilience in a
Graph
1111
Brandes, “Network Analysis, Methodological Foundations”, 2005
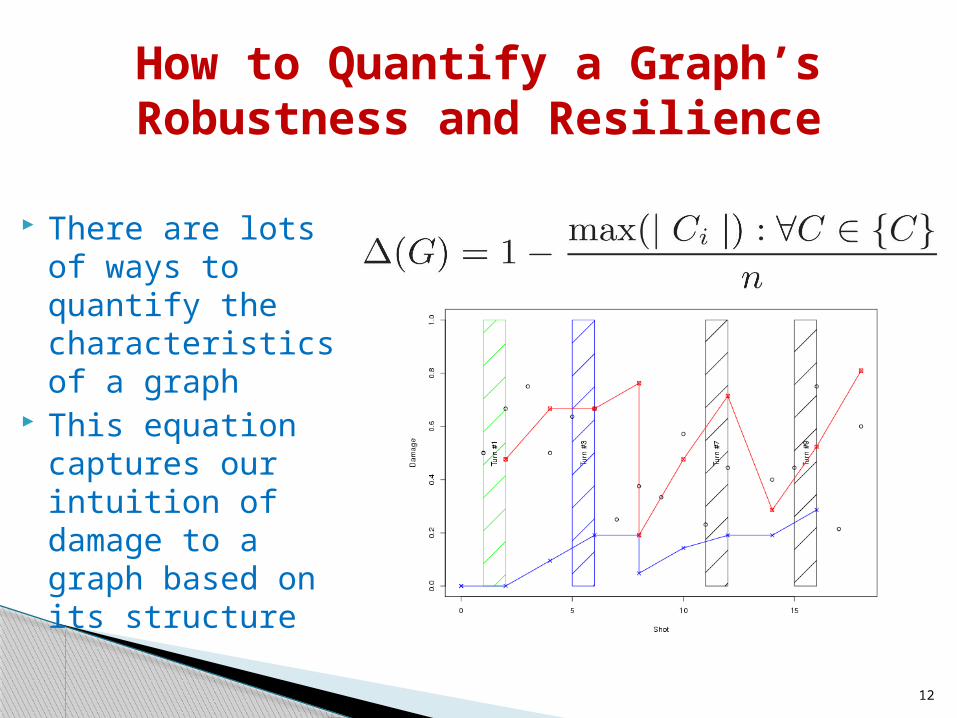
There are lots of ways to quantify the characteristics of a graph
This equation captures our intuition of damage to a graph based on its structure
How to Quantify a Graph’s Robustness and Resilience
12
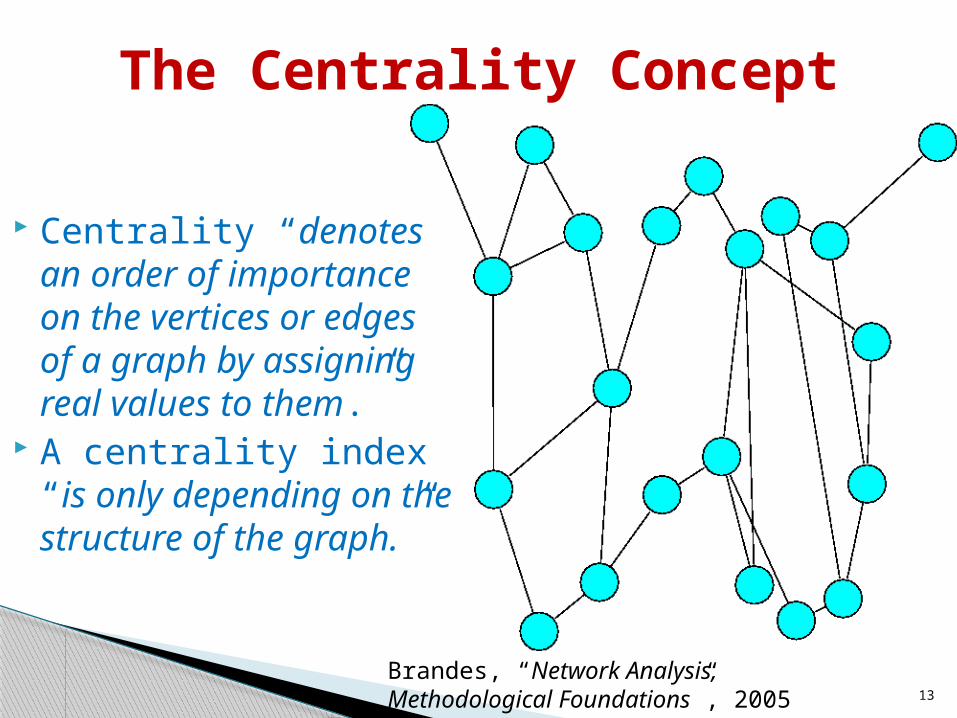
Centrality “denotes an order of importance on the vertices or edges of a graph by assigning real values to them.”
A centrality index “is only depending on the structure of the graph.”
The Centrality Concept
13
Brandes, “Network Analysis, Methodological Foundations”, 2005
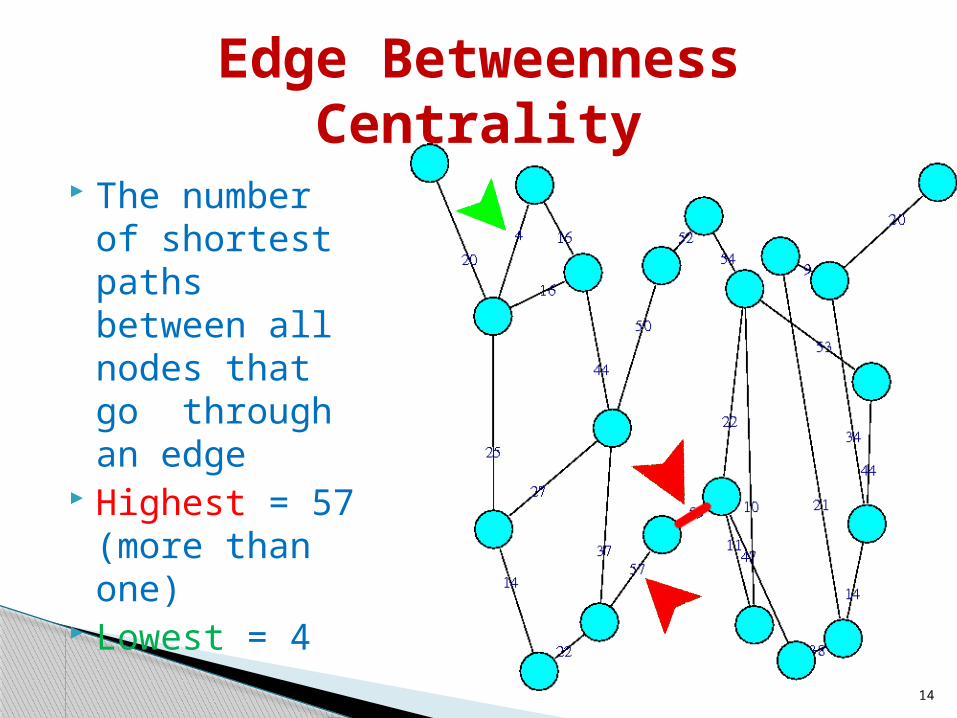
The number of shortest paths between all nodes that go through an edge
Highest = 57 (more than one)
Lowest = 4
Edge Betweenness Centrality
14
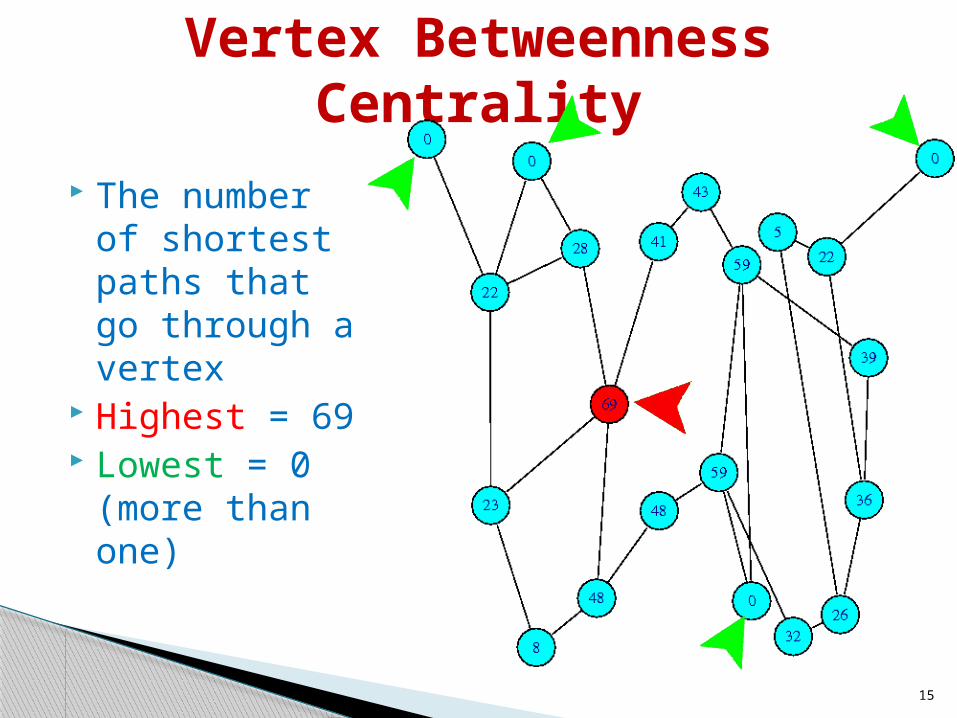
Vertex Betweenness Centrality
15
The number of shortest paths that go through a vertex
Highest = 69 Lowest = 0
(more than one)
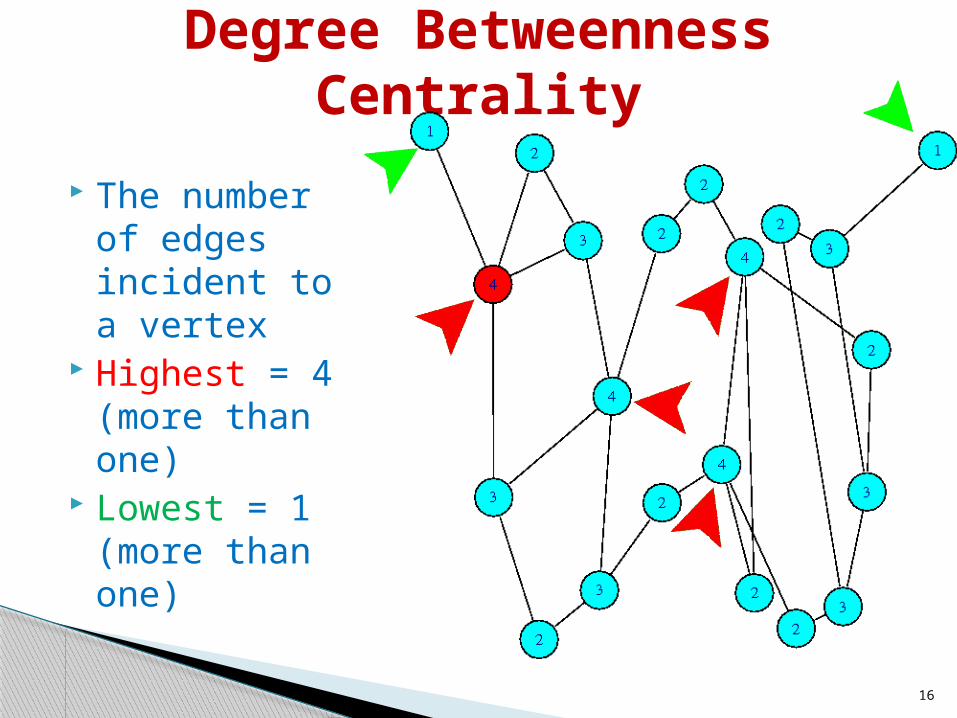
Degree Betweenness Centrality
16
The number of edges incident to a vertex
Highest = 4 (more than one)
Lowest = 1 (more than one)

Attack profile
# of unique graphs
Max. depth
Min. depth
Mean depth
St. dev. Depth
D-V-L 428,580 20 4 15.57 3.65
D-V-H 8 2 1 1.87 0.35
B-E-L 7 6 6 6 0.00
B-E-H 2 2 2 2 0.00
B-V-L 53,155 20 15 19.56 0.82
B-V-H 1 2 2 2 n/a
How Different Centrality Measures Can Affect the Game Space
1717
An attack profile uses a centrality measurement to decide which graph component to eliminate
Mallory will use an attack profile during the game
18
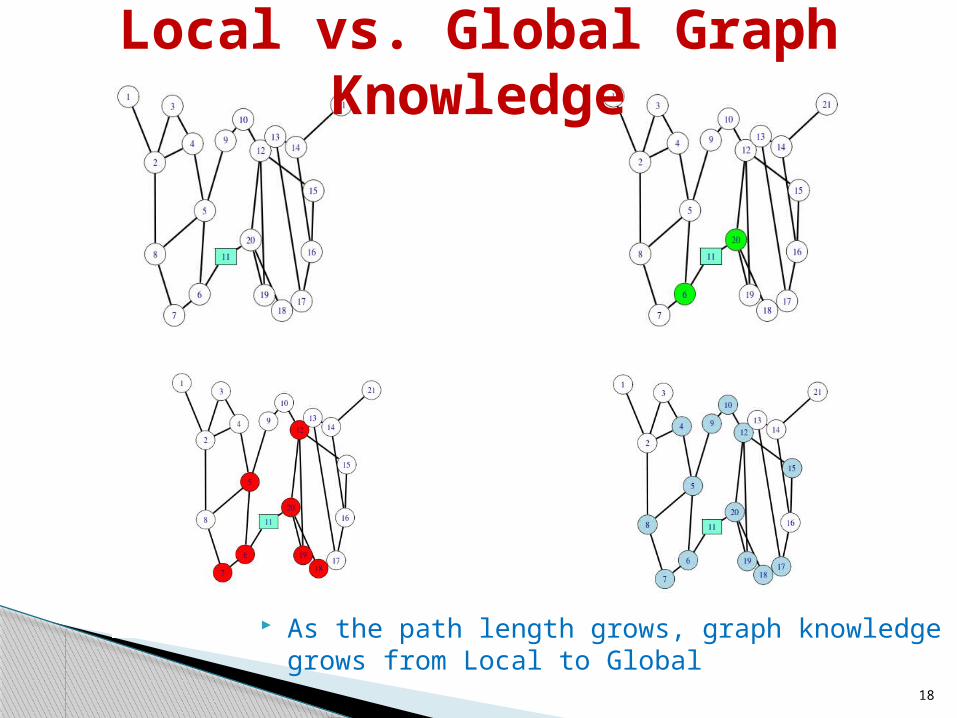
Local vs. Global Graph Knowledge
As the path length grows, graph knowledge grows from Local to Global
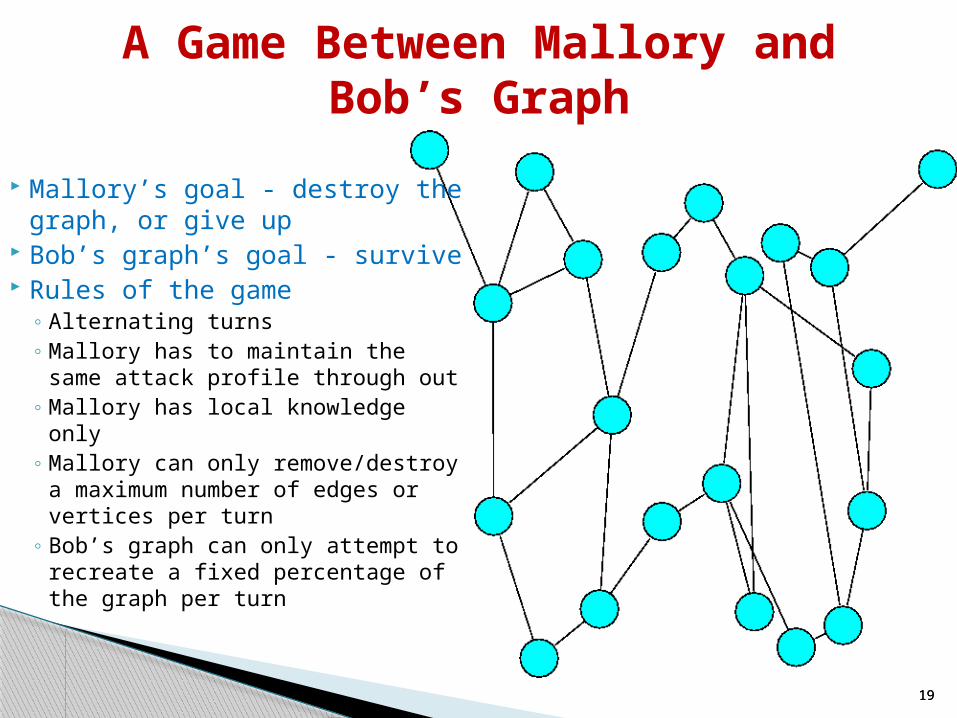
Mallory’s goal - destroy the graph, or give up
Bob’s graph’s goal - survive Rules of the game
◦ Alternating turns◦ Mallory has to maintain the
same attack profile through out◦ Mallory has local knowledge only◦ Mallory can only remove/destroy
a maximum number of edges or vertices per turn
◦ Bob’s graph can only attempt to recreate a fixed percentage of the graph per turn
A Game Between Mallory and Bob’s Graph
1919
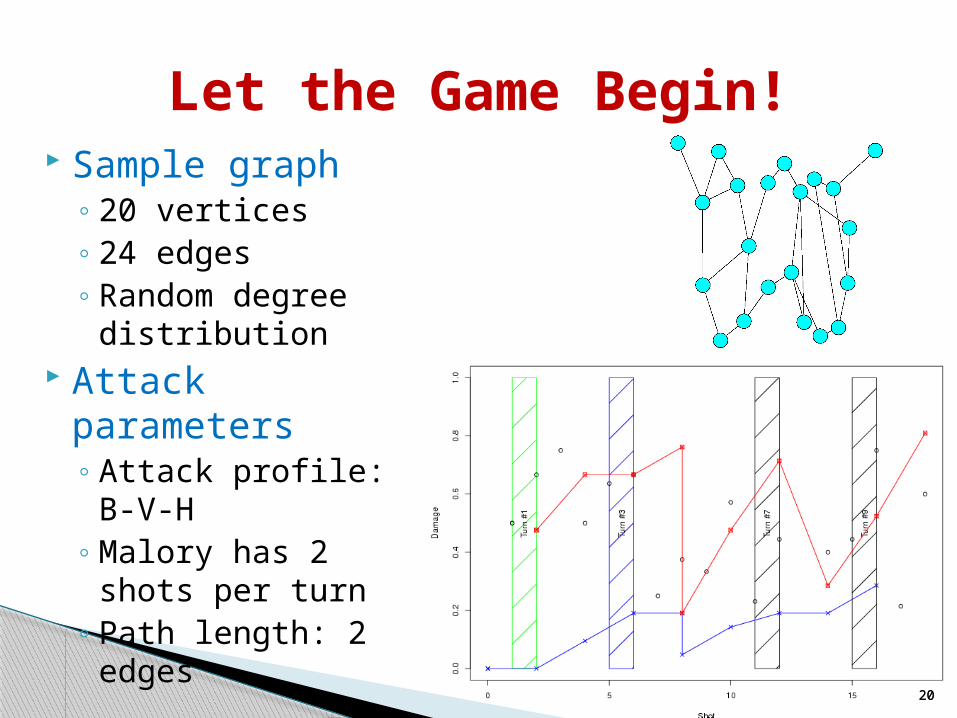
Sample graph◦ 20 vertices◦ 24 edges◦ Random degree
distribution Attack parameters
◦ Attack profile: B-V-H◦ Malory has 2 shots
per turn◦ Path length: 2 edges
Let the Game Begin!
2020
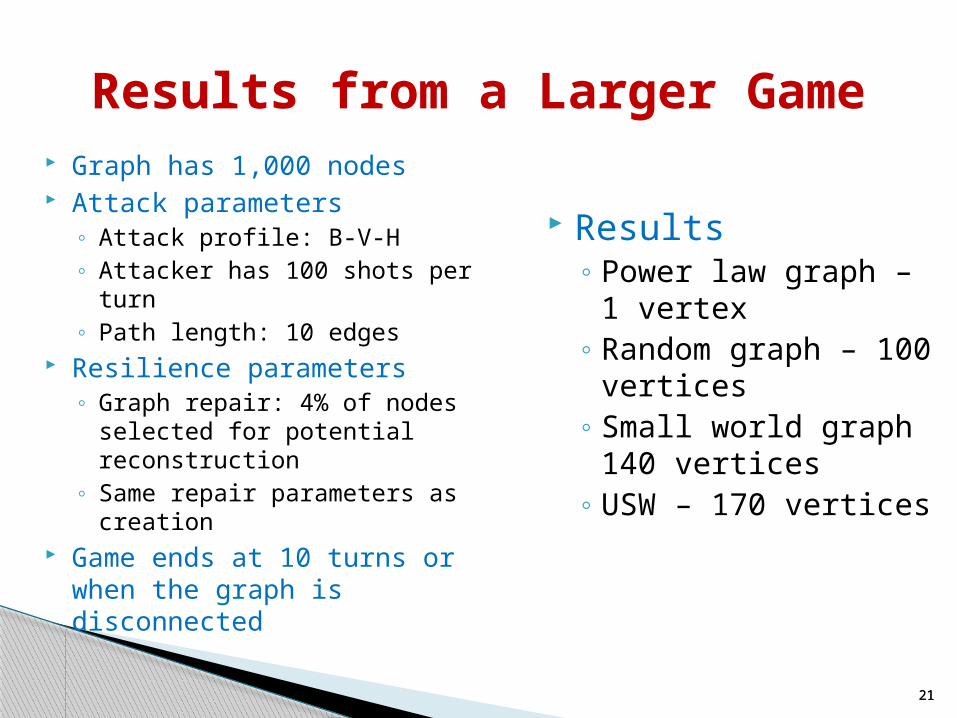
Graph has 1,000 nodes Attack parameters
◦ Attack profile: B-V-H◦ Attacker has 100 shots per turn◦ Path length: 10 edges
Resilience parameters◦ Graph repair: 4% of nodes
selected for potential reconstruction
◦ Same repair parameters as creation
Game ends at 10 turns or when the graph is disconnected
Results from a Larger Game
2121
Results◦ Power law graph – 1
vertex◦ Random graph – 100
vertices◦ Small world graph 140
vertices◦ USW – 170 vertices
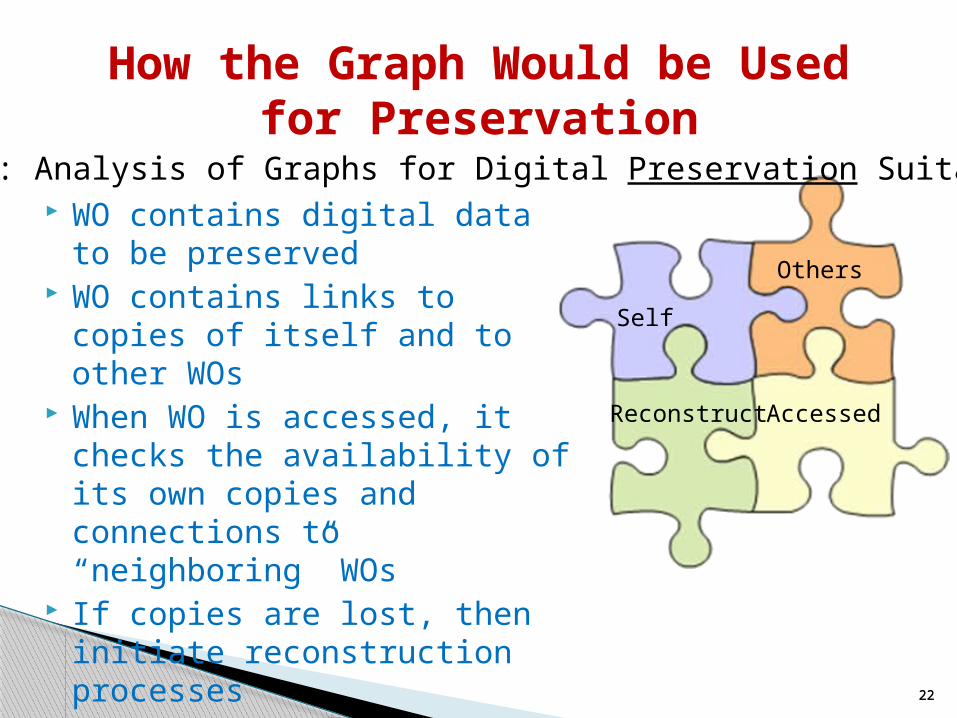
WO contains digital data to be preserved
WO contains links to copies of itself and to other WOs
When WO is accessed, it checks the availability of its own copies and connections to “neighboring” WOs
If copies are lost, then initiate reconstruction processes
How the Graph Would be Used for Preservation
2222
Self
Others
AccessedReconstruct
Title: Analysis of Graphs for Digital Preservation Suitability
Conclusion
23
A USW graph is more robust than small-world, random or power law graphs
USW has shown to have better preservation potential than other tested graphs
Analysis of Graphs for Digital Preservation SuitabilityCharles L. Cartledge
Michael L. NelsonOld Dominion University
Department of Computer ScienceNorfolk, VA 23529 USA
This work was funded in part by the National Science Foundation.


![Big Data: Data Wrangling Boot Camp Big Data VsBig Data: Data Wrangling Boot Camp Big Data Vs Chuck Cartledge, PhDChuck Cartledge, PhDChuck Cartledge, ... small (9%) [19]. Most Big](https://img.pdfslide.net/doc/110x75/5ecc091b087ff73ee102b195/big-data-data-wrangling-boot-camp-big-data-vs-big-data-data-wrangling-boot-camp.jpg)