Embed Size (px)
Citation preview

NASA
ND 2025814
R-735
TRAVERSE GRAVIMETER - CEI 2025000
FS-2 QUALIFICATION UNIT
TEST REPORT
October 1972
CHARLES STARK DRAPERLABORATORY
MASSACHUSETTS INSTITUTE OF TECHNOLOGY
CAMBRIDGE, MASSACHUSETTS, O2f39
nn m(NASA-GR-141650) TRAVERSE GRAVIMETEF CEI2025000 FS-2 QUALIFICATION UNIT TEST REPORT(Massachusetts Inst. of Tech.) 63 p
N75-7284t
~rm~
UnclasQI1/.98 127U

NO 2025814
R-735
TRAVERSE GRAVIMETER - CEI 2025000
FS-2 QUALIFICATION UNIT
TEST REPORT
October 1972
PREPARED BY:
APPROVED:
APPROVED:
APPROVED:
APPROVED:
ROBERT MAS^I/EK, STAFF ENGINEERTRAVERSE GRAVIMETER EXPERIMENT
"SHELDON W. BUCK, TECHNICAL DIRECTORTRAVERSE GRAVIMETER EXPERIMENT
JOflN B. HARPER, PROGRAM DIRECTORVERSE GRAVIMETER EXPERIMENT
DAVID G. HOCHARLES S T R K
OCIATE DLRtCTORAPER LABORATORY
DATE:
DATE:
RALPH/R. RAGAN, DEPUTY DIRECTORCHARLES STARK DRAPER LABORATORY
DATE:
DATE:

ACKNOWLEDGMENT
This report was prepared under DSR Project 55-45175, sponsored by the
Manned Spacecraft Center of the National Aeronautics and Space Administration
through Contract NAS 9-11555.
Richard Martorana wrote Section 3. 1, Robert Reid wrote Section 3. 2,
John Eterno summarized the data in Sections 3. 3 and 3. 4, and William Beaton
wrote Sections 4.0, 5.0, and 12.0
*The publication of this report does not constitute approval by the National
Aeronautics and Space Administration of the findings or the conclusions contained
herein. It is published only for the exchange and stimulation of ideas.
11
TABLE OF CONTENTS
Section Page
1.0 INTRODUCTION 1
2.0 TEST RESULTS. 3
3.0 DETAILED TEST RESULTS 7
4.0 FAILURES AND DISCREPANCIES 25
5. 0 SUMMARY OF WAIVERS AND DEVIATIONS 33
6.0 SUMMARY OF ECR'S 35
7.0 DEVIATIONS FROM QUALIFICATION TEST SPECIFICATION . . 37
8.0 DEVIATIONS FROM QUALIFICATION TEST PROCEDURE . ... 39
9.0 SCHEDULE CONSIDERATION 41
10.0 PHOTOGRAPHS 43
11.0 TEARDOWN AND INSPECTION 53
12.0 MSC FORM 772 57
13.0 CONCLUSION. 63
111

LIST OF ILLUSTRATIONS
Figure Page
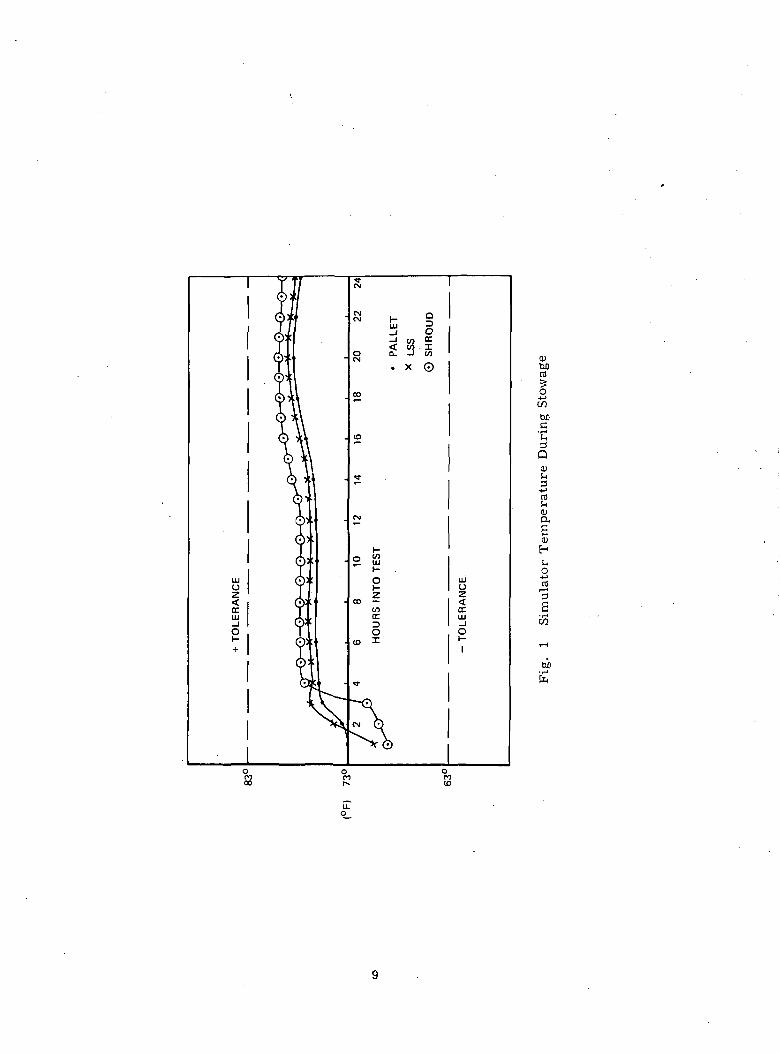
1 Simulator Temperatures During Stowage 9
2 Simulator Temperatures During Soakback . . 10
3 Simulator Temperatures During Traverse I 11
4 Deviation of TG Display (Counts) From Average (Traverse I). ... 13
5 Simulator Temperatures During Rest Periods 14
6 Simulator Temperatures During Traverse II 15
7 Deviation of TG Display (Counts) From Average (Traverse II) ... 17
8 TG Component Temperatures During Thermal-Vacuum Test 19
9 TG "As Run" Schedule 42
10 Typical Launch Depressurization Set-Up 44
11 Typical Performance Test Set-Up. 45
12 Thermal Vacuum Simulator Apparatus . 46
13 Thermal Vacuum Simulator Apparatus 47
14 Thermal Vacuum Simulator Apparatus in Vacuum Chamber . . . . 48
15 Traverse Gravimeter Mechanical Unit/Isoframe Test 49
16 TG Qualification Vibration - Y Axis 50
17 TG Qualification Vibration - X Axis 51
18 Rover Vertical Vibration 52
IV

LIST OF TABLES
Table Page
I Traverse I Gravity Data 12
II Traverse II Gravity Data 16
III TP 25045 23
IV TP 25075 . . . 24
LIST OF EXHIBITS
Exhibit Page
A Failure Investigation Action Report No. 03 26
B Waiver 0005 2.7
C Failure Investigation Action Report No. 04 28
D MIT Failure Report No. 29 30
E MIT Failure Report No. 31 31
F Work Requisition 54
G Work Requisition 55
H System and Component Historical Record 58
I System and Component Historical Record (Cent) 59
J System and Component Historical Record (Cont) 60
K System and Component Historical Record (Cont) 61
L System and Component Historical Record (Cont) 62

SECTION 1
INTRODUCTION
1.1 GENERAL
This report summarizes the results of the testing of the Traverse
Gravimeter Qualification Unit FS-2 at M.I .T. /C. S. Draper Laboratory
from June 30, 1972 to September 19, 1972.
1.2 SCOPE
This report summarizes test results, failures, discrepancies and
schedule progress of the Traverse Gravimeter Qualification Unit FS-2.
More detailed information may be obtained from the actual Traverse Gravi-
meter data package.
1.3 TEST PROCEDURES
The following is a very brief summary of the Traverse Gravimeter
test procedures and their purpose.
1.3.1 TP 25015 - TG CURRENT MONITOR. - This test measures the
current useage in each of the TG modes; STANDBY, ON, GRAY, BIAS and
READ.
1.3.2 TP 25020 - TG LEVEL TEST. - This test verifies the TG level
accuracy and the ability of the TG to remode to operate when tilted greater
than 15° from vertical.
1.3.3 TP 25025 - TG TEMPERATURE TEST. - This test verifies proper
operation of the TG temperature display (8th digit) and verifies the ability
of the TGto undergo a thermal cycle. In addition, the temperature of the
TG thermostat opening and closing points is ascertained. •
1.3.4 TP 25030 - TG ACCEPTANCE VIBRATION. - This test subjects the
TGto a workmanship vibration test.
1.3.5 TP 25035 - THERMAL VACUUM TEST. - This test verifies the
ability of the TGto undergo a simulated mission under vacuum and varying
temperature conditions.

1.3.6 TP 25036 - OPERATIONAL TEST DURING T-V. - This test verifies
the ability of theTG to take measurements during a simulated lunar traverse.
1.3.7 TP 25045 - TG PERFORMANCE TEST. - This test verifies the repeat-
ability and slope stability of the TG during earth gravity measurements.
1.3.8 TP 25055 - TG VISUAL INSPECTION. - This test verifies and defines
the steps necessary to ensure proper appearance and dimensions of the TG.
In addition, the weight and center of gravity, of the Traverse Gravimeter are
measured.
1.3.9 TP 25075 - BASELINE VERIFICATION TEST. - This is a basic func-
tional test designed to verify TG level capability, measurement operation, toggle
and pushbutton operation, display operation and to obtain VSA bias and scale
factor data.
1. 3. 10 TP 25080 TG QUALIFICATION VIBRATION. - This test verifies the ability
of the TG to undergo launch sine, dwell, and random vibration in the X, Y, and Z
axes, and Lunar Rover Vehicle vertical vibration.
1. 3. 11 TP 25081 - TG MECHANICAL UNIT / ISOFRAME VIBRATION. -. This
test verifies the ability of the TG Isoframe Assembly to undergo a launch dwell
vibration and a 5G acceleration simultaneously.
1. 3. 12 TP 25085 LAUNCH DEPRESSURIZATION. - This test verifies the ability
of the TG to undergo a Launch Depressurization.
1. 3. 13 TEN DAY COOLDOWN. - TP 25045 was performed, then the TG was cooled
down for ten days and TP 25045 performed again to verify the ability of the TG to
perform properly after the simulated launch cooldown.

SECTION^ 2
TEST RESULTS
The test results of the Traverse Gravimeter Qualification Unit will be
summarized in chronological order.
2. 1 TESTS PERFORMED AT DL-11
2. 1. 1 TG TEMPERATURE TEST - TP 25025. - This test was successfully com-
pleted with the exception of steps D7a, D7c, and D21 which were out of specification.
These items were closed by ECR 20518, which clarified instructions and added
instrumentation error to the tolerances.
2. 1. 2 BASELINE VERIFICATION TEST - TP 25075. - This test was successfully
completed with the exception of an incorrect formula in the calculations. ECR
20520 corrected the typographical error.
2. 2 TESTS PERFORMED AT BEDFORD FLIGHT FACILITY
2. 2. 1 BASELINE VERIFICATION TEST - TP 25075. - This test was successfully
completed with the correction noted in ECR 20520 (see Paragraph 2. 1. 2).
2. 2. 2 TG ACCEPTANCE VIBRATION - TP 25030. - This test was successfully
completed.
2. 2. 3 BASELINE VERIFICATION TEST - TP 25075. - This test was successfully/
completed with the same comment as Paragraph 2. 1.2.
2. 2. 4 TG CURRENT MONITOR - TP 25015. - This test was successfully com-
pleted with the exception of some out of specification conditions of a typographical
nature which were cleared by ECR 20519.
2. 2. 5 TG PERFORMANCE TEST - TP 25045. - This test was successfully com-
pleted with the exception of an out of specification condition at step F. 5. This was
cleared by waiver number 0005 and later by ECR 20535 which changed the test
configuration. It was determined the P. L. L. repeatability improved considerably
by performing this test on the TG Battery rather than the GSE Breakout Box.
2. 2. 6 BASELINE VERIFICATION TEST - TP 25075. - This test was success-
fully completed with the same comment as Paragraph 2. 1. 2.

2. 2. 7 TG LEVEL TEST - TP 25020. - This test was successfully completed with the
exception of an out of specification condition at step R. 3. This was a typographical
error and misinterpretation of test procedure that was cleared by ECR 20517.
2. 3 TESTS PERFORMED AT DL-11
2. 3. 1 LAUNCH DEPRESSURIZATION - TP 25085. - This test was successfully
completed.
2. 3. 2 TG VISUAL INSPECTION - TP 25055. - This test was successfully completed.
2. 4 TESTS PERFROMED AT BEDFORD FLIGHT FACILITY
2. 4. 1 TG THERMAL VACUUM TEST - TP 25035. - This test was successfully
completed.
2. 4. 2 OPERATIONAL TEST DURING T-V-TP 25036. - This test was successfully
completed during the first traverse.
2. 4. 3 OPERATIONAL TEST DURING T-V-TP 25036. - This test was successfully
completed during the second traverse.
2. 4. 4 BASELINE VERIFICATION TEST - TP 25075. - This test was successfully
completed.
2. 4. 5 ISOFRAME/MECHANICAL UNIT VIBRATION - TP 25081. - This test was
successfully completed.
2. 4. 6 TG QUALIFICATION VIBRATION - TP 25080. - This test was successfully
completed.
2.5 VERIFICATION TESTS PERFORMED DURING TP 25080
2. 5. 1 VIBRATION VERIFICATION TEST - TP 25076. - This test was successfully
completed six times during TP 25080.
2. 5. 2 BASELINE VERIFICATION TEST- TP 25075. —This test was successfully
completed three times during TP 25080 with the exception of the last time at steps
1. 6 and I. 12 which were cleared by waiver 0006.
2. 5. 3 TG CURRENT MONITOR - TP 25015. - This test was successfully completed.
2. 5.4 TG LEVEL TEST - TP 25020. - This test was successfully completed.
2. 5. 5 TG PERFORMANCE TEST - TP 25045. - This test was successfully com-
pleted with the exception of an out of specification condition at step F. 5 - see
waiver 0005.
2. 5. 6 BASELINE VERIFICATION TEST - TP 25075. - This test was successfullycompleted.

2. 6 TESTS PERFORMED AT DLrll
2. 6. 1 TG TEMPERATURE TEST - TP. - This test was successfully completed
except for out of specification condition at step D. 7 which was cleared by Internal
Failure Report No. 29.
2. 6. 2 TEARDOWN AND INSPECTION. - The inspection was successfully completed.
During the inspection Internal Failure Report No. 31 was generated when it was noted
that the anti-backlash gear was not centered. ECR 20548 clarified TP 25020 so
that this would not happen again.

SECTION 3
DETAILED TEST RESULTS
3. 1 THERMAL VACUUM TEST TP 25035
3. 1. 1 GENERAL. - During the period of July 24 to July 28, 1972, the TGE qualifi-
cation model (FS2 ) underwent thermal vacuum testing at Bedford. A hot mission
was simulated with stowage, soakback, two traverse and two rest periods. Through-
out the test the TG maintained temperature control. All simulation and remote
actuation apparatus operated continuously so that the test ran uninterrupted for
eighty-two hours.
3. 1. 2 APPARATUS. - In the period between thermal vacuum testing of the engineer-
ing and qualification models, several revisions were made in the simulation apparatus
in order to make it more reliable. The major changes are as follows.
1. Thermocouples on the pallet and lunar surface simulator (LSS) were moved
from the back to gravimeter side of each in order to get more accurate estimates
of radiative flux between the TG and simulation apparatus. Temperature control
sensors for these surfaces were similarly moved.
2. The couplers were revised to increase the gap between the back of the TG
blanket and the pallet simulator in order to eliminate physical contact between the
two surfaces.
3. The bottom pin removal was made independent of the side pin removal by
coupling it to a single high-force uni-directional solenoid.
4. The remote button actuator was revised so that one could see the button click
into its contact position. In addition the tips of the actuators or "fingers" were
changed to larger teflon coated hemispherical surfaces to protect the blanket.
5. Activation switches for operation of all remote manipulators were panel
mounted beside the viewing port. This enabled one technician to view the remote
control apparatus as he was using it.
3.1.3 TG CONFIGURATION. - The TGE deviated from flight configuration since
three thermocouples were brought out of the instrument through the aft foot. These
(Cu-Cn) thermocouples were attached to the I-oven, battery and housing. They

represent a conductance leak through the blanket of 0. 0043 watts/ F. The leak was
not monitored as in previous tests by heat stationing the thermocouples due to other
configuration constraints of qualification testing.
3.1.4 PROCEDURE. - The TGE was brought to Bedford on July 21 when installation
was begun in the simulation apparatus. . Preparation and final adjustment of the
apparatus was carried out for three days as outlined in part C of TP 25035. The
test began at 10PM on July 24. This hour was chosen as t • 0 so that the traverse
phases of the mission would occur at reasonable hours. Hot stowage phase took
twenty-four hours wherein the LSS, pallet and shroud were held to 73°F ± 10°F
(Figure 1). The TG was in standby. After twenty-four hours soakback began that
simulated a seventeen hour linear ramp function of temperaturfe between 73°F and
123 F (Figure 2). At the end of soakback the TG was put into operate mode, pins
removed, couplers placed in "p" position, crygenics applied to the shroud and
simulator temperatures reset for hot traverse. Temperatures on the LSS and pallet
were set at 208 F which exposes the TG to an infrared radiative flux equivalent to the
total energy (infrared plus ultraviolet) that the TG would experience for a sun angle
of 30°. The time variation of the sun's elevation angle was simulated with a tem-
perature ramp. Simulator temperatures for the first traverse are shown in Figure
3. Data was taken according to TP 25036 and is listed in Table I and plotted in
Figure 4. One sigma is 0. 514 ppm.
Six hours after Traverse I began. Rest I was initiated by setting the TG in
standby mode, opening the radiator, lowering the couplers and controlling the pallet
and LSS at -100 F (Figure 5). These temperature changes (as well as all other
transients between mission phases) were accomplished within the first hour of suc-
ceeding phases. Throughout the remainder of the test the shroud was held at -320°F.
Rest I lasted fourteen hours after which the radiator was shut and couplers raised
for the next traverse.
Traverse II began at t = 61 and lasted for seven hours (Figure 6). It was
conducted the same as Traverse I except that the roughing pump was not operating
which may be a partial explanation for the lower value of one sigma of 0.4423 ppm.
The sun angle at the end of Traverse II was 40 . Gravity data is shown in Table II
and Figure 7.
Rest II was an exact repeat of Rest I. It began at t • 68 and ended at t • 82,
completing the test (Figure 5). Heat was then applied to all simulation apparatus
for about two hours prior to backfilling the chamber with dry gaseous nitrogen.
The blanket was inspected after the TG was removed from the chamber. No damage
could be detected.
LLJ
O
<ccHI
2
aocci/)
x 0
(ftLLI
ozc/5ccoI
(J
oI
o35tUO
c3Q
a<uD.s
o-»->ctf
,—4
3g
ao
ot»700
On
on(D

un)X!Jdeno
60c
Qto01(H
-4->Cflh
tt)O,S0>
hS-,o*jtai — i3
S•(-IC/3
60•,-1
In
10

\
\\
\
<Q.
OOCMCO
Occ
co
CO"a-
X O inq-
OI
COUJ
COKDO
OJ03
0)>CO
Q
0)Q.
B
a
ta
oCOCMCM
OCO
Oro o
COorooCM
11

TABLE I
TRAVERSE I GRAVITY DATA
Time (hrs after t = 0)
41.43
41.53
.62
.68
.75
.82
.88
.95
42. 02
.10
.33
.66
.73
43.08
.33
.58
.83
44.08
.33
.58
.83
45.08
.33
.58
.83
46.08
.33
.58
.75
.83
(bias)
(bias)
Data
843079441
82541
84041
83841
83941
83941
84841
84341
84141
83641
83641
952207441
843083841
83941
84441
83841
84441
83141
84542
84042
83642
83242
83642
83842
83542
83942
84242
84562
952206062
843082962
12

If)CO
tr<
CO CCHI LUI- >
-1 £LlJ r**
8 "
<Q
o. o. a.
Q.
£ 1
D LU
in po ci 6
LUcc
s §in M
IIU3
(OO
W Ocd o
oLU mLL ^LU LUDC cr
O LU55 5
po'
qdCN
pci
0)toI*<ua
CDtXOeg
sof-lfn
co
.O
O,co
•r-I
QO
§
(U
Q
bfl•r*
fe
NOI1VIA3Q AVIdSIQ
13

" 0 0
<Q-
illDC
in
§ -
inin '
I
c ««Is1 LUor
ooO)
o§ oo
OJ•oo
W)
Q
caSi0)a,S
o-»jai — i36
•rlCO
14

^ - —18
\UJ
O
O-I i/> DC< C/J Xa. —I to
• x ©
UJh-
o
enir
s I
0)
CB "
Q
0)as4)
o4-*rt"3S
Si1
o(Oincv
oin
oCO
O
Sev
o
CM
o(OCMCM
U.O
15
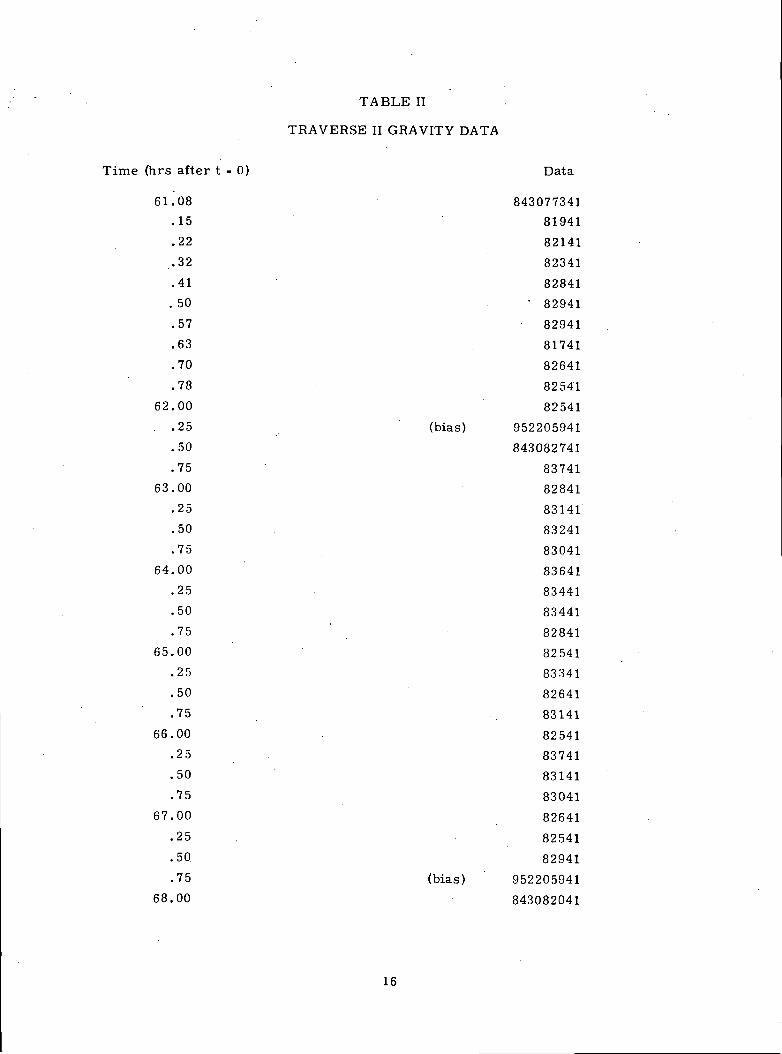
TABLE II
TRAVERSE II GRAVITY DATA
Time (hrs after t - 0)
61.08
.15
.22
.32
.41
. 50
.57
.63
.70
.78
62.00
. .25
.50
.75
63.00
.25
.50
.75
64.00
.25
.50
.75
65.00
.25
.50
.75
66.00
.25
.50
.75
67.00
.25
.50
.75
68.00
(bias)
(bias)
Data
843077341
81941
82141
82341
82841
' 82941
82941
81741
82641
82541
82541
952205941
843082741
83741
82841
83141
83241
83041
83641
83441
83441
82841
82541
83341
82641
83141
82541
83741
83141
83041
82641
82541
82941
952205941
843082041
16

in
cb
O
cc
CM
OO Z_
CO CC01 UJh- >> 2
qco
qco
co
o.
—* ^j
I D
I
S
S2 S
UJcc
coo
"I u
cb o
UJD
uj QO ^
LU UJCC CC
qo
0)CO
4)
CB
H
0>DJOcut,0)
<
o^In
coU
aCO
-r-l
QOH
co
a;Q
qo«r
qoCM
qa
qoCM
qo
NOIJ.VIA3Q AVIdSIQ
17

Temperature data was recorded continuously on one set of strip chart
recorders and hourly on a digital thermocouple recorder. Although the simulators
were well instrumented with many thermocouples the average temperature of three
strategically located thermocouples on each simulator was taken as the simulator
temperature.
3. 1. 5 RESULTS. - The temperature response at the three monitored TG components
(I-oven, battery, and housing) is shown in Figure 8. The maximum temperature of
the I-oven was about 110 F occurring at about t = 48. 5 hours, just into the first rest
period. Rest I cooled the I-oven enough to limit its maximum temperature after
Traverse II to about 98. 5°F at t = 72 hours.
During Traverse I a total of thirty measurements were taken (grav + bias).
The last two display digits were "4l" for the first eighteen measurements, "42"
for the next nine, and "62" for the last three points. Thus, the P-oven went 0. 018°F
above its control set point. For the second traverse a total of thirty-five measure-
ments were made but the last two digits never changed from "4l" (0. 009°F above
set point).
The total battery power consumption for the mission was 11.3 amp-hours.
3. 2 TG QUALIFICATION VIBRATION TP 25080/TP 25081
3. 2. 1 GENERAL. - The qualification vibration tests of the Traverse Gravimeter
were performed on 11 and 14 August, 1972, at the Special Test Facility of the CSDL.
3 .2 .2 PREPARATION. - Early in the program, a mechanical mock-up of the TG
was built (called Mechanical Unit) which simulated as closely as possible the weights
and compliances of the major components. Critical parts were instrumented with
vibration accelerometers, in particular a dummy VSA. Before the qualification test
was performed, this mechanical model was subjected to the test levels in an attempt
to predict the effects on real components, and several qualification dry-runs were
performed to familiarize personnel with the procedures.
Prior to the test the control accelerometer was calibrated by comparing it
with one belonging to R&QA which had previously been calibrated with NBS Trace-
ability.
3.2.3 APPARATUS.. - The following instruments and apparatus were used:
Ling PP60/140/c70 Shaker and Slip Table.
Isolation Vibration Fixture.
TG Z axis Fixture.
Endevco Accelerometer.
Hewlett Packard 136A X-Y-Y recorder.
Kepco #52-256-96 Power supply and Associated cables.
18

crHI
<CD
<O
O
O
inoc
O
g
CO0)H
o0)
oa>
II— <rt
• 6
111OC
Oin
e?
J
ooo
o(O
OCO
tuoC'£
Pin0)
(UaSO)
C0)
oa.
oUOEH
00
oo
o8 °0
00
Co o§
19

Isoframe assembly.150 pound Spring assembly.TG Mechanical model.TG Flight System #2 (Qualification Model).
3. 2. 4 VIBRATION PROFILE. - The sinusoidal and random profiles were thosespecified for the TG location in the LM. Two level reductions at specific frequencieswere requested because of.possible damage to the VSA. These were reviewed byNASA and approved as being consistent with actual flight levels. The TG axes arerelated to LM axes as follows:
TG LM
X a
Y XZ /3
3. 2. 5 PROCEDURE. - The first test was the combined environment test of theisoframe mechanical unit, TP 25081. The isoframe was mounted on the slip tableof the shaker with the input along the TG Y (Launch axis). The mechanical unit wasmounted on the isoframe and the spring loading assembly attached to it by means ofa web sling. The spring was stretched to provide a static load on the TG of 150pounds to simulate the maximum launch accelerating of 5 g's on a 30 pound package.The assembly was then subjected to 0. 9 g's @ 6 Hz for 10 seconds. This test indi-cated that the worst expected combined environment would not cause the isolatorsto bottom. This was considered an important design goal.
The remainder of the isoframe qualification was combined with the TG tests.
Since the shaker was already set up for the Y axis, it was decided to deviatefrom the sequence indicated in TP 25080 and do the Y, Z, and then X axes. R&QAand ONR concurred with the deviation. The procedure for the Y axis was repeatedfor the Z and X axes using the appropriate vibration profiles, and only the Y axisis described in detail.
•»The mechanical unit was mounted on the isoframe and secured with flight
pins. The sinusoidal dwell level, 0. 9 g's @6 Hz, was applied for a time sufficientto obtain a record of level on the X-Y-Y recorder. The level was verified and themechanical unit removed and FS2 mounted. The dwell level was applied to the TGfor the required 10 seconds. No visible failures were observed and the TG wasremoved and a 3 measurement test as described in TP 25076 performed.
The mechanical unit was replaced and the sine sweep for the Y axis wasrun at 3 oct/min and recorded. FS2 was then mounted and this shake performed.
20

Actual time for the sweep from 20 to 100 Hz was 1 minute 26 seconds. The 3
measurement test was repeated on the TG.
The X axis qualification random profile was then set up on the random
signal generator. When it was in satisfactory agreement with the specification, the
vibration was applied to an empty fixture and the profile recorded on the X-Y-Y
recorder. The mechanical unit was then mounted and the procedure repeated, using
a 1 oct/min sweep rate for the recording filter. The shaker table motion agreed
with the specification and so the mechanical unit was removed and FS2 mounted.
The shaker was run at 1/2 Qualification power level for a time long enough to re-
cord the profile on the X-Y-Y recorder at 3 octaves/minute. Again the record was
satisfactory and the actual test performed at full power as determined by integrating
the spectral power density of the profile. In this case it was 6. 1 g's rms. The
duration of this test was 1 minute.
This completed the Y axis vibration and a 10X test of TG performance was
done as described in TP 25075.
The fixture was then rotated 90° on the slip table for a Z axis input and the
sequence repeated. For this axis, the random level was 7. 8 g's rms.
Following completion of Z axis shake, the shaker was rotated 90 to the
upright position for X axis. Testing was then adjourned for the weekend, and the
TG returned to the test lab.
The X axis shake including a random level of 8. 2 g's rms was performed
on Monday morning thus completing the flight portion.
The final portion of the test was Rover simulation and was performed on
Monday afternoon. The Z axis fixture was mounted on the shaker and the iso-.
frame was mounted on it. The vibration profile was verified with the mechanical
model. For this test the TG was mounted without the flight pins and the Velcro
fasteners on the display and radiator covers were removed. Because of some
difficulties in obtaining the very low frequencies, the test was performed in two
stages sweeping from 5 to 10 Hz for 15 minutes and then from 10 to 20 Hz for 15
minutes. No performance checks were made between the stages.
3. 2. 6 RESULTS. - No external failures were noted in any of the components. The
instrument showed a bias shifting of 17. 5/ig and a scale factor shift of 2. 59 ppm.
3.2. 7 CONCLUSION. - The TG-isoframe assembly is capable of surviving the
flight vibration environment. The bias and scale factor shifts are considerably less
than those sustained in acceptance vibration (91|/g's and 5.87 ppm respectively).
The isolators perform as predicted and do a satisfactory job of protecting the TG;
also the isolators will not bottom out during the most severe combined loading.
21

3. 3 TG PERFORMANCE TEST TP 25045
Table III summarizes the results of TP 25045.
3. 4 BASELINE VERIFICATION TEST TP 25075
Table IV summarizes the results of TP 25075.
22

NOTES
BFF PAD 5
ON VACUUM
THERMAL-VAC
DATE
7/10/72
7/10/72*
TABLE III TP 25045
MEANSHORT TERM LONG TERM
DRIFT** DRIFT
843-0752
8430749
0. 164
1.230
0.471
2.199
0.504
0 .229
- TRAN 1
- T-RAN 2
BFF PAD 5
POST VI B
BFF POST
COOLDOWN
SPECIAL TEST
ON BATTERY
7/26/72*
7 /27 /72*
8/22/72
8/22/72*
9 / 6 / 7 2
9/6/72*
9/8 /72
9/8/72*
8430840
8430832
8430995
8430986
8431041
8431034
8431035
8431033
0.514
0.442
0.209
1.490
0.121
1.160
0.156
0.332
0.033
-2.159
2. 130
3.612
0.923
-0.280
0.402
0.929
0.573
-1.399
-0.142
-1.755
* PLL Data** No Specification applies.
23

TABLE IV TP 25075
NOTES
CAMBRIDGE
BFF PRE-VIB
BFF POST-VIB
BFF TP 25045
CAMBRIDGE
BFF POST T-V
BFF POST VIB
- Y AXIS
- Z AXIS
- X AXIS
- ROVER
BFF TP 25045
BFF POST COOL
#W/O 2 BADTEMP DATAPTS
DATE
7/6/72
7/7/72
7 / 7 / 7 2
7/11/72
7/13/72
8/3/72
8/11/72
8/11/72
8/11/72
8/14/72
8/14/72*
8/24/72
9/7 /72
8/14/72
TILT •
YES
YES
YES
NO
NO
NO
YES
YES
YES
YES
NO
NO
YES
BIAS (Hz)(Average)
7.820176
7.820838
7.832572
7.831188
7.831136
7.829680
7.828798
7.828559
7.827489
7.827494
7.826542
7.825849
7.827430
o (vg)
0.537
0.365
0.459
0.316
0.167
0.383
0.370
0.264
0.257
1.031
0.254
0.273
0.307
S/F(Hz/g)(Average)
128.808242
128.808042
128.808798
128.808818
128.809808
128.809202
128.8.09588
128.809559
128.809669
128.809610
128.809500
128.809493
128.809535
a (PPft
0.216
0.262
0.238
0.134
0.151
0.202
0.527
0.259
0.257
1.191
0.210
0.072
0.281
24

SECTION 4
FAILURES AND DISCREPANCIES
4. 1 FAILURE REPORTS
There were two FIARs, 03 and 04, written against TG 002.
4. 1. 4 FIAR 03 (Exhibit A) documented an out of specification condition that was
discovered after reduction of the data obtained from the first performance test,
TP 25045, during pre-qualification acceptance. The performance specification
with the phase lock loop in requires that the standard deviation of a least square
line fit of the data be 1. 0 ppm or less. Reduction of the data showed it to be 1. 2299
ppm. This condition resulted from two factors, 1) the phase lock loop module
specification was too loose; the stability requirement at the module level was less
than 3. 0 ppm, and 2) the test was run with external power and the breakout box
inserted instead of the battery. Because the breakout box does not have the thermal
mass of the battery the phase lock loop was subjected to thermal changes that it
would not see when mounted on the battery.
The obvious incompatability between the system specification and the module
specification was corrected by tightening the module specification to 0. 75 ppm.
Additionally, the performance test, TP 25045, was revised to have the test run on
internal battery power.
A waiver, 0005 (Exhibit B), was prepared at QTRR and approved by MSC
to allow continuation of the qualification test with the out of specification condition.
The condition was present on all subsequent performance tests run with the break-
out box in.
FIAR 03 has been closed out by MSC.
4. 1. 2 FIAR 04 (Exhibit C) documented an out of specification condition that was
noted after performing the baseline verification test, TP 25075, that was run after
the simulated rover vibration of TP 25080. This condition occurred because the
thermal design has marginal control capability during earth testing without vacuum.
The precision oven temperature decreased about 0. 03 C from nominal, as evidenced
by the last digit of the display going from a 3 to a 6. Apparently the rover vibration
25

NASA - MANNED SPACECRAFT CENTERFAILURE INVESTIGATION ACTION REPORT
NU \ vik Oil
1. PROJECT 2 WHERE DETECTED 3. ORCT^<v«A«3* FACILITY Organization LOCATION
6. CONTRACTOR 7. END ITEM NAME 8. ITEM UN°DER TE
11.TPS NUMBER 7a. El MODEL NO. 8a. CONTR. PART C
12. ROUTING VIA 7b. El SERIAL NO. 8b. SUPPLIER PAR
13. SPEC/PROCESS NO. 8c. SERIAL NO.
DATE: PARA:14.COND. 15. CAUSE 16. SYMPT 17. Fail TYP 18. Detected 19.
During
3. REPORT NO. 4. PROS. CLASSIF. 5. DATE REPORTEDD FAILURE _ ... _ _DUNSAT. COND. ^ - \H- » J-
ST 9. NEXT ASSY. NAME 10. REPORTED ITEf,'
JO. 9a. CONTR. PART NO. .10a. CONTR. PART NO.
TNO. 9b. SUPPLIER PART NO. 10b. SUPPLIER PART NO.
9c. SERIAL NO. 10c. SERIAL NO.
20. SYSTEM NAME lOd. Time/Cycles (ACUM)
21. DESCRIPTION OF FAILURE/CONDITION
22. CRITICALITY K-^c^^Vcv-c^t. Tea-s^ ^r-'-c
23. INITIATOR/CONTACT ORG. DATE 24
25. HARDWARE ANALYSIS REQUESTED/INSTRUCTIONS
26. ASSIGNED TO ORG. DATE 27
~" ^° C^^^.-T«rt
RIE ORG. DATE
REQUESTER ORG. DATE
28. CAUSE OF FAILURE/ANALYSIS RESULTS
"ii O ""* *"
^BJT iew*- -C-VHI.RXJ- «. v^uov •
29. SYSTEM ENGINEER ORG. DATE 30
31. CORRECTIVE ACTION REQUESTED
32. ACTION ASSIGNED TO ORG. DATE 33
34. CORRECTIVE ACTION TAKENYS)O. vJ^J j ,j O^~Q£JOG\V' fe CA CKO^Ni J b \W^ ^^SyXjjA. ^
^^ * ^~^~> "* ClC3k \ . "^^yWtfT* ^g. . ^^ . t^ • i| *
-V, . ,.5 ; r,-JCSs%.A;__^ V ^ _ ,
35. ACTION BY ORG. DATE 36. RIE ORG.
RIE ORG. . DATE
REQUESTED ORG. DATE
3^^, cirxcM-vojB^ -Se» r«a~,.s\».fe r^ej-^*-"M«lT Cl«.' feC. ^LQ^-S^fc,
DATE 37. CLOSE-OUT DATE-
MSC FORM 2174 (JUL 66) PAGE J_ OF \_
Exhibit A Failure Investigation Action Report No. 0326

No. 0005
CHARLES STARK DRAPER LABORATORY
DEVIATION/WAIVER REQUESTCATEGORY A
DATE 7-24-72
SHEET 1 OF 1
PART NUMBER 2025000 NOMENCLATURE Traverse Gravimeter
NEXT ASSEMBLY ' FINAL ASSEMBLY 2025000 .
SERIAL NUMBER FS - 2 QUANTITY INVOLVED 1
VENDOR MIT/Draper Lab . CONTRACT NUMBER NAS 9-11555
PURCHASE ORDER NUMBER TYPE FP CPFF CPIF
DETAILS OF NON-CONFORMITY: Failed Step F-5 of Performance Test Procedure
TP 25045
REASONS FOR NON-CONFORMITY:
Standard deviation of performance data taken with Phase Lock Loop "in", exceededthe 1.0 ppm spec by 20%. Cause of the problem is due to the module spec being thesame as the system spec. In this case, the module performance was at the limit ofthe spec and there was no margin for system error.
ACTION THAT MIGHT BE TAKEN TO CORRECT DEFECT IN EXISTING ITEM, IF ANY:
Replace PLL #4 with one having tighter performance characteristics. However, it isrecommended that PLL #4 be left in system 002 until after qualification test becauseof the unavailability of other PLL modules.
ACTION TAKEN TO PREVENT RECURRENCE OF NON-CONFORMITY:
1. Module test specification was tightened to 0.75 ppm per ECR 20534.
2. Test procedure changed to reflect that measurements be made with TG on internalbattery power per ECR 20535. (Ref. T.P. 25045)
EFFECT ON PRODUCTION SCHEDULE/COST IF REQUEST NOT APPROVED:
Delay of several weeks for resumption of qualification testing due to unavailability ofPLL modules.
LIMITATIONS OF USAGE: YES | | NO
APPROVALS
RELIABILITY
(
DESIGN ENGINEERING/DRB
CUSTOMER REPRESENTATIVE
TP 22925-1
Exhibit B Waiver 000527

NASA MANNED SPACECRAFT CENTERFAILURE INVESTIGATION ACTION REPORT
1 PROJECT 2 WHERE DETECTEDFACILITY I Oigani/ation LOCATION
3. ORG. REPORT NO. 4. PROB. CLASSIF.0 FAILUREffl UNSAT. CUND.
S. DATE REPORTED
6. CONTRACTOR 7. END ITEM NAME 8. ITEM UNDER TEST 9. NEXT ASSY. NAME 10. REPORTED ITEM
11. TPS NUMBER la. El MODEL NO. 8a. CONTR. PART NO. 9a. CONTR. PART NO.Ni ifv
lOa. CONTR. PART NO.KJIK
1?. ROUTING VIA 7b. El SERIAL NO. 8b. SUPPLIER PART NO. 9b. SUPPLIER PART NO.VOIP-
lOb. SUPPLIER HART NO.K i-
13. SPEC/PROCESS NO.
DATE: PARA:
8c. SERIAL NO. 9c. SERIAL NO. 10.. bERiAL NO.
14.CONO. 15. CAUSE 16. SYMPT 117. Fail TYP 18. DetectedDuring ^,
19. 20. SYSTEM NAME lOd. Time/Cvclei (ACUM)VOift
21. DESCRIPTION OF FAILURE/CONDITIONx*- .
"X. A'i.
22. CRITICALITY
23. INITIATOR/CONTACT ORG. DATE 24. RIE ORG. DATE
HARDWARE ANALYSIS REQUESTED/INSTRUCTIONS
26. ASSIGNED TO ORG. DATE 27. REQUESTER ORG. DATE
28. CAUSE OF FAILURE/ANALYSIS RESULTS
29. SYSTEM ENGINEER ORG. DATE 30. RIE ORG. DATE
31. CORRECTIVE ACTION REQUESTED
32. ACTION ASSIGNED TO ORG. DATE 33. REQUESTED ORG. DATE
34. CORRECTIVE ACTION TAKEN
.V'..r .cv
^«-*^<ev»«^. >Wcv
35. ACTION BY ORG. DATE 38. RIE ORG. DATE 37. CLOSE OUT DATE
: ^OHM 1174 IJULSei
Exhibit C Failure Investigation Action Report No. 04\ . 2 B I ^

test fixture acted as a heatsink and caused cooldown to the oven. After removal
from the test fixture, the first measurement indicated a temperature shift had
occurred. All subsequent measurements were normal. However, by factoring the
first measurements into the calculations for standard deviation of bias and scale
factor, it was sufficient to cause the system requirement of TP 25075 to be out of
specification. The standard deviation of the five bias measurements should have
been less than 1. 0 mg - it was 1. 031 mg. The standard deviation of the five scale
factor measurements should have been less than 1. 0 ppm - it was 1. 191 ppm.
A waiver, 0006, was prepared to allow continuation of qualification testing,
but MSC has indicated that the waiver is not necessary.
FIAR 04 has been closed out by MSC.
4.2 DISCREPANCIES
Discrepancies were documented on the MIT/DL internal form. Any anomaly
that did not warrant recording on a FIAR was recorded on the internal form. Two
discrepancies were noted during test:
4.2. 1 MIT/DL failure report #29 (Exhibit D) documented an out of specification
condition at step D. 7 of TP 25025. Step D. 7 requires the battery heater thermostat
to turn on at 47 ±6 F when the chamber temperature is lowered to 20°F. The
battery heater thermostat came on 39°F, two degrees below tolerance. Because
of previous problems that were experienced with the Daystrom recorder, a calibra-
tion check using an ice bath and thermometer was performed; the particular
channel in question was found to be reading two degrees below actual temperature.
Allowing for the recorder error, the reading obtained is considered within the
allowable specification.
4.2. 2 During teardown of the TG 002 after qualification test it was noted that the
anti-backlash gear segment was not centered on the pinion. This condition was
documented on internal failure report #31 (Exhibit E). Condition was caused by
tilting the TG off vertical more than fifteen degrees during bias measurement of
TP 25020 on August 22. The TP 25020 has been clarified by ECR 20548 to prevent
recurrence of this condition by test personnel.
29

MASSACHUSETTS INSTITUTE OF TECHNOLOGYINSTRUMENTATION LABORATORY
FA I LURE REPORT ING FORMSHEET \ OF L
Project: End Item Name: Serial No. No.
Assembly Nim«; Dwg. No.: Serial No.
Part Nam*: Dwg.No. Date:
Description of Failure:
Orlginitor
Failure Analysis:
^a 'V^v V3.<^^<ps«ak
Engineer Date
Corrective Action:
^S.Ccs^fR fc QA Engineer Date
Exhibit D MIT Failure Report No. 2930

MASSACHUSETTS INSTITUTE OF TECHNOLOGYINSTRUMENTATION LABORATORY
FA I LURE REPORT ING FORMSHEET I OF L
Project: End Item Name: Serial No.
Assembly Name: Dwg.N<x: Serial No.
Part Namt: Dwg.No. Date:
Description of Failure;
IOriginator
Failure Analysis:
Engineer Date
Corrective Action:
<Y
^^^^"^ >
^^^
X-^Cv
R I QA Engineer Date
Exhibit E MIT Failure Report No. 3131 .

SECTION 5
SUMMARY OF WAIVERS AND DEVIATIONS
Waiver #0005 (Exhibit B) was the only waiver written against the TG 002.
This waiver was requested because of an out of specification condition that was
observed during the pre-qualification acceptance test. The condition was docu-
mented on FIAR 03. Waiver #0005 has been approved by NASA/MSC, and FIAR 03
closed out.
33

SECTION 6
SUMMARY OF ECR'S
6. 1 ECR 20518:
Clarified test procedure and added instrumentation tolerance to TP 25025.
6.2 ECR 20520
Corrected incorrect formula needed for calculation in TP 25075.
6.3 ECR 20519:
Corrected typographical error in TP 25015.
6.4 ECR 20535:
Changed TG configuration for performance of TP 25045.
6.5 ECR 20517:
Clarified operational procedure in TP 25020.
35

SECTION 7
DEVIATIONS FROM QUALIFICATION TEST SPECIFICATION
7.1 PROCEDURE NO. ND 2025808, PAGE 22, PARAGRAPH 3. 2, 6. 1. IB AND C
TP 25036 is slightly different than outlined in this paragraph. Instead of
the alternating between Normal and Bias measurements, Normal measurements were
made. A Bias measurement was made at the start and at the end of the test and
approximately thirty-two Normal measurements were made. This sequence simulates
more exactly the actual traverse sequence planned for Apollo 17, and it was felt
more engineering information could be gained with respect to the TG operation on
the traverse.
7.2 PROCEDURE NO. ND 2025808, PAGES 38, 39, 41, 42, AND 43
The actual test flow differed from that planned in the Qualification Test
Specification. The actual test flow is listed in this report paragraph 8. 2. The
reasons for the changes were to affect a more expeditious test flow and to reduce
configuration changes. These test flow changes were coordinated with NASA/MSC.
37

SECTION 8
DEVIATIONS FROM QUALIFICATION TEST PROCEDURE
8. 1 PROCEDURE NO. 2025810, PAGE 3, PARAGRAPH 3. 3.4
In addition to the Daystrom recorders indicated, a Kaye Model 8000 digital
thermocouple recorder was used.
8.2 PROCEDURE NO. 2025810, PAGE 7 AND 8
The order of the test program was changed in order to affect a more expedi-
tious performance of the tests because of availability of test facilities, personnel
and configuration of the TG. The test order follows:
As Performed
DL-11 25025 DL-11
25075
25075 BFF
25030
BFF 25075
25015
25045
25075
25020
25075 DL-11
25085
25055
25035/46 BFF
25075
25081
25080
25015
25020
25045
DL-11 25075
10 day cool down
12
3
4
5
6
7
8
9
10
11
12
13
14
15
16
2025810
25085
25055
25025
25075
25075
25030
25075
25015
25020
25045
25035/36
25075
25080
25081
25015 .
25020
25045
cool down
25045
25025
39

25045
25075
25045*
25075*
25025 DL-11
NOTES:
*Tests added to verify better TG performance tests by running TG on Battery
rather than Power Supply.
In addition, TP 25075 was performed after transportation of the TG more
times than anticipated in 2025810.
40

SECTION 9
SCHEDULE CONSIDERATION
9. 1 The "As Performed" Qualification test schedule is indicated in Figure 9.
41

iX X m 52 orn jo S3 S °
00
55.
00
OT ,
3?
sSi
CO
5
5
5
CO
5.
m
o
CO
o
al
§ <" r :
-
- •
-
-
-
-
-
-
11
UJ £
ii o. aZ u-O o.U UJUJ CCCC Q.
D
§ £U
-
- 1 ~ rs
CM
CC— CC
H— - o
§ inVolCN^ CN'
ino o^
_ M in m £^ uv
t-— Cfl
— (M Kk O O OO^ W r in in in
r
a -
r a-°^ § "^
HI CM 1 *^ SM S
00
§ ]o
.8 :o
Q
in
Sk Ol»
H lh ^ ^
Kco
er'g -
-
-
-
.
-
-
-
-
-
-
-
-
(U
Sch
ed
u
c3
en
O
02
ta
42

SECTION 10
PHOTOGRAPHS
43

Fig. 10 Typical Launch Depressurization Set-Up
44

Fig. 11 Typical Performance Test Set-Up
45

aa
o13
ocd
01
H
(M
T-
fn
46

CD3"dcti
a
o15
s3
O
OJ
47

.cu
I
o^
Uoi
a
u
48

DQ0)HOJ
B03
Ow
aDi— I
ctiO
O0)
1)-MOJ
B'r^
cahO0)raho
cS
SX)• H
fe

Fig. 16 TG Qualification Vibration - Y Axis
50

o
ao•t-<-Mcdo
O
fc»0•iH
fe
51

Fig. 18 Rover Vertical Vibration
52

SECTION 11
TEARDOWN AND INSPECTION
After completing all prescribed tests in accordance with the Qualification
Test Procedure, 2025810, the system was partially disassembled to allow for
inspection of damage and replacement of the phase lock loop module, S/N 004, in
accordance with MSC direction per MSC memo EG9-72- 140.(Exhibits F and G).
The TG main cover was removed and the battery pack assembly extracted.
This allowed inspection of the base harness, gimbals, and gear boxes; by rotating
the gimbals it was possible to inspect the TIE" frame harness.
The "E" frame harness was examined for conformity to revision A of
PFP #29 (Process Flow Plan). Rework of the tie points to the harness was required
to obtain conformity to revision A of the PFP.
It was noted the anti-backlash gear segment was not centered on the pinion.
This condition was documented on internal failure report #31. During performance
of TP 25020, while doing a bias measurement the TG was tilted greater than fifteen
degrees; apparently this caused the gear segment to come off the pinion. It came
back on the pinion when returning to normal position, but was off center. The offcenter condition had no effect on the TG. The anti-backlash gear was recentered
during reassembly of the TG in preparation of reacceptance test. The phase lock
loop module S/N 004 was replaced by S/N 006 in accordance with MSC direction.
No other anomalies were noted and the TG was reassembled in preparation of
reacceptance tests.
53

WORK REQUISITION
PROJECT:CHARGE: DATE:
UNIT NAME: NO.REO.. REQ. BY
DWG. NO.REV ORIGINATOR:.
SPECIAL INSTRUCTIONS
ASSEMBLY S/N
RAW MATERIAL DATA
TYPE: LOT NO. OR PO NO.
OPERATION INSTRUCTIONS/RECORD
OPR.NO.
DESCRIPTIONcoMPirrioN
DATEOPERATOR OR INSPECTOR
INITIALS OR STAMP
^Bn^QSfcA—J«^- Ag.»acs%. i g. " g." Prc^rna
COMPLETION APPROVALS:
FOREMAN/SUP. WISOR AREA OR SHOP . OC REPRESENTATIVE
Exhibit F Work Requisition54

"^&!(PROJECT)
ASSEMBLYNAME
ADDENDUM SHEET W
ASSEMBLY WORK ORDER
DWG.N0- •i.oaa^o^
REV.
n NO "MO
PAGE OF
ASSEMBLY
SER. NO. ^«5>-3_
BUILD HISTORY/CHANGE INCORPORATED:
STEPNO.
TYPE DESCRIPTION PERFORMED BY DATE
\ O .\'
Exhibit G Work Requisition'_. :_ . cci ' •
" ~.." ODi

SECTION 12
MSC FORM 772
Exhibits H - L are copies of MSC Form 772 historically recording the
significant events of the Qualification Test program on Traverse Gravimeter Flight
System No. 2.
57

= *iouUJ
ya:Oto
SY
ST
EM
AN
D C
OM
PO
NE
NT
DR
AW
ING
NU
MB
; o! S
i
11
10
1/1UJ_JU
UUJ
ZUJ>UJ_l<yOLo
. i/)£x
(N
UJ
•<— a
'(I
Ixt
<r-w
cr
r
s r
\
,
ifj
8nr
4
I
j?'t
(HOO0)
rto
O4->CO
QJflOaaoUT3
rt
sCD
-i->CO
B•*-»•F-l
|
w
58

o.2 a
K
i/iu_)uuLU2
l/tzLU.>LU_J<U
5o
.1/1
if'if
(.1•III
(K
(Ir
iiiO'
Kit
I
J
0II
o-K
II
I
J
IiII
6I
ri4o^yt
5 v
•>
c(
(&
1•Ql
i
y
i i
j\
o
f. u»,
0
UJ
n_ror
tt rr7)^*
r
r f r
59 /

coU
OO<D
CflO
CQ• r-l
ffi
§
O<aoU•acai
S0)
w
60:

a.
1
sU
IJUl
tn
OR
ICA
L E
VE
NT
!
Ǥ
zr\
12.
LO
CA
TK
1 1 iuuK
"°
-
^
—
**1
(
1
-wys
s
X1
C
Irr
<P
1
s
*
r.\A
$
(
i
1i
ii
Ii(
(
• 0r• ii<
iiiI
a
s
x
i
i
i^
.1<i
, 0
u
rfI"?
^
pI\
r
I>
•I
I' I
I
J
I/
I
(
J
J
Ci
IiI
d£
I'J
. icc
(fKj
?
rf*
2
(1
0
*••
1
J
i
Id
r
K
/X>
1
cii
u-
r
|
5
I
-
s
\• Ic*/
1111
$H(jiIf>
X(
cJ
?C
(
0Y4
-i
ii 1
r
"3V
K
<ofo*
-dh
|
i•i
'i3
i
1
(f
r
H-u
f
Ii
!1t
• ' . <t
i0-K
'
^
.1
r
/r
1
1r
•1
••
icb
>
1
C
u-dkd
rr;
r
«
i
'".
*•
1
'
»J
0-Y
- *
• r
c
(3
>
Xi
c
a-j
rr
r
' '*
k*
7
'
ii
i
: C
>/
i
1
!
Id<
/I
11I
(
t
i
..
^
(
-tf
10
•1
^ >
>
i
1
t
0
1
rr1r
'
i
)
^
dr
. u
x
1
X
u
rff
*"
1i
7 J
i
iintV
.
t1,
• <. 1
IJj
cl
j<r
i•
•
i
*,
>
y
1
0
fjtf
s
j
&
1
IA(r
>
1
r
f
iK
J
•11
'1
J
(
(
^
1
Tf
6
ID
7
rfC
^
(
\
<
4
il
>
^
^iL
i»
^
r_rJ<r
iI)
sV4
j
1
1 {
J
^
/
t
r
f(i• t
d
\
1
ff
1u11
1d1j5*|,
' 0
'1«
1
310
J
1
^^rj
^^
61

Q
0(JUJ
-J
< >&LO
!£1
AN
D C
OM
PO
NE
NT
2UJ
toto
* ji oi 0<(CUlVI.
(ri
I o3 —
5 t:U. jS3 5Z
5
il
3.
DR
AW
ING
NU
MB
ER
'2LO
.1II£
><=5«aK
NU
MB
ER
2Ul1-
cj
Of
rf) hiui# £2 £
111• fr** t5'
t.UlU.U.Ul
01
MUl
O
U
•iK
1 8.
LIF
E L
IMIT
S:
UlO
ccon
OP
ER
AT
ING
ft \
(t %b a)
uV mui *F .•> » Oj
OL X V
•" J
2Ul
tn
U1-(A>•<"id
0
NS
TR
UC
TI
OZ0.
I
1CQ
Z
(9Z3ozI_l
SP
EC
IA
0
Q-
|—to
toUJ_JU
<JUJ
. 2
2 K
to
z
13.
HIS
TO
RIC
AL
EV
E
ZoH
Uf^O
UJH
i-1
iu1T
1J
$
1
"i
ijf.,
cr<
**
4
^
\
U-U-
f£
0
I
rtlif
7
/1J
, 1\
'{
i
• \4|
!ii
J, X
t
^£
JKiBl
ll
n.j1\\i•ft
C
It
«Y
(
i•ft I
• ?Y:
\f
*
\w'
41
£
f
-<
f1i
ft°l
i
C
4
*t
• I
i
s
, \\1
A
(
Ut
\f
*.i0
U^
\
I
• tr7.-*
i#
t{^4
A
7t
. .<
4
t1
;4
75
o„
J ?
|
-f
"iii
/L
i—^
T"
c
//P1
i/rs
**
,
. <l
' fi•j
^T
- .
oU
•goo
COo
• r-lfnO
-i->CO
C(U
o
soU
•a0]
03
XW
62

SECTION 13
CONCLUSION
Very few serious problems were encountered during the Traverse Gravimeter
Qualification test program. Of the problems that did occur most were procedural
errors or typographical errors in the Test Procedures, or improper tolerances.
One reason for this is the initial failure of the Engineering Unit which therefore did
not allow pre-running the Test Procedures before the actual Acceptance and Quali-
fication testing. This led to the performance of some of the Test Procedures for
the first time on the Qualification Unit. In order to avoid problems because of this,
efforts were made to ensure that test personnel either designed or wrote the test
procedure, and were therefore most familiar with the purpose of the test.
One other difficulty encountered during the test program was difficulty in
re-configuring the TG for test. The main reason for this is again the lack of the
Engineering 'unit to gain experience on and originate procedures from this experience.
Therefore most of the work done in this area was generated without actual hardware
to work on.
One important configuration change was made for TP 25045. It was dis-
covered that the TG performance data improved appreciably when the TG was
powered by a Battery rather than a Power Supply. TP 25045 was modified to include
this change.
The TG successfully passed the Qualification Tests with no serious mechanical
or performance degradation and all of the minor problems were cleared through the
appropriate paper work. In conclusion, it is felt the Qualification test program was
successful and that the Traverse Gravimeter has demonstrated the ability to suc-
cessfully undergo the Apollo 17 mission.
63