Embed Size (px)
Citation preview
Charts
Financial stability 2/06
Summary

0
0.3
0.6
0.9
1.2
1.5
1998 1999 2000 2001 2002 2003 2004 2005 20060
2
4
6
8
10
Chart 1 Banks’ Tier 1 capital ratio and pre-tax profit as a percentage of average total assets.1)
1998 – 2005 and as of 2006 Q3
1) Excluding branches of foreign banks in Norway
Source: Norges Bank
Profit before loan losses(left-hand scale)
Profit after loan losses (left-hand scale)
Tier 1 capital ratio(right-hand scale)

0
1
2
3
4
5
6
1987 1990 1993 1996 1999 2002 20050
1
2
3
4
5
6
Source: Norges Bank
Chart 2 Banks’ interest margin. Percentage points. Quarterly figures. 87 Q1 – 06 Q3
110
120
130
140
150
160
170
180
1987 1990 1993 1996 1999 2002 2005110
120
130
140
150
160
170
180
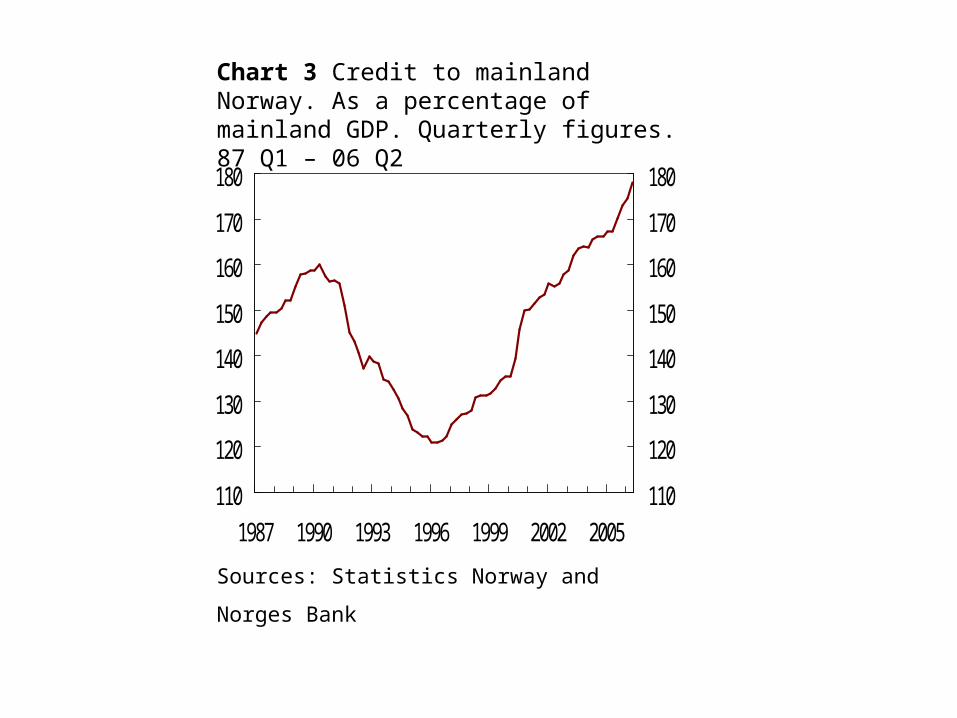
Sources: Statistics Norway and Norges Bank
Chart 3 Credit to mainland Norway. As a percentage of mainland GDP. Quarterly figures. 87 Q1 – 06 Q2
-4048
1216202428
1997 1998 1999 2000 2001 2002 2003 2004 2005 2006-40481216202428
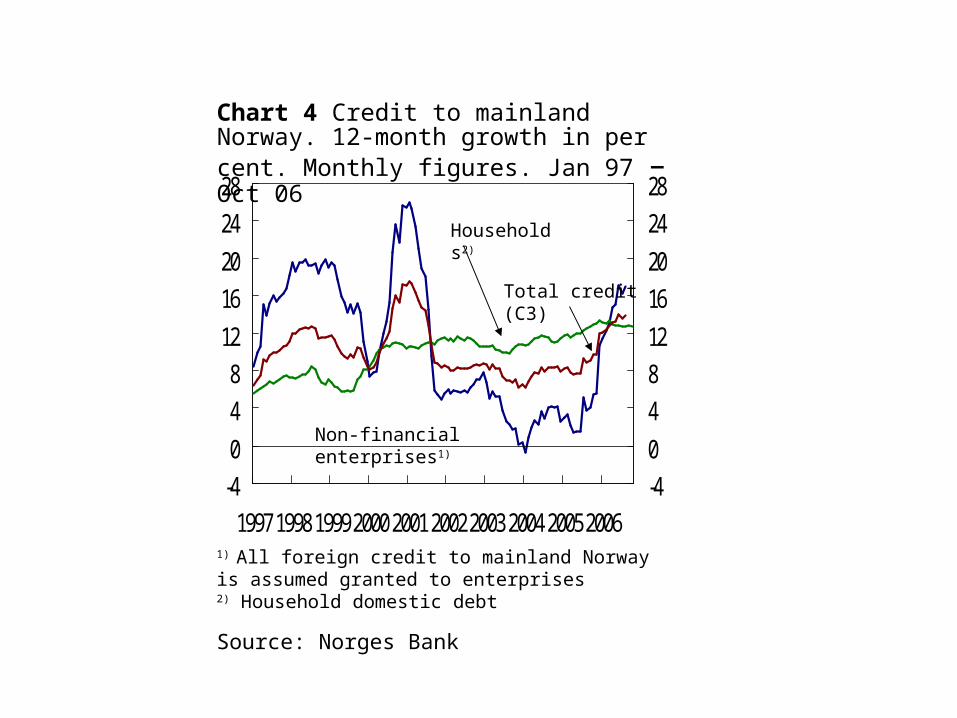
Non-financial enterprises1)
Households2)
Chart 4 Credit to mainland Norway. 12-month growth in per cent. Monthly figures. Jan 97 – Oct 06
Source: Norges Bank
1) All foreign credit to mainland Norway is assumed granted to enterprises 2) Household domestic debt
Total credit (C3)

0
50
100
150
200
250
1985 1988 1991 1994 1997 2000 2003 20060
50
100
150
200
250
Deflated by house rent Deflated by
building costs
Deflated by disposable income2)
Deflated by CPI
Chart 5 Real house prices. Indices, 1985 = 100. Annual figures. 1985-20061)
1) Estimates for 20062) Disposable income less estimated reinvested dividend payments for the period 2000-2005
Sources: Association of Norwegian Real Estate Agents, ECON, Finn.no, Association of Real Estate Agency Firms, Statistics Norway and Norges Bank
-20
-10
0
10
20
30
40
50
2002 2003 2004 2005 2006-20
-10
0
10
20
30
40
50
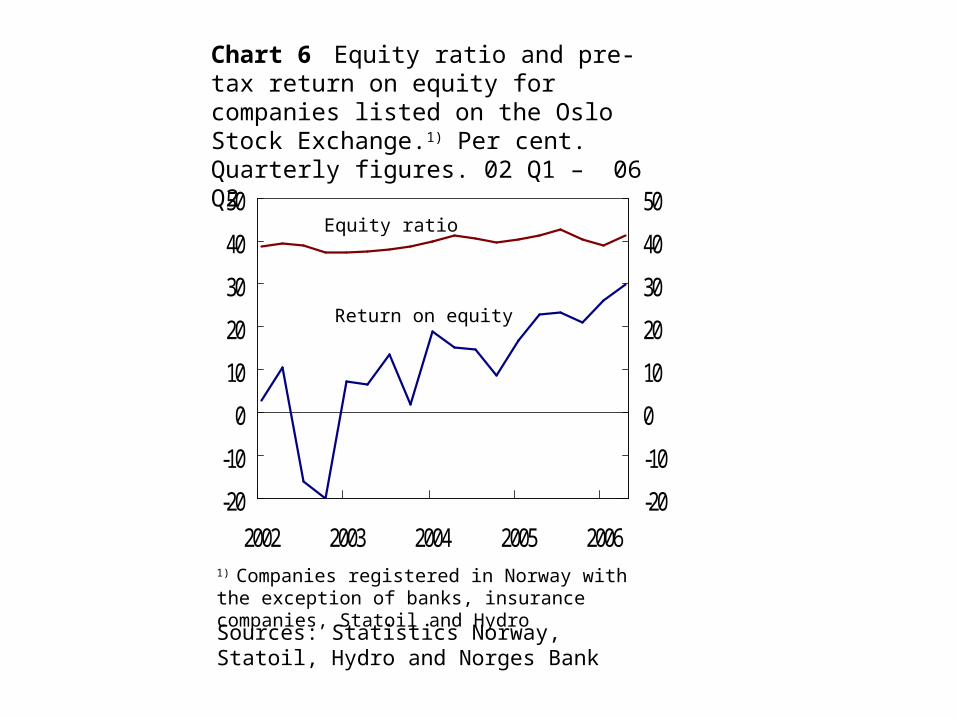
Chart 6 Equity ratio and pre-tax return on equity for companies listed on the Oslo Stock Exchange.1) Per cent. Quarterly figures. 02 Q1 – 06 Q2
1) Companies registered in Norway with the exception of banks, insurance companies, Statoil and Hydro
Equity ratio
Return on equity
Sources: Statistics Norway, Statoil, Hydro and Norges Bank

1 International developments

0
2
4
6
8
10
US Euro Area Japan China Tradingpartners
0
2
4
6
8
102005 2006
2007 2008
Chart 1.1 GDP growth abroad. Increase on previous year in per cent. Forecasts for 2006 – 20081)
Sources: IMF, EU Commission, OECD and Norges Bank
1) Forecasts in Inflation Report 3/06

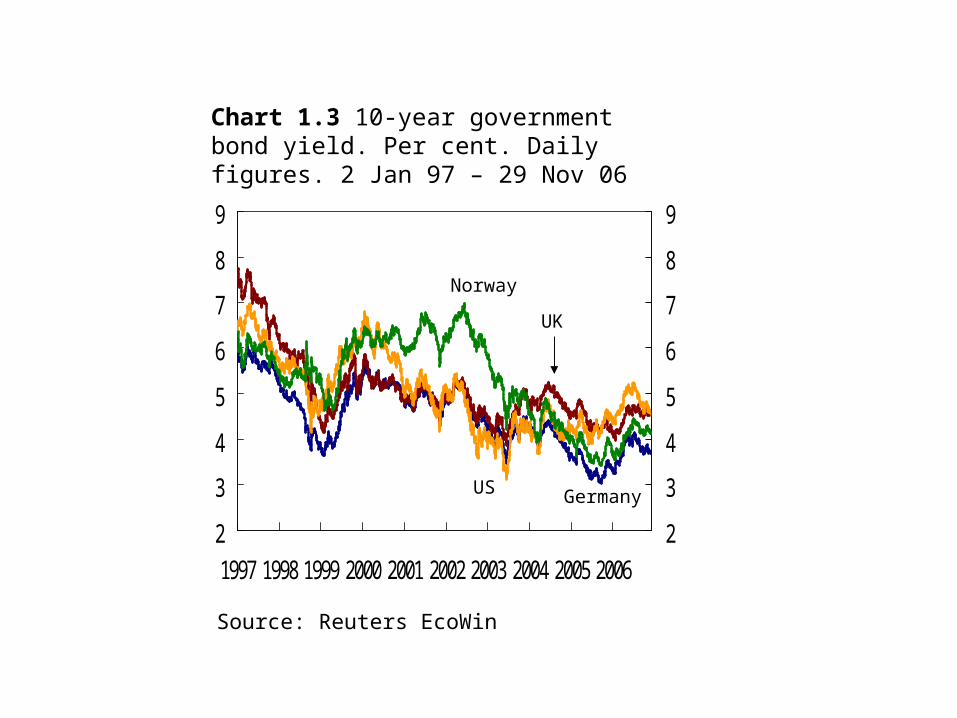
Source: Reuters EcoWin
Chart 1.2 Equity indices and oil price (Brent Blend). 1 Jan 05 = 100. Daily figures. 3 Jan 05 – 29 Nov 06
80
100
120
140
160
180
200
Jan 05 Jul 05 Jan 06 Jul 0680
100
120
140
160
180
200
Oil price
Europe Stoxx
Norway OSEBX
US S&P 500
Source: Reuters EcoWin
Chart 1.3 10-year government bond yield. Per cent. Daily figures. 2 Jan 97 – 29 Nov 06
2
3
4
5
6
7
8
9
1997 1998 1999 2000 2001 2002 2003 2004 2005 20062
3
4
5
6
7
8
9
UK
Germany
Norway
US
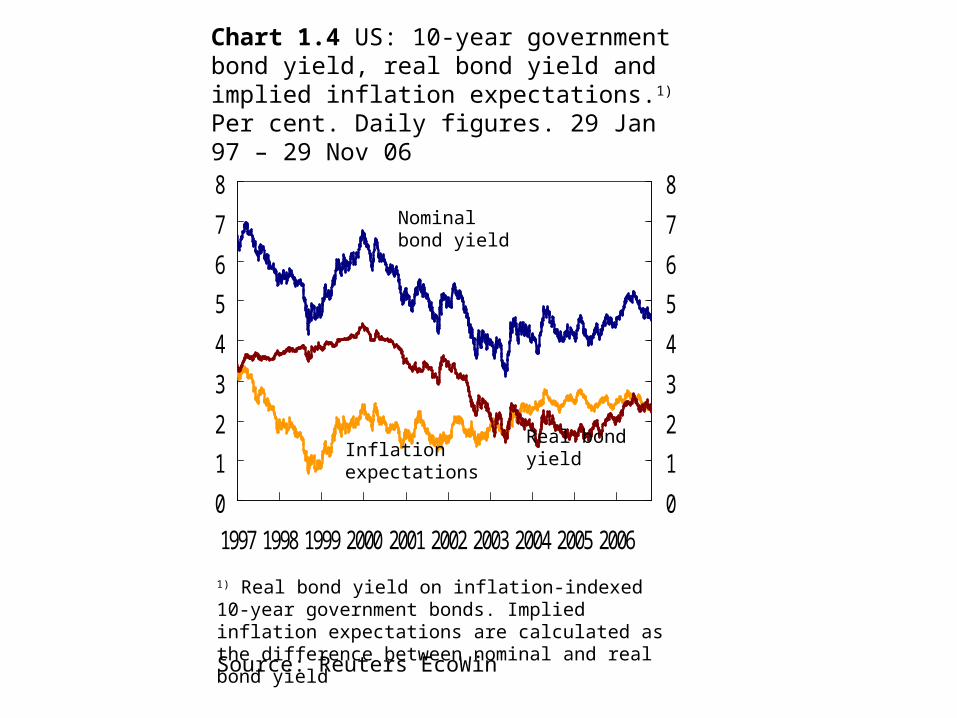
Chart 1.4 US: 10-year government bond yield, real bond yield and implied inflation expectations.1) Per cent. Daily figures. 29 Jan 97 – 29 Nov 06
0
1
2
3
4
5
6
7
8
1997 1998 1999 2000 2001 2002 2003 2004 2005 20060
1
2
3
4
5
6
7
8
Real bond yield
Nominal bond yield
Inflation expectations
1) Real bond yield on inflation-indexed 10-year government bonds. Implied inflation expectations are calculated as the difference between nominal and real bond yield
Source: Reuters EcoWin
-5
0
5
10
15
20
0 1 2 3 4 5 6
Non-performing loans in % of total loans
Retur
n on e
quity
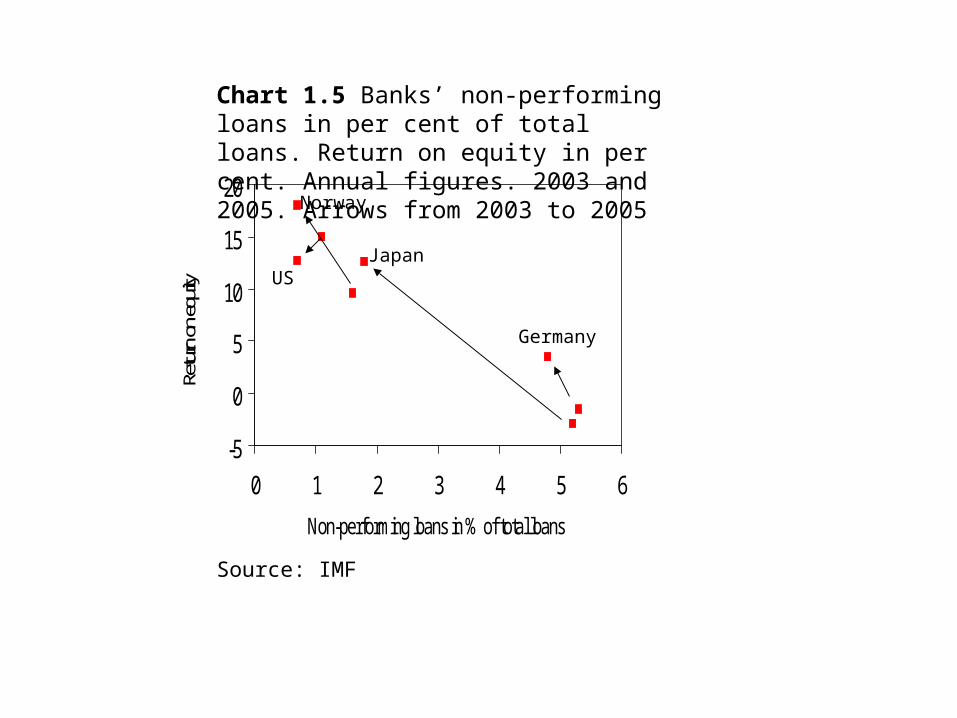
Chart 1.5 Banks’ non-performing loans in per cent of total loans. Return on equity in per cent. Annual figures. 2003 and 2005. Arrows from 2003 to 2005
Source: IMF
US
Norway
Japan
Germany
Source: Reuters EcoWin
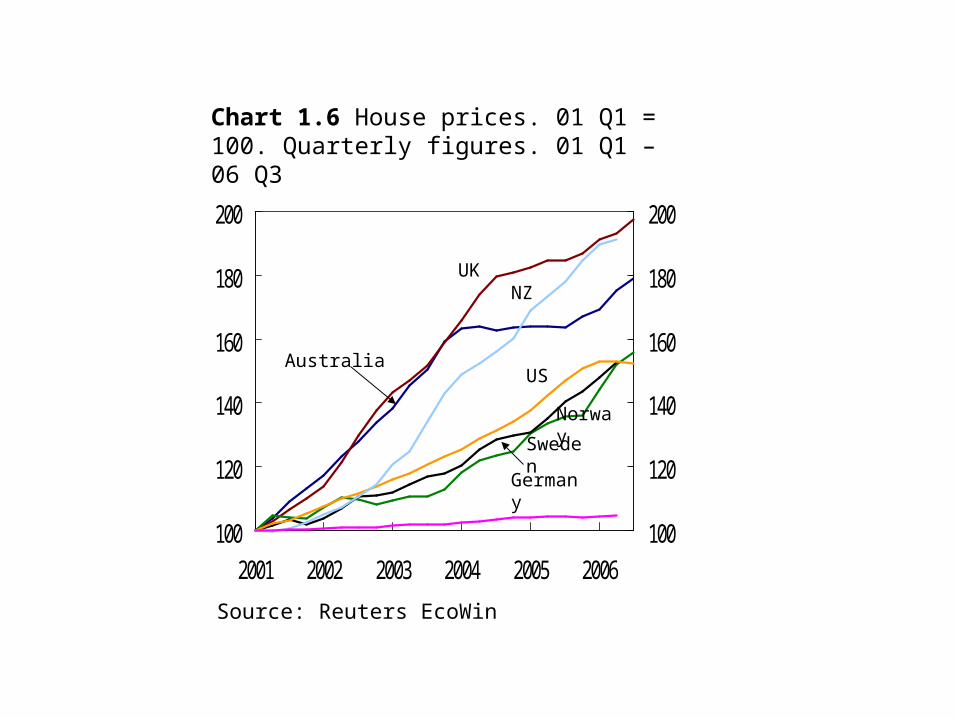
Chart 1.6 House prices. 01 Q1 = 100. Quarterly figures. 01 Q1 – 06 Q3
100
120
140
160
180
200
2001 2002 2003 2004 2005 2006100
120
140
160
180
200
UK
Norway
AustraliaUS
Sweden
NZ
Germany
Source: Reuters EcoWin
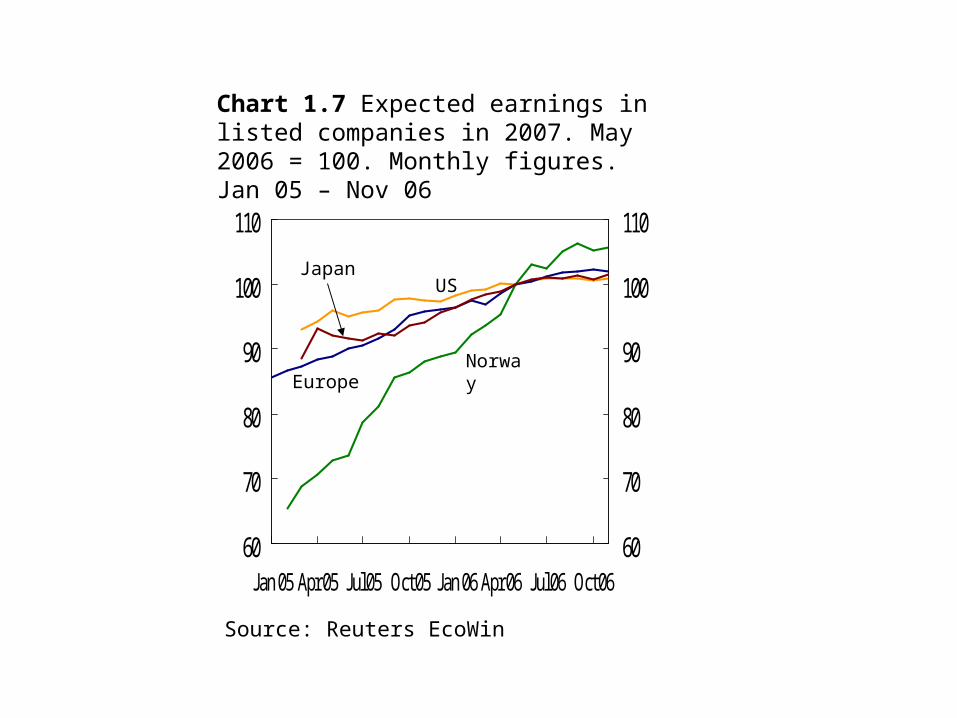
Chart 1.7 Expected earnings in listed companies in 2007. May 2006 = 100. Monthly figures. Jan 05 – Nov 06
60
70
80
90
100
110
Jan 05 Apr 05 Jul 05 Oct 05 Jan 06 Apr 06 Jul 06 Oct 0660
70
80
90
100
110
Norway
JapanUS
Europe
Sources: ECB, Federal Reserve, Bank of England and Norges Bank
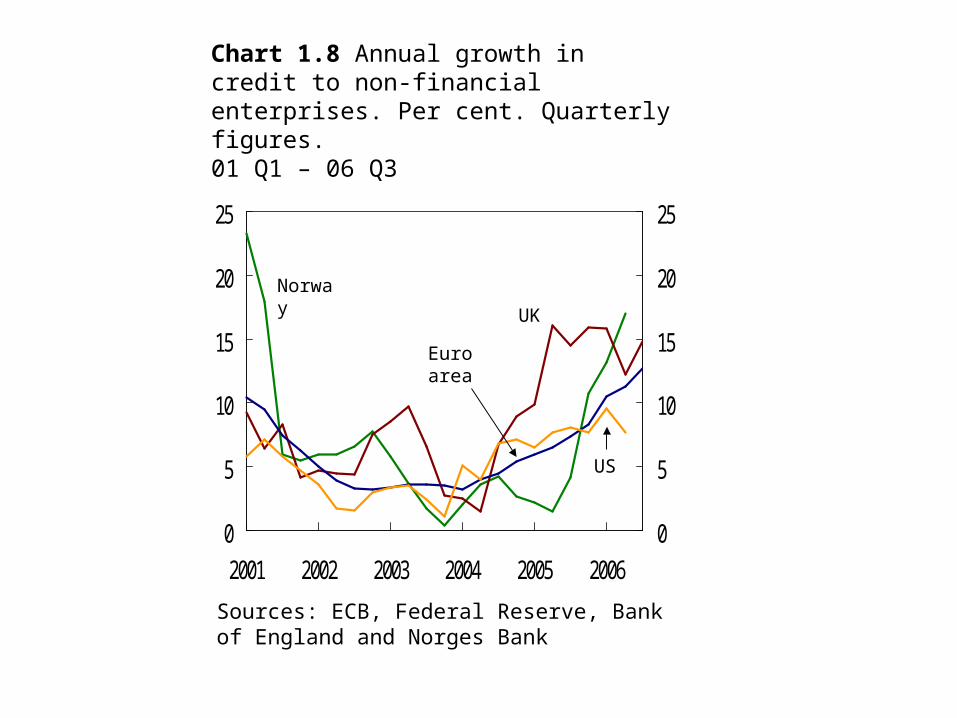
Chart 1.8 Annual growth in credit to non-financial enterprises. Per cent. Quarterly figures. 01 Q1 – 06 Q3
0
5
10
15
20
25
2001 2002 2003 2004 2005 20060
5
10
15
20
25
UKNorway
US
Euro area

1) Difference between yield on corporate bonds rated BBB and yield on government bonds. 5-year maturity
Chart 1.9 Credit spread, US non-financial enterprises.1) Annual earnings growth in S&P 500 enterprises. Per cent. Daily and monthly figures respectively. 1 Jan 03 – 29 Nov 06
0
0.5
1
1.5
2
2.5
3
3.5
Jan 03 Jul 03 Jan 04 Jul 04 Jan 05 Jul 05 Jan 06 Jul 06
-5
0
5
10
15
20
25
Credit spread (left-hand scale)
Earnings growth(right-hand scale, reversed)
Source: Reuters EcoWin

Chart 1.10 Net importers and exporters of capital in 2005. Per cent of total
Source: IMF
0102030405060708090
100
Net importers Net exporters
US
Others
Japan
Saudi Arabia
Germany
Switzerland
Spain
China
UK
Others
Russia
Norway
Source: Reuters EcoWin
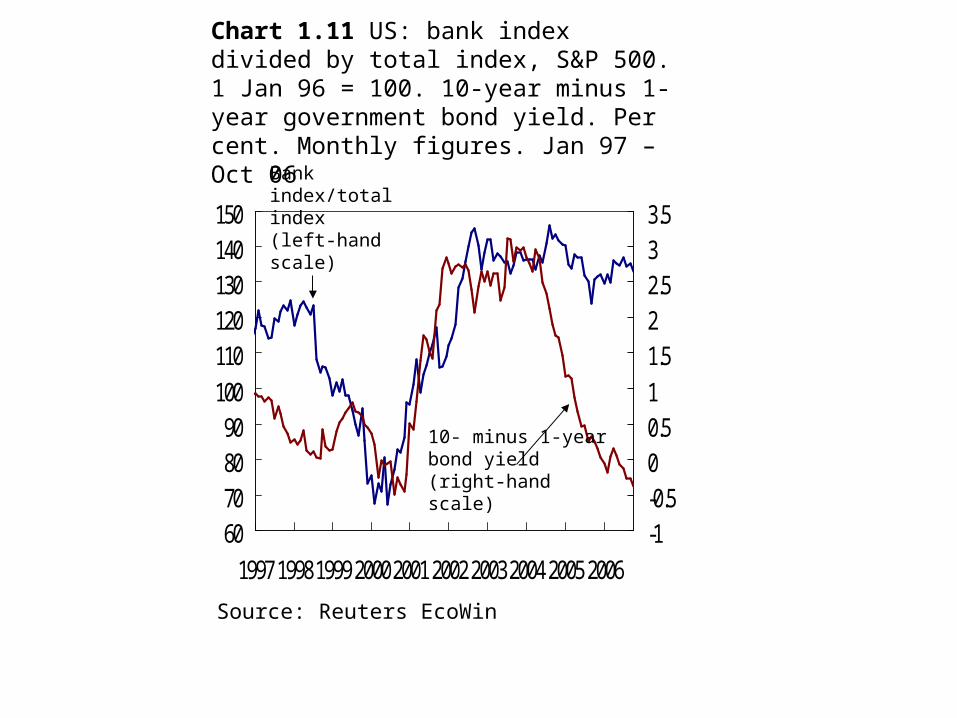
Chart 1.11 US: bank index divided by total index, S&P 500. 1 Jan 96 = 100. 10-year minus 1-year government bond yield. Per cent. Monthly figures. Jan 97 – Oct 06
60708090
100110120130140150
1997 1998 1999 2000 2001 2002 2003 2004 2005 2006-1-0.500.511.522.533.5
Bank index/total index(left-hand scale)
10- minus 1-year bond yield (right-hand scale)
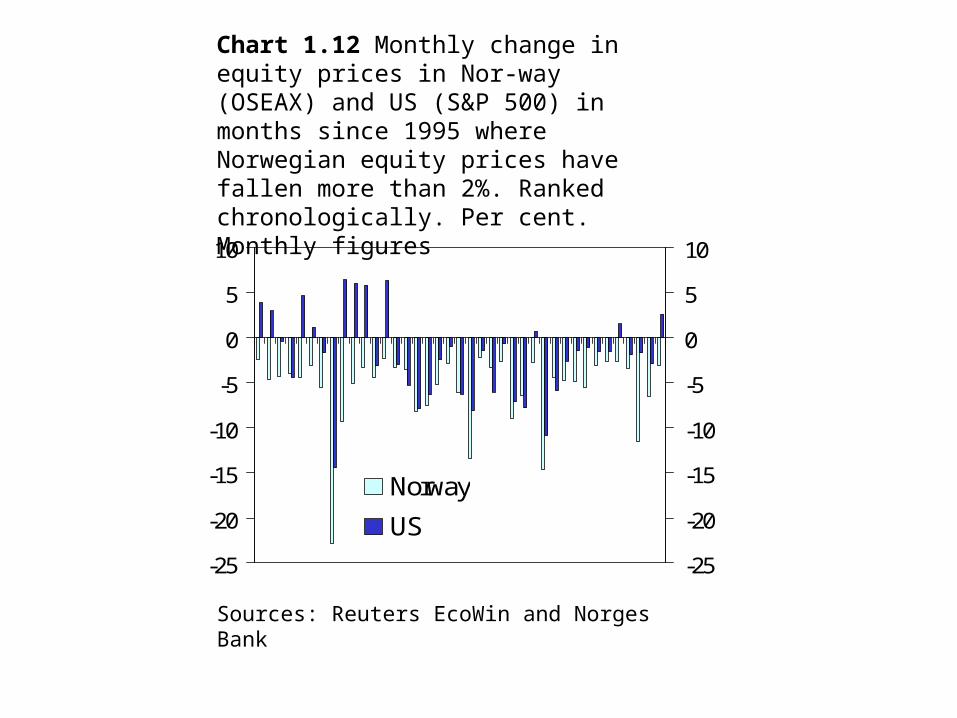
Chart 1.12 Monthly change in equity prices in Nor-way (OSEAX) and US (S&P 500) in months since 1995 where Norwegian equity prices have fallen more than 2%. Ranked chronologically. Per cent. Monthly figures
Sources: Reuters EcoWin and Norges Bank
-25
-20
-15
-10
-5
0
5
10
-25
-20
-15
-10
-5
0
5
10
Norway
US
2 Macro economic developments, households
and enterprises

Chart 2.1 Mainland GDP. Seasonally adjusted annualised quarterly growth at constant prices. Per cent. 02 Q1 – 06 Q2
-6
-3
0
3
6
9
02 Q1 03 Q1 04 Q1 05 Q1 06 Q1-6
-3
0
3
6
9
Source: Statistics Norway
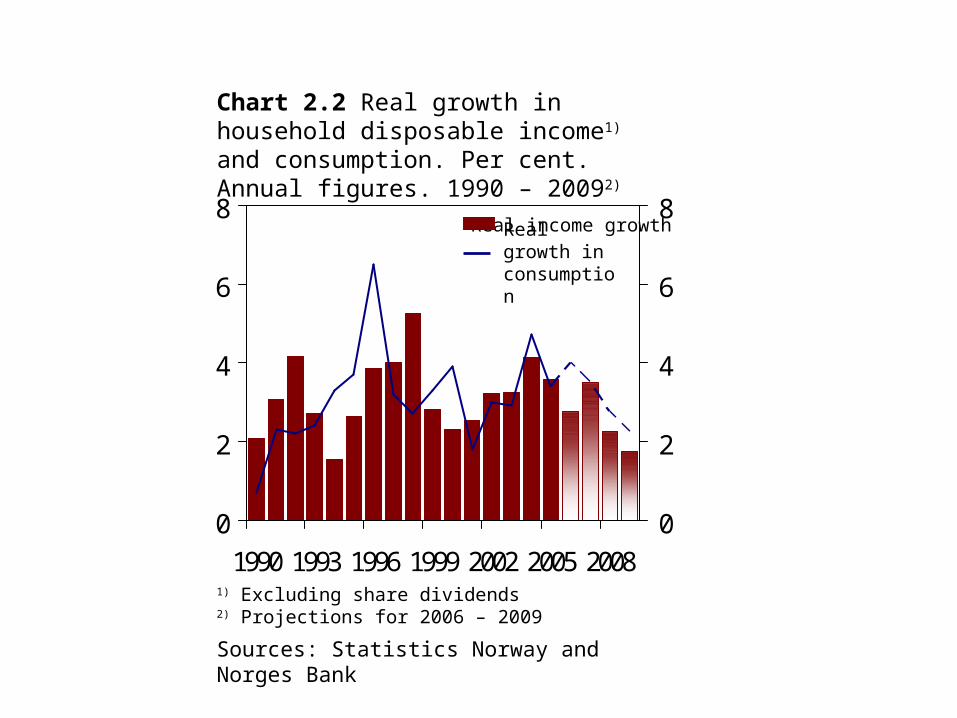
Chart 2.2 Real growth in household disposable income1) and consumption. Per cent. Annual figures. 1990 – 20092)
0
2
4
6
8
1990 1993 1996 1999 2002 2005 20080
2
4
6
8
1) Excluding share dividends2) Projections for 2006 – 2009
Real income growthReal growth in consumption
Sources: Statistics Norway and Norges Bank
-202468
10121416
1998 1999 2000 2001 2002 2003 2004 2005 2006-20246810121416
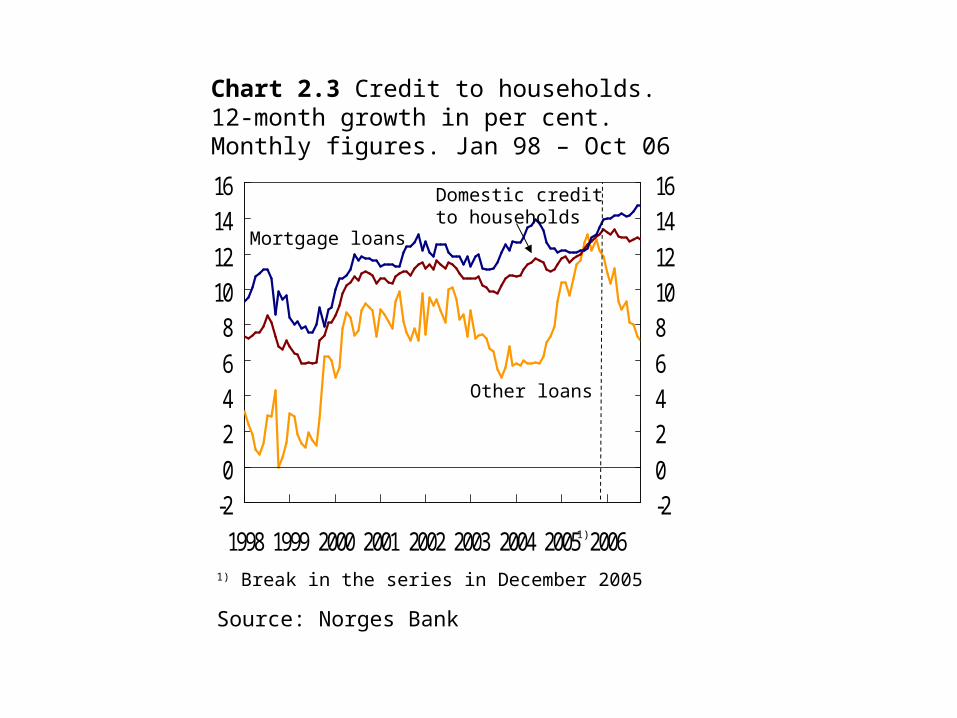
Chart 2.3 Credit to households. 12-month growth in per cent. Monthly figures. Jan 98 – Oct 06
Mortgage loans
Domestic credit to households
Other loans
Source: Norges Bank
1)
1) Break in the series in December 2005
0
10
20
30
40
50
60
70
04 Q1 04 Q3 05 Q1 05 Q3 06 Q1
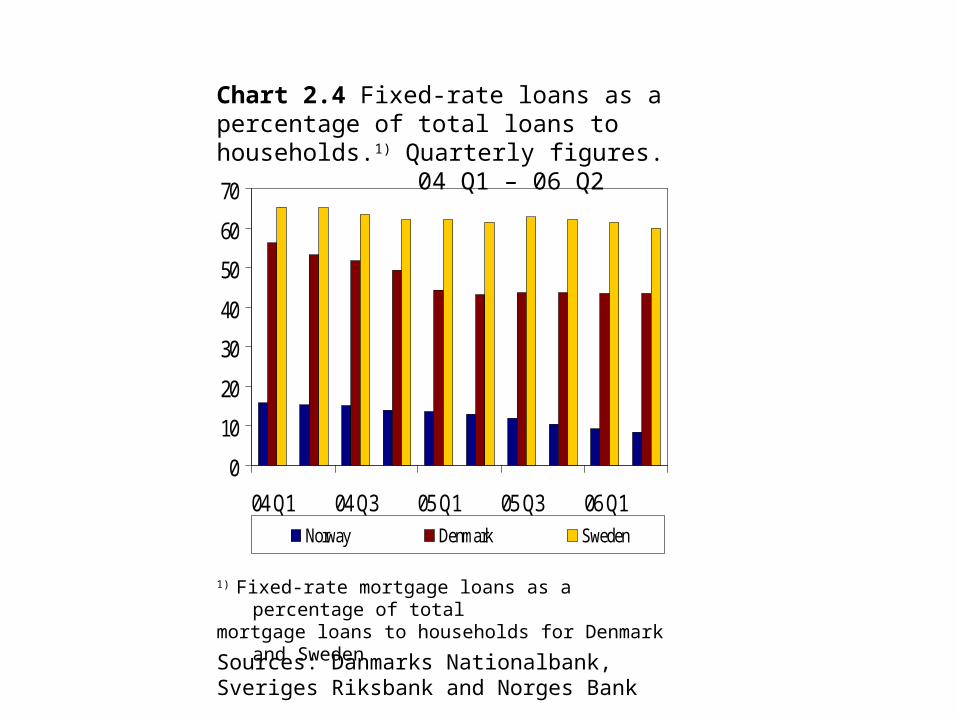
Norway Denmark Sweden
Sources: Danmarks Nationalbank, Sveriges Riksbank and Norges Bank
Chart 2.4 Fixed-rate loans as a percentage of total loans to households.1) Quarterly figures. 04 Q1 – 06 Q2
1) Fixed-rate mortgage loans as a percentage of totalmortgage loans to households for Denmark and Sweden
0
40
80
120
160
1997 1999 2001 2003 20050
40
80
120
160
Source: Norges Bank
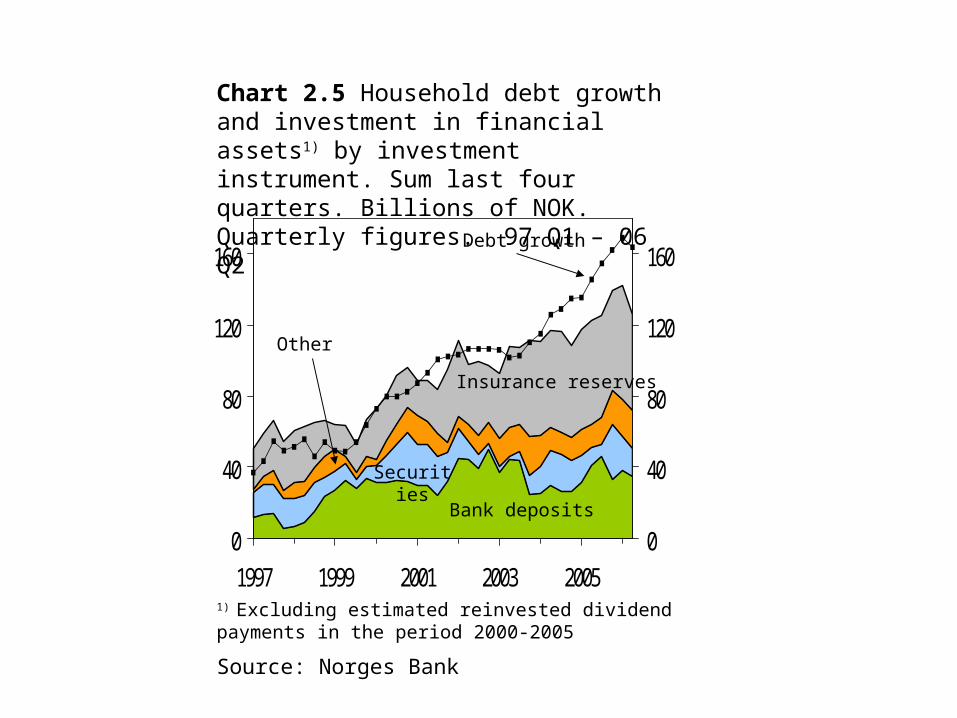
Chart 2.5 Household debt growth and investment in financial assets1) by investment instrument. Sum last four quarters. Billions of NOK. Quarterly figures. 97 Q1 – 06 Q2
Debt growth
Securities
Insurance reserves
Other
Bank deposits
1) Excluding estimated reinvested dividend payments in the period 2000-2005

-60
-40
-20
0
20
40
60
80
1981 1985 1989 1993 1997 2001 2005-60
-40
-20
0
20
40
60
80
Chart 2.6 Household net investments in financial assets. Sum last four quarters. Billions of NOK. 81 Q4 – 06 Q2
Credit market statistics1)
(Norges Bank)
Credit market statistics excl. reinvested dividends 2)
Sources: Statistics Norway and Norges Bank
National accounts
1) Break in the series 1995 Q42) Excluding estimated reinvested dividend payments in the period 2000-2005
0
2
4
6
8
1996 1998 2000 2002 2004 20060
2
4
6
8
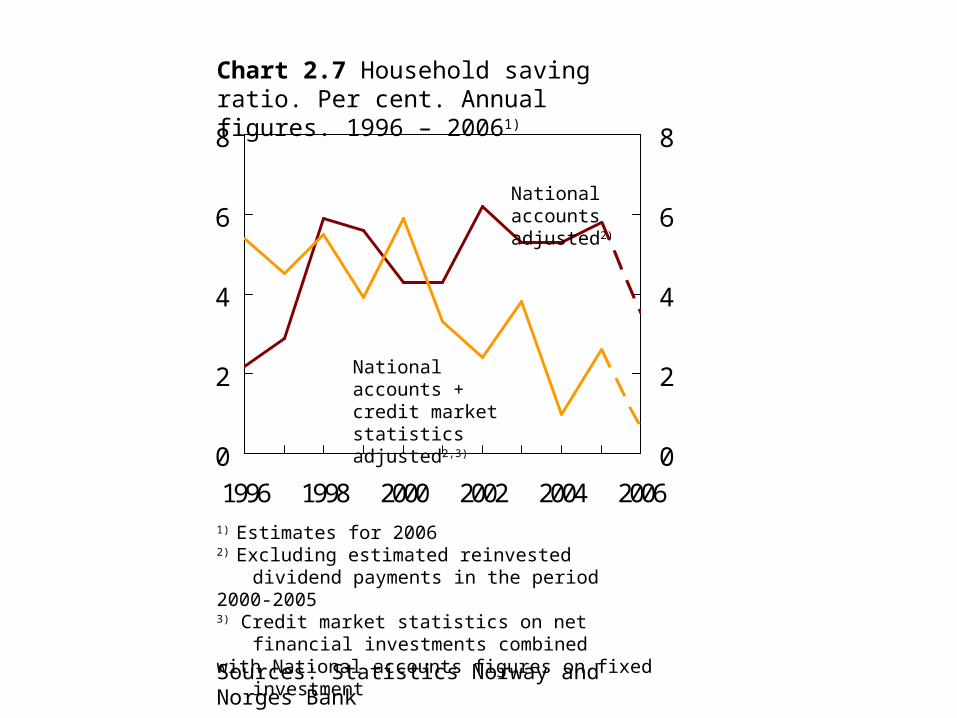
Chart 2.7 Household saving ratio. Per cent. Annual figures. 1996 – 20061)
Sources: Statistics Norway and Norges Bank
1) Estimates for 20062) Excluding estimated reinvested dividend payments in the period2000-2005 3) Credit market statistics on net financial investments combinedwith National accounts figures on fixed investment
National accounts adjusted2)
National accounts + credit market statistics adjusted2,3)
-10
0
10
20
30
40
50
60
1998 1999 2000 2001 2002 2003 2004 2005 2006-10
0
10
20
30
40
50
60
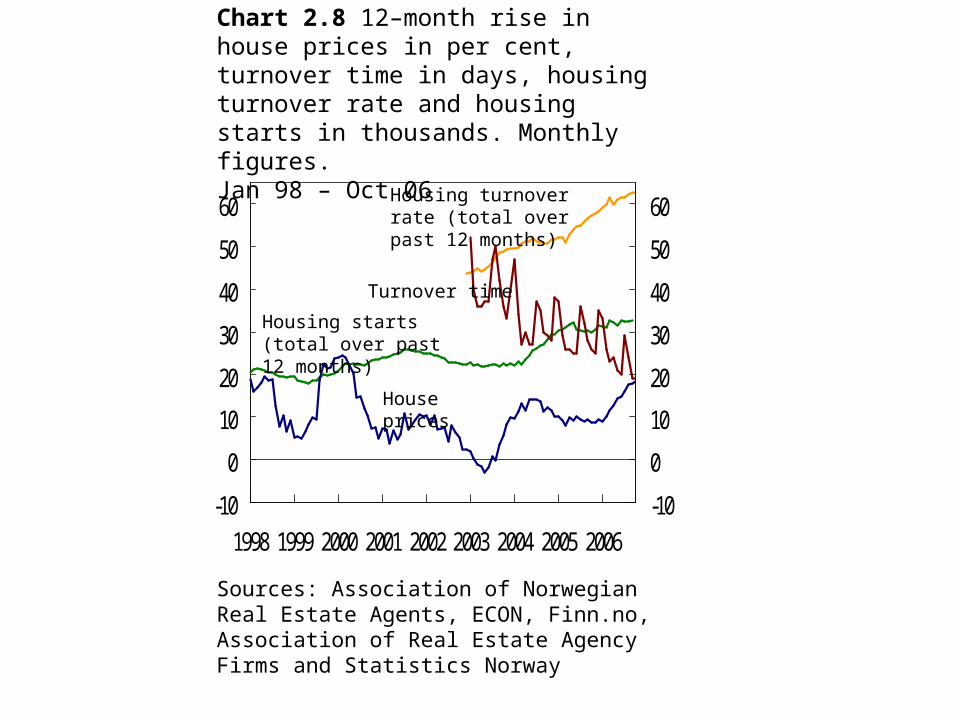
House prices
Chart 2.8 12–month rise in house prices in per cent, turnover time in days, housing turnover rate and housing starts in thousands. Monthly figures. Jan 98 – Oct 06
Turnover time
Housing turnover rate (total over past 12 months)
Housing starts (total over past 12 months)
Sources: Association of Norwegian Real Estate Agents, ECON, Finn.no, Association of Real Estate Agency Firms and Statistics Norway

0
1000
2000
3000
4000
5000
6000
Liabilities Assets0
1000
2000
3000
4000
5000
6000
Mortgages
Other loans
Housing wealth
Notes, coins and bank deposits
Insurance reservesSecurities
Other claims
Chart 2.9 Household liabilities and assets. Billions of NOK. 2006 Q2
Sources: Association of Norwegian Real Estate Agents, ECON, Finn.no, Association of Real Estate Agency Firms, Statistics Norway and Norges Bank
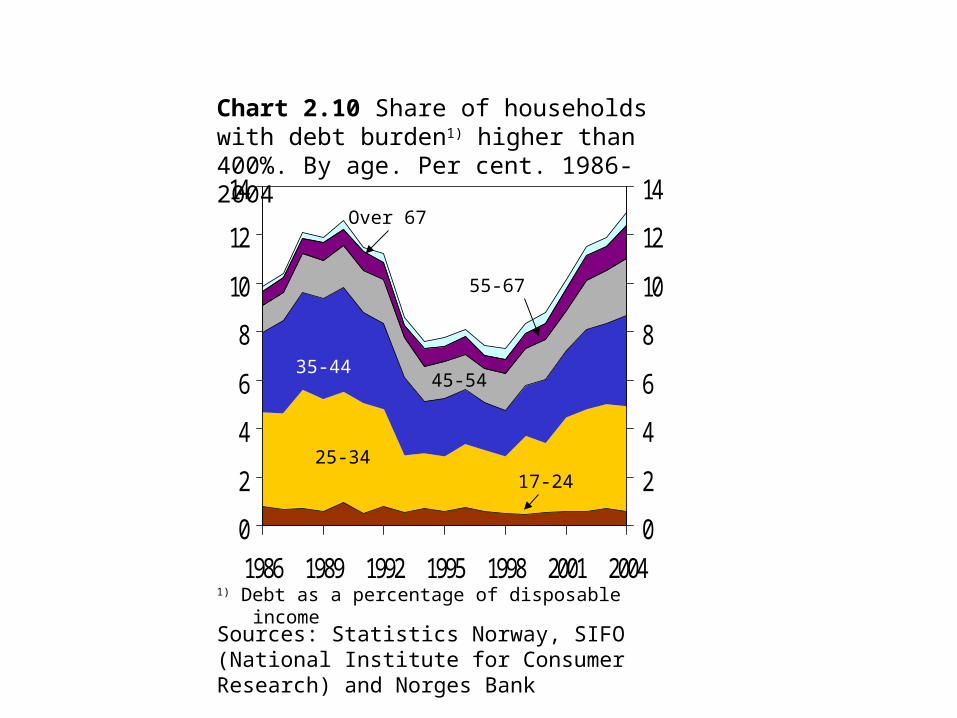
Chart 2.10 Share of households with debt burden1) higher than 400%. By age. Per cent. 1986-2004
Sources: Statistics Norway, SIFO (National Institute for Consumer Research) and Norges Bank
0
2
4
6
8
10
12
14
1986 1989 1992 1995 1998 2001 20040
2
4
6
8
10
12
14
17-24
35-44 45-54
55-67
Over 67
25-34
1) Debt as a percentage of disposable income
0
10
20
30
40
50
60
1986 1990 1994 1998 2002 20060
50
100
150
200
250
300
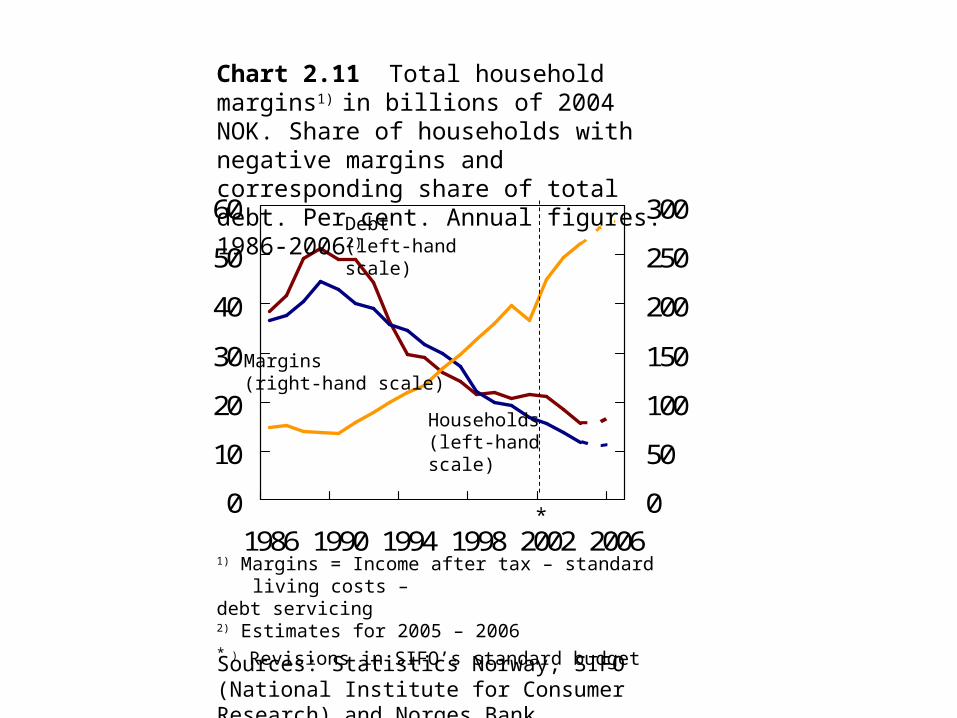
Chart 2.11 Total household margins1) in billions of 2004 NOK. Share of households with negative margins and corresponding share of total debt. Per cent. Annual figures. 1986-20062)
Margins (right-hand scale)
Debt(left-hand scale)
Households (left-hand scale)
1) Margins = Income after tax – standard living costs –debt servicing 2) Estimates for 2005 – 2006 * ) Revisions in SIFO’s standard budget
*
Sources: Statistics Norway, SIFO (National Institute for Consumer Research) and Norges Bank
-15
-10
-5
0
5
10
15
20
25
1991 1993 1995 1997 1999 2001 2003 2005 2007 2009-15
-10
-5
0
5
10
15
20
25
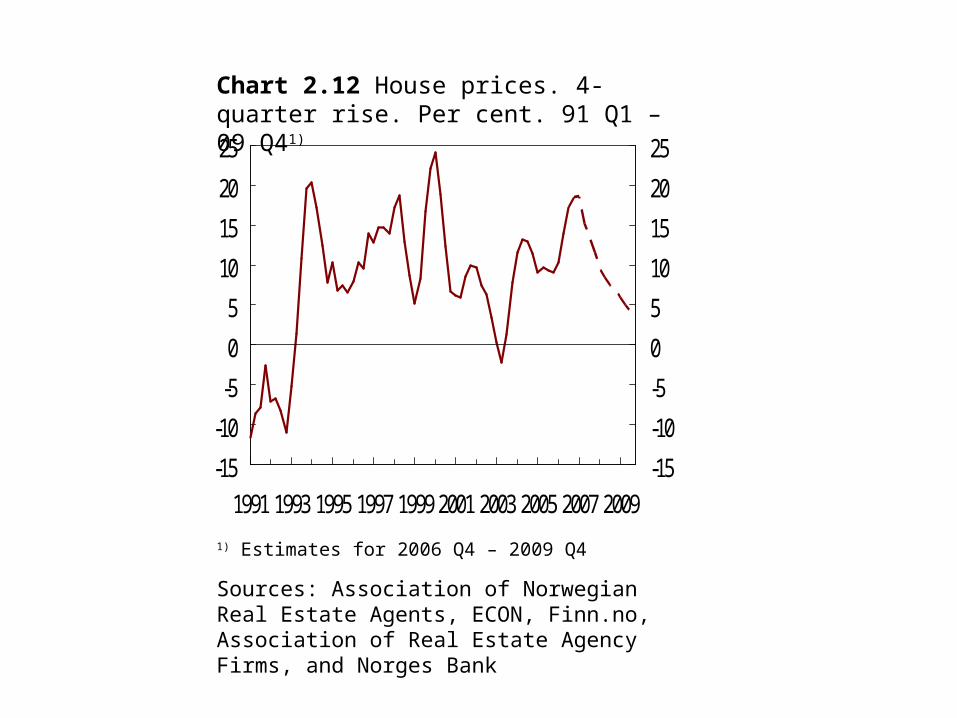
Chart 2.12 House prices. 4-quarter rise. Per cent. 91 Q1 – 09 Q41)
1) Estimates for 2006 Q4 – 2009 Q4
Sources: Association of Norwegian Real Estate Agents, ECON, Finn.no, Association of Real Estate Agency Firms, and Norges Bank

Chart 2.13 Household debt burden1) and interest burden2). Per cent. Quarterly figures. 87 Q1 – 09 Q4
Source: Norges Bank
1) Loan debt as a percentage of liquid disposable income lessestimated reinvested dividend payments2) Interest expenses after tax as a percentage of liquid disposableincome less estimated reinvested dividend payments plus interestexpenses
100
120
140
160
180
200
220
240
260
1987 1991 1995 1999 2003 20070
2
4
6
8
10
12
Interest burden (right-hand scale)
Debt burden (left-hand scale)
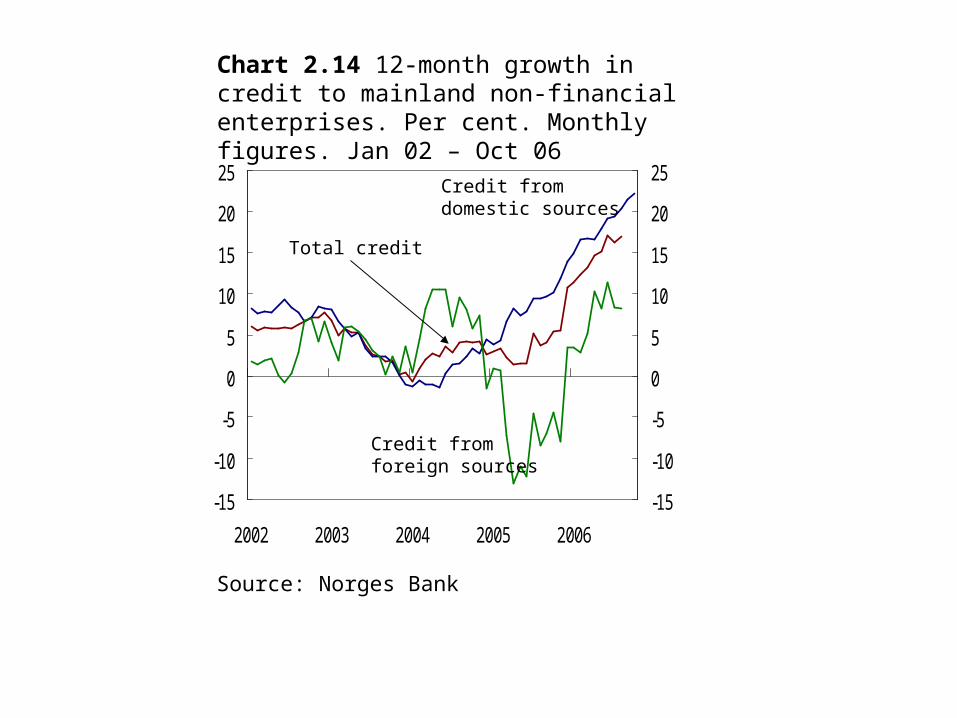
Chart 2.14 12-month growth in credit to mainland non-financial enterprises. Per cent. Monthly figures. Jan 02 – Oct 06
-15
-10
-5
0
5
10
15
20
25
2002 2003 2004 2005 2006
-15
-10
-5
0
5
10
15
20
25
Source: Norges Bank
Total credit
Credit fromdomestic sources
Credit fromforeign sources

Chart 2.15 Return on equity1), return on total assets2) and equity ratio. Mainland non-financial limited enterprises. Per cent. Annual figures. 1988-2005
05
1015202530354045
1988 1990 1992 1994 1996 1998 2000 2002 2004051015202530354045
1) Pre-tax profit as a percentage of book equity2) Pre-tax profit as a percentage of total assets
Return on total assets
Equity ratio
Return on equity
Source: Norges Bank
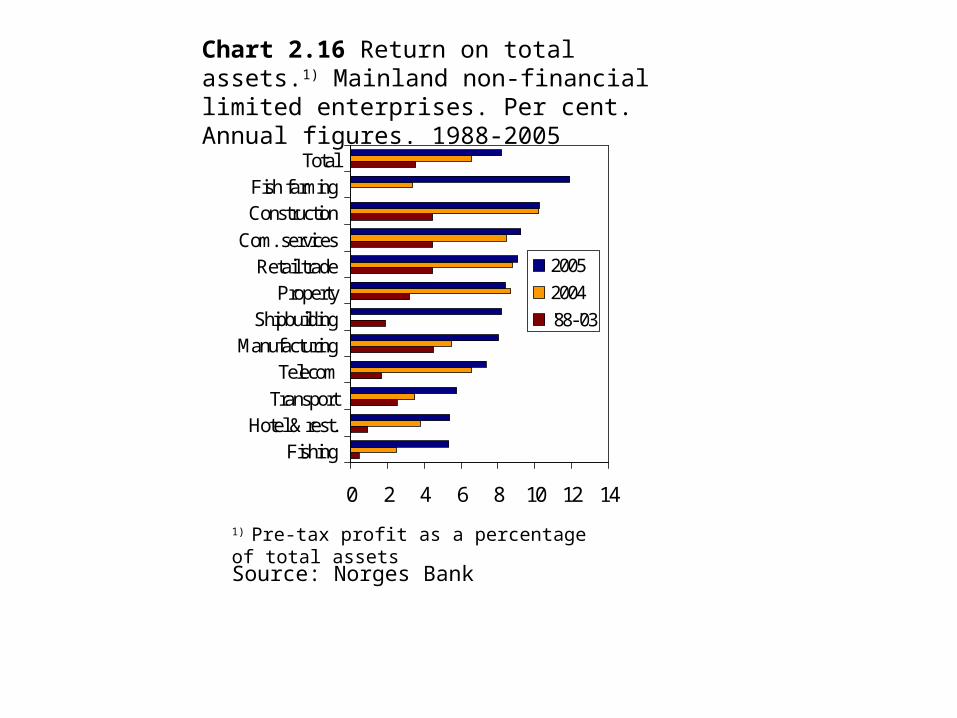
Chart 2.16 Return on total assets.1) Mainland non-financial limited enterprises. Per cent. Annual figures. 1988-2005
0 2 4 6 8 10 12 14
FishingHotel & rest.
TransportTelecom
ManufacturingShipbuilding
PropertyRetail trade
Com. servicesConstructionFish farming
Total
20052004'88-'03
1) Pre-tax profit as a percentage of total assets
Source: Norges Bank
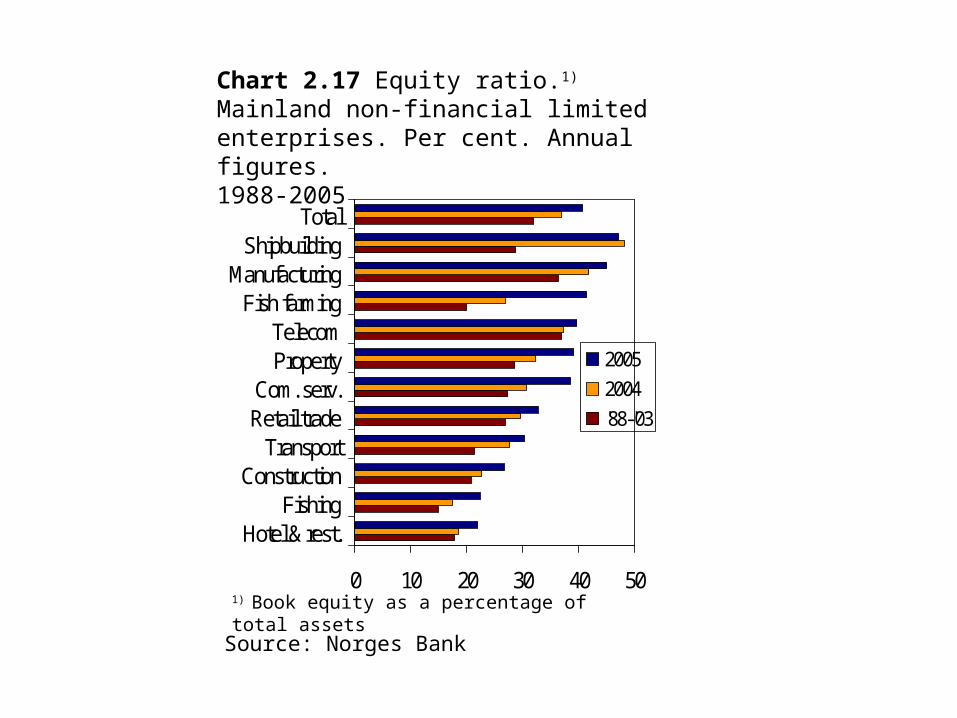
Chart 2.17 Equity ratio.1) Mainland non-financial limited enterprises. Per cent. Annual figures. 1988-2005
0 10 20 30 40 50
Hotel & rest.Fishing
ConstructionTransport
Retail tradeCom. serv.
PropertyTelecom
Fish farmingManufacturing
ShipbuildingTotal
20052004'88-'03
1) Book equity as a percentage of total assets
Source: Norges Bank
60
70
80
90
100
110
120
130
Jan 06 Mar 06 May 06 Jul 06 Sep 06 Nov 0660
70
80
90
100
110
120
130
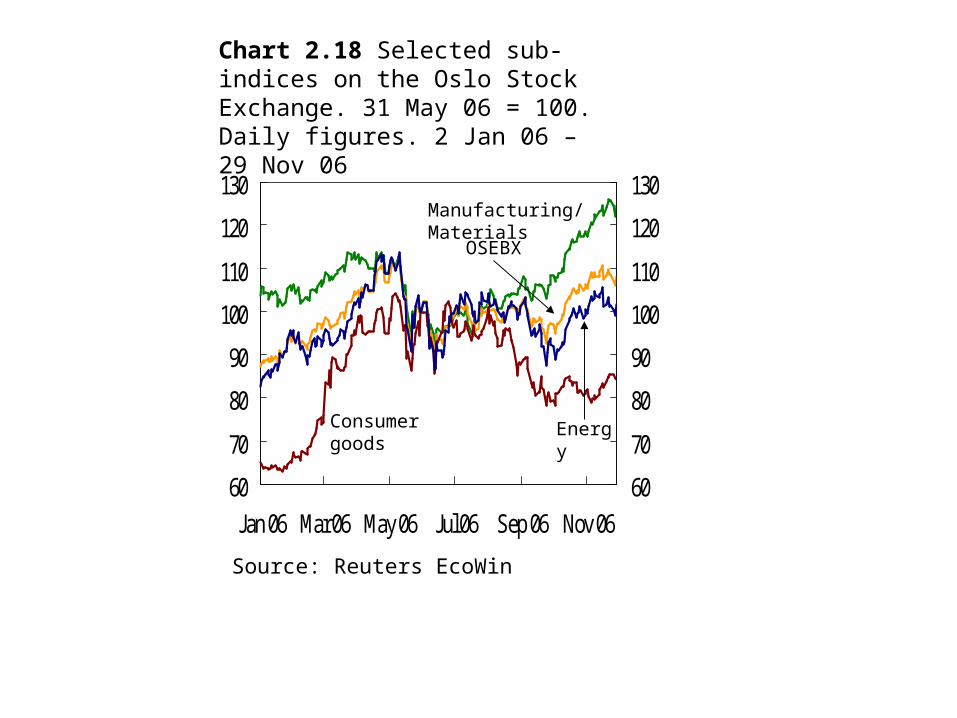
Chart 2.18 Selected sub-indices on the Oslo Stock Exchange. 31 May 06 = 100. Daily figures. 2 Jan 06 – 29 Nov 06
Source: Reuters EcoWin
Consumer goods Energy
OSEBX
Manufacturing/Materials

Source: Reuters EcoWin
Chart 2.19 Expected earnings in 2007 and 2008 for listed companies in Norway. May 2006 = 100. Monthly figures. Jan 05 – Nov 06
60
70
80
90
100
110
Jan05
Apr05
Jul05
Oct05
Jan06
Apr06
Jul06
Oct06
60
70
80
90
100
110
20082007
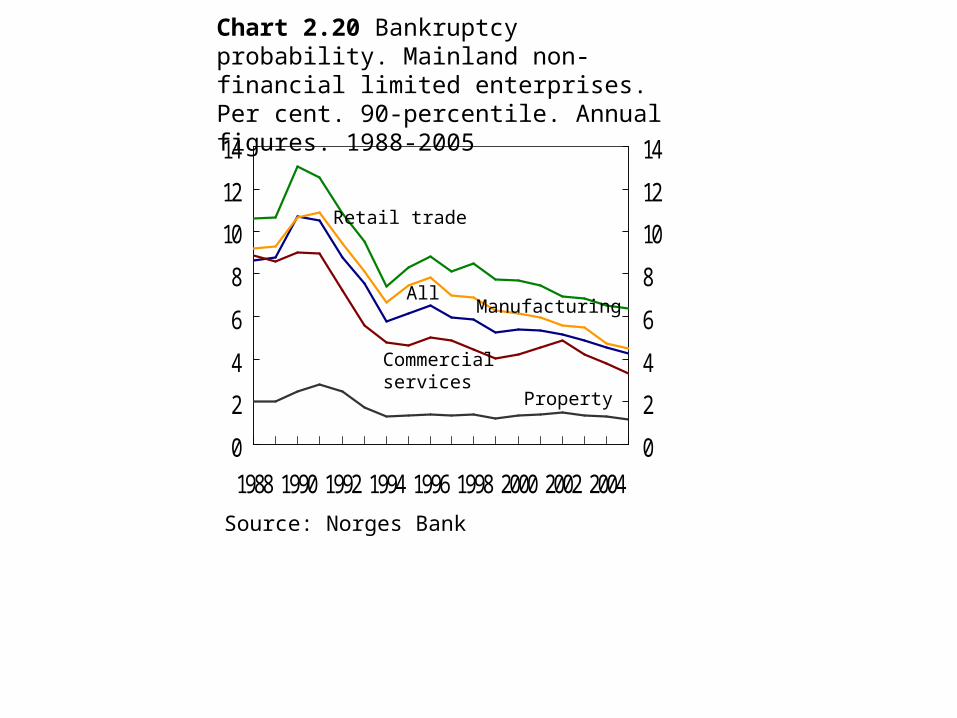
Chart 2.20 Bankruptcy probability. Mainland non-financial limited enterprises. Per cent. 90-percentile. Annual figures. 1988-2005
0
2
4
6
8
10
12
14
1988 1990 1992 1994 1996 1998 2000 2002 20040
2
4
6
8
10
12
14
Source: Norges Bank
Manufacturing
Commercialservices
All
Property
Retail trade
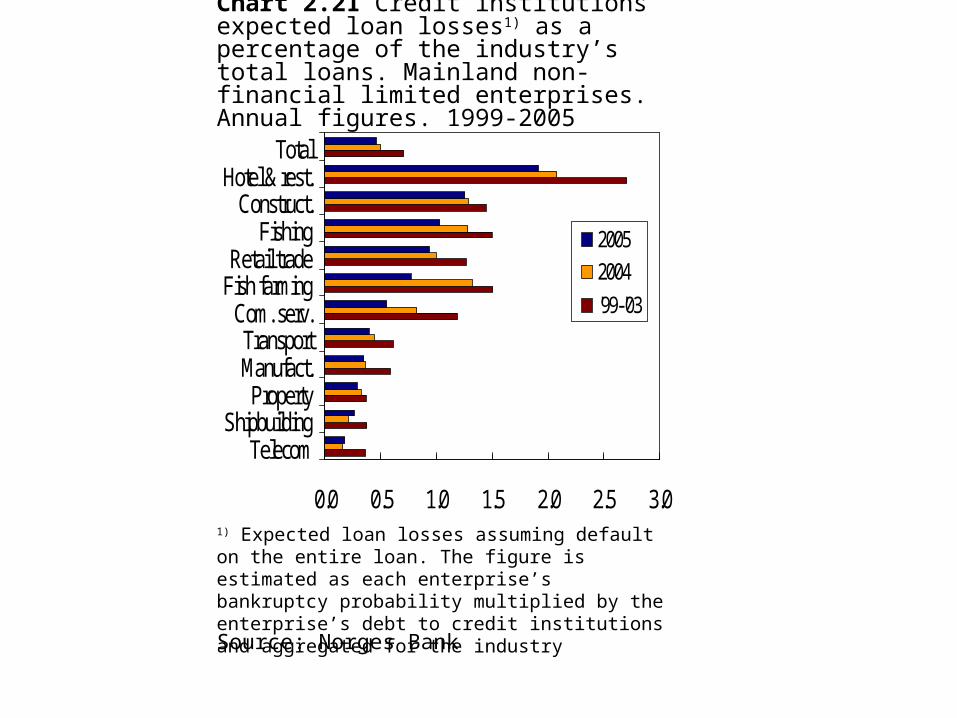
Chart 2.21 Credit institutions’ expected loan losses1) as a percentage of the industry’s total loans. Mainland non-financial limited enterprises. Annual figures. 1999-2005
0.0 0.5 1.0 1.5 2.0 2.5 3.0
TelecomShipbuilding
PropertyManufact.Transport
Com. serv.Fish farmingRetail trade
FishingConstruct.
Hotel & rest.Total
20052004'99-'03
1) Expected loan losses assuming default on the entire loan. The figure is estimated as each enterprise’s bankruptcy probability multiplied by the enterprise’s debt to credit institutions and aggregated for the industry
Source: Norges Bank
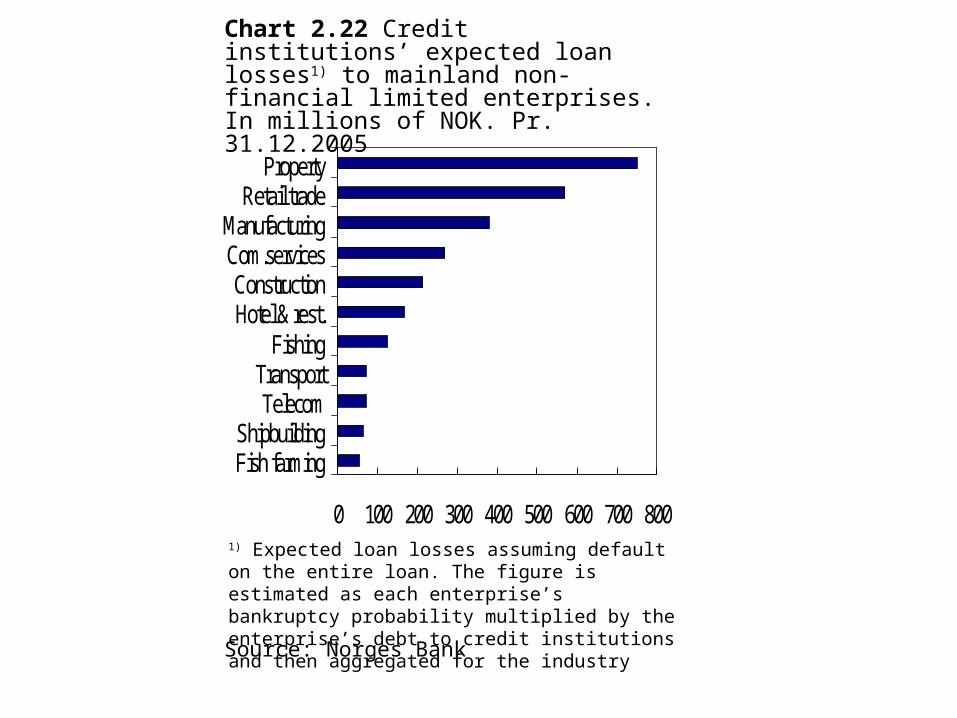
Chart 2.22 Credit institutions’ expected loan losses1) to mainland non-financial limited enterprises. In millions of NOK. Pr. 31.12.2005
0 100 200 300 400 500 600 700 800
Fish farmingShipbuilding
TelecomTransport
FishingHotel & rest.Construction
Com.servicesManufacturing
Retail tradeProperty
1) Expected loan losses assuming default on the entire loan. The figure is estimated as each enterprise’s bankruptcy probability multiplied by the enterprise’s debt to credit institutions and then aggregated for the industry
Source: Norges Bank

Chart 2.23 Interest and debt burden. Mainland non-financial limited enterprises with debt to credit institutions. Per cent. Annual figures. 1990-2009. Estimates for 2006-2009
0100200300400500600700800900
1990 1992 1994 1996 1998 2000 2002 2004 2006 20080
10
20
30
40
50
60
1) Debt to credit institutions as a percentage of pre-tax profit, depreciation and write-downs2) Debt to credit institutions as a percentage of average pre-tax profit, depreciation and write-downs 1988-20053) Interest expenses as a percentage pre-tax profit, interest expenses, depreciation and write-downs
Debt burden1)
(left-hand scale)
Interest burden3)
(right-hand scale)
Debt burden average2)
(left-hand scale)
Source: Norges Bank
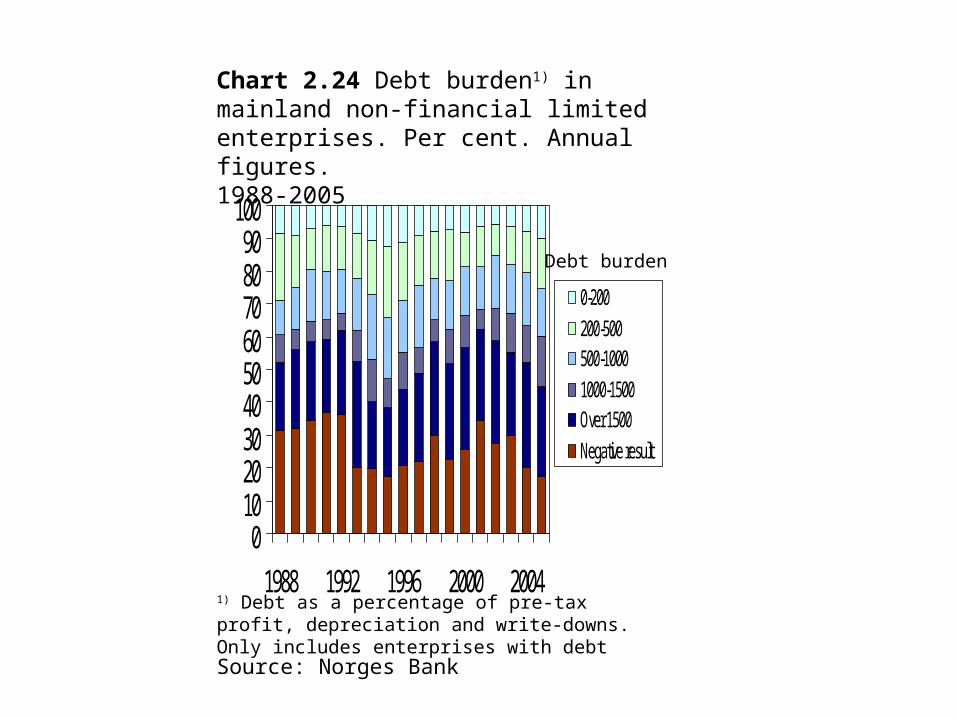
Chart 2.24 Debt burden1) in mainland non-financial limited enterprises. Per cent. Annual figures. 1988-2005
0102030405060708090
100
1988 1992 1996 2000 2004
0-200200-500500-10001000-1500Over 1500Negative result
1) Debt as a percentage of pre-tax profit, depreciation and write-downs. Only includes enterprises with debt
Debt burden
Source: Norges Bank
0
500
1000
1500
2000
2500
1988 1990 1992 1994 1996 1998 2000 2002 2004 20060
2
4
6
8
10
12
14
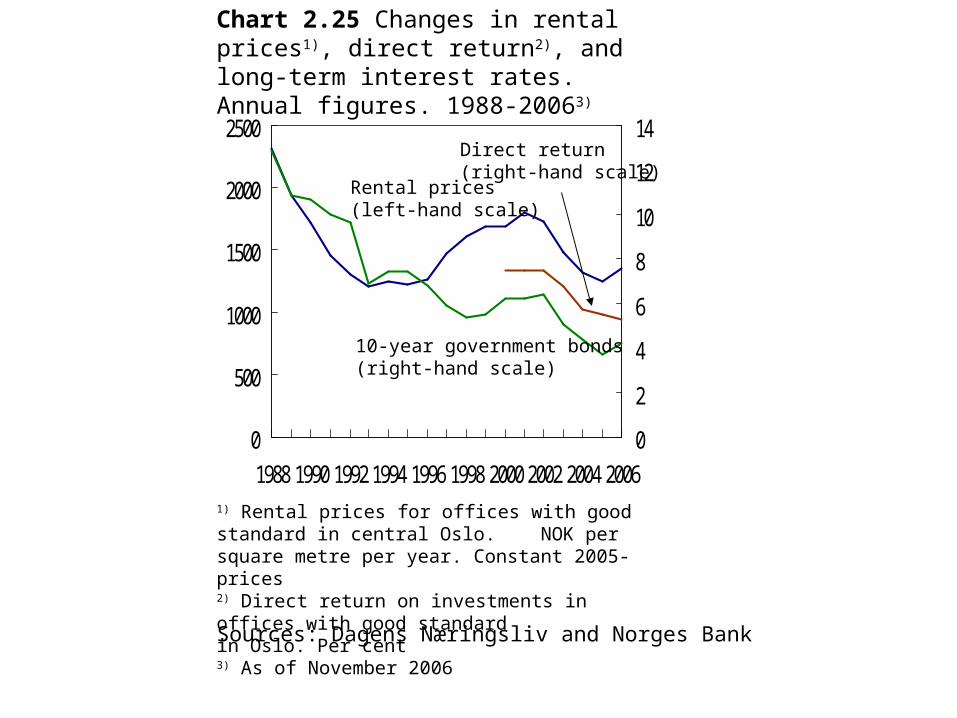
Chart 2.25 Changes in rental prices1), direct return2), and long-term interest rates. Annual figures. 1988-20063)
1) Rental prices for offices with good standard in central Oslo. NOK per square metre per year. Constant 2005-prices2) Direct return on investments in offices with good standard in Oslo. Per cent3) As of November 2006
Direct return(right-hand scale)
Rental prices(left-hand scale)
10-year government bonds(right-hand scale)
Sources: Dagens Næringsliv and Norges Bank

Chart 2.26 Growth in credit, debt burden1) and equity ratio in the sector “Property leasing”. Per cent. Annual figures. 1989-20072)
0
5
10
15
20
25
30
35
40
1989 1991 1993 1995 1997 1999 2001 2003 2005 2007020040060080010001200140016001800
1) Pre-tax profit, depreciation and write-downs as a percentage of debt2) Figures for 2007 are based on a stress scenario where property prices fall by 20 per cent and rental prices remain unchanged
Growth in credit (left-hand scale)
Equity ratio(left-hand scale)
Debt burden (right-hand scale)
Source: Norges Bank
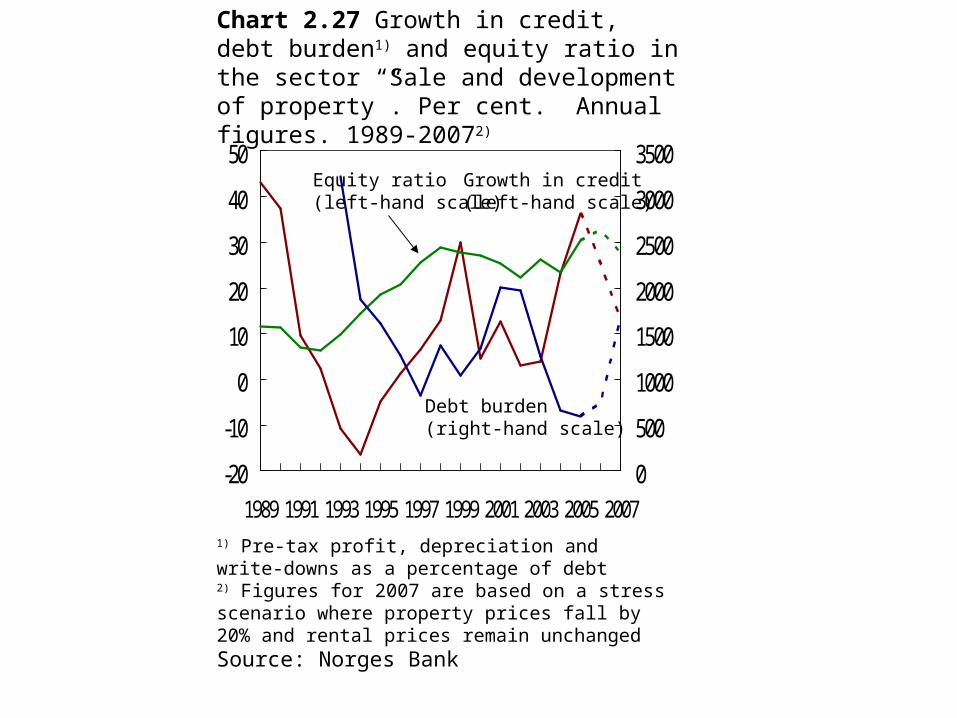
Chart 2.27 Growth in credit, debt burden1) and equity ratio in the sector “Sale and development of property”. Per cent. Annual figures. 1989-20072)
-20
-10
0
10
20
30
40
50
1989 1991 1993 1995 1997 1999 2001 2003 2005 20070
500
1000
1500
2000
2500
3000
3500
1) Pre-tax profit, depreciation and write-downs as a percentage of debt2) Figures for 2007 are based on a stress scenario where property prices fall by 20% and rental prices remain unchanged
Growth in credit(left-hand scale)
Equity ratio(left-hand scale)
Debt burden(right-hand scale)
Source: Norges Bank
3 Financial institutions and financial infrastructure

Chart 3.1 Banks’1) assets and liabilities. Per cent. September 2006
1) All banks in Norway. Norwegian banks’ subsidiaries and branches abroad are not included in the statistical basis
0102030405060708090
100
Assets Liabilities
Foreign assets
Equity
Debt securities
Lending to Norwegian enterprises
Other liabilities
Lending to Norwegian households
Customer deposits
Deposits from financial institutions
Other Norwegianassets
Source: Norges Bank
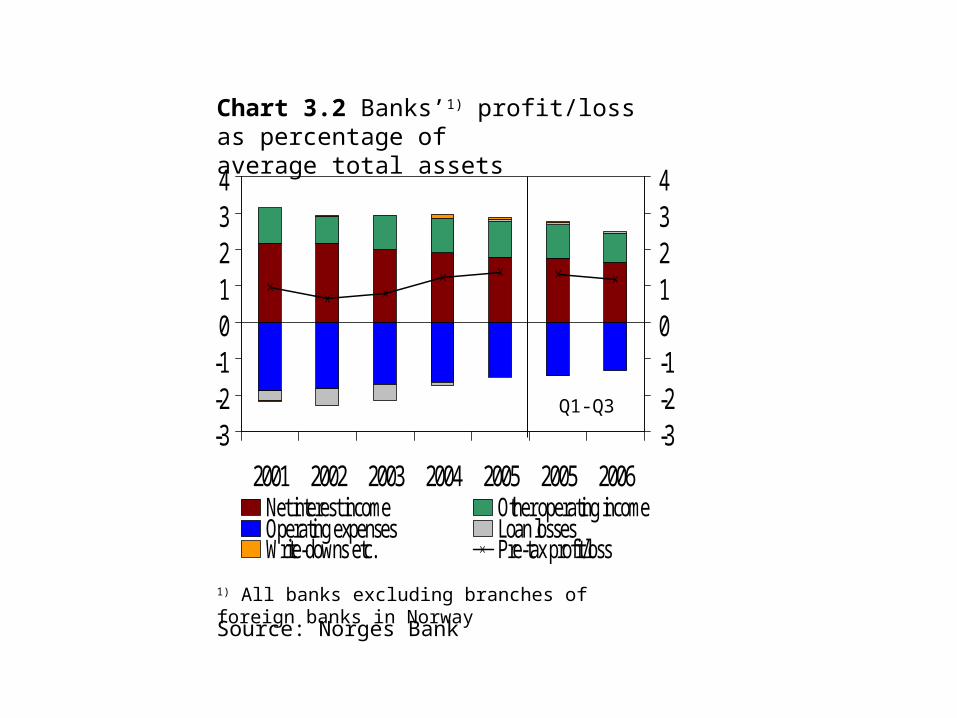
Chart 3.2 Banks’1) profit/loss as percentage of average total assets
1) All banks excluding branches of foreign banks in Norway
-3-2-101234
2001 2002 2003 2004 2005 2005 2006-3-2-101234
Net interest income Other operating incomeOperating expenses Loan lossesWrite-downs etc. Pre-tax profit/loss
Q1-Q3
Source: Norges Bank
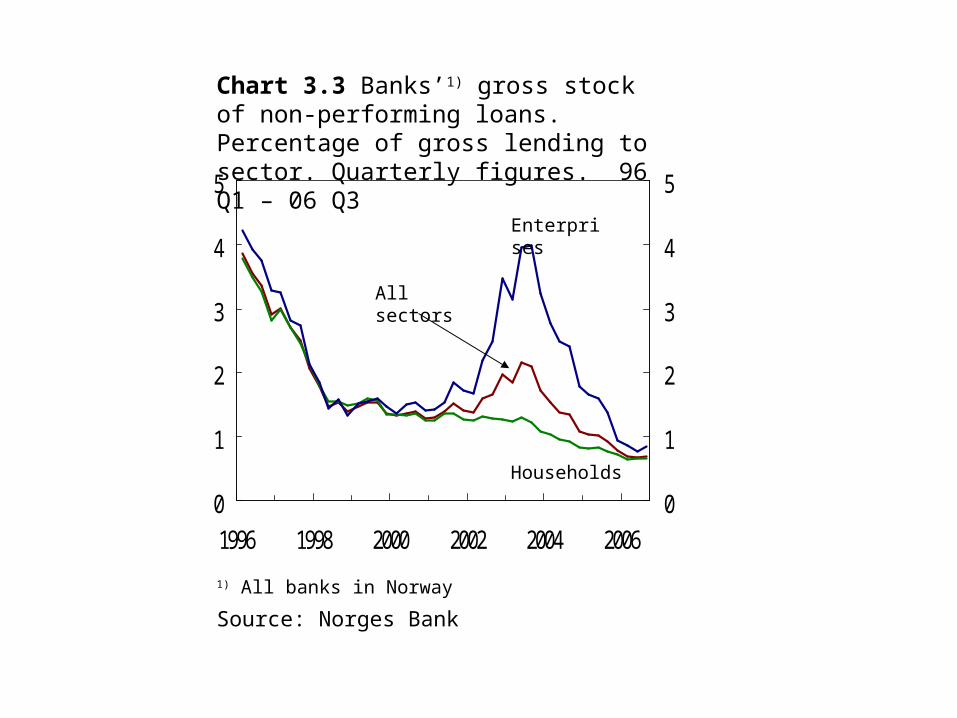
Chart 3.3 Banks’1) gross stock of non-performing loans. Percentage of gross lending to sector. Quarterly figures. 96 Q1 – 06 Q3
1) All banks in Norway
0
1
2
3
4
5
1996 1998 2000 2002 2004 20060
1
2
3
4
5
Households
All sectors
Enterprises
Source: Norges Bank
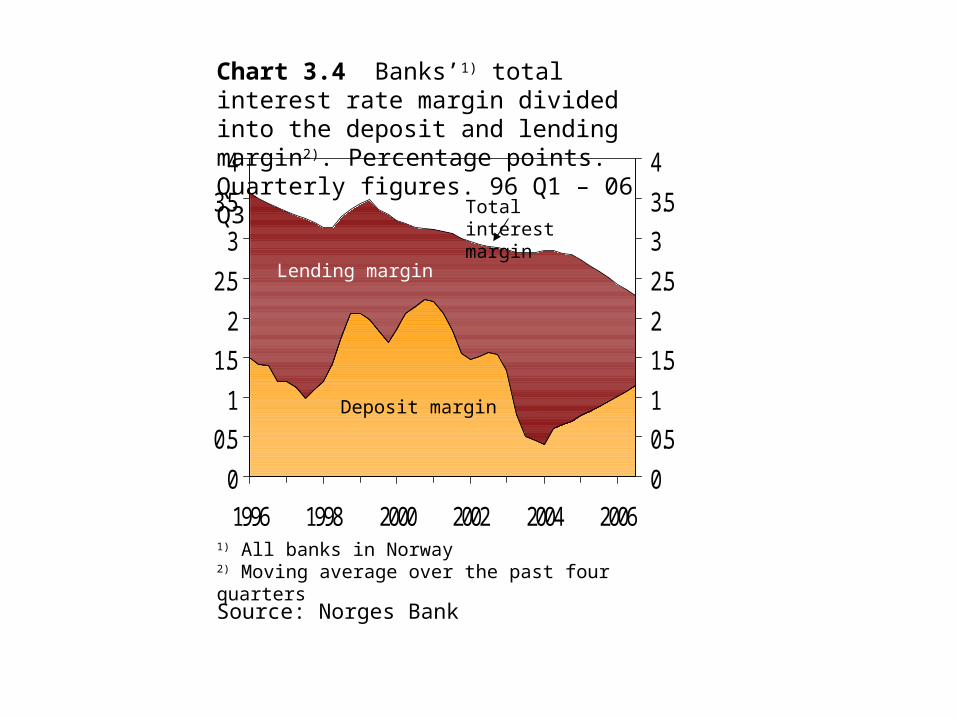
Chart 3.4 Banks’1) total interest rate margin divided into the deposit and lending margin2). Percentage points. Quarterly figures. 96 Q1 – 06 Q3
1) All banks in Norway2) Moving average over the past four quarters
0
0.51
1.52
2.5
33.5
4
1996 1998 2000 2002 2004 20060
0.51
1.52
2.5
33.5
4
Total interest margin
Lending margin
Deposit margin
Source: Norges Bank
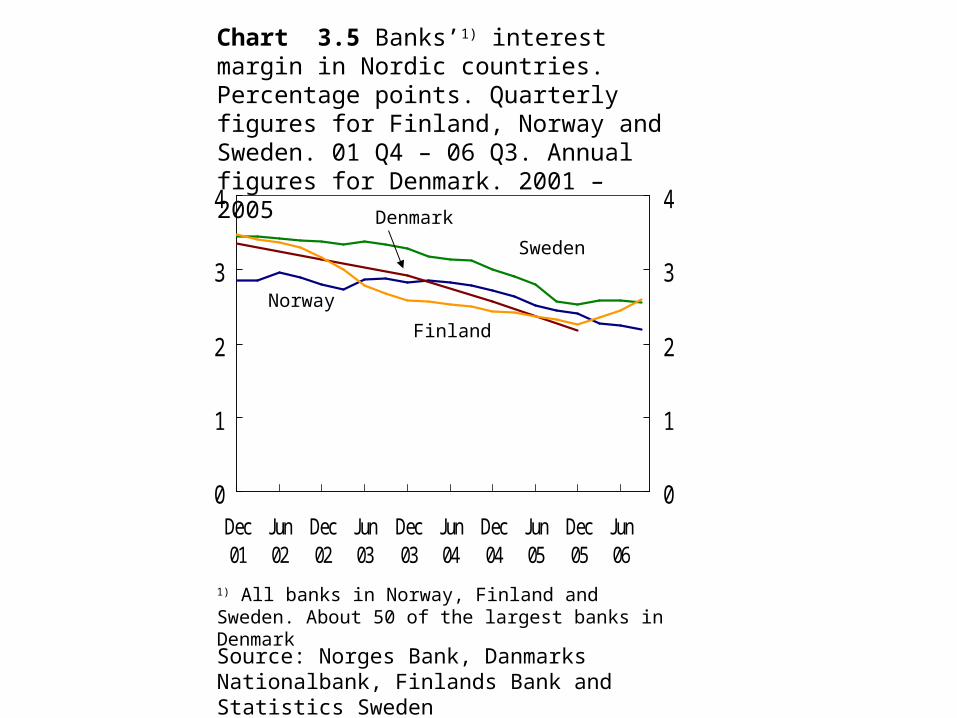
Chart 3.5 Banks’1) interest margin in Nordic countries. Percentage points. Quarterly figures for Finland, Norway and Sweden. 01 Q4 – 06 Q3. Annual figures for Denmark. 2001 – 2005
0
1
2
3
4
Dec01
Jun02
Dec02
Jun03
Dec03
Jun04
Dec04
Jun05
Dec05
Jun06
0
1
2
3
4
Norway
Denmark
Sweden
Finland
Source: Norges Bank, Danmarks Nationalbank, Finlands Bank and Statistics Sweden
1) All banks in Norway, Finland and Sweden. About 50 of the largest banks in Denmark
01020304050607080
0 - 0.4 0.4 - 0.7 0.7 - 1.0 Over 1.001020304050607080
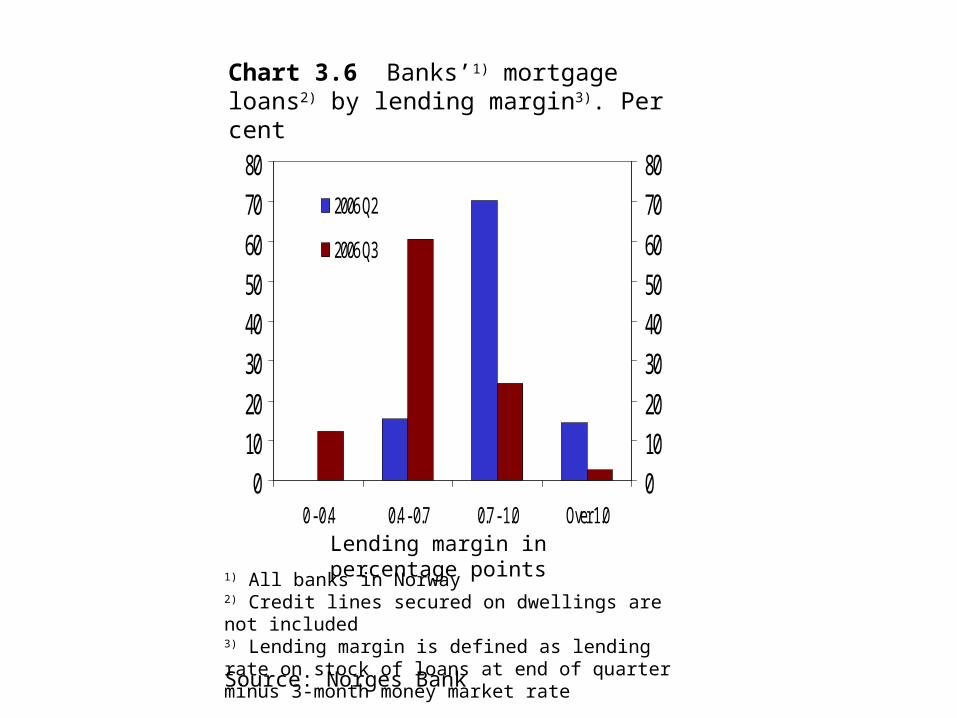
2006 Q2
2006 Q3
Chart 3.6 Banks’1) mortgage loans2) by lending margin3). Per cent
Lending margin in percentage points
Source: Norges Bank
1) All banks in Norway2) Credit lines secured on dwellings are not included3) Lending margin is defined as lending rate on stock of loans at end of quarter minus 3-month money market rate
0
10
20
30
40
50
60
70
80
2001 2002 2003 2004 20050
10
20
30
40
50
60
70
80
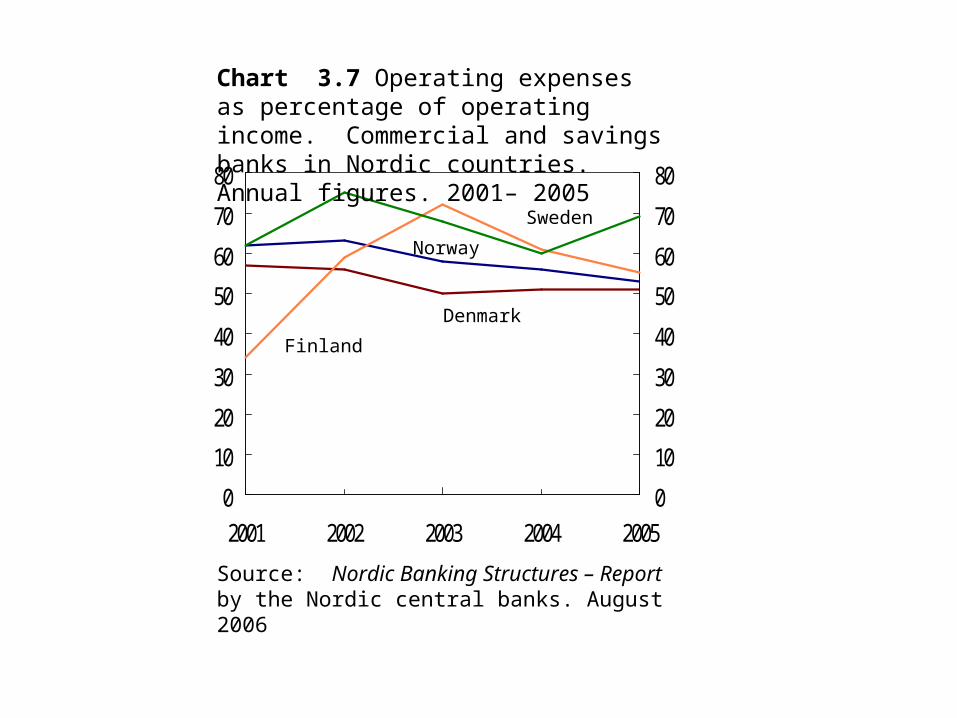
Chart 3.7 Operating expenses as percentage of operating income. Commercial and savings banks in Nordic countries. Annual figures. 2001– 2005
Source: Nordic Banking Structures – Report by the Nordic central banks. August 2006
Denmark
Norway
Sweden
Finland

-20
0
20
40
60
0 10 20 30 40
Tier 1 capital ratio
Grow
th in
lendin
g
-20
0
20
40
60
Less than NOK 10 bn in assets More than NOK 10 bn in assets
Chart 3.8 Norwegian banks’1) Tier 1 capital ratio and 12-month lending growth at end of Q3 2006. Per cent
1) Banks excluding foreign branches in Norway
Source: Norges Bank
-4
0
4
8
12
16
20
24
2000 2001 2002 2003 2004 2005 2006-4
0
4
8
12
16
20
24
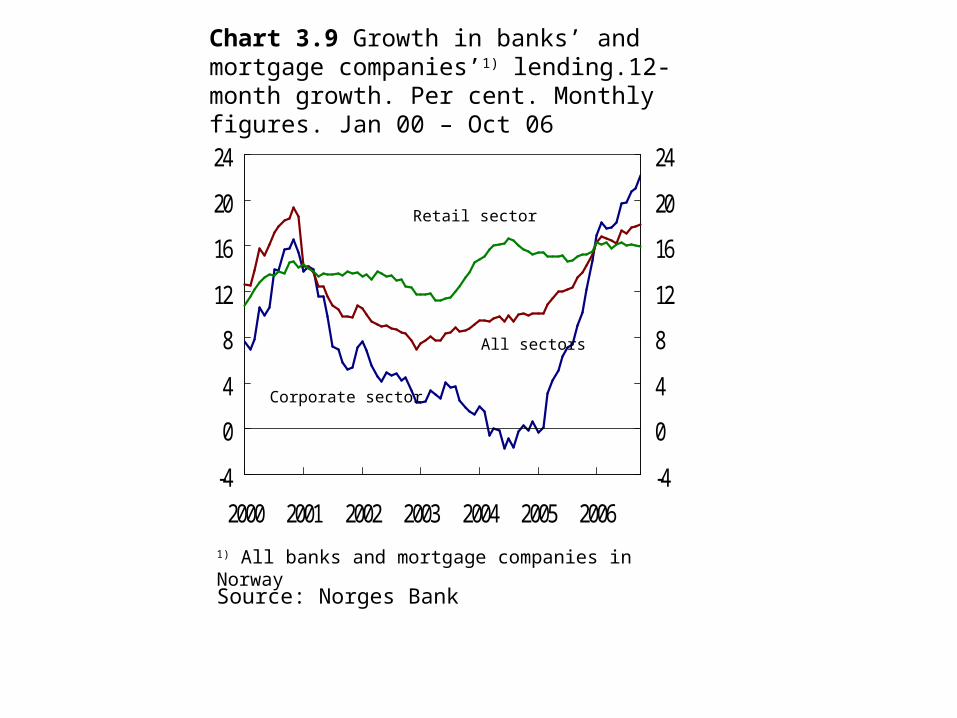
1) All banks and mortgage companies in Norway
Corporate sector
All sectors
Retail sector
Chart 3.9 Growth in banks’ and mortgage companies’1) lending.12-month growth. Per cent. Monthly figures. Jan 00 – Oct 06
Source: Norges Bank

Chart 3.10 Banks’ and mortgage companies’1) lending to selected industries. Four-quarter growth. Per cent. 02 Q1 – 06 Q3
1) All banks and mortage companies in Norway
-10
-5
0
5
10
15
20
25
30
2002 2003 2004 2005 2006-10
-5
0
5
10
15
20
25
30
Manufacturing
Construction and utilities
Retail trade, hotel and restaurant
Property management and commercial services
Source: Norges Bank
-1
0
1
2
3
4
5
1988 1991 1994 1997 2000 2003 2006 2009-1
0
1
2
3
4
5
Source: Norges Bank
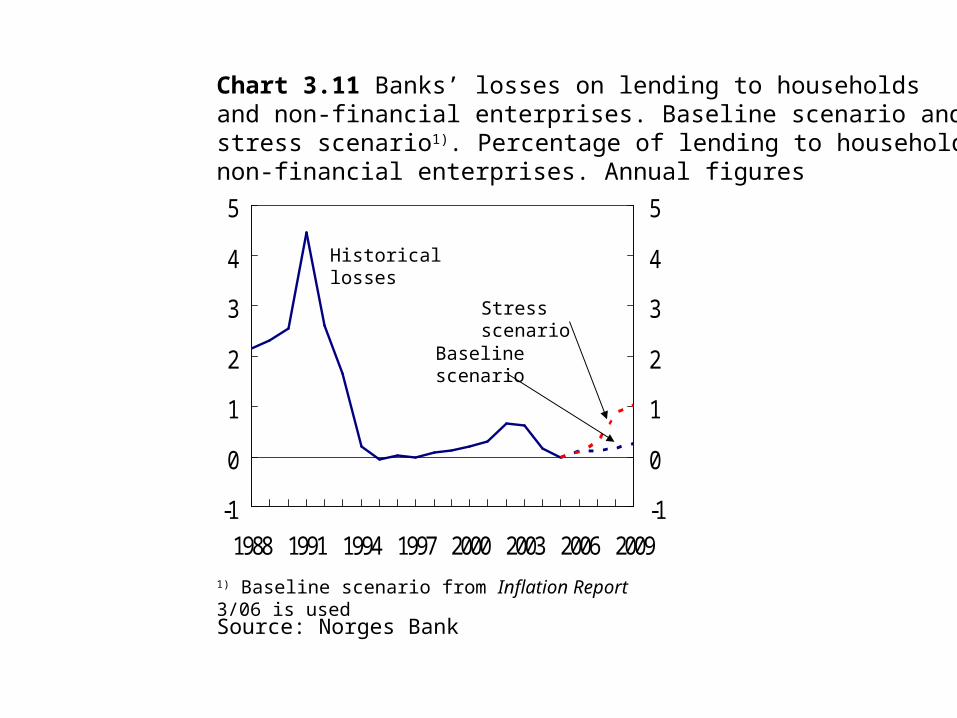
Baseline scenario
Chart 3.11 Banks’ losses on lending to households and non-financial enterprises. Baseline scenario and stress scenario1). Percentage of lending to households and non-financial enterprises. Annual figures
1) Baseline scenario from Inflation Report 3/06 is used
Stress scenario
Historical losses
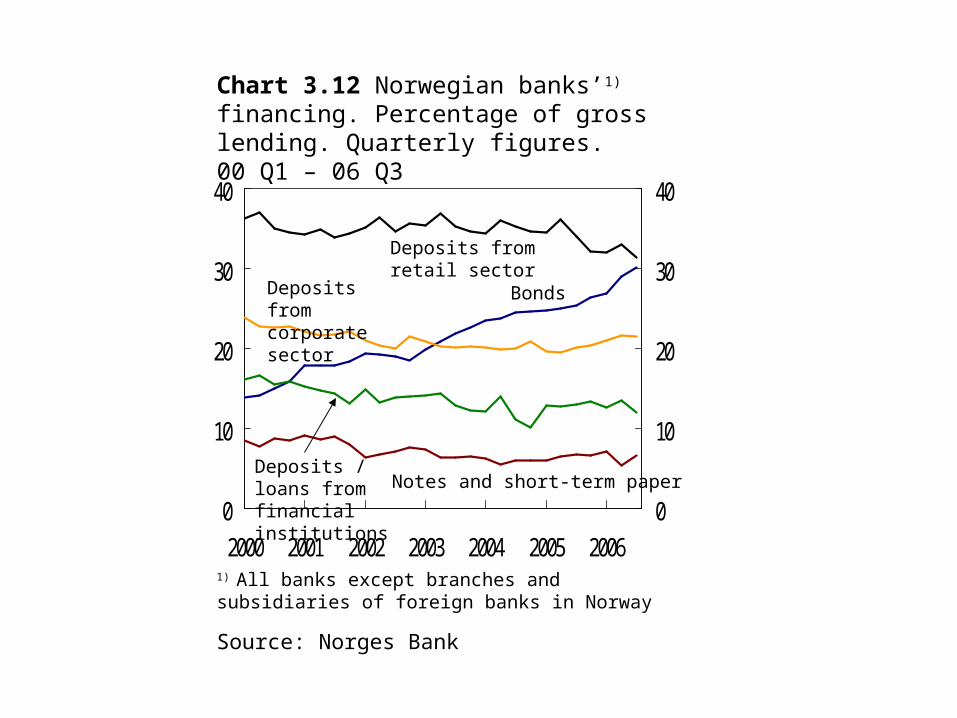
1) All banks except branches and subsidiaries of foreign banks in Norway
Chart 3.12 Norwegian banks’1) financing. Percentage of gross lending. Quarterly figures. 00 Q1 – 06 Q3
0
10
20
30
40
2000 2001 2002 2003 2004 2005 20060
10
20
30
40
Bonds
Notes and short-term paperDeposits / loans from financial institutions
Deposits from retail sector
Deposits from corporate sector
Source: Norges Bank

Chart 3.13 Banks’1) liabilities by maturity. Customer deposits are excluded. Per cent. Annual figures.2001- Sep. 2006
0
10
20
30
40
50
60
70
80
90
100
2001 2002 2003 2004 2005 sep.06
Less than 1 month 1 - 3 months 3 - 12 months
1 - 5 years More than 5 years No maturity
1) All banks except branches and subsidiaries of foreign banks in Norway
Source: Norges Bank
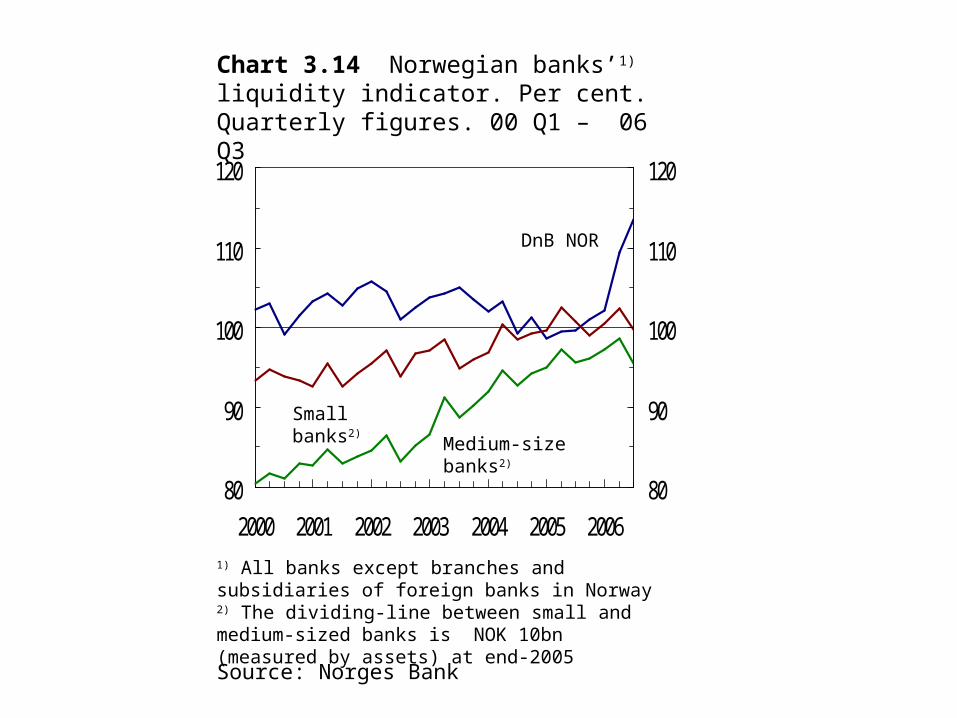
Chart 3.14 Norwegian banks’1) liquidity indicator. Per cent. Quarterly figures. 00 Q1 – 06 Q3
1) All banks except branches and subsidiaries of foreign banks in Norway 2) The dividing-line between small and medium-sized banks is NOK 10bn (measured by assets) at end-2005
80
90
100
110
120
2000 2001 2002 2003 2004 2005 200680
90
100
110
120
DnB NOR
Small banks2)
Medium-size banks2)
Source: Norges Bank

Chart 3.15 Nordic commercial and savings banks’ assets. Per cent. Annual figures. 2005
0
10
20
30
40
50
60
70
80
90
100
Norway Denmark Finland Sweden
0
10
20
30
40
50
60
70
80
90
100
Loans to the public Other interest-bearing assets Other assets
Source: Nordic Banking Structures – Report by the Nordic central banks. August 2006. Supplementary information from Sveriges Riksbank

Chart 3.16 Nordic commercial and savings banks’ liabilities. Per cent. Annual figures. 2005
0102030405060708090
100
Norway Denmark Finland Sweden
0102030405060708090100
EquityOther liabilities Debt securities and other interest-bearing liabilitiesDeposits by the public
Source: Nordic Banking Structures – Report by the Nordic central banks. August 2006. Supplementary information from Sveriges Riksbank
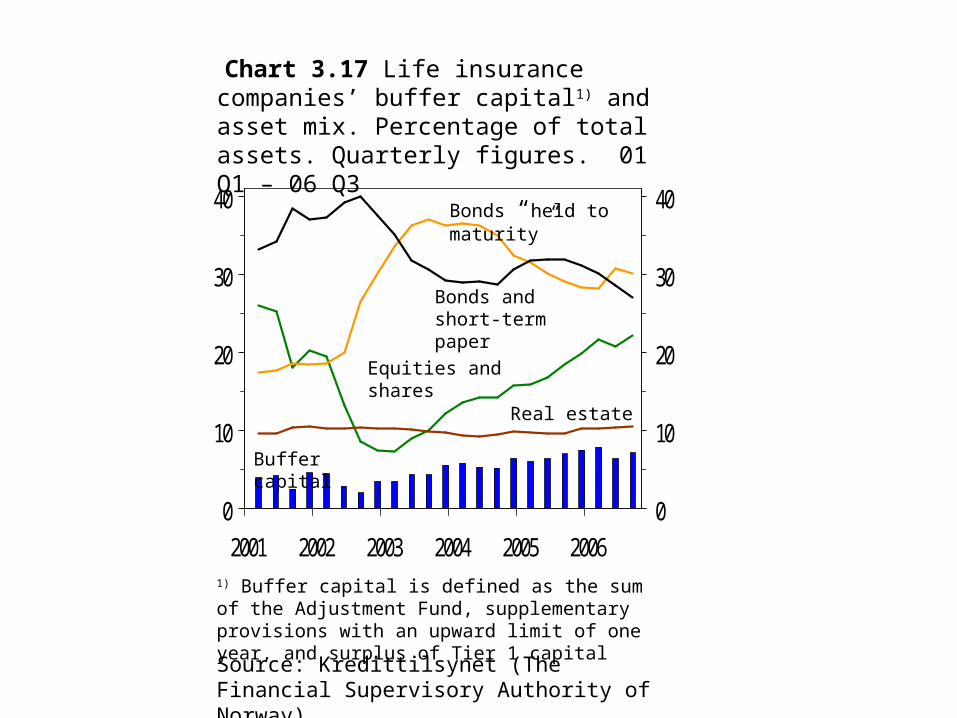
1) Buffer capital is defined as the sum of the Adjustment Fund, supplementary provisions with an upward limit of one year, and surplus of Tier 1 capital
Chart 3.17 Life insurance companies’ buffer capital1) and asset mix. Percentage of total assets. Quarterly figures. 01 Q1 – 06 Q3
0
10
20
30
40
2001 2002 2003 2004 2005 20060
10
20
30
40
Real estate
Equities and shares
Buffer capital
Bonds “held to maturity”
Bonds and short-term paper
Source: Kredittilsynet (The Financial Supervisory Authority of Norway)

Source: Norges Bank
Bank
Chart 3.18 Financial infrastructure in Norway
Norges Bank’s settlement system
Clearing
Settlement level 1
Direct participants level 1
Settlement level 2
Bank
NICS: retail clearing andclearing / transfer of large transactions
Bank BankDnB NOR
Bank Bank Bank
VPS
SpB1 M-N
Bank Bank
1) DnB NOR and Sparebank 1 Midt-Norge are level 1 participants that settle on behalf of banks at level 2

Boxes
Housing investments and house prices
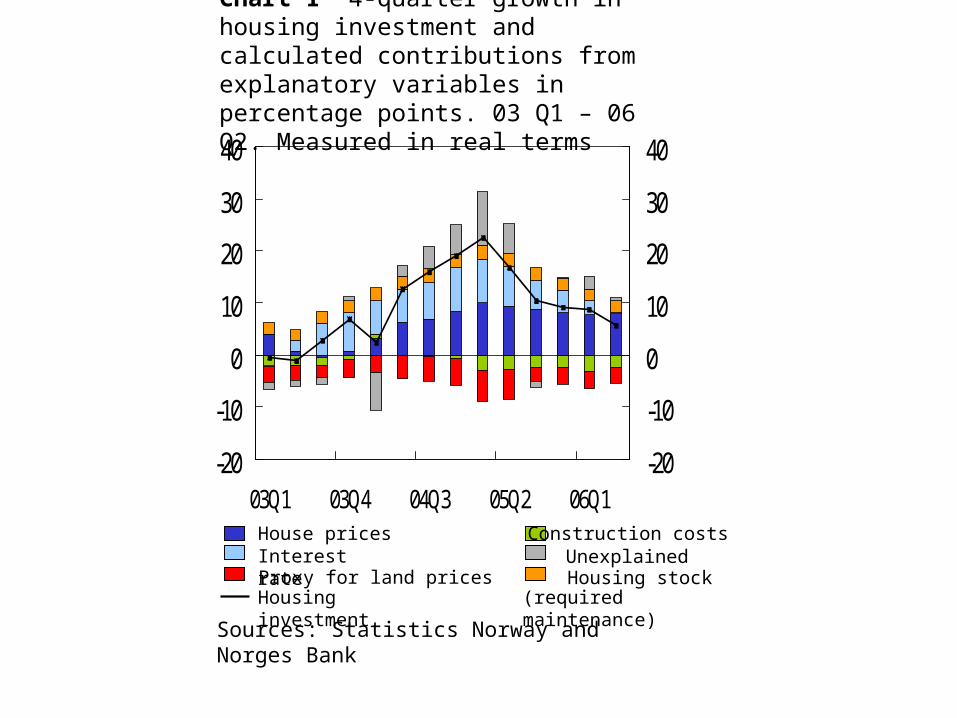
Sources: Statistics Norway and Norges Bank
Chart 1 4-quarter growth in housing investment and calculated contributions from explanatory variables in percentage points. 03 Q1 – 06 Q2. Measured in real terms
-20
-10
0
10
20
30
40
03Q1 03Q4 04Q3 05Q2 06Q1-20
-10
0
10
20
30
40
UnexplainedConstruction costs
Housing stockInterest rateHouse prices
Proxy for land prices Housing investment (required maintenance)
-2
0
2
4
6
8
10
12
14
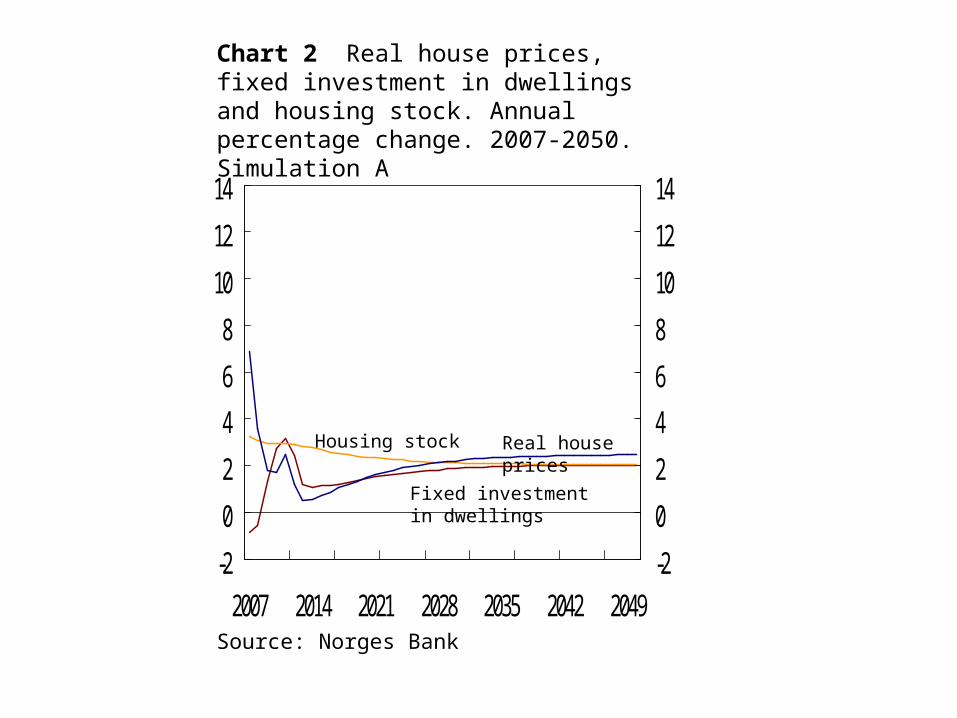
2007 2014 2021 2028 2035 2042 2049-2
0
2
4
6
8
10
12
14
Real house prices
Fixed investment in dwellings
Source: Norges Bank
Housing stock
Chart 2 Real house prices, fixed investment in dwellings and housing stock. Annual percentage change. 2007-2050. Simulation A
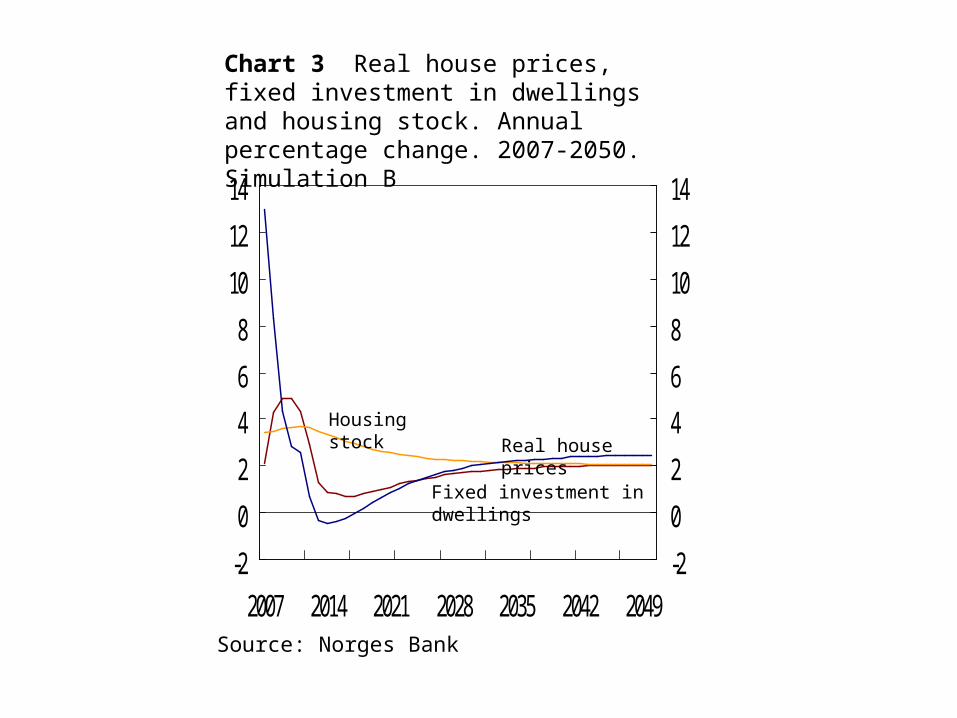
Chart 3 Real house prices, fixed investment in dwellings and housing stock. Annual percentage change. 2007-2050. Simulation B
-2
0
2
4
6
8
10
12
14
2007 2014 2021 2028 2035 2042 2049-2
0
2
4
6
8
10
12
14
Real house prices
Fixed investment in dwellings
Source: Norges Bank
Housing stock
High debt in households in many countries
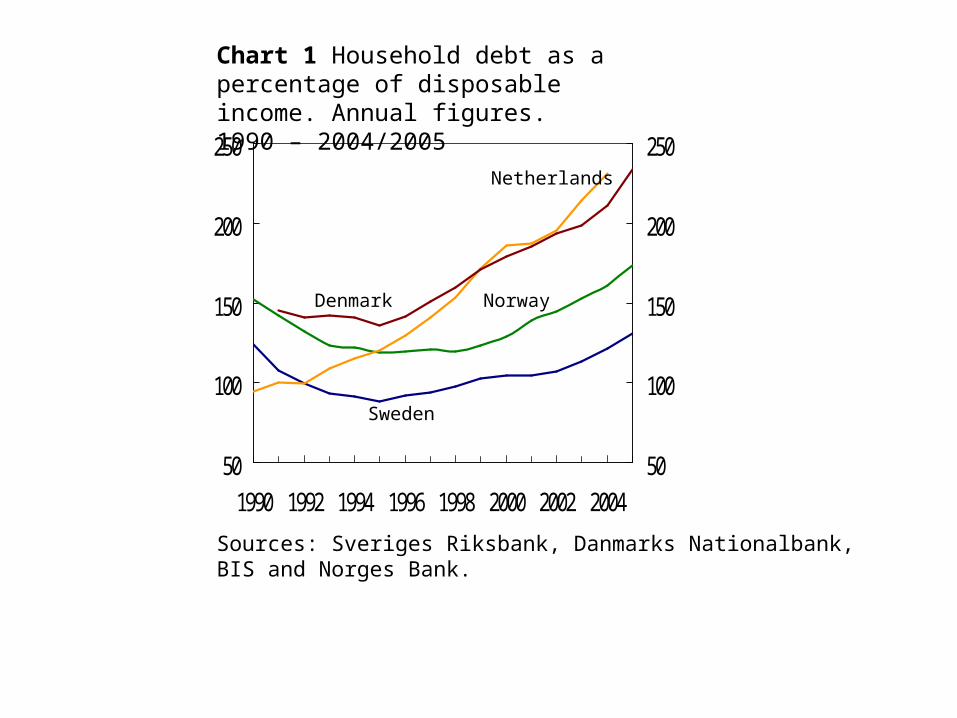
Chart 1 Household debt as a percentage of disposable income. Annual figures. 1990 – 2004/2005
Sources: Sveriges Riksbank, Danmarks Nationalbank,BIS and Norges Bank.
50
100
150
200
250
1990 1992 1994 1996 1998 2000 2002 200450
100
150
200
250
Denmark Norway
Sweden
Netherlands
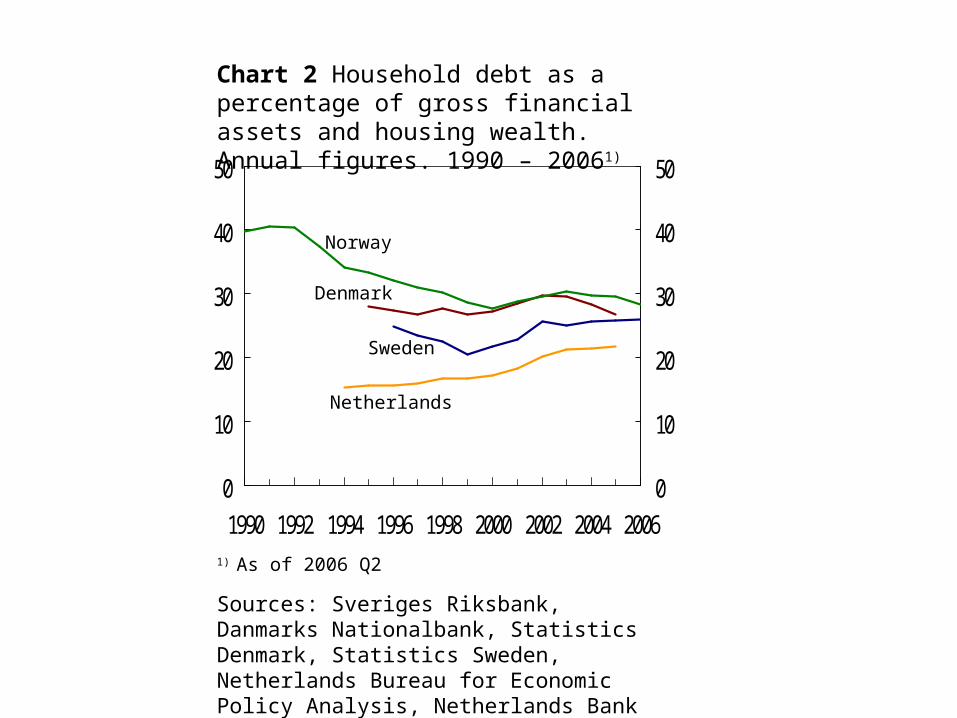
Chart 2 Household debt as a percentage of gross financial assets and housing wealth. Annual figures. 1990 – 20061)
Sources: Sveriges Riksbank, Danmarks Nationalbank, Statistics Denmark, Statistics Sweden, Netherlands Bureau for Economic Policy Analysis, Netherlands Bank and Norges Bank
1) As of 2006 Q2
0
10
20
30
40
50
1990 1992 1994 1996 1998 2000 2002 2004 20060
10
20
30
40
50
Denmark
Norway
Sweden
Netherlands
A fall in household consumption – what is the impact on credit risk in the
corporate sector?
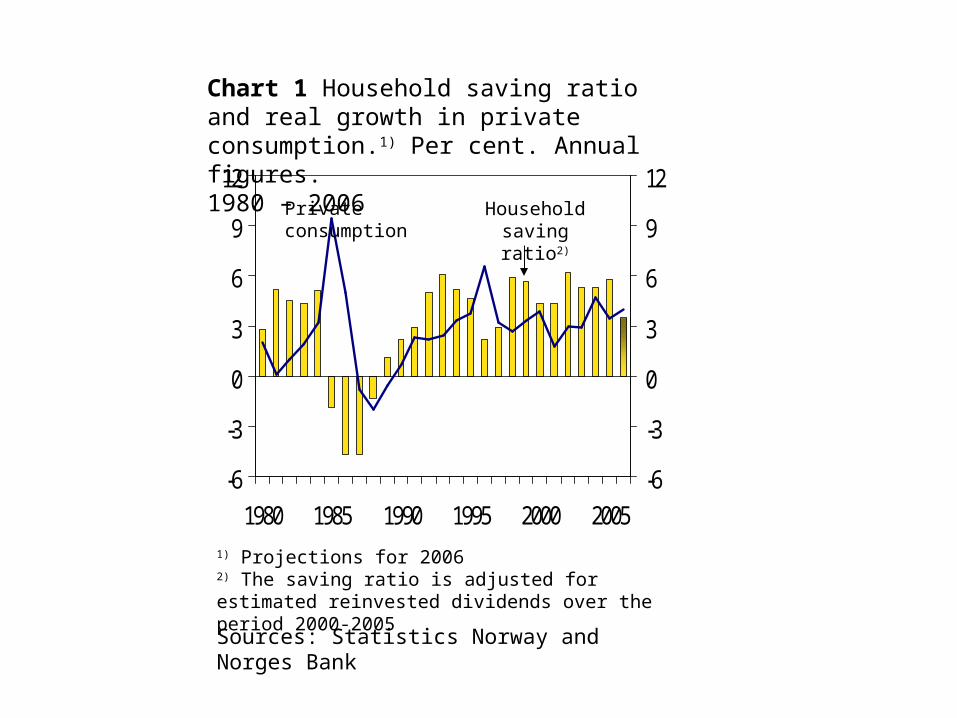
Chart 1 Household saving ratio and real growth in private consumption.1) Per cent. Annual figures.1980 – 2006
-6
-3
0
3
6
9
12
1980 1985 1990 1995 2000 2005-6
-3
0
3
6
9
12Private consumption
Sources: Statistics Norway and Norges Bank
1) Projections for 20062) The saving ratio is adjusted for estimated reinvested dividends over the period 2000-2005
Household saving ratio2)

-5
0
5
10
1980 1985 1990 1995 2000 2005-5
0
5
10
Chart 2 Private consumption and value added in consumption-related sectors1). Annual change in per cent. 1980 – 2005
Sources: Statistics Norway and Norges Bank
1) Consumption-related sectors are defined as in Table 12) Calculated on the basis of value added at constant 2000-prices
Value added in consumption-related sectors2)
Private consumption
Basel II – what is the impact on banks’ capital
adequacy?
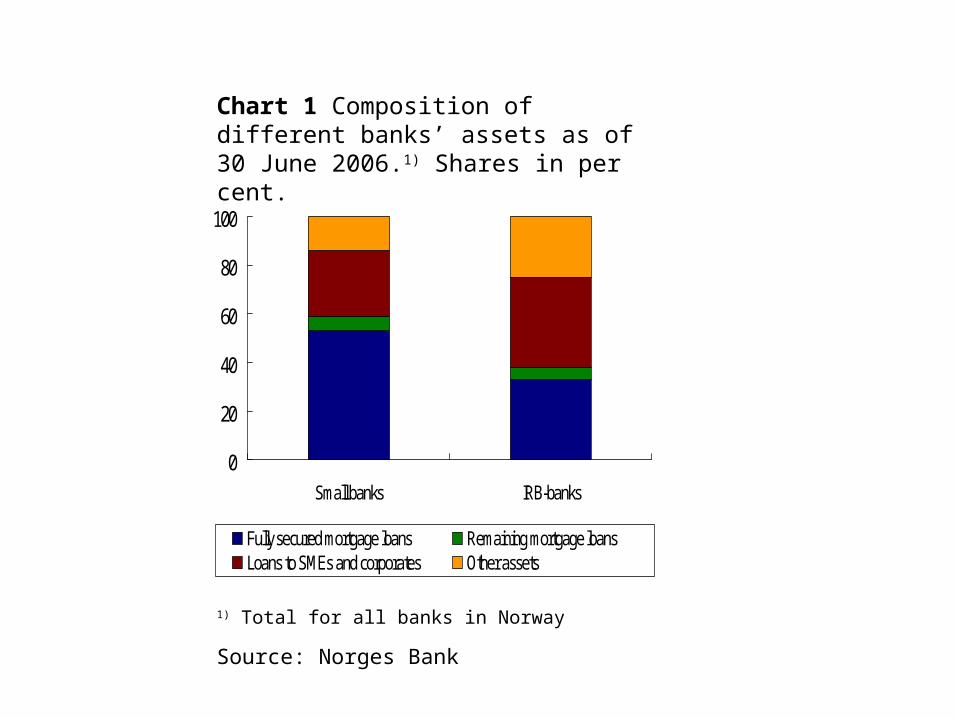
Chart 1 Composition of different banks’ assets as of 30 June 2006.1) Shares in per cent.
1) Total for all banks in Norway
0
20
40
60
80
100
Small banks IRB-banks
Fully secured mortgage loans Remaining mortgage loansLoans to SMEs and corporates Other assets
Source: Norges Bank


![Psychrometric Charts 3[1]](https://img.pdfslide.net/doc/110x75/577d20ac1a28ab4e1e937c25/psychrometric-charts-31.jpg)