Embed Size (px)
Citation preview

Bianco Research L.L.C.An Arbor Research & Trading Affiliated Company
Independent · Objective · Original———————————————————————————————————————————————————————————————————————
Long-Term Interest Rates - 1900 to 2010
Charts Of The WeekUpdated Pictures of Current Interest
For the week of February 9, 2011

Bianco Research, L.L.C For the week of February 9, 2011 2
Why Crude Oil Prices Are Now Above $100/BarrelFrom Our Newsclips/Daily Commentary
What is the worldwide price of crude oil?
If you’re like most, you will look up the nearby crude oil futures contract that trades on the New York Mercantile Exchange (NYMEX). Yesterday (February 8th) the March 2011 NYMEX contract closed at $86.94/barrel, down 43 cents. This contract is based on the price for “sweet” (low sulfur) Cushing Oklahoma delivered crude oil. But, is this price misleading? Could the true worldwide price actually be above $100/barrel? We believe the answer is yes. Let us explain.
Many Benchmarks For Crude
As the chart to the right shows, a divergence has opened up between various sweet benchmark crude oil prices. For this analysis we will focus on similar grades of sweet crude oil like that found in Cushing Oklahoma. (The other major grade is high sulfur “sour”crude which usually trades at a discount to sweet crude oil. Sour crude oil is more expensive to refine, making it less desirable.)
In the chart to the right, the mid-continent U.S. pipeline delivered benchmarks of West Texas Intermediate (WTI) in Midland Texas (pink line) and WTI in Cushing Oklahoma (black line) are tradingaround $87/barrel.
However, the other sweet crude oil benchmarks are trading around$100/barrel. These are the waterborne (tanker) cargoes originating out of the Bonny oil terminal in Southern Nigeria (Bonny Light in red), the North Sea cargoes from the Sullom Voe oil terminal in Shetland Islands, Scotland (Brent 40s in blue) and St. James Parish in Louisiana that connects to the Louisiana Offshore Oil Port or LOOP (LA Light in Cyan). The Brent crude oil benchmark is the underlying cash market for the Brent futures contract traded on the Intercontinental Commodity Exchange (ICE) ….Continued here.
Benchmark "Sweet" Crude Oil Price
70
75
80
85
90
95
100
105
6/30
/201
0
7/20
/201
0
8/9/
2010
8/29
/201
0
9/18
/201
0
10/8
/201
0
10/2
8/20
10
11/1
7/20
10
12/7
/201
0
12/2
7/20
10
1/16
/201
1
2/5/
2011
2/25
/201
1
Dol
lars
Per
Bar
rel
70
75
80
85
90
95
100
105
Dol
lars
Per
Bar
rel
WTI Cushing SpotLA Light SpotAf Bonny LightWTI Midland SpotBrent 40s Spot
26-Nov

Bianco Research, L.L.C For the week of February 9, 2011 3
Crude Oil Mid-Continent Dislocation ReturnsFrom A Recent Market Facts
The Mid-Continent DislocationGulf Coast To Cushing
$(3)
$(2)
$(1)
$-
$1
$2
$3
$4
$5
$6
$7
$8
$9
$10
$11
$12
$13
Jul-8
8M
ar-8
9D
ec-8
9S
ep-9
0Ju
n-91
Mar
-92
Dec
-92
Sep
-93
Jun-
94M
ar-9
5D
ec-9
5S
ep-9
6Ju
n-97
Mar
-98
Dec
-98
Sep
-99
Jun-
00M
ar-0
1D
ec-0
1S
ep-0
2Ju
n-03
Mar
-04
Dec
-04
Sep
-05
Jun-
06M
ar-0
7D
ec-0
7S
ep-0
8Ju
n-09
Mar
-10
Dec
-10
LLS
@ S
t. Ja
mes
- W
TI @
Cus
hing
, $/B
$(3)
$(2)
$(1)
$-
$1
$2
$3
$4
$5
$6
$7
$8
$9
$10
$11
$12
$13
LLS
@ S
t. Ja
mes
- W
TI @
Cus
hing
, $/B
The Mid-Continent Dislocation In Sweet Crude Oil
$(4.5)
$(3.5)
$(2.5)
$(1.5)
$(0.5)
$0.5
$1.5
$2.5
$3.5
$4.5
$5.5
$6.5
$7.5
$8.5
$9.5
$10.5
Jul-8
8M
ar-8
9D
ec-8
9S
ep-9
0Ju
n-91
Mar
-92
Dec
-92
Sep
-93
Jun-
94M
ar-9
5D
ec-9
5S
ep-9
6Ju
n-97
Mar
-98
Dec
-98
Sep
-99
Jun-
00M
ar-0
1D
ec-0
1S
ep-0
2Ju
n-03
Mar
-04
Dec
-04
Sep
-05
Jun-
06M
ar-0
7D
ec-0
7S
ep-0
8Ju
n-09
Mar
-10
Dec
-10
LLS
- Bre
nt B
lend
, Adj
uste
d, $
/B (R
osea
te C
olum
ns)
$(11.5)$(10.5)$(9.5)$(8.5)$(7.5)$(6.5)$(5.5)$(4.5)$(3.5)$(2.5)$(1.5)$(0.5)$0.5$1.5$2.5$3.5$4.5$5.5$6.5
WTI
- B
rent
Ble
nd, A
djus
ted,
$/B
(Blu
e Li
ne)
LLS - Brent(Left Scale)
WTI - Brent(Right Scale)
The spread between Louisiana Light Sweet (LLS) at St. James, Louisiana and West Texas Intermediate (WTI) at Cushing, Oklahoma (roseate columns, left-hand chart), last datum in red, is at an all-time high. This discount is consistent with the 9.2% increase in Cushing storage since the start of October 2010.
The adjusted Brent-WTI and adjusted LLS-Brent Blend spreads (hatched blue line and roseate columns, right-hand chart) reflect the midcontinent discount. The Brent-WTI spread has collapsed in favor of Brent while the LLS-Brent spread remains in a rather normal range; the last datum of $1.99 is highlighted in red. A conclusion from May 2010 remains (original boldface):
The crude oil market is not distorted so much as the Cushing delivery point for WTI is distorted.

Bianco Research, L.L.C For the week of February 9, 2011 4
TIPS’ Forecasting Record Still Better Than Economists’From A Recent Market Facts
Assessing The TIPS Market's Forecasting Ability
0.75%
0.95%
1.15%
1.35%
1.55%
1.75%
1.95%
2.15%
2.35%
2.55%
2.75%
2.95%
3.15%
3.35%
Feb-
97M
ar-9
7A
pr-9
7M
ay-9
7Ju
n-97
Jul-9
7A
ug-9
7S
ep-9
7O
ct-9
7N
ov-9
7D
ec-9
7Ja
n-98
Feb-
98M
ar-9
8A
pr-9
8M
ay-9
8Ju
n-98
Jul-9
8A
ug-9
8S
ep-9
8O
ct-9
8N
ov-9
8D
ec-9
8Ja
n-99
Feb-
99M
ar-9
9A
pr-9
9M
ay-9
9Ju
n-99
Jul-9
9A
ug-9
9S
ep-9
9O
ct-9
9N
ov-9
9D
ec-9
9Ja
n-00
Feb-
00M
ar-0
0A
pr-0
0M
ay-0
0Ju
n-00
Jul-0
0A
ug-0
0S
ep-0
0O
ct-0
0N
ov-0
0D
ec-0
0
Rea
lized
Ten
-Yea
r Ave
rage
CPI
(Red
Col
umns
)
0.75%
0.95%
1.15%
1.35%
1.55%
1.75%
1.95%
2.15%
2.35%
2.55%
2.75%
2.95%
3.15%
3.35%
Forw
ard-
Look
ing
TIPS
Bre
akev
en R
ate
(Blu
e Li
ne)
We last visited the topic of the TIPS market relative forecasting ability vis-à-vis professional economists in July 2010. As we now have another seven months of data, and as TIPS breakevens have increased from 181 to 235 basis points, an update is in order.
The contemporaneous ten-year breakeven rate of inflation (blue line) fell steadily between the January 1997 launch of TIPS and December 1998, and then began to climb to 2.28%. The realized ten-year average of the CPI-U over the succeeding ten year period (red columns) rose steadily; the ten-year average culminating in May 2000 was 2.62%.

Bianco Research, L.L.C For the week of February 9, 2011 5
Betting On MetalsAll Known ETF Holdings Of Gold
300
400
500
600
700
800
900
1,000
1,100
1,200
1,300
1,400
1,50011
/3/2
003
2/9/
2004
5/17
/200
4
8/23
/200
4
11/2
9/20
04
3/7/
2005
6/13
/200
5
9/19
/200
5
12/2
6/20
05
4/3/
2006
7/10
/200
6
10/1
6/20
06
1/22
/200
7
4/30
/200
7
8/6/
2007
11/1
2/20
07
2/18
/200
8
5/26
/200
8
9/1/
2008
12/8
/200
8
3/16
/200
9
6/22
/200
9
9/28
/200
9
1/4/
2010
4/12
/201
0
7/19
/201
0
10/2
5/20
10
1/31
/201
1
Spot
Gol
d P
rice
- Red
Lin
e
0
10
20
30
40
50
60
70
Num
ber o
f Oun
ces
(in m
illio
ns) H
eld
By A
ll E
TFs
- Blu
e Li
ne
Spot Gold Price(Left Scale)
Ounces (in Millions) Held By ALL ETFs(Right Scale)
All Known ETF Holdings Of Silver
5
10
15
20
25
30
35
5/1/
2006
8/7/
2006
11/1
3/20
06
2/19
/200
7
5/28
/200
7
9/3/
2007
12/1
0/20
07
3/17
/200
8
6/23
/200
8
9/29
/200
8
1/5/
2009
4/13
/200
9
7/20
/200
9
10/2
6/20
09
2/1/
2010
5/10
/201
0
8/16
/201
0
11/2
2/20
10
2/28
/201
1
Spot
Silv
er P
rice
- Red
Lin
e
0
50
100
150
200
250
300
350
400
450
500
Num
ber o
f Oun
ces
(in m
illio
ns) H
eld
By A
ll E
TFs
- Blu
e Li
ne
Spot Silver Price(Left Scale)
Ounces (in Millions) Held By ALL ETFs(Right Scale)
All Known ETF Holdings Of Platinum
500
750
1,000
1,250
1,500
1,750
2,000
2,250
2,500
4/26
/200
7
8/2/
2007
11/8
/200
7
2/14
/200
8
5/22
/200
8
8/28
/200
8
12/4
/200
8
3/12
/200
9
6/18
/200
9
9/24
/200
9
12/3
1/20
09
4/8/
2010
7/15
/201
0
10/2
1/20
10
1/27
/201
1
Spot
Silv
er P
rice
- Red
Lin
e
0.0
0.2
0.4
0.6
0.8
1.0
1.2
1.4
Num
ber o
f Oun
ces
(in m
illio
ns) H
eld
By A
ll E
TFs
- Blu
e Li
ne
Spot Platinum Price(Left Scale)
Ounces (in Millions) Held By ALL ETFs(Right Scale)
All Known ETF Holdings Of Palladium
100
200
300
400
500
600
700
800
900
4/26
/200
7
8/2/
2007
11/8
/200
7
2/14
/200
8
5/22
/200
8
8/28
/200
8
12/4
/200
8
3/12
/200
9
6/18
/200
9
9/24
/200
9
12/3
1/20
09
4/8/
2010
7/15
/201
0
10/2
1/20
10
1/27
/201
1
Spo
t Silv
er P
rice
- Red
Lin
e
0.0
0.5
1.0
1.5
2.0
2.5
Num
ber o
f Oun
ces
(in m
illion
s) H
eld
By
All
ETFs
- Bl
ue L
ine
Spot Palladium Price(Left Scale)
Ounces (in Millions) Held By ALL ETFs(Right Scale)

Bianco Research, L.L.C For the week of February 9, 2011 6
Declining Carry Trade Again A Warning To Global EquitiesFrom A Recent Market Facts
Let’s revisit the topic. We will use, as before, the Deutsche Bank “G-10 Currency Future Harvest” index (black line, left-hand chart) and broad global equity indices such as the MSCI World Free, the EAFE, Emerging Markets Free and the U.S. (magenta, blue, hatched green and hatched red lines, both charts).
The G-10 Currency Future Harvest index, which began in March 1993, replicates the carry strategy of borrowing in low-yield futures and lending in high-yield futures. “High” and “low” are relative terms.
Equity index returns are outstripping currency carry returns just as they had in March-April 2010. In addition, the rolling three-month correlation of returns of equity indices against the currency carry index (right-hand chart) has turned lower.
This observation corroborates other recent conclusions for markets such as India, Indonesia, Thailand and the Philippines. Low interest rates in funding countries are forcing short-term interest rates higher in receiving countries; this leads to selling in those equity markets and diminished currency carry returns despite wider short-term interest rate gaps.
The Carry Trades And Global Stock Indices
75
100
125
150
175
200
225
250
275
300
325
Mar
-93
Nov
-93
Jun-
94Fe
b-95
Oct
-95
May
-96
Jan-
97S
ep-9
7M
ay-9
8D
ec-9
8A
ug-9
9A
pr-0
0D
ec-0
0Ju
l-01
Mar
-02
Nov
-02
Jul-0
3Fe
b-04
Oct
-04
Jun-
05Ja
n-06
Sep
-06
May
-07
Jan-
08A
ug-0
8A
pr-0
9D
ec-0
9A
ug-1
0M
ar-1
1
DB
Cur
renc
y H
arve
st In
dex
(Bla
ck L
ine)
50%
75%
100%
125%
150%
175%
200%
225%
250%
275%
300%
325%
350%
375%
400%
425%
MSC
I Ind
ices
, Mar
ch 1
2, 1
993
= 10
0%
World Free
EAFE
Emerging Markets FreeUS
DB Currency Futures Harvest Index(Left Scale)
The Importance Of The Carry Trades Turning Lower
-0.5
-0.4
-0.3
-0.2
-0.1
0
0.1
0.2
0.3
0.4
0.5
0.6
0.7
0.8
0.9
Jul-9
3M
ar-9
4
Nov
-94
Jun-
95
Feb-
96O
ct-9
6M
ay-9
7
Jan-
98S
ep-9
8
May
-99
Dec
-99
Aug
-00
Apr
-01
Nov
-01
Jul-0
2
Mar
-03
Nov
-03
Jun-
04Fe
b-05
Oct
-05
Jun-
06Ja
n-07
Sep
-07
May
-08
Dec
-08
Aug
-09
Apr
-10
Dec
-10
Rol
ling
Thre
e-M
onth
Cor
rela
tion
of R
etur
ns
-0.5
-0.4
-0.3
-0.2
-0.1
0
0.1
0.2
0.3
0.4
0.5
0.6
0.7
0.8
0.9
Rol
ling
Thre
e-M
onth
Cor
rela
tion
of R
etur
ns
World Free
EAFE
Emerging Markets Free
US

Bianco Research, L.L.C For the week of February 9, 2011 7
Russian Markets Facing Rising InflationFrom A Recent Market Facts
The Ruble/Dollar Rate And Crude Oil
21
22
23
24
25
26
27
28
29
30
31
32
33
34
35
36
37
Jan-
99
Jun-
99
Dec
-99
Jun-
00
Dec
-00
Jun-
01
Nov
-01
May
-02
Nov
-02
May
-03
Nov
-03
Apr
-04
Oct
-04
Apr
-05
Oct
-05
Apr
-06
Sep
-06
Mar
-07
Sep
-07
Mar
-08
Sep
-08
Feb-
09
Aug
-09
Feb-
10
Aug
-10
Jan-
11
RU
B P
er U
SD, I
nver
se S
cale
(Thi
n R
ed L
ine)
$5
$15
$25
$35
$45
$55
$65
$75
$85
$95
$105
$115
$125
$135
$145
Ura
ls C
rude
Oil,
NW
E (T
hick
Blu
e Li
ne)
RUB Per USD(Left Scale)
Urals Crude Oil(Right Scale)
Russian Equity Relative Performance A Function Of Crude Oil
Rel. Perf. = 8.176 * Ln(Urals) - 20.256R2 = 0.83
0%
150%
300%
450%
600%
750%
900%
1050%
1200%
1350%
1500%
1650%
1800%
1950%
2100%
$5 $15
$25
$35
$45
$55
$65
$75
$85
$95
$105
$115
$125
$135
$145
Urals Crude Oil At Northwest Europe
Rel
ativ
e Pe
rfor
man
ce, M
SCI
Rus
sia
Vs. E
MU
Jan.
5, 1
999
= 10
0%
Feb. 1, 2011
We concluded in August 2010 rising crude oil prices would support both the ruble and Russian equity prices. The price of benchmark Urals crude oil delivered to Northwest Europe (thick blue line, left-hand chart) has increased 21% since that time, and the total return of Russian equities relative to EMU equities has advanced 9.48%, but the RUB has been (thin red line, inverse scale) has been static. The excess carry return between the USD and the RUB has been erratic, gaining only 2.277%. The excess carry return from the EURhas been -2.93%.
We can attribute much of this poor RUB performance to Russian reticence to raise short-term interest rates in the face of 8.8% annualized consumer inflation. The Central Bank of Russia’s refinancing rate has remained at 7.75% since June 1, 2010, when it was lowered from 8.00%.
Russian equities’ performance relative to the EMU prices (top right-hand chart) remains a distinct function of crude oil; the logarithmic trend reflects the diminishing returns to higher crude oil prices similar to that seen in the U.S. market.

Bianco Research, L.L.C For the week of February 9, 2011 8
Carry Into Filipino Markets FadingFrom A Recent Market Facts
Yen Carry Into Peso Fading With Relative Stock Performance
30%
40%
50%
60%
70%
80%
90%
100%
110%
120%
130%
140%
150%
160%
170%
Mar
-99
Aug
-99
Feb-
00A
ug-0
0Fe
b-01
Jul-0
1Ja
n-02
Jul-0
2Ja
n-03
Jul-0
3D
ec-0
3Ju
n-04
Dec
-04
Jun-
05D
ec-0
5M
ay-0
6N
ov-0
6M
ay-0
7N
ov-0
7M
ay-0
8O
ct-0
8A
pr-0
9O
ct-0
9A
pr-1
0O
ct-1
0M
ar-1
1
Rel
ativ
e Pe
rf.,
US
D T
erm
s, P
hilip
pine
s V
s. J
apan
Mar
ch 1
, 199
9 =
100%
(Thi
n R
ed L
ine)
80
90
100
110
120
130
140
150
160
170
180
190
Exc
ess
Car
ry R
etur
n: J
PY
Into
PH
PM
arch
1, 1
999
= 10
0 (T
hick
Blu
e Li
ne)
Relative Stock Performance(Left Scale)
Carry Into PHP(Right Scale)
USD Carry Into Peso Parallels Relative Stock Performance
40%
50%
60%
70%
80%
90%
100%
110%
120%
130%
140%
150%
160%
170%
180%
Mar
-99
Aug
-99
Feb-
00
Aug
-00
Feb-
01Ju
l-01
Jan-
02Ju
l-02
Jan-
03Ju
l-03
Dec
-03
Jun-
04
Dec
-04
Jun-
05
Dec
-05
May
-06
Nov
-06
May
-07
Nov
-07
May
-08
Oct
-08
Apr
-09
Oct
-09
Apr
-10
Oct
-10
Mar
-11
Rel
ativ
e Pe
rf. In
USD
Ter
ms
Phi
lippi
nes
Vs. U
.S.
Mar
ch 1
, 199
9 =
100%
(Thi
n R
ed L
ine)
80859095100105110115120125130135140145150155160165170175180
Exce
ss C
arry
Ret
urn:
USD
Into
PH
PM
arch
1, 1
999
= 10
0 (T
hick
Blu
e Li
ne)
Relative Stock Performance(Left Scale)
Carry Into PHP(Right Scale)
The excess carry return for the USD into the Philippine peso (thick blue line, left-hand chart) peaked at the beginning of October 2010. The yen carry trade (thick blue line, right-hand chart) peaked in December 2007 and was replaced, as has been the case so often, by the dollar carry trade.
The story is similar to what we have seen for India, Indonesia, Korea and Thailand. Short-term interest rates are rising; three-month PHIBOR has increased from 1.25% to 2.5625%. Interestingly, reported inflation is not in an uptrend; the Filipino CPI’s year-over-year increase of 3.0% reported in December was less than every month’s reading for January-September 2010.
The anticipation of higher short-term interest rates to come has pushed the relative performance of Filipino equities sharply lower since the dollar carry trade peaked in October; they declined 21.287% and 19.602% relative to American and Japanese stocks (thin red lines, left- and right-hand charts, respectively), in USD terms.

Bianco Research, L.L.C For the week of February 9, 2011 9
Thailand Turns Lower As Carry Fades
Yen Carry Into Baht Fading With Relative Stock Performance
25%50%75%
100%125%150%175%200%225%250%275%300%325%350%375%400%425%450%475%500%
Mar
-99
Aug
-99
Feb-
00A
ug-0
0Fe
b-01
Jul-0
1Ja
n-02
Jul-0
2Ja
n-03
Jul-0
3D
ec-0
3Ju
n-04
Dec
-04
Jun-
05D
ec-0
5M
ay-0
6N
ov-0
6M
ay-0
7N
ov-0
7M
ay-0
8O
ct-0
8A
pr-0
9O
ct-0
9A
pr-1
0O
ct-1
0M
ar-1
1
Rel
ativ
e Pe
rform
ance
, USD
Ter
ms,
Tha
iland
Vs.
Jap
anM
arch
1, 1
999
= 10
0% (T
hin
Red
Lin
e)
80
85
90
95
100
105
110
115
120
125
130
135
140
145
150
155
Exce
ss C
arry
Ret
urn:
JPY
Into
TH
B,
Mar
ch 1
, 199
9 =
100
(Thi
ck B
lue
Line
)
Relative Stock Performance(Left Scale)
Carry Into THB(Right Scale)
USD Carry Into Baht Parallels Relative Stock Performance
50%75%
100%125%150%175%200%225%250%275%300%325%350%375%400%425%450%475%500%525%
Mar
-99
Aug
-99
Feb-
00A
ug-0
0Fe
b-01
Jul-0
1Ja
n-02
Jul-0
2Ja
n-03
Jul-0
3D
ec-0
3Ju
n-04
Dec
-04
Jun-
05D
ec-0
5M
ay-0
6N
ov-0
6M
ay-0
7N
ov-0
7M
ay-0
8O
ct-0
8A
pr-0
9O
ct-0
9A
pr-1
0O
ct-1
0M
ar-1
1
Rel
ativ
e Pe
rform
ance
In U
SD T
erm
s Th
aila
nd V
s. U
.S.
Mar
ch 1
, 199
9 =
100%
(Thi
n R
ed L
ine)
80
85
90
95
100
105
110
115
120
125
130
135
Exc
ess
Car
ry R
etur
n: U
SD
Into
TH
B, M
arch
1, 1
999
= 10
0(T
hick
Blu
e Li
ne)
Relative Stock Performance(Left Scale)
Carry Into THB(Right Scale)
The unwinding of the carry trade coincides with a decline in the relative performance of Thai equities; once again measuring from the immediate aftermath of QE2, the relative performance of Thailand to the U.S. and Japan (thin red lines, left- and right-hand charts, respectively) have been -14.73% and -18.45%.
The culprit, as is the case in India and Indonesia, is higher short-term interest rates employed to fight rising inflation. Three-month BIBOR has increased from 1.895% in November 2010 to 2.40%, and the Bank of Thailand’s repo rate has been pushed higher twice in the past two months, from 1.75% to 2.25%. Unlike Korea, Thailand’s markets are being judged incapable of withstanding higher short-term interest rates.
The obvious risk here is higher short-term rates in Thailand will lead to lower asset values and capital outflows. Should Thailand respond to preserve the THB by raising short-term rates further, they will run the risk of being overwhelmed today just as they were in 1997.
From A Recent Market Facts
Bianco Research, L.L.C For the week of February 9, 2011 10
Korean Markets Avoid Damage From Rising Short-Term RatesFrom A Recent Market Facts
Korean Stocks' Relative Performance Leading Won By Three Months
900
950
1000
1050
1100
1150
1200
1250
1300
1350
1400
1450
1500
1550
1600
Sep
-98
Feb-
99
Aug
-99
Feb-
00
Aug
-00
Jan-
01
Jul-0
1
Jan-
02
Jul-0
2
Jan-
03
Jul-0
3
Dec
-03
Jun-
04
Dec
-04
Jun-
05
Nov
-05
May
-06
Nov
-06
May
-07
Nov
-07
Apr
-08
Oct
-08
Apr
-09
Oct
-09
Apr
-10
Sep
-10
Mar
-11
KR
W P
er U
SD, I
nver
se S
cale
, Led
3 M
onth
s (T
hin
Red
Li
ne)
75%100%125%150%175%200%225%250%275%300%325%350%375%400%425%450%475%500%525%
Rel
ativ
e To
tal R
etur
n, K
orea
Vs.
U.S
., U
SD T
erm
sD
ec. 3
1, 1
998
= 10
0% (T
hick
Blu
e Li
ne)
Relative Return(Right Scale)
Won Per DollarLed 3 Months
(Left Scale)
Carry Trades Into Won In Widening Divergence
80
90
100
110
120
130
140
150
160
170
180
190
Mar
-99
Aug
-99
Feb-
00
Aug
-00
Feb-
01
Jul-0
1
Jan-
02
Jul-0
2
Jan-
03
Jul-0
3
Dec
-03
Jun-
04
Dec
-04
Jun-
05
Dec
-05
May
-06
Nov
-06
May
-07
Nov
-07
May
-08
Oct
-08
Apr
-09
Oct
-09
Apr
-10
Oct
-10
Mar
-11
JPY
Car
ry T
o K
RW
, Mar
ch 1
, 199
9 =
100
(Thi
n R
ed L
ine)
80
90
100
110
120
130
140
150
160
170
180
190
Exce
ss C
arry
Ret
urn
USD
: K
RW
Mar
ch 1
, 199
9 =
100
(Thi
ck B
lue
Line
)Yen Carry(Left Scale)
Dollar Carry(Right Scale)
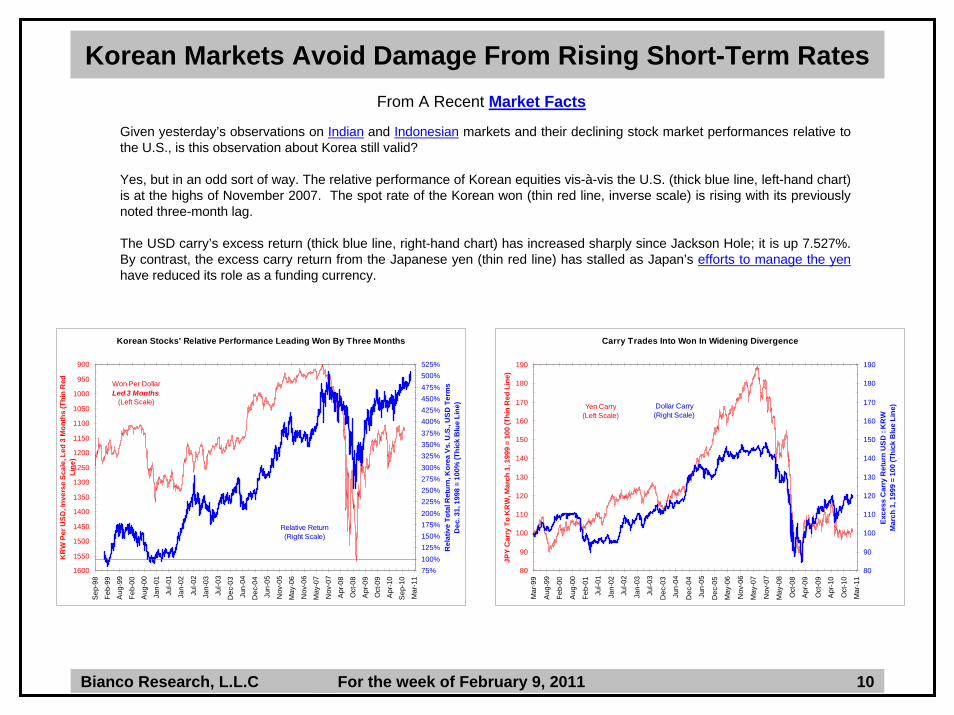
Given yesterday’s observations on Indian and Indonesian markets and their declining stock market performances relative to the U.S., is this observation about Korea still valid?
Yes, but in an odd sort of way. The relative performance of Korean equities vis-à-vis the U.S. (thick blue line, left-hand chart) is at the highs of November 2007. The spot rate of the Korean won (thin red line, inverse scale) is rising with its previously noted three-month lag.
The USD carry’s excess return (thick blue line, right-hand chart) has increased sharply since Jackson Hole; it is up 7.527%. By contrast, the excess carry return from the Japanese yen (thin red line) has stalled as Japan’s efforts to manage the yenhave reduced its role as a funding currency.

Bianco Research, L.L.C For the week of February 9, 2011 11
Carry Trades Into Indonesia SlowingFrom A Recent Market Facts
AUD Carry Into Rupiah In Downtrend Still
50%
75%
100%
125%
150%
175%
200%
225%
250%
275%
300%
325%
Mar
-99
Aug
-99
Feb-
00
Aug
-00
Feb-
01
Jul-0
1
Jan-
02
Jul-0
2
Jan-
03
Jul-0
3
Dec
-03
Jun-
04
Dec
-04
Jun-
05
Dec
-05
May
-06
Nov
-06
May
-07
Nov
-07
May
-08
Oct
-08
Apr
-09
Oct
-09
Apr
-10
Oct
-10
Rel
ativ
e P
erfo
rman
ce, I
ndon
esia
Vs.
Aus
tralia
Mar
ch 1
, 199
9 =
100%
(Thi
n R
ed L
ine)
90.0
97.5
105.0
112.5
120.0
127.5
135.0
142.5
150.0
157.5
165.0
AU
D :
IDR
Car
ry, M
arch
1, 1
999
= 10
0, In
vers
e S
cale
(Thi
ck B
lue
Line
)
Relative Performance(Left Scale)
AUD:IDR Carry(Right Scale)
Indonesian Relative Stock Performance Falling
50%100%150%200%250%300%350%400%450%500%550%600%650%700%750%800%850%900%950%
1000%1050%1100%
Mar
-99
Aug
-99
Feb-
00
Aug
-00
Feb-
01
Jul-0
1
Jan-
02
Jul-0
2
Jan-
03
Jul-0
3
Dec
-03
Jun-
04
Dec
-04
Jun-
05
Dec
-05
May
-06
Nov
-06
May
-07
Nov
-07
May
-08
Oct
-08
Apr
-09
Oct
-09
Apr
-10
Oct
-10
Rel
ativ
e Pe
rform
ance
, Ind
ones
ia V
s. U
.S.
Mar
ch 1
, 199
9 =
100%
(Thi
n R
ed L
ine)
90100110120130140150160170180190200210220230240250260270
US
D :
IDR
Car
ry, M
arch
1, 1
999
= 10
0 (T
hick
Blu
e Li
ne)
USD:IDR Carry(Right Scale)
Relative Performance(Left Scale)
Yes; not only did the relative performance of the Indonesian stock market to the U.S. (thin red line, left-hand chart) peak on the very same day, October 4, 2010, India’s did, but the excess carry return (thick blue line) pattern declined similarly as well. The period excess carry return from the USD into the IDR was 1.726% between Jackson Hole and October 4, 2010 and 0.927% afterwards.
Indonesia faces rising inflationary pressures; its core CPI has increased 4.28% and its “volatile food” CPI is rising at 17.74% year-over-year. We suppose public statements about the scourge of deflation would not play well in a Jakarta grocery store.
If we switch the basis of comparison from the U.S. to Australia, we see Australian equities have outperformed the Indonesian counterparts (thin red line, right-hand chart) since October 2010, too. The excess carry return from the AUD into the IDR (thick blue line, inverse scale) remains in a downtrend as the AUD remains a strong currency.

Bianco Research, L.L.C For the week of February 9, 2011 12
India Fights InflationFrom A Recent Market Facts
Second, and perhaps more important for global markets as 2001 unfolds, the relative performance of the Indian stock market has been declining since October 2010 (thick blue line, right-hand chart).
India’s moves to contain domestic inflation have depressed relative prospective returns on assets and have discouraged speculative capital inflows at a time when the short-term interest rate gap between the USD and INR has been widening. The Federal Reserve’s moves had been exporting inflation via the mechanism of asset markets; India’s defensive response now is penalizing those investors who fled thereto.
Relative stock market performance has led the rate gap at the ten-year horizon between Indian and U.S. government bonds (thin red line) by six months on average. We should, therefore, expect Indian government bonds to outperform Treasuries in the first half of 2011.
Long-Term Interest Rates And Relative Stock Performance
0.25%0.50%0.75%1.00%1.25%1.50%1.75%2.00%2.25%2.50%2.75%3.00%3.25%3.50%3.75%4.00%4.25%4.50%4.75%5.00%5.25%5.50%5.75%
May
-01
Oct
-01
Mar
-02
Aug
-02
Jan-
03
May
-03
Oct
-03
Mar
-04
Aug
-04
Jan-
05
Jun-
05
Oct
-05
Mar
-06
Aug
-06
Jan-
07
Jun-
07
Nov
-07
Mar
-08
Aug
-08
Jan-
09
Jun-
09
Nov
-09
Apr
-10
Aug
-10
Jan-
11
Ten-
Year
Not
e D
iffer
entia
l, In
dia
- U.S
., Le
d 6
Mon
ths
(Thi
n R
ed L
ine)
50%
100%
150%
200%
250%
300%
350%
400%
450%
500%
550%
600%
650%
Rel
ativ
e Pe
rfor
man
ce, I
ndia
To
U.S
., M
ay 2
4, 2
001
= 10
0%(T
hick
Blu
e Li
ne)
Relative Performance(Right Scale)
Interest Rate Differential, INR-USDLed 6 Months
(Left Scale)
Rupee Weakening As Interest Rate Expectations Stabilize
-0.65-0.60-0.55-0.50-0.45-0.40-0.35-0.30-0.25-0.20-0.15-0.10-0.050.000.050.100.150.200.250.300.350.400.450.500.550.600.650.70
Dec
-03
Feb-
04M
ay-0
4A
ug-0
4N
ov-0
4Fe
b-05
May
-05
Aug
-05
Nov
-05
Feb-
06M
ay-0
6Ju
l-06
Oct
-06
Jan-
07A
pr-0
7Ju
l-07
Oct
-07
Jan-
08A
pr-0
8Ju
l-08
Sep
-08
Dec
-08
Mar
-09
Jun-
09S
ep-0
9D
ec-0
9M
ar-1
0Ju
n-10
Sep
-10
Dec
-10
Mar
-11
FRR
6,9 D
iffer
entia
l Led
3 M
onth
s (R
ed C
olum
ns)
39.039.540.040.541.041.542.042.543.043.544.044.545.045.546.046.547.047.548.048.549.049.550.050.551.051.552.052.5
INR
Per
USD
Led
3 M
onth
s (T
hick
Blu
e Li
ne)
FRR6,9 Differential, USD-INR(Left Scale)
INR Per USDLed 3 Months(Right Scale)

Bianco Research, L.L.C For the week of February 9, 2011 13
Core Versus Headline Inflation
The chart on the right here shows 10-year inflation rates. So we are looking at long-term measures of inflation here. Instead of the year-over-year change, we just do it the 10-year annualized.
The red line is headline CPI while the blue line is core CPI. Now, you can see that core CPI is at the lowest level that it has ever been, and headline is fairly low. But the bottom chart measures the spread between the two. What you will notice is that, for the last 10 years or so, especially maybe even 15 years, there has been an uptrend in headline being larger than the core numbers.
This is because the food and energy components are not mean reverting anymore; they just don’t go up and go down, and go up and go down, and the Fed can get faked out and raise rates because food goes up or energy goes up, and then cut rates because they go down. They are in a solid uptrend and have been for many years. And they continue to be in that uptrend to the point where you are starting to see food rise.
10-Year Annualized InflationCPI vs Core CPI
1.00%
2.00%
3.00%
4.00%
5.00%
6.00%
7.00%
8.00%
9.00%
1.00%
2.00%
3.00%
4.00%
5.00%
6.00%
7.00%
8.00%
9.00%
Headline CPI
Core CPI
10-Year Annualized InflationHeadline CPI Minus Core CPI
12/31/20100.41%
3/31/1991, -0.70%
2/28/1981, 0.86%7/31/2008, 0.77%
-1.00%
-0.50%
0.00%
0.50%
1.00%
Jan-
67S
ep-6
8M
ay-7
0Ja
n-72
Sep
-73
May
-75
Jan-
77S
ep-7
8M
ay-8
0Ja
n-82
Sep
-83
May
-85
Jan-
87S
ep-8
8M
ay-9
0Ja
n-92
Sep
-93
May
-95
Jan-
97S
ep-9
8M
ay-0
0Ja
n-02
Sep
-03
May
-05
Jan-
07S
ep-0
8M
ay-1
0Ja
n-12
-1.00%
-0.50%
0.00%
0.50%
1.00%
From A Recent Special Report
.. From our most recent conference call(audio, webcast, handout, transcript)

Bianco Research, L.L.C For the week of February 9, 2011 14
The Fed/Bread SpreadFrom A Recent Market Facts
QE2 And Hard Red Winter Wheat Prices
-7.5%-7.0%-6.5%-6.0%-5.5%-5.0%-4.5%-4.0%-3.5%-3.0%-2.5%-2.0%-1.5%-1.0%-0.5%0.0%0.5%1.0%1.5%2.0%2.5%3.0%3.5%4.0%4.5%5.0%5.5%6.0%6.5%7.0%7.5%8.0%8.5%
30-J
un8-
Jul
15-J
ul22
-Jul
29-J
ul5-
Aug
12-A
ug19
-Aug
26-A
ug2-
Sep
10-S
ep17
-Sep
24-S
ep1-
Oct
8-O
ct15
-Oct
22-O
ct29
-Oct
5-N
ov12
-Nov
19-N
ov29
-Nov
6-D
ec13
-Dec
20-D
ec28
-Dec
4-Ja
n11
-Jan
19-J
an26
-Jan
2-Fe
b
Ret
urns
Pre
- & P
ost-J
acks
on H
ole
(Ros
eate
& D
ark
Red
Col
umns
)
500525550575600625650675700725750775800825850875900925950
Mar
ch 2
011
Har
d R
ed W
inte
r Whe
at (B
lue
Line
)
Daily Returns(Left Scale)
March 2011 HRW(Right Scale)
Monetary excess becomes an illusion in such instances. We can track March 2011 hard red winter wheat futures prices (blue line) and their returns from the start of the FSU drought in 2010 through Jackson Hole (roseate columns) and then compare them to returns after Jackson Hole (dark red columns).
The average daily return pre-Jackson Hole of 0.742% is more than three times as great as the average daily return post-Jackson Hole of 0.240%. Our confidence level in the higher pre-Jackson Hole mean is 85.8%, rather considerable given the small sample sizes involved.
Monetary excess provides the fuel for inflation. However, not even Ben Bernanke can cause the past; of that we are 100% confident. Therefore, we should not attribute events prior to QE2 to anyone’s stated desire to raise inflationary expectations.

Bianco Research, L.L.C For the week of February 9, 2011 15
Currency Carry And Higher-Risk BondsFrom A Recent Special Report
Currency Carry And Higher-Risk Bond Indices
-0.65
-0.55
-0.45
-0.35
-0.25
-0.15
-0.05
0.05
0.15
0.25
0.35
0.45
0.55
0.65
0.75
Mar
-99
Sep
-99
Mar
-00
Sep
-00
Mar
-01
Aug
-01
Feb-
02
Aug
-02
Feb-
03
Aug
-03
Jan-
04
Jul-0
4
Jan-
05
Jul-0
5
Jan-
06
Jun-
06
Dec
-06
Jun-
07
Dec
-07
Jun-
08
Nov
-08
May
-09
Nov
-09
May
-10
Nov
-10
Rol
ling
Thre
e-M
onth
Cor
rela
tion
of R
etur
ns
-0.65
-0.55
-0.45
-0.35
-0.25
-0.15
-0.05
0.05
0.15
0.25
0.35
0.45
0.55
0.65
0.75
Rol
ling
Thre
e-M
onth
Cor
rela
tion
of R
etur
ns
EMBI
US HY
Euro HY
The Carry Trades And Higher-Risk Bond Indices
125
150
175
200
225
250
275
300
325
Dec
-98
Aug
-99
Apr
-00
Dec
-00
Jul-0
1
Mar
-02
Nov
-02
Jul-0
3
Feb-
04
Oct
-04
Jun-
05
Jan-
06
Sep
-06
May
-07
Jan-
08
Aug
-08
Apr
-09
Dec
-09
Aug
-10
Mar
-11
DB
Cur
renc
y H
arve
st In
dex
(Bla
ck L
ine)
50%
75%
100%
125%
150%
175%
200%
225%
250%
275%
300%
Hig
her-R
isk
Bon
d In
dice
s, D
ec. 3
1, 1
998
= 10
0%
Euro HY
EMBI
US HY
DB Currency Futures Harvest Index(Left Scale)
Recent analyses of emerging markets and the carry trades from the U.S. and other funding sources and a Market Facts on currency carry trades’ impact on equity indices prompted a question whether emerging market bonds (green lines/bubbles, all charts) are affected similarly.
Let’s add both U.S. and European high-yield (blue and red lines/bubbles, respectively, all charts) to the mix against the Deutsche Bank Currency Futures Harvest index (black line, left-hand chart). All indices are measured in USD terms.
All three bond indices’ rolling three-month correlations of returns (right-hand chart) are retreating somewhat from high historic levels. The three previous peaks occurred in November 2007, November 2008 and August 2010. None of these correlation peaks signaled impending market declines; indeed, the November 2008 and August 2010 peaks preceded rallies in higher-risk bonds.

Bianco Research, L.L.C For the week of February 9, 2011 16
European Currencies And Cross-Rates: The Mess ContinuesFrom A Recent Special Report
Comparative Nominal Ten-Year Note Yields
1%
10%
Apr
-94
Nov
-94
Jun-
95
Dec
-95
Jul-9
6Fe
b-97
Sep
-97
Mar
-98
Oct
-98
May
-99
Dec
-99
Jun-
00Ja
n-01
Aug
-01
Mar
-02
Oct
-02
Apr
-03
Nov
-03
Jun-
04D
ec-0
4Ju
l-05
Feb-
06
Sep
-06
Apr
-07
Oct
-07
May
-08
Dec
-08
Jul-0
9Ja
n-10
Aug
-10
Mar
-11
1%
10%
Generic Yields ForU.S.U.K.
EurozoneSwiss
Ten-Year Notes
The intervening months have brought a resolution of sorts to Ireland’s sovereign credit situation, continued concerns over the sovereign credit situations of Portugal, Spain and Belgium, and the news the U.K.’s GDP contracted in 2010:Q4.
Key sovereign entities remain able to finance their debts at low cost; while nominal ten-year note yields have bounced higher since Jackson Hole, these still are secondary retracements of much longer secular downtrends.
As noted recently, though, we are at the limit of being able to solve or postpone problems by borrowing against the future and printing the currency as if no consequences are involved. Once short-term interest rates are forced off their lows by rising inflation, sovereigns will be unable to maintain their fiscal stimulus programs.

Bianco Research, L.L.C For the week of February 9, 2011 17
The Yuan And U.S. Inflation: How RV2 Led QE2From A Recent Commentary
Money Market Yield Curves Diverged After RV2
1.0000
1.0125
1.0250
1.0375
1.05001.0625
1.0750
1.0875
1.1000
1.1125
1.1250
1.1375
1.15001.1625
1.1750
1.1875
1.2000
1.2125
Oct
-06
Dec
-06
Feb-
07A
pr-0
7M
ay-0
7Ju
l-07
Sep
-07
Nov
-07
Jan-
08M
ar-0
8M
ay-0
8Ju
l-08
Sep
-08
Nov
-08
Jan-
09M
ar-0
9M
ay-0
9Ju
l-09
Sep
-09
Oct
-09
Dec
-09
Feb-
10A
pr-1
0Ju
n-10
Aug
-10
Oct
-10
Dec
-10
Feb-
11
CN
Y FR
R 6,9
(Thi
n R
ed L
ine)
0.800.850.900.951.001.051.101.151.201.251.301.351.401.451.501.551.601.651.701.751.80
USD
FR
R6,
9 (Th
ick
Blu
e Li
ne)
CNY FRR6,9
(Left Scale)
USD FRR6,9
(Right Scale)
Treasury Yields Continued Decline Between RV2 And QE2
1.00001.01251.02501.03751.05001.06251.07501.08751.10001.11251.12501.13751.15001.16251.17501.18751.20001.2125
Oct
-06
Dec
-06
Feb-
07A
pr-0
7M
ay-0
7Ju
l-07
Sep
-07
Nov
-07
Jan-
08M
ar-0
8M
ay-0
8Ju
l-08
Sep
-08
Nov
-08
Jan-
09M
ar-0
9M
ay-0
9Ju
l-09
Sep
-09
Oct
-09
Dec
-09
Feb-
10A
pr-1
0Ju
n-10
Aug
-10
Oct
-10
Dec
-10
Feb-
11
CN
Y FR
R 6,9
(Thi
ck R
ed L
ine)
-0.1%
0.4%
0.9%
1.4%
1.9%
2.4%
2.9%
3.4%
3.9%
4.4%
4.9%
5.4%
Sele
ct T
reas
ury
Yiel
ds
Three-Month Five-Year Two-Year Ten-Year
CNY FRR6,9
(Left Scale)
U.S. Response To RV2
RV2 lowered Chinese demand for U.S. Treasuries for currency management purposes. This mechanism was discussed fist in January 2010 and most recently in October 2010. This removal of demand created the incentive for what was to be QE2.
This decline in Chinese demand occurred after the end of QE1 (gray vertical line, left-hand chart). Treasury yields at the ten-, five-and two-year maturities (thick blue, hatched blue and purple lines, left-hand chart) decline immediately in a bullish flattening of the U.S. yield curve; this bullish flattening continued in the gap between RV2 and QE2 (green rectangle). Chinese money-market conditions as measured by the forward rate ratio between six and nine months (red line) tightened considerably. Once QE2 was initiated in November 2010, Treasury rates rose as U.S. liquidity infusions offset tighter credit conditions in China and contributed to the rise in U.S. inflation expectations.
A second view of RV2’s (green vertical line, right-hand chart) significance can be seen in the comparative maps of the CNY and USD FRR6,9 (red and blue lines, respectively). The American FRR6,9 began to steepen once the need for lower short-term interest rates in the U.S. became apparent; the Chinese FRR6,9 continued flattening through the end of January 2011.

Bianco Research, L.L.C For the week of February 9, 2011 18
Yuan’s Impact On CPI/PPI Sub-IndicesFrom A Recent Market Fact
Jan-01M
ay-01Sep-01
Jan-02M
ay-02Sep-02
Jan-03M
ay-03Sep-03
Jan-04M
ay-04Sep-04
Jan-05M
ay-05Sep-05
Jan-06M
ay-06Sep-06
Jan-07M
ay-07Sep-07
Jan-08M
ay-08Sep-08
Jan-09M
ay-09Sep-09
Jan-10M
ay-10Sep-10
Appa
rel
Recr
eatio
n
Hous
ing
Serv
ices
Educ
atio
n
Food
& B
ever
ages
Med
ical
Othe
r
82%84%85%87%88%90%91%93%94%96%97%99%100%102%103%105%106%108%109%111%112%114%115%117%118%120%121%123%
Sept
embe
r 200
5 =
100%
Distribution of CPI Sub-Indices
Jan-01M
ay-01Sep-01
Jan-02M
ay-02Sep-02
Jan-03M
ay-03Sep-03
Jan-04M
ay-04Sep-04
Jan-05M
ay-05Sep-05
Jan-06M
ay-06Sep-06
Jan-07M
ay-07Sep-07Jan-08
May-08
Sep-08Jan-09
May-09
Sep-09Jan-10M
ay-10Sep-10
Met
al Pr
oduc
ts
Appa
rel
Mac
hiner
y &
Equip
men
t
Leat
her
Furn
ishing
& H
ousin
g
Pulp
& Pa
per
Indu
stria
l Com
mod
ities
All C
omm
oditie
s
Com
mod
ities E
x-Fu
el
Rubb
er &
Plas
tics
Misc
ellan
eous
Proc
esse
d Fo
od
Chem
icals
Non-
met
allic
Min
eral
s
72%
75%
78%
81%
84%
87%
90%
93%
96%
99%
102%
105%
108%
111%
114%
117%
120%
123%
126%
129%
132%
135%
138%
141%
144%
Sept
embe
r 200
5 =
100%
Distribution of PPI Sub-Indices
If we index the PPI sub-indices to September 2005, two months after the yuan began to revalue the first time (left-hand chart), we find significant upward price pressure in only two sub-indices, those for non-metallic minerals and chemicals. The apparel sub-index remains lower than September 2005 levels; its progress will be interesting to watch given the strong move higher in cotton prices.
A similar map for CPI sub-indices (right-hand chart) also shows apparel prices to be relative laggards. The sub-indices with the largest advances have been medical and “other.”

Bianco Research, L.L.C For the week of February 9, 2011 19
Coupon Yield Curve Returns In A Flattening Yield CurveFrom A Recent Commentary
Returns During Flattenings
The average annual total returns on the Merrill Lynch Ten-Year+ Treasury/Agency index during each flattening period since 1988 (blue columns) and during the subsequent steepening of the curve (red columns) are presented below. The short-lived flattening of the yield curve between December 2009 and April 2010 led to a substantial -13.03% annualized loss; the following steepening through November led to a strong 27.12% annualized gain.
The present flattening since the execution of QE2 has produced a -31.24% annualized loss for this index; once again, the risk-averse have taken a beating while risk-seekers have prospered, and once again we marvel at how the Federal Reserve can undertake a program to buy $600 billion of Treasuries out of thin air only to watch their prices fall.
The annualized return on the Merrill Lynch 1-3 Year Treasury/Agency index has been -2.32%. This divergence in returns has opened the gap for a duration-neutral flattening trade.
Long Bonds During And After Yield Curve FlatteningsAverage Annual Total Return On Merrill Lynch Ten-Year + Treasury/Agency Index
-35%
-30%
-25%
-20%
-15%
-10%
-5%
0%
5%
10%
15%
20%
25%
30%
Mar 88 - Mar 89 Oct 92 - Dec 94 May 99 - Aug 00 Jun 03 - Nov 06 Dec 09 - Apr 10 Nov 10 - ?
Ave
rage
Ann
ual T
otal
Ret
urn
Return During Flattening
(Blue Columns)
Return DuringSubsequent Steepening
(Red Columns)

Bianco Research, L.L.C For the week of February 9, 2011 20
Mutual Fund FlowsFrom Our Recent Mutual Fund Flow Update
Monthly Net New Cash Flow into Government Bond Funds
-10.0-8.0-6.0-4.0-2.00.02.04.06.08.0
10.012.014.016.018.0
billio
ns o
f dol
lars
-10.0-8.0-6.0-4.0-2.00.02.04.06.08.010.012.014.016.018.0
billio
ns o
f dol
lars
Monthly Net New Cash Flow into Strategic Income Bond Funds
-20.0
-15.0
-10.0
-5.0
0.0
5.0
10.0
15.0
20.0
2/28
/199
7
10/3
1/19
97
6/30
/199
8
2/28
/199
9
10/3
1/19
99
6/30
/200
0
2/28
/200
1
10/3
1/20
01
6/30
/200
2
2/28
/200
3
10/3
1/20
03
6/30
/200
4
2/28
/200
5
10/3
1/20
05
6/30
/200
6
2/28
/200
7
10/3
1/20
07
6/30
/200
8
2/28
/200
9
10/3
1/20
09
6/30
/201
0
2/28
/201
1
billio
ns o
f dol
lars
-20.0
-15.0
-10.0
-5.0
0.0
5.0
10.0
15.0
20.0
billio
ns o
f dol
lars
Monthly Net New Cash Flow into Total Municipal Bond Funds
-14.0-12.0-10.0-8.0-6.0-4.0-2.00.02.04.06.08.0
10.012.0
billio
ns o
f dol
lars
-14.0-12.0-10.0-8.0-6.0-4.0-2.00.02.04.06.08.010.012.0
billio
ns o
f dol
lars
12 Month Rolling Sum of Net New Cash Flow into Total Funds
-300-200-100
0100200300400500600
billio
ns o
f dol
lars
-300-200-1000100200300400500600
billio
ns o
f dol
lars
12 Month Rolling Sum of Net New Cash Flow into Stock Funds
-300-200-100
0100200300400
billio
ns o
f dol
lars
-300-200-1000100200300400
billio
ns o
f dol
lars
12 Month Rolling Sum of Net New Cash Flow into Bond Funds
-100
0
100
200
300
400
500
billio
ns o
f dol
lars
-100
0
100
200
300
400
500
billio
ns o
f dol
lars
12 Month Rolling Sum of Net New Cash Flow into Hybrid Funds
-50
-25
0
25
50
75
Dec
-84
Dec
-85
Dec
-86
Dec
-87
Dec
-88
Dec
-89
Dec
-90
Dec
-91
Dec
-92
Dec
-93
Dec
-94
Dec
-95
Dec
-96
Dec
-97
Dec
-98
Dec
-99
Dec
-00
Dec
-01
Dec
-02
Dec
-03
Dec
-04
Dec
-05
Dec
-06
Dec
-07
Dec
-08
Dec
-09
Dec
-10
billio
ns o
f dol
lars
-50
-25
0
25
50
75
billio
ns o
f dol
lars

Bianco Research, L.L.C For the week of February 9, 2011 21
Stock Market Capitalization As A % of Nominal GDPFrom A Recent Commentary
Stock Market Capitalization As A Percentage Of Nominal GDP
Feb-09, 61.62%
0%
20%
40%
60%
80%
100%
120%
140%
160%
180%
200%19
25
1929
1933
1937
1941
1945
1949
1953
1957
1961
1965
1969
1973
1977
1981
1985
1989
1993
1997
2001
2005
2009
2013
0%
20%
40%
60%
80%
100%
120%
140%
160%
180%
200%
Dec-7278.1%
Nov-6877.8%
Aug-29 81.4%
Apr-4216.0%
Sep-7433.7%
Jul-8233.5%
Last (December 2010) 103.77%Stock Market Capitalization = $15.43 TrillionNominal GDP = $14.87 Trillion
Average = 59.24%
Mar-00183.0%

Bianco Research, L.L.C For the week of February 9, 2011 22
Cotton Futures: Swap Dealers Shedding Long PositionsFrom Our Latest
Commitment Of Traders Update
Net Managed Money
-40-20
020406080
Net
Pos
ition
s (in
00
0's)
-40-20020406080
Net
Pos
ition
s (in
00
0's)
Net Producer/Merchant
-250
-200
-150
-100
-50
0
Net
Pos
ition
s (in
000
's)
-250
-200
-150
-100
-50
0
Net
Pos
ition
s (in
000
's)
Weekly Cotton Futures
406080
100120140160180
Wee
kly
Ran
ge
406080100120140160180
Wee
kly
Ran
ge
Net Small Traders
-10
0
10
20
30
6/13
/200
6
9/5/
2006
11/2
8/20
06
2/20
/200
7
5/15
/200
7
8/7/
2007
10/3
0/20
07
1/22
/200
8
4/15
/200
8
7/8/
2008
9/30
/200
8
12/2
3/20
08
3/17
/200
9
6/9/
2009
9/1/
2009
11/2
4/20
09
2/16
/201
0
5/11
/201
0
8/3/
2010
10/2
6/20
10
1/18
/201
1
Net
Pos
ition
s (in
000
's)
-10
0
10
20
30
Net
Pos
ition
s (in
000
's)
Net Swap Dealers
102030405060708090
100110120
Net
Pos
ition
s (in
000
's)
102030405060708090100110120
Net
Pos
ition
s (in
000
's)
Net Other Reportables
-30
-20
-10
0
10
20
30
Net
Pos
ition
s (in
000
's)
-30
-20
-10
0
10
20
30
Net
Pos
ition
s (in
000
's)
Friday's Commitments of Traders data for cotton futures showed Managed Money was net long 29,617 contracts on February 1.
Swap dealers have been continuously long in this market during its rally, but they have been liquidating their positions, apparently taken opposite the Other Reportables.

Bianco Research, L.L.C For the week of February 9, 2011 23
LT Look: Case-Shiller Nominal Home Price Index Back to 1890From Our Collection of Long-Term Charts
Case- Shiller Nominal Home Price Index
19256.34
19334.41
2006188.66
1
10
100
100018
90
1896
1902
1908
1914
1920
1926
1932
1938
1944
1950
1956
1962
1968
1974
1980
1986
1992
1998
2004
2008
2009
2011
Nom
inal
Hom
e Pr
ice In
dex
1.0
10.0
100.0
1000.0
Nom
inal
Hom
e Pr
ice
Inde
x
30% Decline - Second Largest Ever
31.72% Decline - Largest Ever

Copyright © 2011 Bianco Research, L.L.C.This message is intended only for the personal and confidential use of the designated recipients named above. If you are not the intended recipient of this message you are hereby notified that any review, dissemination, distribution or copying of this message is strictly prohibited. This communication is for information purposes only and should not be regarded as an offer to sell or as a solicitation of an offer to buy any financial product, an official confirmation of any transaction, or as an official statement of Bianco Research LLC. Email transmission cannot be guaranteed to be secure or error-free. Therefore, we do not represent that this information is complete or accurate and it should not be relied upon as such. All information is subject to change without notice.
Bianco Research L.L.C.Clybourn Galleria1731 N. Marcey StreetSuite 510Chicago IL 60614
Phone: (847) 304-1511 Fax: (847) 304-1749e-mail: [email protected]://www.biancoresearch.com
For more information about the contents/ opinions contained in these reports:
President (847) 756-3599James A. Bianco [email protected]
Strategist/Analysts (847) 304-1511Howard L. Simons [email protected]
Greg Blaha [email protected] Malo [email protected]
For subscription/service Information:Arbor Research & Trading, Inc.Director of Sales & Marketing (800) 606-1872Fritz Handler [email protected]
Arbor Research & Trading, Inc.1000 Hart Road, Suite 260Barrington IL 60010
Phone: (847) 304-1560 Fax: (847) 304-1595e-mail: [email protected]://www.arborresearch.com
Domestic - For more information about Arbor Research & Trading and its services:
New York Sales OfficeThe Chrysler Building405 Lexington AveNew York, NY 10174Edward T. McElwreath [email protected] (212) 867-5326 Fax (212) 370-1218
International - For more information about Arbor Research & Trading and its services:London Sales OfficeMarlow House1A Lloyds AvenueLondonEC3N 3ALPhone 44-207-100-1051 Neil Tritton [email protected]
Ben Gibson [email protected] Sales OfficeJames L. Perry [email protected] (847) 304-1560 Fax (847) 304-1595Geneva Sales OfficeRich Kleinbauer [email protected] (41) 22 365-1850Far East SalesRobert Reynolds [email protected] (847) 756-3680 Fax (435) 647-3073