Embed Size (px)
Citation preview
Charts Related to Charts Related to Labor Market Labor Market DevelopmentsDevelopments
Robert J. Gordon, Northwestern Robert J. Gordon, Northwestern and NBERand NBER
CBO Advisers MeetingCBO Advisers MeetingNovember 13, 2009November 13, 2009
Recent Performance of UI Recent Performance of UI New Claims as an New Claims as an
IndicatorIndicator Back in March, discovery of a tight Back in March, discovery of a tight
lag between the cyclical peak in lag between the cyclical peak in new claims and the NBER troughnew claims and the NBER trough– Four of last five recessions, lag had Four of last five recessions, lag had
been 4-6 weeks (1991 -3 weeks)been 4-6 weeks (1991 -3 weeks)– This time turned out to be 10 weeks, This time turned out to be 10 weeks,
not a big miss for this leading indicatornot a big miss for this leading indicator How bad will the jobless recovery How bad will the jobless recovery
be, according to this indicator?be, according to this indicator?
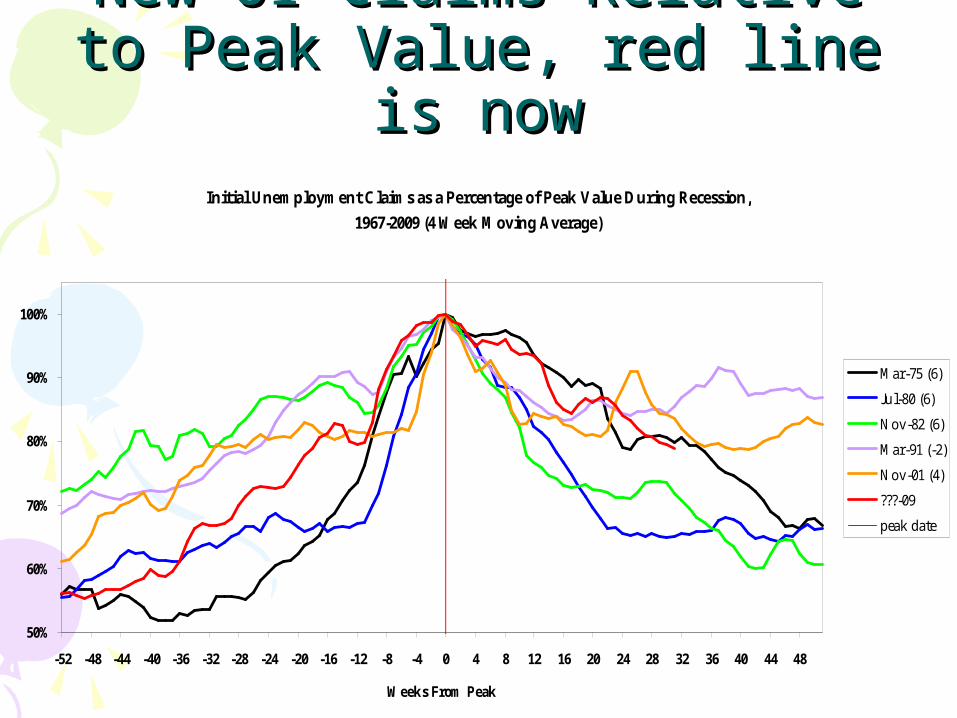
New UI Claims Relative to New UI Claims Relative to Peak Value, red line is nowPeak Value, red line is now
Initial Unemployment Claims as a Percentage of Peak Value During Recession,
1967-2009 (4 Week Moving Average)
50%
60%
70%
80%
90%
100%
-52 -48 -44 -40 -36 -32 -28 -24 -20 -16 -12 -8 -4 0 4 8 12 16 20 24 28 32 36 40 44 48
Weeks From Peak
Mar-75 (6)
Jul-80 (6)
Nov-82 (6)
Mar-91 (-2)
Nov-01 (4)
???-09
peak date
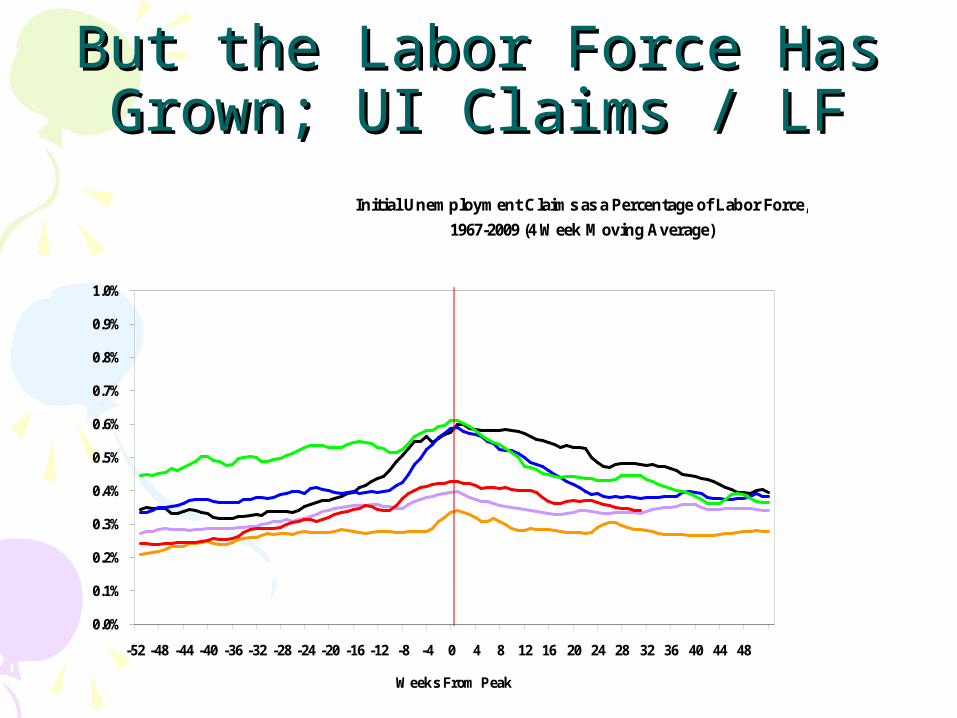
But the Labor Force Has But the Labor Force Has Grown; UI Claims / LFGrown; UI Claims / LF
Initial Unemployment Claims as a Percentage of Labor Force,
1967-2009 (4 Week Moving Average)
0.0%
0.1%
0.2%
0.3%
0.4%
0.5%
0.6%
0.7%
0.8%
0.9%
1.0%
-52 -48 -44 -40 -36 -32 -28 -24 -20 -16 -12 -8 -4 0 4 8 12 16 20 24 28 32 36 40 44 48
Weeks From Peak
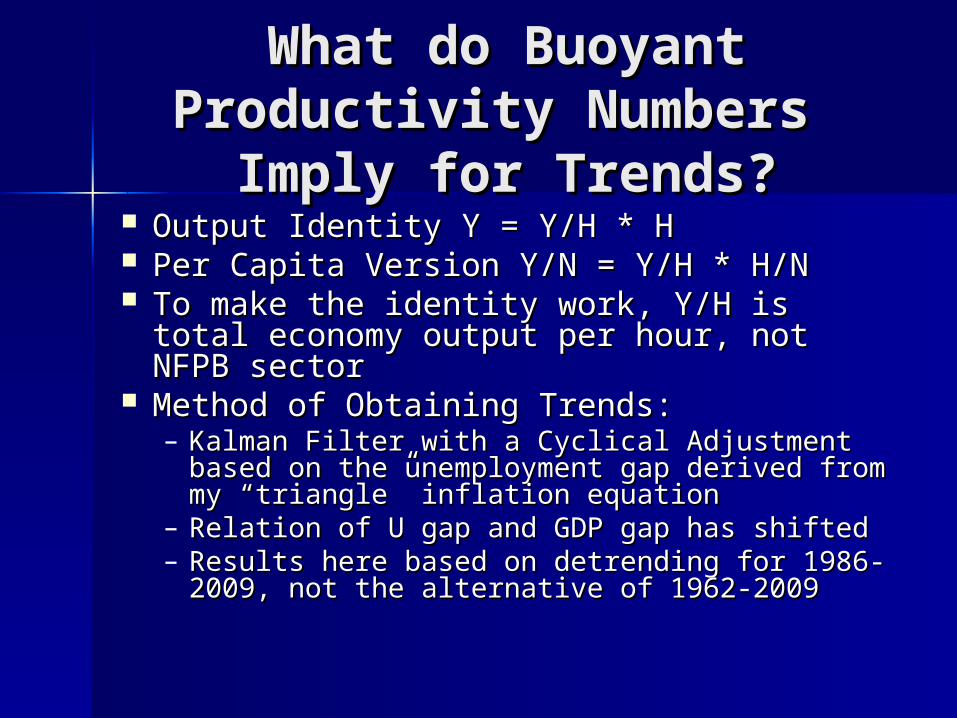
What do Buoyant What do Buoyant Productivity Numbers Productivity Numbers
Imply for Trends?Imply for Trends? Output Identity Y = Y/H * HOutput Identity Y = Y/H * H Per Capita Version Y/N = Y/H * H/NPer Capita Version Y/N = Y/H * H/N To make the identity work, Y/H is total To make the identity work, Y/H is total
economy output per hour, not NFPB economy output per hour, not NFPB sectorsector
Method of Obtaining Trends:Method of Obtaining Trends:– Kalman Filter with a Cyclical Adjustment Kalman Filter with a Cyclical Adjustment
based on the unemployment gap derived based on the unemployment gap derived from my “triangle” inflation equationfrom my “triangle” inflation equation
– Relation of U gap and GDP gap has shiftedRelation of U gap and GDP gap has shifted– Results here based on detrending for 1986-Results here based on detrending for 1986-
2009, not the alternative of 1962-20092009, not the alternative of 1962-2009
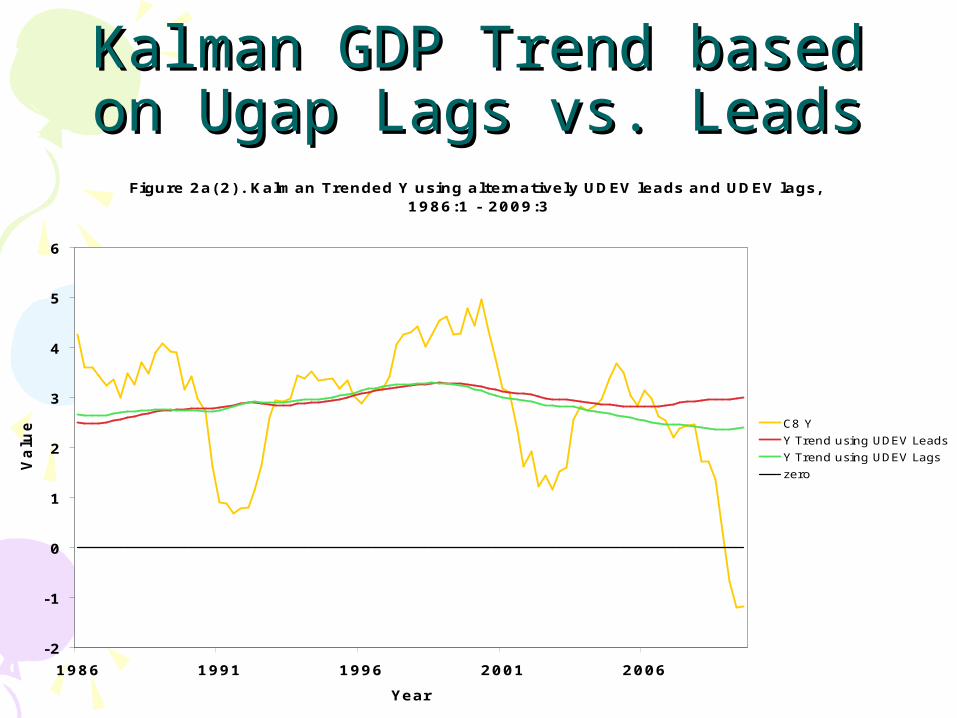
Kalman GDP Trend based on Kalman GDP Trend based on Ugap Lags vs. LeadsUgap Lags vs. Leads
Figure 2a(2). Kalman Trended Y using alternatively UDEV leads and UDEV lags, 1986:1 - 2009:3
-2
-1
0
1
2
3
4
5
6
1986 1991 1996 2001 2006
Year
Valu
e C8 Y
Y Trend using UDEV Leads
Y Trend using UDEV Lags
zero
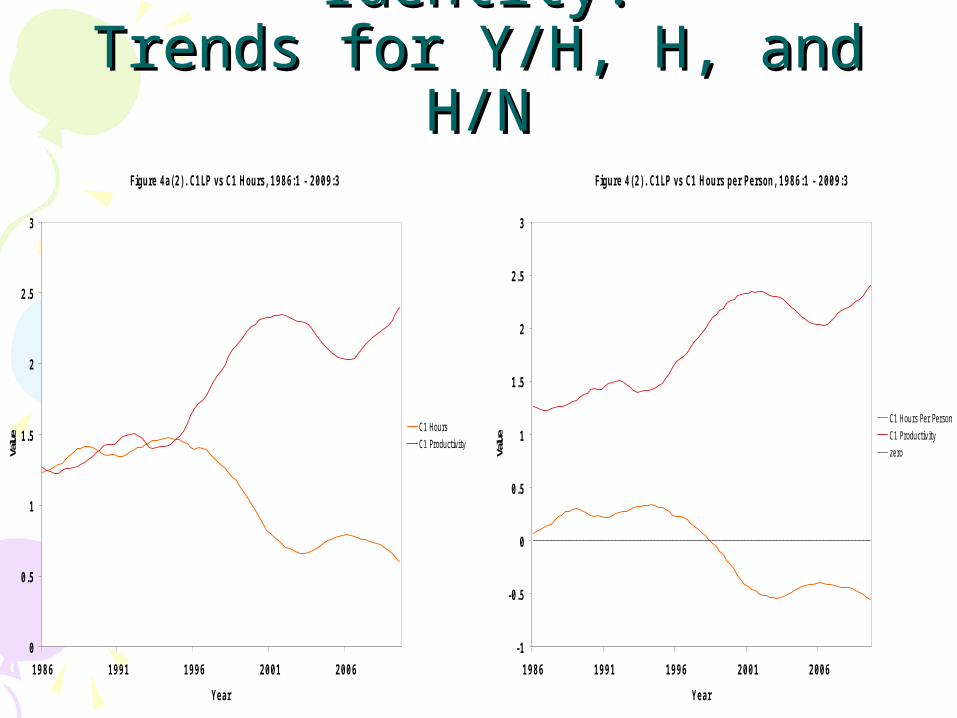
Right Side of the Identity:Right Side of the Identity:Trends for Y/H, H, and H/NTrends for Y/H, H, and H/N
Figure 4a(2). C1LP vs C1 Hours, 1986:1 - 2009:3
0
0.5
1
1.5
2
2.5
3
1986 1991 1996 2001 2006
Year
Value
C1 Hours
C1 Productivity
Figure 4(2). C1LP vs C1 Hours per Person, 1986:1 - 2009:3
-1
-0.5
0
0.5
1
1.5
2
2.5
3
1986 1991 1996 2001 2006
Year
Value
C1 Hours Per Person
C1 Productivity
zero
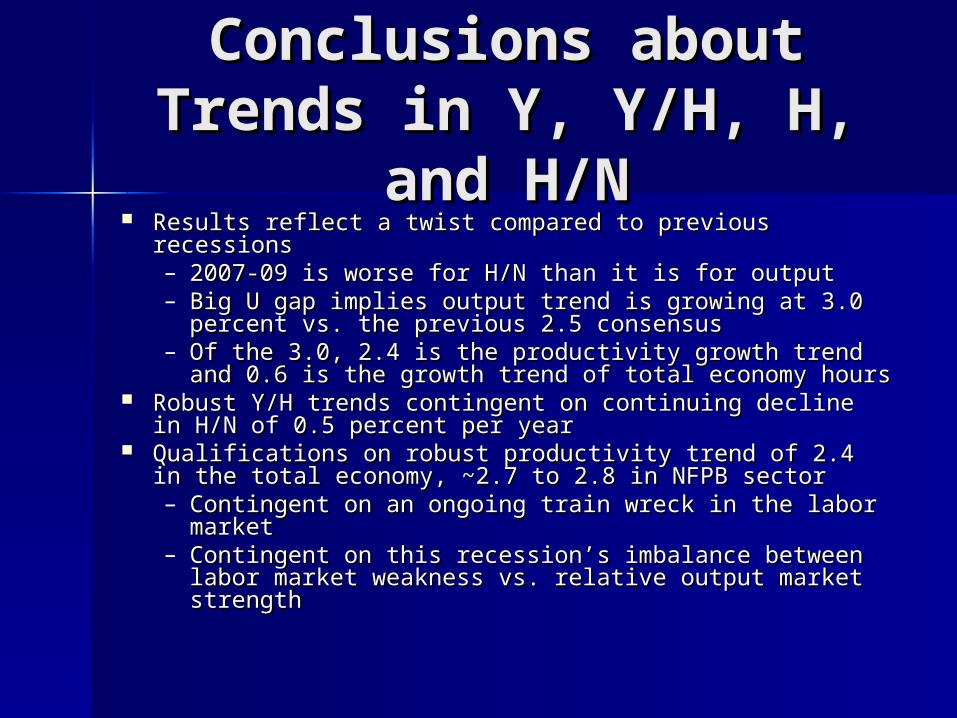
Conclusions about Conclusions about Trends in Y, Y/H, H, Trends in Y, Y/H, H,
and H/Nand H/N Results reflect a twist compared to previous recessionsResults reflect a twist compared to previous recessions
– 2007-09 is worse for H/N than it is for output2007-09 is worse for H/N than it is for output– Big U gap implies output trend is growing at 3.0 Big U gap implies output trend is growing at 3.0
percent vs. the previous 2.5 consensuspercent vs. the previous 2.5 consensus– Of the 3.0, 2.4 is the productivity growth trend and Of the 3.0, 2.4 is the productivity growth trend and
0.6 is the growth trend of total economy hours0.6 is the growth trend of total economy hours Robust Y/H trends contingent on continuing decline in Robust Y/H trends contingent on continuing decline in
H/N of 0.5 percent per yearH/N of 0.5 percent per year Qualifications on robust productivity trend of 2.4 in the Qualifications on robust productivity trend of 2.4 in the
total economy, ~2.7 to 2.8 in NFPB sectortotal economy, ~2.7 to 2.8 in NFPB sector– Contingent on an ongoing train wreck in the labor Contingent on an ongoing train wreck in the labor
marketmarket– Contingent on this recession’s imbalance between Contingent on this recession’s imbalance between
labor market weakness vs. relative output market labor market weakness vs. relative output market strengthstrength