Embed Size (px)
Citation preview
AN ANALYSIS OF THE EFFECTIVENESS/IMPACT OF ICTs IN DAIRY
PRODUCTION- A CASE OF ZIMBABWE’S MASHONALAND
EAST‘sBEATRICE-MARIRANWE DAIRY FARMERS
BY
MILLION CHAUKE
REGISTRATION NUMBER R901951H
A DISSERTATION SUBMITTED IN PARTIAL FULFILLMENT OF THE
REQUIREMENTS FOR THE DEGREE OF MASTER OF BUSINESS
ADMINISTRATION
GRADUATE SCHOOL OF MANAGEMENT
UNIVERSITY OF ZIMBABWE
Supervisor: Dr. G. T Hapanyengwi
FEBRUARY 2015

i
DECLARATION
I, Million Chauke, do hereby declare that this dissertation is the result of my own inves-
tigation and research, except to the extent indicated in the acknowledgements, refer-
ences and by comments included in the body of the report, and that it has not been
submitted in part or in full for any other degree to any other university.
Student’s signature ______________________________ Date_______________
Supervisor’s name ___________________________________________________
Supervisor’s Signature ____________________________ Date: ______________

ii
DEDICATION
This work is dedicated to my beautiful and loving wife Florence, and our two sons
Tsembani and Amukelani. Should the Almighty bless us with more children, I also dedi-
cate it to them apriori.

iii
ACKNOWLEDGEMENTS �
To the Almighty, for hisson our Saviour Jesus Christ, his Grace and Presence, Hallowed
be thy name.
To my supervisor Dr. G.T.Hapanyengwi, who went out of his way to make this piece of
work a success, thanks a million times, may the good Lord continue to bless you.
I would also like to express my indebtedness to my family, who continued to walk with-
out me for extended periods and all Graduate School lecturers, without whom this study
would by non-existent.
I would like to sincerely acknowledge the dairy farmers in the Beatrice-Marirangwe area
whom I interacted with during the data collection exercise, who left their busy farming
schedules to attend to my academic pursuit.

iv
ABSTRACT �
This study analyses the effectiveness/Impact of ICTs in dairy production. This is a case
study of Zimbabwe’s Mashonaland East BEATRICE-MARIRANWE Dairy farmers. By
nature, dairy production is a complex business that involves handling of massive data
and information. This makes dairy production a good candidate for use of ICTs to im-
prove sector competitiveness. It is against this background that the study sought to in-
vestigate the extent of use of ICTs in dairy production in Zimbabwe.
Information from the farmers was gathered through questionnaires and personal inter-
views. The analysis of the study was both qualitative and quantitative.
The study found out that there is low uptake of ICTs in the dairy sector. The recommen-
dation focused on improving uptake of ICTs, networking and thus improving competi-
tiveness of the dairy sector. Paramount to the recommendations was the designing of
the national dairy ICTs architecture. The architecture emphasises on maximising condi-
tions for local innovation and creative public-private partnerships to expand ICT access
and services.

v
TABLE OF CONTENTS
�
DECLARATION�����������������������������������������������������������������������������������������������������������������������������������������
DEDICATION���������������������������������������������������������������������������������������������������������������������������������������������
ACKNOWLEDGEMENTS�������������������������������������������������������������������������������������������������������������������������
ABSTRACT�����������������������������������������������������������������������������������������������������������������������������������������������
TABLE OF CONTENTS���������������������������������������������������������������������������������������������������������������������������
LIST OF FIGURES�����������������������������������������������������������������������������������������������������������������������������������
LIST OF TABLES�������������������������������������������������������������������������������������������������������������������������������������
LIST OF ABBREVIATIONS���������������������������������������������������������������������������������������������������������������������
CHAPTER ONE����������������������������������������������������������������������������������������������������������������������������������������
INTRODUCTION AND BACKGROUND���������������������������������������������������������������������������������������������
INTRODUCTION����������������������������������������������������������������������������������������������������������������������������������
1.1� BACKGROUND INFORMATION���������������������������������������������������������������������������������������������
1.2. THE BEATRICE-MARIRANGWE DAIRY FARMING AREA������������������������������������������������������
1.3 ENVIRONMENTAL/PESTEL ANALYSIS�������������������������������������������������������������������������������������
1.3.1 Political�������������������������������������������������������������������������������������������������������������������������������������
1.3.2 Economic����������������������������������������������������������������������������������������������������������������������������������
1.3.3 Technological���������������������������������������������������������������������������������������������������������������������������
1.3.4 Legislative��������������������������������������������������������������������������������������������������������������������������������
1.3.5 Social����������������������������������������������������������������������������������������������������������������������������������������
1.3.6 Environmental�������������������������������������������������������������������������������������������������������������������������
1.4 SWOT ANALYSIS OF THE DAIRY INDUSTRY�������������������������������������������������������������������������
1.4.1 Strengths���������������������������������������������������������������������������������������������������������������������������������
1.4.2 Weaknesses���������������������������������������������������������������������������������������������������������������������������
1.4.3 Opportunities���������������������������������������������������������������������������������������������������������������������������
1.4.4 Threats������������������������������������������������������������������������������������������������������������������������������������
1.5 PROBLEM STATEMENT�������������������������������������������������������������������������������������������������������������
1.6 RESEARCH OBJECTIVES������������������������������������������������������������������������������������������������������
1.7 RESEARCH QUESTIONS�����������������������������������������������������������������������������������������������������������

vi
1.8 RESEARCH HYPOTHESIS���������������������������������������������������������������������������������������������������������
1.9 SCOPE OF RESEARCH��������������������������������������������������������������������������������������������������������������
1.10 JUSTIFICATION OF RESEARCH���������������������������������������������������������������������������������������������
1.11 DISSERTATION OUTLINE��������������������������������������������������������������������������������������������������������
1.12 CHAPTER SUMMARY������������������������������������������������������������������������������������������������������������� �
CHAPTER TWO��������������������������������������������������������������������������������������������������������������������������������������
2.0 LITERATURE REVIEW����������������������������������������������������������������������������������������������������������������
2.1 INTRODUCTION���������������������������������������������������������������������������������������������������������������������������
2.2 DEFINITION OF ICT���������������������������������������������������������������������������������������������������������������������
2.3 DEFINITION OF TECHNOLOGY������������������������������������������������������������������������������������������������
2.4 ROLE OF ICTS IN AGRICULTURE��������������������������������������������������������������������������������������������
2.5 ROLE OF ICT IN THE DAIRY SECTOR������������������������������������������������������������������������������������
2.5.1. ICT and Firm Performance���������������������������������������������������������������������������������������������������
2.6 FACTORS AFFECTING THE ADOPTION OF ICTS���������������������������������������������������������������� �
2.6.1 Connectivity����������������������������������������������������������������������������������������������������������������������������
2.6.2 Community������������������������������������������������������������������������������������������������������������������������������
2.6.3 Content������������������������������������������������������������������������������������������������������������������������������������
2.6.4 Commerce�������������������������������������������������������������������������������������������������������������������������������
2.6.5 capacity�����������������������������������������������������������������������������������������������������������������������������������
2.6.6 Culture�������������������������������������������������������������������������������������������������������������������������������������
2.6.7 Cooperation����������������������������������������������������������������������������������������������������������������������������
2.6.8 Context������������������������������������������������������������������������������������������������������������������������������������
2.7 CASE STUDIES���������������������������������������������������������������������������������������������������������������������������
2.8 CHAPTER CONCLUSION����������������������������������������������������������������������������������������������������������
3.0 RESEARCH METHODOLODY������������������������������������������������������������������������������������������������� ��
3.1 INTRODUCTION������������������������������������������������������������������������������������������������������������������������ ��
3.2 RESEARCH DESIGN���������������������������������������������������������������������������������������������������������������� ��
3.3 RESEARCH PHILOSOPHY������������������������������������������������������������������������������������������������������ ��
3.4 RESEARCH STRATEGIES������������������������������������������������������������������������������������������������������� �
3.4.1. Case Study������������������������������������������������������������������������������������������������������������������������� �
3.5 POPULATION����������������������������������������������������������������������������������������������������������������������������� ��
3.6 SAMPLING���������������������������������������������������������������������������������������������������������������������������������� ��

vii
3.6.1 Non-probability (Random) Sampling���������������������������������������������������������������������������������� ��
3.6.1.1 Convenience Sampling���������������������������������������������������������������������������������������������������� ��
3.6.1.2 Judgment Sampling��������������������������������������������������������������������������������������������������������� ��
3.6.1.3 Snowball Sampling����������������������������������������������������������������������������������������������������������� ��
3.6.1.4 Quota Sampling���������������������������������������������������������������������������������������������������������������� ��
3.6.2 Probability (Random) Sampling����������������������������������������������������������������������������������������� �
3.6.2.1 Simple Random Sampling����������������������������������������������������������������������������������������������� �
3.6.2.2 Systematic Sampling������������������������������������������������������������������������������������������������������� �
3.6.2.3 Stratified Sampling����������������������������������������������������������������������������������������������������������� �
3.6.2.4 Cluster Sampling�����������������������������������������������������������������������������������������������������������������
3.6.2.5 Multi-stage Sampling����������������������������������������������������������������������������������������������������������
3.7 SAMPLE SELECTION������������������������������������������������������������������������������������������������������������������
3.8 DATA COLLECTION���������������������������������������������������������������������������������������������������������������������
3.8.1 Questionnaire������������������������������������������������������������������������������������������������������������������������ �
3.8.2 Personal Interviews����������������������������������������������������������������������������������������������������������������
3.8.1.1 Structured Interviews����������������������������������������������������������������������������������������������������������
3.8.1.2 Semi-Structured Interviews and Unstructured Interviews������������������������������������������������
3.8.1.4 Advantages of using Interviews�����������������������������������������������������������������������������������������
3.9 RELIABILITY AND VALIDITY������������������������������������������������������������������������������������������������������
3.9.1 Reliability���������������������������������������������������������������������������������������������������������������������������������
3.9.2 Validity�������������������������������������������������������������������������������������������������������������������������������������
3.9.3 Content validity�����������������������������������������������������������������������������������������������������������������������
3.9.4 Construct Validity��������������������������������������������������������������������������������������������������������������������
3.10 PRACTICAL AND RESEARCH ETHICS����������������������������������������������������������������������������������
3.11 DATA PROCESSING, ANALYSIS AND PRESENTATION����������������������������������������������������
3.12 LIMITATIONS OF THE STUDY������������������������������������������������������������������������������������������������
3.13 CHAPTER CONCLUSION��������������������������������������������������������������������������������������������������������
CHAPTER FOUR������������������������������������������������������������������������������������������������������������������������������������
4.0 RESEARCH FINDINGS AND DISCUSSIONS���������������������������������������������������������������������������
4.1 INTRODUCTION���������������������������������������������������������������������������������������������������������������������������
4.2 RESPONSE RATE������������������������������������������������������������������������������������������������������������������������
4.3 GENERAL INFORMATION����������������������������������������������������������������������������������������������������������

viii
4.3.1 Age Groups of Survey Participants���������������������������������������������������������������������������������������
4.3.2 Level of Education������������������������������������������������������������������������������������������������������������������
4.3.3 Training in Agriculture���������������������������������������������������������������������������������������������������������� �
4.3.4 Classification of Dairy Farming Business�����������������������������������������������������������������������������
4.4 FARM PRODUCTION STATISTICS��������������������������������������������������������������������������������������������
4.4.1 Breed of Cows and Breeding Herd Size�������������������������������������������������������������������������������
4.4.2 Average Milk Yield�����������������������������������������������������������������������������������������������������������������
4.4.3 Milk Markets����������������������������������������������������������������������������������������������������������������������������
4.5 COMPUTER AND TECHNOLOGY���������������������������������������������������������������������������������������������
4.5.1 Utilisation of ICT Hardware on Farms����������������������������������������������������������������������������������
4.5.2 Operation of a Computer and Articulation of ICTs������������������������������������������������������������� �
4.5.3 Connectivity����������������������������������������������������������������������������������������������������������������������������
4.5.4 Farm use of Websites������������������������������������������������������������������������������������������������������������
4.5.5 Use of Dairy Production Software�����������������������������������������������������������������������������������������
4.5.6 Use of ICTs in Conducting Dairy Farm Business����������������������������������������������������������������
4.5.7 On-farm Internet Marketing��������������������������������������������������������������������������������������������������
4.5.8 Internet Business Transactions��������������������������������������������������������������������������������������������
4.5.9 Benefits of using ICTs������������������������������������������������������������������������������������������������������������
4.5.10 Inhibitions on Using ICT in Dairy Business������������������������������������������������������������������������
4.5.11 Barriers in the Adoption and Use of ICTs by Farmers������������������������������������������������������
4.5.12 Impact of ICT on Dairy Business�������������������������������������������������������������������������������������� �
4.6 CHAPTER SUMMARY�����������������������������������������������������������������������������������������������������������������
CHAPTER FIVE���������������������������������������������������������������������������������������������������������������������������������������
5.0 CONCLUSIONS AND RECOMMENDATIONS��������������������������������������������������������������������������
5.1 INTRODUCTION���������������������������������������������������������������������������������������������������������������������������
5.2 CONCLUSIONS����������������������������������������������������������������������������������������������������������������������������
5.2.1 Research Objectives��������������������������������������������������������������������������������������������������������������
5.2.2 Education and Training����������������������������������������������������������������������������������������������������������
5.2.3 Classification of Dairy Farming Business�����������������������������������������������������������������������������
5.24 Farm Production Statistics������������������������������������������������������������������������������������������������������
5.2.5 Dairy Market����������������������������������������������������������������������������������������������������������������������������
5.2.6 Communication and Technology�������������������������������������������������������������������������������������������

ix
5.3 RESEARCH HYPOTHESIS��������������������������������������������������������������������������������������������������������
5.4 RECOMMENDATIONS����������������������������������������������������������������������������������������������������������������
5.4.2 The Government Ministries��������������������������������������������������������������������������������������������������
5.4.3 The Information Centre���������������������������������������������������������������������������������������������������������
5.4.5 Continuous Training and Development�������������������������������������������������������������������������������
5.4.6 The National ICT Architecture����������������������������������������������������������������������������������������������
5.4.6 Who Will Benefit From This Study?�������������������������������������������������������������������������������������
5.5 AREA OF FURTHER STUDY�����������������������������������������������������������������������������������������������������
REFERENCES������������������������������������������������������������������������������������������������������������������������������������� �
APPENDICES�����������������������������������������������������������������������������������������������������������������������������������������

x
LIST OF FIGURES
Figure Pages
Figure 1.1: The relative position of the dairy sector in the Agricultural industry 4
Figure 4.1: Age groups of survey participants 51
Figure 4.2: Level of education 52
Figure 4.3: Formal training in Agriculture 53
Figure 4.4: Classification of dairy farming business 55
Figure 4.5: Breeding herd size 57
Figure 4.6: Average milk yield per cow per day 59
Figure 4.7: Where farmers sell their milk 60
Figure 4.8: Operation of a computer 63
Figure 4.9: Web presence 65
Figure 4.10: Use of dairy production software 66
Figure 4.11: Use of ICTs in conducting dairy farm business 67
Figure 4.12: Sales via the internet 68

xi
LIST OF TABLES
Table 4.1: ICT hardware usage on the farms 61
Table 4.2: Connection to the internet 64
Table 4.3: Business activities transacted over the internet69
Table 4.4: Classification of negative inhibitions on using ICT in dairy business 71
Table 4.5 Barriers in the adoption and use of ICTs by farmers 72
Table 4.6: Impact of ICT on dairy business 73

xii
LIST OF ABBREVIATIONS
A.I- Artificial Insemination
Agro-ICTs- Agricultural Information Communication Technologies
ARDA- Agricultural and Rural Development Authority
AREX- Agricultural Research and Extension Services
CA- Contagious Abortion
CSO-Central Statistics Office, now called Zimbabwe Statistics
CZI- Confederation of Zimbabwean Industries
DDP- Dairy Development Programme
DMB- Dairy Marketing Board
DRSS- Department of Research and Special Services
GIS-Geographical Information Systems
GNU- Government of National Unity
GPS- Global Positioning Systems
ICT4D-ICT for Development
ICTs-Information Communication Technologies
IICD-International Institute for Communication and Development
Kg- Kilogrammes
LPD- Livestock production department

xiii
MDGs- Millennium Development Goals
MIS- Management Information Systems
MOET- Multi Ovulation and Embryo Transfer
NDFA- National Dairy Farmers Association of Zimbabwe
NGOs-Non Governmental Organisations
PESTEL- Political, Economic, Social, Technological, Environmental and Legal analysis
SPSS- A Statistical Package for Social Scientists
TB- Tuberculosis
UNCTAD- United Nations Conference on Trade and development
UNDP- United Nations Development Programme
ZESA- Zimbabwe Electricity Supply Authority

1
CHAPTER ONE �
INTRODUCTION AND BACKGROUND
INTRODUCTION �
Agriculture is the cornerstone of the Zimbabwean economy. Besides informal sources
like neighboring farmers and friends, it is generally accepted that information to sustain
and increase agricultural production is spread by different agencies, notably, universi-
ties, research institutes, extension services, commercial enterprises, and non-
governmental organizations (NGOs). However, this knowledge is often poorly docu-
mented or difficult to access.
This study looks into the effectiveness/impact of ICTs in dairy production.The chapter
provides the background of the study, the problem statement, research objectives, re-
search questions and scope of the study. The justification for carrying out the study and
dissertation outline is also provided. The chapter ends with a chapter summary.
1.1 BACKGROUND INFORMATION
�
There is growing recognition within the business community in and the agricultural sec-
tor, that there is potential contribution of Information and Communication Technologies
(ICT) in achieving development objectives. In the Agricultural sector, this growing inter-
est in ICT is generating strong demand for new evidence, approaches, and business
models.
In developing countries agriculture is the cornerstone of rural development projects. In
Zimbabwe it is regarded as `the backbone of the economy’. Notwithstanding this poten-
tial, concrete evidence of ICT's impact remains incomplete.
2
In Zimbabwe, guidance on proper design and deployment of ICT interventions in Agri-
culture in general and dairy production in particular, is not available.
While the importance of information and communication in business in general is well
appreciated, the contribution of ICT to agriculture is less well-understood, and rapidly
changing. New technologies, new applications and new business models and their
wider availability and affordability, are offering new and broader opportunities for farm-
ers.
Technologies are evolving very fast.These technologies are driving changes in agricul-
ture that make it even more urgent to understand their potential and pitfalls. This dra-
matic and rapid expansion in global information and communication technologies, and
the resultant proliferation of new information and communication devices, applications,
services and business models pose significant new opportunities (and of course new
threats) for the agricultural industry. Global food markets have both opened market op-
portunities for developing countriesbut at the same time creating new risks, volatility,
and challenges toagricultural value chains that increasingly depend on technical sophis-
tication for speed, scale, customization and food safety.
The increased global networking in agriculture and the demand of global class higher
value-added, more diversified food products necessitate more time-urgent and contex-
tualized information about crop varieties, supporting technologies, market trends, trad-
ing partners and the competition.
Poor smallholders face an increased risk of being left at the bottom of the value chain,
seeking to earn income from commodity crops that are increasingly volatile in price.
These farmers are faced with substantial information disadvantages such as costs im-
posed by physical isolation, weak infrastructure and asymmetric access. This also limits
their leverage at market and their ability to innovate in response to changing business
environments.

3
The challenge for agriculture in developing countries like Zimbabwe, then, is to harness
the power of ICT to compete in complex and rapidly-changing regional and global mar-
kets.This entails empowering poor smallholders with information and communication
assets and services that can increase their productivity and income. This becomes
more pertinent in Zimbabwe today because of the existence of many small farmers,
most of them financially challenged, following the implementation of the Agrarian Re-
form.
The increasing diversity and complexity of global agriculture, and the speed of global
innovation in ICT tools, services and business models, require maximizing conditions for
local innovation and creative public-private partnerships to expand ICT access and ser-
vices.In Bolivia, Ghana and Jamaica governments are increasingly realising the neces-
sity to link ICT and agriculture and thus incorporate ICT in agricultural sector policies
and programmes, (Stienen, Bruinsma and Neuman, 2007). In this regard, the Interna-
tional Institute for Communication and Development (IICD) has been supporting policy
processes in these countries for national ICT for Development (ICT4D). It is therefore
the aim of this study to deliberate on the impact of ICT in dairy farming.
1.1.1 Overview of Zimbabwean Agricultural Industry
The Zimbabwean Agricultural industry is divided into a matrix of sectors. The horizontal
plane consists of the following sectors:
a) Large scale commercial sector (the A2sector)
b) Small scale (A1) sector
c) Resettlement (refers to those areas resettled before the onset of the land reform
programme)
d) Subsistence sector (consists largely of traditional rural farmers)
The vertical plane consists of the following:
a) Livestock production
b) Crop Production and
c) Forests and Plantations

4
Of relevancy in this study is the livestock industry in which the dairy sector under study
belongs. In an attempt to bring out the relative position of the dairy sub-sector in the in-
dustry the author has conceptualised the following figure:
Figure 1.1: The Relative Position of the Dairy Sector in the AgriculturalIndustry.
1.1.2 The Dairy Sub Sector
The Dairy sub-sector in Zimbabwe plays a pivotal role in the country’s agricultural sec-
tor, providing the nation with nutrition, while simultaneously creating employment and
earning the country much-needed foreign currency. The sector has evolved over the
years, gradually transforming itself through the implementation of a Government-driven
land reform program, which commenced in the late 1990s. Production systems range
from extensive, low cost systems to intensive, zero-grazing (cut-and-carry) systems.
����������
��������
������������
���������
�!�� �����
"����
#�����������
��$$���%��!�����
���"��������
���������
#�""���&��'�
���������
(�����
���������
5
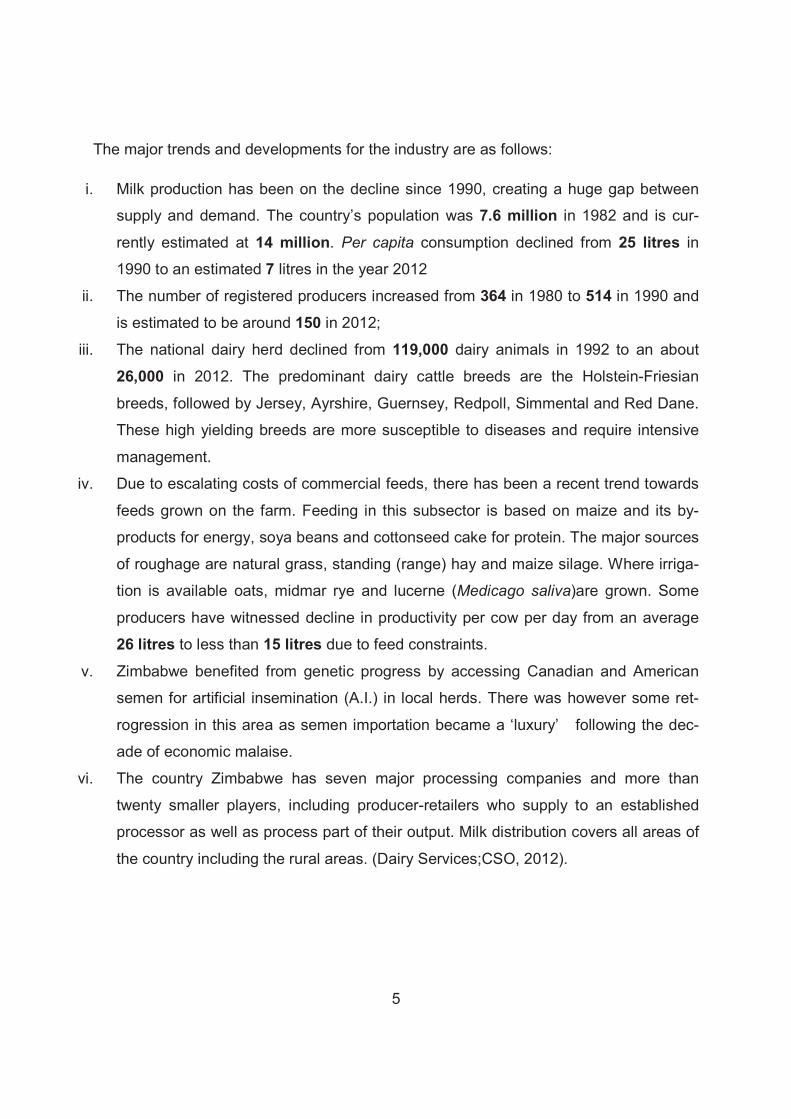
The major trends and developments for the industry are as follows:
i. Milk production has been on the decline since 1990, creating a huge gap between
supply and demand. The country’s population was 7.6 million in 1982 and is cur-
rently estimated at 14 million. Per capita consumption declined from 25 litres in
1990 to an estimated 7 litres in the year 2012
ii. The number of registered producers increased from 364 in 1980 to 514 in 1990 and
is estimated to be around 150 in 2012;
iii. The national dairy herd declined from 119,000 dairy animals in 1992 to an about
26,000 in 2012. The predominant dairy cattle breeds are the Holstein-Friesian
breeds, followed by Jersey, Ayrshire, Guernsey, Redpoll, Simmental and Red Dane.
These high yielding breeds are more susceptible to diseases and require intensive
management.
iv. Due to escalating costs of commercial feeds, there has been a recent trend towards
feeds grown on the farm. Feeding in this subsector is based on maize and its by-
products for energy, soya beans and cottonseed cake for protein. The major sources
of roughage are natural grass, standing (range) hay and maize silage. Where irriga-
tion is available oats, midmar rye and lucerne (Medicago saliva)are grown. Some
producers have witnessed decline in productivity per cow per day from an average
26 litres to less than 15 litres due to feed constraints.
v. Zimbabwe benefited from genetic progress by accessing Canadian and American
semen for artificial insemination (A.I.) in local herds. There was however some ret-
rogression in this area as semen importation became a ‘luxury’ following the dec-
ade of economic malaise.
vi. The country Zimbabwe has seven major processing companies and more than
twenty smaller players, including producer-retailers who supply to an established
processor as well as process part of their output. Milk distribution covers all areas of
the country including the rural areas. (Dairy Services;CSO, 2012).

6
1.2. THE BEATRICE-MARIRANGWE DAIRY FARMING AREA
This is the case study area. It is a unique area in that two dairy sectors, Beatrice (a
large scale sector) and Marirangwe (a small scale sector) are located close to each oth-
er. This area lies within forty to a hundred kilometers on both sides of the Harare-
Masvingo road.
Marirangwe was set up and run by the Agricultural and Rural Development Agency
ARDA under its Dairy Development Programme (DDP).
1.3 ENVIRONMENTAL/PESTEL ANALYSIS �
Using the PESTEL model the researcher is going to look at the key points affecting the
environment within which telecommunication companies are operating.
1.3.1 Political
The political situation is marked by a quasi-stable environment brought about by Gov-
ernment of National Unity has been ruling the country for the past five years before the
2013 elections. The Indigenization Act has remained a thorny issue in some sectors of
the economy.
These and other issues affect the flow of capital into the country, growth is slow and the
speculative attitude limits the companies from spending on capital projects which direct-
ly impacts our business.
1.3.2 Economic
The relative stable political environment has enabled the economy to grow by an aver-
age of 6% between 2009 and 2012. Prices have largely stabilized and the annual infla-
tion averaged 3.1% and compares favorably to regional averages of around 8-15%.
The economy has recorded a real growth per year in 2010 and 2011 of more than 9%,
though faced with economic, infrastructural, regulatory deficiencies, policy uncertainty
and ongoing indigenization pressures. Lending interest rates declined from as high as
60% per annum (5%/month) to ranges of 15-25% per annum(CZI, 2012).

7
1.3.3Technological
The Zimbabwe information and computer technology (ICT) industry is growing and mov-
ing in line with global trends. There has been deliberate effort to include computer stu-
dies in school curricular. Visible effort is evident in equipping schools with computer
hardware.
The ICT industry is tailing global trends but there is still a lag. The industry is expanding
network coverage and service provision. The ICT industry’s potential has not yet been
fully exploited.
Sector specific applications are being introduced. The financial services sector has had
an upper hand. Other sectors such as the transport, health and agriculture are receiving
some stimuli, thus ICT applications are still conceived to be at infancy.
1.3.4 Legislative
ICT policy lacks robustness to the extant that sector specific frameworks are absent and
rules of fair competition are difficult to monitor amongst players in the industry. A minis-
try dedicated to ICT was formed during the Government of National Unity.
The impact of the ministry is yet to be realized since the ministry is still new, hence
there is dire need for various stakeholders to input into formulation of National ICT poli-
cies and their attendant legislation.
1.3.5Social
Whilst the economy has stabilized, the decade of long economic decline has left the
government incapacitated to undertake social responsibilities.
Vulnerable social groups like the elderly, the handicapped, underprivileged and the un-
employed do not enjoy any social grants. Government institutions such as hospitals and
schools are still under-funded and unable to delivery services to desired levels as per
expectations.
Similarly, local government municipalities and state enterprises like Zimbabwe Electrici-
ty Supply Authority are failing to delivery basic but essential services such as consistent
supply of clean water and electricity for both domestic and industrial use.

8
Social networks in the telecommunications sector and its impact on the society also falls
short in service access and delivery to the vulnerable groups.
1.3.6Environmental
In line with the Millennium Development Goals (MDGs) and SADC protocols, the coun-
try is putting measures to ensure a clean environment. For instances, measures have
been put in place to limit the use of unrecyclable plastic materials and the limiting of the
importation of motors vehicles that could cause air pollution. Because of the ever
changing telecommunications industry, new opportunities for growth need to be created
in line with the regulatory framework and international best practice.
9
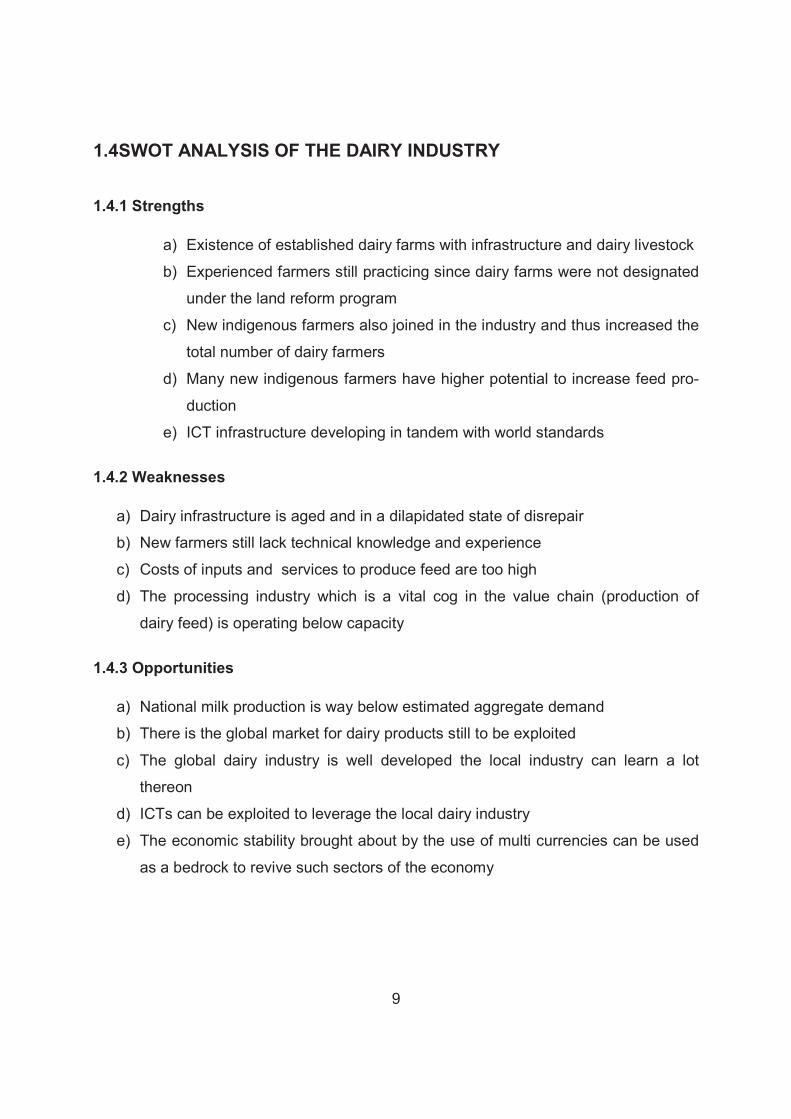
1.4SWOT ANALYSIS OF THE DAIRY INDUSTRY �
1.4.1 Strengths
a) Existence of established dairy farms with infrastructure and dairy livestock
b) Experienced farmers still practicing since dairy farms were not designated
under the land reform program
c) New indigenous farmers also joined in the industry and thus increased the
total number of dairy farmers
d) Many new indigenous farmers have higher potential to increase feed pro-
duction
e) ICT infrastructure developing in tandem with world standards
1.4.2 Weaknesses
a) Dairy infrastructure is aged and in a dilapidated state of disrepair
b) New farmers still lack technical knowledge and experience
c) Costs of inputs and services to produce feed are too high
d) The processing industry which is a vital cog in the value chain (production of
dairy feed) is operating below capacity
1.4.3 Opportunities
a) National milk production is way below estimated aggregate demand
b) There is the global market for dairy products still to be exploited
c) The global dairy industry is well developed the local industry can learn a lot
thereon
d) ICTs can be exploited to leverage the local dairy industry
e) The economic stability brought about by the use of multi currencies can be used
as a bedrock to revive such sectors of the economy

10
1.4.4 Threats
a) The local industry is suffocating from imports from neighboring countries
b) Lack of clarity and inconsistency in the indigenization policy may scatter away
offshore capital
c) The unacceptability of Offer Letters as collateral by banks to secure loans may
choke the resuscitation of the industry
1.5 PROBLEM STATEMENT
In most dairy farms in Zimbabwe, information and record systems are poor, unstruc-
tured and costly. In dairy farms, the uptake of Agro-ICTs and their utilization is very low,
and thus there is very little collaboration amongst farmers and with other players in the
value chain such as; suppliers, buyers of dairy produce, industry regulators and know-
ledge-generation centers ( Universities, Research Institutes and Government and Non-
Governmental extension services)
1.6RESEARCH OBJECTIVES �
The objectives of this study are:
1) To identify which ICTs have been adopted by farmers,
2) To establish what factors affect adoption of Agro-ICTs,
3) To ascertain the extent to which farmers are utilizing ICTs in their day-today
production and financial information
4) To determine to what extent dairy farms are collaborating with other farmers and
other players in the milk production value chain through ICTs, among dairy far-
mers in Mashonaland East Province of Zimbabwe, and
5) To formulate an Agro-ICT architecture that may be recommended to promote na-
tional dairy production.

11
1.7 RESEARCH QUESTIONS
1) What ICTs have been adopted by Zimbabwean commercial farmers?
2) What are the factors that affect adoption of information technology by the dairy
farmers?
3) To what extent are farmers using ICTs in their production and financial records?
4) To what extent is the ICT collaboration between farmers and other players in the
value chain?
5) What national architecture can be set up to promote dairy production?
1.8 RESEARCH HYPOTHESIS
Zimbabwe’s dairy production can be improved by increasing uptake of ICTs by farmers.
1.9 SCOPE OF RESEARCH
This study will attempt to find out how the farmers have embraced ICT technologies and
how they are connected among themselves and within the value chain. Due to con-
straints in time, financial and material resources, the study will investigate farmers only
and other various players in the industry will be not be studied.
The dairy farms to be included in the study will be sampled from dairy farms in the Ma-
shonaland East province of Zimbabwe. The study will focus on Beatrice-Marirangwe
dairy farmers because the area has a relatively large concentration of dairy farmers.
This part of the country is a good candidate of this research because it has relatively
large numbers of farmers from different sectors of the dairy industry in proximity. Both
groups of farmers will be included in the study. This means that samples will be taken
from both large scale commercial farmers and small scale farmers.
12
Target respondents in the farms will be the Farm Owners. In the small scale sector
members of the family and workers were allowed to represent the farm owners.
In case of commercial farms the responsible Farm Managers or Bookkeepers can act
as proxies of the owners.
Data collection from the farms was carried out through questionnaires and face-to-face
interviews in December 2014. Data capture and analysis was carried out in the months
of January and February 2015.
1.10JUSTIFICATION OF RESEARCH
1) To increase awareness on the importance of Agro-ICT (ICTs in agriculture)
2) To harness ICT in exploiting dairy production potential to meet increasing de-
mand for dairy products.
3) To promote networking the dairy industry with other sectors of the economy and
globally.
4) To recommend a dairy ICT architecture that can be used for policy formulation at
national level.
5) To transform dairy into a knowledge-based industry so as to enhance the coun-
try’s competitiveness in order to increase the contribution of the dairy industry to
economic growth.
1.11DISSERTATION OUTLINE �
This study mainly consists of five chapters. Chapter 1 introduces the whole study.
Chapter 2 reviews literature relevant to the objectives of the study. Chapter 3 provides
the methodology used in the research. Chapter 4 presents the research findings and
discussion Chapter 5 presents the conclusions and recommendations of the study, as
well as areas of further research.

13
1.12CHAPTER SUMMARY �
The chapter has provided the introduction of the research study, the background infor-
mation, and research objectives, research questions, research hypothesis, scope of the
study, reasons for justifying the study.The dissertation outline has also been put for-
ward. The following chapter reviewsliterature on the impact of ICT in dairy farming.

14
CHAPTER TWO
2.0 LITERATURE REVIEW
2.1 INTRODUCTION
Agriculture requires substantial knowledge transfer to and among farmers. This informa-
tion includes; farming practice advice, new technologies, disease control and selection
of markets (van den Ban, 1998). With the advent of information communication technol-
ogies (ICT), dairy farming is envisaged to embrace the use of technology in; milk pro-
duction, on-farm technologies adopted, managing production costs, record-keeping ac-
tivities, general farm and farmer statistics and collaboration of farm with its external en-
vironment.
This chapter provides literature review on the use of information communication tech-
nology (ICT) in agricultural practices. The literature review focuses on how ICTs are
adopted by commercial farmers. The factors affecting the adoption of ICT by dairy
farmers, the collaboration between farmers and other players in the value chain and the
policies that are in place in order to promote dairy production.
2.2 DEFINITION OF ICT
Kundishora (unpublished) defined ICT as ‘a generic term referring to technologies that
are used for collecting, storing, editing and passing on (communicating) information in
various forms.’
Heeks (1999) used the systemic approach to describe ‘the information system’. The au-
thor here postulates that `information system’ and `ICT’ are synonymous and hence can
be used interchangeably.
That postulation fits well to Kundishora’s definition.

15
Heeks viewed the information system as a two tier system. The author agues that there
exists the information (the content) and the technology used to deliver the information.
These two arein turn the design of the ICT platform, the people and environment.
Heeks (2005) described the information system as a two-way chain. Heeks’ integrated
two-way information chain agrees with Toyama’s postulation. Toyama (2010) believes
that for the information system to effective it requires ‘to integrate ICTs into organiza-
tional systems by focusing on the needs of the users of the technology ……… at the
same time, to amplify the developmental intents of the organization.’ This view is also
supported by Parker (1999), who adds that without this integration process, the project
becomes technology-facing.
In search of the definition of ICT, one fact comes out that: in that ICT mosaic, there are
three aspects that feature in these definitions; pieces of gadgets or equipment, informa-
tion and people. Haag et al. (2007), support this opinion. They viewed IT more holisti-
cally, as a ‘mind support tool set’ where the tools help the people to process the infor-
mation.
The human-computer interaction inherent in IT-based is described by Leeuwis (1993)
as a ‘communication of meanings’. Acknowledging the abundance of terms used to de-
scribe computer-based management aids, Leeuwis settled on `communication tech-
nologies’ (CT) to reflect `communication of meanings,’ a multidirectional data flow be-
tween different IT components and also between computers and people. The conver-
gence of information technologyand communications technology has been given a new
label of information and communications technology (ICT) (ibid).
For the sake of this agro-oriented study, Stienen, Bruinsma and Neuman (2007), de-
scribed Agro-ICTs as using compute based applications to enhance food security, agri-
cultural development and support rural livelihoods.

16
2.3 DEFINITION OF TECHNOLOGY �
Definitions for technology vary from being focussed on use of a material object to being
very broad in scope. MacKenzie and Wajcman (1985, in Paine 1997) describe technol-
ogy as consisting of three layers or dimensions. The first layer involves physical objects
and artefacts; the second relates to activities or processes; and the third to what people
know and do. Farrington and Bebbington (1993, in Paine 1997) express a similar three
tiered definition referring to objects as hardware, processes as methods, and and what
people know (knowledge).
These definitions emphasise an interaction between ideas, material objects, and hu-
mans in a system designed to accomplish a task. Perceiving technology in a whole sys-
tem sense, rather than just the physical components, fits well with the systems ap-
proach used to define ICT.
2.4 ROLE OF ICTS IN AGRICULTURE
Van den Ban (1998) highlighted that farmers require access to varied information from
many sources. The author adds that such information should be context-specific and
includes advice on; best practices, technologies for crop production, weather, and
about post-harvest aspects, includingstorage, handling, processing, , and marketing.
Chapman and Slaymaker (2002) argued that ICTs in agriculture are enablers since they
have the potential to facilitate greater access to information that drive or support knowl-
edge sharing.
ICTs essentially facilitate the creation, management, storage, retrieval, and dissemina-
tion of any relevant data, knowledge, and information that may have been already been
processed and adapted (ibid). Kundishora (unpublished) adds that ICT as asector can
contribute immensely to the national GDP of a nation and that it can result in improved
market competitiveness of a nation’sproducts and services.
17
In turn ICT can effectively assist international economicintegration, improve living stan-
dards, narrow the digital divide, and improvebiodiversity utilisation and management.
Furthermore it can ICTs can impact positively on governance of the economy(ibid).
Balaji, Meera, and Dixit (2007) pointed out that traditionally; the primary broadcasting
media were the radio and television. However, lately, internetand mobile-based tech-
nologies are taking centre stage.This new phenomenon includes applications and
communication facets of the order of social media and an array of digitalparaphernalia
(information repositories, digitalcamaras and video, including high-tech mobile phones)
(ibid).
Llewellyn (2007) posited that information that is properly packaged led to cost reduction
of the process of seeking the information It also makes learning cheaper and affordable
Use of ICTs may lead to strengthen farmers’ capacities and make the better represent
their constituencies. ICTs would leaverage farmers in negotiating input and output
prices, land claims, resource rights and infrastructure projects. It would also enablefarm-
ing communities to interact with other stakeholders, thus reducing social isolation. It
opens up new business opportunities and allows easier contact with friends and rela-
tives, (Stienen et al, 2007). This widens the perspective of local communities in terms of
national or global developments.
Stienen et al, (2007) argued that Global Positioning Systems (GPS) linked to Geo-
graphical Information Systems (GIS), digital cameras and internet, can assist farmers to
document and communicate their situation. Farmers can benefit from better access to
credit and banking facilities (ibid). Mobile banking facilities offer further scope to reduce
costs and stimulate local trade. In India, the a programme that automates milk collection
and payments for its members, enhancing transparency of the milk volume and quality
collected, thus and ensures fair payments to farmers (ibid).
With computers becoming available for agricultural management and production use,
the need to understand and improve the effectiveness of ICT investment cannot be

18
overstated. ICT applications in agricultural activities have payoff potential in research
activities, extension activities, production and processing (obtaining and sharing
information, preparing operational plans, proposals and budgets) and gaining access to
markets (ibid).
Proliferation of mobile phone technologies is providing faster and multi-directional
communication and information exchange opportunities for farmers, extension workers
and agricultural businesses.
But the ICT literacy of farmers in developing countries is very low (Riviera, 1996), in
addition to the absent or negligible internet connectivity infrastructure in remote areas.
Hence, use of computers and the Internet is mostly absent from rural areas.
2.5 ROLE OF ICT IN THE DAIRY SECTOR �
In this section I will discuss the complexity of the dairy farming units. I will demonstrate
how large amounts of data evolve, the needs for interacting with a multiplicity of institu-
tions, and how therefore dairy production is a good candidate for ICT.
According to Berman (2010), dairy farming systems probably are the most complex of
the agricultural production systems.Other agricultural systems, involving crops plants
and livestock, inputs and outputs occur a few times per year. These products usually
relate to one or two products. Contrary, in the dairy system inputs and outputs are con-
tinuous. The inputs include births, deaths, sales or purchases of animals, feed and la-
bour. The outputs are milk, meat and surplus animals. They are the outputs of individual
cows, the cost of which makes them individual production units that vary in performance
(Richardson, 2006).
Revenue maximisation requires continuous decision making at both individual cows and
herd levels. According to Stoner (2010), productivity response to information flow is
greater in the dairy farming system than in other sectors of agriculture.

19
The dairy farming systems, even the simplest of them, contain a bulk of potential infor-
mation in records of; milk yields, fertility, feed production and usage, animal health, la-
bour input, prices (Aker, 2010). The transformation of this potential into data and later
into information depends on the prevalence of literacy.
The initial phase in the creation of data was for the purpose of breeding that is, improv-
ing productivity through production of better breeds. It was initiated by the farmers’
weighing of milk and keeping of records with the purpose of selecting the higher yielding
animals. This progressed to breeders associations setting breeding schemes based on
regular milk assessment of milk for quantity and composition typical for the breeds
(ibid).
Agrocom (2010) noted that artificial insemination and deep freezing bull’s semen, en-
hanced breeding for milk production. Ali and Kumar (2011) noted that the advances in
quantitative genetics initiated by animal breeders to enhance progress in animal produc-
tivity, was further improved by computerized data analysis.
The dairy farmers formed breeders associations which initiated and supported re-
search. This culminated in the formation of international organizations serving producer
interests. These organisations have developed to the extent of marketing and exporting
frozen semen or live bulls of superior genotypes(ibid).
The rate of genetic progress depends to a significant extent on the size of herds. The
larger herds make possible more accurate predictions of differences in genetic potential
between bulls used in the artificial insemination. This implies that farming systems of
small size may see slower rates of genetic progress, Balaji et al (2007).
The net effect is that: in order to get higher rates of genetic progress, larger herd sizes
are required and several traits have to be monitored on individual animals leading to
handling of massive data.

20
Batchelor (2002)contends that another pattern of information transfer is evident in ani-
mal nutrition.Information flows to and from individual farmers and farmers’ organisa-
tions. The pattern of evolution of information transfer is a function of socio-economic
state. The initial diffusion of information was by means of verbal communication at
farmers meetings or by publications of a more popular style. The acceptance of the in-
formation provided was determined by the trust placed by farmers in the providers of
information.
Balaji (2009) argued that the presence of extension services, related to universities or
government bodies played a significant role in transfer of information in this domain.
Aker’s (2010) view is that information sharing resulted in the improvement of feed ra-
tions.
Ballantyne (2002) indicated the potential benefits of feeding complete mixed rations.
This technology requires mixing of feeds. The advantage of this technology enunciated
formation of large cormercial stockfeed firms.
Dairy farming was modified by the advent of computers and of computer based systems
in several ways. Bowonder et al (2007) found that computer-based feeding programs
became available for suggesting the least-cost feed mixtures. According to Cecchini
and Scott (2003),computerised milking systems improved the storage of milk records of
entire lactations. The most advanced commercially developed milking systems (e.g. the
Afimilk system developed in Israel) compiled information on physical activity, electrical
conductivity of milk along with that on milk yield. Algorithms were created for detection
of sub-clinical mastitis and made possible treatment before the evolution of the inflam-
mation into a clinical state. It also developed algorithms for detection of oestrus, a
paramount phase of animal breeding.
Singh (2006, as cited in Bowonder et al, 2007) noted that one phase of information
transfer in dairy farming systems is that of health control. This was supported by
Chapman and Slaymaker (2002). It involves detection and care of diseases. The com-
ponents of veterinary care usually are performed by different organization bodies.

21
Therefore the information associated with them may have different flow patterns, ac-
cording to the distribution of components between these bodies. Some disease control
may be carried out commercial bodies and or NGOs. Epidemic diseases control may a
government institution exercise.
Further progress in increasing production efficiency may be attained by forming an in-
put- output data bank (Ali, 2010). It includes feeds, labour, purchases, sales, and prices
that may serve as an input for analysis of economic performance. Such analyses may
point to herd management weaknesses requiring further consideration.
According to Garforth, Angell, Archer, and Green (2003),with the advent of computer
networks information may be made available at government, university, and farmer’s
organizations websites. This may considerably reduce the time between the recognition
of need for information and the access to it. Heeks (1999) added that the efficiency of
this information transfer method depends however on the ability of end-user farmer. The
farmer needs to identify, analyse, to detect causes for the problem and to know where
to turn for information (Garforth, Angell, Archer, and Green, 2003). This requiresfarm-
ersto be capable of independently screening the available information for relevancy and
applying the information to the situation.
Llewellyn (2007) argued that the degree of literacy and of formal education are critical
elements in determining the pattern of information flow and its impact, as are the readi-
ness for cooperation and the degree of technological development.
ICT systems are applicable to all functions of management, as they help to gather and
organise information for farmers. These include planning and implementation and, in
addition to control(Parker, 1999).
Through their management strategies, farmers aim to exert control over on-farm system
variability.Information gathering is a vital component in the control function and in reduc-
ing system uncertainty.
22
Haag, Cummings, and Philips(2007) and Leeuwis (1993) delineate between structured
and non-structured decisions. It is the more structured decisions which lend themselves
to programming of decision support systems.
Information requirements, based on key dairy decision-making areas, have been as-
sessed by several authors. (Huirne, Harsh and Dijkhuizen, (1997) examined general
critical success factors for Dutch and US dairy farms and related them to information
needs. The information needs are summarised as:
a) Financial issues
b) Reproduction/breeding
c) Milk production
d) Feeding
e) Herd health
f) Marketing
The actual decision maker is an often overlooked aspect in the design of decision sup-
port systems (Huirne et al.,1997). This failure to consider the actual use and decision
making processes of the end user in the creation of technologies will hinder successful
implementation. By viewing technology as more than a combination of technical de-
vices, the importance of the end-user, the farmer, becomes apparent. Explicitly includ-
ing farmers in a more holistic view of technology links them into the creation of innova-
tive farming systems.
2.5.1. ICT and Firm Performance
Farming is a business. Dairy farms should be viewed as commercial enterprises or
firms. ICT is widely viewed as an enabler. Greater use of ICT may help firms increase
their overall efficiency (Pilat, 2004).
Other studies have demonstrated that ICT management capabilities, or the managerial
skills associated with the acquisition, management and use of ICT have significant
23
impact on business performance (Santhanam and Hartono, 2003). Mukhopadhyay,
Rajiv and Srinivasan (1997) found support for the beneficial impacts of IT on the quality
and output of organizational processes.
It has been argued that ICT investment directly affects production processes and
permits other productivity enhancing changes, such as business process redesign and
organizational change. ICT investments, particularly those that facilitate sharing of
information, may also increase the ability firms to innovate. Sambamurthy, Bharadwaj
and Grover (2003) advocated a network of factors that reflect the integration of IT into
critical organizational processes and business capabilities. In particular, they
conceptualized the organizational impacts occurring through ICT-enabled agility
capabilities, digitized organizational processes and knowledge management systems.
Barua, Kriebel and Mukhopadhyay (1995) proposed a theory of ICT complementarities
to argue that the initial effects of IT should occur at the level of organizational processes
that use the IT resources.
2.6 FACTORS AFFECTING THE ADOPTION OF ICTS
The United Nations Conference on Trade and Development(UNCTAD) (2006) demon-
strated that the success of any ICT project depends on 12 C‘s, which comprise: Con-
nectivity, Community, Commerce, Capacity, Culture, Cooperation, Capital, Context,
Continuity, Control, Content and Coherence. While UNCTAD contends that these fac-

24
tors affect the success of ICT projects it can be colloquially inferred that the same fac-
tors can affect adoption of ICTs by farmers. This stems from the fact that these factors
have been identified by other authors. For example, Alvarez and Nuthall (2006) con-
cluded that in New Zealand and Uruguay, the character, level education, skills, and
learning style of farmers were associated with farmers’ use of information communica-
tion technologies.
Llewellyn (2007) found that information gathering and learning could be explained by
land size, the ability of the farmer to make utilise the information, and accessto informa-
tion packed in a localized content form.
In that regard the UNCTAD framework can be used as a guide in reviewing factors that
affect adoption of ICTs although the author has reservations on failure by the UNCTAD
to collapse the factors since some of them are interrelated. For instance the author feels
that the following aspects could have been collapsed together:
a) Commerce and capital
b) Content and context
c) Community, culture and cooperation
2.6.1 Connectivity
For effectiveness, it is imperative that ICT projects are structured and integrated within
existing systems of local information exchange and flow in farming areas (Roman and
Colle 2003). The integration of the ICTs into organizational activities and individual
tasks at the different levels in which it operates is usually the challenging aspect of most
projects, but it is animportant one for the ICT project‘s effectiveness and success
(Parker, 1999).

25
May, Karugia and Ndokweni (2007) observed that skewed ICT policies are a dislocation
in the adoption of ICT in agriculture, especially those addressing farming areas, rural
communities and development, language barriers, poor information sharing culture.
2.6.2 Community
An array of characteristic of farmers influencesthe manner in which they seek informa-
tion, and access to information sources and channels. By understanding how informa-
tion is used locally, the impact of ICTs could be greater (UNDP, 2001; Chapman and
Slaymaker 2002). Information provided through ICTs should be appropriate and rele-
vant to livelihoods of the intended end-users. Localised and contextualized content is an
important, as it tends to be more responsive to local needs; in addition, people relate
better to content that recognise and own (Chapman and Slaymaker,2002).
However, not all information is generated on the basis of community needs. For in-
stance, information about environmental concerns, climate issues, and food and nutri-
tion could initially be provided to communities to start creating awareness or as an entry
point to provoke discussions on theseissues (ibid).
2.6.3 Content
It is paramount to contextualise the content of ICT projects in packaging information for
farmers.Relevance is degree to which the information is localised to the situations of the
farmer.
Local content is defined as content that is intended for a target audience, as defined by
geographic location, socio-economic and political inclinations of a given society (Ballan-
tyne, 2002). Therefor local content is an expression of a community‘s knowledge. Local
content includes external and global material that has been transformed, adapted, and
assimilated into a community.
26
Relevance of information is destroyed by lack of congruency between service providers
and the community (Ballantyne, 2002). This disconnects results in service providers
pushing information to people without paying attention to their real needs.
A two-way participatory allows incorporation of farmers’ knowledge base into the pro-
gram. Such an approach enables farmers to share lessons and best practices related to
their farm enterprise among Interactions and collborations assist in farmers expressing
their needs, fears and expectations and this lead to establishment of trust, (Chapman
and Slaymaker, 2002).
Adhiguru, Birthal, and Kumar (2009)postulated small marginal farmers accessed less
information and from fewer sources compared to medium- and large-scale farmers.
2.6.4 Commerce
The nature of business transactions and their levels determine the ICT projects. A case
in point is comparisons between one community that has one product and onother that
has diversified products. Balasubramanian, Thamizoli, Umar and Kanwar,( 2010) ar-
gued that encouraging diversification of enterprises creates a demand for more informa-
tion.
2.6.5 capacity
However, in agriculture, despite the rapid proliferation ICTs to facilitate farmers‘ access
to information, benefits have not accrued due to a myriad of factors including; capacity ,
costs, sustainability, affordability, applicability, accessibility, scalability, and availability in
appropriate languages (Keniston 2002; Dossani, Misra, and Jhaveri, 2005).
Another common distortion is that digital information related to agriculture is poor in
quantity and generic in quality (Balaji, 2009).
This is because institutions are not capacitated to contextualise information and make it
more relevant for the users and more useful to their needs (Cecchini and Scott 2003;
UNDP, 2001).
27
2.6.6 Culture
Different communities have different traditions, rites, values and norms. Appropriate
packaging and channels of information transmission have to be designed. They should
consider the information delivery mechanism (the technology itself) and community lan-
guage options, One local language is preferred (Mittal, Gandhi, and Tripathi, 2010). This
is particularly relevant to the Zimbabwe farming communities because there several
languages, and some with different dialects.
2.6.7 Cooperation
What Ballantyne (2004) is insinuating is that there is need for collaboration on those ICT
platforms in order to provide the farmer with relevant information.
Instead of a research institution supplying research results to farmers directly there is
need for those institutions to work closely or pass their information through extension
services that work with farmers very closely and are better placed to know the farmers’
needs with better intimacy. Community meetings, collaborations and participatory ap-
proaches as well as by involving farmers in the monitoring and evaluation exercises as-
sist ingetting leads to what type, quality and quantity of information is required (Colle
and Roman, 2002; Meera, Jhamtani, and Rao, 2004).
2.6.8 Context
The type of information to be packed in an ICT project will be affected by the project‘s
motives. For instance objectives of private-sector initiatives will differ from Public or civil
society initiatives, in terms of rivalry and excludability on one hand , issues of public or
common good on the other (Chapman and Slaymaker,2002).
Generalized content posses challenges to farmers in different regions, which have spe-
cific crops, livestock requirements, and agro-ecological perculiarities.
Narrowing the scope of information to needs of farmers may have important impacts on
the adoption of technologies and could invariably increase productivity of farmers
(Samaddar, 2006).

28
2.7 CASE STUDIES �
ICT Use and Impact in Agriculturial Firms in Developing Countries
Matambalya and Wolf (2001) explored whether the utilisation of ICTs can improve their
competitiveness and performance of firms in the small to medium enterprises category.
They concluded that a positive correlation between the size of the firm and use of
advanced ICTs. They argued that over and above reducing transactions costs and
uncertainities ICTsdo increase competitiveness through facilitating information flows.
Lubbe (2004) ascertained the linkages between ICT investment and organisational
performance in some e-commerce oriented SME in South Africa. The study provides
evidence that shows that firm performance is linked to the level of ICT investment
intensity in the sample of companies investigated. De Silva and Ratnadiwakara (2008)
found that ICT investment reduced the transaction costs of smallholder vegetable
farmers in Sri Lanka. Jenson (2007) used micro-level survey data to show that the
adoption of mobile phones by fishermen and wholesalers was associated with a
dramatic reduction in price dispersion, the complete elimination of waste, and near-
perfect adherence to the law of one price.
Adekunle and Alluri (2004) reported on a pilot project that was implemented in South
Western Nigeria which provided a multi-purpose community information access point
with basic ICT infrastructure including Internet access. The access point provided links
to the Community Help Desk and other sources of information on the Internet, provided
training to farmers, linked the farmers directly with inputs and output markets, provided
an array of farm equipment that farmers lacked on rental basis, and provided online
materials to promote farmers’ learning of innovative methods to increase their
productivity, market products and develop enterprises.
Analyses of panel data from the farmers showed that the participating farmers
increased their holdings, external inputs used and productivity leading to higher
incomes with attendant evidence of graduation into commercial farming.

29
2.8 CHAPTER CONCLUSION �
The chapter has provided literature on the use of ICT in dairy. IT was established in the
literature that ICT is crucial for the growth of dairy farming. The literature focuses on the
adoption of ICTs in dairy farming, factors affecting adoption of ICTs and the role of ICT
in farming. Arelevant case study was provided. The next chapter presents the research
methodology.
CHAPTER 3
30
3.0 RESEARCH METHODOLODY
3.1 INTRODUCTION �
The literature review was on the anticipated role, adoption and impact of ICT in Agricul-
ture in general and dairy production in particular. This literature however is not enough
to make conclusions on the impact of ICT in the dairy sector in Zimbabwe. With the aim
of understanding more on the subject matter, the researcher carried out a primary re-
search. This chapter therefore presents the research methodology. It mainly focuses on
the research design, research strategy, population and sampling. The research in-
strument, data collection method and data presentation and analysis are provided in the
chapter.
3.2 RESEARCH DESIGN �
Degu and Yigzaw (2006) defined a research design as the process that guides re-
searchers on how to collect, analyse and interpret findings. It can therefore inferred to
mean that it is a logical model that guides the researcher though various stages of the
research. The research design facilitates efficient collation of information withreduced
effort, time and money (Greener, 2008). Research design expresses both the structure
of the research problem and the plan of investigation used to obtain empirical evidence
that will help solve the problem (Cooper and Schindler, 2003).
According to Wiid and Diggines (2009) research design is simply the outline, framework
or plan for the research project that is used to guide data collection and analysis.
The design ensures that the study addresses the relevant problem in the most cost-
effective manner.

31
Therefore the preparation of a research design which is appropriate for this takes cogni-
sance and consideration of the following:
a) Objectives of the research study.
b) Method of data collection to be adopted
c) Source of information (Sample Design)
d) Tools for data collection
e) Data analysis - qualitative or quantitative
3.3 RESEARCH PHILOSOPHY �
Easterby-Smith, Thorpe and Lowe (2008) argued that success of business reseach
hinges on through preparation of underlying philosophical issues. They added that also
research philosophy points the researcher to the appropriate designs that best suit the
project. Saunders, Lewis and Thornhill (2003) also agreed and furtherargued that re-
search philosophy supports the forms a link between the researcher’s thought proc-
esses and knowledge on a particular subject area.
All research work is undertaken to find answers to a question or problem and it is as-
sumed apriori that the process is being undertaken within a framework of a set of phi-
losophies (Gasson, 2002). Two major philosophies to research theory development
were identified by Perry (1998) and these are; deductive theory and inductive theory.
The difference between the two approaches can be viewed in terms of scientific para-
digms, with the deductive approach representing the positivist paradigm and the induc-
tive approach representing the phenomenological paradigm (Perry, 1998). These re-
search philosophies also known as research approaches can be also classified as quali-
tative and quantitative.
Quantitative research techniques include surveys, observation, and experiments. Quali-
tative research techniques include focus groups, in-depth interviews, and predictive
techniques. Parasuraman, Zeithaml, and Berry (2004) defined qualitative research as

32
the collection, analysis, and interpretation of data that cannot be meaningfully quanti-
fied, that is, summarized in the form of numbers. Qualitative research is generally less
structured than quantitative research and, due to the detail of data collected, uses
smaller sample sizes. To a large extent, qualitative research relies on detailed descrip-
tion by respondents to gain insight into a particular problem. This approach is useful
when examining attitudes, perceptions, motivation, and understanding.
Quantitative research is the collection of data that involves larger, more representative
respondent samples and the numerical calculation of results. This type of research re-
lies on numbers, measurement and calculations. The scientific approach to research is
the guiding framework for quantitative research. This approach tends to be more highly
structured than Qualitative research, which makes it easier to measure and analyses
the responses.
Hague (2002) in a direct comparison of the two approaches, four important differences
can be identified between the two:
a) The type of problem that can be solved.
b) The sampling method used.
c) The methods used to collect the data.
d) The techniques used to analyse the data.
According to Saunders et al (2000), the positivist approach assumes that the world is
external to the researcher and in which he is attempting to get an explanation, predic-
tion and control by dividing it into parts and isolating them using mechanistic process for
explaining social behaviour.
Thus positivist believes the researcher is objective and that the truth has to be con-
firmed with empirical evidence using deductions on quantitative data (Saunders, Lewis
and Thornhill, 2000).
This is because positivist philosophy was foundedon a belief that the study of human
behaviour should be conducted in the same way as studies conducted in the natural-
sciences.

33
On the other hand, Gasson (2002) explained that phenomenological approach exam-
ines the relationship between consciousness and being. The main assumption here is
that phenomenological approaches are particularly concerned with understanding be-
haviour from the subjects’ own subjective frames of reference (Greener, 2008). Re-
search methods are chosen therefore to try and describe, translate and explain and in-
terpret events from the perspectives of the people who are the subject of the research
(Saunders et al 2000).
The research is both quantitative and qualitative in nature.The researcher used both
approaches. Using both of these approaches avoids bias. The research will not miss
crucial data that is important for the answering of the research objectives.
3.4 RESEARCH STRATEGIES
Saunders, Lewis and Thornhill(2002) posit that there are several strategies that can be
used for carrying out a research. These include experiment, survey, case study, action
research, grounded theory ethnography and archival research.
The type of research strategies one uses depends on the research questions and objec-
tives, the extent of existing knowledge, the amount of time and other resources availa-
ble for the research, and the philosophical underpinnings (Saunders et al, 2009). This
research adopted the case study approach. A case study of Beatrice-Marirrangwe is
used to represent dairy farmers in Zimbabwe.
3.4.1. Case Study
Saunders et al. (2002) defines case study “as a strategy for doing research which in-
volves an empirical investigation of a particular contemporary phenomenon within its
real life context using multiple sources of evidence”. According to Yin (2003), there is no
clear distinction betweenthe phenomenon under study and the context within which it is

34
being studied. It differs from an experimental strategy in that, in the latter the research is
undertaken in a known and controlled environment.�
Yin (2008), defined a case study as “an empirical inquiry that investigates a contempo-
rary phenomenon within its real-life context...” (p. 8). Also Kumar (2005) refers the case
study as a research study which focuses on understanding the dynamics of the present
within a single setting. Thus case studies offer an opportunities to study particular sub-
jects, for example one organisation or a group of people and usually involves gathering
and analysing information that may be both qualitative and quantitative (Saunders et al.,
2003).
With regards to the foregoing, the researcher undertook a case study approach of Bea-
trice-Marirangwe dairy farmers. The execution of this research was conducted based on
the guidelines supplied by Myers (1997) who suggested that the case study method in-
volve at least four stages of work:
a) Determining the present situation. In this study this was achieved through the use
of questionnaires, interviews and documentary records.
b) Gathering information about background to the present situation – in this study it
was achieved by referring to documentation and other sources available on the
case study
c) Gathering more specific data- this was achieved by piloting the questionnaire to
make sure that it is capturing all the objectives of the study.
d) Presenting and analysing findings and recommendations for action- mainly
through the production of the final research report.
3.5 POPULATION �
Greener (2008) described a population as the total of individual units under considera-
tion in a study; whether they are people, companies or households. Best (1993) also in

35
defining population in reference to research, explains that it is any group of individuals
that have one or more characteristics in common that are of interest to the researcher.
The concept of population (or universe) is defined by McDaniel and Gates (2001) as the
total group of people from whom information is needed. In other words, a population
consists of a comprehensive number of individuals, units or items that can become ob-
jects for observation. It consists of a specific group of individuals, households, business,
professional people from whom data is required.
The population of this study consists of the total number of the large and small scale
dairy farmers in Beatrice-Marirangwe dairy farmers. They are a total sixty (60) farmers
in number (thirty nine small scale and twenty one large scale farmers).
3.6 SAMPLING �
If data regarding each and every member of the population is to be collected, then the
exercise is regarded as a census (Kumar, 2005).
Census is cumbersome and almost impossible in some incidences to carry out and re-
searchers have to use samples that represent the population. Therefore, sampling is the
scientific process of selecting a number of study units from a defined study population
(Saunders et al., 2000). A sample is a statistical selection of part of the population
whose properties are studied in order to make some inferences about the whole popula-
tion and the selected sample must be a close representative of the whole population
(Dawson, 2002; Kumar, 2005). Thus Kothari (2008) gave the assumption that there ex-
ists enough similarity among the elements of the population that a few of these ele-
ments will adequately represent the characteristics of the total population.
The common statistical rule is; a sample must be large enough relative to the population
size so that it is reliable and valid (Greener, 2008).
Sampling methods for obtaining representative samples are basically divided into two
broad categories. These categories are probability sampling methods and non-
probability sampling methods. The concept of probability can be interpreted as the pos-

36
sibility of something happening in reality. The basic difference between the two methods
is:
a) In non-probability sampling methods, no indication can be given of possible bias
or error margins of estimates of population characteristics;
b) In probability sampling methods, the sample error of a given sample size can be
estimated statistically if the sample design meets certain requirements.
This does not mean that non-probability sampling methods cannot yield good results;
the problem is that the user of these methods is unable to give any indication of the reli-
ability of the results that are obtained (Wiid and Diggines, 2009).
3.6.1 Non-probability (Random) Sampling
In probability sampling methods, the probability that a specific unit of the population will
be selected is unknown and cannot be determined. Non-probability sampling is based
on the judgment of the researcher (Diamantopoulos and Schlegemilch, 1997). Non-
probability sampling methods take less time, are more convenient and cheaper than
probability sampling methods to implement.
This has led to non-probability methods being preferred, especially in market research
and opinion surveys, where speed is of the essence. Non-probability sampling methods
do not allow for generalization outside the group of sample units and can only be evalu-
ated subjectively.
3.6.1.1 Convenience Sampling
In convenience sampling, the sample is drawn from a section of the population that is
readily accessible or available to the researcher.
Only those people who are at the same place at the same time as the researcher stand
a chance of being selected for an interview. In this case, the sample is not representa-
tive of the population and no reliable generalizations can be reached. Merely increasing
the sample size does not make the sample more representative because only the sam-
pling method can affect a sample’s representation. This sampling method is particularly
useful in exploratory research in which ideas and insight are more important than scien-
tific objectivity (Tustin,Lithelm, Martins and Van wyk, 2005)

37
3.6.1.2 Judgment Sampling
In judgment sampling, the sample elements are selected subjectively and deliberately
by the researcher to be representative of the population. For example, a researcher de-
liberately selects a group of business people for a sample, based on various criteria and
the researcher’s own judgment.
The researcher may believe that the sample selected is representative of the population
or has the best knowledge and experience of the research subject. A shortcoming of
this method is that different ‘experts’ have different opinions about which population
elements should be selected. Judgment sampling is particularly useful when large sam-
ples are not necessary, for example in pre-testing of questionnaires, pilot studies, and
exploratory studies where only ideas and insights generated (Saunders et al., 2000).
3.6.1.3 Snowball Sampling
Snowball sampling is a method of judgment sampling, which is used when samples of
special populations are needed. In this case, the researcher deliberately selects a num-
ber of respondents with characteristics that are specifically required. These respondents
are then used as informants to identify other individuals with the same characteristics
(Saunders et al., 2000).
3.6.1.4 Quota Sampling
Quota sampling is a combination of convenience sampling and judgment sampling. The
researcher uses census data (or other available sources) to classify the population ac-
cording to pertinent characteristics such as age, income, sex or geographical area.
These elements are known as control variables.
The researcher then determines the sample so that the quota (proportion) of sample
elements with certain characteristics is more or less the same as that of elements in the
population. The sample quota is then divided among the interviewers, who have to try
and find respondents who meet the required characteristics. Quota sampling is faster
and less costly for surveys than probability sampling methods. The cost of a quota
sample depends on how many control variables were applied when classifying the
population: the less limiting the control variables, the lower the cost, although also the
greater the risk of selection bias. The quality of the data obtained is to a large extent in-

38
fluenced by the fact that interviewers use their own judgment or discretion when select-
ing respondents and because of the degree of control over the fieldwork (Parasuraman
et al., 2004).
3.6.2 Probability (Random) Sampling
In probability sampling, each unit of the population has a known positive (non-zero)
probability of being selected as a unit of the sample (Tustin et al., 2005).
3.6.2.1 Simple Random Sampling
This is a process in which units of the population are selected individually and directly
by means of a random process. The selection is done in such a way that each unit has
the same probability as any other unit in the population of being selected. Thus, each
element of the population has a known and equal chance of being selected for the sam-
ple (Parasuraman et al., 2004).
A simple random sample can be drawn with or without replacement. A simple random
sample without replacement can be obtained as follows: a specific number of elements
is drawn one by one from the elements of the population all the remaining elements in
the population have the same probability of being drawn. Sampling with replacement is
when a selected element is noted and put back into the population before the next ele-
ment is selected. In sampling without replacement, a selected element is not put back
into the population before the next element is selected. Any element can be selected
more than once in sampling with replacement and only once in sampling without.
For simple random sampling to be employed in practice each element in the population
must be clearly and unequivocally identifiable and a list of all population elements
(sample frame) must be available or be complied.
The list is used for selecting and identifying the sample elements. When the population
elements are people, sufficient information must be available about each person so that
they can be identified (Zikmund, 2000; Parasuraman et al., 2004).
3.6.2.2 Systematic Sampling
In systematic sampling, the sample elements are drawn systematically from a complete
list of the population elements. Assuming that the population consists of N elements,

39
numbered from 1 to N, and that N = nk, where n indicates the sample size and k is an
integer.
A systematic sample size n consists of an element that has been drawn randomly from
the first k element on the list and every k th element thereafter. The selection of the first
element of the sample automatically determines the whole sample (Proctor, 2000).
3.6.2.3 Stratified Sampling
Stratification is a two-step process. First the heterogeneous population is grouped into
homogeneous strata that are mutually exclusive (i.e. every element is assigned to only
one stratum) and comprehensive (i.e. no population element is excluded). Then a ran-
dom sample of elements is drawn independently from each stratum using either random
sampling or systematic sampling. Effective stratification requires knowledge of the com-
position of the population, which can be stratified according to variables such as sex,
age, income and level of education. If various stratification variables are available, se-
lect those stratification variables that are possibly related, or have the closest relation to
the variables being studied, and that will represent the population (Wiid and Diggines,
2009).
Stratified random sampling is used when:
a. the population is heterogeneous with regard to the variable or characteris-
tic being studied and is associated with the elements of the population and
b. the population can be divided into strata that are all more homogeneous
with regard to the variable that is being studied than the population as a
whole. Elements in the same stratum must be more homogeneous or simi-
lar and the strata may not overlap.
In other words, an element may only be included in one stratum and the different strata
together make up the whole population.
There are a number of reasons for using stratified random sampling:

40
a) Through better grouping of the elements of the population into strata, a more
precise estimate of the population parameter (for example, the average spending
pattern of households) is obtained from the sample data.
b) A far smaller sample size is needed to obtain the same precision in estimating
the population parameter using random stratified sampling rather than simple
random sampling from the unstratified population.
Stratified sampling guarantees better average representation of the population in the
sample. The bigger the stratum and the wider the variation of variables within the stra-
tum, the greater the proportion of elements allotted to it (ibid).
3.6.2.4 Cluster Sampling
Research often requires that a sample be drawn from populations for which it is difficult,
impractical or even impossible to compile a sampling frame of the elements. For exam-
ple: the population of a city, a province or a country, or all school pupils in the country.
In such cases, it is necessary to design a more complex sample.
Cluster sampling involves two steps:
a) The total population is divided into mutually exclusive and comprehensive groups
called clusters.
b) A random sample of elements is drawn from each of the selected clusters, using
one of two approaches. Single-phase cluster sampling is when all the elements
in the clusters (that are chosen at random) can be used as sample elements.
Two-stage sampling is when a random sample of elements is selected from each
cluster.
Cluster sampling is often used in practice. The reason for this is twofold:
a) There is often no comprehensive list or sample frame of the population elements
that can be used for drawing a random sample.
b) Even if a complete list of the population elements is available, cluster sampling is
often necessary for economic and practical reasons.

41
Cluster sampling requires some knowledge of the population’s composition. The popu-
lation must be divided into mutually exclusive and comprehensive groups before select-
ing a cluster. The more heterogeneous the composition of the clusters of the population
elements, the smaller the standard error of the estimates will be. The clusters should be
as heterogeneous as the population itself (Wiid and Diggines, 2009).
Although both stratified and cluster sampling divide the population into mutually exclu-
sive and comprehensive subgroups, the criteria used are different. In fact, the two are
diametrically opposed: cluster sampling requires heterogeneous clusters, while stratified
sampling requires homogeneous strata.
For practical and economic reasons, clusters are normally formed by grouping geo-
graphically adjacent households, which means that the elements tend to be more ho-
mogeneous or similar than elements that are situated further apart. Consequently, in
general a small cluster size produces more precise estimates but also costs more to
survey. When selecting the size of a cluster, the researcher has to make a compromise
between precision and cost, as well as look at the practical or administrative considera-
tions (Hague, 2002).
3.6.2.5 Multi-stage Sampling
Multi-stage sampling draws samples in different stages: the researcher first divides the
population into various groups or clusters of elements and then draws a representative
sample using the random selection method (Hague, 2002).
3.7 SAMPLE SELECTION �
Tustin et al. (2005) define a sample as a subset of a population (or universe). Within this
context a population is defined as the total group of people or entities from whom infor-
mation is required. There are many misconceptions and generalizations about the re-
quired sample size. For example, that the sample size is a specific/fixed proportion of
the population, or that an increase in sample size leads to a corresponding increase in
accuracy (Hague, 2002).

42
The sample size necessary to reflect truly the value of the population parameter de-
pends not only on the population parameter but also on the behavior variable in the
population. Therefore, it is fair to assume that the standard error and consequently the
confidence level will have some determining effect on the sample size.
Deciding which sample size to use is often a case of judgment rather than calculation.
Therefore researchers must choose a sample that is big enough to yield a relatively
precise estimate of the population values, but at the same time can be executed eco-
nomically and practically.
In consideration of:
a) The foregoing literature
b) The small size of the Beatrice –Marirangwe dairy farms community
c) The quantitative part/aspect of the research
d) And the fact that this was a case study,
the researcher intended to deal with every of the sixty farmers in the target area. Unfor-
tunately this was not to be as discussed in the limitations elsewhere in this chapter.
3.8 DATA COLLECTION �
Data collection is nothing more than planning for and obtaining useful information on
key quality characteristics produced by your process. The issue is not how do we collect
the data but how do we obtain useful data. The data is collected in order to establish a
factual basis for making decisions. Data collection improves decision making by helping
you focus on objective. This study uses primary data gathered from questionnaires and
personal interviews to collect information on; milk production, production costs, record-
43
keeping activities, technologies adopted, general farm and farmer statistics and collabo-
ration of farm with its external environment. Secondary data was also used.
This includes dairy farm records and literature done from previous studies on the cho-
sen study area.
3.8.1 Questionnaire
The questionnaire was used as a data collection instrument because of its applicability
to the survey research design. Its purpose is to collect accurately and reliably specific
qualitative and quantitative information.
Parasuraman et al. (2004) defined a questionnaire as, a set of questions designed to
generate the data necessary to accomplish a research project’s objectives’. Designing a
questionnaire is difficult. It is very easy to ask questions but difficult to ask the right
questions. A poorly designed questionnaire can be disastrous for any research, irre-
spective of a good sample, well trained interviewers and well implemented, sophisti-
cated statistical techniques. When deciding what type of questions to include in the
questionnaire, the researcher must consider the respondent’s possible reaction or ex-
pected answer. This will help determine the best question/response format to use (ibid)
The researcher used structured questions. The researcher allowed for flexibility in re-
sponses, in that, some responses were structured, but in other cases they were not
structured.
a) Structured questions with structured responses.
The purpose of these questions was to collect factual information or to obtain a
point of view on a matter of example, ‘agree’ or ‘disagree’. Multiple choice ques-
tions were alternative answers are provided were also used and like dichotomous
questions, is used to obtain information that can be divided logically into rea-
sonably fixed categories. Ranking questions which assign a relative value to a
series of aspects were also made use of by this researcher. The respondent was

44
asked to rank aspects into a sequence. Scaled questions which are those where
the respondent answers questions by marking a certain point on a scale were
used. In a scaled question the respondent’s actual position is measured on the
attitude continuum.
b) Structured questions with unstructured responses
With this type of question, the open-ended questions encourage respondents to compile
and express their own responses freely, which the lack of a fixed response category
makes possible. This type of question is used particularly to obtain reasons for specific
attitudes or views the respondent may have (Tustin et al, 2005).
3.8.2 Personal Interviews
The research also used personal interviews. These happened to be face-to-face and
the interviewer asked the respondent certain questions on a dairy farm performance. In
a few cases the researcher had to phone the farmers to gather information, particularly
where people on the ground were not privileged to know the issues at stake.
Interviews are a data collection technique involving the researcher following a set pro-
cedure in seeking for answers to a set of predetermined questions through one on one
interaction with the respondent (Kothari, 2008). (Kothari, 2008; Saunders et al, 2003;
Kumar 2005) all have recommended interview method as the most suitable tool in case
study researches. Although many authors have recommended interview method, there
is no one have mentioned that it is the best method. Usually interviews are carried out in
a structured, unstructured and semi-structured way where quality of the information ob-
tained depends upon the ability of the interviewer.
However, Proctor (2000) argues that structured interviews yield data that is easier to
analyse compared to unstructured interview data.
3.8.1.1 Structured Interviews
This approach entails the use of questionnaires based on a predetermined and identical
set of questions. The researcher asks the questions as s/he reads them. Voice control
is important to avoid elleciting biased responses. (Saunders et al, 2000; Kumar 2005

45
and Greener, 2008). The purpose of the structured interviews is to maintain consistence
of findings and also obtain quantitative data.
3.8.1.2 Semi-Structured Interviews and Unstructured Interviews
Under semi-structured interviews the researcher will have a list of areas to be covered
using standard questions although the researcher may skip or add to some of these
questions or areas, depending in order to get more clarity. Used in greater detail in this
case study were unstructured interviews as advised by Kothari (2008); where informal
discussions were used to investigate in-depth on specific areas from the subject in an
unstructured way. However Kothari (2008) infers that even in unstructured interviews
the researcher would have a pre-determined range of areas to be discussed in the in-
terview.
Therefore, for maximum effect, the researcher used both structured and unstructured
interviews were used to collect data for this case study.
3.8.1.4 Advantages of using Interviews
• More information in greater depth can be obtained.
• The response success is guaranteed as the respondent is likely to answer to all
the questions except those the researcher omits due the discussion environment.
• There is greater flexibility because the researcher can change or drop a question
when necessary
• Personal information can be obtained easily in this method.
• The interviewer has an opportunity to catch the respondent by surprise and thus
able to record the impulse reactions.
• The language or tone of the interview can be changed according to individual’s
literacy.
• The interviewer can obtain additional information about respondent's personal
characteristics that can be used while interpreting results Kothari (1985).
3.9 RELIABILITY AND VALIDITY
�

46
3.9.1 Reliability
Saunders et al. (2003) defines reliability as the degree to which the data collection tech-
niques or analytic techniques will yield consistent results. In this study validity and relia-
bility was observed by pre-testing the questionnaire in the pilot study. Factors affecting
reliability like clarity, specificity of items on the questionnaire and the length of the ques-
tionnaire were considered. Items were made as simple as possible and to the point
For validity, pre-testing helped to ensure the thoroughness and completeness of the
questionnaire. Content validity, which entails making sure the major dimensions of the
subject matter are covered was ensured through cross checking the content of the in-
struments against the stated research questions.
3.9.2 Validity
According to Cooper and Schindler (2011) validity is the extent to which a test meas-
ures what we actually wish to measure while reliability has to do with the accuracy and
precision of a measurement procedure. There are three major forms of validity – con-
tent, criterion related and construct validity.
3.9.3 Content validity
The content validity of a measuring instrument is the extent to which it provides ade-
quate coverage of the investigative coverage of the study.The data collection instrument
should adequately cover the topics that have been defined.
3.9.4 Construct Validity
According to Cooper and Schindler (2011) when evaluating construct validity both the
theory and the measuring instrument are used. Firstly the way in which a construct a
defined must correspond to an empirically grounded theory.
Then if a known measure of the construct is available then the results from the new in-
strument and those obtained using the measure can be correlated.
47
3.10 PRACTICAL AND RESEARCH ETHICS
According to Cooper and Schindler (2011, p.32), “ethics is made up of norms or stan-
dards of behaviour and our relationships with others. The goal of ethics is to ensure that
no one is harmed or suffers adverse consequences from research activities” This is
echoed by Saunders et al. (2010) who argues that research should not embarrass,
harm or disadvantage the research population.
Diener and Crandall (1978,as cited in Bryman and Bell, 2006) divide ethical issues into
four recurring ones: Whether there is harm to participants, lack of informed consent, in-
vasion of privacy and deception involved.
According to Coldwell and Herbst (2004), generally three parties are involved in re-
search process:-
The researcher
The respondent
The user of the research results
The rights and obligations of the researcher are fairness, accurate reporting of findings,
confidentiality, disclosure of defective information and or erroneous conclusions and not
stealing ideas from other research proposals.
The rights and obligations of the user are observation of ethics between buyer and sel-
ler, ethical relationships with research companies and open relationship with interested
parties.
In an attempt to address ethical issues, the following issues were taken into considera-
tion:-
a) The researcher sought authority from the Zimbabwe National Dairy Farmers As-
sociation and ARDA to carry out the research and an undertaking to up hold their
mutual rights and obligations will be made.
b) The rights and obligations of the respondent are to be honest, privacy, full disclo-
sure of purpose of research.

48
c) The respondents were requested to give their verbal endeavor to be truthful with
their response.
3.11 DATA PROCESSING, ANALYSIS AND PRESENTATION
When the fieldwork was completed, the data was entered, coded and cleaned using
Epi-Info. A Statistical Package for Social Scientists was used to run the analysis of data.
The information gathered was presented using tables, graphs. These findings were laid
out in Chapter 4, together with their detailed discussion.
3.12 LIMITATIONS OF THE STUDY �
This research study has the following limitations;
1) The study may not be representative of dairy farmers in Zimbabwe.
2) The study was limited by financial constraints. A case study approach was used
instead in order to reduce costs. The researcher had to work within a tight budget
which could have compromised information gathering and processing.
The use of email could have reduced costs (such as stationary, travel and sub-
sistence of the researcher and research assistant) but could not be adopted as
farmers’ email addresses were not known.
3) The researcher drove out to the farms to administer data collection and the fol-
lowing challenges were imminent:
a) Farmers were visited without notice. It was difficult to make appointments.
b) Because of absence of appointments some farmers were never dealt with
c) A few farms were in accessible by a standard vehicle
4) Political hangover among farmers. This elicited different behaviours among farm-
ers. To some, unannounced visitations made them suspicious and therefor timid.

49
To others, it made them overzealous and over expectant. Tis could have affected
their responses.
3.13 CHAPTER CONCLUSION �
The Chapter explored how research instruments were developed, methods of data col-
lection and corresponding justification of the methodology adopted and the reason for
rejecting other methods. The research design and reasons of its choice was also dis-
cussed. The following chapter presents and discusses the research findings.
50
CHAPTER FOUR �
�
4.0 RESEARCH FINDINGS AND DISCUSSIONS
4.1 INTRODUCTION �
This chapter presents the research findings from the study population. The data was
captured using EPI information system and data was analysed using SPSS version 16
by the researcher. In addition, the researcher used Microsoft excel to analyse some of
the data. The presentation of the research results was done by using graphs and tables
and explained using percentages. Reference was also made to the literature review.
The results were based on the views of the sample population that took part in the sur-
vey.
The overall objective of the research was to analyse the impact of ICTs in dairy produc-
tion. The specific objectives of the study were to:
a) identify the ICTs adopted by farmers, establish the factors affecting adoption of
Agro-ICTs,
b) ascertain the extent to which farmers are utilising ICTs in their day-today production
and financial information.
c) determine the extent dairy farms are collaborating with other farmers and other play-
ers in the milk production value chain through ICTs among dairy farmers in Masho-
naland East Province of Zimbabwe.
d) to design/formulate an Agro-ICT architecture that may be recommended to promote
national dairy production.

51
4.2 RESPONSE RATE �
Sixty (60) questionnaires were used to collect data from Mashonaland west dairy farm-
ers. All questionnaires were targeted to all farmers in target, and forty four (44) were
successfully completed giving a response rate of 73.33%. This rate is a fair rate for re-
search conclusions to be rendered valid.
4.3 GENERAL INFORMATION �
4.3.1 Age Groups of Survey Participants
The research investigated the age groups of the respondents that participated in the re-
search. The findings are presented in the figure below.
Figure 4.1: Age groups of survey participants

52
According to 18.18% of the respondents they stated that they were aged between the
ages 26 and 35years, 27.27% were aged between 36 and 45 years while 13.64% stated
that they were aged between the ages 46 and 55 years. Furthermore according to
22.73% of the large and small scale dairy farmers in Marirangwe and Beatrice area they
stated that they were aged between 56 and 65 years and 18.18% indicated they are
aged above years. The ages of the respondents were above the legal majority age to
warrant the findings of this research.
4.3.2 Level of Education
The level of education of the study participants is presented in the figure below.
Figure 4.2: Level of education
The figure above reveals that 18.18% of the respondents were educated before ordi-
nary level and 31.82% indicated they were educated up to ordinary level. The same
percentage as pre-ordinary level indicated they were educated up to certificate level.
On the other hand another minority of 4.55% respondents stated that they were edu-
cated up to degree level, making it the same with those that have Masters Degrees.
53
Lastly, in between the two extremes 22.73% stated that their highest education level
was up to diploma level.
This shows that the respondents are fairly educated, with a great proportion having at-
tained a minimum of ordinary level of education, and are therefore presumed to give
valid responses for the research. This is at varience with the Riveria (1996) assertion
that farmers in developed countries have little education.
Garforth, Angell, Archer, and Green (2003), argued that the use of ICTs requires a
farmer capable of making an efficient use of websites’ resources, and a farmer capable
of independently screening the available information for relevancy and applying the in-
formation gained. Farmers ought to be capable of critical thinking, to evaluate the infor-
mation availed and to seek for alternatives.
4.3.3 Training in Agriculture
The research further investigated if the respondents acquired formal training in agricul-
ture. The findings are summarized in the figure 4.3 below.
Figure 4.3: Training in Agriculture

54
Figure 4.3 above shows that 45.45% respondents indicated they have not received any
formal training in agriculture. On the contrary 54.55% majority of the dairy farmers in the
area stated they have received formal training in agriculture. Information extracted from
farmers during interviews indicated that, what the farmers meant by formal training are
attendance courses provided by the Dairy Development Programme, Farmers Associa-
tions and some suppliers. Further probing revealed that this training was dairying-
oriented.
This implies that the majority of the small and large scale farmers in Marirangwe and
Beatrice area have received formal training in dairy production. This is in line with Bal-
lantyne (2002), who asserted relevance of information is key in addressing farmers’
problems.
Having undergone some trainings in dairy production farmers are ready to receive pro-
duction information and advice though ICT programmes. Llewellyn (2007) argued that
the degrees of literacy and of formal education are critical elements in determining the
pattern of information flow and its impact.
On further probing through interviews, the farmers demonstrated that exposure to train-
ing has improved their production knowledge although they required a lot more knowl-
edge. They proffered that the dairy industry is being faced by other challenges beyond
the production skills which included, but not limited to:
a) high cost of dairy animals
b) high input costs, particularly dairy feeds
c) high electricity tariffs and frequent blackouts

55
4.3.4 Classification of Dairy Farming Business
Respondents were asked by the researcher the classification of their farming business.
The views of the respondents are presented in the figure 4.4.
Figure 4.4: Classification of dairy farming business
The majority of respondents representing 54.55% indicated that their dairy farming
business is large scale. The other 45.45% farmers stated that their farming business is
small scale.
This is contrary to expectations, where twenty one farmers (representing 35% of a
population of 60) are from Beatrice (a large scale area) and thirty nine (65%) are from
Marirangwe (a small scale area). This shows two things: that, either the research did not
stratify the dairy farmers according to scale, or that some small scale farmers have
grown and now consider themselves as large scale farmers.
The former assertion is correct as no sampling was done. The research targeted all the
farmers in the Case Study area. The latter assertion is difficult to conclude, as neither
stratification nor sampling was done.

56
On further investigations through interviews, farmers were not aware how they are
classified into small scale or large scale. One farmer opined that they were just told that
they are small scale. Yet another farmer said, “All I know is that I’m a farmer, whether
I’m big or small is neither here nor there…..it doesn’t help me in anyway”.
Adhiguru, Birthal, and Ganesh Kumar (2009), argued the size of the enterprise affects
the amount, quality and sources of information. This test would be difficult to apply in
this case as no stratification was done.

57
4.4 FARM PRODUCTION STATISTICS �
4.4.1 Breed of Cows and Breeding Herd Size
From interviewing the farmers, it was evident that the predominant dairy cattle breeds
are the Holstein-Friesian breed, followed by the Jersey and Red Dane. There are also
various crosses of these breeds. Of particular interest is that some small scale farmers
use the indigenous Mashona and their crosses in their dairy projects.
The breeding herd sizes of the dairy farmers in Marirangwe and Beatrice area are pre-
sented below.
Figure 4.5: Breeding herd size
According to 22.73 % of the dairy farmers in the case study area indicated that their
herd size is less than 10 cows, and 27.27% are those who own between 10-20 cows. A
further 18.18% of respondents said their herd size is between 20-50 cows, whilst 4.5%
own herd sizes between 75-100 cows.
On the other hand 22.73% of the dairy farmers in the area added that their breed size is
more than 100 cows.

58
Matambalya and Wolf (2001), studied 300 dairy farmers in Kenya and Tanzania to ex-
plore whether use of ICT can enable dairy farmers to improve their herd size, competi-
tiveness and performance. Their survey found a positive correlation between average
breeding herd size and use of advanced ICT.
The rate of genetic progress depends on the size of herds. The larger herds make pos-
sible more accurate predictions of differences in genetic potential between bulls used in
the artificial insemination. This implies that farming systems of small size may see
slower rates of genetic progress, (Balaji et al., 2007).
In order to get higher rates of genetic progress, larger herd sizes are required, and thus
small herds have to be transformed to larger herds through breeding.
The use of the local Mashona breed can be expedited in cross-breeding programs with
the exotic breeds to take advantage of the breed’s natural adaptation to the local envi-
ronment, to produce robust high yielding breeds. It is also envisaged that ICT should
play a major role in livestock breeding since such programs handle massive data (Balaji
et al., 2007).

59
4.4.2 Average Milk Yield
The researcher investigated the average milk yield per cow per day for the dairy farmers
in Marirangwe and Beatrice area. The results from the investigation are presented in the
figure 4.6
Figure 4.6: Average milk yield per cow per day
Some 31.82% of respondents said their production is less than 10 litres per cow per day
while the majority of the dairy farmers in Marirangwe and Beatrice area (54.55%) indi-
cated that their average milk yield per cow per day is 10-20litres. A further 9.09% re-
spondent said their average milk herd per cow per day is 20-30litres. A mere 4.55% of
survey participants indicated that the average milk per cow per day is between 30-
40litres. On the other hand 9.09% respondents did not respond.
This shows that the majority 86.37% (54.55%+31.82%) of farmers achieve below twenty
litres of milk yields per cow per day. These figures tally with the CSO and Dairy services
(2012) observations. These production levels are too low particularly for large scale
farmers (van den Ban, 1998). Dairy services (2012) attributed the low milk yields to high
production costs, particularly the cost of feeds.

60
With the proliferation of ICT, dairy farming is intended to embrace the use of these
technologies to improve on; milk production, production costs (Bowonder, Gupta, and
Singh, 2007), record-keeping, general farm statistics and collaboration of farm with its
external environment (van den Ban, 1998).
It is the researcher`s contention that there is scope for improving dairy productivity in
terms of daily milk yields and herd sizes, and that such developments should be lever-
aged on ICT. This assertion was supported by Ali and Kumar, (2011). Stoner (2010)
added that productivity response to information flow is greater in the dairy farming sys-
tems than in other sectors of agriculture.
4.4.3 Milk Markets
The study sought to find out the market for milk to dairy farmers in Marirangwe and Bea-
trice area. The findings from the investigation are presented in figure 4.7
Figure 4.7: Where farmers sell their milk
61
From the figure above it shows that 22.73% dairy farmers sell their milk to Dairiboard
Zimbabwe Limited, and similarly to the local community. Also from the findings 4.55% of
dairy farmers in the area stated that they sell their milk to Nestle Zimbabwe. The major-
ity of the respondents as evidenced by 50% respondents said they sell their milk their
milk to other markets which include; Cheeseman, TN, Innscor, Kefaloes and
Marirangwe milk collection centre.
ICT investments and applications in agricultural and/or rural activities have payoff po-
tential in research activities, extension activities, production and processing and market-
ing /trade (Bowonder, Gupta, and Singh, 2007).
ICTs strengthen farmer’s capacities and better represent their constituencies when ne-
gotiating input and output prices Llewellyn, (2007). Stienen et al, (2007) argued that
mobile banking facilities offer further scope to cut down on costs and facilitate stimulate
business transactions.
4.5 COMPUTER AND TECHNOLOGY �
4.5.1 Utilisation of ICT Hardware on Farms
The ICT hardware found on dairy farms in the Beatrice- Marirangwe area are presented
in the table below based on the views from the research participants.
Table 4.1: ICT hardware usage on the farms
HARDWARE ITEM USAGE
Cell phone 90.09%
Laptop 45.5%
Desktop Computer 36.4%
i-Phone tablet 18.2%

62
The majority respondents (90.09%) indicated that the ICT hardware they have on their
farm is a cellphone and 45.5% indicated they have a laptop as ICT hardware on the
farm. Also the research findings reveal that 36.4% of the survey participants indicated
that they have a desktop computer, while the minority as represented by 18.2% respon-
dents said they have an i-phone tablet. This implies that the predominant ICT hardware
on the dairy farms in the area is a cellphone, while laptops other ICT gadgets are pre-
sent but in lower frequencies.
From a closer analysis it would appear as if:
a) farmers have various combinations of these gadgets
b) the prevalence of gadgets is based on cost of gadget and thus affordability
This observation is in agreement with Balaji, Meera, and Dixit (2007) assertion who
said mobile technologies are coming in to supplement the traditional television and radio
as primary broadcast technologies in remote communities.Leeuwis (1993) stresses the
importance of ICT hardware in dairy farming in that it institutes the multidirectional data
flow between different IT components.

63
4.5.2 Operation of a Computer and Articulation of ICTs
Respondents were asked by the researcher if they have anyone on the farm that can
operate a computer and could articulate ICTs. The findings are summarized in figure 4.9
Figure 4.8: Operation of a computer
Figure 4.8 shows that 45.45% respondents indicated that they do not have anyone on
the farm that that can operate a computer and articulate ICTs. On the other hand
40.91% dairy farmers in the area stated that they have someone on the farm that that
can operate a computer and articulate ICTs. Some 4.55% of responses stated that they
are in the process learning operating computers. This implies that only an insignificant
number of dairy farmers in Beatrice- Marirangwe area can operate a computer and
articulate ICTs.

64
While the uses of digital technologies, especially for communicating agriculture-related
information, has been increasing rapidly in developed and emerging market economies
the ICT literacy of farmers in the sub-region has remained very low (May, Karugia and
Ndokweni ( 2007).
4.5.3 Connectivity
The research investigated the ways in which dairy farms in Beatrice- Marirangwe area
connect to the internet. The responses are analysed and presented in the table below:
Table 4.2: Connection to the internet
WAYS OF CONNECTING TO THE INTERNET PERCENTAGE RES-
PONSES
Analogue modem (dial up via standard phone line) none
Integrated Services Digital Network 4.5%
DSL (ADSL, SDSL, VDSL ) 4.5%
Cable modem none
Other narrowband/other broadband 40.9%
Table 4.2 above shows the ways in which dairy business connect to the internet. Only
4.5% indicated they connect via Integrated Services Digital Network, and the same pro-
portion goes for DSL (ADSL, SDSL and VDSL). The majority respondents as indicated
by 40.9% stated that their business connects to the internet using other narrowband or
broadband. On the contrary none of the survey participants indicated they use cable
modem and analogue modem (dial up via standard phone line). This indicates that con-
nectivity is reliant upon the availability on of some service provider networks. In the ab-
sence of any network no internet connectivity is possible as it appears that landline te-
lephony is non-existent.
Through personal interviews the majority of farmers concurred that there is a dearth in
connectivity. This is in synch with literature Riveria (1996). In contrast Van den Ban
(1998) highlighted that farmers require access to varied, multisource, context-specific,
faster and multi-directional communication.
65
In addition to low internet connectivity infrastructure in remote areas; May, Karugia and
Ndokweni (2007) had noted that poor policies hindered progress in the use of ICTs in
agriculture.
4.5.4 Farm use of Websites
An investigation was carried out to determine the extent to which dairy businesses in
Beatrice- Marirangwe area have a web presence. Figure 4.10 presents the findings;
Figure 4.9: Web presence
Figure 4.9 shows that the majority respondents (81.82%) indicated they do not have a
web presence. On the other hand 18.18% of the dairy businesses in the area agreed
and stated that they have a web presence.

66
Such a state of affairs is not desirable in a sector poised to buttress a national economy.
Balaji, Meera, and Dixit (2007), posit that information made available at government,
university, and farmer’s organizations websites may considerably reduce the time be-
tween the recognition of need for information and the access to it.
4.5.5 Use of Dairy Production Software
The study investigated if the dairy businesses use any dairy production software. The
result is summarised below:
Figure 4.10: Use of dairy production software
According to figure 4.10 above, 81.82% of respondents indicated that they do not use
any dairy production software. On the contrary, minority respondents (18.18%) agreed
that they use dairy production software.

67
The fact that dairy farming systems probably are the most complex of the agricultural
production systems (as alluded to in the Literature Review), and also that response to
information flow is greater in the dairy farming system than in other components of the
agricultural sector, strongly suggest that the dairy sector stands to benefit more from
embracing ICTs.
Some of respondents revealed during interviews that they were not aware of the exis-
tence of such programmes. Others said they would not afford them.
4.5.6 Use of ICTs in Conducting Dairy Farm Business
The research investigated the use of ICTs in dairy businesses in the area. The results
are shown below:
Figure 4.12: Use of ICTs in conducting dairy farm business
The study findings in figure 4.11 reveal that 63.64% study participants indicated that
they do not use ICTs in conducting dairy farm business.

68
On the other hand 18.18% respondents stated that they use ICTs in conducting dairy
farm business. This section is better read with the one that follows.
4.5.7 On-farm Internet Marketing
Research sought to find out if dairy businesses in Marirangwe and Beatrice area receive
orders for goods and services via the internet. The chart below presents the study find-
ings.
Figure 4.12: Sales via the internet
The majority respondents as shown by 90.91% in figure 4.12 indicate that they do not
receive orders for goods and services via the internet. On the other hand 9.09% re-
spondents agreed and stated that they make sales over the internet
For the two sections above, such low statistics represent loss of opportunities to farm-
ers. The conclusion and recommendations of this study will be incomplete if no refer-
ence is made to this.

69
4.5.8 Internet Business Transactions
To those dairy farm businesses that use the internet, the research sought to find out the
business activities that farmers transacted over the internet.
Table 4.3: Business activities transacted over the internet
BUSINESS ACTIVITIES PERCENTAGE RSPONSE
For getting information 36.4%
For performing internet banking or accessing other financial ser-
vices
27.3%
For sending or receiving emails 50%
For dealing (interacting) with government organisations/public
authorities
4.5%
For delivering products online 5.5%
For providing customer services 13.6%
The most popular utilization of internet is for communication through e-mailing and mo-
bile banking. These may be confounded with personal use as ordinary people who are
not in business also use the internet for these purposes. The high frequencies may
therefore not be indicative of ‘business use` in that strict sense.
As enterprise managers, dairy farmers attempt to organise available resources to
achieve their business goals. The natural systems in which they operate are highly un-
certain due to physical resource variability on farm in addition to variability in off farm
factors such as international prices for dairy products. Through their management
strategies, farmers aim to exert control over on-farm system variability. Control is a key
management function, along with planning and implementation (Parker, 1999) and in-
volves monitoring, comparing, and correcting management plans. Information gathering
is a vital component in the control function and in reducing system uncertainty. A re-
sponse rate of 36.4% is too low for such an important function as seeking business in-
formation.

70
The great question that begs to be answered then is; what should be done, with regards
to ICT systems as planning and control functions of dairy management, in the pursuit to
gather and organise information for decision making by farmers?
4.5.9 Benefits of using ICTs
The research investigated the benefits of the system being used by dairy farmers in the
case study area. The question referred to the benefits, as recognized by the farmer, of
the mode of connecting to the internet and their attendant use of the internet. The
responses were varied depending on the farmers’ connectivity but some of the common
benefits mentioned included:
a) low cost
b) efficiency
c) ease of connection
d) flexibility
e) hands on personal interaction
f) improved access to information
g) knowledge gain and sharing
h) instant responses
i) and environment friendly
The question was meant to gauge if farmers appreciated any downstream benefits
from utilising ICT, and quite clearly they did. Sambamurthy, Bharadwaj and Grover
(2003) advocated a network of factors that reflect the integration of IT into critical
organizational processes and business capabilities. In particular, they
conceptualized the organizational impacts occurring through ICT-enabled agility
capabilities, digitized organizational processes and knowledge management
systems. Barua et al. (1995) proposed a theory of ICT complementarities to argue
that the initial effects of IT should occur at the level of organizational processes that
use the IT resources.

71
4.5.10 Inhibitions on Using ICT in Dairy Business
The farmers were asked to classify negative inhibitions on using ICT in their dairy busi-
ness. The results are shown in Table 4.4:
Table 4.4: Classification of negative inhibitions on using ICT in dairy business
NEGATIVE INHIBITIONS PERCENTAGE RESPONSE
Lack of skills/understanding 59.1%
Lack of confidence in using ICT 13.6%
Lack of privacy 5%
Cyber crimes 14.1%
Online vulnerability to children 9.1%
Table 4.4 above shows that the majority of the survey respondents (59.1%) classified
lack of skills/understanding as a negativeinhibition in using ICT in dairy business. Also
13.6% of respondents added that lack of confidence in using ICT on their dairy busi-
ness. Lack of skills denotes absence of knowledge. It tallies in tandem with low
(45.45%) rates of farmers who can use computers and high incidences (54.55) of farm-
ers who do not use ICTs in transacting business issues.
Five percent minority respondents argued that lack of privacy is a negative inhibition on
using ICT, 14.1% indicated cyber crimes and 9.1% indicated online vulnerability to chil-
dren is a negative inhibition in using ICT on their dairy business. These inhibitions are
not only restricted to agriculture as they cut across many sections of the community, for
example in the issue of accepting use of cellphones in schools. The lid on these nega-
tive inhibitions has to be effective, and this is a matter that should seize policy-making.
Roman and Colle (2003) argued on the need for intergarting ICTs to local and existing
patterns of communication.

72
4.5.11 Barriers in the Adoption and Use of ICTs by Farmers
The survey also investigated the farmers considered to be barriers in the adoption and
use of ICTs. The table below shows the perceived barriers in the adoption, use of ICTs
by farmers according to the dairy farmers who participated in the study.
Table 4.5: Barriers in the adoption and use of ICTs by farmers
BARRIERS PERCENTAGE RESPONSE
Lack of skills/confidence by farmers 36.4%
Reluctance by current staff 4.5%
Expenditure too high 68.2%
Not appropriate/no perceived benefits 9.1%
Technology changing too fast 19.1%
Security concerns (fraud/hacking/viruses) 5%
Table 4.5 above shows that 36.4% dairy farmers indicated that lack of skills/confidence
by farmers is a perceived barrier in the adoption and use of ICTs by farmers and 4.5%
said reluctance by current staff. The majority of the survey participants as represented
by 68.2% argued that expenditure too high is a barrier to the adoption and use of ICTs
by farmers. Moreover the results from the investigation revealed that 19.1% respon-
dents stated that technology is changing too fast and 5% minority highlighted that secu-
rity concerns (fraud/hacking/viruses) are barriers.
The result further reinforces the notion that lack of knowledge is a major factor in the
adoption and use of ICTs by farmers. While the costs of using ICTs are progressively
going down, the establishment costs of the systems remain high.
From all those interviewed cited, they cited telephony or cellular network and connec-
tivity as a major challenge in the area. Those that are connected to some networks
complained of persistent signal failures or blackouts.

73
4.5.12 Impact of ICT on Dairy Business
The table below tabulates the considered impact of ICT on dairy business.
Table 4.6: Impact of ICT on dairy business
IMPACT OF ICT PERCENTAGE RESPONSE
None 9.1%
Reduced costs of internal management processes 13.6%
Reduced time of internal processes 14%
Expanding geographic coverage of products 22.7%
Increasing product quality 18.2%
According to 22.7% of the dairy farmers who participated in the survey they consider
expanding geographic coverage of products as having an impact on ICT in the dairy
business. Moreover 13.6% respondents stated that the impact of ICT on their business
is through reduced costs of internal management processes and 14% consider re-
ducedtime of internal processes as the impact of ICT on their business. On the other
hand 18.2% dairy farmers stated that increasing product quality is considered to be the
impact of ICT on their business.
To further add to the research findings, Toyama (2010) adds that the roles played by
information in the course of dairy farming systems evolution, the changes in the sources
of information and in the bodies that utilized it, points to a large heterogeneity of poten-
tial bottlenecks. The latter depends upon social structure, culture dependent patterns of
cooperation, presence of research bodies, involvement of government institutions in the
provision of extension services, and of public health care. The degree of literacy and of
formal education are critical elements in determining the pattern of information flow and
is impact, as are the readiness for cooperation and the degree of technological devel-
opment.

74
4.6 CHAPTER SUMMARY �
This chapter analysed information which was collected through a questionnaire to ac-
quire information pertaining to the research objectives. Major issues that were dis-
cussed include farm production statistics, computer and technology in dairy farming.
The next chapter presents the conclusions and recommendations of the study.�
75
CHAPTER FIVE �
�
5.0 CONCLUSIONS AND RECOMMENDATIONS
�
5.1 INTRODUCTION �
This chapter presents the major conclusions and recommendations of the research
study. These are based on the research findings, analysis and discussions in the previ-
ous chapter. An area of further study is also proposed in this chapter to further analyse
the subject area.
5.2 CONCLUSIONS �
The study provides the following conclusions:
5.2.1 Research Objectives
All the five research objectives have been met. This comes out clearly in the recom-
mendations sections of this chapter. A national ICT architecture has been recom-
mended. Government has to play a pivotal role in policy formulation, network infrastruc-
tural development, setting up of an information centre and financing.
The information centres should then be used for networking and sharing of information
and knowledge.
5.2.2 Education and Training
On the positive side, the majority of farmers have a minimum of Ordinary Level of
education, and as such they are amenable to training. A greater proportion of them
have been exposed to training in dairy production. A major drawback is that they don’t
have computing skills.

76
A considerable proportion (54.55%) (13.64%+22.73%+18.18%) of the farmers are
above the forty five years age group. Most of them went through their education life-
time before schools and colleges had computers. Deliberate computer skills training
programmes for farmers are required.
5.2.3 Classification of Dairy Farming Business
Classification of dairying farming business into small scale or large scale is arbitrary. A
farmer chooses to call/classify themselves (whether small scale or large scale) what-
ever they deem fit of their own volition. There is no industry standard nomenclature.
Classifying farmers into these categories is important for research purposes, policy for-
mulation and special stakeholder interventions.
5.24 Farm Production Statistics
a) The breeding herd sizes of the dairy farmers are small. These are congruent to
and/or limited by such factors as finance capital, production skills, input costs and
utility tariffs. The net result is that they reduce the aggregate milk yields and re-
tard genetic progress.
b) The above factors also draw down on the average milk yield per cow per day.
The daily milk yields per cow are very low.
c) There are good bloodlines in the genetic constitution of dairy herds. The pure-
bred exotic lines alone are not suited for the local climatic environment. The ex-
otic breeds are not available in sufficient numbers to boost aggregate milk yield.
Their numbers need to be increased by importing semen for artificial insemina-
tion.
The local Mashona breed is not a high milk producer. The line is however good
for crossbreeding with exotic breeds to producer better adapted animals. Their
numbers can be multiplied by adoption of modern techniques such Multi Ovula-
tion and Embryo Transfer (MOET).

77
5.2.5 Dairy Market
There is a broad market base for the farmer’s milk. But the farmers are not linked
with the market players. There is need for information flow between the farmers
and the various market players in order for the farmers to compare and optimal
markets for their products.
5.2.6 Communication and Technology
The importance of hardware in ICT dairy farming in that it institutes the multidirectional
data flow between different IT components also between gadgets and people. Internet-
and mobile-based information gadgets are complementing television and radio as the
main electronic broadcast technologies used to reach rural and farm communities. The
prevalence of the cellphone as a major ICT hardware used on the dairy farms is by rea-
sons of costs. Cellphones are readily affordable. While other gadgets such as laptops, i-
phone tablets and desktop computer are other hardware also used by the dairy farmers,
they are available on an affordability and scalability basis.
The cause of low utilization rates of ICTs in the dairy sector, non-business-use of inter-
net, farm websites and dairy production software cannot be isolated and pointed to one
individual cause as it is a product of a matrix of factors that include:
a) lack of computing skills appreciation
b) lack of knowledge on available technologies
c) high cost of technologies
d) poor infrastructural network
e) lack of Government support on ICT
f) lack of national and sectorial ICT policies.

78
5.3 RESEARCH HYPOTHESIS �
For the avoidance of doubt the hypothesis has been re-stated:
Zimbabwe’s dairy production can be improved by increasing uptake of ICTs by
farmers.
The hypothesis cannot be rejected. The uptake of ICTs in the dairy sector remains very
low; hence the effectiveness of ICTs in this sector cannot be ascertained. The reasons
for the low uptake have been described in the previous section. In view of the foregoing,
the impact and/or benefits of ICTs have not been realized.
Not withstanding, the researcher still continues to argue that there is a lot of potential to
increase dairy production and competitiveness, but a lot of work still needs to be done
to increase uptake of the ICTs.
The following recommendations are proffered as a means to achieve higher ICT utiliza-
tion by dairy farmers and subsequently realize said benefits for the sector.
5.4 RECOMMENDATIONS �
5.4.1 The Government
The Government should promulgate well defined ICT policies. The policies should focus
on:
a) infrastructural network expansion
b) Government departments themselves adopting ICTs
c) Security concerns such as cyber crimes (hacking and fraud), privacy and unde-
sirable content

79
5.4.2 The Government Ministries
The ministry of agriculture, itself having embraced ICTs, should establish an agricultural
Information Centre. The Ministry(s) of ICT and information should be the advisors to the
ministry of Agriculture, as it leads in the setting up of the information centres.
The ministry of finance should source and make available the financial resources so re-
quired. The two ministries of Information and Communications should be merged to
synchronise policy. TheGovernment, through the merged ministry, should own the na-
tional infrastructural grid and users should pay tariffs.
5.4.3 The Information Centre
This agricultural information centre should have different specific units that relate to
each agricultural sector of which dairy production is one. The dairy information centre
should consist of:
a) Commercial ICT service providers
b) Universities- faculties of agriculture, animal sciences, veterinary sciences, busi-
ness studies and colleges of agriculture
c) Suppliers of dairy inputs
d) Buyers of milk and its products
e) Providers of extension services
5.4.4 Networking
Dairy farmers should be linked to the information centres and other extension advisory
services such as the Livestock production department (LPD), Agricultural Research and
Extension Services (AREX), the Veterinary Services department, Farmers associations
and Non-Governmental Organisations (NGOs) that work with the farmers in the field.
The same centres should be linked to commercial companies.
Commercial companies (suppliers of inputs and buyers of dairy products) should send
their product list and prices to the information centres to be packaged for access by
farmers. These information centres should prepare the required information for the

80
farmers. The dairy information centres should have call centres where farmers ask
questions and get responses real time.
5.4.5 Continuous Training and Development
Extension and advisory services should design deliberate training programmes for
farmers, both in dairy production and use of ICTs.
The extension service providers should be capacitated enough to be able to hire knowl-
edgeable consultants and experienced resource persons depending on the subject mat-
ter on the intended training sessions.
5.4.6 The National ICT Architecture
The foregoing recommendations have been summarised in the following diagram, and
the figure has been named as the National ICT Architecture.
81
�
)������!������������
*����������������+"����������������"���
,����������$����������"���-�������
.,/��������� ���������
+"����������0��������
%�������0��������
.,/�0��������
.�'���������0��������
���������������� �
%�������+������������
+)12�
3�������������������
456��
�#(�
����� �����������
��� �����
������������
�������������� �������������

82
5.4.6 Who Will Benefit From This Study?
As demonstrated in the above section, the following groups of people stand to bene-
fit:
a) The Consumers/General Public- the prices of milk and its products will go
down
b) Dairy Farmers- they will have access to abundant, accurate and timely man-
agement decision- making information and thus make the sector more com-
petitive
c) Commercial Business Organisations- their products and prices will be made
readily available to the farmers
d) The Government- an improved dairy sector will contribute significantly to the
national economy
e) Research Institutions- fruits of their labour will be adopted and put to use by
the farmers
5.5 AREA OF FURTHER STUDY �
Further research should be carried out to determine the extent of use dairy produc-
tion software in this sector. These assist farmers in routine decision making. In other
business fields they are already in use.
5.6 CHAPTER SUMMARY
�
This chapter has provided the research conclusions and recommendations. An area
of further study was also proposed.

83
REFERENCES �
Adhiguru, P., P. S. Birthal, and B. Ganesh Kumar. (2009). Strengthening Pluralistic
Agricultural Information Delivery Systems in India. Agricultural Economics Research
Review 22.
Agrocom. (2010). Farmer Survey Responses. Accessed 15 November 2014.
www.agrocom.co.in/new/fr.php.
Aker, J. C. (2010). Dial A for Agriculture: A Review of Information and Communica-
tion Technologies for Agricultural Extension and in Developing Countries. Agricul-
tural Economics. 42 (6).
Ali, J. and Kuma, S. (2011). Information and Communication Technologies (ICTs)
and Farmers’ Decision-Making across the Agricultural Supply Chain. International
Journal of Information Management 31.
Alvarez, J., and P. Nuthall. (2006). Adoption of Computer Based Information Sys-
tems. The Case of Dairy Farmers in Canterbury, NZ, and Florida, Uruguay.� Com-
puters and Electronics in Agriculture 50.
Angell, I.O. and Smithson, S. (1991). Information systems management: opportuni-
ties and risks. London. Macmillan.
Balaji, V. (2009). The Fate of Agriculture. Accessed November 14, 2014. www.india-
seminar.com/2009/597/597_v_balaji.htm.
Balaji, V., S. N. Meera, and X. Dixit. (2007). ICT-Enabled Knowledge Sharing in
Support of Extension: Addressing the Agrarian Challenges of the Developing World
Threatened by Climate Change, with a Case Study of India. SAT eJournal 4 (1).
Balasubramanian, K., P. Thamizoli, A. Umar, and A. Kanwar. (2010). Using Mobile
Phones to Promote Lifelong Learning Among Rural Women in Southern India. Dis-
tance Education 31: 2, page 200.
Ballantyne, P. (2002). Collecting and Propagating Local Development Content. Syn-
thesis and Conclusions. IICD Research Report 7 (May). The Hague: International
Institute for Communication and Development. Accessed November 20, 2014.

84
http://portal.unesco.org/ci/fr/file_download.php/4c457b9c0ad2d1ac37d8bb16783f083
9collecting+and+propagating+local+dev+content.pdf
Barua, A., Kriebel, C.H., and Mukhopadhyay, T. (1995). ‘Information technologies
and business value: An analytic and empirical investigation,’ Information Systems
Research, 6(1).
Batchelor, S. (2002). Using ICTs to Generate Development Content. IICD Research
Report 10. The Hague: International Institute for Communication and Development.
Berman, A. (2000). ICT in Dairy Farming Systems. Dept. Animal Science, Faculty
of Agriculture. Hebrew University. Rehovot.Israel.
Bowonder, B., V. Gupta, and A. Singh. 2007. Developing a Rural Market e-hub: The
Case Study of e-Choupal Experience of ITC. Accessed February 14, 2014.
www.planningcommission.nic.in/reports/sereport/ser/stdy_ict/4_e-choupal%20.pdf.
Bryman, A. and Bell, R. (2006). Qualitative Inquiry and Research Design – Choosing
among Five Traditions. London: Sage Publications
Cecchini, S., and Scott, C. (2003). Can Information and Communications Technol-
ogy Applications Contribute to Poverty Reduction? Lessons from Rural India. Infor-
mation Technology for Development 10.
Chapman, R., and Slaymaker, T. (2002). ICTs and Rural Development: Review of
the Literature, Current Interventions, and Opportunities for Action. ODI Working Pa-
per 192. London: Overseas Development Institute.
Coldwell, A. and Herbst, A. (2004), Research design: Qualitative and quantitative
approaches. Thousand Oaks, CA: Sage.
Colle, R. D.and Roman, R. (2002). Content for ICT Initiatives. International Con-
gress of Information Conference on information, knowledge and society, challenges
of a new era. Havana, Cuba. April 22-26, 2002.
Cooper, D. R. and Schindler, P. S. (2003).Business Research Methods.8th Edition.
New Delhi: Tata McGraw-Hill.
85
Cooper, D.R. and Schindler P. S. (2011).Business Research Methods. 10th edition.
New Delhi: Tata McGraw-Hill.
CSO (Central Statistical Office). (2000). Dairy services. Statistical year book. CSO,
Harare, Zimbabwe.
Dawson, W. (2002) Research methods. Boston: McGraw-Hill.
De Silva, H. and Ratnadiwakara, D. (2008), ‘Using ICT to reduce transaction costs in
agriculture through better communication: A case-study from Sri Lanka.’ Aaccessed
on 17 November 2014. http://www.lirneasia.net/wp-
content/uploads/2008/11/transactioncosts.pdf
Degu, G. and Yigzaw, T. F. (2006). Biostatistics for Health Science Students: lec-
ture note series. The Carter Center 9EPHTI), Addis Ababa; January 2005.
Diamantopoulos, D. & Schlegelmilch, B. (1997). Taking the fear out of data analysis.
London: Thomson.
Dossani, R., D. C. Misra, and R. Jhaveri. (2005). Enabling ICT for Rural India. Stan-
ford, CA: Asia Pacific Research Center, National Informatics Center.
Easterby-Smith, M., Thorpe, R. and Lowe, A. (2008). 3rd edn. Management Re-
search: An Introduction. London, Sage Publications.
Garforth, C. (2001). Agricultural knowledge and information systems in Hagaz, Eri-
trea.SD Dimensions. Retrieved 16 December 2014.
http://www.fao.org/sd/2001/KN1001a_en.htm
Garforth, C., Angell, B., Archer, J. and Green, K. (2003). Improving Farmers’ Access
to Advice on Land Management: Lessons from Case Studies in Developed Coun-
tries. ODI Agricultural Research and Extension Network Paper 125. London. Over-
seas Development Institute.
Gasson, M. (2002),Data in Market Research: United States and Worldwide, Quorum
Books, Westport.

86
Glendening, C. J. and Ficarelli, P. P. (2012). The Relevant Content in ICT Initiatives
in Indian Agriculture. International food Policy Research Institute working paper
011180.
Greener, L. (2008) Research Methods: A Handbook for Africa Educational Publish-
ers.
Haag, S., Cummings, M. and Phillips, A. 2007, Management information systems for
the information age. Boston, McGraw-Hill/Irwin.
Hague, P. (2002). Social Research. Allyn and Bacon. London
Heeks, R. 2005. Foundations of ICTs in Development: The Information Chain. eDe-
velopment Briefing 3.
Heeks, R. (1999). Information and Communication Technologies, Poverty, and De-
velopment. Development Informatics Working Paper 5. Manchester, UK: Institute for
Development Policy and Management.
Huirne, R.B.M., Harsh, S.B. and Dijkhuizen, A.A. (1997). Critical success factors
and information needs on dairy farms: the farmer's opinion. Livestock Production
Science, 48.
Jensen, R. (2007). The Digital Provide: Information (Technology), Market Perform-
ance, and Welfare in the South Indian Fisheries Sector. The Quarterly Journal of
Economics;122: 3
Keniston, K. (2002). Grassroots ICT Projects in India: Some Preliminary Hypotheses.
ASCI Journal of Management 31. Page 2.
Kothari, M. (2008). The Research Methods Knowledge Base. Cincinnati: Atomic
Dog.
Kumar, C.R. (2005). Research Methodology. New Delhi: APH Publishing Corpora-
tion. Diama.

87
Kundishora,S. M. (Unpublished). The role of Information Communication Technology
(ICT) in enhancing local economic development and poverty reduction. A paper pre-
sented to the Zimbabwe Academic and Research Network.
Leeuwis, C. (1993). Of Computers myths and modelling. The social construction of
diversity, knowledge, information and communication technologies in Dutch horticul-
ture and agricultural extension. Department of Communication & Innovation Studies,
Wageningen Agricultural University.
Llewellyn, R. S. (2007). Information Quality and Effectiveness for More Rapid Adop-
tion Decisions by Farmers. Field Crops Research 104.
Lubbe, S. (2004). The impact of IT investment in RSA e-commerce SME organisa-
tions.’ Electronic Journal of Information Systems Evaluation, 7(1).
May, J., J. Karugia and M. Ndokweni.(2007). ICT and agricultural development:
transformation and employment generation. Final framework paper for the African
Economic Research Consortium (AERC).
McDaniel, P. and Gates, R. (2001). Fundamentals of social research methods: an
African perspective. Juta & Co.
Meera, S. N., A. Jhamtani, and Rao, D. U. M. (2004). Information and Communica-
tion Technology in Agricultural Development: A Comparative Analysis of Three Pro-
jects from India. ODI Agricultural Research and Extension Network Paper 135. Lon-
don: Overseas Development Institute.
Mittal, S., Gandhi, S and Tripathi, G. (2010). Socio-economic Impact of Mobile
Phones on Indian Agriculture. Working Paper 246. New Delhi: Indian Council for Re-
search on International Economic Relations.
Mukhopadhya, T., Rajiv, S. and Srinivasan, K. (1997), ‘Information technology im-
pact on process output and quality.’ Management Science (Special issue).
Myers, L. (1997). Researching and Writing a Dissertation: An Essential Guide for
Business Students, 3rd Edition. London: Prentice Hall.

88
Paine, M. S. (1997). Doing it together: Technology as practice in the New Zealand
dairy sector. PhD thesis. Wageningen Agricultural University. The Netherlands.
Parasuraman. A., Zeithaml, V. A. and Berry, L.L. (2004). ‘More on Improving Ser-
vice Quality Measurement’. Journal of Retailing, Volume 69.
Parker, C. (1999). Decision Support Systems: Lessons from Past Failures. Farm
Managent 10 (5).
Pedersen, S. M., S. Fountas, B. S. Blackmore, M. Gylling and J. L. Pedersen, 2004.
Adopting and Perspectives of Precision Farming in Denmark. Agriculture Scandi-
navica. Soil and Plant Science. Vol. (2004) 54
Perry, G. ( 1998) ‘Research Methods in Business Studies’: organisations (2nd Edi-
tion). Boston: PWS-Kent Publishing Company.
Pilat D. (2004). ‘Introduction and Summary,’ In: Economic Impact of ICT. Paris:
OECD.
Proctor, A (2000) Business research . Business Horizons, 30.
Richardson, D.( 2006). How Can Agricultural Extension Best Harness ICTs to Im-
prove Rural Livelihoods in Developing Countries? In ICT in Agriculture: Perspectives
of Technological Innovation. Accessed 14 November 2014.
http://departments.agri.huji.ac.il/economics/gelb-main.html.
Rivera, W.M. (1996). Agricultural Extension in Transition Worldwide: Structural, Fi-
nancial and Managerial Strategies for Improving Agricultural Extension. Public Ad-
ministration and Development 16.
Samaddar, A. (2006). Traditional and Post-Traditional: A Study of Agricultural Rituals
in Relation to Technological Complexity among Rice Producers in Two Zones of
West Bengal, India. Journal of Culture and Agriculture 28 (2).Sambamurthy, V., Bha-
radwaj, A.S., and Grover, V. (2003). ‘Shaping agility through digital options: Recon-
ceptualising the role of IT in contemporary firms.’ MIS Quarterly, 27(2).
Santhanam, R. and Hartono, E. (2003), ‘Issues in linking information technology ca-
pability to firm performance,’ MIS Quarterly, 27(1).

89
Saunders, M., Lewis, P. and Thornhill, A. (2000). Research Methods and Theory for
Business Students. 2nd edition. Great Britain: Pitman Publishing.
Saunders, M., Lewis, P. and Thornhill, A. (2002). 2nd edition. Research Methods for
Business Students. Prentice Hall.
Saunders, M., Lewis, P. and Thornhill, A. (2003). 3rd. Research Methods for Busi-
ness Students, Prentice Hall.
Stienen, J., Bruinsma, W. and Neuman,F.,( 2007). International Institute for Com-
munication and Development (IICD). The Commonwealth Ministers’ Reference
Book.
Stone, G.D. (2010). Contradictions in the Last Mile: Suicide, Culture, and E-
Agriculture in Rural India. Science, Technology and Human Values.
Thomas, P. (2009). Bhoomi, Gyan Ganga, e-Governance, and the Right to Informa-
tion: ICTs and Development in India. Telematics and Informatics 26
Toyama, K. (2010). Can Technology End Poverty? Boston Review. Novem-
ber/December 2010. http://bostonreview.net/BR35.6/toyama.php Accessed Decem-
ber 10, 2014.
Tustin, S., Ligthelm, T., Martins, W. and Van wyk, U. V. (2005). Marketing Research
in Practice. Pretoria: Unisa Press
UNCTAD (UN Conference on Trade and Development) Secretariat. (2006). Informa-
tion Economy Report: The Development Perspective. Geneva: UNCTAD.
van den Ban, A. 1998. Supporting Farmers Decision-making Process by Agricultural
Extension.� Journal of Extension Systems 14: 55–64.
Wiid, R., T. and Diggines, A. (2009). Research for business: business research
methods. Ohio: Publishing horizon.
Yin, R.K. (2003). Case Study Research: Design and Method (3rd edition). London:
Sage.
Yin, R.K. (2008). Case Study Research: Design and Method (4th edition). London:
Sage.

90
Zikmund, W.G. (2000). Business Research Methods (6th edition). Fort Worth, TX:
Dryden Press.

91
APPENDICES
APPENDIX 1: QUESTIONNAIRE FOR THE DAIRY FARMERS
INTRODUCTION
My name is Million Chauke, a University of Zimbabwe MBA student and I am carry-
ing out a research entitled ‘An Analysis of the Effectiveness/Impact of ICTs in
Dairy Production- A case of Zimbabwe’s Mashonaland East BEATRICE-
MARIRANWE Dairy farmers’.
You may indicate your name if you so wish, but you are assured of confidentiality as
nowhere will your name ever be published concerning this research interview. I
thank you for participating in this academic exercise.
STRUCTURED INTERVIEW QUESTIONS
A. DEMOGRAPHICS
1. Name of respondent
……………………………………………………………………………
2. Sex?
Male
Female
3. What is your age group?
26-35 Years
36-45 Years
46-55 Years
56-65 Years
Over 65 Years

92
4. What is your highest level of Education?
Doctorate Degree
Masters Degree
First Degree
Diploma
Certificate
O’ level
Before O’ Level
5. Do you have any previous formal training in Agriculture?
Yes
No
6. Before you venture into dairy farming, what was your professional career?
…………………………………………………………………………………………
…………………………………………………………………………………………
……………………………………………....
7. How do you classify your dairy farming business?
Small Scale
Large Scale

93
B. FARM PRODUCTION STATICS
8. What is the breed of your cows?
………………………………………………………………………………………………
9. What is your breeding herd size?
Less than 10 cows
10-20 cows
20-50 cows
50-75 cows
75-100 cows
More than 100
10. What is your average Milk Yield per cow per day?
Less than 10 litres
10-20 litres
20-30 litres
30-40 litres
More than 40 litres
11. Where do you sell your milk?
Dairiboard Zimbabwe Limited
Nestle Zimbabwe
Other farmers
Local community
Local Government institutions
Others
12. At what price per litre do you sell your milk?
……………………………………………………..
94
C. COMPUTOR AND TECHNOLOGY
13. Which ICT hardware do you have on the farm?
Cellphone
i-phone table
Desktop computer
laptop
14. Do you have anyone on the farm business who can operate a computer and
articulate ICTs?
Yes
No
15. How does your business connect to the Internet?
Analogue modem (dial- up via stan-
dard phone line)
ISDN (Integrated Services Digital
Network)
DSL (ASL, SDSL, VDSL ETC.)
Cable modem
Other narrowband /Other broadband
16. Does your business have a Web presence?
Yes
No
17. Do you use any dairy production software?
Yes
No

95
18. Do you use ICTs in conducting your dairy farm business?
Yes
No
Planning to
19. Does your business receive orders for goods or services (that is, make sales)
via the Internet?
Yes
No
20. Which of the following activities does your business use the Internet?
For getting information
For performing Internet banking or
accessing other Financial services
For sending or receiving emails
For dealing (interacting) with govern-
ment organizations/Public authorities
For delivering products online
For providing customer services
21. To which of the following is your business linked :
Other Farmers
Market
Suppliers
Bankers
Dairy Associations
Others institution outside the country
22. What do you consider to be the benefits of the system you are using?
…………………………………………………………………………………………
…………………………………………………………………………………………

96
23. Do you have any negative inhibitions about on using ICT in your dairy busi-
ness?
How would you classify these?
Lack of skills/understanding
Lack of confidence in using ICT
Lack of privacy
Cyber crimes
Online vulnerability to children
24. What do you perceive to be the barriers in the adoption and use of ICTs by
framers?
Lack of skills/confidence by farmers
Reluctance by current staff
Expenditure is too high
Not appropriate/no perceived benefits
Technology is changing too fast
Security concerns
(Fraud/hackings/Viruses
Others

97
25. What do you consider to be the impact of ICT on your dairy business?
None
Reduced cost of internal management
processes
Reduce time of internal processes
Expanding geographic coverage of
your of your products
Increasing product quality
Other (please specify)
26. What do you think should be done at a national level to increase the adoption
of Agro-ICTs and realize more benefits for this sector?
…………………………………………………………………………………………
…………………………………………………………………………………………
…………………………………………………………………………………………
…………………………………………………………………………………………
…………………………………………………………………………………………
…………………………………………………………………………………………
…………………………………………………………………………………………
…………………………………………………....