Embed Size (px)
Citation preview

Seref Efe, Inam ur Raheem, Tingting Wan & Carter Williamson
September 2015
Cheaper Power Bills, More Jobs, Less CO2: How On-Bill Financing Done Right can be
a Quick Win for British Columbia

PACIFIC INSTITUTE FOR CLIMATE SOLUTIONS
University of VictoriaPO Box 1700 STN CSCVictoria, BC V8W 2Y2
Phone 250-853-3595 Fax 250-853-3597E-mail [email protected] pics.uvic.ca
The Pacific Institute for Climate Solutions gratefully acknowledges the generous endowment provided by the Province of British Columbia through the Ministry of Environment in 2008. This fund-ing is enabling ongoing independent research aimed at developing innovative climate change solutions, opportunities for adaptation, and steps toward achieving a vibrant low-carbon economy.
Edited by Leigh Phillips, PICS Science Writer, Dr. Tom Pedersen, PICS Executive Director and Robyn Meyer, PICS Senior Communications Officer

3
Pacific Institute for Climate Solutions
TABLE OF CONTENTS
EXECUTIVE SUMMARY 4
1. BACKGROUND 5
2. INTRODUCTION TO ON-BILL FINANCING 6
3. REVIEW OF VARIOUS OBF PROGRAMS 7
3.1 Manitoba Hydro Power Smart Residential Loan Programme 7
3.1.1 Factors of Success 8
3.2 The Tennessee Valley Authority programme 9
3.2.1 Factors of Success 10
3.3 BC Pilot Programmes 11
4. CONCLUSIONS 12
4.1 Critical factors for success 12
5. KEY RECOMMENDATIONS 14
6. EXPECTED RESULTS AND BENEFITS 15
APPENDIX A: TECHNOLOGIES/OPTIONS FOR ENERGY EFFICIENT RENOVATIONS 18
APPENDIX B: OBF PROGRAMS REVIEWED 21
ENDNOTES/REFERENCES 22

4
Pacific Institute for Climate Solutions
EXECUTIVE SUMMARY
One of the easiest ‘quick wins’ that governments can introduce to lower greenhouse gas (GHG) emissions—while simultaneously costing the public purse almost nothing, creating jobs and cosier living conditions and lowering energy bills for households—is a policy known as “on bill financ-ing”, or OBF. Under OBF programmes, a loan is made to a utility customer, such as a homeowner or a commercial building owner, to pay for energy-efficiency improvements to the customer’s house or building. The loans are then repaid via an additional charge on the building’s utility bill.
But here’s the charm of the idea: the decreased demand in energy lowers utility payments, which means there is little to no net change in the monthly utility bill until the loan is paid off. The customer hardly feels a thing—other than a home that’s a lot more comfortable to live in. And eventually, when the loan is paid off, the customer’s energy bills fall as a result of the reduced energy usage.
OBF programmes exist in the United States, Canada and Europe, and promote energy efficiency primarily in the residential sector. In 2012, two pilot “on-bill financing” programmes were imple-mented in British Columbia (BC) but failed to achieve traction. Yet elsewhere in North America, OBF has been a roaring success. What went wrong? And what makes similar programmes in other jurisdictions so successful?
For this study, in-depth examinations of thirty OBF programmes in Canada, United States and the United Kingdom were conducted with a particular focus on three: BC Hydro, Manitoba Hydro and the Tennessee Valley Authority, the objective being to define best international practices for OBF design.
This report revisits BC’s failed pilot programmes to come to grips with their shortcomings, compares them to what has worked best elsewhere, and presents a series of ‘lessons learnt’ tailored to British Columbia that, when adopted, can create a successful OBF programme in the province.
This 30-program survey reveals 10 features that are critical for success:
• attractive interest rates
• quick turnaround for approval
• ease of use
• supplier buy-in
• strong brand equity or trust in the provider
• effective marketing
• no bill neutrality requirement
• relaxed underwriting criteria
• administration of the program by a utility company
• post-retrofit audits to ensure effectiveness and prevent fraud.
For the success of an OBF program in BC we propose three key recommendations:
1. The provincial government must take ownership and be the champion and marketing face of energy efficiency.

5
Pacific Institute for Climate Solutions
2. The greatest element in a successful OBF program is the level of supplier buy-in, where contractors are certified to ensure quality delivery of retrofit services. Moreover these contractors can promote the scheme and assist home owners with filling out the paperwork for a loan thus ensuring a faster turnaround of applications.
3. Underwriting criteria for loan approval should be adequate to attract participation without compromising on-time payments. Establishing relatively lenient underwriting criteria is critical for higher market penetration, particularly since it is proven that applying stricter bank criteria to unsecured loans does not lower default rates. In Manitoba for example, despite relaxed underwriting criteria, the OBF default rate on loans was only 0.48%.
Using existing programme outcomes as a guide, implementing these recommendations would be highly likely to yield the following results for British Columbia:
Energy savings & emissions reduction
• Energy savings of 4 TWh over the life of a successful OBF programme (20 years), which would help the province meet the rising demand for electricity.
• The energy savings would in turn permit BC to realize 3 million tons of direct and indirect GHG reductions over 20 years.
Benefits beyond energy efficiency and emissions reduction
• An OBF programme will bring to BC an estimated $60 million annually in additional economic activity.
• This translates into the creation of 600 to 1,080 direct and indirect jobs (i.e. build-ing/maintenance and construction related) for residents of British Columbia.
1. BACKGROUNDIncreasing population means increasing energy demand
Apart from any climate change-related concerns, the need for energy saving plans in BC follows from a simple calculation of the energy needs required to support an increasing population. Energy demand in the province has risen steadily over the years. Indeed, historical data, shown in Figure 1, indicates that in 2010, energy consumption province-wide outstripped energy produc-tion.
Note that the orange colour in the chart represents the energy supplied by the Burrard generating station, a gas-powered plant that was taken permanently offline in 2009. In the same chart, the acronym DSM stands for ‘Demand-side Management’ which refers to BC Hydro’s now 25-year-old strategy of working to reduce growth in demand by promoting energy conservation via its Power Smart programmes, incentives, marketing and customer education.
However, even with continued success in DSM, by the end of the next decade, energy consump-tion will again outstrip energy production. Increasing energy demand is largely a product of population growth, which clocks in at about one percent a year, mostly due to in-migration to the province. Demographers predict that by 2041, some 6.12 million people will make BC their home. This figure translates to a 32% population increase within 27 years.

6
Pacific Institute for Climate Solutions
Roughly 40% of BC homes are energy inefficient
Energy consumption in the residential sector accounts for nearly 35% of all energy used in BC. As of 2012, the residential sector ranked the highest in energy consumption of all the various economic sectors, exceeding energy use by industry and by commerce. This makes the residential sector an obvious first target for substantial energy and GHG savings.
There is a lot of room for action in this sector. Of the approximately 1.88 million homes currently in BC, some 800,000 of them were constructed before 1984. Homes built before this time are significantly less energy efficient than those built after. Thus, retrofitting this ‘older-home’ sector should be a top priority in realizing near to medium term energy efficiency gains. Moreover, low-income households are more likely to live in older and less efficient housing stock. A programme of affordable retrofits thus offers the added social benefit of reducing ‘energy poverty’, where households have to spend a disproportionate part of their income just to meet basic energy needs, including the vital necessity of home heating.
A conservative estimate suggests that some 400,000 pre-1984 homes remain in need of energy-efficiency upgrading, and it is that pool of building stock that is the subject of this report. Policies that are applied to homeowners are the focus here; policies that specifically target renters are not considered.
2. INTRODUCTION TO ON-BILL FINANCING
On-bill financing, or OBF, refers to a loan made to a utility customer to pay for energy efficiency improvements to a home or commercial building. OBF programmes have three main objectives: to expand access to capital by making it relatively easy for building owners to borrow funds for retrofits; to make energy efficiency improvements affordable; and to drive demand for increased adoption of energy-efficient practices.
Figure 1: Historical Energy Demand and Supply in BC, in Gigawatt Hours per Year
Source: BC Hydro

7
Pacific Institute for Climate Solutions
In practice, once a pre-retrofit energy audit of a structure has been carried out and acceptable costs of renovations have been determined, an OBF loan is granted to the owner. This can be an attractive option for a building owner because: a) loan servicing charges (capital plus interest) are repaid using the savings from reduced energy costs in such a way that there is no or little net change in monthly utility bills; b) retrofitting increases occupant comfort; and c) once the loan is repaid, the building owner will realize net savings on his or her energy bills. A further advantage occurs at the utility or provincial scale: overall energy demand declines.
There is a difference between utility-scale OBF and conventional financing. OBF is provided as a non-profit service designed to be attractive in terms of interest rates, underwriting eligibility, and (usually) a relaxed amortization schedule. Those three features distinguish it from loans offered by traditional lending institutions such as banks, which normally have higher interest rates, stricter underwriting criteria, and shorter repayment periods. Such criteria, coupled with potentially high upfront costs for energy-efficiency improvements, often pose a constraint that many building owners cannot meet. OBF eliminates that constraint by providing access to inexpensive capital, thereby making energy efficiency affordable to a much larger pool of homeowners including those who cannot qualify for traditional loans and/or who have insufficient capacity to self-finance. And as discussed in below, OBF loans typically have low default rates and that allows, underwrit-ing criteria to be fairly relaxed. That provision significantly expands the market for home renova-tion financing.
3. REVIEW OF VARIOUS OBF PROGRAMS
Not all OBF programmes have proven to be successful. For this report, 30 existing OBF pro-grammes (Appendix B) in Canada, the United States and the United Kingdom, were reviewed and beneficial factors were identified. The success of each was measured primarily by assessing progress to a programme’s targets, which could be defined as market penetration, loan amounts or renovation volume, energy savings, and low default rates.
Two successful OBF programmes, one in Manitoba and the other in Tennessee, were selected for a detailed review and analysis to ascertain how their success was achieved and maintained. Additionally, and in contrast, two failed BC pilot programmes were analyzed to identify elements that led to their failure. All are described in the following sections.
3.1 Manitoba Hydro Power Smart Residential Loan Programme This programme was selected for the study due to the similar energy rates in Manitoba compared to BC, the proximity of the two provinces, the programme’s longevity, and similarity in institu-tional structure, with both Manitoba Hydro and BC Hydro being crown corporations.
In 2001, Manitoba Hydro (MH) in conjunction with the Province of Manitoba unveiled its first OBF programme. Since that time, the “Power Smart Residential Loan Programme” has been operating, albeit with various changes. The adjustments have yielded a dynamic programme that is now well-adapted to the needs of building owners in Manitoba. Three features are key: the pool of available capital for financing is sufficient; projects are eligible for support across a wide spec-trum; and loan interest rates are appropriate.
Capital for the Manitoba programme comes from public monies that are generated internally by the Manitoba government and lent to Manitoba Hydro at cost. When the loan programme was launched, the interest rate charged by Manitoba Hydro was set at over 6%, but this has changed

8
Pacific Institute for Climate Solutions
over the years and currently sits at 4.8%. This rate covers the cost of programme administration and also offers protection for the lender in the event of customer default. The Manitoba govern-ment does not back any of the loans.
Start-up costs for the programme were minimal, as MH’s computer and billing systems did not require significant upgrades to accommodate changes. However, there have been many incremen-tal changes to the billing system over the years, which in aggregate have led managers to say of the programme: “costs were substantial”.
Customer application and participation in the programme is very simple: After a homeowner decides to pursue renovations, she or he contacts contractors. When the contractor is part of MH’s accredited network, he or she would then suggest OBF to finance the project and would explain how OBF works to the homeowner. If the customer decides to finance a retrofit through OBF, the contractor then fills out the necessary paperwork and sends it to MH for approval and a credit check (of the homeowner). If the paperwork is in good order and credit rating is accept-able, MH notifies the contractor directly and the contractor is authorized to begin work. This approach is highly attractive to homeowners as it greatly minimizes the workload involved in applying to the programme.
Results
Manitoba Hydro’s Power Smart Residential Programme is highly successful, having consistently served approximately new 5,000 participants yearly, with annual total loan amounts of approxi-mately $29 million. Some participants re-entered the programme after paying off their previous loans. Indeed, some MH customers liked the programme so much that they participated many times.
In terms of loan volume, this is one of the most successful OBF programmes in North America, having reached in 13 years 15% of households within its target market. Furnace and window replacements have been the primary targets for energy upgrades. Total loan volume has reached nearly $300 million, with an astonishingly low default rate of 0.48%, as listed in the table below.
Manitoba Hydro’s programme managed to achieve an average energy savings per project of 825 kWh per year. For comparison, the average BC home uses about 11,000 kWh per year.
3.1.1 Factors of Success
Five key elements contributed to the clear success of MH’s Power Smart Residential Loan Pro-gramme:
• underwriting criteria and eligibility requirements are relaxed compared to tradi-tional bank renovation financing
• interest rates are kept relatively low
• the programme is convenient and easy to use and offers a quick turnaround time for approval
• the programme enjoys robust supplier and contractor buy-in and participation
• Manitoba Hydro has strong brand equity – it is seen as a trusted entity
The relatively relaxed underwriting criteria allows for greater market penetration, as the loan rejec-tion rate is only about 5%.

9
Pacific Institute for Climate Solutions
MH’s current interest rate of 4.8% lies in the middle of rates offered by all OBF programmes researched for this study. According to a senior administrator in Manitoba, the reasonable interest rate contributes to the high penetration rate and total loan volume.
Moreover, participation in the programme is enhanced by a short, roughly 48-hour turnaround time for approval. Easy application procedures that are led by the contractor coupled with reduced processing times have been important factors in attracting participants and reducing rates of abandonment during the application process.
Supplier buy-in
MH maintains a pool of approximately 3,400 certified contractors who service about 5,000 projects a year. All have been trained to fill in the application forms and finish all paperwork for customers, and this ‘one-stop-shopping’ approach has been key to lowering entrance barriers for building owners.
Strong brand equity of utility company
Building customer trust makes a difference in attracting participation. The high market penetra-tion rates in Manitoba are reported to be related to the trust that customers place in the Manitoba Hydro brand.
3.2 The Tennessee Valley Authority programmeThe Tennessee Valley Authority (TVA) in the United States created one of the longest running and largest OBF programmes in place to date. For nearly 30 years, the TVA has offered financing programmes. Since 1997, these initiatives have proven successful, funding nearly $500 million worth of energy-efficiency retrofit projects.
The TVA approach differs significantly from that of Manitoba Hydro by putting more onus on the customer. The building owner first contacts the TVA to apply for a loan and completes an application. The utility receives the loan request and sends it to a banking partner for a credit score review. If approved, customers are notified to proceed with installation. A contractor cho-sen by the customer notifies the utility company when the work is complete; the utility inspects the work, and sends a funding authorization to the bank, and the bank makes the payment directly to the contractor.
Figure 2: Projects Financed in Manitoba Hydro Program
Source: State and Local Energy Efficiency Action Network. May 2014

10
Pacific Institute for Climate Solutions
The TVA generates and sells energy to 155 local distributors across Alabama, Georgia, Kentucky, Mississippi, North Carolina, Tennessee and Virginia. Of these, 131 participate in the OBF pro-grammes. The TVA acts as the governing body for the loans and establishes certain loan criteria. Each of the 131 local distributors acts as its own programme administrator and can customize the OBF programme to meet the needs of its clients.
The capital for this programme employs the “Warehouse Model” approach in which the TVA initially provides the loan funds. Multiple loans are then aggregated and sold to a local bank, and the TVA secures the loans in the event of default. The banking partner retains all loan payments from local utilities. TVA pays the banking partner for its administrative role by discounting the loan purchase agreement. In calendar year 2012, this programme was responsible for $44.5 mil-lion worth of loans.
Results
At first glance, it would appear the indicators of success for TVA are not as strong as those for Manitoba Hydro (see Table 1). However, the numbers are misleading due to the sheer size of the market served by the TVA. The lower market penetration rate is still considered successful, as the application decline rate is 25%, (compared to 5% in Manitoba). The higher decline rate is likely associated with stricter underwriting criteria that minimize the risk of default. The sheer size of the market for TVA has pushed the total loan volume to date to some $500 million.
The Tennessee Valley Authority programme managed to achieve an average energy savings per project of 1,300-2000 kWh per year.
3.2.1 Factors of Success
Three key elements contribute to the success of TVA’s OBF programs:
• a reasonable interest rate;
• supplier and contractor buy-in; and,
• the utility company serving as the programme administrator
Low interest rate
The interest rate for this programme is 6% or 8%: the lower rate applies if a high-efficiency heat pump is installed and the higher rate is used where a less efficient heat pump is fitted. Both rates are considerably lower than the 9.25% rate offered by similar, non-TVA programmes in the area.
Supplier buy-in
Supplier buy-in is a critical element for TVA, as it was for Manitoba Hydro. Public awareness of the TVA programme is mainly achieved through contractor advertising. Moreover, participation in the programme is attractive to contractors as they become quite likely to receive additional
Table 1: Key statistics for OBF best-practice, based on the period 2001-2013
Jurisdiction Market Penetration
Loan Volume Default Rate Energy Savings (per project)
Manitoba 15% $290 million 0.48% 825 kWh
Tennessee 2.03% $500 million 3.00% 1300-‐2000 kWh
11
Pacific Institute for Climate Solutions
contracting work, a consequence of the OBF programme making available access to inexpensive home-renovation capital.
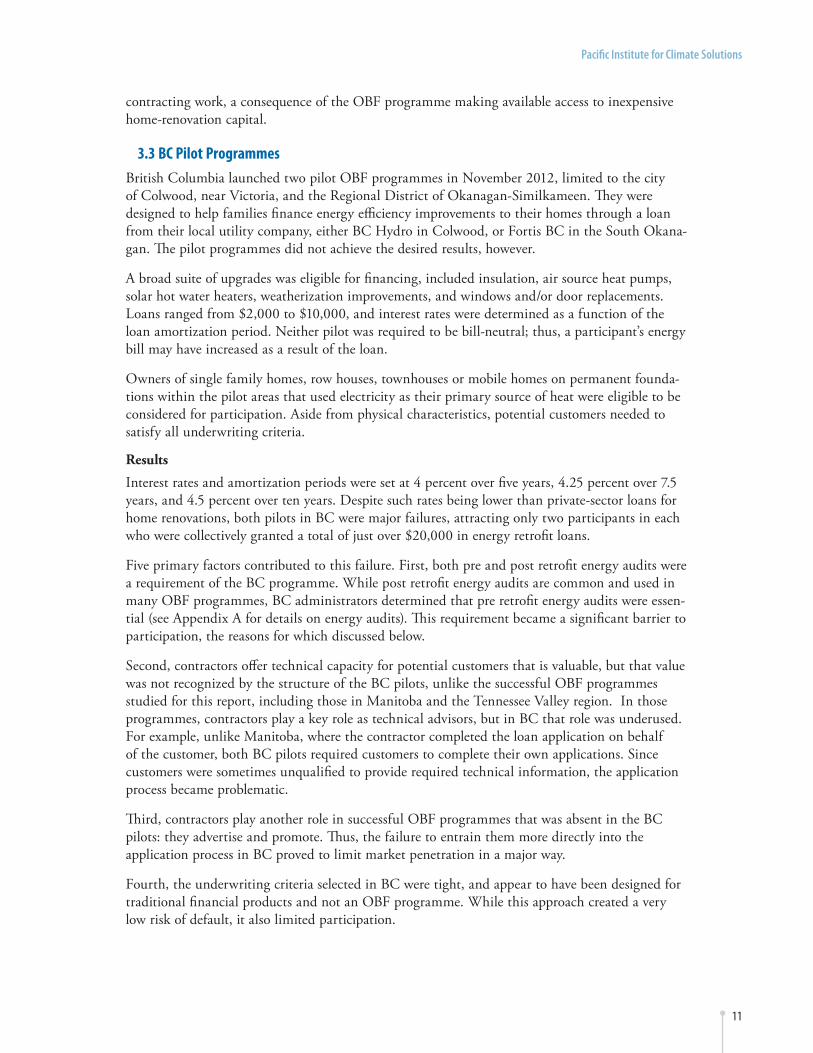
3.3 BC Pilot ProgrammesBritish Columbia launched two pilot OBF programmes in November 2012, limited to the city of Colwood, near Victoria, and the Regional District of Okanagan-Similkameen. They were designed to help families finance energy efficiency improvements to their homes through a loan from their local utility company, either BC Hydro in Colwood, or Fortis BC in the South Okana-gan. The pilot programmes did not achieve the desired results, however.
A broad suite of upgrades was eligible for financing, included insulation, air source heat pumps, solar hot water heaters, weatherization improvements, and windows and/or door replacements. Loans ranged from $2,000 to $10,000, and interest rates were determined as a function of the loan amortization period. Neither pilot was required to be bill-neutral; thus, a participant’s energy bill may have increased as a result of the loan.
Owners of single family homes, row houses, townhouses or mobile homes on permanent founda-tions within the pilot areas that used electricity as their primary source of heat were eligible to be considered for participation. Aside from physical characteristics, potential customers needed to satisfy all underwriting criteria.
Results
Interest rates and amortization periods were set at 4 percent over five years, 4.25 percent over 7.5 years, and 4.5 percent over ten years. Despite such rates being lower than private-sector loans for home renovations, both pilots in BC were major failures, attracting only two participants in each who were collectively granted a total of just over $20,000 in energy retrofit loans.
Five primary factors contributed to this failure. First, both pre and post retrofit energy audits were a requirement of the BC programme. While post retrofit energy audits are common and used in many OBF programmes, BC administrators determined that pre retrofit energy audits were essen-tial (see Appendix A for details on energy audits). This requirement became a significant barrier to participation, the reasons for which discussed below.
Second, contractors offer technical capacity for potential customers that is valuable, but that value was not recognized by the structure of the BC pilots, unlike the successful OBF programmes studied for this report, including those in Manitoba and the Tennessee Valley region. In those programmes, contractors play a key role as technical advisors, but in BC that role was underused. For example, unlike Manitoba, where the contractor completed the loan application on behalf of the customer, both BC pilots required customers to complete their own applications. Since customers were sometimes unqualified to provide required technical information, the application process became problematic.
Third, contractors play another role in successful OBF programmes that was absent in the BC pilots: they advertise and promote. Thus, the failure to entrain them more directly into the application process in BC proved to limit market penetration in a major way.
Fourth, the underwriting criteria selected in BC were tight, and appear to have been designed for traditional financial products and not an OBF programme. While this approach created a very low risk of default, it also limited participation.
12
Pacific Institute for Climate Solutions
Fifth, the provincial government together with BC Hydro and Fortis BC created the pilot OBF schemes in BC, but only the utility companies appeared as the faces of OBF, not the government. And while both BC Hydro and Fortis have strong brand equity in terms of providing energy to their customers, they lack brand equity as lending institutions. According to the director of energy efficiency and conservation at Fortis BC, given the lack of trust in that context, homeowners ques-tioned the intentions of the both utilities and hesitated to participate in the pilot programmes. The pilots may have been seen as an opportunity for the utilities to squeeze more money out of their customers rather than as a public-spirited programme intended to benefit homeowners, reduce energy consumption and lower greenhouse gas emissions.
4. CONCLUSIONS
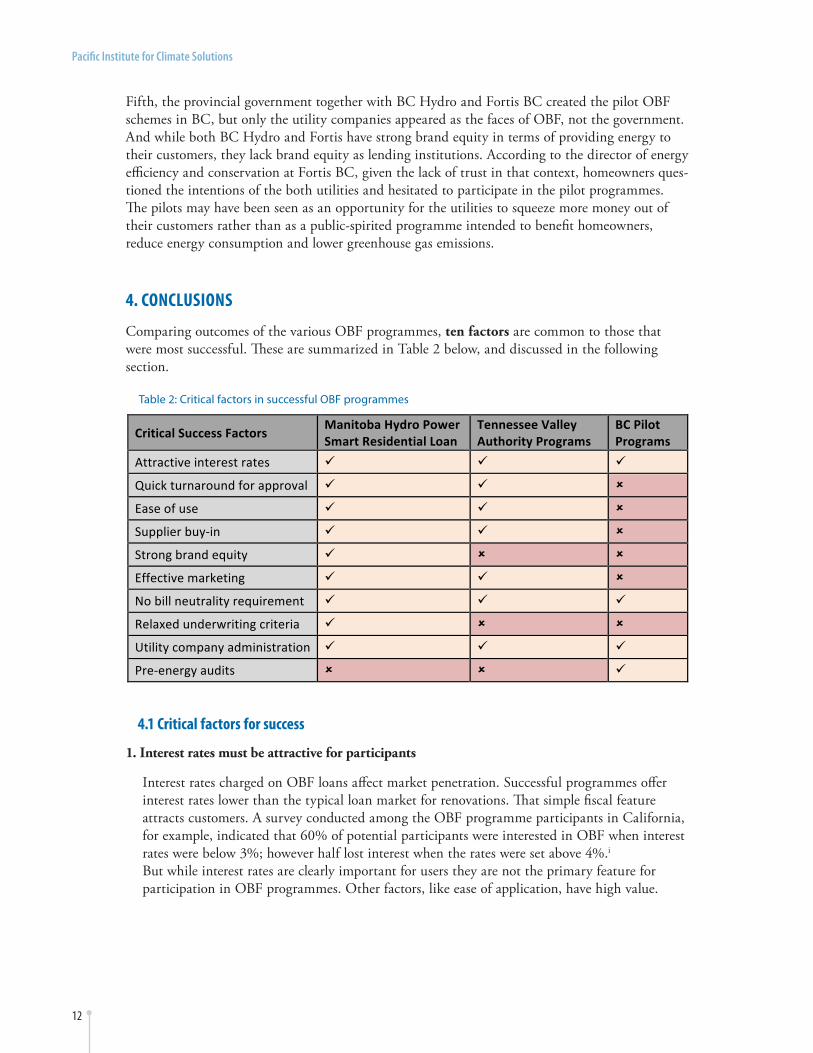
Comparing outcomes of the various OBF programmes, ten factors are common to those that were most successful. These are summarized in Table 2 below, and discussed in the following section.
4.1 Critical factors for success
1. Interest rates must be attractive for participants
Interest rates charged on OBF loans affect market penetration. Successful programmes offer interest rates lower than the typical loan market for renovations. That simple fiscal feature attracts customers. A survey conducted among the OBF programme participants in California, for example, indicated that 60% of potential participants were interested in OBF when interest rates were below 3%; however half lost interest when the rates were set above 4%.i But while interest rates are clearly important for users they are not the primary feature for participation in OBF programmes. Other factors, like ease of application, have high value.
Critical Success Factors Manitoba Hydro Power Smart Residential Loan
Tennessee Valley Authority Programs
BC Pilot Programs
Attractive interest rates ü ü ü
Quick turnaround for approval ü ü û
Ease of use ü ü û
Supplier buy-‐in ü ü û
Strong brand equity ü û û
Effective marketing ü ü û
No bill neutrality requirement ü ü ü
Relaxed underwriting criteria ü û û
Utility company administration ü ü ü
Pre-‐energy audits û û ü
Table 2: Critical factors in successful OBF programmes

13
Pacific Institute for Climate Solutions
2. Quick turnaround for approval
The processes used in the Manitoba and Tennessee programmes, and particularly the former, demonstrate that successful programmes have quick turnaround times for approval. Smooth, fast processing of applications was reported to be a crucial element in the success of both of these leading programmes and this contributed to reducing the rate of abandonment.
3. Supplier (contractor) buy-in
Early-stage contractor involvement makes the process easier for customers. One of the key elements of success for the Manitoba programme was the training of suppliers to fill in application forms and finish all the work for customers. This approach made it easy for participants to apply, and is credited with substantially increasing participation rates. Indeed, in all OBF programmes surveyed, applicants were regularly rejected when paperwork was not in good order. Programmes that required inexperienced building owners to fill out the application rather than trained professionals had a higher chance of paperwork being improperly completed. That increased the rejection rate.
4. Strong brand equity
Utility companies (UCs) that are reported to have had trust issues ended up with unsuccessful programme initiatives. Fortis BC confirmed this, as its field research indicated that potential customers harbored a general mistrust about Fortis offering services beyond its normal scope.ii
5. Effective marketing is required for the initial programme publicity
Contractors are crucial for publicity and marketing of OBF programmes, not least because they are primary sources of information for homeowners who plan to start home retrofits. In California, 67% of the customers indicated that they heard of the OBF programme through contractors.iii Without supplier buy-in, utility companies will need to bear a significant cost of advertising to stimulate public awareness. Government ownership of the programme is also essential, especially in the first year of implementation. Having government promote OBF fosters programme credibility and improves citizen trust in those utility companies chosen to administer OBF programmes.
6. Overly strict ‘bill-neutrality’ requirement may result in lower market penetration without bbsignificantly lowering default rates
One of the main selling points of OBF programmes is that there is little to no net change in a household’s utility bill payment amount until the loan is paid off, so the homeowner does not have to increase his or her monthly outgoing costs. This is referred to as ‘bill neutrality’. However, an overly strict effort to maintain such bill neutrality can end up backfiring because it can limit the types of projects that can be financed. Comparative studies have shown that programmes that demand strict bill neutrality have often struggled to achieve significant market penetration. At the same time, they do not appear to have had significantly fewer defaults.iv This suggests that in practice requiring “bill neutrality” as a design element may actually have a demand-dampening effect. For OBF to succeed, some leeway here should be embraced.

14
Pacific Institute for Climate Solutions
7. Underwriting criteria significantly influence application approval rates
The choice of underwriting criteria significantly influences approval rates. A programme that relies on traditional criteria such as commercial-bank interest rates rejects about eight times more applications than the median rejection rate of on-bill loan programmes that rely primarily on utility bill repayment history. The Manitoba Hydro programme by contrast, simply required that ten out of the last 12 monthly utility bills had been paid on time, that there had been no disconnect notices during the previous year, that there had been no record of bankruptcy in the previous five years, and that the building was insured.
8. Utility companies are in a better position to administer OBF programme
Since the utility companies have user data and access to information, they are in a better position to administer the programme. Another advantage may be the low cost of capital. Utility companies in BC have approximately same cost of borrowing as the BC government. As one of the experts interviewed put it: “Financial institutions would only be interested in providing a large sum of loans for this type of programme, but they will not be willing to deal with individual customers with relatively small loans.”
9. Energy audits can be a barrier
Pre and post retrofit energy audits are fundamentally different from each other. While there are obvious benefits to implementing both pre and post energy audits, it appears that the cons may outweigh the expected benefits. Implementing mandatory pre retrofit energy audits may present entrance barriers for consumers, as they represent another step consumers must complete as well as a cost, albeit relatively small. Thus, a pre retrofit energy audit may be viewed as an additional hassle that will dissuade a household from participating in an OBF programme.
10. No up-front costs for customers
Another key design element that removes entrance barriers for participants is the absence of up-front costs. This is supported by a survey among the participants of the California OBF programme that revealed that a primary reason for their participation in the programme was that it had no up-front costs.
5. KEY RECOMMENDATIONS
Beyond the 10 factors that have been critical to success, there are three key recommendations that should allow BC to achieve its own successful OBF programme:
1. Government as Champion
In order for OBF to gain the necessary traction within the residential sector, the provincial government must take ownership and be the champion of energy efficiency. Such ownership includes undertaking strong promotion at the launch of the programme; this is mandatory if public awareness of and trust in the programme are to be established. Once the programme has developed initial awareness, typically in the first year, there does not need to be any advertising outside the utility companies’ own websites. Indeed, promotion will be maintained over the long term by retrofit suppliers.
15
Pacific Institute for Climate Solutions
2. Supplier (Contractor) Buy-in
Perhaps the single greatest element in a successful OBF programme is that of the level of contractor buy-in, where contractors are certified by the government to ensure competence and quality delivery of services.
From the perspective of the contractor, four elements ensure a vibrant programme:
• renovations must be of high quality
• the programme must be easy to use
• the programme must have the capacity to disseminate changes quickly to customers
• the government and utilities must support the contractors gaining OBF work through appropriate marketing.
Quality work is a must, and can be generally assured by having only authorized contractors provide the OBF work. To gain authorization and participate in the programme, contractors must demonstrate knowledge, skills and abilities, as well provide proof of training to the utility company or responsible government agency. From a contractor’s perspective this certification is highly valuable as it restricts the pool of bidders for jobs––uncertified contractors being ineligible––as well as signalling to potential customers that high-quality work will be provided. Both of these benefits ultimately increase participating contractors’ businesses.
Moreover, the most impactful type of marketing for OBF programmes is having the contractor propose the programme to potential customers. This again requires a high level of competency that the authorization requirement can ensure. Finally, regular communication between the pool of certified contractors and the government or utility companies is a must. This will allow for a dynamic programme with the flexibility to meet the needs of a growing public.
3. Relaxed underwriting criteria
Underwriting criteria for loan approval should be adequate to attract participation without compromising on-time payments. Since it is proven that more lenient rules do not lower default rates in comparison with typical bank criteria for unsecured loans, establishing relatively relaxed underwriting criteria is critical for higher market penetration.
6. EXPECTED RESULTS AND BENEFITS
A successful OBF programme in BC may reach 12,000 participants a year:
BC has approximately four times as many houses as Manitoba. While a quarter of those are in the north of the province and are subject to a climate similar to that in Manitoba, the remainder enjoy a milder climate that renders energy efficient home renovations somewhat less attractive. That said, there are many energy-conscious homeowners in the milder climate areas who would be attracted to OBF and benefit from more comfortable, energy efficient living conditions.
Assuming an uptake rate of 12,000 participants a year, an OBF programme that provided retrofits for half of the ‘old’ housing stock in BC would after 25 years yield aggregate total energy savings of about 4 TWh, thereby contributing to meeting British Columbia’s long-term growth in electricity demand.

16
Pacific Institute for Climate Solutions
GHG Reduction
GHG emissions will be lowered directly by reducing the use of natural gas in BC homes through energy efficient improvements. GHG’s may also be reduced indirectly as utility companies that realize declines in energy demand may export excess electricity to other jurisdictions that rely on fossil-fuel combustion to produce electricity. In light of these factors, BC could achieve 3 million tons of direct and indirect GHG reductions with implementation of an effective OBF programme.
Jobs Creation
Energy efficient retrofits lead to the creation of three employment categories: (i) Direct jobs in this sector include building construction and repairs; (ii) Indirect jobs involve both the manu-facturing and transportation of the materials required for the construction and repair work; and (iii) Induced jobs are those resulting from the money spent by the other workers, and by building owners and tenants who will save money due to lower energy costs.
BC estimates show that construction and retrofitting create between 10 and 18 direct and indirect jobs for every $1 million in increased output. This contrasts with oil and natural gas extraction, where it takes about $4 million in increased output to support a single direct job.
In Oregon, Portland’s 10-year Clean Energy Works retrofit programme anticipates the creation of around 10,000 direct jobs based on undertaking and estimated 100,000 retrofits. A New York green jobs programme, Green Homes New York, aims to retrofit one million houses in five years and is expected to create 120,000 direct and induced job-years, which is equivalent to over 14,000 full-time jobs.v
There are approximately 400,000 houses in BC that need retrofitting. Providing an upgrade to each of these homes, assuming that a basic upgrade takes about five to eight person-days to complete, would translate to about 2 million to 3.2 million person-days, or 8,200 to 13,200 person-years of employment. Another analysis, based on a more thorough (and thus employment-
Figure 3: Total Direct and Indirect Employment in Different Economic Sectors
Source: Green Jobs BC

17
Pacific Institute for Climate Solutions
intensive) upgrade standard found that retrofitting 100,000 homes per year in BC would keep 14,000 to 30,000 people directly employed.vi
And from a fiscal perspective, a successful OBF programme in BC that renovated homes 12,000 homes per year has the potential to reach an annual sales volume of $60 million. That translates to the creation of 600-1,080 direct and indirect jobs, with a considerable associated impact on BC’s economy.
Benefits Estimated Amount
Annual economic activity $60 million
Employment creation 600-‐1080 jobs
Aggregate energy savings 4 TWh over 20 years
GHG reduction 3 million tonnes over 20 years
Table 3: Expected Benefits of OBF in BC

18
Pacific Institute for Climate Solutions
APPENDIX A: TECHNOLOGIES/OPTIONS FOR ENERGY EFFICIENT RENOVATIONS
There is no unique formula to calculate the impact of such upgrades and generalize them to all homes. Every house is unique due to differences in structural design, location and exposure to sunlight and shade, the number and behaviours of the occupants, appliances installed, varying installation quality, sources of energy and other factors. The best approach to quantify exact cost-benefit trade-offs is to treat each house independently, an approach best achieved by conducting an energy audit.
Energy AuditsA pre-renovation energy audit done by an energy advisor provides the homeowner with expert advice and a customized retrofit plan for his/her house. There are several organizations (for example the non-profit City Green Solutions) that can provide a thorough energy assessment for buildings in BC. A general audit will yield a detailed and comprehensive report on a home’s energy consumption, including areal segregation and areas of energy waste. A customized report would also include specific improvement recommendations for that home. Post-renovation audits are also useful in determining the actual impact of the upgrades. Energy audits are relatively inexpensive; generally an initial audit costs around $300 and a post-renovation assessment about $150. It is important to understand the technologies and construction techniques available for energy efficient home renovations, as they are the driver behind every OBF programme. The wide array of options on offer can be divided into two broad categories: appliances and equipment, and building design renovations.
Appliances and EquipmentThe pattern of energy consumption in BC’s residential sector provides an idea of how energy is used in a home. As seen in the chart below, space heating (heating rooms) takes up more than half the total energy use in a typical house. Home heating can be the costliest process in terms of both economic and environmental costs but it also offers the greatest potential for energy savings. Therefore, to maximize energy savings, the focus must be on the appliances and equipment used to heat homes, in addition to the thermal integrity of the building envelope. Homeowners should note that many older (“legacy”) appliances and equipment appliances are inefficient. This results in higher operating costs and a larger carbon footprint.
Space hea(ng 53%
Water hea(ng 25%
Appliances 16%
Ligh(ng 5% Space Cooling 1%
Source: Natural Resources Canada 2014
Figure 4: Domestic Energy Consumption in BC

19
Pacific Institute for Climate Solutions
Examples of Appliances Gas FurnaceGas furnaces are one of the most commonly used home-heating devices and installations. They draw air from the outside the home and heat it with a flame fuelled by natural gas (an energy efficient and cost efficient alternative to electricity or coal). The warmed air is forced through ducts and vents throughout the house. The efficiency of a gas furnace is measured via the Annual Fuel Utilization Efficiency (AFUE) rating, which indicates how well a furnace converts fuel into heat. For example, a 90% efficiency furnace would mean that it converts 90 cents out of each dollar spent on fuel into heat. Gas furnaces with “Energy Star” ratings have an AFUE rating of between 90 and 97%. Since January 1, 2009, only Energy Star-rated gas furnaces may be manufactured in Canada.
Air-source Heat PumpAn air-source heat pump uses the compression-expansion principle of refrigeration to extract heat from the air and transfer it to either the inside or outside of a house, depending on the season. Even at lower temperatures, an air-source heat pump is able to extract heat from the outside air, although efficiency dimishes as the temperature cools. The pump meanwhile works in reverse in summer, extracting heat from inside the house and transferring it outside. However, heat pumps are not considered a suitable stand-alone solution, according to BC Hydro: In almost any part of Canada, it is not economical to use a heat pump as the only source of heat in your home. A heat pump large enough to meet your winter heating needs would work inefficiently in sum-mer. Combining a heat pump with an existing furnace or other supplemental heater can reduce home energy expenses.
Geo-thermal Heat Pump A geo-thermal heat pump (also known as a ground-source heat pump) uses the earth or ground water as a source of heat in the winter and as the “sink” for heat removed from home in the sum-mer. Geothermal heat pumps require wells to be drilled into the ground, often to depths of many tens of metres. As a result, they are an expensive solution that results in longer payback periods.
Solar Hot WaterAt 30% of total energy usage within the home, water heating is the second highest energy utiliza-tion function after space heating. Solar Hot Water (SHW) systems can be utilized to reduce the amount of traditional energy needed for water heating. A SHW system works by absorbing sun-light as heat and transferring it into a water storage tank either directly, in cases where the water is unlikely to freeze, or through the use of an anti-freeze and heat exchanger in colder climates. A review of the Solar Colwood Programme, established in Colwood, BC, a suburb of Victoria, indicates that the average cost of installing a SHW system is around $8,200 and the return on investment is between 4% and 17% annually over a 25-year loan amortization period. A SHW system generated at least 40% energy savings in an average home in Colwood.
Building Design RenovationsThe structure, construction style and surroundings of a home are equally important for mak-ing it more energy efficient. For example, an energy efficient renovation with just appliances or equipment replacement will be rendered useless if windows or walls are not properly insulated and internal heat is lost by convection as well as conduction. Below are two of the most common structural renovations to achieve greater energy efficiency.

20
Pacific Institute for Climate Solutions
InsulationPoor or inadequate insulation within a house can result in high-energy usage to maintain a comfortable living space. Attics are generally the most cost-effective places to add insulation. A well-insulated attic can save money year-round and reduce cooling energy costs by 20-60%.
Draft ProofingDraft proofing/air sealing is one of the simplest, fastest and cost-effective ways to save energy and reduce heating and cooling bills. The average twenty-year-old house has leaks the equivalent of an open hole to the outside 40 cm in diameter, which effectively acts like small window left open all year around.vii The best way to draft proof a home is to hire a certified energy advisor. The advisor will put a powerful fan in an outside doorway, close all windows and other openings in the house, and turn on the fan. As it runs, the house becomes depressurized and the advisor will walk around inside house and map problematic areas where the air is being pulled in. Identified leakage areas can be sealed using various draft proofing techniques such as caulking and weather-stripping.

21
Pacific Institute for Climate Solutions
APPENDIX B: OBF PROGRAMS REVIEWED
Country Name of OBF Programme
Canada BC Pilot Programmes-‐LiveSmart BC (Colwood and Okanagan) Canada Nelson Hydro – EcoSave
Canada Manitoba Hydro Power Smart Residential Loan Programme, Energy Finance Plan and Pay As You Save (PAYS) Financing
US Tennessee Valley Authority Energy Right Solutions Heat Pump and In-‐Home Energy Evaluation On-‐Bill Programme
US California On-‐Bill Financing & On-‐Bill Repayment Pilots
US Georgia Environmental Finance Authority—Residential Energy Efficiency On-‐Bill Loan Programmes
US Illinois Energy Efficiency Loan Programme (IEEL) US How$mart® Kansas On-‐Bill Programme US National Grid On-‐Bill Loan Programmes US NYSERDA Green Jobs-‐Green New York On-‐Bill Recovery Programme US Central Electric Power Cooperative Help My House On-‐Bill Pilot Programme US Connecticut Small Business Energy Advantage On-‐Bill Loan Programme US Alliant Energy Shared Savings Wisconsin On-‐Bill Programme
UK The United Kingdom’s Green Deal: A Market Framework for Funding Energy Efficiency Improvements
US SAVEGREEN On-‐bill Repayment Programme – New Jersey US Clean Energy Works Oregon – Oregon US Mpower Oregon US PSE&G, New Jersey US Windsor Efficiency PAYS US Ft. Collins Utilities Residential On-‐Bill Financing Programme US Residential Energy Efficiency Financing Programme (CL&P) US Hawaii On-‐Bill Financing US Solar Saver Programme (Hawaiian Electric Company) US How$mart, KY (Mountain Association for Community Economic Development) US Residential Energy Conservation Programme (Holyoke Gas & Electric Dept.) US Help My House Pilot (Electric Cooperatives of South Carolina) US SaveGreen Project (New Jersey Natural Gas)
22
Pacific Institute for Climate Solutions
ENDNOTES/REFERENCESi The Cadmus Group Inc. Report for California Public Utilities Commission. March 2012. “California 2010-2012 On-Bill Financing Process Evaluation and Market Assessment “, 59
ii Sarah Smith (Director, Energy Efficiency and Conservation, Fortis BC) Interviewed by Authors, June 4, 2014.
iii California Public Utilities Commission. 2012 . “California 2010-2012 On-Bill Financing Process Evalua-tion and Market Assessment”, 34
iv State and Local Energy Efficiency Action Network. May 2014. “Financing Energy Improvements on Util-ity Bills – Market Updates and Key Program Design Considerations for Policymakers and Administrators”, xxi.
v Columbia Institute. 2010. “Jobs, Justice, Climate: Building a Green Economy for BC”, 38 http://www.columbiainstitute.ca/sites/default/files/attachments/REVISED_FINAL_Columbia_green_jobs_nov2010.pdf
vi Columbia Institute. 2010. “Jobs, Justice, Climate: Building a Green Economy for BC” http://www.colum-biainstitute.ca/sites/default/files/attachments/REVISED_FINAL_Columbia_green_jobs_nov2010.pdf
vii City Green Solutions, “Home Upgrades, Draft Proofing”, (accessed October 3, 2014) http://www.citygreen.ca/air-sealing-weatherstripping-and-draft-proofing


University of VictoriaPO Box 1700 STN CSCVictoria, BC V8W 2Y2
Phone 250-853-3595 E-mail [email protected]
Web pics.uvic.ca