Embed Size (px)
Citation preview
The Impact of Cybercrime on Business
Studies of IT practitioners in the United States, United Kingdom, Germany, Hong Kong and Brazil
Ponemon Institute© Research Report
Sponsored by Check Point Software Technologies Independently conducted by Ponemon Institute LLC Publication Date: May 2012
Ponemon Institute© Research Report Page 1
The Impact of Cybercrime on Business
Studies of IT practitioners in the United States, United Kingdom, Germany, Hong Kong and Brazil Ponemon Institute, May 2012
Part 1. Executive Summary Cyber criminals today are increasingly leveraging malware, bots and other forms of sophisticated threats to attack organizations for various reasons, including financial gain, business disruption or political agendas. In many cases, cybercriminals often target multiple sites and organizations to increase the likelihood of an attack’s initial success and viral spread. With new variants of malware being generated on a daily basis, many companies struggle to fight these threats separately and the majority of attacks are often left undetected or unreported. In addition, cybercriminals are no longer isolated amateurs. They belong to well-structured organizations with money, motivation and goals, often employing highly skilled hackers that execute targeted attacks. Such organizations can deploy considerable threat intelligence, time and resources in order to execute attacks that can cost cybercrime victims significant amounts of money. Unfortunately, this trend is only growing more complex as businesses experience a surge in Web 2.0 use, mobile computing and the cloud, creating more channels of communication and vulnerable entry points into the network. Conducted by Ponemon Institute and sponsored by Check Point Software Technologies, we are pleased to present the findings of The Impact of Cybercrime on Business. The purpose of the study is to better understand the likelihood, frequency and magnitude targeted threats have on organizations across all company sizes and industries, and to understand how IT practitioners are addressing the risk for future remediation and precautions. In this study we surveyed 2,618 highly experienced business leaders and IT security practitioners located in the United States, United Kingdom, Germany, Hong Kong and Brazil.1 Respondents were asked to focus on five of the most prevalent types of attacks: botnets, Advanced Persistent Threats (APTs), denial of service (DoS) attacks, viruses, worms and trojans and social engineering attacks to evaluate what impact they have on businesses, including their level of risk, motivations, types of information compromised and cost. As the study will show, there are significant differences in practices and perceptions among IT practitioners in all five countries. The following are key findings from this research: The level of risk for cybercrime varies among countries. DoS attacks are considered to pose the greatest risk to organizations. Respondents in the U.S., UK and Hong Kong report they are most worried about denial of service attacks and in Brazil respondents are concerned about viruses, worms and trojans. Social engineering is the greatest concern in Germany.
An average of 43 percent of respondents report SQL injections as the most serious attacks their organizations experienced in the past two years. More than one-third of organizations represented in this research experienced APTs (35 percent), botnets (33 percent) and DoS attacks (32 percent). Organizations face an average of 66 cyber attacks weekly that cause business disruptions. Organizations in Germany and the U.S. experience the highest average rate of weekly attacks, 82 and 79 respectively. Brazil and Hong Kong have the lowest frequency, on average 47 and 54 per week respectively. On average, respondents believe 17 percent of machines and mobile devices within their organizations have been infected by an act of cybercrime. 1The present survey questions were part of a larger omnibus survey instrument (a.k.a. Meta survey) fielded on a quarterly cycle in all five countries.
Ponemon Institute© Research Report Page 2
Respondents in all countries reported the most serious consequences are business disruption and loss of sensitive information, including intellectual property and trade secrets. Of least concern as a consequence of cybercrime, with the exception of respondents in the UK, are diminished reputation and brand name followed by equipment damages
The hacker’s motivation. While respondents may have different perceptions about which cyber risks are most detrimental to their businesses, they all agree that the primary goal for cybercriminals is financial fraud and/or access to the company’s financial records. In the U.S. and UK, financial gain is followed by theft of customer data. Approximately five percent of security attacks are motivated by political or ideological agendas.
Cybercrime continues to be costly for businesses worldwide. In the aftermath of one cybercrime attack, the cost to investigate, recover brand and reputation and invest in technologies ranges from an average high of $298,359 (U.S. $ dollars) for German organizations to an average low of $106,904 (U.S. $ dollars) for Brazilian organizations. The impact of mobile devices on cyber security risk. The one risk respondents in all countries can agree with is the use of mobile devices such as smart phones and tablet PCs in the workplace. Hong Kong and Brazil report on average the highest percentage of mobile devices infected an act of cyber crime. The U.S. and Germany appear to be the most successful in limiting infected mobile devices. These countries report the lowest average of infected mobile devices and machines connected to the network at 11 percent in the U.S. and nine percent in Germany. Too little is done in many countries to prevent cybercrime. While the majority of companies have the important security building blocks, such as firewalls and IPS, needed for their security infrastructure, less than half of organizations in this study have advanced protections to fight botnets and APTs. The majority of organizations in the U.S. and Germany are deploying solutions and training that are more specific to addressing cyber risk such as anti-bot, application controls and security intelligence systems. Whereas, other countries represented in this study are lagging behind in their cyber security readiness.
Senior executives are more concerned about cyber attacks and see a greater need to take steps to reduce the risk. In all organizations represented in this study, respondents who hold leadership positions are more likely than respondents in lower level IT and IT security positions to say their organizations are very concerned and have fully implements and applied security precautions, technology and training.
Ponemon Institute© Research Report Page 3
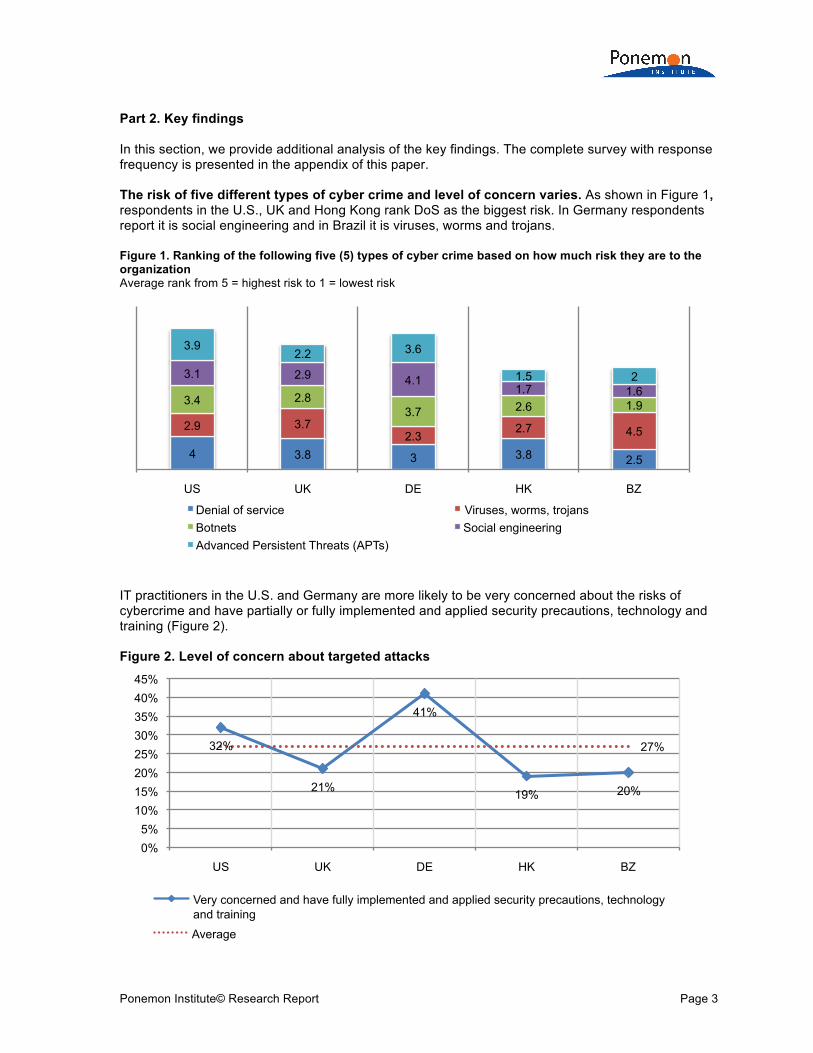
Part 2. Key findings In this section, we provide additional analysis of the key findings. The complete survey with response frequency is presented in the appendix of this paper. The risk of five different types of cyber crime and level of concern varies. As shown in Figure 1, respondents in the U.S., UK and Hong Kong rank DoS as the biggest risk. In Germany respondents report it is social engineering and in Brazil it is viruses, worms and trojans. Figure 1. Ranking of the following five (5) types of cyber crime based on how much risk they are to the organization Average rank from 5 = highest risk to 1 = lowest risk
IT practitioners in the U.S. and Germany are more likely to be very concerned about the risks of cybercrime and have partially or fully implemented and applied security precautions, technology and training (Figure 2). Figure 2. Level of concern about targeted attacks
4 3.8 3 3.8 2.5
2.9 3.7 2.3
2.7 4.5
3.4 2.8 3.7 2.6 1.9
3.1 2.9 4.1 1.7 1.6
3.9 2.2 3.6
1.5 2
US UK DE HK BZ
Denial of service Viruses, worms, trojans Botnets Social engineering Advanced Persistent Threats (APTs)
32%
21%
41%
19% 20%
27%
0% 5%
10% 15% 20% 25% 30% 35% 40% 45%
US UK DE HK BZ
Very concerned and have fully implemented and applied security precautions, technology and training Average
Ponemon Institute© Research Report Page 4
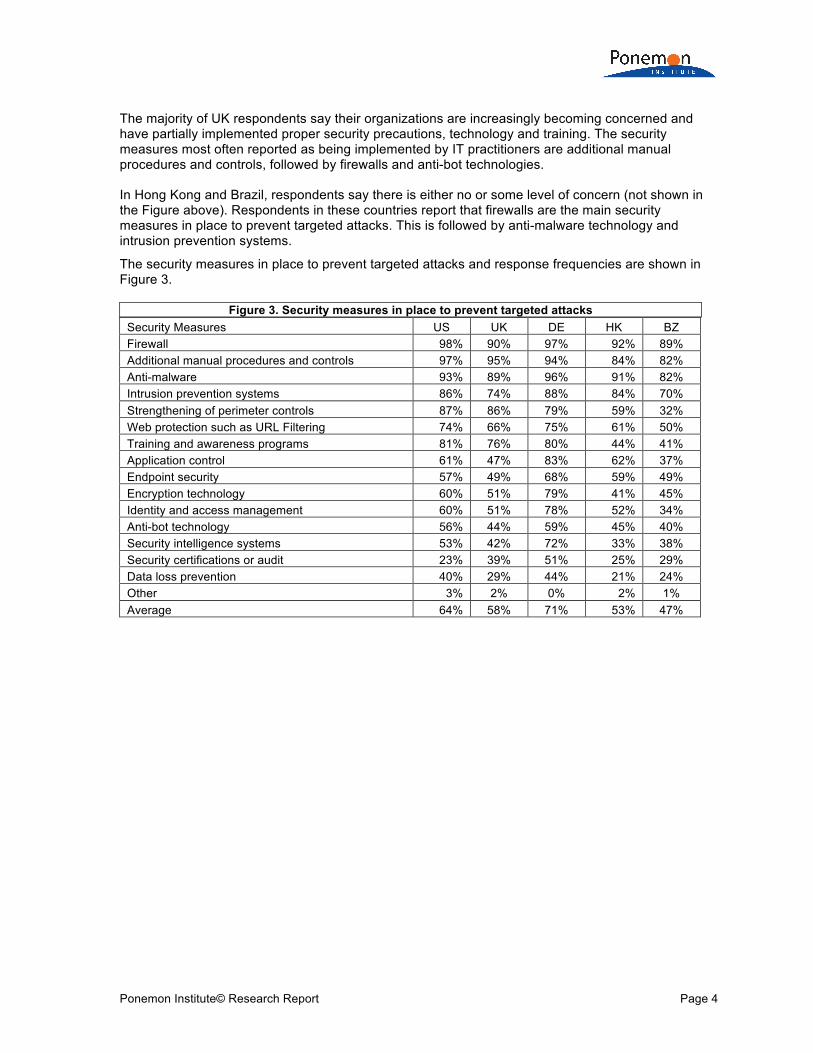
The majority of UK respondents say their organizations are increasingly becoming concerned and have partially implemented proper security precautions, technology and training. The security measures most often reported as being implemented by IT practitioners are additional manual procedures and controls, followed by firewalls and anti-bot technologies. In Hong Kong and Brazil, respondents say there is either no or some level of concern (not shown in the Figure above). Respondents in these countries report that firewalls are the main security measures in place to prevent targeted attacks. This is followed by anti-malware technology and intrusion prevention systems.
The security measures in place to prevent targeted attacks and response frequencies are shown in Figure 3.
Figure 3. Security measures in place to prevent targeted attacks Security Measures US UK DE HK BZ Firewall 98% 90% 97% 92% 89% Additional manual procedures and controls 97% 95% 94% 84% 82% Anti-malware 93% 89% 96% 91% 82% Intrusion prevention systems 86% 74% 88% 84% 70% Strengthening of perimeter controls 87% 86% 79% 59% 32% Web protection such as URL Filtering 74% 66% 75% 61% 50% Training and awareness programs 81% 76% 80% 44% 41% Application control 61% 47% 83% 62% 37% Endpoint security 57% 49% 68% 59% 49% Encryption technology 60% 51% 79% 41% 45% Identity and access management 60% 51% 78% 52% 34% Anti-bot technology 56% 44% 59% 45% 40% Security intelligence systems 53% 42% 72% 33% 38% Security certifications or audit 23% 39% 51% 25% 29% Data loss prevention 40% 29% 44% 21% 24% Other 3% 2% 0% 2% 1% Average 64% 58% 71% 53% 47%
Ponemon Institute© Research Report Page 5
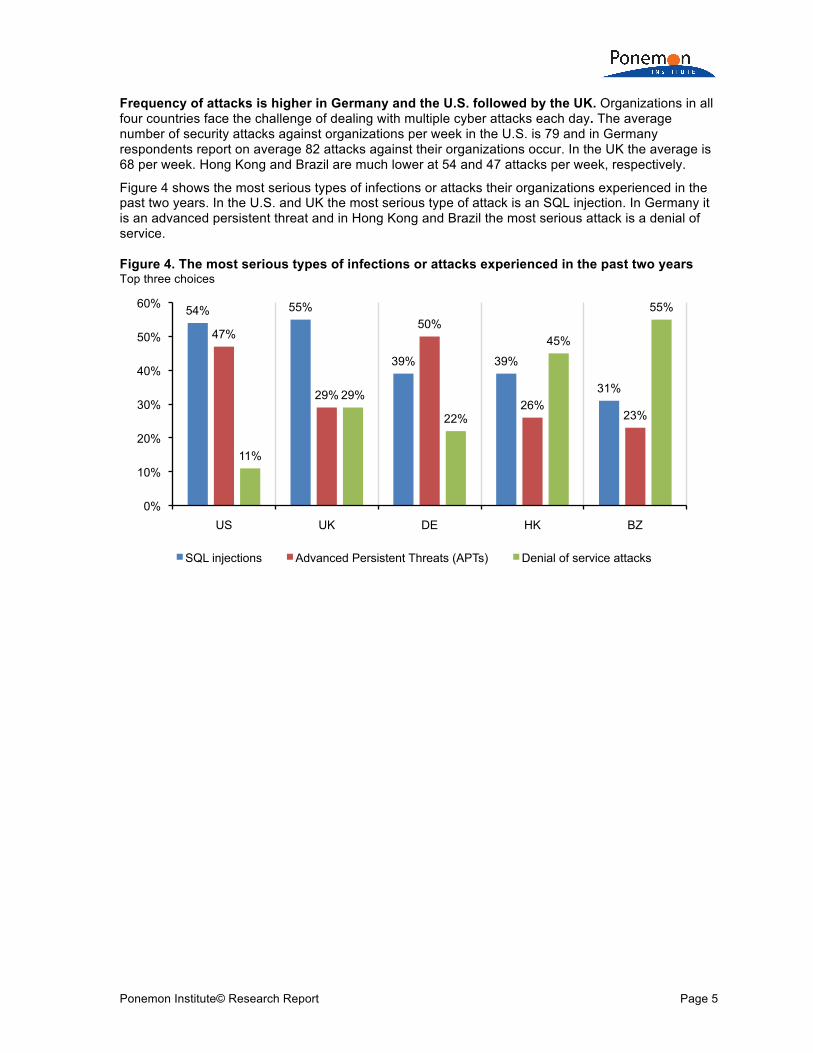
Frequency of attacks is higher in Germany and the U.S. followed by the UK. Organizations in all four countries face the challenge of dealing with multiple cyber attacks each day. The average number of security attacks against organizations per week in the U.S. is 79 and in Germany respondents report on average 82 attacks against their organizations occur. In the UK the average is 68 per week. Hong Kong and Brazil are much lower at 54 and 47 attacks per week, respectively.
Figure 4 shows the most serious types of infections or attacks their organizations experienced in the past two years. In the U.S. and UK the most serious type of attack is an SQL injection. In Germany it is an advanced persistent threat and in Hong Kong and Brazil the most serious attack is a denial of service. Figure 4. The most serious types of infections or attacks experienced in the past two years Top three choices
54% 55%
39% 39%
31%
47%
29%
50%
26% 23%
11%
29%
22%
45%
55%
0%
10%
20%
30%
40%
50%
60%
US UK DE HK BZ
SQL injections Advanced Persistent Threats (APTs) Denial of service attacks
Ponemon Institute© Research Report Page 6
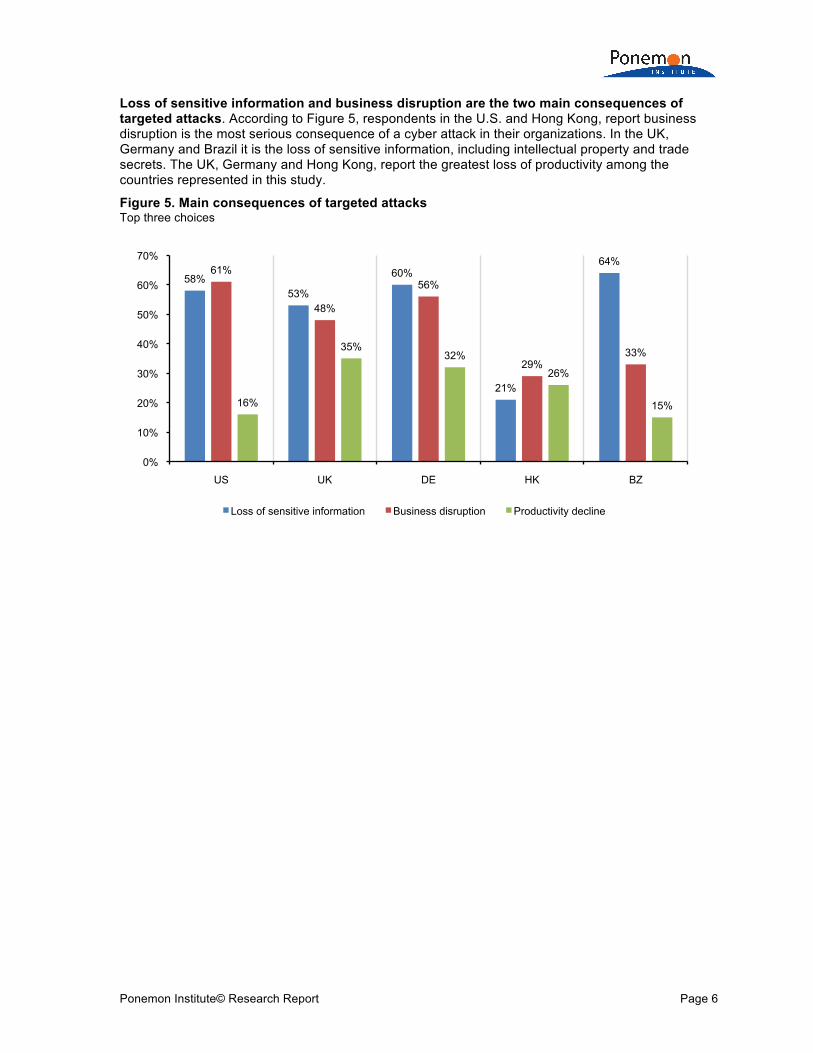
Loss of sensitive information and business disruption are the two main consequences of targeted attacks. According to Figure 5, respondents in the U.S. and Hong Kong, report business disruption is the most serious consequence of a cyber attack in their organizations. In the UK, Germany and Brazil it is the loss of sensitive information, including intellectual property and trade secrets. The UK, Germany and Hong Kong, report the greatest loss of productivity among the countries represented in this study.
Figure 5. Main consequences of targeted attacks Top three choices
58% 53%
60%
21%
64% 61%
48%
56%
29% 33%
16%
35% 32%
26%
15%
0%
10%
20%
30%
40%
50%
60%
70%
US UK DE HK BZ
Loss of sensitive information Business disruption Productivity decline
Ponemon Institute© Research Report Page 7
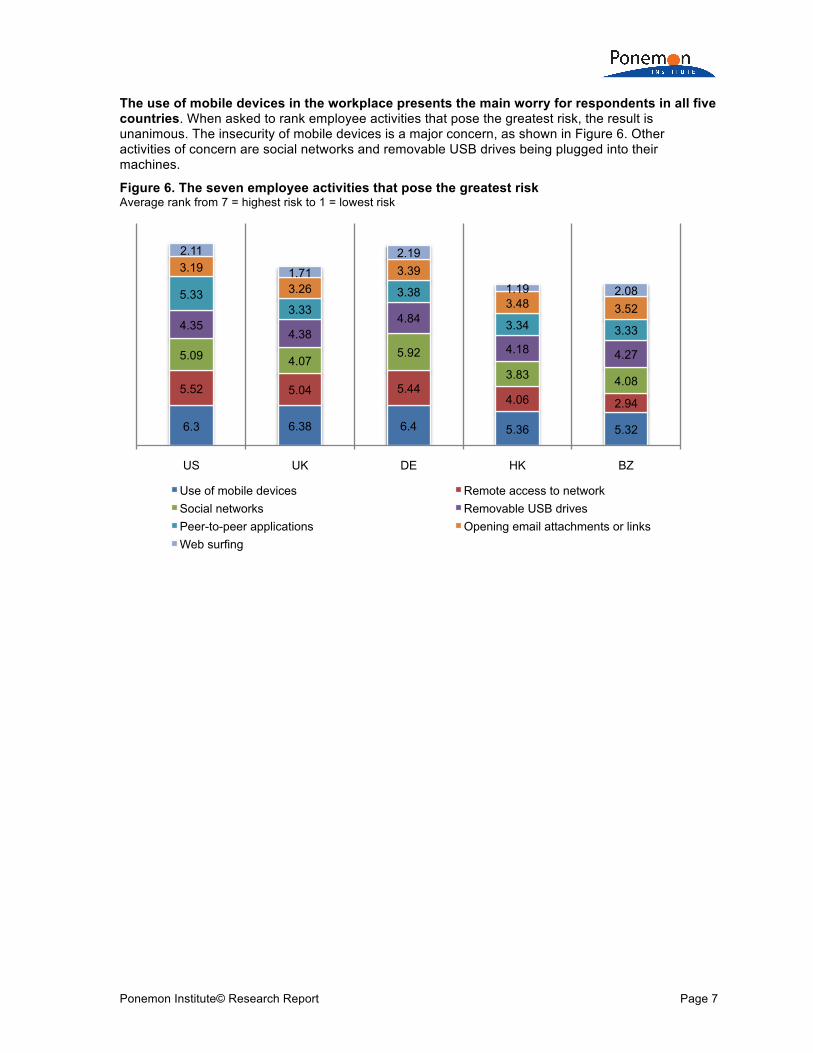
The use of mobile devices in the workplace presents the main worry for respondents in all five countries. When asked to rank employee activities that pose the greatest risk, the result is unanimous. The insecurity of mobile devices is a major concern, as shown in Figure 6. Other activities of concern are social networks and removable USB drives being plugged into their machines.
Figure 6. The seven employee activities that pose the greatest risk Average rank from 7 = highest risk to 1 = lowest risk
6.3 6.38 6.4 5.36 5.32
5.52 5.04 5.44 4.06 2.94
5.09 4.07 5.92
3.83 4.08
4.35 4.38
4.84
4.18 4.27
5.33 3.33
3.38
3.34 3.33
3.19
3.26 3.39
3.48 3.52
2.11
1.71
2.19
1.19 2.08
US UK DE HK BZ
Use of mobile devices Remote access to network Social networks Removable USB drives Peer-to-peer applications Opening email attachments or links Web surfing
Ponemon Institute© Research Report Page 8
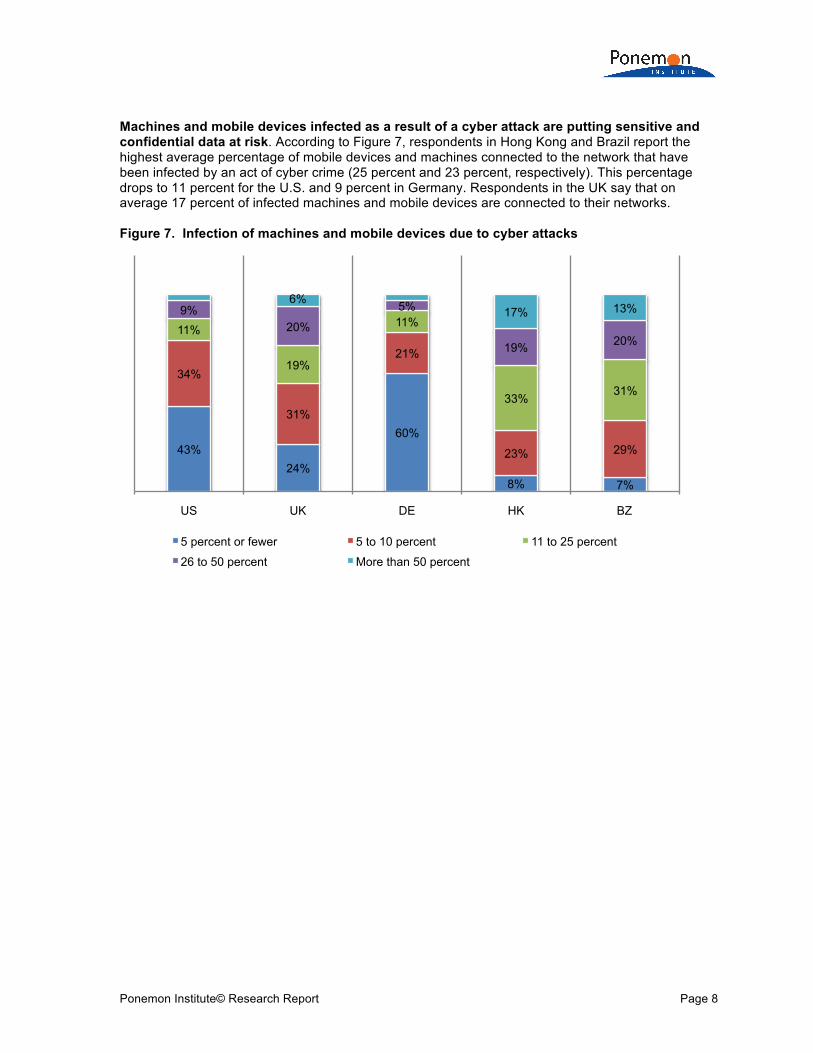
Machines and mobile devices infected as a result of a cyber attack are putting sensitive and confidential data at risk. According to Figure 7, respondents in Hong Kong and Brazil report the highest average percentage of mobile devices and machines connected to the network that have been infected by an act of cyber crime (25 percent and 23 percent, respectively). This percentage drops to 11 percent for the U.S. and 9 percent in Germany. Respondents in the UK say that on average 17 percent of infected machines and mobile devices are connected to their networks. Figure 7. Infection of machines and mobile devices due to cyber attacks
43% 24%
60%
8% 7%
34%
31%
21%
23% 29%
11%
19%
11%
33% 31%
9% 20%
5%
19% 20%
6% 17% 13%
US UK DE HK BZ
5 percent or fewer 5 to 10 percent 11 to 25 percent
26 to 50 percent More than 50 percent
Ponemon Institute© Research Report Page 9
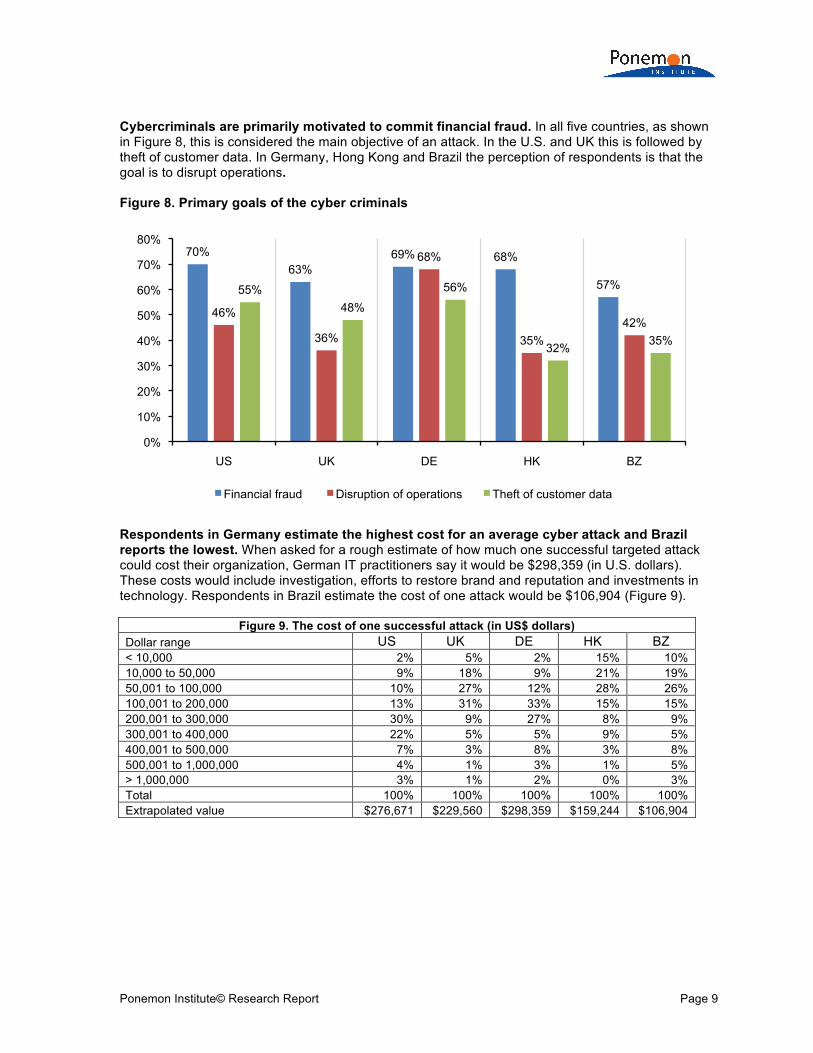
Cybercriminals are primarily motivated to commit financial fraud. In all five countries, as shown in Figure 8, this is considered the main objective of an attack. In the U.S. and UK this is followed by theft of customer data. In Germany, Hong Kong and Brazil the perception of respondents is that the goal is to disrupt operations. Figure 8. Primary goals of the cyber criminals
Respondents in Germany estimate the highest cost for an average cyber attack and Brazil reports the lowest. When asked for a rough estimate of how much one successful targeted attack could cost their organization, German IT practitioners say it would be $298,359 (in U.S. dollars). These costs would include investigation, efforts to restore brand and reputation and investments in technology. Respondents in Brazil estimate the cost of one attack would be $106,904 (Figure 9).
Figure 9. The cost of one successful attack (in US$ dollars) Dollar range US UK DE HK BZ < 10,000 2% 5% 2% 15% 10% 10,000 to 50,000 9% 18% 9% 21% 19% 50,001 to 100,000 10% 27% 12% 28% 26% 100,001 to 200,000 13% 31% 33% 15% 15% 200,001 to 300,000 30% 9% 27% 8% 9% 300,001 to 400,000 22% 5% 5% 9% 5% 400,001 to 500,000 7% 3% 8% 3% 8% 500,001 to 1,000,000 4% 1% 3% 1% 5% > 1,000,000 3% 1% 2% 0% 3% Total 100% 100% 100% 100% 100% Extrapolated value $276,671 $229,560 $298,359 $159,244 $106,904
70% 63%
69% 68%
57%
46%
36%
68%
35% 42%
55% 48%
56%
32% 35%
0%
10%
20%
30%
40%
50%
60%
70%
80%
US UK DE HK BZ
Financial fraud Disruption of operations Theft of customer data
Ponemon Institute© Research Report Page 10
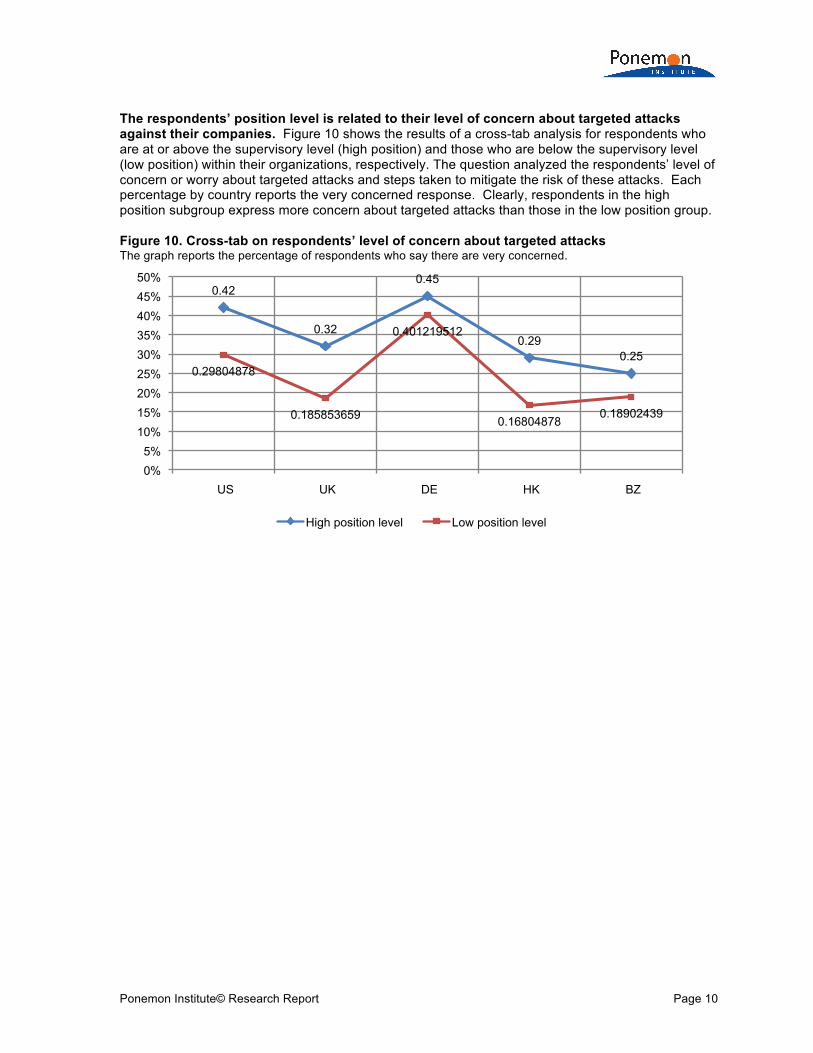
The respondents’ position level is related to their level of concern about targeted attacks against their companies. Figure 10 shows the results of a cross-tab analysis for respondents who are at or above the supervisory level (high position) and those who are below the supervisory level (low position) within their organizations, respectively. The question analyzed the respondents’ level of concern or worry about targeted attacks and steps taken to mitigate the risk of these attacks. Each percentage by country reports the very concerned response. Clearly, respondents in the high position subgroup express more concern about targeted attacks than those in the low position group. Figure 10. Cross-tab on respondents’ level of concern about targeted attacks The graph reports the percentage of respondents who say there are very concerned.
0.42
0.32
0.45
0.29 0.25
0.29804878
0.185853659
0.401219512
0.16804878 0.18902439
0% 5%
10% 15% 20% 25% 30% 35% 40% 45% 50%
US UK DE HK BZ
High position level Low position level
Ponemon Institute© Research Report Page 11
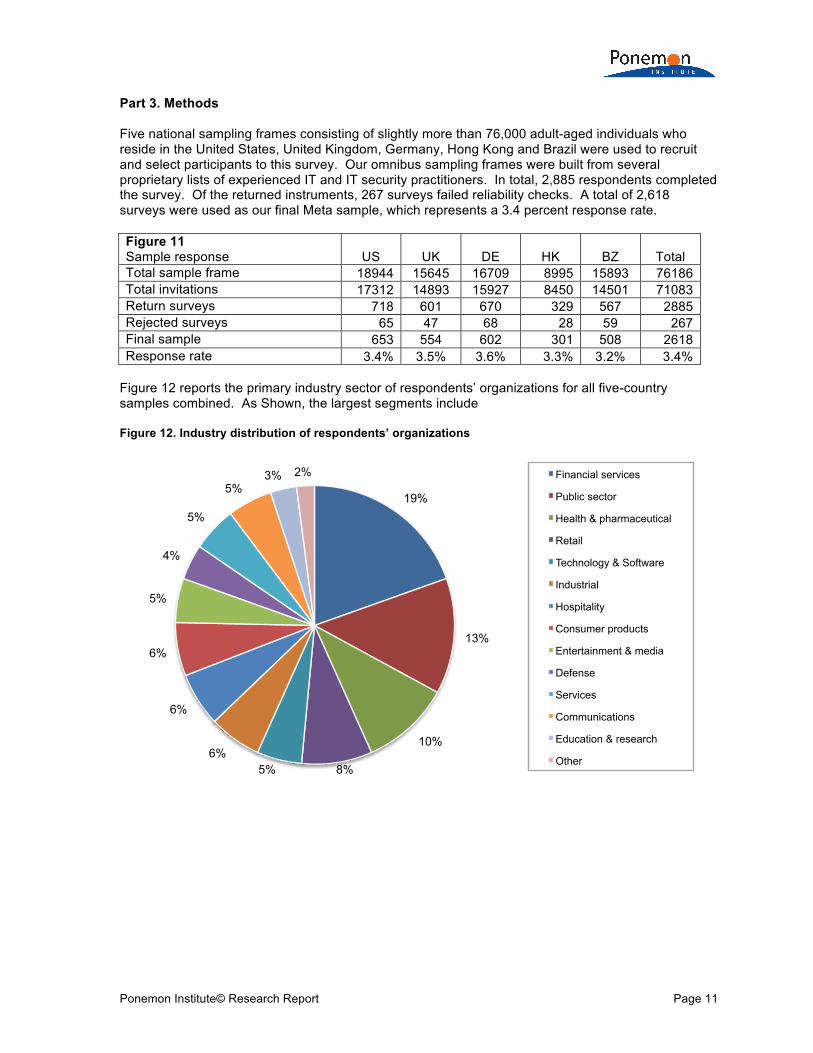
Part 3. Methods Five national sampling frames consisting of slightly more than 76,000 adult-aged individuals who reside in the United States, United Kingdom, Germany, Hong Kong and Brazil were used to recruit and select participants to this survey. Our omnibus sampling frames were built from several proprietary lists of experienced IT and IT security practitioners. In total, 2,885 respondents completed the survey. Of the returned instruments, 267 surveys failed reliability checks. A total of 2,618 surveys were used as our final Meta sample, which represents a 3.4 percent response rate. Figure 11 Sample response US UK DE HK BZ Total Total sample frame 18944 15645 16709 8995 15893 76186 Total invitations 17312 14893 15927 8450 14501 71083 Return surveys 718 601 670 329 567 2885 Rejected surveys 65 47 68 28 59 267 Final sample 653 554 602 301 508 2618 Response rate 3.4% 3.5% 3.6% 3.3% 3.2% 3.4%
Figure 12 reports the primary industry sector of respondents’ organizations for all five-country samples combined. As Shown, the largest segments include Figure 12. Industry distribution of respondents’ organizations
19%
13%
10%
8% 5% 6%
6%
6%
5%
4%
5%
5% 3% 2% Financial services
Public sector
Health & pharmaceutical
Retail
Technology & Software
Industrial
Hospitality
Consumer products
Entertainment & media
Defense
Services
Communications
Education & research
Other
Ponemon Institute© Research Report Page 12
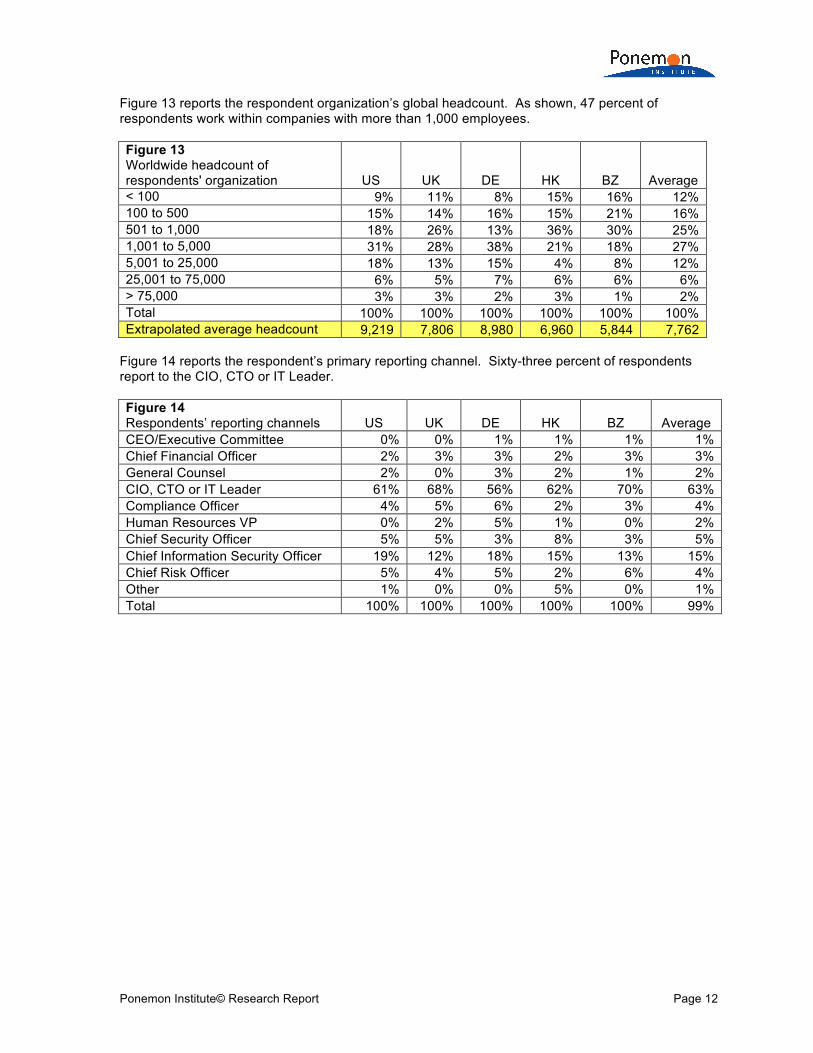
Figure 13 reports the respondent organization’s global headcount. As shown, 47 percent of respondents work within companies with more than 1,000 employees. Figure 13 Worldwide headcount of respondents' organization US UK DE HK BZ Average < 100 9% 11% 8% 15% 16% 12% 100 to 500 15% 14% 16% 15% 21% 16% 501 to 1,000 18% 26% 13% 36% 30% 25% 1,001 to 5,000 31% 28% 38% 21% 18% 27% 5,001 to 25,000 18% 13% 15% 4% 8% 12% 25,001 to 75,000 6% 5% 7% 6% 6% 6% > 75,000 3% 3% 2% 3% 1% 2% Total 100% 100% 100% 100% 100% 100% Extrapolated average headcount 9,219 7,806 8,980 6,960 5,844 7,762
Figure 14 reports the respondent’s primary reporting channel. Sixty-three percent of respondents report to the CIO, CTO or IT Leader. Figure 14 Respondents’ reporting channels US UK DE HK BZ Average CEO/Executive Committee 0% 0% 1% 1% 1% 1% Chief Financial Officer 2% 3% 3% 2% 3% 3% General Counsel 2% 0% 3% 2% 1% 2% CIO, CTO or IT Leader 61% 68% 56% 62% 70% 63% Compliance Officer 4% 5% 6% 2% 3% 4% Human Resources VP 0% 2% 5% 1% 0% 2% Chief Security Officer 5% 5% 3% 8% 3% 5% Chief Information Security Officer 19% 12% 18% 15% 13% 15% Chief Risk Officer 5% 4% 5% 2% 6% 4% Other 1% 0% 0% 5% 0% 1% Total 100% 100% 100% 100% 100% 99%
Ponemon Institute© Research Report Page 13
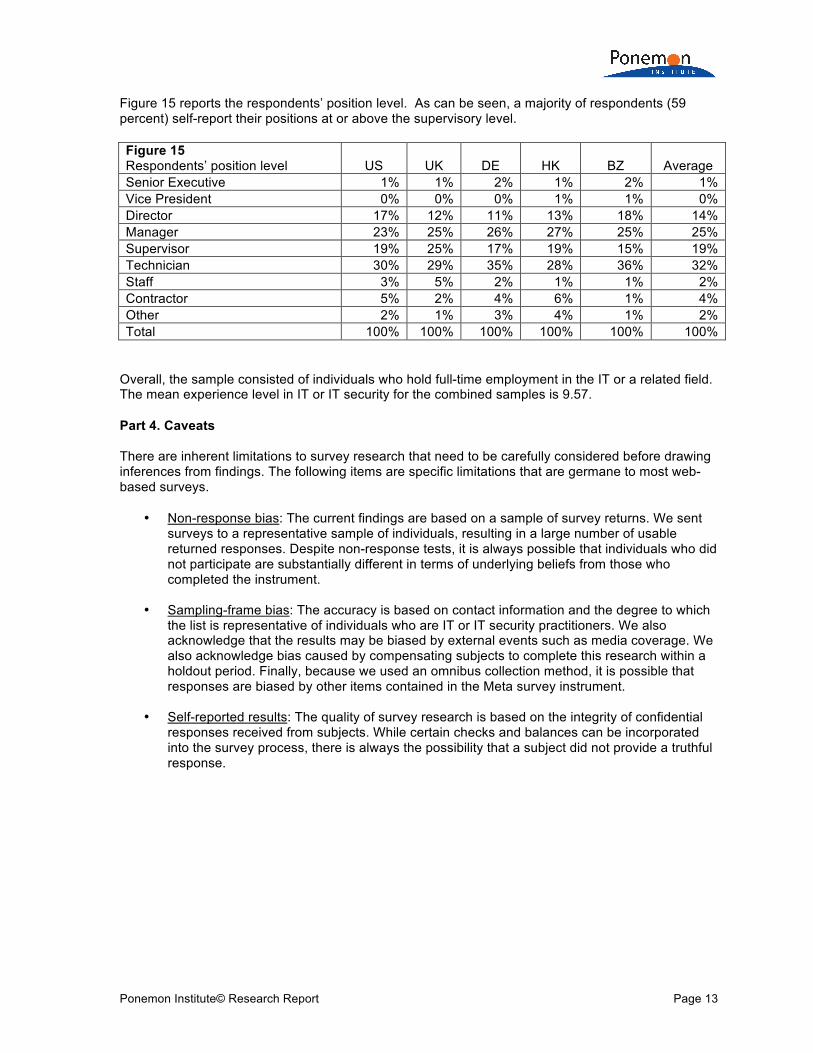
Figure 15 reports the respondents’ position level. As can be seen, a majority of respondents (59 percent) self-report their positions at or above the supervisory level.
Figure 15 Respondents’ position level US UK DE HK BZ Average Senior Executive 1% 1% 2% 1% 2% 1% Vice President 0% 0% 0% 1% 1% 0% Director 17% 12% 11% 13% 18% 14% Manager 23% 25% 26% 27% 25% 25% Supervisor 19% 25% 17% 19% 15% 19% Technician 30% 29% 35% 28% 36% 32% Staff 3% 5% 2% 1% 1% 2% Contractor 5% 2% 4% 6% 1% 4% Other 2% 1% 3% 4% 1% 2% Total 100% 100% 100% 100% 100% 100%
Overall, the sample consisted of individuals who hold full-time employment in the IT or a related field. The mean experience level in IT or IT security for the combined samples is 9.57.
Part 4. Caveats There are inherent limitations to survey research that need to be carefully considered before drawing inferences from findings. The following items are specific limitations that are germane to most web-based surveys.
• Non-response bias: The current findings are based on a sample of survey returns. We sent surveys to a representative sample of individuals, resulting in a large number of usable returned responses. Despite non-response tests, it is always possible that individuals who did not participate are substantially different in terms of underlying beliefs from those who completed the instrument.
• Sampling-frame bias: The accuracy is based on contact information and the degree to which
the list is representative of individuals who are IT or IT security practitioners. We also acknowledge that the results may be biased by external events such as media coverage. We also acknowledge bias caused by compensating subjects to complete this research within a holdout period. Finally, because we used an omnibus collection method, it is possible that responses are biased by other items contained in the Meta survey instrument.
• Self-reported results: The quality of survey research is based on the integrity of confidential
responses received from subjects. While certain checks and balances can be incorporated into the survey process, there is always the possibility that a subject did not provide a truthful response.
Ponemon Institute© Research Report Page 14
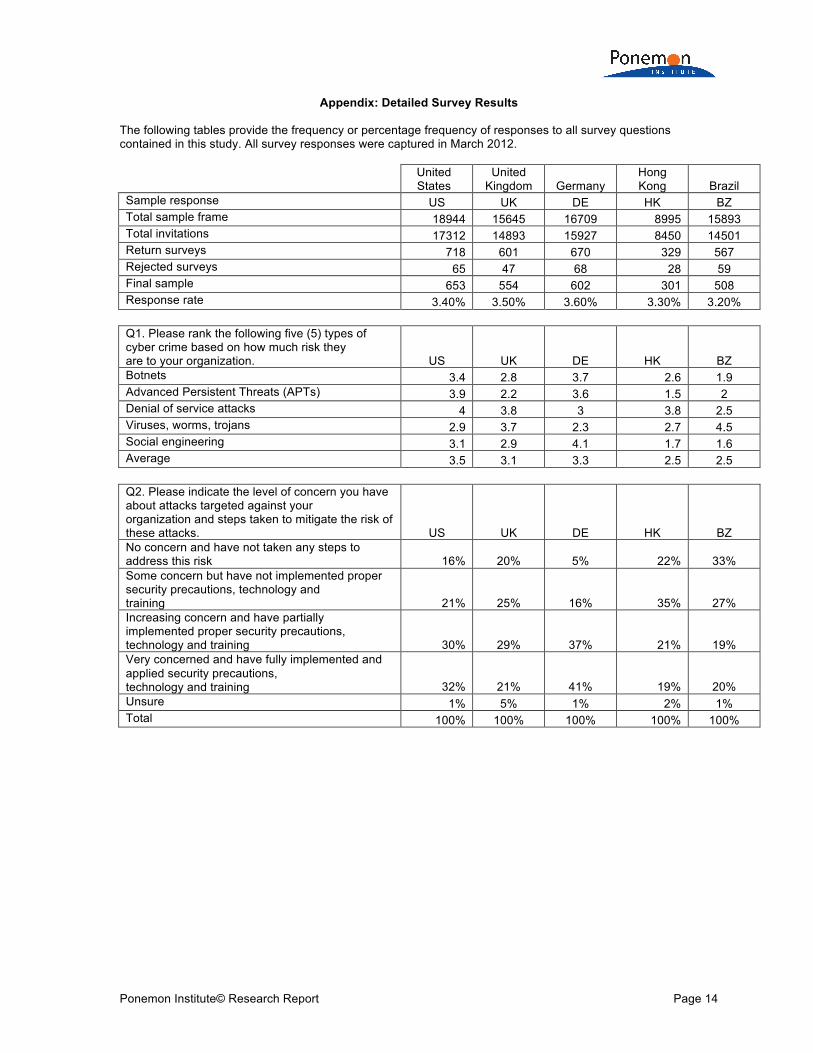
Appendix: Detailed Survey Results The following tables provide the frequency or percentage frequency of responses to all survey questions contained in this study. All survey responses were captured in March 2012. United
States United
Kingdom Germany Hong Kong Brazil
Sample response US UK DE HK BZ Total sample frame 18944 15645 16709 8995 15893 Total invitations 17312 14893 15927 8450 14501 Return surveys 718 601 670 329 567 Rejected surveys 65 47 68 28 59 Final sample 653 554 602 301 508 Response rate 3.40% 3.50% 3.60% 3.30% 3.20% Q1. Please rank the following five (5) types of cyber crime based on how much risk they are to your organization. US UK DE HK BZ Botnets 3.4 2.8 3.7 2.6 1.9 Advanced Persistent Threats (APTs) 3.9 2.2 3.6 1.5 2 Denial of service attacks 4 3.8 3 3.8 2.5 Viruses, worms, trojans 2.9 3.7 2.3 2.7 4.5 Social engineering 3.1 2.9 4.1 1.7 1.6 Average 3.5 3.1 3.3 2.5 2.5 Q2. Please indicate the level of concern you have about attacks targeted against your organization and steps taken to mitigate the risk of these attacks. US UK DE HK BZ No concern and have not taken any steps to address this risk 16% 20% 5% 22% 33% Some concern but have not implemented proper security precautions, technology and training 21% 25% 16% 35% 27% Increasing concern and have partially implemented proper security precautions, technology and training 30% 29% 37% 21% 19% Very concerned and have fully implemented and applied security precautions, technology and training 32% 21% 41% 19% 20% Unsure 1% 5% 1% 2% 1% Total 100% 100% 100% 100% 100%
Ponemon Institute© Research Report Page 15
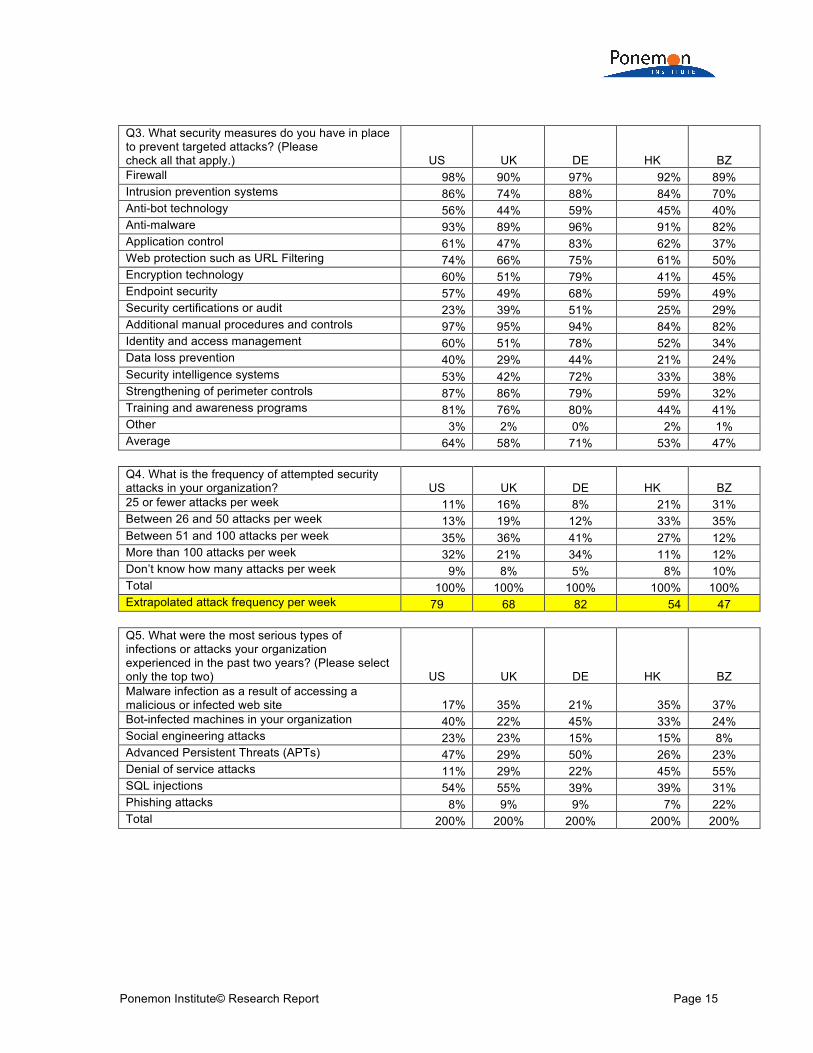
Q3. What security measures do you have in place to prevent targeted attacks? (Please check all that apply.) US UK DE HK BZ Firewall 98% 90% 97% 92% 89% Intrusion prevention systems 86% 74% 88% 84% 70% Anti-bot technology 56% 44% 59% 45% 40% Anti-malware 93% 89% 96% 91% 82% Application control 61% 47% 83% 62% 37% Web protection such as URL Filtering 74% 66% 75% 61% 50% Encryption technology 60% 51% 79% 41% 45% Endpoint security 57% 49% 68% 59% 49% Security certifications or audit 23% 39% 51% 25% 29% Additional manual procedures and controls 97% 95% 94% 84% 82% Identity and access management 60% 51% 78% 52% 34% Data loss prevention 40% 29% 44% 21% 24% Security intelligence systems 53% 42% 72% 33% 38% Strengthening of perimeter controls 87% 86% 79% 59% 32% Training and awareness programs 81% 76% 80% 44% 41% Other 3% 2% 0% 2% 1% Average 64% 58% 71% 53% 47% Q4. What is the frequency of attempted security attacks in your organization? US UK DE HK BZ 25 or fewer attacks per week 11% 16% 8% 21% 31% Between 26 and 50 attacks per week 13% 19% 12% 33% 35% Between 51 and 100 attacks per week 35% 36% 41% 27% 12% More than 100 attacks per week 32% 21% 34% 11% 12% Don’t know how many attacks per week 9% 8% 5% 8% 10% Total 100% 100% 100% 100% 100% Extrapolated attack frequency per week 79 68 82 54 47 Q5. What were the most serious types of infections or attacks your organization experienced in the past two years? (Please select only the top two) US UK DE HK BZ Malware infection as a result of accessing a malicious or infected web site 17% 35% 21% 35% 37% Bot-infected machines in your organization 40% 22% 45% 33% 24% Social engineering attacks 23% 23% 15% 15% 8% Advanced Persistent Threats (APTs) 47% 29% 50% 26% 23% Denial of service attacks 11% 29% 22% 45% 55% SQL injections 54% 55% 39% 39% 31% Phishing attacks 8% 9% 9% 7% 22% Total 200% 200% 200% 200% 200%
Ponemon Institute© Research Report Page 16
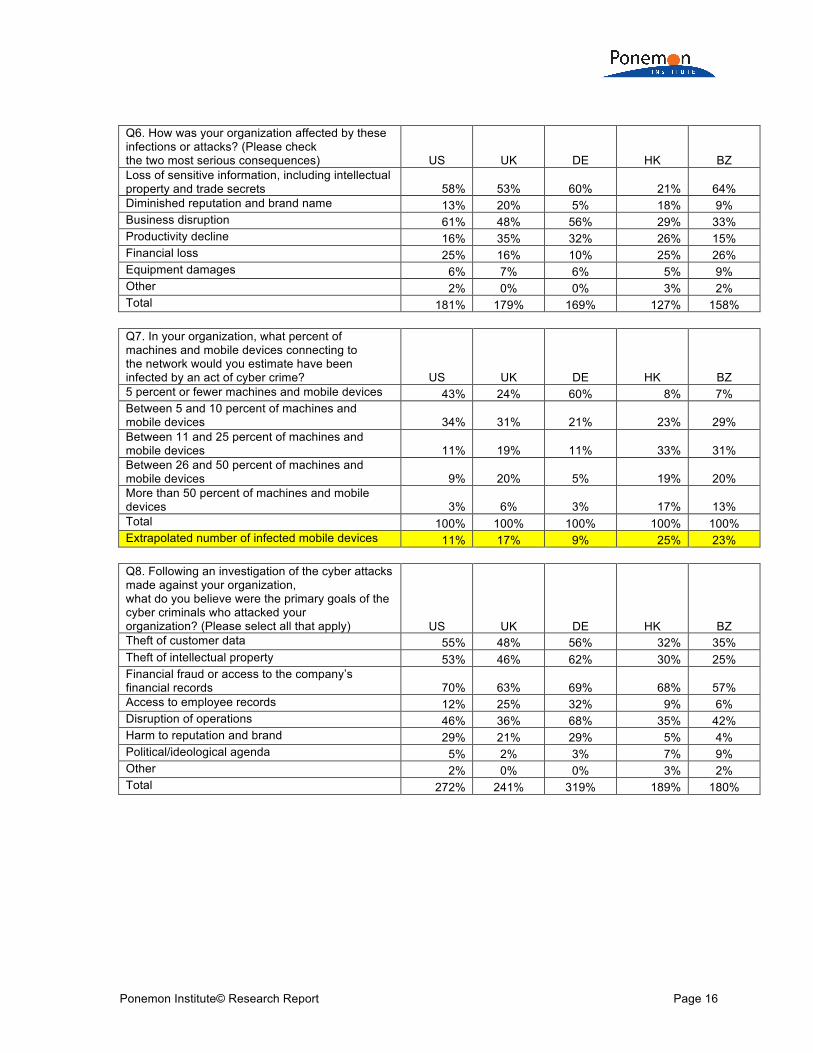
Q6. How was your organization affected by these infections or attacks? (Please check the two most serious consequences) US UK DE HK BZ Loss of sensitive information, including intellectual property and trade secrets 58% 53% 60% 21% 64% Diminished reputation and brand name 13% 20% 5% 18% 9% Business disruption 61% 48% 56% 29% 33% Productivity decline 16% 35% 32% 26% 15% Financial loss 25% 16% 10% 25% 26% Equipment damages 6% 7% 6% 5% 9% Other 2% 0% 0% 3% 2% Total 181% 179% 169% 127% 158% Q7. In your organization, what percent of machines and mobile devices connecting to the network would you estimate have been infected by an act of cyber crime? US UK DE HK BZ 5 percent or fewer machines and mobile devices 43% 24% 60% 8% 7% Between 5 and 10 percent of machines and mobile devices 34% 31% 21% 23% 29% Between 11 and 25 percent of machines and mobile devices 11% 19% 11% 33% 31% Between 26 and 50 percent of machines and mobile devices 9% 20% 5% 19% 20% More than 50 percent of machines and mobile devices 3% 6% 3% 17% 13% Total 100% 100% 100% 100% 100% Extrapolated number of infected mobile devices 11% 17% 9% 25% 23% Q8. Following an investigation of the cyber attacks made against your organization, what do you believe were the primary goals of the cyber criminals who attacked your organization? (Please select all that apply) US UK DE HK BZ Theft of customer data 55% 48% 56% 32% 35% Theft of intellectual property 53% 46% 62% 30% 25% Financial fraud or access to the company’s financial records 70% 63% 69% 68% 57% Access to employee records 12% 25% 32% 9% 6% Disruption of operations 46% 36% 68% 35% 42% Harm to reputation and brand 29% 21% 29% 5% 4% Political/ideological agenda 5% 2% 3% 7% 9% Other 2% 0% 0% 3% 2% Total 272% 241% 319% 189% 180%
Ponemon Institute© Research Report Page 17
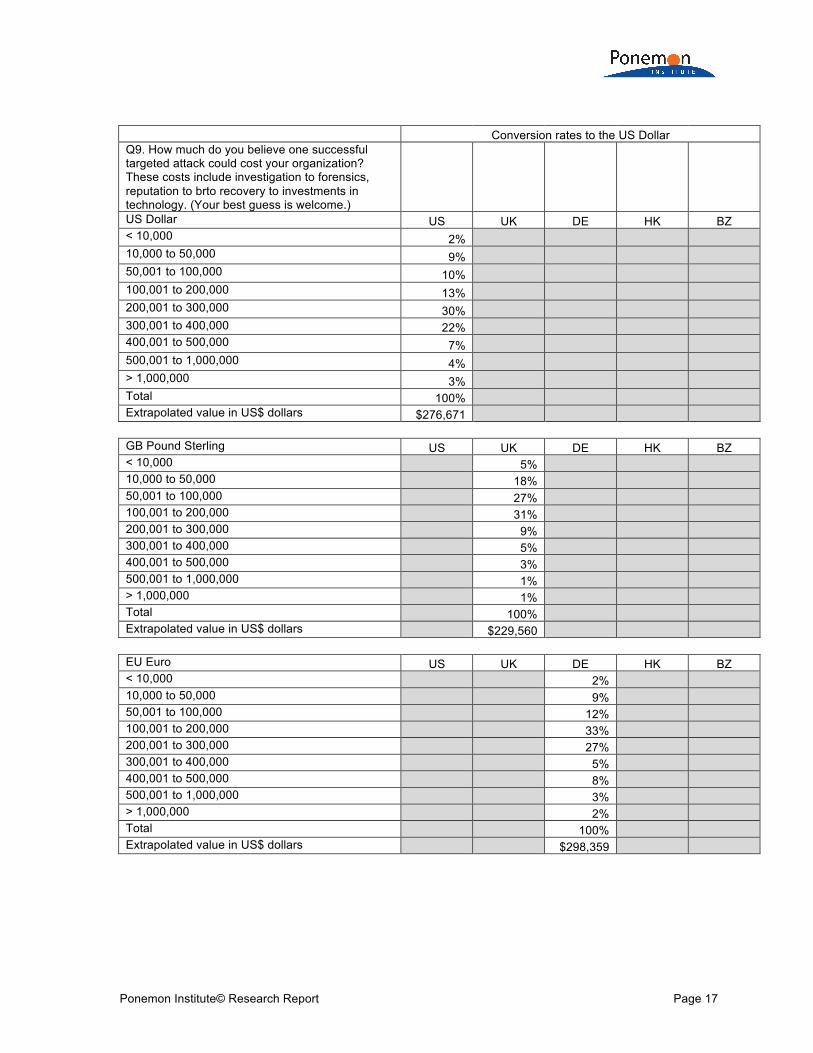
Conversion rates to the US Dollar Q9. How much do you believe one successful targeted attack could cost your organization? These costs include investigation to forensics, reputation to brto recovery to investments in technology. (Your best guess is welcome.) US Dollar US UK DE HK BZ < 10,000 2% 10,000 to 50,000 9% 50,001 to 100,000 10% 100,001 to 200,000 13% 200,001 to 300,000 30% 300,001 to 400,000 22% 400,001 to 500,000 7% 500,001 to 1,000,000 4% > 1,000,000 3% Total 100% Extrapolated value in US$ dollars $276,671 GB Pound Sterling US UK DE HK BZ < 10,000 5% 10,000 to 50,000 18% 50,001 to 100,000 27% 100,001 to 200,000 31% 200,001 to 300,000 9% 300,001 to 400,000 5% 400,001 to 500,000 3% 500,001 to 1,000,000 1% > 1,000,000 1% Total 100% Extrapolated value in US$ dollars $229,560 EU Euro US UK DE HK BZ < 10,000 2% 10,000 to 50,000 9% 50,001 to 100,000 12% 100,001 to 200,000 33% 200,001 to 300,000 27% 300,001 to 400,000 5% 400,001 to 500,000 8% 500,001 to 1,000,000 3% > 1,000,000 2% Total 100% Extrapolated value in US$ dollars $298,359
Ponemon Institute© Research Report Page 18
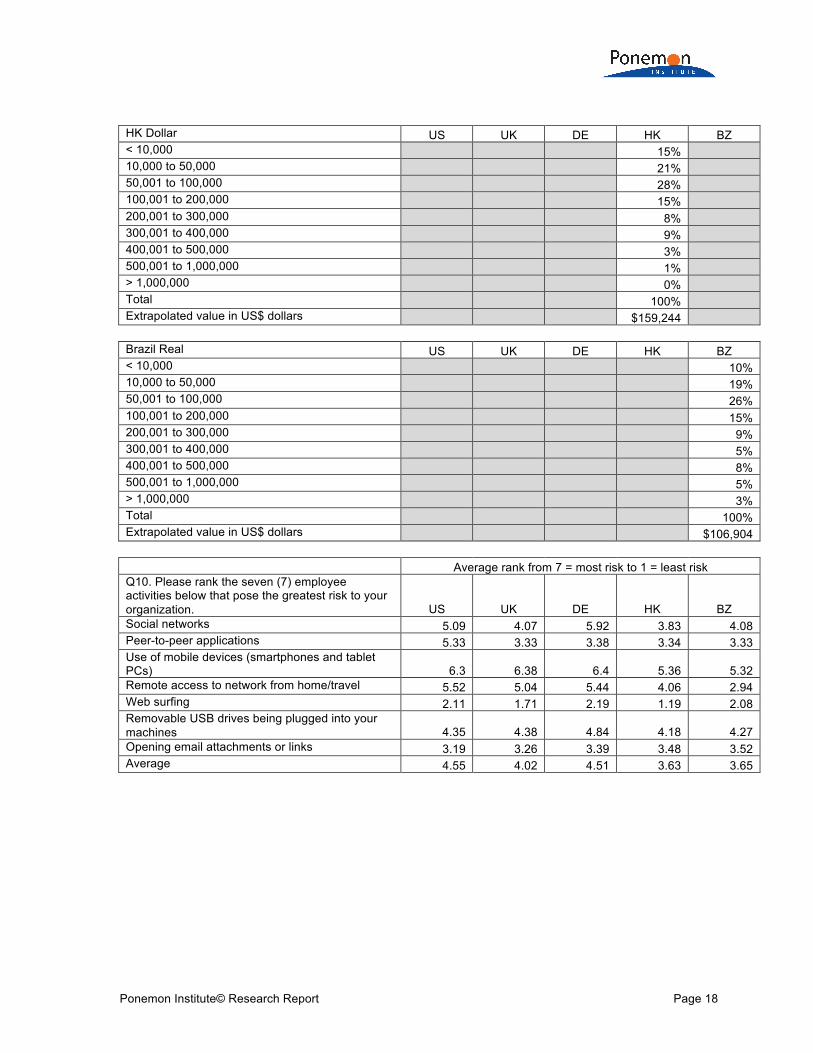
HK Dollar US UK DE HK BZ < 10,000 15% 10,000 to 50,000 21% 50,001 to 100,000 28% 100,001 to 200,000 15% 200,001 to 300,000 8% 300,001 to 400,000 9% 400,001 to 500,000 3% 500,001 to 1,000,000 1% > 1,000,000 0% Total 100% Extrapolated value in US$ dollars $159,244 Brazil Real US UK DE HK BZ < 10,000 10% 10,000 to 50,000 19% 50,001 to 100,000 26% 100,001 to 200,000 15% 200,001 to 300,000 9% 300,001 to 400,000 5% 400,001 to 500,000 8% 500,001 to 1,000,000 5% > 1,000,000 3% Total 100% Extrapolated value in US$ dollars $106,904 Average rank from 7 = most risk to 1 = least risk Q10. Please rank the seven (7) employee activities below that pose the greatest risk to your organization. US UK DE HK BZ Social networks 5.09 4.07 5.92 3.83 4.08 Peer-to-peer applications 5.33 3.33 3.38 3.34 3.33 Use of mobile devices (smartphones and tablet PCs) 6.3 6.38 6.4 5.36 5.32 Remote access to network from home/travel 5.52 5.04 5.44 4.06 2.94 Web surfing 2.11 1.71 2.19 1.19 2.08 Removable USB drives being plugged into your machines 4.35 4.38 4.84 4.18 4.27 Opening email attachments or links 3.19 3.26 3.39 3.48 3.52 Average 4.55 4.02 4.51 3.63 3.65
Ponemon Institute© Research Report Page 19
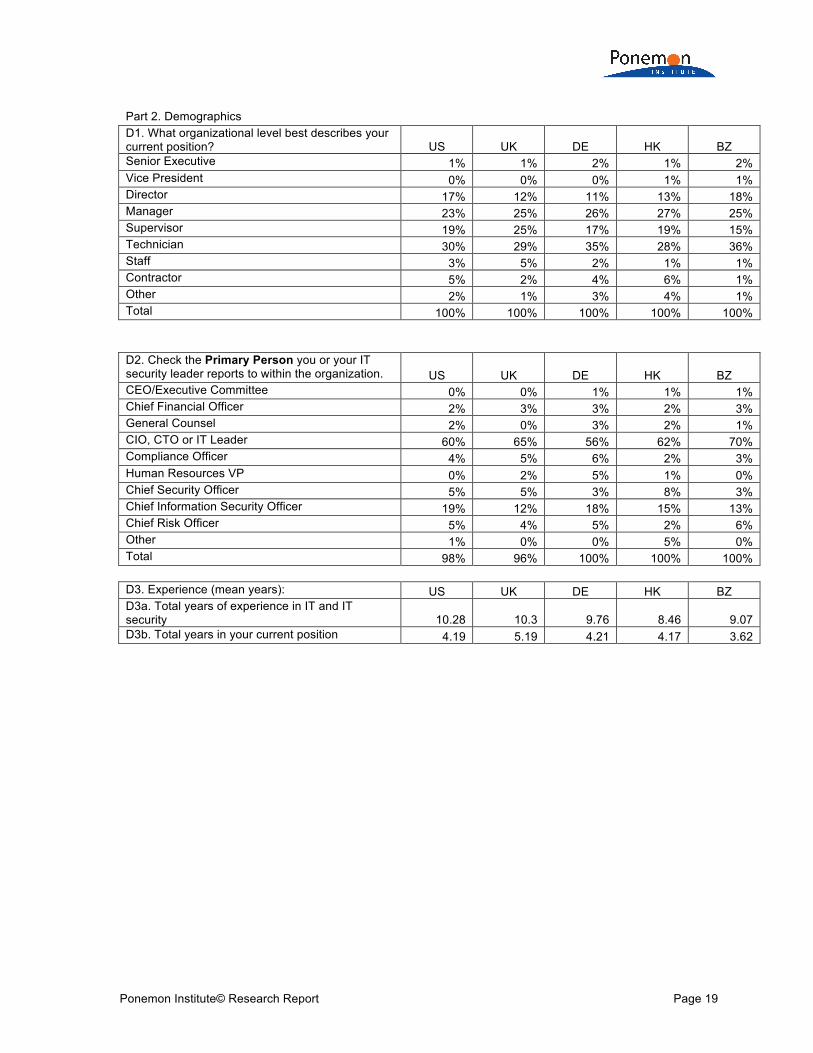
Part 2. Demographics D1. What organizational level best describes your current position? US UK DE HK BZ Senior Executive 1% 1% 2% 1% 2% Vice President 0% 0% 0% 1% 1% Director 17% 12% 11% 13% 18% Manager 23% 25% 26% 27% 25% Supervisor 19% 25% 17% 19% 15% Technician 30% 29% 35% 28% 36% Staff 3% 5% 2% 1% 1% Contractor 5% 2% 4% 6% 1% Other 2% 1% 3% 4% 1% Total 100% 100% 100% 100% 100% D2. Check the Primary Person you or your IT security leader reports to within the organization. US UK DE HK BZ CEO/Executive Committee 0% 0% 1% 1% 1% Chief Financial Officer 2% 3% 3% 2% 3% General Counsel 2% 0% 3% 2% 1% CIO, CTO or IT Leader 60% 65% 56% 62% 70% Compliance Officer 4% 5% 6% 2% 3% Human Resources VP 0% 2% 5% 1% 0% Chief Security Officer 5% 5% 3% 8% 3% Chief Information Security Officer 19% 12% 18% 15% 13% Chief Risk Officer 5% 4% 5% 2% 6% Other 1% 0% 0% 5% 0% Total 98% 96% 100% 100% 100% D3. Experience (mean years): US UK DE HK BZ D3a. Total years of experience in IT and IT security 10.28 10.3 9.76 8.46 9.07 D3b. Total years in your current position 4.19 5.19 4.21 4.17 3.62
Ponemon Institute© Research Report Page 20
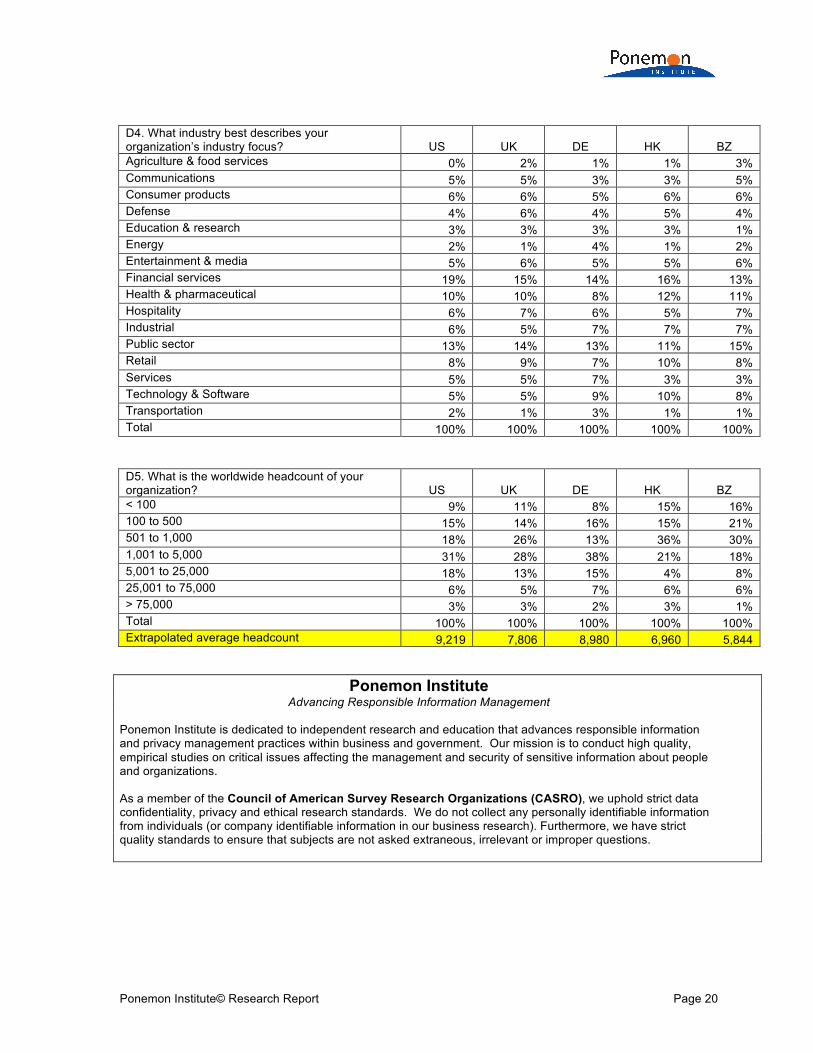
D4. What industry best describes your organization’s industry focus? US UK DE HK BZ Agriculture & food services 0% 2% 1% 1% 3% Communications 5% 5% 3% 3% 5% Consumer products 6% 6% 5% 6% 6% Defense 4% 6% 4% 5% 4% Education & research 3% 3% 3% 3% 1% Energy 2% 1% 4% 1% 2% Entertainment & media 5% 6% 5% 5% 6% Financial services 19% 15% 14% 16% 13% Health & pharmaceutical 10% 10% 8% 12% 11% Hospitality 6% 7% 6% 5% 7% Industrial 6% 5% 7% 7% 7% Public sector 13% 14% 13% 11% 15% Retail 8% 9% 7% 10% 8% Services 5% 5% 7% 3% 3% Technology & Software 5% 5% 9% 10% 8% Transportation 2% 1% 3% 1% 1% Total 100% 100% 100% 100% 100% D5. What is the worldwide headcount of your organization? US UK DE HK BZ < 100 9% 11% 8% 15% 16% 100 to 500 15% 14% 16% 15% 21% 501 to 1,000 18% 26% 13% 36% 30% 1,001 to 5,000 31% 28% 38% 21% 18% 5,001 to 25,000 18% 13% 15% 4% 8% 25,001 to 75,000 6% 5% 7% 6% 6% > 75,000 3% 3% 2% 3% 1% Total 100% 100% 100% 100% 100% Extrapolated average headcount 9,219 7,806 8,980 6,960 5,844
Ponemon Institute Advancing Responsible Information Management
Ponemon Institute is dedicated to independent research and education that advances responsible information and privacy management practices within business and government. Our mission is to conduct high quality, empirical studies on critical issues affecting the management and security of sensitive information about people and organizations. As a member of the Council of American Survey Research Organizations (CASRO), we uphold strict data confidentiality, privacy and ethical research standards. We do not collect any personally identifiable information from individuals (or company identifiable information in our business research). Furthermore, we have strict quality standards to ensure that subjects are not asked extraneous, irrelevant or improper questions.