Embed Size (px)
Citation preview
CHELVERTON SMALL COMPANIESDIVIDEND TRUST PLC
Half-Yearly Reportfor the six months ended 31 October 2017
A S S E T M A N A G E M E N TCHE LV E RTON
C

Contents
Investment Objective and Policy 1
Financial Highlights 1
Interim Management Report 2
Principal Risks 4
Responsibility Statement of the Directors in respect of the Half-Yearly Report 5
Condensed Consolidated Statement of Comprehensive Income (unaudited) 6
Condensed Consolidated Statement of Changes in Net Equity (unaudited) 8
Condensed Consolidated Balance Sheets (unaudited) 9
Condensed Consolidated Statement of Cash Flows (unaudited) 10
Notes to the Condensed Half-Yearly Report 11
Portfolio Investments 14
Shareholder Information 16
Capital Structure 17
Directors and Advisers 18

1
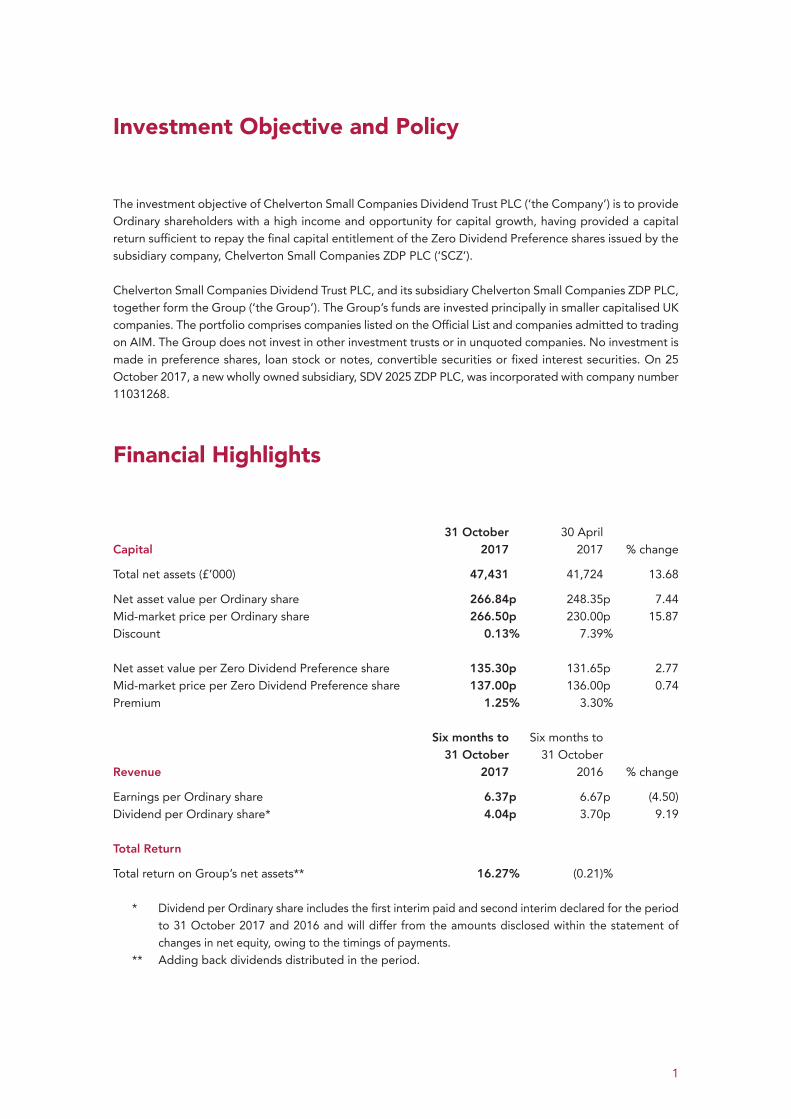
Investment Objective and Policy
The investment objective of Chelverton Small Companies Dividend Trust PLC (‘the Company’) is to provide
Ordinary shareholders with a high income and opportunity for capital growth, having provided a capital
return sufficient to repay the final capital entitlement of the Zero Dividend Preference shares issued by the
subsidiary company, Chelverton Small Companies ZDP PLC (‘SCZ’).
Chelverton Small Companies Dividend Trust PLC, and its subsidiary Chelverton Small Companies ZDP PLC,
together form the Group (‘the Group’). The Group’s funds are invested principally in smaller capitalised UK
companies. The portfolio comprises companies listed on the Official List and companies admitted to trading
on AIM. The Group does not invest in other investment trusts or in unquoted companies. No investment is
made in preference shares, loan stock or notes, convertible securities or fixed interest securities. On 25
October 2017, a new wholly owned subsidiary, SDV 2025 ZDP PLC, was incorporated with company number
11031268.
Financial Highlights
31 October 30 April
Capital 2017 2017 % change
Total net assets (£’000) 47,431 41,724 13.68
Net asset value per Ordinary share 266.84p 248.35p 7.44
Mid-market price per Ordinary share 266.50p 230.00p 15.87
Discount 0.13% 7.39%
Net asset value per Zero Dividend Preference share 135.30p 131.65p 2.77
Mid-market price per Zero Dividend Preference share 137.00p 136.00p 0.74
Premium 1.25% 3.30%
Six months to Six months to
31 October 31 October
Revenue 2017 2016 % change
Earnings per Ordinary share 6.37p 6.67p (4.50)
Dividend per Ordinary share* 4.04p 3.70p 9.19
Total Return
Total return on Group’s net assets** 16.27% (0.21)%
* Dividend per Ordinary share includes the first interim paid and second interim declared for the period
to 31 October 2017 and 2016 and will differ from the amounts disclosed within the statement of
changes in net equity, owing to the timings of payments.
** Adding back dividends distributed in the period.

2
Interim Management Report
Results
This half-yearly report covers the six months to 31 October 2017. The net asset value per Ordinary share
at 31 October 2017 was 266.84p up from 248.35p at 30 April 2017, an increase of 7.44% in the past six
months compared to an increase of 7.4% in the MSCI Small Cap Index.
Since the beginning of the Company’s financial year, the Ordinary share price has increased from 230p to
266.5p at 31 October 2017, an increase of 15.87%, whilst the discount of 7.4% at the year-end has been
almost eliminated with the shares traded at a negligible discount of 0.13% at the period end. Since then
the share price has increased to 269.5p as at 10 November 2017.
Dividend
A first interim dividend of 2.02p (2016: 1.85p) per Ordinary share was paid on 2 October 2017. The Board
has declared a second interim dividend of 2.02p per Ordinary share (2016: 1.85p) payable on 2 January
2017 to shareholders on the register on 8 December 2017, making a total for the half year of 4.04p per
Ordinary share (2016: 3.70p) an increase of 9.2%. At present it is anticipated that the Company will maintain
this level of dividend for the third quarter and will likewise maintain the same level for the fourth interim of
2.40p as was paid last year making a total normal dividend of 8.46p for the year.
Portfolio
In the last six months we have increased our investment in seventeen of our existing holdings, taking
advantage of lower share prices and shares being available, including Alumasc Group, Bloomsbury
Publishing, Castings, Connect Group, DFS Furniture, Diversified Gas & Oil, Epwin Group, Galliford Try, Go-
Ahead Group, Hilton Food Group, Kier Group, Marston’s, Murgitroyd Group, Produce Investments, Randall
& Quilter Investment, RTC Group and Severfield.
During the period we added eight new names to the portfolio, BCA Marketplace – manager of used car
auctions, De La Rue – bank note manufacturer and security printing, Flowtech Fluidpower – distributor of
technical fluid power products, Palace Capital - property investment, Premier Asset Management Group –
asset management, Restaurant Group – operator of chains of UK restaurants and public houses, Revolution
Bars Group – operator of premium bars, Strix Group – manufacturer of kettle safety controls.
Funds were raised from the sale of nineteen of our holdings, Cape was the only company taken over in the
period whilst the holdings in Bioventix, UP Global Sourcing Holdings, Morgan Sindall Group and
Intermediate Capital Group were sold in their entirety. The following holdings were reduced as they grew
to become larger weightings on lower yields, Acal, Amino Technologies, Brewin Dolphin Holdings, Brown
(N) Group, Conviviality, Curtis Banks Group, Dairy Crest Group, Games Workshop Group, GVC Holdings,
Huntsworth, Jarvis Securities, McColls Retail Group, Polar Capital Holdings and StatPro Group.
Outlook
The fund has continued to see strong growth across the portfolio and with the number of attractive
opportunities available the portfolio has been increased to 73 holdings and with steady growth in the UK
economy we believe the portfolio will continue to prosper.
We have been surprised that there has not been more takeover offers, building on the increase last year
however one can only suppose that the Brexit uncertainty is holding corporates back from taking advantage
of the sterling discount.

3
UK Gross Domestic Product growth has been subdued for the last six months, although there are signs
that UK Growth will increase in the future mirroring the recent pick-up in the Eurozone.
The Brexit position will likely remain unresolved until the “eleventh” hour, that being the EU’s usual modus
operandi in negotiations. Repeatedly “experts” have said that a deal is of equal importance to both sides
however until the Germans and the French properly engage then little or no obvious progress will be made.
The dividends of the underlying companies continue to be increased and we believe that this will continue
into 2018 with company balance sheets remaining in a strong state.
Chelverton Asset Management
15 November 2017

4
Principal Risks
The principal risks facing the Group are substantially unchanged since the date of the Annual Report for
the year ended 30 April 2017 and continue to be as set out in that report on pages 9 to 10. Risks faced by
the Group include, but are not limited to, market risk, discount volatility, regulatory risk, financial risk and
risks associated with banking counterparties.

5
Responsibility Statement of the Directors in respectof the Half-Yearly Report
We confirm that to the best of our knowledge:
• the condensed set of financial statements has been prepared in compliance with the IAS 34 ‘Interim
Financial Reporting’ and gives a true and fair view of the assets, liabilities and financial position of
the Group; and
• the interim management report and notes to the Half-Yearly Report include a fair view of the
information required by:
(a) DTR 4.2.7R of the Disclosure and Transparency Rules, being an indication of the important events
that have occurred during the first six months of the financial year and their impact on the condensed
set of financial statements; and a description of the principal risks and uncertainties for the remaining
six months of the year; and
(b)DTR 4.2.8R of the Disclosure and Transparency Rules, being related party transactions that have taken
place in the first six months of the current financial year and that have materially affected the financial
position or performance of the Group during that period; and any changes in the related party
transactions described in the last annual report that could do so.
This Half-Yearly Report was approved by the Board of Directors on 15 November 2017 and the above
responsibility statement was signed on its behalf by Lord Lamont, Chairman.

6
Condensed Consolidated Statement of ComprehensiveIncome (unaudited)for the six months ended 31 October 2017
Six months to 31 October Year to 30 April
2017 2017
Revenue Capital Total Revenue Capital Total
£’000 £’000 £’000 £’000 £’000 £’000
(audited)
Gains/(losses) on investments at fair
value through profit or loss – 3,820 3,820 – 6,642 6,642
Investment income 1,314 – 1,314 2,361 – 2,361
Investment management fee (75) (223) (298) (119) (357) (476)
Other expenses (118) (6) (124) (224) (12) (236)
Net return/(deficit) before finance costs
and taxation 1,121 3,591 4,712 2,018 6,273 8,291
Finance costs
Appropriations in respect of Zero Dividend
Preference shares – (341) (341) – (633) (633)
Net return/(deficit) before taxation 1,121 3,250 4,371 2,018 5,640 7,658
Taxation (see note 2) (4) – (4) – – –
Total comprehensive income for
the period 1,117 3,250 4,367 2,018 5,640 7,658
Revenue Capital Total Revenue Capital Total
pence pence pence pence pence pence
Earnings per:
Ordinary share
(see note 3) 6.37 18.53 24.90 12.17 34.03 46.20
Zero Dividend Preference share
(see note 3) – 3.65 3.65 – 7.37 7.37
The total column of this statement is the Statement of Comprehensive Income of the Group prepared in
accordance with International Financial Reporting Standards (‘IFRS’) as adopted by the European Union.
All revenue and capital items in the above statement derive from continuing operations. No operations
were acquired or discontinued during the period. All of the net return for the period and the total
comprehensive income for the period is attributed to the shareholders of the Group. The supplementary
revenue and capital return columns are presented for information purposes as recommended by the
Statement of Recommended Practice issued by the Association of Investment Companies (‘AIC’).
7
Six months to 31 October
2016
Revenue Capital Total
£’000 £’000 £’000
Gains/(losses) on investments at fair value
– (690) (690) through profit or loss
1,270 – 1,270 Investment income
(56) (166) (222) Investment management fee
(110) (7) (117) Other expenses
Net return/(deficit) before finance costs
1,104 (863) 241 and taxation
Finance costs
Appropriations in respect of Zero Dividend
– (313) (313) Preference shares
1,104 (1,176) (72) Net return/(deficit) before taxation
– – – Taxation (see note 2)
1,104 (1,176) (72) Total comprehensive income for the period
Revenue Capital Total
pence pence pence
Earnings per:
Ordinary share
6.67 (7.11) (0.44) (see note 3)
Zero Dividend Preference share
– 3.68 3.68 (see note 3)
8
Condensed Consolidated Statement of Changes in NetEquity (unaudited)for the six months ended 31 October 2017
Share
Share premium Capital Revenue
capital account reserve reserve Total
£’000 £’000 £’000 £’000 £’000
Six months ended 31 October 2017
30 April 2017 4,200 12,915 21,632 2,977 41,724
Total comprehensive income for the period – – 3,250 1,117 4,367
Ordinary shares issued 244 2,252 – – 2,496
Expenses of ordinary share issue – (73) – – (73)
Dividends paid (see note 4) – – – (1,083) (1,083)
31 October 2017 4,444 15,094 24,882 3,011 47,431
Year ended 30 April 2017 (audited)
30 April 2016 4,138 12,403 15,992 2,544 35,077
Total comprehensive income for the year – – 5,640 2,018 7,658
Ordinary shares issued 62 519 – – 581
Expenses of ordinary share issue – (7) – – (7)
Dividends paid – – – (1,585) (1,585)
30 April 2017 4,200 12,915 21,632 2,977 41,724
Six months ended 31 October 2016
30 April 2016 4,138 12,403 15,992 2,544 35,077
Total comprehensive income for the period – – (1,176) 1,104 (72)
Dividends paid – – – (968) (968)
31 October 2016 4,138 12,403 14,816 2,680 34,037

9
Condensed Consolidated Balance Sheet(unaudited)as at 31 October 2017
31 October 30 April 31 October
2017 2017 2016
£’000 £’000 £’000
(audited)
Non-current assets
Investments at fair value through profit or loss 59,806 53,827 44,605
Current assets
Trade and other receivables 238 262 340
Cash and cash equivalents 377 89 59
615 351 399
Total assets 60,421 54,178 45,004
Current liabilities
Trade and other payables (341) (146) (125)
Zero Dividend Preference shares (12,649) (12,308) –
(12,990) (12,454) (125)
Total assets less current liabilities 47,431 41,724 44,879
Non-current liabilities
Zero Dividend Preference shares – – (10,842)
Total liabilities (12,990) (12,454) (10,967)
Net assets 47,431 41,724 34,037
Represented by:
Share capital 4,444 4,200 4,138
Share premium account 15,094 12,915 12,403
Capital reserve 24,882 21,632 14,816
Revenue reserve 3,011 2,977 2,680
Equity shareholders’ funds 47,431 41,724 34,037
Net asset value per: (see note 5) pence pence pence
Ordinary share 266.84 248.35 205.66
Zero Dividend Preference share 135.30 131.65 127.56
10
Condensed Consolidated Statement of Cash Flows(unaudited)for the six months ended 31 October 2017
Six months to Year to Six months to
31 October 30 April 31 October
2017 2017 2016
£’000 £’000 £’000
(audited)
Operating activities
Investment income received 1,324 2,419 1,244
Investment management fee paid (278) (457) (221)
Administration and secretarial fees paid (32) (64) (37)
Other cash payments (112) (185) (122)
Net cash inflow from operating activities (see note 7) 902 1,713 864
Investing activities
Purchases of investments (8,960) (13,776) (3,314)
Sales of investments 7,006 11,988 3,448
Net cash (outflow)/inflow from investing activities (1,954) (1,788) 134
Financing activities
Issue of Zero Dividend Preference shares – 1,146 –
Issue of ordinary shares 2,496 581 –
Expenses of ordinary share issue (73) (7) –
Dividends paid (1,083) (1,585) (968)
Net cash inflow/(outflow) from financing activities 1,340 135 (968)
Change in cash and cash equivalents for period 288 60 30
Cash and cash equivalents at start of period 89 29 29
Cash and cash equivalents at end of period 377 89 59
Comprises of:
Cash and cash equivalents 377 89 59

Notes to the Condensed Half-Yearly Reportfor the six months ended 31 October 2017
1 General information
The financial information contained in this Half-Yearly Report does not constitute statutory financial
statements as defined in Section 434 of the Companies Act 2006. The statutory financial statements
for the year ended 30 April 2017, which contained an unqualified auditors’ report, have been lodged
with the Registrar of Companies and did not contain a statement required under the Companies Act
2006. These statutory financial statements were prepared under International Financial Reporting
Standards (‘IFRS’) and in accordance with the Statement of Recommended Practice (‘SORP’): Financial
Statements of Investment Trust Companies and Venture Capital Trusts issued by the AIC in November
2014, except to any extent where it conflicts with IFRS.
The Group has considerable financial resources and therefore the Directors believe that the Group is
well placed to manage its business risks and also believe that the Group will have sufficient resources
to continue in operational existence for the foreseeable future. Accordingly, they continue to adopt the
going concern basis in preparing this report.
This report has not been reviewed by the Group’s Auditors.
This report has been prepared using accounting policies adopted in the audited financial statements
for the year ended 30 April 2017. This report has also been prepared in compliance with IAS 34 ‘Interim
Financial Reporting’ as adopted by the European Union.
The Group has adequate financial resources and, as a consequence, the Directors believe that the Group
is well placed to manage its business risks successfully and continue to adopt the going concern basis
for this report.
2 Taxation
The Company has an effective tax rate of 0%. The estimated effective tax rate is 0% as investment gains
are exempt from tax owing to the Company’s status as an Investment Trust and there is expected to be
an excess of management expenses over taxable income and thus there is no charge for corporation tax.
3 Earnings per share
Ordinary shares
Revenue earnings per Ordinary share is based on revenue on ordinary activities after taxation of
£1,117,000 (30 April 2017: £2,018,000, 31 October 2016: £1,104,000) and on 17,536,371 (30 April 2017:
16,575,343, 31 October 2016: 16,550,000) Ordinary shares, being the weighted average number of
Ordinary shares in issue during the period.
Capital earnings per Ordinary share is based on the capital profit of £3,250,000 (30 April 2017: capital
profit of £5,640,000, 31 October 2016: capital loss of £1,176,000) and on 17,536,371 (30 April 2017:
16,573,343, 31 October 2016: 16,550,000) Ordinary shares, being the weighted average number of
Ordinary shares in issue during the period.
Zero Dividend Preference shares
Capital earnings per Zero Dividend Preference share is based on allocations from the Company of
£341,000 (30 April 2017: £633,000, 31 October 2016: £313,000) and on 9,349,000 (30 April 2017:
8,586,063, 31 October 2016: 8,500,000) Zero Dividend Preference shares being the weighted average
number of Zero Dividend Preference shares in issue during the period.
11

Notes to the Condensed Half-Yearly Report (continued)
for the six months ended 31 October 2017
4 Dividends
During the period, a fourth interim dividend of 2.4p per Ordinary share and a special dividend of 1.86p
per Ordinary share for the year ended 30 April 2017, together with a first interim dividend of 2.02p per
Ordinary share for the year ending 30 April 2018, have been paid to shareholders.
In addition the Board has declared a second interim dividend of 2.02p per Ordinary share payable on
2 January 2018 to shareholders on the register at 18 December 2017.
5 Net asset values
Ordinary shares
The net asset value per Ordinary share is based on assets attributable of £47,431,000 (30 April 2017:
£41,724,000, 31 October 2016: £34,037,000) and on 17,775,000 (30 April 2017: 16,800,000, 31 October
2016: 16,550,000) Ordinary shares being the number of shares in issue at the period end.
Zero Dividend Preference shares
The net asset value per Zero Dividend Preference shares is based on assets attributable of £12,649,000
(30 April 2017: £12,308,000, 31 October 2016: £10,842,000) and on 9,349,000 (30 April 2017: 9,349,000,
31 October 2016: 8,500,000) Zero Dividend Preference shares being the number of shares in issue at
the period end.
6 Fair value hierarchy
Financial assets and financial liabilities of the Company are carried in the condensed Consolidated
Balance Sheet at their fair value. The fair value is the amount at which the asset could be sold or the
liability transferred in a current transaction between market participants, other than a forced or
liquidation sale. For investments actively traded in organised financial markets, fair value is generally
determined by reference to Stock Exchange quoted market bid prices and Stock Exchange Electronic
Trading Services (‘SETS’) at last trade price at the Balance Sheet date, without adjustment for transaction
costs necessary to realise the asset.
The Company measures fair values using the following hierarchy that reflects the significance of the
inputs used in making the measurements. Categorisation within the hierarchy has been determined on
the basis of the lowest level input that is significant to the fair value measurement of the relevant assets
as follows:
Level 1 – Quoted prices (unadjusted) in active markets for identical assets or liabilities.
An active market is a market in which transactions for the asset or liability occur with sufficient frequency
and volume on an ongoing basis such that quoted prices reflect prices at which an orderly transaction
would take place between market participants at the measurement date. Quoted prices provided by
external pricing services, brokers and vendors are included in Level 1, if they reflect actual and regularly
occurring market transactions on an arm’s length basis.
Level 2 – Inputs other than quoted prices included within Level 1 that are observable for the asset or
liability, either directly (that is, as prices) or indirectly (that is, derived from prices).
Level 2 inputs include the following:
• quoted prices for similar (i.e. not identical) assets in active markets;
12
6 Fair value hierarchy (continued)
• quoted prices for identical or similar assets or liabilities in markets that are not active. Characteristics
of an inactive market include a significant decline in the volume and level of trading activity, the
available prices vary significantly over time or among market participants or the prices are not current;
• inputs other than quoted prices that are observable for the asset (for example, interest rates and
yield curves observable at commonly quoted intervals); and
• inputs that are derived principally from, or corroborated by, observable market data by correlation
or other means (market-corroborated inputs).
Level 3 – Inputs for the asset or liability that are not based on observable market data (unobservable inputs).
The level in the fair value hierarchy within which the fair value measurement is categorised in its entirety
is determined on the basis of the lowest level input that is significant to the fair value measurement in
its entirety. If a fair value measurement uses observable inputs that require significant adjustment based
on unobservable inputs, that measurement is a Level 3 measurement. Assessing the significance of a
particular input to the fair value measurement in its entirety requires judgement, considering factors
specific to the asset or liability.
As at 31 October 2017, 30 April 2017 and 31 October 2016 all of the Company’s investments are
classified as Level 1.
7 Reconciliation of net return/(deficit) before and after
taxation to net cash flow from operating activities
31 October 30 April 31 October
2017 2017 2016
£’000 £’000 £’000
Net return/(deficit) before taxation 4,371 7,658 (72)
Taxation (4) – –
Net return/(deficit) after taxation 4,367 7,658 (72)
Net capital (gain)/loss (3,250) (5,640) 1,176
Decrease/(increase) in receivables 9 50 (43)
Decrease in payables 5 14 (24)
Interest and expenses charged to the capital reserve (229) (369) (173)
Net cash inflow from operating activities 902 1,713 864
8 Related party transactions
The Group’s investments are managed by Chelverton Asset Management Limited, a company in which
Mr van Heesewijk, a Director of the Company and the subsidiary, has an interest. The amounts paid to
the Investment Manager in the period to 31 October 2017 were £298,000 (year ended 30 April 2017:
£476,000, six months to 31 October 2016: £222,000).
At 31 October 2017 there were amounts outstanding to be paid to the Investment Manager of £92,000
(year ended 30 April 2017: £72,000, six months to 31 October 2016: £53,000).
13
Portfolio Investmentsas at 31 October 2017
Market
value % of
Holding Sector £'000 portfolio
Diversified Gas & Oil Oil & Gas Producers 1,665 2.8
McColl's Retail Group Food & Drug Retailers 1,429 2.4
Jarvis Securities Financial Services 1,403 2.4
StatPro Group Software & Computer Services 1,368 2.3
Acal Support Services 1,268 2.1
Belvoir Lettings Real Estate Investment & Services 1,260 2.1
Alumasc Group Construction & Materials 1,230 2.1
Gattaca Support Services 1,220 2.0
Galliford Try Household Goods & Home Construction 1,218 2.0
Personal Group Holdings Nonlife Insurance 1,215 2.0
Connect Group Support Services 1,102 1.8
Amino Technologies Technology Hardware & Equipment 1,097 1.8
Braemar Shipping Services Industrial Transportation 1,078 1.8
Numis Corporation Financial Services 1,070 1.8
Curtis Banks Group Financial Services 1,067 1.8
Marston's Travel & Leisure 1,066 1.8
Ramsdens Holdings Financial Services 1,062 1.8
Brown (N) Group General Retailers 1,054 1.8
De La Rue Support Services 1,048 1.8
Mucklow (A&J) Group Real Estate Investment Trusts 980 1.6
Strix Group Electronic & Electrical Equipment 978 1.6
Moss Bros Group General Retailers 900 1.5
Polar Capital Holdings Financial Services 900 1.5
Randall & Quilter Investment Nonlife Insurance 896 1.5
Photo-Me International Leisure Goods 894 1.5
Park Group Financial Services 891 1.5
Hilton Food Group Food Producers 852 1.4
Conviviality Food & Drug Retailers 849 1.4
GVC Holdings Travel & Leisure 842 1.4
Kier Group Construction & Materials 832 1.4
Bloomsbury Publishing Media 818 1.4
Severfield Industrial Engineering 816 1.4
Coral Products General Industrials 810 1.4
Premier Asset Management Group Financial Services 804 1.3
Centaur Media Media 803 1.3
Huntsworth Media 800 1.3
Go-Ahead Group Travel & Leisure 797 1.3
Shoe Zone General Retailers 790 1.3
Chesnara Life Insurance 767 1.3
Town Centre Securities Real Estate Investment Trusts 762 1.3
Dairy Crest Group Food Producers 759 1.3
Orchard Funding Group Financial Services 750 1.3
Clarke (T) Construction & Materials 745 1.2
Flowtech Fluidpower Industrial Engineering 728 1.2
Macfarlane Group General Industrials 715 1.2
14

15
Market
value % of
Security Sector £’000 portfolio
Brewin Dolphin Holdings Financial Services 706 1.2
Sanderson Group Software & Computer Services 700 1.2
XP Power Electronic & Electrical Equipment 694 1.2
Low & Bonar Construction & Materials 690 1.2
Murgitroyd Group Support Services 690 1.2
GLI Finance Equity Investment Instruments 687 1.1
Produce Investments Food Producers 684 1.1
Regional REIT Real Estate Investment Trusts 676 1.1
Epwin Group Construction & Materials 672 1.1
Palace Capital Real Estate Investment & Services 670 1.1
KCOM Group Fixed Line Telecommunications 638 1.1
Restaurant Group Travel & Leisure 607 1.0
Hansard Global Life Insurance 602 1.0
RPS Group Support Services 589 1.0
Wilmington Group Media 585 1.0
Castings Industrial Engineering 576 1.0
Games Workshop Group Leisure Goods 568 1.0
Foxtons Group Real Estate Investment & Services 555 0.9
St.Ives Support Services 551 0.9
RTC Group Support Services 530 0.9
DFS Furniture General Retailers 522 0.9
Revolution Bars Group Travel & Leisure 507 0.8
Titon Holdings Construction & Materials 419 0.7
Chamberlin Industrial Engineering 375 0.6
Anglo African Oil & Gas Oil & Gas Producers 369 0.6
DX Group Industrial Transportation 338 0.6
BCA Marketplace Industrial Transportation 208 0.3
Fairpoint Group Financial Services 0 0.0
Total Investments 59,806 100.0
Breakdown of portfolio by industry
Fixed Line Telecommunications 1.1%
General Retailers 5.5%Household Goods & Home Construction 2.0%Industrial Engineering 4.2%
Real Estate Investment & Services 4.1%
Real Estate Investment Trusts 4.0%
Travel & Leisure 6.3%Technology Hardware & Equipment 1.8%
Support Services 11.7%
Software & Computer Services 3.5%
Oil & Gas Producers 3.4%
Life Insurance 2.3%Leisure Goods 2.5%
General Industrials 2.6%
Industrial Transportation 2.7%
Nonlife Insurance 3.5%Media 5.0%
Construction & Materials 7.7%
Electronic & Electrical Equipment 2.8%Equity Investment Instruments 1.1%
Financial Services 14.6%
Food Producers 3.8%
Food & Drug Retailers 3.8%
16
Shareholder Information
Financial calendar
Group’s year end 30 April
Interim dividends paid April, July, October and January
Annual results announced June
Annual General Meeting September
Group’s half year 31 October
Half-Year results announced December
Share prices and performance information
The Company’s Ordinary and Zero Dividend Preference shares issued through SCZ are listed on the London
Stock Exchange.
The net asset values are announced weekly to the London Stock Exchange and published monthly via the
AIC.
Information about the Group can be obtained on the Chelverton website at www.chelvertonam.com. Any
enquiries can also be e-mailed to [email protected].
Share register enquiries
The registers for the Ordinary shares and Zero Dividend Preference shares are maintained by Share
Registrars Limited. In the event of queries regarding your holding, please contact the Registrar on 01252
821390. Changes of name and/or address must be notified in writing to the Registrar.

17
Capital Structure
Chelverton Small Companies Dividend Trust PLC (‘the Company’)
The Company has in issue one class of Ordinary share. In addition, it has a wholly owned subsidiary SCZ,
through which Zero Dividend Preference shares have been issued.
Ordinary shares of 25p each (‘Ordinary shares’) – 17,775,000 in issue
Share Capital Events
During the period, the Company announced the issue of 975,000 Ordinary shares at an average price of
256.04p each, which were to rank pari passu in all respects with the Ordinary shares in issue. The shares
were issued for cash in order to meet investor demand. Following this admission there were 17,775,000
Ordinary shares in issue. The Company has only one class of share and this figure represents 100% of the
Company’s share capital and voting rights.
Dividends
Holders of Ordinary shares are entitled to dividends.
Capital
On a winding-up of the Company, Ordinary shareholders will be entitled to all surplus assets of the
Company available after payment of the Company’s liabilities including the capital entitlement of the Zero
Dividend Preference shares.
Voting
Each holder, on a show of hands, will have one vote and on a poll will have one vote for each Ordinary
share held.
Chelverton Small Companies ZDP PLC (‘SCZ’)
Ordinary shares of 100p each (‘SCZ ordinary shares’) – 50,000 in issue (partly paid up as to 25p each)
The SCZ ordinary shares are wholly owned by the Company. References to Ordinary shares within this Half-
Yearly Report are to the Ordinary shares of Chelverton Small Companies Dividend Trust PLC.
Capital
Following payment of any liabilities and the capital entitlement to the Zero Dividend Preference
shareholders, ordinary shareholders are entitled to any surplus assets of SCZ.
Voting
Each holder, on a show of hands, will have one vote and on a poll will have one vote for each ordinary share
held.
Zero Dividend Preference shares of 100p each – 9,349,000 in issue
Dividends
Holders of Zero Dividend Preference shares are not entitled to dividends.
Capital
On a winding up of SCZ, after the satisfaction of prior ranking creditors and subject to sufficient assets
being available, Zero Dividend Preference shareholders are entitled to an amount equal to 100p per share
increased daily from 28 August 2012 at such compound rate as will give an entitlement to 136.7 pence per
share at 8 January 2018.
Voting
Holders of Zero Dividend Preference shares are not entitled to attend, speak or vote at a general meeting
of the Company (including the Company’s Annual General Meeting) unless the business of the meeting
includes a resolution to vary, modify or abrogate the rights attached to the Zero Dividend Preference shares.
In the event that Zero Dividend Preference shareholders are entitled to attend a General Meeting each
holder of Zero Dividend Preference shares, on a show of hands, will have one vote for every Zero Dividend
Preference share held in relation to any resolutions applicable to Zero Dividend Preference shares.

18
Directors and Advisers
Directors Lord Lamont of Lerwick (Chairman)
David Harris
William van Heesewijk
Howard Myles
Investment Manager Chelverton Asset Management Limited
11 Laura Place
Bath BA2 4BL
Tel: 01225 483030
Secretary and Maitland Administration Services Limited
Registered Office Springfield Lodge
Colchester Road, Chelmsford
Essex CM2 5PW
Tel: 01245 398950
Corporate Broker Stockdale Securities Limited
Beaufort House
15 St. Botolph Street
London EC3A 7BB
Registrar and Share Registrars Limited
Transfer Office The Courtyard
17 West Street
Farnham
Surrey GU9 7DR
Tel: 01252 821390
www.shareregistrars.uk.com
Auditors Hazlewoods LLP
Windsor House
Bayshill Road
Cheltenham GL50 3AT
Custodian Jarvis Investment Management Limited
78 Mount Ephraim
Tunbridge Wells
Kent TN4 8BS
Registered in England
No. 3749536
A member of the Association of Investment Companies

19

A S S E T M A N A G E M E N TCHE LV E RTON
C