Embed Size (px)
Citation preview
Chem. 133 – 4/1 Lecture

Announcements I
• Lab – Returning Term Project Proposals (I expect to
be getting boxes of supplies ready)– Returning Set 2 Period 1 Lab Reports (for
those where all partners turned in reports – not GC-MS or HPLC)
– Better than electronics lab reports but still some need for improvements:• give unknown # in report (I don’t know it)• give information on how you performed
optimization• remember to account for dilutions/other sample
processing• read instructions for additional questions
– Next Lab Report due 4/7
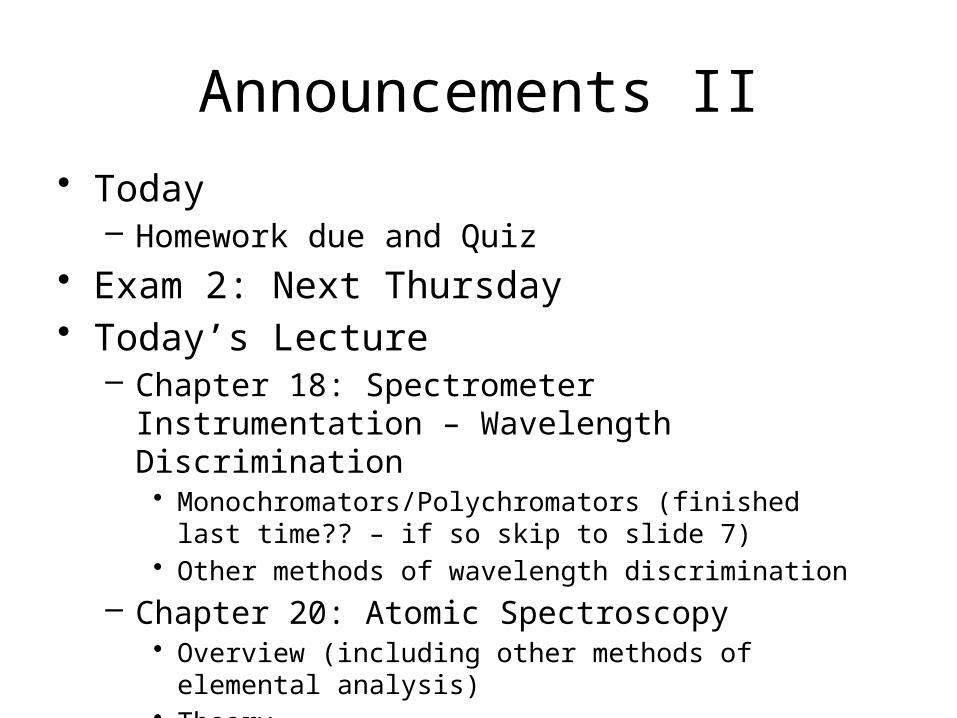
Announcements II• Today
– Homework due and Quiz• Exam 2: Next Thursday• Today’s Lecture
– Chapter 18: Spectrometer Instrumentation – Wavelength Discrimination• Monochromators/Polychromators (finished last
time?? – if so skip to slide 7)• Other methods of wavelength discrimination
– Chapter 20: Atomic Spectroscopy• Overview (including other methods of elemental
analysis)• Theory

SpectrometersSome Questions II
1. If white light enters the monochromator to the right, which wavelength is longer wavelength?
2. List two parameters that will affect the resolution. Can any of these be easily changed?
3. A band pass filter is often placed between the grating and the focusing optics. What is the purpose of this filter?
4. If a grating is used with 320 lines/mm and the output angle for 380 nm is 45º and the focal length is 40 cm for 1st order light, what exit slit width is needed to be able to obtain a resolution of 200?
l1
l2
exit slit
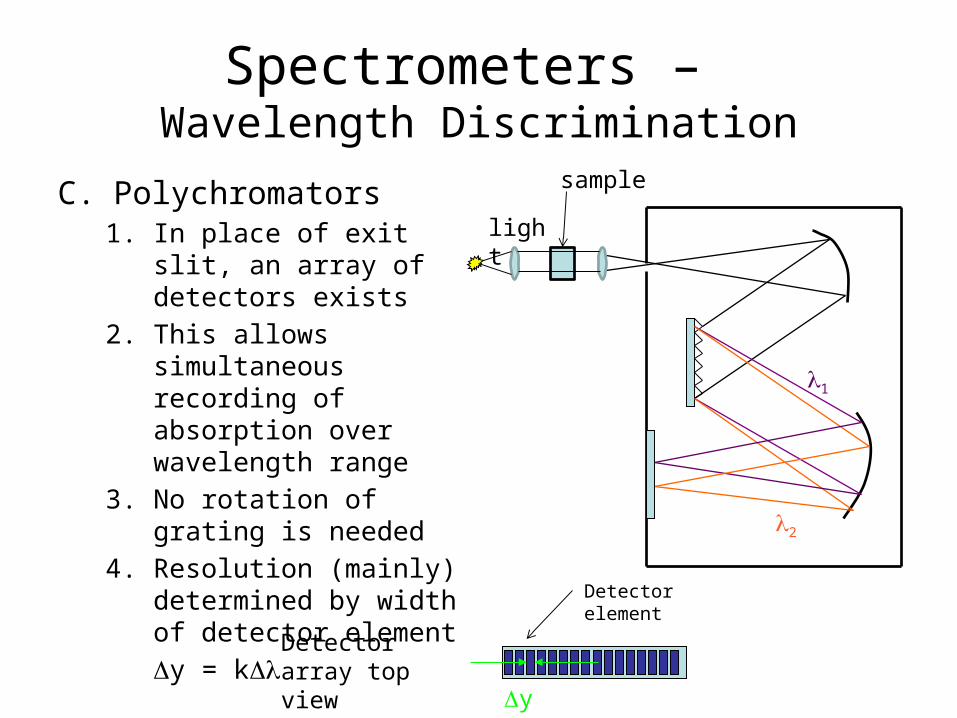
Spectrometers – Wavelength Discrimination
C. Polychromators1. In place of exit slit, an
array of detectors exists
2. This allows simultaneous recording of absorption over wavelength range
3. No rotation of grating is needed
4. Resolution (mainly) determined by width of detector elementDy = kDl
light
l1
l2
sample
Detector array top view
Detector element
Dy

Spectrometers – Wavelength Discrimination
C. 2-D Polychromators1. Light can be dispersed in
two dimensions by placing a prism in front of the grating (dispersion in and out of the screen) to go along with the grating’s dispersion (in y-axis)
2. See Color Plate 25 in Harris3. Requires 2-D detector array4. Usually uses high order
grating dispersion (e.g. n = 11, 12, 13, 14) with different orders separated by prism
l1
l2
prism
2-D detector array
prism
dispersion
grating dispersion (y-axis)
emission light source
Detector elements

Spectrometers – Wavelength Discrimination
D. Other Methods1. Energy-dispersive detectors (X-ray and
g-ray analysis) – wavelength discrimination is part of detection system
2. Fourier-transform Instruments- Will cover for IR and NMR- “White” light passed through sample- Variance in response with time or with
distance is recorded and then transformed to conventional spectrum

Wavelength DiscriminationFourier Transform Instruments
• FTIR Instruments– Uses Michelson
interferometer (see Figure)– Light goes to beam splitter
(partially reflecting/partially transmitting
– Part of beam goes to fixed mirror and is reflected. Part of this beam then goes through the sample to the detector
– Another part of the original beam goes through the beam splitter to a moving mirror and is reflected with part of this going on to the sample and detector
light
Beam splitter
Fixed mirror
Mirror on drive
sample
detector

Wavelength DiscriminationFourier Transform Instruments
• FTIR Instruments (continued)– If beams from the two paths combine “in phase” (both wave
maxima) constructive interference occurs and greater light intensity reaches sample/detector
– If beams are not “in phase”, less light reaches detector– Distance between beam splitter and mirror affects whether
light is in phase– Since “white” light is used (actually broad band IR), at different
distances, different wavelengths will be in phase
intensity
Mirror position (or time if mirror moves)
l1l2

Wavelength DiscriminationFourier Transform Instruments
• Performance:– Δṽ is inversely related to distance traveled by
mirror (D) (not explained clearly in text)– This means better resolution (larger ṽ/Δṽ)
when D is larger– Spectral range depends on sampled data
speed (assuming fast detector)– High resolution over a long wavenumber range
will take more time
small displacement → poor resolution

Wavelength DiscriminationFourier Transform Instruments
• Advantages of FT Instruments– Faster than scanning– Greater light throughput– Higher wavenumber accuracy (IR), so can
repeat “scans” and average signals• Disadvantages of FT Instruments
– Practical limitations in aligning mirrors– This is more problematic at smaller
wavelengths (or larger wavenumbers) where misalignment is a greater % of l value
extra distance
Light Detectors
• Detectors covered in electronics section– UV/Vis/NearIR: Photocell, photomultiplier
tube, photodiode, photoconductivity cell, and solid state array detectors (charged coupled device or CCD)
– IR: temperature measurement (e.g. thermopile), and solid state
– NMR: antenna

Light Detectors• Detectors for high energy (X-ray, g-ray light) (both gas cells
and solid state available)– Due to high energy, a single photon can easily produce a big signal– Two types: gas cells (e.g. Geiger Counter) and solid state sensors (e.g.
Si(Li) detectors)– In both cases, detectors can be set up where cascade of electrons is
produced from a single photon– The number of ions produced from photons can be dependent upon the
photon energy
time
currenthigh E photon
low E photon
energy
counts/s
solid state detector
I
+++
-- -
These detectors are said to be energy dispersive (no monochromator needed)

Atomic SpectroscopyOverview
• Main Purpose– Determine elemental composition (or
concentration of specific elements)• Main Performance Concerns
– Sensitivity– Multi-element vs. single element– Speed– Interferences (for different matrices)– Precision– Required sample preparation

Atomic SpectroscopyOverview
• Instrument Types– Analysis for liquid samples (main focus of text
+ lecture discussion)– Systems for solid samples
• Modified instruments for liquids– 2 examples in book: graphite furnace with solid
sample placed in tube (see p. 485) and laser ablation (see p. 495)
– laser ablation allows microanalysis• X-ray Fluorescence Spectroscopy and X-ray Emission
Detection attachments coupled to electron microscopy– Both based on spectral (or energy-dispersive) analysis
of emitted X-rays to determine elements present

Atomic SpectroscopyOverview
• Instrument Types – Systems for Solids – cont.– XRF – cont.
– Emitted X-rays have wavelengths dependent upon element (but generally not element’s charge or surroundings)
– Accurate quantification is more difficult due to limited penetration of sample by X-rays or electrons and by attenuation of emitted X-rays due to absorption (matrix effects)
• Instrument Types – For Analysis of Liquids– Atomization Systems: to convert elements to
gaseous atoms or ions (MS detection)• Flame• Electrothermal (Graphite Furnace)• Inductively Coupled Plasma (ICP)

Atomic SpectroscopyOverview
• Instrument Types – For Analysis of Liquids– Atom Detection: to detect atoms (or ions in MS)
• Atomic Absorption Spectroscopy (with flame or electrothermal)
• Atomic Emission Spectroscopy (with flame or ICP)• Mass Spectrometry (with ICP)

Atomic SpectroscopyTheory
• Spectroscopy is performed on atoms in gas phase
• Transitions are very simple (well defined energy states with no vibration/rotation /solvent interactions)
• Allowed transitions depend on selection rules (not covered here)
E
Na(g)o (3s)
4s4p
5s5p
absorption

Atomic SpectroscopyTheory
• Consequence of well defined energy levels:– very narrow absorption
peaks– few interferences from
other atoms– very good sensitivity (all
absorption occurs at narrow l range)
– but can not use standard monochromator where Dl(from monochromator) >> dl due to extreme deviations to Beer’s law
– requires greater wavelength discrimination for absorption measurements
l
A
Spectrum from high resolutions spectrometer (not typical for AA)
atomic transition
molecular transition
very narrow natural peak width (dl ~ 0.001 nm)
broader width

Atomic SpectroscopyTheory
• For emission measurements, a key is to populate higher energy levels
• In most cases, this occurs through the thermal methods also responsible for atomization
• Fraction of excited energy levels populated is given by Boltzmann Distribution
• More emission at higher temperatures and for longer wavelengths (smaller DE)
Na(g)o (3s)
4pE
kTEeg
g
N
N /
00
**
N = number atoms in ground (0) and excited (*) states
g = degeneracy (# equivalent states) = 3 in above example
k = Boltzmann constant

Atomic SpectroscopyTheory
• Example problem:Calcium absorbs light at 422 nm. Calculate
the ratio of Ca atoms in the excited state to the ground state at 3200 K (temperature in N2O fueled flame). g*/g0 = 3 (3 5p orbitals to 1 4s orbital).