Embed Size (px)
Citation preview
Chemical and Physical Properties
of Lake Sakakawea 1992 - 2000
Program ManagerMike Ell
Written byScott Elstad
North Dakota Department of HealthDivision of Water Quality
Surface Water ProgramMay 2001

2
Table�of�Contents
Page
List�of�Figures............................................................................................................. ��3
List�of�Tables.............................................................................................................. ��4
Introduction................................................................................................................ ��5
Methods...................................................................................................................... ��5
Results�and�Discussion............................................................................................... ��9
Literature�Cited.......................................................................................................... �19
Appendix:�Variables�and�Concentrations.................................................................. �20
3
List�of�Figures
Figure � Page
���1.��Lake�Sakakawea�hydrograph.............................................................................���7
���2.��Map�of�Lake�Sakakawea�and�sampling�locations............................................. ��8
���3.��Lake�Sakakawea�coldwater�habitat�1992.......................................................... �12
���4.��Lake�Sakakawea�coldwater�habitat�1993..........................................................���13
���5.��Lake�Sakakawea�coldwater�habitat�1994...........................................................��14
���6.��Lake�Sakakawea�coldwater�habitat�1995...........................................................��15
���7.��Lake�Sakakawea�coldwater�habitat�1996...........................................................��16
4
List�of�Tables
Table Page
�1. Site�names,�STORET�numbers,�and�river�mile�(RM)................................. �10
�2. Lake�Sakakawea�physical�characteristics�during�the�lowest�amount�of�coldwater�habitat�available�1992-1996�and�1999.................................. �12��
5
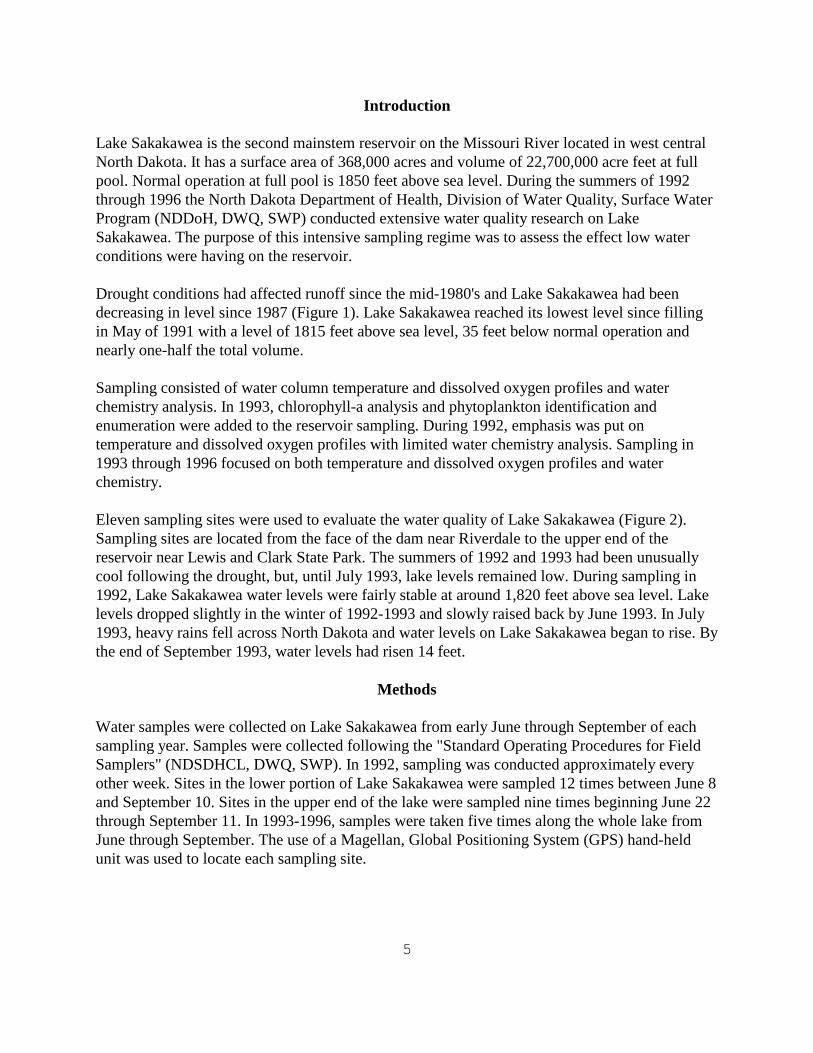
Introduction
Lake�Sakakawea�is�the�second�mainstem�reservoir�on�the�Missouri�River�located�in�west�centralNorth�Dakota.�It�has�a�surface�area�of�368,000�acres�and�volume�of�22,700,000�acre�feet�at�fullpool.�Normal�operation�at�full�pool�is�1850�feet�above�sea�level.�During�the�summers�of�1992through�1996�the�North�Dakota�Department�of�Health,�Division�of�Water�Quality,�Surface�WaterProgram�(NDDoH,�DWQ,�SWP)�conducted�extensive�water�quality�research�on�LakeSakakawea.�The�purpose�of�this�intensive�sampling�regime�was�to�assess�the�effect�low�waterconditions�were�having�on�the�reservoir.
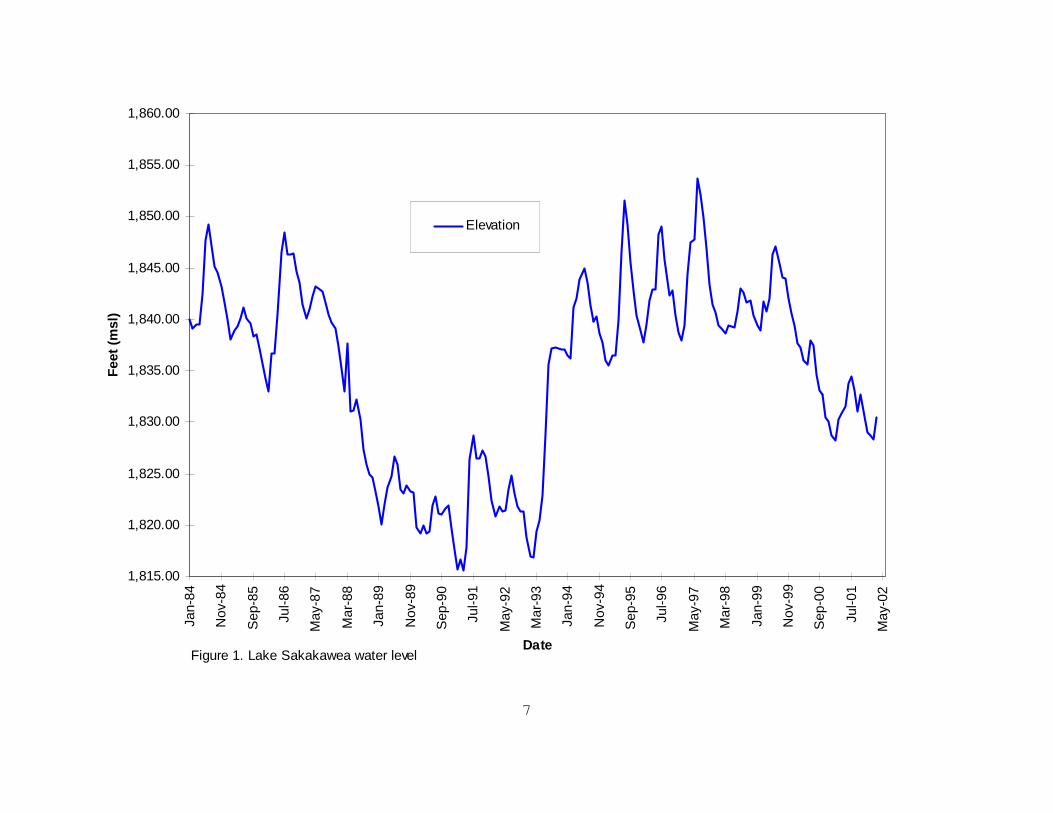
Drought�conditions�had�affected�runoff�since�the�mid-1980's�and�Lake�Sakakawea�had�beendecreasing�in�level�since�1987�(Figure�1).�Lake�Sakakawea�reached�its�lowest�level�since�fillingin�May�of�1991�with�a�level�of�1815�feet�above�sea�level,�35�feet�below�normal�operation�andnearly�one-half�the�total�volume.
Sampling�consisted�of�water�column�temperature�and�dissolved�oxygen�profiles�and�waterchemistry�analysis.�In�1993,�chlorophyll-a�analysis�and�phytoplankton�identification�andenumeration�were�added�to�the�reservoir�sampling.�During�1992,�emphasis�was�put�ontemperature�and�dissolved�oxygen�profiles�with�limited�water�chemistry�analysis.�Sampling�in1993�through�1996�focused�on�both�temperature�and�dissolved�oxygen�profiles�and�waterchemistry.
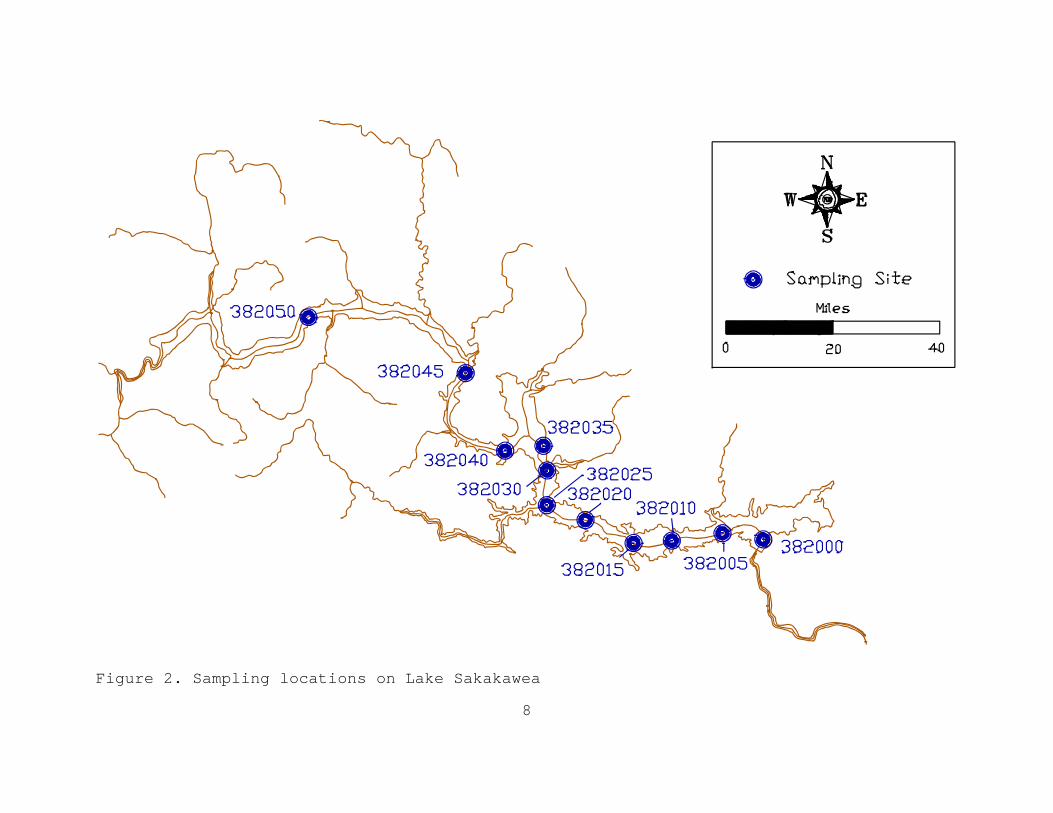
Eleven�sampling�sites�were�used�to�evaluate�the�water�quality�of�Lake�Sakakawea�(Figure�2).Sampling�sites�are�located�from�the�face�of�the�dam�near�Riverdale�to�the�upper�end�of�thereservoir�near�Lewis�and�Clark�State�Park.�The�summers�of�1992�and�1993�had�been�unusuallycool�following�the�drought,�but,�until�July�1993,�lake�levels�remained�low.�During�sampling�in1992,�Lake�Sakakawea�water�levels�were�fairly�stable�at�around�1,820�feet�above�sea�level.�Lakelevels�dropped�slightly�in�the�winter�of�1992-1993�and�slowly�raised�back�by�June�1993.�In�July1993,�heavy�rains�fell�across�North�Dakota�and�water�levels�on�Lake�Sakakawea�began�to�rise.�Bythe�end�of�September�1993,�water�levels�had�risen�14�feet.
Methods
Water�samples�were�collected�on�Lake�Sakakawea�from�early�June�through�September�of�eachsampling�year.�Samples�were�collected�following�the�"Standard�Operating�Procedures�for�FieldSamplers"�(NDSDHCL,�DWQ,�SWP).�In�1992,�sampling�was�conducted�approximately�everyother�week.�Sites�in�the�lower�portion�of�Lake�Sakakawea�were�sampled�12�times�between�June�8and�September�10.�Sites�in�the�upper�end�of�the�lake�were�sampled�nine�times�beginning�June�22through�September�11.�In�1993-1996,�samples�were�taken�five�times�along�the�whole�lake�fromJune�through�September.�The�use�of�a�Magellan,�Global�Positioning�System�(GPS)�hand-heldunit�was�used�to�locate�each�sampling�site.

6
At�each�site,�a�temperature�and�dissolved�oxygen�profile�was�taken�from�the�surface�to�the�lakebottom.�Measurements�were�taken�every�2�meters�until�stratification�was�noticed�and�then�takeneach�meter.�Once�through�the�stratified�layer,�readings�were�once�again�taken�at�each�2�meters.
The�winkler/azide�method�was�used�to�calibrate�the�meter�twice�each�day�before�and�aftersampling.�Water�chemistry�results�were�checked�by�QA/QC�procedures�outlined�in�the�"StandardOperating�Procedures.”
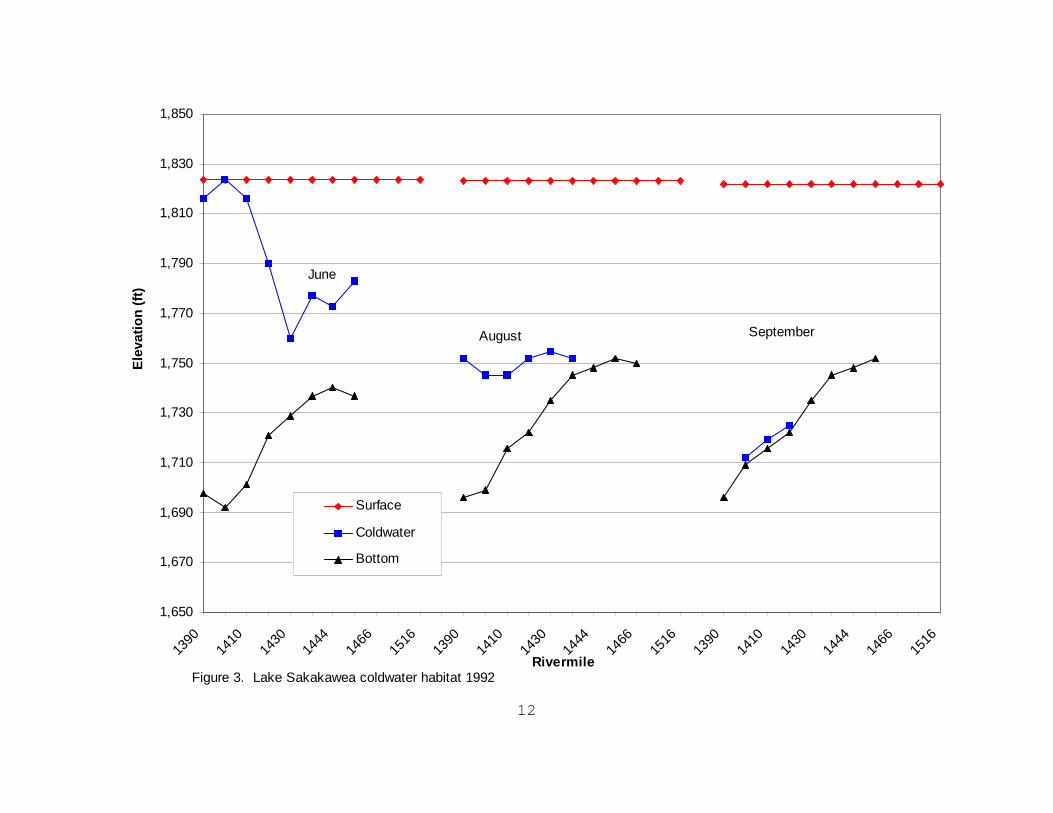
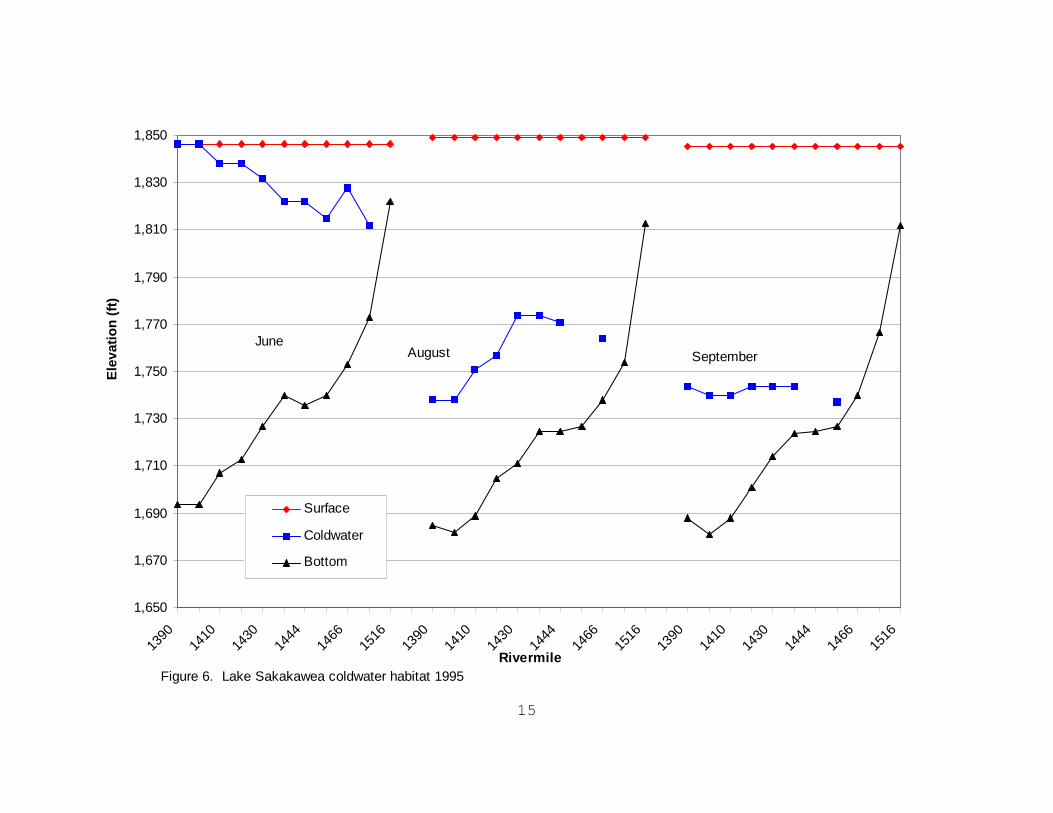
Diagrams�of�the�coldwater�habitat�were�made�for�each�and�were�taken�from�the�temperatureprofiles�for�Lake�Sakakawea.�Coldwater�habitat�was�defined�as�water�with�a�temperature�below15�degrees�centigrade�and�dissolved�oxygen�levels�above�5�mg/l.�Up�to�four�layers�would�bepossible�per�month�(Figures�3-7).�The�surface�layer,�colored�red,�was�the�level�of�the�reservoir�atthe�end�of�the�month.�Coldwater�layer,�colored�blue,�was�the�start�of�the�coldwater�habitat.Coldbot�layer,�colored�green,�was�the�bottom�of�the�coldwater�habitat.�This�took�place�when�thewater’s�physical�variables,�temperature�or�dissolved�oxygen�were�either�above�15�degreescentigrade�or�below�5�mg/l.�Bottom�was�the�last�variable,�colored�black,�and�was�the�bottom�ofthe�lake.
7
1,815.00
1,820.00
1,825.00
1,830.00
1,835.00
1,840.00
1,845.00
1,850.00
1,855.00
1,860.00
Jan-84
Nov-84
Sep-85
Jul-86
May-87
Mar-88
Jan-89
Nov-89
Sep-90
Jul-91
May-92
Mar-93
Jan-94
Nov-94
Sep-95
Jul-96
May-97
Mar-98
Jan-99
Nov-99
Sep-00
Jul-01
May-02
Date
Feet�(m
sl)
Elevation
Figure�1.�Lake�Sakakawea�water�level
8
Figure 2. Sampling locations on Lake Sakakawea
9
Results�and�Discussion
In�July�1993,�Lake�Sakakawea�was�influenced�by�heavy�rains�and�cool�temperatures.�Waterlevels�were�increasing�during�this�time�and�were�at�approximately�1,835�feet�above�sea�level�bythe�end�of�July�(Figure�1).
Dissolved�Oxygen
Oxygen�levels�were�good�in�1992�throughout�the�water�column,�ranging�up�to�10�mg/l.�Oxygenlevels�in�the�lower�four�sampling�sites(RM�1390-1420)�were�fairly�consistent�throughout�thewater�column�near�9�mg/l�with�a�drop�to�3.8�mg./l�in�July�near�Riverdale.�The�next�four�sites(RM�1430-1450)�measured�during�this�time�showed�oxygen�levels�above�8�mg/l�in�theepilimnion�but�declined�to�nearly�5�mg/l�in�the�hypolimnion�(Appendix).�See�Table�1�for�siteexplanation.
Oxygen�levels�taken�in�August�1992�ranged�between�8�and�9�mg/l�in�the�epilimnion,�while�levelsdropped�off�drastically�at�the�thermocline.�Oxygen�levels�fell�to�nearly�4�mg/l�near�the�bottom�inthe�upper�sites�measured�in�1992.�The�four�sites�that�exhibited�temperatures�indicative�of�coldwater�habitat�also�displayed�oxygen�levels�above�5�mg/l.��Oxygen�levels�during�July�1993�ranged�between�7�and�9.4�mg/l�.�The�dissolved�oxygen�levelswere�more�stable�in�the�lower�reaches�of�the�reservoir,�with�slight�decreases�near�the�bottom.Mid-reservoir�and�upper�reservoir�sites�generally�exhibited�a�slight�decline�throughout�theprofile.�As�compared�to�July�1992,�oxygen�levels�in�the�lower�reaches�were�very�similar.
Dissolved�oxygen�profiles�taken�during�August�1993�also�met�the�criteria�for�cold�water�habitat,with�all�sites�and�all�depths�above�5�mg/l.�RM�1390�through�RM�1445�were�very�stablethroughout�the�water�column,�with�only�small�deviations�in�oxygen�levels�compared�to�1992.Mid�to�upper�sites�showed�a�strong�relationship�with�the�thermocline,�decreasing�in�oxygen�asdepth�increased.�This�compared�fairly�well�to�1992,�but�the�decrease�in�oxygen�was�markedlyreduced�in�1993.�This�again�may�be�attributed�to�the�large�inflow�received�during�July�1993.
The�dissolved�oxygen�profiles�for�September�of�both�years�displayed�fairly�stable�conditionsthroughout�the�water�column.�In�1992,�the�oxygen�profile�generally�ranged�between�8�and�9�mg/l,while�1993�ranged�from�9�to�10�mg/l.�As�displayed�in�the�September�temperature�profiles,�thesmall�stratified�area�was�also�noticeable�in�the�oxygen�profiles.�Oxygen�levels�declined�by�nearly3�mg/l�at�the�same�sites�during�each�year.
Dissolved�oxygen�in�June�1994,�was�also�at�high�levels.�By�August,�however,�there�were�midreservoir�areas�that�fell�below�5�mg/l.�In�September,�this�area�move�closer�to�Garrison�Dam�andhigher�in�the�water�column.�Many�areas�in�the�mid�and�upper�reaches�of�the�reservoir�fell�wellbelow�the�5�mg/l�standard�in�August�and�September�1994.
10
Initially,�1995�oxygen�levels�were�above�10�mg/l�at�all�sites,�with�the�exception�of�Pouch�Pointand�Lewis�and�Clark�sites.�These�two�sites�were�still�above�8�mg/l�oxygen,�however.�All�sitesdisplayed�a�decrease�in�oxygen�throughout�the�summer�months,�with�RM1430-RM1438�andRM1449-RM1516�sites�falling�below�5�mg/l�in�July,�August�or�September.
During�1996,�oxygen�levels�once�again�started�out�relatively�high,�with�all�sites�having�more�than9�mg/l�except�RM1516,�which�had�levels�just�above�8�mg/l.�Oxygen�levels�remained�highthroughout�the�1996�sampling�season.�All�sites�remained�above�5�mg/l�at�all�times,�thus�meetingone�of�the�criteria�for�coldwater�habitat.
Table�1.�Site�names,�STORET�numbers,�and�river�mile�(RM).
Name STORET ����Rivermile
Riverdale 382000 1390
Hazen�Bay 382005 1400
Beulah�Bay 382010 1410
Beaver�Bay 382015 1420
Indian�Hills 382020 1430
Little�Missouri 382025 1438
Deepwater 382030 1444
Van�Hook�Arm 382035 1449
Pouch�Point 382040 1466
Four�Bears�Bridge 382045 1480
Lewis�&�Clark�State�Park 382050 1516
Temperature
In�1992,�thermal�stratification�was�evident�by�the�time�sampling�began�in�early�June�(Appendix).Temperatures�in�early�August�1993�showed�good�stratification,�but�the�range�of�temperatures�wassmaller�than�in�1992.�Temperatures�in�early�August�1993�ranged�from�13�degrees�to�19�degrees�Cexcept�for�site�380050,�which�was�influenced�by�runoff�from�the�heavy�July�rains.�The�excessiverunoff�also�impacted�the�hypolimnetic�formation�by�slowing�the�process�and�also�increased�thetemperatures�in�the�hypolimnion�by�over�2�degrees�C�compared�to�August�1992.�
11
During�late�August�1993,�a�stable�thermocline�had�developed.�Temperatures�in�the�epilimnionaveraged�just�over�19�degrees�C,�with�temperatures�in�the�hypolimnion�ranging�from�13�degreesto�17�degrees�C.�
In�1992,�water�levels�were�nearly�30�feet�below�full�pool�but�were�stable�throughout�the�samplingseason.�June�1992�showed�the�hypolimnion�starting�19�meters�below�the�surface.�Due�to�thestable�water�conditions,�the�thermocline�formed�early�with�good�stratification.�In�June�1993,�veryweak�stratification�was�noticed,�with�the�thermocline�located�near�the�surface�and�graduallyfalling�off�up�reservoir.�By�July�1992,�strong�stratification�was�evident�and�a�reduction�in�thehypolimnion�was�seen.�Also�by�this�time,�cold�water�habitat�was�being�reduced�to�the�lowersampling�sites�on�the�lake.�In�July�1993,�stratification�was�still�very�weak.�At�this�time,�there�wasa�large�hypolimnion�in�July�1993�compared�to�the�previous�year.�This�was�due�to�good�runoff�inJune�and�the�cool�temperatures�experienced�during�sampling.
In�August�1992,�the�hypolimnion�was�compressed�to�30�meters�below�the�surface.�By�this�time,cold�water�habitat�was�limited�to�sites�382000�through�382015�in�the�lower�portions�of�thereservoir.�Stratification�was�heavy�throughout�the�reservoir,�with�hypolimnetic�temperaturesincreasing�as�depth�decreased.�The�hypolimnetic�volumes�were�similar�to�those�in�August�1993.
Water�temperatures�progressively�became�somewhat�cooler�from�1993�through�1996.�This�wasdue�to�the�large�amount�of�spring�runoff�received�by�Lake�Sakakawea�during�these�years,bringing�the�lake�close�to�full�pool.�Although�these�temperatures�cooled�off�somewhat,�they�didfollow�the�same�basic�patterns�each�year.
Coldwater�Habitat
The�amount�of�coldwater�habitat�present�in�Lake�Sakakawea�in�1988�through�1992�was�less�than2�million�acre/ft�and�nearly�nonexistent�in�1991�(Lee�et�al�1997).�Figure�3�displays�the�amount�ofcoldwater�habitat�in�Lake�Sakakawea�for�June,�August�and�September�1992.�As�can�be�seen,�theamount�of�habitat�diminished�throughout�the�summer�to�almost�nothing�in�September.�During1993,�a�greater�area�developed�as�coldwater�habitat.�This�area�was�maintained�throughout�thesummer�months�and�through�the�fall�(Figure�4).�
Although�there�was�more�coldwater�habitat�during�1994,�a�problem�did�develop.�During�Augustand�September,�oxygen�levels�dropped�to�below�5�mg/l�in�some�areas�of�Lake�Sakakawea�(Figure5).�Those�areas�designated�by�a�green�line�(below)�were�incapable�of�meeting�the�definition�ofcoldwater�habitat�during�those�months.�
Again�in�1995,�a�larger�coldwater�habitat�area�developed�and�was�sustained�throughout�thesummer�months�(Figure�6).�Coldwater�habitat�reached�up�Lake�Sakakawea�to�RM1455.�Figure�7displays�coldwater�habitat�present�in�1996.�Once�again,�the�area�grew�deeper�and�extendedfurther�up�the�reservoir�to�RM�1466�in�August.�
12
1,650
1,670
1,690
1,710
1,730
1,750
1,770
1,790
1,810
1,830
1,850
1390
1410
1430
1444
1466
1516
1390
1410
1430
1444
1466
1516
1390
1410
1430
1444
1466
1516
Rivermile
Elevation�(ft)
Surface
Coldwater
Bottom
June
August September
Figure�3.��Lake�Sakakawea�coldwater�habitat�1992

13
1,650
1,670
1,690
1,710
1,730
1,750
1,770
1,790
1,810
1,830
1,850
1390
1410
1430
1444
1466
1516
1390
1410
1430
1444
1466
1516
1390
1410
1430
1444
1466
1516
Rivermile
Elevation�(ft)
Surface
Coldwater
Bottom
June August
September
Figure�4.��Lake�Sakakawea�coldwater�habitat�1993

14
1,650
1,670
1,690
1,710
1,730
1,750
1,770
1,790
1,810
1,830
1,850
1390
1410
1430
1444
1466
1516
1390
1410
1430
1444
1466
1516
1390
1410
1430
1444
1466
1516
Rivermile
Elevation�(ft)
Surface
Coldwater
Coldbot
Bottom
June
August
September
Figure�5.��Lake�Sakakawea�coldwater�habitat�1994
15
1,650
1,670
1,690
1,710
1,730
1,750
1,770
1,790
1,810
1,830
1,850
1390
1410
1430
1444
1466
1516
1390
1410
1430
1444
1466
1516
1390
1410
1430
1444
1466
1516
Rivermile
Elevation�(ft)
Surface
Coldwater
Bottom
JuneAugust September
Figure�6.��Lake�Sakakawea�coldwater�habitat�1995

16
1,650
1,670
1,690
1,710
1,730
1,750
1,770
1,790
1,810
1,830
1,850
1390
1410
1430
1444
1466
1516
1390
1410
1430
1444
1466
1516
1390
1410
1430
1444
1466
1516
Rivermile
Elevation�(ft)
Surface
Coldwater
Bottom
June August
October
Figure�7.��Lake�Sakakawea�coldwater�habitat�1996
17
Table�2. Lake�Sakakawea�physical�characteristics�during�the�lowest�amount�of�coldwaterhabitat�available�1992-1996�and�1999-2001.
� �� �� �������NDDH NDGF �USCOE �������Dis-�Year��������Surface ��Volume ��� Coldwater�Habitat�������� Stage��������charge
�������Acres ��Acre-ft �� Acre-feet�(million)��������� �feet ��������cfs
1990 249,665 13,275,410 .065 1821.0
1991 266,715 14,822,060 0.46 1.81 1826.0 18,000
1992 257,585 14,036,010 .043 1.1 2.80 1823.0 18,130
1993 304,925 17,955,980 1.5 1.47 4.88 1837.1 15,790
1994 325,805 19,216,870 1.8 2.7 5.53 1841.3 18,440
1995 360,505 21,969,270 1.7 1.8 6.72 1849.2 29,760
1996 348,715 20,904,990 3.2 2.5 5.86 1845.8 36,060
1997 352,810 21,255,790 2.3 2.36 1846.9 46,000
1998 335,450 20,256,000 3.63 1842.6 21,900
1999 340,035 20,216,070 1.1 2.0 3.81 1844.1 22,700
2000 292,410 17,061,000 2.2 1834.0
2001
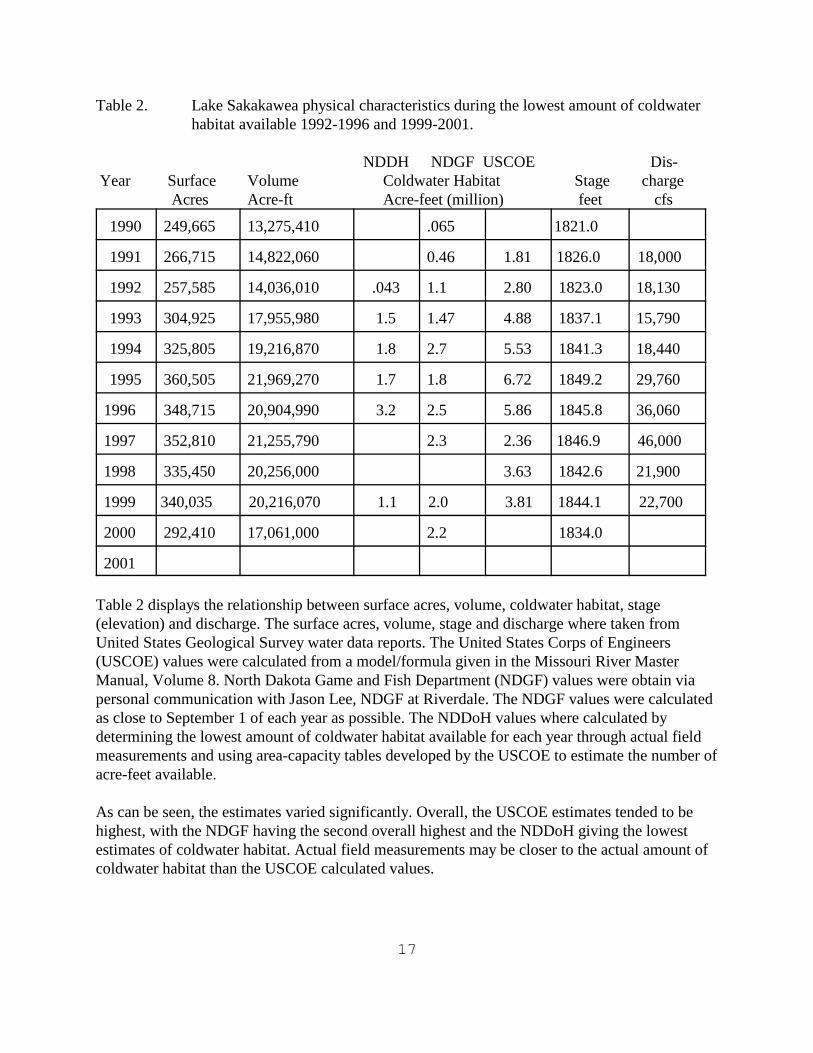
Table�2�displays�the�relationship�between�surface�acres,�volume,�coldwater�habitat,�stage(elevation)�and�discharge.�The�surface�acres,�volume,�stage�and�discharge�where�taken�fromUnited�States�Geological�Survey�water�data�reports.�The�United�States�Corps�of�Engineers(USCOE)�values�were�calculated�from�a�model/formula�given�in�the�Missouri�River�MasterManual,�Volume�8.�North�Dakota�Game�and�Fish�Department�(NDGF)�values�were�obtain�viapersonal�communication�with�Jason�Lee,�NDGF�at�Riverdale.�The�NDGF�values�were�calculatedas�close�to�September�1�of�each�year�as�possible.�The�NDDoH�values�where�calculated�bydetermining�the�lowest�amount�of�coldwater�habitat�available�for�each�year�through�actual�fieldmeasurements�and�using�area-capacity�tables�developed�by�the�USCOE�to�estimate�the�number�ofacre-feet�available.
As�can�be�seen,�the�estimates�varied�significantly.�Overall,�the�USCOE�estimates�tended�to�behighest,�with�the�NDGF�having�the�second�overall�highest�and�the�NDDoH�giving�the�lowestestimates�of�coldwater�habitat.�Actual�field�measurements�may�be�closer�to�the�actual�amount�ofcoldwater�habitat�than�the�USCOE�calculated�values.�
18
Water�Quality
Total�dissolved�solids�(TDS)�varied�drastically�throughout�Lake�Sakakawea.�There�was�a�generalincreasing�trend�from�1992�through�1996�at�all�sites.�The�range�of�change�varied�greatly�from�siteto�site.�TDS�at�RM�1390�(face�of�dam)�started�off�in�1992�just�below�400�mg/L�and�ended�in1996�just�above�400�mg/L.�Also�TDS�concentrations�did�not�have�wide�fluctuations�during�eachyear.�Further�up�the�reservoir,�this�pattern�did�not�hold�true.�At�RM�1516�(Lewis�and�Clark�StatePark)�wide�fluctuations�occurred�between�and�among�years.�Each�year,�TDS�concentrations�started�out�near�250�mg/L�and�ended�over�400�mg/L.�During1994,�concentrations�started�and�ended�even�higher.�
Kjeldahl�nitrogen�and�nitrate�and�nitrite�levels�followed�much�the�same�pattern�throughout�thereservoir,�with�one�minor�exception.�The�concentration�levels�remained�approximately�the�sameover�the�project�period.
Sulfate,�sodium,�iron,�alkalinity,�bicarbonate,�carbonate,�chromium�and�selenium�all�followed�thesame�basic�pattern�of�TDS.�A�slight,�gradual�increase�in�concentration�with�low�variation�near�thedam�and�wide�ranging�variations�within�each�year�further�upstream.�These�changes�in�waterquality�are�to�be�expected,�with�the�majority�of�the�ions�entering�the�system�through�theYellowstone�and�Missouri�rivers�and�subsequently�dropping�out�by�RM�1466�(Pouch�Point).�Thisleaves�the�water�with�the�lowest�TDS�nearest�Garrison�Dam.�
19
Literature�Cited
Lee,�J.D.�2001.�Personal�communication.�North�Dakota�Game�&�Fish�Department.�Riverdale,North�Dakota.
US�Army�Corps�of�Engineers.�1994.�Volume�7B:Environmental�Studies.�Missouri�River�MasterManual�Review�and�Update�Study.�U.S.�Army�Corps�of�Engineers.�Omaha�District.Missouri�River�Division.�Omaha,�Nebraska.
US�Army�Corps�of�Engineers.�1994.�Volume�8:Environmental�Impacts��Model.�Missouri�RiverMaster�Manual�Review�and�Update�Study.�U.S.�Army�Corps�of�Engineers.�OmahaDistrict.�Missouri�River�Division.�Omaha,�Nebraska.
US�Geological�Survey.�1993.�Water-Data�Report.�ND-92-1.
US�Geological�Survey.�1994.�Water-Data�Report.�ND-93-1.
US�Geological�Survey.�1995.�Water-Data�Report.�ND-94-1.
US�Geological�Survey.�1996.�Water-Data�Report.�ND-95-1.
US�Geological�Survey.�1997.�Water-Data�Report.�ND-96-1.
US�Geological�Survey.�1998.�Water-Data�Report.�ND-97-1.
US�Geological�Survey.�1999.�Water-Data�Report.�ND-98-1.

20
Appendix
Variables�and�Concentrations
Contact�the�North�Dakota�Department�of�Health