Embed Size (px)
Citation preview

1 3
Eur Food Res TechnolDOI 10.1007/s00217-016-2706-0
ORIGINAL PAPER
Chemical constituents analysis of white tea of different qualities and different storage times
Jing‑Ming Ning1 · Ding Ding1 · Ya‑Sai Song1 · Zheng‑Zhu Zhang1 · Xianjingli Luo1 · Xiao‑Chun Wan1
Received: 14 July 2015 / Revised: 27 April 2016 / Accepted: 8 May 2016 © Springer-Verlag Berlin Heidelberg 2016
Introduction
White tea is one of the six major tea categories in China, mainly produced in Fujian Province. The production pro-cess of white tea is significantly different compared with those of other teas, such as green tea, black tea and pu-erh tea. It is a lightly fermented tea with only two simple processing called withering and drying. It retains large quantities of catechins, amino acids and other constituents because of its simplest process. White tea is a seasonal crop (spring) with special flavor, and its health benefits have been explained gradually by scientists [1]. Yen et al. [2] had found that the water extracts of white tea had significant antioxidant properties and can maintain the normal redox status of the cell. In addition, white tea owned a greater inhibitory potency than the green tea in the Salmonella assay [3]. Zhao et al. [4] analyzed Pu’er raw tea, green tea and white tea by UPLC/DAD/MS and found the contents of total catechins in white tea and green tea were similar and higher than that in Pu’er raw tea; furthermore, the contents of phenolic acid derivatives and total flavonoids were the highest in white tea. There is a general belief that the more aged white tea is, the better it is. In addition, the chemical quality of different grades of white tea is still confused by consumers and researchers.
White tea has four grades from high to low which are the main products in the market called Baihao Yinzhen (BY), Bai Mudan (BM), Gong Mei (GM) and Shou Mei (SM). It is mainly graded by tenderness of fresh tea shoots, and these grades have different quality such as performance, flavor and taste. Baihao Yinzhen is the most famous and expensive white tea which is made only from buds with no mature leaves [5], followed by Bai Mudan, Gong Mei and Shou Mei are made from one bud with two leaves, one bud with two or three leaves and mature leaves, respectively.
Abstract Gallic acid, caffeine, catechins and amino acids in different grades of white teas and white teas under dif-ferent storage times were determined in this study. The qualitative analysis was carried out on the main chemical components in white teas by ultra-performance liquid chro-matography coupled with triple quadrupole tandem mass spectrometry (UPLC-QQQ-MS/MS). A total of 29 com-pounds were detected in white teas. The results showed that contents of total catechins and caffeine decreased with grades reducing. The middle-grade of white tea, Gong Mei, contained the amino acids at the highest content of 53.606 mg g−1, while the low grade Shou Mei contained the lowest (14.848 mg g−1). It was observed that contents of catechins and amino acids showed a similar tendency to decrease with storage times, while gallic acid increased with storing time (from 0.770 to 1.420 mM). This study suggested that high- and low-grade white tea should not be distinguished solely based on a single characteristic com-ponent or by market price, as well as providing an impor-tant basis for changes in characteristic components in white tea of different storage times.
Keywords White tea · Grade · Storage · Chemical components
Jing-Ming Ning, Ding Ding have contributed equally to this work.
* Xiao-Chun Wan [email protected]
1 State Key Laboratory of Tea Plant Biology and Utilization, Anhui Agricultural University, Hefei 230036, Anhui, China

Eur Food Res Technol
1 3
The contents of polyphenol, caffeine and amino acids are considered to reflect tea quality [6]. Tea is known to have many health-related properties, including physiological and pharmacological activities, which are mainly due to its chemical components like polyphenols, alkaloids, amino acids and others [7]. Analytical methods for quantifying these tea components involve extraction, separation and analysis [8].
A series of chemical reactions will take place during storage. Recent research shows that the quality of pu-erh tea would be better with storage time [9]. In the previous study, the comparison analysis of aged white tea and newly made white tea also indicated that the long-term stored white tea has a better healthy function than that of newly made white tea [10]. As a result, the influence of storage on tea quality is worth studying.
There are quite a number of studies on health function of white tea; however, the systematic research on white tea of different grades and different stored times is limited. The paper detected and compared the contents of catechins, caf-feine and main amino acids in white teas from different grades and different stored times which were stored under the same condition by high-performance liquid chromatog-raphy (HPLC) and investigated the main biochemical com-ponents in white tea for qualitative identification by UPLC-QQQ-MS/MS. The aim of this paper was to ascertain the difference in effective components among white teas of dif-ferent grades and different stored times and identify chemi-cal components in white tea.
Materials and methods
Chemicals and reagents
Standards of caffeine, gallic acid (99 %, GA), (+)-catechin (99 %, C), (−)-epicatechin (99 %, EC), (−)-epicatechin gallate (99 %, ECG), (−)-epigallocatechin gallate (99 %,
EGCG) and (−)-epigallocatechin (99 %, EGC) were from Sigma (Sigma Chemical Co., St. Louis, MO, USA). HPLC and UPLC grade acetonitrile, methyl alcohol and acetic acid were from Tedia (Tedia Co., Ohio, USA). The stand-ards of 17 kinds of amino acids and theanine (100 %) were from Waters (Waters Corp., Milford, MA, USA). Water was purified with a water purification system (Aquapro International Co., Delaware, USA).
Materials
All of teas were obtained from Fujian PinPinxiang Tea Co., Ltd (Fujian, China). 2013 Baihao Yinzhen (2013 BY), 2013 Bai Mudan (2013 BM), 2013 Gong Mei (2013 GM) and 2013 Shou Mei (2013 SM) were produced in 2013, 2012 Shou Mei (2012 SM) was produced in 2012, 2010 Shou Mei (2010 SM) was produced in 2010, and 1993 Shou Mei (1993 SM) was produced in 1993. All teas were cultivated in the same tea plantation, picked in the spring (from April 1 to April 20) and processed in the same factory, as well as naturally preserving in the storehouse in the same condi-tion: dry, sealed and avoid from light and smell.
Preparation of the test solution
Ground sample of tea (0.2 g) was extracted with 5 mL 70 % methanol at 70 °C for 10 min with stirring (every 5 min) and then centrifuged at 1400×g for 10 min under room temperature. The supernatant was taken into a 10-mL volumetric flask, then repeated the steps and diluted with 70 % methanol to 10 mL. After that, the extracts were diluted to five times for further filtering through 0.22- μm Millipore filter for analysis of catechins, gallic acid (GA) and caffeine by HPLC.
One-gram tea sample was extracted with 300 mL of hot water (100 °C) for 20 min. The extract was vacuum-filtered, then transferred to 500-mL volumetric flask and diluted with water to volume, and mixed. After that, the
Fig. 1 HPLC chromatogram of mixed references of catechins, GA and caffeine
Eur Food Res Technol
1 3
extract was filtered through a 0.22- μm Millipore filter and transferred into centrifuge tube. Finally, pre-column deri-vatization was performed using the AccQ-Fluor Reagent Kit according to the manufacturer’s specifications. The test solution was further analyzed for amino acids on HPLC.
Determination of catechins, caffeine and GA
High-performance liquid chromatography (HPLC) was used to determine the catechins and caffeine in white tea samples. The Waters E2695 series HPLC system (Waters Corp., Milford, MA, USA) consisted of a sample manager, a quaternary solvent manager, a ultraviolet/visible detector and a SymmetryR C18 column (particle size 5 μm; column size 250 mm × 4.6 mm; Waters). The gradient was from solvent A (9 % acetonitrile, 2 % acetic acid, 0.2 % EDTA, 88.8 % water) to solvent B(80 % acetonitrile, 2 % acetic acid, 0.2 % EDTA, 17.8 % water), and the linear gradi-ent condition of mobile phase was 0–10 min, 100 % A; 10–25 min, 100–68 % A; 25–35 min, 68 % A; 35–40 min, 68–45 % A; 40–45 min, 45 % A; 45–50 min, 45–100 % A; and 50–60 min, 100 % A. The flow rate was 1 mL min−1, and the detection was performed at 278 nm.
Determination of amino acids
Sample analysis was carried out with a Waters 600 series HPLC system (Waters Corp., Milford, MA, USA). A Waters AccQ.Tag reversed-phase HPLC column (particle size 4 μm; column size 3.9 mm × 150 mm; Waters) was used, and column temperature was maintained at 25 °C. The mobile phase was composed of AccQ.Tag Eluent A (A), acetonitrile (B) and Milli-Q water (C). The gradient program used for separation of the tea amino acids: 100 % A at 0 min, turned linearly to 91 % A, 5 % B and 4 % C at 17 min, then changed into 80 % A, 17 % B and 3 % C at 24 min, 68 % A, 20 % B and 12 % C at 32 min and last for 2 min, then went to 60 % B, 40 % C at 35 min to 37 min, and returned to 100 % A at 38 min, then added to column wash and stabilization from 38 to 45 min. The flow rate was 1 mL min−1, and the detection was at 395 nm. The contents of amino acids were obtained from chromatograms. The regression equation, limit of detection (LOD) and limit of quantification (LOQ) in the determination of amino acids are listed in Table 1. The calibration curves of the amino acids showed good linearity (r2 ≥ 0.99). LOD and LOQ values were less than 0.07 and 0.2 μg mL−1, respectively.
Table 1 Regression equation, LOD and LOQ in the determination of analytes
a y is the peak area; x is the concentration (pmol/μL)b y is the peak area; x is the concentration (mg/mL)
Compounds Regression equationa Correlation coefficient r2
LOD (μg/mL) LOQ (μg/mL)
Asp y = 3592.2x − 6500.3 0.9999 0.03 0.11
Ser y = 4807.5x − 4114.4 0.9996 0.03 0.08
Glu y = 3479.2x − 9100.8 0.9991 0.04 0.12
Gly y = 4088.8x + 1534 0.9999 0.02 0.06
His y = 7117x − 6903.1 0.9997 0.04 0.13
Arg y = 7456.8x − 4108.6 0.9994 0.04 0.14
Thr y = 7527.7x − 11618 0.9990 0.03 0.10
Ala y = 6243.9x − 396.91 0.9994 0.02 0.07
Pro y = 3074.2x + 724.02 0.9995 0.06 0.19
Theab y = 90474x − 84651 0.9992 0.01 0.03
Cys y = 1081.3x + 9468.2 0.9986 0.05 0.16
Tyr y = 9559.6x − 9006.3 0.9996 0.02 0.06
Val y = 15638x − 18406 0.9994 0.01 0.04
Met y = 13151x − 21355 0.9990 0.02 0.05
Lys y = 6376.5x − 8279.4 0.9997 0.04 0.12
Ile y = 18003x − 16861 0.9999 0.01 0.04
Leu y = 17918x − 28900 0.9998 0.01 0.04
Phe y = 21290x − 7211.1 0.9992 0.02 0.06

Eur Food Res Technol
1 3
Tea preparation for UPLC‑QQQ‑MS/MS
Hundred milligrams of each tea sample (approximately 8 % moisture content, 40 mesh to 60 mesh) was placed in 10-mL plastic centrifuge tube, and added 1 mL of methyl alco-hol/0.1 % acetic acid–water (75:25, v/v) and then vibrated for 10 s. After mixing, tubes were placed in KQ500DE-type ultrasonic cleaner (220 V, 50 HZ, 500 W) at 30 °C for 20 min. Two hundred microliters of the sample extract was diluted to 2 mL with distilled water. The solution was further filtered through 0.22-μm Millipore filter. Five microliters of the residual solution was injected to the UPLC-MS/MS system.
UPLC‑QQQ‑MS/MS analysis
The Agilent 6460 series UPLC-MS/MS system consisted of quaternary pump with a vacuum degasser, thermostated col-umn compartment, autosampler, UV detector and triple quad-rupole mass spectrometer (QQQ) from Agilent Technologies (Palo Alto, CA, USA). An Agilent ZORBAX Eclipse Plus C18 column (particle size 1.8 μm, length 100 mm and inter-nal diameter 2.1 mm) was used in this study at a flow rate
of 0.2 mL min−1. The column oven temperature was set at 40 °C, and the detection was performed at 254 nm. The elu-tion profile used two solvents, 0.2 % aqueous acetic acid (A) and acetonitrile (B): 0 min, 0.1 % B; 0–22 min, 0.1–7 % B; 22–25 min, 7–11 % B; 25–30 min, 11–12 % B; 30–31 min, 12–14 % B; 31–43 min, 14–30 % B; and 43–47 min, 30–80 % B. Mass spectra were acquired simultaneously using electro-spray ionization in the negative ionization mode over the range of 100–1000 m/z. A drying gas flow of 6 L min−1, drying gas temperature of 350 °C, nebulizer pressure of 45 psi and capil-lary voltages of 3.5 kV were used in this study.
The compounds in white tea (2013 BY, 2013 SM, 1993 SM) were identified qualitatively by comparing the reten-tion time, deprotonated molecules ([M–H]−) and major fragment ions with the published literature.
Statistical analysis
All data were expressed as means obtained from triplicate experiments ± standard deviation (SD). ANOVA was car-ried out to determine significant difference (a, p < 0.05) by using SPSS 18.0 statistical software.
0.00
0.04
0.08
0.12
b
aa
C c
once
ntra
tion
(mM
)
Ca
0
4
8
12
16
20
24
28
32
c
bb
Caf
fein
e co
ncen
trat
ion
(mM
) D a
2013 BY 2013 BM 2013 GM 2013 SM0.00.10.20.30.40.50.60.70.80.91.0
c
ab
GA
con
cent
ratio
n (m
M)
A
Grade
2013 BY 2013 BM 2013 GM 2013 SMGrade
2013 BY 2013 BM 2013 GM 2013 SMGrade
2013 BY 2013 BM 2013 GM 2013 SMGrade
abc
0
1
2
3
4
5
cd
EGC
con
cent
ratio
n (m
M)
B a
b
Fig. 2 Concentrations of GA, catechins and caffeine in white teas of different grades: A GA, B EGC, C +C, D Caffeine. Data are mean ± standard deviation of three replicates. Test of the significance
of difference is showing in the figure, “a” versus “a” meaning that there is no significant difference (p > 0.05). Results are expressed as mM (1 g dry tea: 50 mL 70 % methanol)
Eur Food Res Technol
1 3
Results and discussion
Separation and quantitation of catechins, GA and caffeine
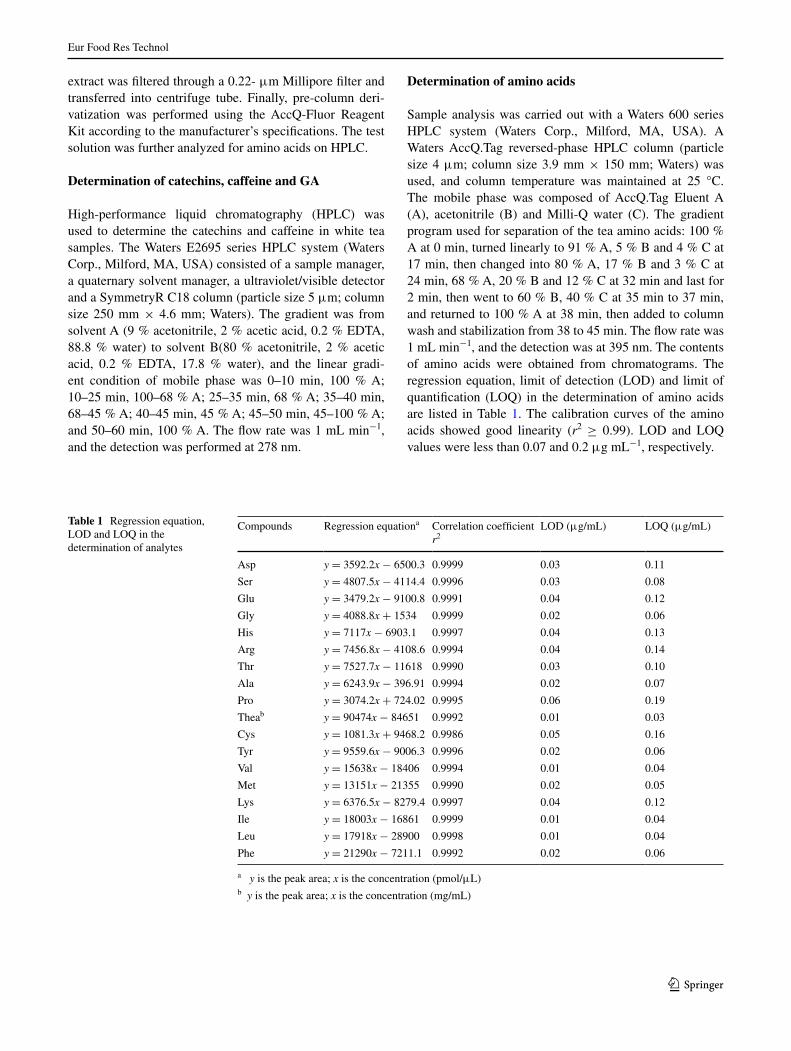
The separation of catechins, GA and caffeine in mixed stand-ards and tea sample was shown in Fig. 1. Determination of the caffeine, esterified catechins (EGCG, ECG) and total catechins in white teas of different grades showed that 2013 BY > 2013 BM > 2013 GM > 2013 SM (Figs. 2D, 3A, C, D), which suggested that total catechins and esterified catechins declined with the growth of new shoots. Eungwanichayapant and Popluechai [11] also determined catechins in new shoots as well as in mature leaves and reported that accumulation of most catechins was higher in new shoots than in mature leaves. As shown in Figs. 2B and 3B, EGC and EC con-centration increased markedly from 2013 BY to 2013 GM and then decreased significantly between 2013 GM to 2013 SM. C showed no significant change from 2013 BY to 2013 GM and was not detectable in 2013 SM (Fig. 2C). Similar trends were also found in the previous study [12]. The trends of EGC concentration were similar to previous reports by
Mamati et al. [13] that the level of EGC in mature leaves was higher than in new shoots. Song [14] has reported that the levels of EGC and EC increased significantly from bud to the second leaf. In addition, the caffeine concentration decreased from 26.881 to 14.797 mM with grade reducing. As noted above, the accumulation of caffeine in new shoots was significantly higher than that in mature leaves [11]. This decrease has also reported [15] that the amount of caffeine presented a decreased in the next elder leaves compared to the leaves at the same stage, as well as demonstrated caffeine synthesized and accumulated mainly on the new shoots and decreased significantly with shoots aging. From 2013 BY to 2013 GM, GA decreased significantly from 0.877 mM to 0.640 mM and then markedly increased to 0.770 mM in 2013 SM (Fig. 2A). Saijo et al. [16] speculated that GA was biosynthesized and esterified with EC and EGC to form ECG and EGCG in young tea shoots. So GA, a kind of tea polyphenols, showed a similar tendency to the previous work [13] that the concentration of tea polyphenols declined with age of tea leaves (from 2013 BY to 2013 GM). However, GA increased from 2013 GM to 2013 SM, which was probably due to the hydrolysis of esterified catechins.
2013 BY 2013 BM 2013 GM 2013 SM0
3
6
9
12
15
18
c
b
a
EGC
G c
once
ntra
tion
(mM
)
Grade
2013 BY 2013 BM 2013 GM 2013 SMGrade
2013 BY 2013 BM 2013 GM 2013 SMGrade
2013 BY 2013 BM 2013 GM 2013 SMGrade
Aa
0.0
0.3
0.6
0.9
1.2
1.5
1.8
2.1
2.4
2.7
c
b
a
EC c
once
ntra
tion
(mM
)
B
c
0
2
4
6
8
d
c
b
ECG
con
cent
ratio
n (m
M)
C a
0
4
8
12
16
20
24
28
c
b
ab
Tota
l Cat
echi
ns c
once
ntra
tion
(mM
)
D a
Fig. 3 Concentrations of catechins in white teas of different grades: A EGCG, B EC, C ECG, D total Catechins. Data are mean ± stand-ard deviation of three replicates. Test of the significance of difference
is showing in the figure, “a” versus “a” meaning that there is no sig-nificant difference (p > 0.05). Results are expressed as mM (1 g dry tea: 50 mL 70 % methanol)

Eur Food Res Technol
1 3
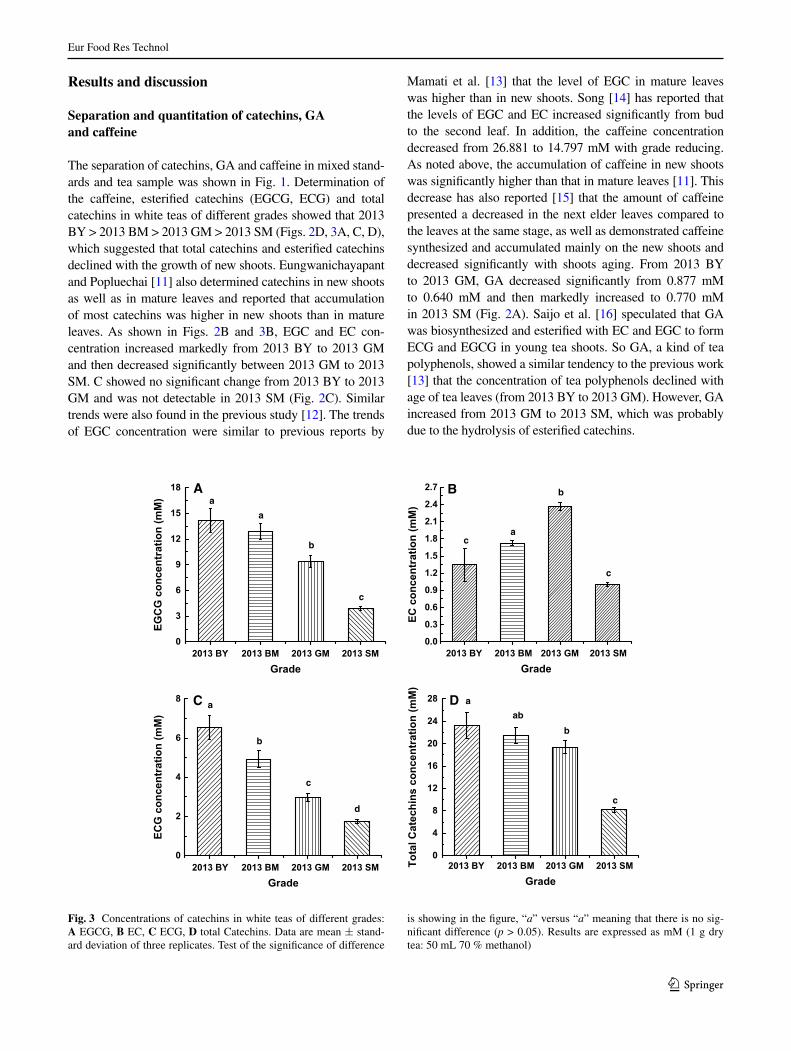
The effect of storing on EC content is shown in Fig. 5A, which reduced significantly with the lengthening of stor-age time. Many factors contributed to the change in tea catechins, chief among that is oxidation [17]. Similarly, the concentrations of EGC, EGCG, ECG and total catechins showed a tendency to decrease markedly from 2013 SM to 2010 SM (Figs. 4B, D, 5B, C). However, these concen-trations increased from 2010 SM to 1993 SM, and similar result was reported in the previous article [18] that indi-vidual and total catechin levels increased in green tea after long-term storage. GA in 1993 SM was significantly higher in comparison with others during storage (Fig. 4A), and this might be connected with oxidative degradation of cat-echins, which is in line with the result of previous analysis that GA content in Pu’er tea increased gradually with the storage time of raw material (Pu’er crude tea) [19]. Yang et al. [20] have reported that gallic acid showed a significant increase after tea infusions stored at 25 °C for 36 h. Gallic acid has been reported to inhibit fatty acid synthase [21] as well as cholesterol biosynthesis in a Hep G2 cell line [22]. However, there was no significant difference in caffeine content from 2013 SM to 2010 SM, resulting from stable purine ring structure of caffeine. The caffeine concentration
of SM which had been stored for 20 years (1993 SM) pre-sented a significant rise. This result was in agreement with the previous study [23]. One possible explanation for this result could be the degradation of complex by theaflavins and caffeine in the storage, which resulted in the dissocia-tion and detection of caffeine. Another possibility would be correlated with tea differences between 20 years—such as variety, cultivation, harvest time, tea plantation and others.
The detection and analysis of amino acids
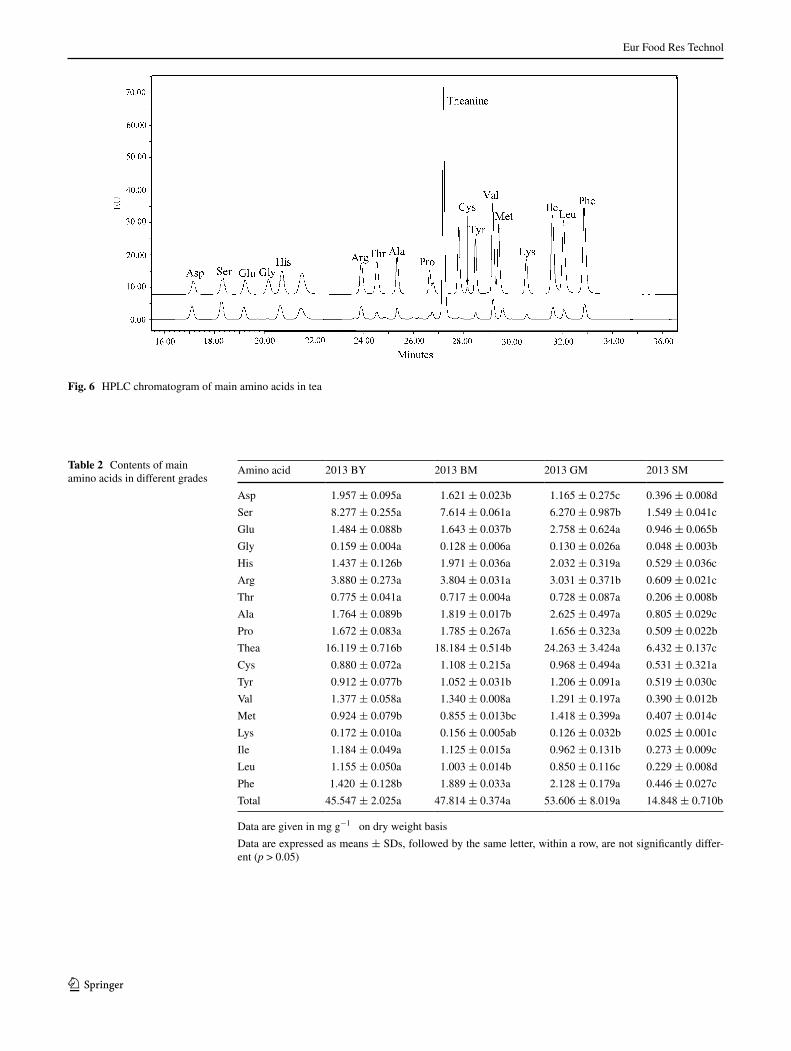
In this study, 18 free amino acids were detected and illus-trated (Fig. 6).
The contents of 18 free amino acids in different grades and different ages are listed in Tables 2 and 3, respectively. Theanine is the predominant amino acid in tea accounting for 30–50 % of the total amino acids [24] and is important for the formation of aroma and umami taste as well as health benefits [25–27]. In this study, despite the fact that all 18 free amino acids were detected, theanine was the most abundant account-ing for 35.4, 38.0, 45.3 and 43.3 % of 18 amino acids from BY to SM, respectively and then followed by
2013 SM 2012 SM 2010 SM 1993 SM0.0
0.2
0.4
0.6
0.8
1.0
1.2
1.4
1.6
c
b b
GA
con
cent
ratio
n (m
M)
Year
2013 SM 2012 SM 2010 SM 1993 SMYear
2013 SM 2012 SM 2010 SM 1993 SMYear
2013 SM 2012 SM 2010 SM 1993 SMYear
A a
0.0
0.3
0.6
0.9
1.2
1.5
1.8
cc
b
EGC
con
cent
ratio
n (m
M)
B a
0
5
10
15
20
b b b
Caf
fein
e co
ncen
trat
ion
(mM
) C a
0.0
0.5
1.0
1.5
2.0
2.5
3.0
3.5
4.0
4.5
d
c
b
EGC
G c
once
ntra
tion
(mM
)
D a
Fig. 4 Concentrations of GA, catechins and caffeine in white teas of different stored times: A GA, B EGC, C Caffeine, D EGCG. Data are mean ± standard deviation of three replicates. Test of the significance
of difference is showing in the figure, “a” versus “a” meaning that there is no significant difference (p > 0.05). Results are expressed as mM (1 g dry tea: 50 mL 70 % methanol)
Eur Food Res Technol
1 3
serine (levels as 0.609–3.880 mg g−1) and arginine (lev-els as 1.549–8.277 mg g−1). Except for theanine, serine and arginine, each grade contained the content of other 15 amino acids in Table 2 levels up to 17.271, 18.212, 20.043, 6.258 mg g−1(from BY to SM, respectively). Table 2 shows the content of total amino acids increased gradually from BY to GM and then dropped from GM to SM. GM contained the highest content, which was 3.6 times higher than that in SM, the lowest grade. The results demonstrated that only when the maturity in a moderate condition can the highest amino acids contents be reached. GM has moderate maturity, resulting in a sharp metabolism. Under these conditions, water-soluble proteins were hydrolyzed into amino acids. According to previous research, theanine is synthesized from eth-ylamine and glutamic acid by theanine synthetase in the root of tea and then transports to the tea shoot [28]. The content of theanine was reduced with the leaf maturity; similar results were found in the previous analysis [29]. However, the internode contained the highest amount of theanine in all parts of tea leaves [30]. The contents of amino acids increased from BY to GM, which might
be linked with some tender stem. There are old leaves and lignified stem in SM and caused the lowest level in amino acids. However, many factors may accord with the amino acids’ content, including variety, growing location, method of cultivation and others [31].
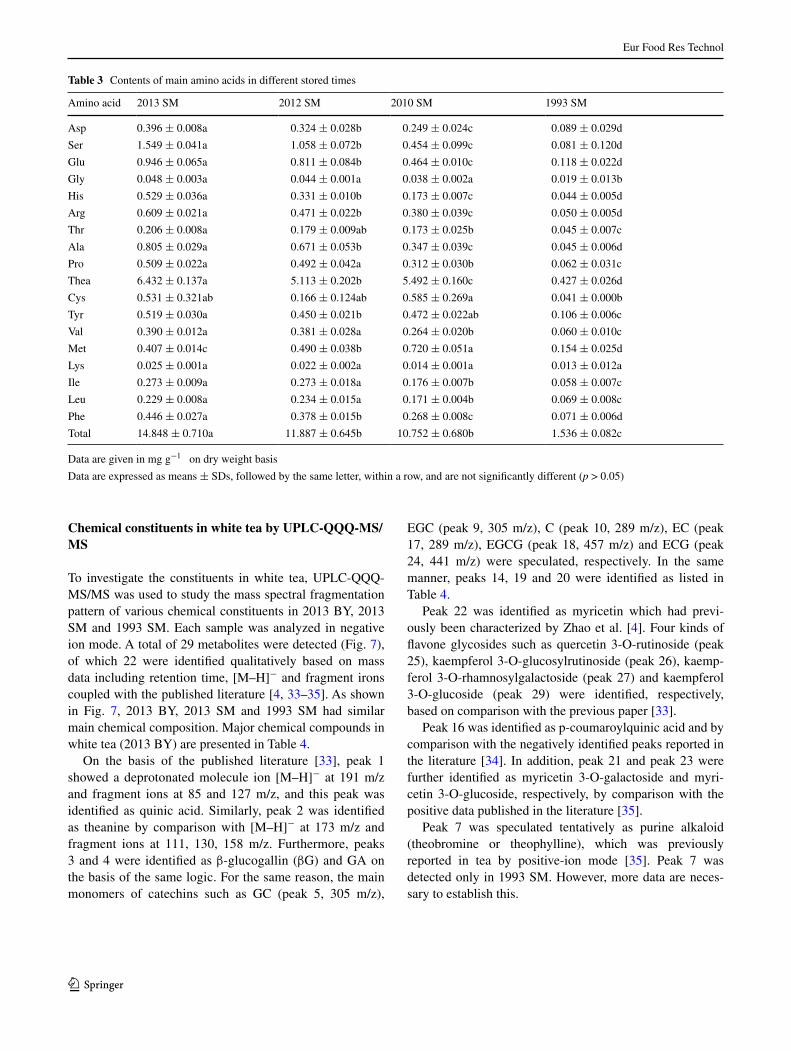
Based on Table 3, the contents of 18 amino acids decreased with age. The contents of amino acids in 1993 SM were very low: theanine, Asp, Ser, Glu, His, Arg, Ala and Phe, all of which showed a similar variation tendency that decreased strongly to total amino acids from 2013 SM to 1993 SM. The theanine content in 2013 SM was 15.4 times higher than that in 1993 SM, and the content of total amino acids in 2013 SM is 9.6 times higher than that in 1993 SM. This should be attributed to a series of physi-ological and biochemical reactions like oxidation by cat-echin o-quinone and subsequently Strecker degradation, which leads to a decrease in amino acids [32]. On the other hand, most amino acids did not reduce significantly in the short term due to the hydrolysis of protein to amino acids—even an increase in methionine from 2013 SM to 2010 SM, so the contents of amino acids had no significant change during short-time storage.
2013 SM 2012 SM 2010 SM 1993 SM0.0
0.2
0.4
0.6
0.8
1.0
1.2
d
c
b
EC c
once
ntra
tion
(mM
)
Year
2013 SM 2012 SM 2010 SM 1993 SMYear
2013 SM 2012 SM 2010 SM 1993 SMYear
A a
0.0
0.4
0.8
1.2
1.6
2.0
c
bb
ECG
con
cent
ratio
n (m
M)
B a
0
2
4
6
8
10
d
c
b
Tota
l Cat
echi
ns c
once
ntra
tion
(mM
)
Ca
Fig. 5 Concentrations of catechins in white teas of different stored times: A EC, B ECG, C total catechins. Data are mean ± standard deviation of three replicates. Test of the significance of difference is
showing in the figure, “a” versus “a” meaning that there is no signifi-cant difference (p > 0.05). Results are expressed as mM (1 g dry tea: 50 mL 70 % methanol)
Eur Food Res Technol
1 3
Fig. 6 HPLC chromatogram of main amino acids in tea
Table 2 Contents of main amino acids in different grades
Data are given in mg g−1 on dry weight basis
Data are expressed as means ± SDs, followed by the same letter, within a row, are not significantly differ-ent (p > 0.05)
Amino acid 2013 BY 2013 BM 2013 GM 2013 SM
Asp 1.957 ± 0.095a 1.621 ± 0.023b 1.165 ± 0.275c 0.396 ± 0.008d
Ser 8.277 ± 0.255a 7.614 ± 0.061a 6.270 ± 0.987b 1.549 ± 0.041c
Glu 1.484 ± 0.088b 1.643 ± 0.037b 2.758 ± 0.624a 0.946 ± 0.065b
Gly 0.159 ± 0.004a 0.128 ± 0.006a 0.130 ± 0.026a 0.048 ± 0.003b
His 1.437 ± 0.126b 1.971 ± 0.036a 2.032 ± 0.319a 0.529 ± 0.036c
Arg 3.880 ± 0.273a 3.804 ± 0.031a 3.031 ± 0.371b 0.609 ± 0.021c
Thr 0.775 ± 0.041a 0.717 ± 0.004a 0.728 ± 0.087a 0.206 ± 0.008b
Ala 1.764 ± 0.089b 1.819 ± 0.017b 2.625 ± 0.497a 0.805 ± 0.029c
Pro 1.672 ± 0.083a 1.785 ± 0.267a 1.656 ± 0.323a 0.509 ± 0.022b
Thea 16.119 ± 0.716b 18.184 ± 0.514b 24.263 ± 3.424a 6.432 ± 0.137c
Cys 0.880 ± 0.072a 1.108 ± 0.215a 0.968 ± 0.494a 0.531 ± 0.321a
Tyr 0.912 ± 0.077b 1.052 ± 0.031b 1.206 ± 0.091a 0.519 ± 0.030c
Val 1.377 ± 0.058a 1.340 ± 0.008a 1.291 ± 0.197a 0.390 ± 0.012b
Met 0.924 ± 0.079b 0.855 ± 0.013bc 1.418 ± 0.399a 0.407 ± 0.014c
Lys 0.172 ± 0.010a 0.156 ± 0.005ab 0.126 ± 0.032b 0.025 ± 0.001c
Ile 1.184 ± 0.049a 1.125 ± 0.015a 0.962 ± 0.131b 0.273 ± 0.009c
Leu 1.155 ± 0.050a 1.003 ± 0.014b 0.850 ± 0.116c 0.229 ± 0.008d
Phe 1.420 ± 0.128b 1.889 ± 0.033a 2.128 ± 0.179a 0.446 ± 0.027c
Total 45.547 ± 2.025a 47.814 ± 0.374a 53.606 ± 8.019a 14.848 ± 0.710b

Eur Food Res Technol
1 3
Fig. 7 UPLC of white tea extract at 254 nm: A 2013 BY, B 1993 SM, C 2013 SM
Eur Food Res Technol
1 3
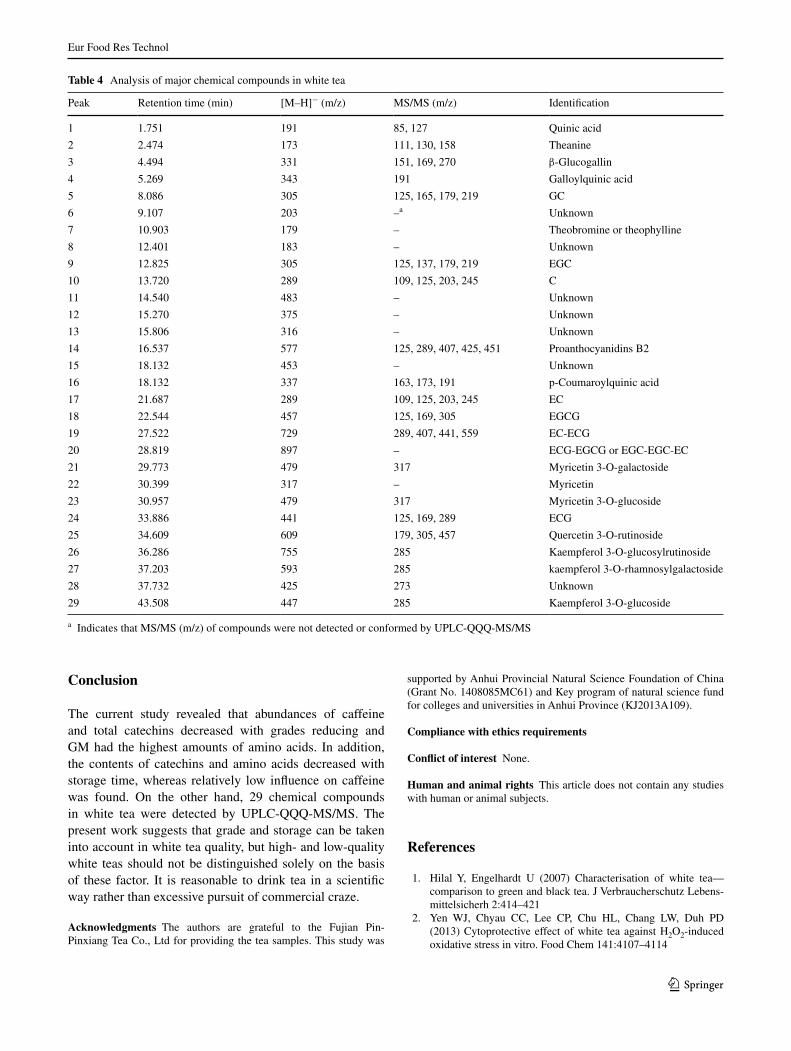
Chemical constituents in white tea by UPLC‑QQQ‑MS/MS
To investigate the constituents in white tea, UPLC-QQQ-MS/MS was used to study the mass spectral fragmentation pattern of various chemical constituents in 2013 BY, 2013 SM and 1993 SM. Each sample was analyzed in negative ion mode. A total of 29 metabolites were detected (Fig. 7), of which 22 were identified qualitatively based on mass data including retention time, [M–H]− and fragment irons coupled with the published literature [4, 33–35]. As shown in Fig. 7, 2013 BY, 2013 SM and 1993 SM had similar main chemical composition. Major chemical compounds in white tea (2013 BY) are presented in Table 4.
On the basis of the published literature [33], peak 1 showed a deprotonated molecule ion [M–H]− at 191 m/z and fragment ions at 85 and 127 m/z, and this peak was identified as quinic acid. Similarly, peak 2 was identified as theanine by comparison with [M–H]− at 173 m/z and fragment ions at 111, 130, 158 m/z. Furthermore, peaks 3 and 4 were identified as β-glucogallin (βG) and GA on the basis of the same logic. For the same reason, the main monomers of catechins such as GC (peak 5, 305 m/z),
EGC (peak 9, 305 m/z), C (peak 10, 289 m/z), EC (peak 17, 289 m/z), EGCG (peak 18, 457 m/z) and ECG (peak 24, 441 m/z) were speculated, respectively. In the same manner, peaks 14, 19 and 20 were identified as listed in Table 4.
Peak 22 was identified as myricetin which had previ-ously been characterized by Zhao et al. [4]. Four kinds of flavone glycosides such as quercetin 3-O-rutinoside (peak 25), kaempferol 3-O-glucosylrutinoside (peak 26), kaemp-ferol 3-O-rhamnosylgalactoside (peak 27) and kaempferol 3-O-glucoside (peak 29) were identified, respectively, based on comparison with the previous paper [33].
Peak 16 was identified as p-coumaroylquinic acid and by comparison with the negatively identified peaks reported in the literature [34]. In addition, peak 21 and peak 23 were further identified as myricetin 3-O-galactoside and myri-cetin 3-O-glucoside, respectively, by comparison with the positive data published in the literature [35].
Peak 7 was speculated tentatively as purine alkaloid (theobromine or theophylline), which was previously reported in tea by positive-ion mode [35]. Peak 7 was detected only in 1993 SM. However, more data are neces-sary to establish this.
Table 3 Contents of main amino acids in different stored times
Data are given in mg g−1 on dry weight basis
Data are expressed as means ± SDs, followed by the same letter, within a row, and are not significantly different (p > 0.05)
Amino acid 2013 SM 2012 SM 2010 SM 1993 SM
Asp 0.396 ± 0.008a 0.324 ± 0.028b 0.249 ± 0.024c 0.089 ± 0.029d
Ser 1.549 ± 0.041a 1.058 ± 0.072b 0.454 ± 0.099c 0.081 ± 0.120d
Glu 0.946 ± 0.065a 0.811 ± 0.084b 0.464 ± 0.010c 0.118 ± 0.022d
Gly 0.048 ± 0.003a 0.044 ± 0.001a 0.038 ± 0.002a 0.019 ± 0.013b
His 0.529 ± 0.036a 0.331 ± 0.010b 0.173 ± 0.007c 0.044 ± 0.005d
Arg 0.609 ± 0.021a 0.471 ± 0.022b 0.380 ± 0.039c 0.050 ± 0.005d
Thr 0.206 ± 0.008a 0.179 ± 0.009ab 0.173 ± 0.025b 0.045 ± 0.007c
Ala 0.805 ± 0.029a 0.671 ± 0.053b 0.347 ± 0.039c 0.045 ± 0.006d
Pro 0.509 ± 0.022a 0.492 ± 0.042a 0.312 ± 0.030b 0.062 ± 0.031c
Thea 6.432 ± 0.137a 5.113 ± 0.202b 5.492 ± 0.160c 0.427 ± 0.026d
Cys 0.531 ± 0.321ab 0.166 ± 0.124ab 0.585 ± 0.269a 0.041 ± 0.000b
Tyr 0.519 ± 0.030a 0.450 ± 0.021b 0.472 ± 0.022ab 0.106 ± 0.006c
Val 0.390 ± 0.012a 0.381 ± 0.028a 0.264 ± 0.020b 0.060 ± 0.010c
Met 0.407 ± 0.014c 0.490 ± 0.038b 0.720 ± 0.051a 0.154 ± 0.025d
Lys 0.025 ± 0.001a 0.022 ± 0.002a 0.014 ± 0.001a 0.013 ± 0.012a
Ile 0.273 ± 0.009a 0.273 ± 0.018a 0.176 ± 0.007b 0.058 ± 0.007c
Leu 0.229 ± 0.008a 0.234 ± 0.015a 0.171 ± 0.004b 0.069 ± 0.008c
Phe 0.446 ± 0.027a 0.378 ± 0.015b 0.268 ± 0.008c 0.071 ± 0.006d
Total 14.848 ± 0.710a 11.887 ± 0.645b 10.752 ± 0.680b 1.536 ± 0.082c
Eur Food Res Technol
1 3
Conclusion
The current study revealed that abundances of caffeine and total catechins decreased with grades reducing and GM had the highest amounts of amino acids. In addition, the contents of catechins and amino acids decreased with storage time, whereas relatively low influence on caffeine was found. On the other hand, 29 chemical compounds in white tea were detected by UPLC-QQQ-MS/MS. The present work suggests that grade and storage can be taken into account in white tea quality, but high- and low-quality white teas should not be distinguished solely on the basis of these factor. It is reasonable to drink tea in a scientific way rather than excessive pursuit of commercial craze.
Acknowledgments The authors are grateful to the Fujian Pin-Pinxiang Tea Co., Ltd for providing the tea samples. This study was
supported by Anhui Provincial Natural Science Foundation of China (Grant No. 1408085MC61) and Key program of natural science fund for colleges and universities in Anhui Province (KJ2013A109).
Compliance with ethics requirements
Conflict of interest None.
Human and animal rights This article does not contain any studies with human or animal subjects.
References
1. Hilal Y, Engelhardt U (2007) Characterisation of white tea—comparison to green and black tea. J Verbraucherschutz Lebens-mittelsicherh 2:414–421
2. Yen WJ, Chyau CC, Lee CP, Chu HL, Chang LW, Duh PD (2013) Cytoprotective effect of white tea against H2O2-induced oxidative stress in vitro. Food Chem 141:4107–4114
Table 4 Analysis of major chemical compounds in white tea
a Indicates that MS/MS (m/z) of compounds were not detected or conformed by UPLC-QQQ-MS/MS
Peak Retention time (min) [M–H]− (m/z) MS/MS (m/z) Identification
1 1.751 191 85, 127 Quinic acid
2 2.474 173 111, 130, 158 Theanine
3 4.494 331 151, 169, 270 β-Glucogallin
4 5.269 343 191 Galloylquinic acid
5 8.086 305 125, 165, 179, 219 GC
6 9.107 203 –a Unknown
7 10.903 179 – Theobromine or theophylline
8 12.401 183 – Unknown
9 12.825 305 125, 137, 179, 219 EGC
10 13.720 289 109, 125, 203, 245 C
11 14.540 483 – Unknown
12 15.270 375 – Unknown
13 15.806 316 – Unknown
14 16.537 577 125, 289, 407, 425, 451 Proanthocyanidins B2
15 18.132 453 – Unknown
16 18.132 337 163, 173, 191 p-Coumaroylquinic acid
17 21.687 289 109, 125, 203, 245 EC
18 22.544 457 125, 169, 305 EGCG
19 27.522 729 289, 407, 441, 559 EC-ECG
20 28.819 897 – ECG-EGCG or EGC-EGC-EC
21 29.773 479 317 Myricetin 3-O-galactoside
22 30.399 317 – Myricetin
23 30.957 479 317 Myricetin 3-O-glucoside
24 33.886 441 125, 169, 289 ECG
25 34.609 609 179, 305, 457 Quercetin 3-O-rutinoside
26 36.286 755 285 Kaempferol 3-O-glucosylrutinoside
27 37.203 593 285 kaempferol 3-O-rhamnosylgalactoside
28 37.732 425 273 Unknown
29 43.508 447 285 Kaempferol 3-O-glucoside

Eur Food Res Technol
1 3
3. SantanaRios G, Orner GA, Amantana A, Provost C, Wu SY, Dashwood RH (2001) Potent antimutagenic activity of white tea in comparison with green tea in the Salmonella assay. Mutat Res 495:61–74
4. Zhao Y, Chen P, Lin L, Harnly JM, Yu LL, Li Z (2011) Tentative identification, quantitation, and principal component analysis of green pu-erh, green, and white teas using UPLC/DAD/MS. Food Chem 126:1269–1277
5. Damiania E, Bacchettia T, Padellab L, Tianob L, Carlonic P (2014) Antioxidant activity of different white teas: comparison of hot and cold tea infusions. J Food Compos Anal 33:59–66
6. Zhong M, Yan Z, Lin Y (2012) Determination of caffeine, thean-ine, (-)-epicatechin and (-)-epigallocatechin gallate in tea by cap-illary zone electrophoresis. Food Sci 33:286–288
7. Horanni R, Engelhardt UH (2013) Determination of amino acids in white, green, black, oolong, pu-erh teas and tea products. J Food Compos Anal 31:0889–1575
8. Rusak G, Komes D, Likić S, Komes D, Horžić D, Kovac M (2008) Phenolic content and antioxidative capacity of green and white tea extracts depending on extraction conditions and the solvent used. Food Chem 110:852–858
9. Tian J, Zhu Z, Wu B, Wang L, Liu X (2013) Bacterial and fungal communities in Pu’er tea samples of different ages. J Food Sci 78:M1249–M1256
10. Zhou QQ, Sun WJ, Ye Y, Chen X (2014) Study on the main bio-chemical components of white tea stored at different years. Sci Technol Food Ind 35:351–354
11. Eungwanichayapant PD, Popluechai S (2009) Accumulation of catechins in tea in relation to accumulation of mRNA from genes involved in catechin biosynthesis. Plant Physiol Biochem 47:94–97
12. Chen CN, Liang CM, Lai JR, Tsai YJ, Tsay JS, Lin JK (2003) Capillary electrophoretic determination of theanine, caffeine, and catechins in fresh tea leaves and oolong tea and their effects on rat neurosphere adhesion and migration. J Agric Food Chem 51:7495–7503
13. Mamati GE, Liang Y, Lu J (2006) Expression of basic genes involved in tea polyphenol synthesis in relation to accumula-tion of catechins and total tea polyphenols. J Sci Food Agric 86:459–464
14. Song R, Kelman D, Johns KL, Wright AD (2012) Correlation between leaf age, shade levels, and characteristic beneficial natu-ral constituents of tea (Camellia sinensis) grown in Hawaii. Food Chem 133:707–714
15. Zhang J, Yang H, Wei C-L, Tai Y-L, Chen Q, Wan X-C (2013) Changes on characteristic components during shoots develop-ment in Camellia sinensis. J Tea 4:P234–P239
16. Saijo R (1983) Pathway of gallic acid biosynthesis and its esteri-fication with catechins in young tea shoots. Agric Biol Chem 47:455–460
17. Ananingsih VK, Sharma A, Zhou W (2013) Green tea catechins during food processing and storage: a review on stability and detection. Food Res Int 50:469–479
18. Friedman M, Levin CE, Lee SU, Kozukue N (2009) Stability of green tea catechins in commercial tea leaves during storage for 6 months. J Food Sci 74:H47–H51
19. She GM, Zhang XL, Chen KK, Zhang YJ, Yang CR (2005) Content variation of theanine and gallic acid in Pu-Er tea. Acta Botanica Yunnanica 5:572–576
20. Yang DJ, Hwang LS, Lin JT (2013) Effects of different steeping methods and storage on caffeine, catechins and gallic acid in bag tea infusions. J Chromatogr A 1156:312–320
21. Wang X, Song KS, Guo QX, Tian WX (2003) The galloyl moi-ety of green tea catechins is the critical structural feature to inhibit fattyacid synthase. Biochem Pharmacol 66:2039–2047
22. Lu CH, Hwang LS (2008) Polyphenol contents of pu-erh teas and their abilities to inhibit cholesterol biosynthesis in Hep G2 cell line. Food Chem 111:67–71
23. Gao L, Liu TX (2013) Study on chemicals and antioxidant activ-ity of Pu-er teas stored at different time. Food Ind 34:127–130
24. Horanni R, Engelhardt UH (2013) Determination of amino acids in white, green, black, oolong, pu-erh teas and tea products. J Food Compos Anal 31:94–100
25. Bryan J (2007) Psychological effects of dietary components of tea: caffeine and L-theanine. Nutr Rev 66:82–90
26. Nobre AC, Rao A, Owen GN (2008) L-theanine, a natural con-stituent in tea, and its effect on mental state. Asia Pac J Clin Nutr 17:167–168
27. Ferda Sari Y, Velioglu Sedat (2013) Changes in theanine and caf-feine contents of black tea with different rolling methods and processing stages. Eur Food Res Technol 237:229–236
28. Wickremasinghe RL, Perera KPWC (1972) Site of biosynthesis and translocation of theanine in the tea plant. Tea Q 43:175–179
29. Hung Y-T, Chen P-C, Chen RLC, Cheng T-J (2010) Sequential determination of tannin and total amino acid contents in tea for taste assessment by a fluorescent flow-injection analytical sys-tem. Food Chem 118:876–881
30. Janet TC, John WK, Thomas K, Kelvin MO, Francis WN (2015) Effect of seasons on theanine levels in different kenyan commer-cially released tea cultivars and its variation in different parts of the tea shoot. Food Nutr Sci 6:1450–1459
31. Alasalvar C (2013) Flavor characteristics of seven grades of black tea produced in Turkey. J Agric Food Chem 60:6323–6332
32. Stagg GV (1974) Chemical changes occurring during the storage of black tea. J Sci Food Agric 25:1015–1034
33. Jiang XL, Liu YJ, Li WW, Zhao L, Meng F, Wang YS, Tan HR, Yang H, Wei CL, Wan XC, Gao LP, Xia T (2013) Tissue-spe-cific, development-dependent phenolic compounds accumulation profile and gene expression pattern in tea plant [Camellia sinen-sis]. PLoS One 8:1–14
34. Lin LZ, Harnly JM (2007) A screening method for the identifi-cation of glycosylated flavonoids and other phenolic compounds using a standard analytical approach for all plant materials. J Agric Food Chem 55:1084–1096
35. Lin LZ, Chen P, Harnly JM (2008) New phenolic components and chromatographic profiles of green and fermented teas. J Agric Food Chem 56:8130–8140