Embed Size (px)
Citation preview
CHEMICALRESEARCH#DEVELOPMENT faENGINEERINGCENTER CRDEC-CR-
DETECTION OF FOURIER TRANSFORMINFRARED (FTIR) LIGHT BY APHOTOACOUSTIC DETECTOR
cvo
Mark G. Rockley. Ph.D.Oklahoma State University
Stillwater, OK 74078
Dennis M. Davis, Ph.D.Lynn D. Hoffland, Ph.D.
RESEARCH DIRECTORATE
March 1989
DTICElFr-TE
MAY 2 6 1989 U
Aboreo P *vie Ground.M nd 21010-423
___b__on UpUnd072
Disclaimer
The findings in this report are not to be construed as an officialDepartment of the Army position unless so designated by otherauthorizing documents.
Distribution Statement
Approved for public release; distribution is unlimited.
UNCLASS IFI ED
SECURITY CLASSIFICATION OF THIS PAGE
Form Approved
REPORT DOCUMENTATION PAGE OMNo. 004-ro in
la. REPORT SECURITY CLASSIFICATION lb RESTRICTIVE MARKINGSUNCLASSIFIED
2a. SECURITY CLASSIFICATION AUTHORITY 3. DISTRIBUTION/AVAILABILITY OF REPORTApproved for public release;
2b. DECLASSIFICATION /DOWNGRADING SCHEDULE distribution is unl imited.
4. PERFORMING ORGANIZATION REPORT NUMBER(S) S. MONITORING ORGANIZATION REPORT NUMBER(S)
CRDEC-CR- 026
6a. NAME OF PERFORMING ORGANIZATION 6b. OFFICE SYMBOL 7a. NAME OF MONITORING ORGANIZATION(If applicable)
Oklahoma State University Office of Naval Research
6c. ADDRESS (City, State, and ZIP Code) 7b. ADDRESS (City, State, and ZIP Code)
Dept of ChemistryStillwater, OK 74078 Austin, TX 78701-3273
Be. NAME OF FUNDING/SPONSORING Sb. OFFICE SYMBOL 9 PROCUREMENT INSTRUMENT IDENTIFICATION NUMBERORGANIZATION (if applicable)
CRDEC SMCCR-RSL DAAA15-85-K-0014
8c. ADDRESS (City, State, and ZIP Code) 10 SOURCE OF FUNDING NUMBERSPROGRAM PROJECT TASK LWORK UNITELEMENT NO. NO. NO. CCESSION NO.
Aberdeen Proving Ground, M'D 21010-5423 1L161101 A91A
11. TITLE (Include Security Classification)
Detection of Fourier Transform Infrared (FTIR) Light by a Photoacoustic Detector
12. PERSONALAUTHOR(K Rockley, Mark G., Ph.D. Wak1ahoma State University); Davis, Dennis M.,Ph.D.; and Hoffland, Lynn D., Ph.D. (CRDEC)
13a. TYPE OF REPORT 13b. TIME COVERED 114. DATE OF REPORT (Year, Monh, Day) 15. PAGE COUNT
Contractor FROM 85 Sep TO 87 Se p 1989 March 1416. SUPPLEMENTARY NOTATION
COR: Dennis M. Davis, Ph.D., SMCCR-RSL, (301) 671-2437
17. COSATI CODES 18. SUBJECT TERMS (Continue on reverue if necesary and identify by block number)
FIELD GROUP SUB-GROUP Optoacoustic spectroscopy
07 04 Photoacoustic spectroscopy (PAS)09 06 Fourier Transform Infrared (FTIR)
19. ABSTRACT (Continue on reverse if necessary and identify by block number)
The responsivity and NEP ratings of three types of photoacoustic cells has been studied.A 0.5 cc nonresonant photoacoustic cell has an Nep of 15 nW/Hzh at 320 Hz with a responsivitythat decreases with increasing modulation frequency of the incident light. A resonant cellwith an active volume of 3 cm length by 1 cm diameter shows an NEP of 24 nW/Hz", at the Q=7resonance of 5.2 kHz and exhibits an NEP of 120 nW/Hzh over a broad frequency range from
2 to 13 kHz. This cell exhibits an NEP of 25 nW/Hzh at 320 Hz with responsivity decreasingwith increasing modulation frequency up to 1 kHz. An optical deflection system showedpoorer NEP but indicated a 200 fold increase in membrane deflection per Watt of incidentpower compared with a conventional microphone. Another order of magnitude improvementin deflection/Watt is possible, but current optical and capacitive techniques for sensingthis motion are not useful.
20. DISTRIBUTION /AVAILABILITY OF ABSTRACT 21. ABSTRACT SECURITY CLASSIFICATIONrM UNCLASSIFIEDUNLIMITED 0 SAME AS RPT 03 OTIC USERS UNCLASSIFIED
22a. NAME OF RESPONSIBLE INDIVIDUAL 22b TELEPHONE (Include Area Code) 22c. OFFICE SYMBOLSANDRA J. JOHNSON (301) 671-2914 SMCCR-SPS-T
OD Form 1473. JUN 86 Previous editions are obsolete. SECURITY CLASSIFICATION OF THIS PAGE
UNCLASS I FI ED
PREFACE
The work described in this report was authorized under ContractNo. DAAA15-85-K-0014, Project No. 1L1611OIA91A, In-house Laboratory IndependentResearch. This work was started in September 1985 and completed in September1987.
The use of trade names or manufacturers' names in this report doesnot constitute an official endorsement of any commercial products. Thisreport may not be cited for purposes of advertisemient.
Reproduction of this document in whole or in part is prohibitedexcept with permission of the Commander, U.S. Army Chemical Research,Development and Engineering Center, ATTN: SMCCR-SPS-T, Aberdeen Proving Ground,Maryland 21010-5423. However, the Defense Technical Information Center and theNational Technical Information Service are authorized to reproduce the documentfor U.S. Government purposes.
This document has been approved for release to the public.
Aooes ion For
-_ --o, - -NTIS GRA&t 9DTIC TA
U IamouncodJust if 1I oat I.
ByDIs tributon/
Avallbbility Codes
jAvail and/or'Dist Specali
3J -l i

Bl ank
CONTENTS
1. INTRODUCTION.......................7
2. EXPERIMENTAL.......................8
3. RESULTS AND DISCUSSION.................10
4. CONCLUSIONS......................12
LIST OF FIGURES
1. Response of a Resonant Photoacoustic Cell with theAssociated Phase Variation...............13
2. Frequency Response of a Resonant Cell.........13
5

BI ank
DETECTION OF FOURIER TRANSFORM INFRARED (FTIR)LIGHT BY A PHOTOACOUSTIC DETECTOR
1. INTRODUCTION
It is imperative that sensor technology in the midinfrared spectral range advance beyond the performance boundariesof the current generation of devices. Most high sensitivity mid-IR band detectors at high modulation frequencies are based on thecooled Mercury Cadmium Telluride (MCT) device operating inphotoconductive or photovoltaic mode. While much engineeringeffort has been expended in the development of this and relateddetector technologies, for battlefield use the system suffersfrom the requirement of a cryogenic cooling mechanism. This addsweight and maintenance complexity. There are severalpyroelectric devices available (e.g. deuterated triglycinesulfate, DTGS) which have better responsivity than an MCTdetector at room temperature and at low modulation frequencies,but none which compares favorably with its performance when thedetector is operating at 77 K and at high modulation frequencies.
A conceptual alternative to this detection scheme is touse a photoacoustic detector. While the photoacoustic detectoris an energy integrating device and thus suffers from 1/fresponsivity loss, it can be made to function at room temperaturewith very inexpensive, light-weight components. _It is theobjective of this article to describe a series of measurements onan actual photoacoustic detector which were aimed at determiningthe noise equivalent power of a practical device and to assessthe range of the performance of this device. In this way arealistic assessment of the potential for such a detector toserve as a replacement for the MCT detector may be made.
The photoacoustic detector typically incorporates asensing medium (an absorbing gas, liquid or solid) in a sealedcontainer. Modulated incident light is absorbed by the sensingmedium and converted indirectly to a pressure wave which is thensensed by microphones or piezoelectric transducers. Thetechnology itself is well documented in many recent monographs.Most work with photoacoustic techniques has been involved with aspectroscopic examination of the sensing medium. There has beenlittle work with the concept of using the sensing medium todetermine the radiant intensity of the incident light. The Golaydetector is one of the few commercial examples of such a device.However, because of the mechanical design of this detector, thefrequency response of the Golay cell was limited to modulationfrequencies below a few hundred Hertz. What is needed is aphotoacoustic detector of bandwidth sufficient to examine light
7
across the 8-12 micron mid-IR range with responsivity vs. noiseequivalent power (NEP) comparable to that of th, best commercialMCT detectors and which does not require cooling.
It is the objective of this work to examine theplausibility of fabricating a photoacoustic (PAS) cell to detect8-12 micron radiation with sensitivity comparable to that of acooled MCT but with that PAS cell operating at room temperature.There are several literature reports indicating the potential forgenerating very high detectivity levels from gas phase PAScells1 . This study has focussed on defining the broad bandacoustic response of both non-resonant and resonant PAS cellsusing commercial microphones and optical deflection systems. Acalibration procedure has been defined using an Argon ion laserand N02 gas so that reasonably accurate responsivity and noisefigures of merit may be obtained. Furthermore, a comparisonfigure between the responsivity of a hexane soot and a gas as asample has been defined.
2. EXPERIMENTAL
The nonresonant PAS cell has been described earlier 2 .A Bruel and Kjaer 4165 0.5 inch foil electret microphone was usedthroughout as the microphone. This was impedance matched with2642 preamp and subjected to a gain of 40 dB (xlOO) by using aBruel and Kjaer 2810 preamp. A Rofin MKII chopper was used tosquare wave chop the incident light from a Hughes 3225H 2 mWHelium Neon laser or a Cyonics 2202-10MLL air cooled 10 mW Argonion laser. When high modulation frequencies were required,either the higher harmonics from the chopper modulated light wereused or the laser light was passed through an Intra-ActionSWM-50 50 MHz acousto-optic modulator (AOM) which was in turnmodulatcd through the video input mode by the output from HewlettPackard 3325A signal generator. The AOM therefore modulated theincident laser at 100 MHz underneath a 100% modulation depthenvelope and acoustic frequencies tVice that specified by thefrequency synthesizer. This in turn introduces higher harmonicsinto the output modulation resulting in a fundamental frequencymodulated power only 67% of that read by the power meter, an AndoAQ2704 power meter. All power readings were corrected for
1 Optoacoustic Spectroscopy and Detection, Ed. Y.H. Pao,Academic Press, N.Y., N.Y., p.25 (1977).
2 M.G. Rockley, Applied Spectroscopy, 34, 405 (1980).
8
fraction of light absorbed by the sample, reflections at windowinterfaces and any losses due to harmonics subtracting from theaverage power at the fundamental.
The resonant photoacoustic cell was a simple aluminumcylinder with bore of length 3 cm and diameter I cm.. The 4165microphone was placed end on with the incident light entering thesample chamber through a window at the opposite end of thechamber. Provision was made for a gas to enter the chamberthrough a side vent. No attempt was made to polish the interiorof the sample chamber or assure parallelism of the end componentssince obtaining the highest resonance quality factor (Q) was notthe particular aim of the work. A measured Q of 7 indicated thatthe Q was indeed spoiled.
The output from the PAS cells was analyzed by a HewlettPackard 3582A spectrum analyzer giving signal amplitude readingsand system noise floor readings, the latter being compensated forbandwidth and being displayed in units of dBV/Hz /2. Forexperiments on the resonant cell it was necessary to measure thephase of the signal as well. For such measurements the signalwas also analyzed by a Stanford Research Systems SR530 lock-inamplifier set to amplitude and phase tracking mode. Forexperiments in which the modulating source was the AOM, the lock-in amplifier was set for operation at the first harmonic of thefrequency synthesizer reference.
To calibrate the nonresonant cell, N02 gas wasgenerated from nitric acid and copper and subjected to dryingprior to being placed in the cell. The incident laser beam (488nm from Ar+ laser) was modulated by the chopper and the incidentpower prior to the sample chamber and after exit from the samplechamber was measured and corrected for attenuation by windows.In this way the exact light power absorbed by the sample couldbe inferred. Because the percent transmittance was never lessthan 75%, small fluctuations in the laser power could introducesome error. Therefore, the transmitted power as a function oftime was measured, together with the PAS signal strength. Theresulting plot showed a fairly linear decrease with time, theslope of the plot giving the response of the cell in mV/Wattabsorbed. The signal decreased with time because the N02 leakedgradually into the region occupied by the microphone preamp(contained hermetically inside the PAS cell) and b~cause the N02was absorbed by O-rings and reacted with the aluminum of the PAScell.This cell was then used to calibrate the response of anexane soot prepared by combustion of hexane in an open flame3 .
3 M.S. Akhter, A.R. Chugtai, and D.M. Smith, AppliedSpectroscopy, 39, 143 (1985).
9
It was estimated that 80% of the light which impinged on the sootwas absorbed, since transmitted light was negligible but somereflec+.on did occur from the hexane soot.
A photodeflection cell was also built. It wasidentical to the resonant cell described above except that thebore was filled with a precision glass capillary of innerdiameter 3 mm. Instead of the microphone at the rear of thechamber a Melles Griot nitrocellulose pellicle (7 micronsthickness) was sealed with a 20 micron by 3 mm air gap to allowstatic pressure equalization. About 100 microns away from thispellicle was placed an uncoated quartz plate. An incident 1 mmdiameter HeNe laser was focussed through a 1 inch diameter f/llens onto the interface between the quartz plate and thepellicle, so configuring a low finesse etalon arrangement. Thereflected fringes were observed at a distance of 18 inches fromthe etalon. At this distance the fringes were about 1.0 mm apartand were observed through a 0.3 mm aperture by a United DetectorTechnology UDT451 photodiode operating in photovoltaic mode witha high frequency cutoff about 25 kHz. The output from thisphotodiode was then analyzed as described above. This output wasamplitude modulated by deflection of the membrane and wastherefore susceptible to laser drift, macroscopic motion of theoptics, etc. A better measure of the membrane motion may beobtained by using phase modulation in which a Zeeman Split twofrequency laser (such as the Optra Optralite) responds to thepellicle motion independently of laser drift or macroscopicoptics motion. The theoretically obtainable performance fromsuch a system is included in Table I under the title "PhaseDetection".
3. RESULTS AND DISCUSSION
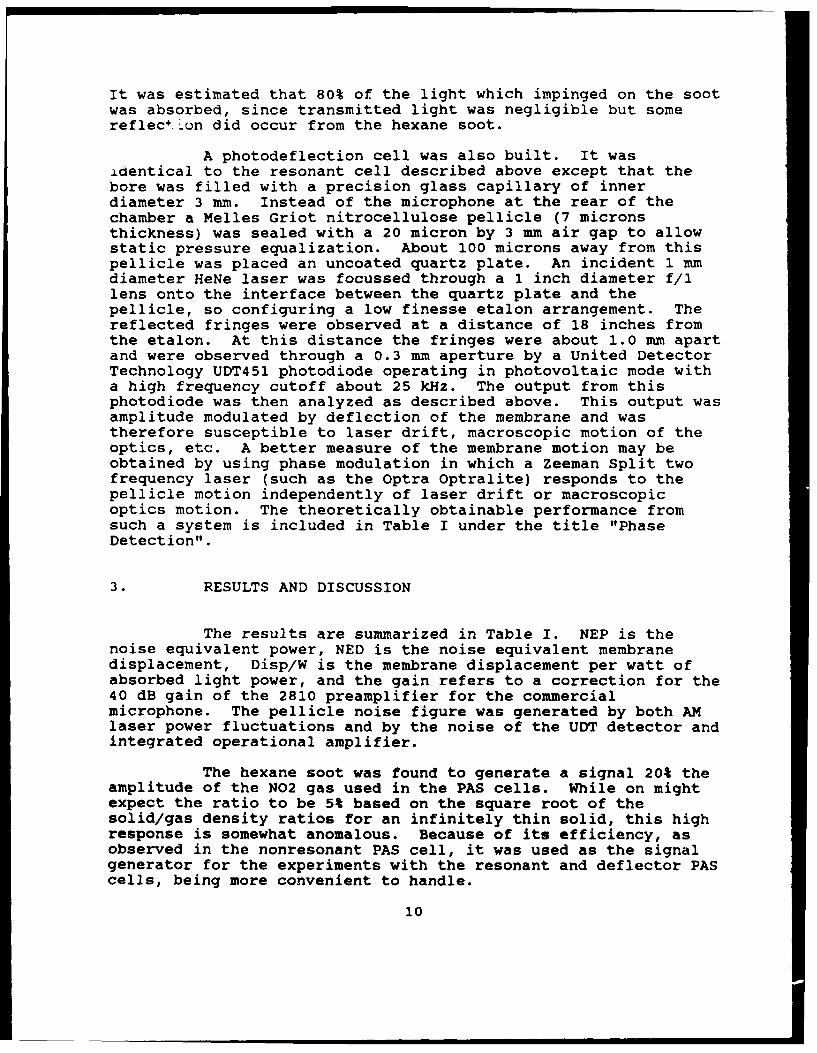
The results are summarized in Table I. NEP is thenoise equivalent power, NED is the noise equivalent membranedisplacement, Disp/W is the membrane displacement per watt ofabsorbed light power, and the gain refers to a correction for the40 dB gain of the 2810 preamplifier for the commercialmicrophone. The pellicle noise figure was generated by both AMlaser power fluctuations and by the noise of the UDT detector andintegrated operational amplifier.
The hexane soot was found to generate a signal 20% theamplitude of the N02 gas used in the PAS cells. While on mightexpect the ratio to be 5% based on the square root of thesolid/gas density ratios for an infinitely thin solid, this highresponse is somewhat anomalous. Because of its efficiency, asobserved in the nonresonant PAS cell, it was used as the signalgenerator for the experiments with the resonant and deflector PAScells, being more convenient to handle.
10
TABLE I
Relative Performance of Various PAS Detectors
Microphone:(@ 322 Hz)
Noise = 15 microvolts/HzI/2
R = 1000 V/WNEP = 1.5 x 10- 8 Watts/Hz
/ 2
NED = 0.003 nanometers/Hz1/ 2
Disp/W = 10 micrometers/40 Volts * R*0.01 (Gain)- 2 micrometers/Watt
Pellicle:(@ 322 Hz)
Noise = 38 microv Its/Hz1 /2
R 100 V/WNEP(am) 3.8 x V-7 Watts/Hzl/2Disp/W = 8 nanometers/39 microWatts
= 200 micrometers/Watt
Phase Detection
Noise = 0.002 wavesin 10 kHz = 1.2 micrometers/Hzl/2
NEP(pm) = 6 x 10- 8 Watts/Hz1 / 2 *
• Theoretical value only.
By analysis of the results in Table I, it can be seenthat the PAS nonresonant cell is 2000 times less sensitive thanan MCT detector at 320 Hz. The resonant cell was observed to be3000 times less sensitive than an MCT detector at 5.2 kHz. Anoptically sensed pellicle arrangement is a factor of 10 lesssensitive than a conventional acoustic cell because of thelimitations of optical sensing methods.
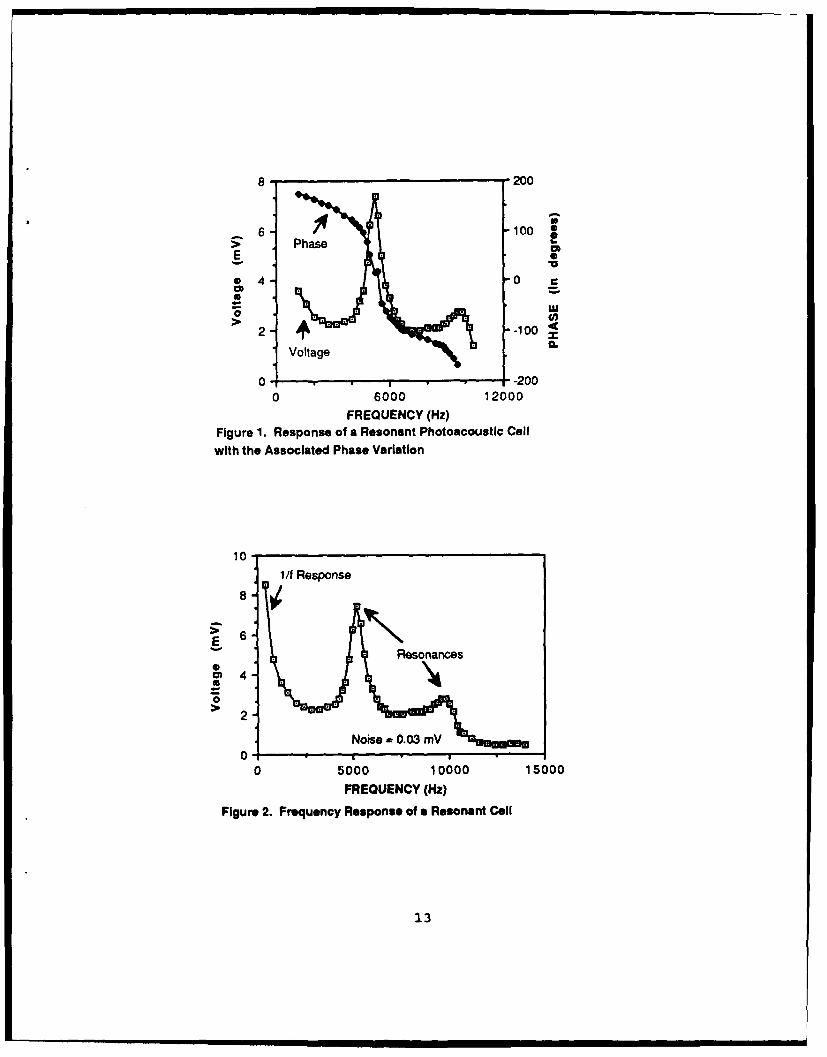
By using an AOM system as described above, the responseof the resonant cell was studied as a function of frequency. Theresults are shown in Figures 1 and 2. Two resonances areobserved, one at 5.2 kHz and a second smaller resonance at 10kHz. The response shows the characteristic 1/f dependence onlyat low frequencies. Above 1.5 kHz, the response of the cell isreasonably flat with frequency except for the resonances.
11
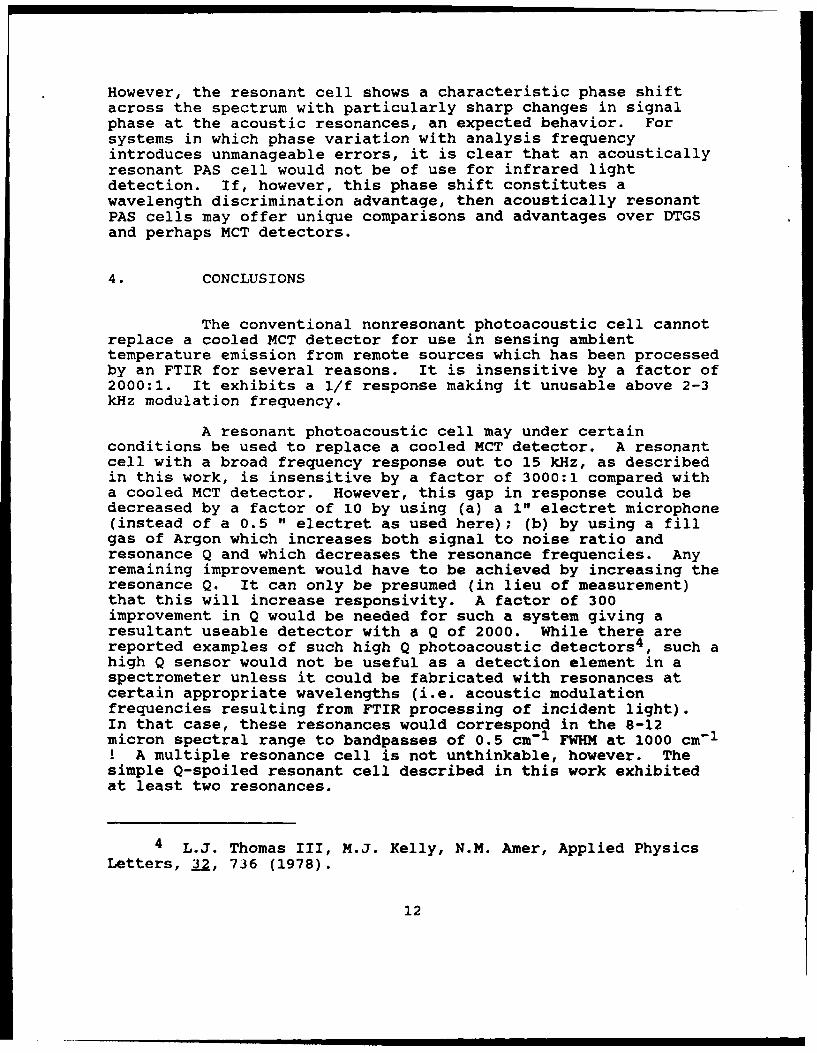
However, the resonant cell shows a characteristic phase shiftacross the spectrum with particularly sharp changes in signalphase at the acoustic resonances, an expected behavior. Forsystems in which phase variation with analysis frequencyintroduces unmanageable errors, it is clear that an acousticallyresonant PAS cell would not be of use for infrared lightdetection. If, however, this phase shift constitutes awavelength discrimination advantage, then acoustically resonantPAS cells may offer unique comparisons and advantages over DTGSand perhaps MCT detectors.
4. CONCLUSIONS
The conventional nonresonant photoacoustic cell cannotreplace a cooled MCT detector for use in sensing ambienttemperature emission from remote sources which has been processedby an FTIR for several reasons. It is insensitive by a factor of2000:1. It exhibits a 1/f response making it unusable above 2-3kHz modulation frequency.
A resonant photoacoustic cell may under certainconditions be used to replace a cooled MCT detector. A resonantcell with a broad frequency response out to 15 kHz, as describedin this work, is insensitive by a factor of 3000:1 compared witha cooled MCT detector. However, this gap in response could bedecreased by a factor of 10 by using (a) a 1" electret microphone(instead of a 0.5 " electret as used here); (b) by using a fillgas of Argon which increases both signal to noise ratio andresonance Q and which decreases the resonance frequencies. Anyremaining improvement would have to be achieved by increasing theresonance Q. It can only be presumed (in lieu of measurement)that this will increase responsivity. A factor of 300improvement in Q would be needed for such a system giving aresultant useable detector with a Q of 2000. While there arereported examples of such high Q photoacoustic detectors4 , such ahigh Q sensor would not be useful as a detection element in aspectrometer unless it could be fabricated with resonances atcertain appropriate wavelengths (i.e. acoustic modulationfrequencies resulting from FTIR processing of incident light).In that case, these resonances would correspond in the 8-12micron spectral range to bandpasses of 0.5 cm-1 FWHM at 1000 cm-1! A multiple resonance cell is not unthinkable, however. Thesimple Q-spoiled resonant cell described in this work exhibitedat least two resonances.
4 L.J. Thomas III, M.J. Kelly, N.M. Amer, Applied PhysicsLetters, 32, 736 (1978).
12
8 200
6 -100>Phase
E0
@4 -0
UU
2 W
Voltage
0- 1 --2000 6000 12000
FREQUENCY (Hz)Figure 1. Response of a Resonant Photoacoustic Cellwith the Associated Phase Variation
10-1/f Response
Resonances
o~4
0
0 5000 10000 15000FREQUENCY (Hz)
Figure 2. Frequency Response of a Resonant Coill
13
An optical deflection system using a nitrocellulosemembrane in place of a microphone membrane can be used as aphotoacoustic sensor. However, even when the membrane is only0.5 microns thick and phase modulation laser methods are used tosense the motion of the membrane, under optimum circumstances theperformance of such a detector is not better than can be obtainedfrom a conventional electret microphone in a conventional PAScell. The limitation arises from the mechanism for detecting themotion of the diaphragm. Capacitive techniques require a closeworking distance between the two plates of the capacitor for bestsensitivity. However, that proximity introduces viscous dampinginto the membrane oscillation with attendant Brownian motionlimited noise performance. This is observed for a nickel film onan electret microphone. If the motion of the diaphragm is sensedby phase modulation techniques, accurate electronic clocks mustbe used to measure the motion. This restricts the resolution ofthe motion as observed by interference between two frequencyshifted components of a probe laser to 0.002 laser wavelengthswith an update rate (bandpass) of 10 kHz. Since the motion ofthe pellicle diaphragm (7 microns thick) observed in this work isabout 200 microns per absorbed Watt, the noise equivalent powerfor such a system is higher than that observed using a microphonein a regular PAS cell. The displacement per Watt of anitrocellulose pellicle is 200 times greater than that observedfor a nickel film on a microphone in part because of the absenceof viscous damping which sets the noise floor for high qualitycommercial microphones. However, this gain in responsivity forthe pellicle system cannot be measured by current phasemodulation optical techniques.
This work shows that the replacement of cooled MCTdetectors by PAS detectors is not unthinkable. However,microphones with much greater responsive surface area (withoutattendant and defeating increases in PAS cell volume) must bedesigned and membrane deflection measurement must be made by moresophisticated or novel optical and/or electronic techniques.
14


![FOURIER -TRANSFORM INFRARED SPECTROMETER [FTIR]](https://img.pdfslide.net/doc/110x75/587539961a28abe7728b6867/fourier-transform-infrared-spectrometer-ftir.jpg)