Embed Size (px)
Citation preview
CHEMICAL ENGINEERING TRANSACTIONS
VOL. 57, 2017
A publication of
The Italian Association
of Chemical Engineering Online at www.aidic.it/cet
Guest Editors: Sauro Pierucci, Jiří Jaromír Klemeš, Laura Piazza, Serafim Bakalis Copyright © 2017, AIDIC Servizi S.r.l.
ISBN 978-88-95608- 48-8; ISSN 2283-9216
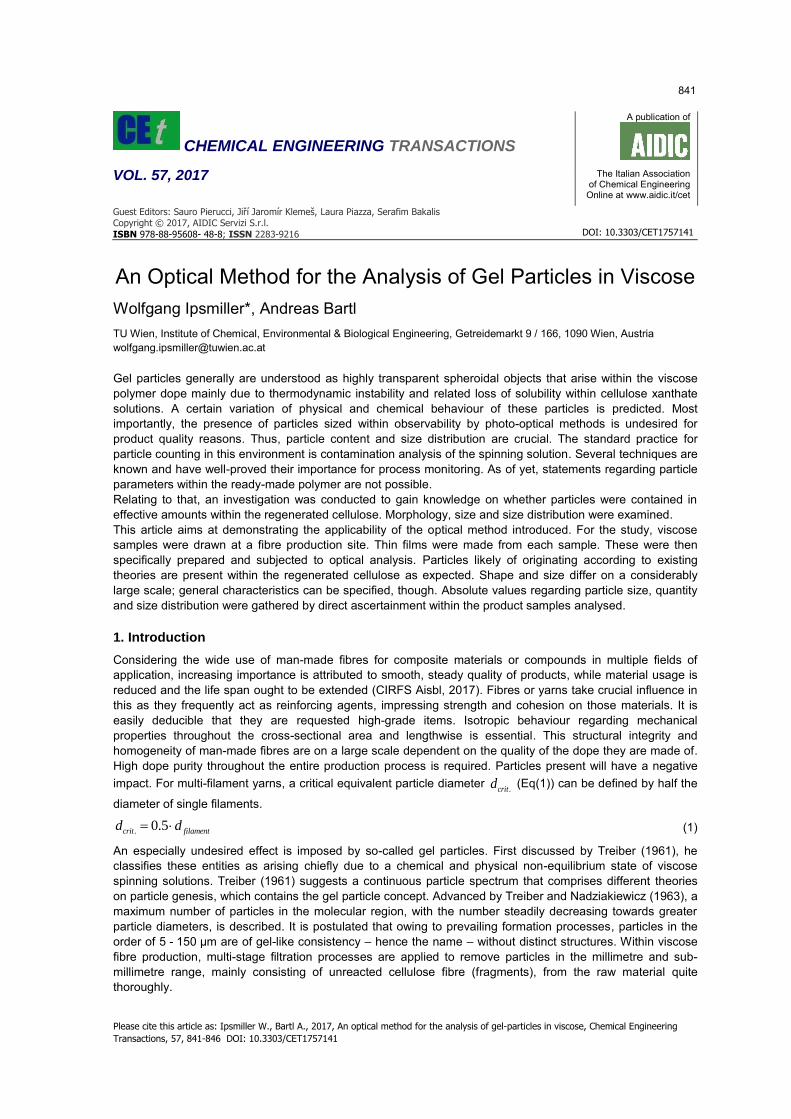
An Optical Method for the Analysis of Gel Particles in Viscose Wolfgang Ipsmiller*, Andreas Bartl TU Wien, Institute of Chemical, Environmental & Biological Engineering, Getreidemarkt 9 / 166, 1090 Wien, Austria [email protected]
Gel particles generally are understood as highly transparent spheroidal objects that arise within the viscose polymer dope mainly due to thermodynamic instability and related loss of solubility within cellulose xanthate solutions. A certain variation of physical and chemical behaviour of these particles is predicted. Most importantly, the presence of particles sized within observability by photo-optical methods is undesired for product quality reasons. Thus, particle content and size distribution are crucial. The standard practice for particle counting in this environment is contamination analysis of the spinning solution. Several techniques are known and have well-proved their importance for process monitoring. As of yet, statements regarding particle parameters within the ready-made polymer are not possible. Relating to that, an investigation was conducted to gain knowledge on whether particles were contained in effective amounts within the regenerated cellulose. Morphology, size and size distribution were examined. This article aims at demonstrating the applicability of the optical method introduced. For the study, viscose samples were drawn at a fibre production site. Thin films were made from each sample. These were then specifically prepared and subjected to optical analysis. Particles likely of originating according to existing theories are present within the regenerated cellulose as expected. Shape and size differ on a considerably large scale; general characteristics can be specified, though. Absolute values regarding particle size, quantity and size distribution were gathered by direct ascertainment within the product samples analysed.
1. Introduction
Considering the wide use of man-made fibres for composite materials or compounds in multiple fields of application, increasing importance is attributed to smooth, steady quality of products, while material usage is reduced and the life span ought to be extended (CIRFS Aisbl, 2017). Fibres or yarns take crucial influence in this as they frequently act as reinforcing agents, impressing strength and cohesion on those materials. It is easily deducible that they are requested high-grade items. Isotropic behaviour regarding mechanical properties throughout the cross-sectional area and lengthwise is essential. This structural integrity and homogeneity of man-made fibres are on a large scale dependent on the quality of the dope they are made of. High dope purity throughout the entire production process is required. Particles present will have a negative impact. For multi-filament yarns, a critical equivalent particle diameter
.critd (Eq(1)) can be defined by half the
diameter of single filaments.
. 0.5crit filamentd d (1)
An especially undesired effect is imposed by so-called gel particles. First discussed by Treiber (1961), he classifies these entities as arising chiefly due to a chemical and physical non-equilibrium state of viscose spinning solutions. Treiber (1961) suggests a continuous particle spectrum that comprises different theories on particle genesis, which contains the gel particle concept. Advanced by Treiber and Nadziakiewicz (1963), a maximum number of particles in the molecular region, with the number steadily decreasing towards greater particle diameters, is described. It is postulated that owing to prevailing formation processes, particles in the order of 5 - 150 µm are of gel-like consistency – hence the name – without distinct structures. Within viscose fibre production, multi-stage filtration processes are applied to remove particles in the millimetre and sub-millimetre range, mainly consisting of unreacted cellulose fibre (fragments), from the raw material quite thoroughly.
DOI: 10.3303/CET1757141
Please cite this article as: Ipsmiller W., Bartl A., 2017, An optical method for the analysis of gel-particles in viscose, Chemical Engineering Transactions, 57, 841-846 DOI: 10.3303/CET1757141
841

Reflecting on number, critical particle diameter and tendency for slippage through filter apparatuses due to their high deformability and rather small particle dimensions, gel particles are considered the major disruptive factor in the production of high tenacity viscose yarns used in tyre manufacture (Müller & Rußler, 2015). It is therefore of vital importance to monitor the gel particle spectrum up to the ready-made product.
2. Image Analysis
2.1 Resolution Power
Fundamental for every image-processing method is the ability for presenting the examined structures in such a way that two given individuals can be recognised discretely by a viewer or image-capturing device (DIN, 1995). With many techniques, a certain magnification can be observed. More importantly, the resolution power must be considered, as Gerlach (1995) emphasises. For a system that enlarges an object as is demanded regarding a specific problem statement, it is inexpedient to further increase the magnification as this limits the viewable screen. On the other hand, an optical system, even at highest magnification, does not increase information density if due to lack of quality of the equipment setting up the optical path, the achievable resolution is insufficient. A lower limit for the resolution power is fixed by the wave character of light (Gerlach, 1995). For classical light microscopy, this boundary will be the Abbe limit,
objective condenser
dNA NA
(2)
with
20 sinDNA n , (3)
where d is the shortest resoluble distance between two spots, the wave length – usually set to 550 nm for the sensitivity of the human eye is highest –,
objectiveNA the numerical aperture of the object lens and
condenserNA the numerical aperture of the condenser lens. NA equals the product of refractive index n
(typically 20
Dn ) of the immersion medium or air, respectively, times the sine of half the acceptance angle of the lens sin( ) . Considering diffraction effects, the Abbe limit is ultimately adapted giving the Rayleigh criterion
0,61objective condenser
aNA NA
, (4)
with a being the shortest resoluble distance after diffraction. For average filament diameters of 10 µm, per Eq(1), a critical particle diameter of 5 µm can be set, requiring the optical system to clearly discriminate objects in distances of this order of magnitude. Minimum numerical apertures for the lens system can therefore be calculated using Eq(4). From Eq(2) and Eq(3), it is evident that refractive indexes are a decisive factor in achieving high resolution, from which can be concluded that the media guiding the light beam should preferably have similar refractive indexes. For the experimental study of viscose film samples, different embedding media were therefore tested.
2.2 Contrast
Picture contrast is equally crucial for good visibility of the structures. An object, considered a grid of fine lines with different translucency, will modulate the transmitted light by interference resulting in the amplitude being altered (Williams, 1999). This corresponds to a change of the object within the captured image. Dependent upon illumination intensity and the lens system, the quality of this contrast transfer function from the object to the image is different. High illumination causes higher overall amplitude difference between structures and background, but also leads to much lower amplitude difference within the structures themselves. This will result in much less image quality, when fine structures (sub-millimetre) are concerned.
2.3 Selection of an appropriate optical system
Three systems using transmitted light are tested. One high-end flat-bed scanner (EPSON Perfection V500 Photo) as well as one microscope in bright field arrangement (Olympus BX61) and a microscope (Leica DMLS) with phase-contrast mechanism are used. For each microscope, three different object lenses are implemented. Image analysis is performed by Olympus imaging software analySIS FIVE. Image capturing for the microscopes is carried out by an Olympus ColorView I digital camera (CCD sensor) mounted onto the lens tubes.
842

Table 1: Resolution values for scanner (calculated) and microscopes (channel calibration)
Optical system EPSON Perfection V500 Photo
Olympus BX61 (bright field)
Leica DMLS (phase contrast)
Resolution at 6400 dpi µm.Pixel-1 3.9 - - Resolution at 2x µm.Pixel-1 - 3.5 - Resolution at 5x µm.Pixel-1 - 1.4 - Resolution at 10x µm.Pixel-1 - 0.7 0.35 Resolution at 40x µm.Pixel-1 - - 0.09 Resolution at 100x µm.Pixel-1 - - 0.04
Theoretical resolution power for each system is determined. For a critical particle diameter of 5 µm, all systems, theoretically, appear sufficient (Table 1). Following the considerations in 2.1 and 2.2, with the actual resolution power being assumingly lower, resolution is tested using a stage micrometre (Figure 1). Results suggest light overexposure for the scanner, also smaller divisions are not resolved. Owing to the image acquisition principle (no linear scanning and therefore no incrementation), the microscope image quality is higher at alike resolution values, still, fine graduation lines are not displayed appropriately. Slightly higher resolution values for the object lenses are needed. Phase contrast, by theory, is used for selective contrast enhancement of objects with different refractive indexes that alter the wave length of light passing through; particularly fine, highly transparent structures are convenient (Gerlach, 1995). If the anticipated particles also have slightly different crystallinity values and thus different refractive indexes compared to the embedding viscose matrix, this contrast method seems favourable. The contrast information added here is but spoilt by light aberrations that occur at the particle boundaries or impurities. This would apply even more for three-dimensional objects. Phase contrast mode must therefore be considered inadequate for viscose-film examination by the current state of scientific knowledge. In the end, for both microscopy techniques, the related loss of displayable screen does not legitimate the rather minor additional information sustained by shifting to even higher object-lens magnifications, when the fetched resolution power is just enough.
Figure 1: Left to right: Display of a stage micrometre by scanner, light microscope and light microscope with
phase contrast, graduation 10 µm, overall length 1000 µm
3. Experimental study of gel particle content in films from regenerated cellulose
From viscose samples drawn at different locations at the production line, films are prepared by coating glass disks with thin layers (approx. 100 µm) of a given geometry, which are then exposed to an acidic spinning bath solution, where the viscose is regenerated. After washing twice with deionised water, the samples are placed in between two metal plates and dried in a cabinet drier at 120 °C. The dry foils are cut and representative squares with a surface area of approx. 1 cm² are prepared. They are then cleaned thoroughly with isopropanol and embedded between a microscope slide and cover glass using polyethylene glycol as an auxiliary medium in a manner displayed in Figure 2. All glass equipment prior to usage is cleaned with acetone. From the specimen (Figure 2), five details {1} are examined, the gel particles present are parameterised manually by outlining the margins {2}. Equivalent particle diameters are calculated and from the results, size distributions are generated.
843

Figure 2: Experimental set-up for particle counting in the prepared viscose films; left: preparation of the
segments taken out of the films, right: mapping of the projection area of the particles by outlining the margins
For all experiments, the projection area is chosen, but it is also possible to use other parameters for this purpose. Given the fact that any one-dimensional value (e.g. Feret’s diameter) or even combinations do not
provide as good an information on particle shape, and given that perimeter determination is equal in effort, gathering area values most accurately allows for calculation of equivalent particle diameters, within 2-D space. Image adjustment and focal adjustment have been proved of being crucial for good presentation of the entities within the screen. Focus should be guaranteed to be set to the middle of the sample. This can be achieved best by arranging the cover glass with a slight offset (Figure 2), focussing the upper and lower surface at one edge of the film covered by the glass and fixing the z-boundaries (focal boundaries) prior to particle analysis. Concerning the auxiliary medium, the refractive index of PEG 400 is closest to cellulose, compared to water or air, for instance. It is a good means for preventing the sample from floating as well, owing to its high viscosity, which is important for accurate adjustment.
4. Results
In this study, the projection area of highly transparent particles in polymer foils was determined using trans-mitted light in an optical cascade at bright field setting. From samples of different stages drawn at a production line, structures could be defined and mapping could be performed. A scope of particle shapes relating to the concept of gel particles is given in Figure 3b. These particles appear highly transparent, with shapes ranging from single rotund entities with mean diameters above 30 µm, to edged items reaching down to lower limits of observability at approx. 5 – 10 µm (Figure 3b). A choice of non-related particles is depicted in Figure 3a.
Figure 3: a): Impurities encountered with optical image analysis, b): Different shapes of gel particles
The gathered geometric data were used to discretise an equivalent particle diameter in 16 classes with class mean values ranging from approx. 4 – 170 µm. Greater particles were listed in the highest class. Class range was increased with higher particle diameters, for the number of particles was expected to decrease.
844
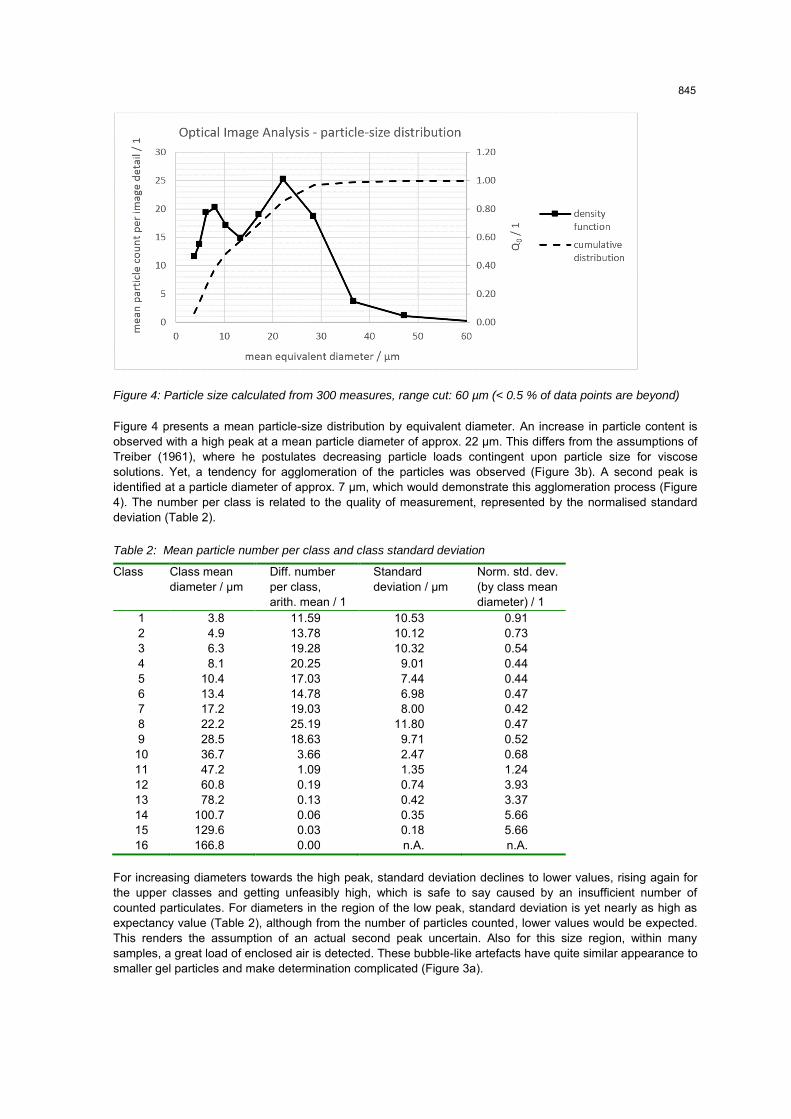
Figure 4: Particle size calculated from 300 measures, range cut: 60 µm (< 0.5 % of data points are beyond)
Figure 4 presents a mean particle-size distribution by equivalent diameter. An increase in particle content is observed with a high peak at a mean particle diameter of approx. 22 µm. This differs from the assumptions of Treiber (1961), where he postulates decreasing particle loads contingent upon particle size for viscose solutions. Yet, a tendency for agglomeration of the particles was observed (Figure 3b). A second peak is identified at a particle diameter of approx. 7 µm, which would demonstrate this agglomeration process (Figure 4). The number per class is related to the quality of measurement, represented by the normalised standard deviation (Table 2).
Table 2: Mean particle number per class and class standard deviation
Class Class mean diameter / µm
Diff. number per class, arith. mean / 1
Standard deviation / µm
Norm. std. dev. (by class mean diameter) / 1
1 3.8 11.59 10.53 0.91 2 4.9 13.78 10.12 0.73 3 6.3 19.28 10.32 0.54 4 8.1 20.25 9.01 0.44 5 10.4 17.03 7.44 0.44 6 13.4 14.78 6.98 0.47 7 17.2 19.03 8.00 0.42 8 22.2 25.19 11.80 0.47 9 28.5 18.63 9.71 0.52 10 36.7 3.66 2.47 0.68 11 47.2 1.09 1.35 1.24 12 60.8 0.19 0.74 3.93 13 78.2 0.13 0.42 3.37 14 100.7 0.06 0.35 5.66 15 129.6 0.03 0.18 5.66 16 166.8 0.00 n.A. n.A.
For increasing diameters towards the high peak, standard deviation declines to lower values, rising again for the upper classes and getting unfeasibly high, which is safe to say caused by an insufficient number of counted particulates. For diameters in the region of the low peak, standard deviation is yet nearly as high as expectancy value (Table 2), although from the number of particles counted, lower values would be expected. This renders the assumption of an actual second peak uncertain. Also for this size region, within many samples, a great load of enclosed air is detected. These bubble-like artefacts have quite similar appearance to smaller gel particles and make determination complicated (Figure 3a).
845

5. Conclusion
Deciding for an optical system to monitor gel particles in regenerated cellulose, a sound compromise balancing observable screen and image quality could be specified. In this case, this is a bright field microscope with a dry objective by a lens magnification of 10 and a numerical aperture of 0.30. Systems without light intensity and focus adjustment cannot be used. Additionally, the dynamic range of the optical cascade must be adequate to cope with the full contrast scope of the particle structures. For a clear differentiation against background, this is crucial. Software-based contrasting does not yield more information, it merely carves out desirable effects for a more pronounced distinction and should be used under reservation only. However, other promising – optical – contrasting methods, e.g. differential interference contrast more suited to 3-D conditions, should be examined. Complying with a rigid cleaning procedure for both the used equipment for specimen handling and the viscose films prepared for the image analysis, a clear differentiation from gel particles against impurities or other contamination within the film can be provided. Sample preparation and presentation are vital for a favourable outcome, the usage of an auxiliary medium is mandatory, too. Particle size follows a bell-shaped curve, yet with a high uncertainty (second peak) below 8 µm. Air inclusions generated during the film-making procedure is most likely impeding proper particle counting, as it superposes particles within this scope of diameter. Owing to the intention to monitor gel particle content throughout the entire production process, a strategy of drawing samples at different process stages and points in time was followed. Surprisingly, a wide variation in the observed overall particle number could be ascertained. While beneficial to the discretisation of particle structures and development of the optical system, this fact has proved itself of being unfortunate regarding the modelling of a statistically secured particle-size distribution. Future studies on gel particle size should therefore include a higher number of expectedly equal samples, i.e. a series of samples followed successively and films made from these, which then should be assessed by the method introduced. An elimination of entrapped air within the regenerated cellulose should be aspired. Furthermore, it should be investigated whether and how the particle spectrum changed over the course of the production and regeneration process. Consequently, a correlation of particle-size distributions obtained by optical image analysis as well as contamination analysis of the viscose spinning solution should be surveyed. Ultimately, automatic counting algorithms could well be of avail with the large volume of samples that seem necessary and even more for on-line process monitoring. Although numerous image-processing software are including just as many detection algorithms, each dealing with specific structural characteristics, we still encounter serious difficulties regarding the precise discrimination of relevant information from noise. A possible step forward could be using an image-based, artificial neural network approach, as Zhang (2013) proposed for the mapping of crystal particulates. Transparent and with a traced agglomeration tendency, these crystallites seem somewhat related to gel particles as we spotted them. Thus, the self-learning capabilities of such a net-work regarding particle-structure detection could turn out to be quite advantageous.
Acknowledgments
The authors want to thank Glanzstoff Industries GmbH for their financial support.
References
CIRFS Aisbl (European Man-made Fibres Association), 2017, About Man-made Fibres, <www.cirfs.org> accessed 17.03.2017.
DIN, 1995, DIN 1319-1:1995-01, Fundamentals of metrology – Part 1: Basic terminology, DIN e. V. (Deutsches Institut für Normung), Berlin (in German).
Gerlach, D., 1995, Lichtmikroskopie, in H. Robenek, Mikroskopie in Forschung und Praxis, GIT Verlag GmbH, Darmstadt, 13-85 (in German).
Müller B., Rußler A., 2015, project meeting: gel particles, Interview with W. Ipsmiller on 13.03.2015, St. Pölten. Treiber E., 1961, The state of solution of technical viscose, J. Polym. Sci. 51(155), 297-315, DOI:
10.1002/pol.1961.1205115518. Treiber E., Nadziakiewicz H.C., 1963, State of solution of viscose. Gel particle counting and optical rotary
dispersion studies on viscose, J. Polym. Sci., C Polym. Symp. 2(1), 357-376, DOI: 10.1002/polc.5070020135.
Williams T.L., 1999, The Optical Transfer Function of Imaging Systems, IOP Publishing Ltd, Bristol, 1-53. Zhang B., Willis R., Romagnoli J., Fois C.A.M., Tronci S., Baratti R., 2013, Image-based multi-resolution-ann
approach for on-line particle size characterization, Chemical Engineering Transactions, 32, 2203-2208, DOI: 10.3303/CET1332368
846