Embed Size (px)
Citation preview
Chemical Equilibrium
Now we arrive at the point where real chemistry begins. Chemical thermo-dynamics is used to predict whether a mixture of reactants has a sponta-neous tendency to change into products, to predict the composition of the
reaction mixture at equilibrium, and to predict how that composition will be mod-ified by changing the conditions. In biology, life is the avoidance of equilibrium,and the attainment of equilibrium is death, but knowing whether equilibrium liesin favor of reactants or products under certain conditions is a good indication ofthe feasibility of a biochemical reaction. Indeed, the material we cover in this chap-ter is of crucial importance for understanding the mechanisms of oxygen transportin blood, metabolism, and all the processes going on inside organisms.
There is one word of warning that is essential to remember: thermodynamics issilent about the rates of reaction. All it can do is to identify whether a particular re-action mixture has a tendency to form products; it cannot say whether that ten-dency will ever be realized. We explore what determines the rates of chemical re-actions in Chapters 6 through 8.
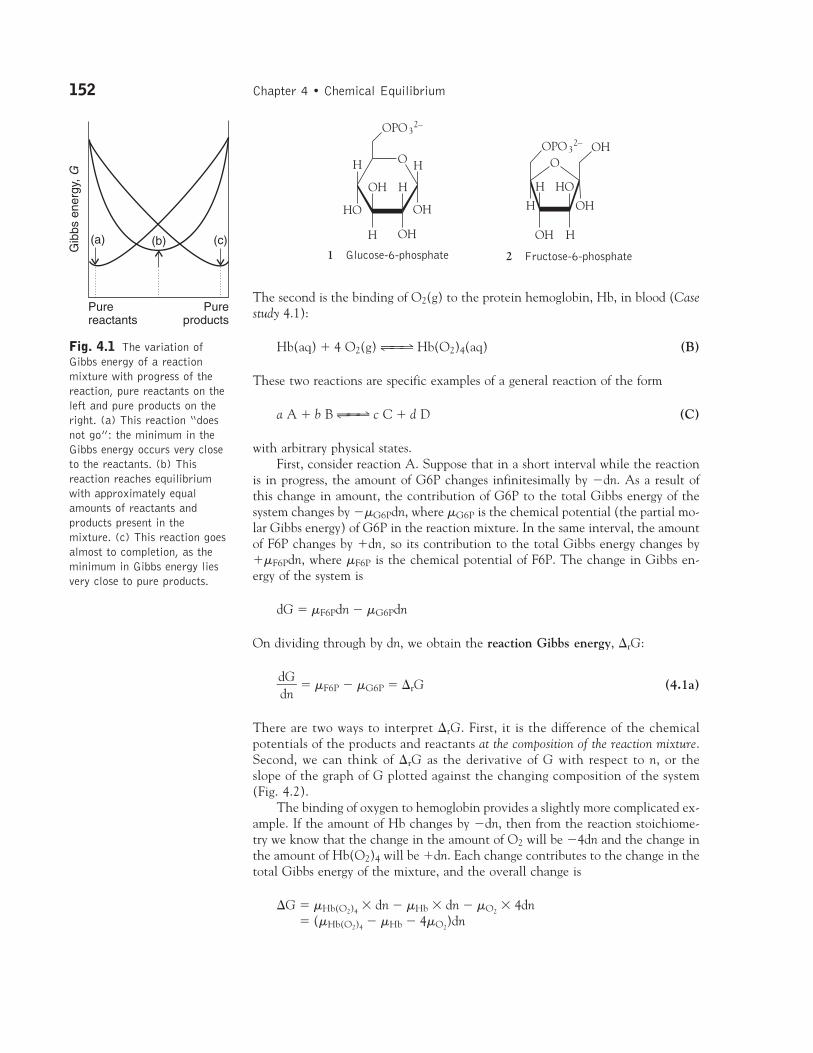
Thermodynamic backgroundThe thermodynamic criterion for spontaneous change at constant temperature andpressure is �G � 0. The principal idea behind this chapter, therefore, is that, atconstant temperature and pressure, a reaction mixture tends to adjust its composition un-til its Gibbs energy is a minimum. If the Gibbs energy of a mixture varies as shownin Fig. 4.1a, very little of the reactants convert into products before G has reachedits minimum value, and the reaction “does not go.” If G varies as shown in Fig. 4.1c, then a high proportion of products must form before G reaches its min-imum and the reaction “goes.” In many cases, the equilibrium mixture contains al-most no reactants or almost no products. Many reactions have a Gibbs energy thatvaries as shown in Fig. 4.1b, and at equilibrium the reaction mixture contains sub-stantial amounts of both reactants and products.
4.1 The reaction Gibbs energy
To explore metabolic processes, we need a measure of the driving power of achemical reaction, and to understand the chemical composition of cells, we needto know what those compositions would be if the reactions taking place in themhad reached equilibrium.
To keep our ideas in focus, we consider two important processes. One is the iso-merism of glucose-6-phosphate (1, G6P) to fructose-6-phosphate (2, F6P), whichis an early step in the anaerobic breakdown of glucose (Section 4.8):
G6P(aq) ˆ̂ 90̂ ˆ F6P(aq) (A)
151
CHAPTER
4Thermodynamic background
4.1 The reaction Gibbs energy
4.2 The variation of �rG withcomposition
4.3 Reactions at equilibrium
CASE STUDY 4.1: Binding ofoxygen to myoglobin andhemoglobin
4.4 The standard reactionGibbs energy
The response of equilibria tothe conditions
4.5 The presence of a catalyst
4.6 The effect of temperature
Coupled reactions inbioenergetics
4.7 The function of adenosinetriphosphate
CASE STUDY 4.2: Thebiosynthesis of proteins
4.8 The oxidation of glucose
Proton transfer equilibria
4.9 Brønsted-Lowry theory
4.10 Protonation anddeprotonation
4.11 Polyprotic acids
CASE STUDY 4.3: Thefractional composition of asolution of lysine
4.12 Amphiprotic systems
4.13 Buffer solutions
CASE STUDY 4.4: Buffer actionin blood
Exercises
The second is the binding of O2(g) to the protein hemoglobin, Hb, in blood (Casestudy 4.1):
Hb(aq) � 4 O2(g) ˆ̂ 90̂ ˆ Hb(O2)4(aq) (B)
These two reactions are specific examples of a general reaction of the form
a A � b B ˆ̂ 90̂ ˆ c C � d D (C)
with arbitrary physical states.First, consider reaction A. Suppose that in a short interval while the reaction
is in progress, the amount of G6P changes infinitesimally by �dn. As a result ofthis change in amount, the contribution of G6P to the total Gibbs energy of thesystem changes by ��G6Pdn, where �G6P is the chemical potential (the partial mo-lar Gibbs energy) of G6P in the reaction mixture. In the same interval, the amountof F6P changes by �dn, so its contribution to the total Gibbs energy changes by��F6Pdn, where �F6P is the chemical potential of F6P. The change in Gibbs en-ergy of the system is
dG � �F6Pdn � �G6Pdn
On dividing through by dn, we obtain the reaction Gibbs energy, �rG:
�ddGn� � �F6P � �G6P � �rG (4.1a)
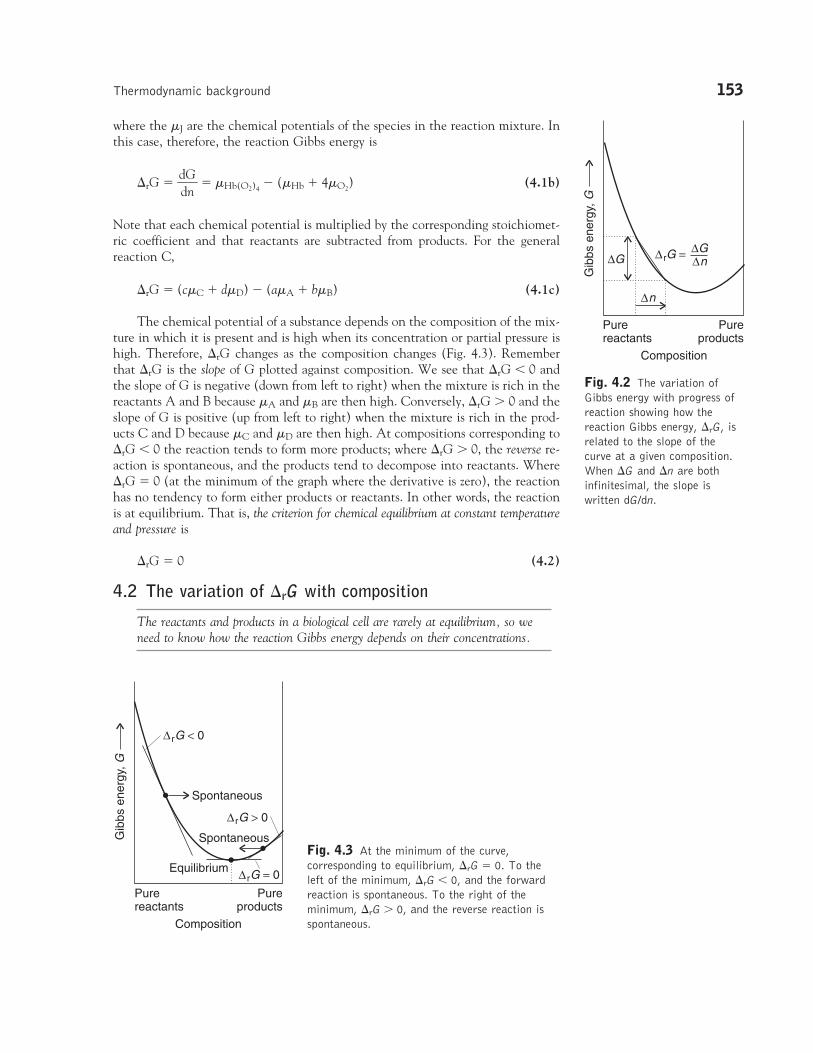
There are two ways to interpret �rG. First, it is the difference of the chemicalpotentials of the products and reactants at the composition of the reaction mixture.Second, we can think of �rG as the derivative of G with respect to n, or theslope of the graph of G plotted against the changing composition of the system(Fig. 4.2).
The binding of oxygen to hemoglobin provides a slightly more complicated ex-ample. If the amount of Hb changes by �dn, then from the reaction stoichiome-try we know that the change in the amount of O2 will be �4dn and the change inthe amount of Hb(O2)4 will be �dn. Each change contributes to the change in thetotal Gibbs energy of the mixture, and the overall change is
�G � �Hb(O2)4� dn � �Hb � dn � �O2
� 4dn� (�Hb(O2)4
� �Hb � 4�O2)dn
152 Chapter 4 • Chemical EquilibriumG
ibbs
ene
rgy,
G
(a) (c)(b)
Purereactants
Pureproducts
Fig. 4.1 The variation ofGibbs energy of a reactionmixture with progress of thereaction, pure reactants on theleft and pure products on theright. (a) This reaction “doesnot go”: the minimum in theGibbs energy occurs very closeto the reactants. (b) Thisreaction reaches equilibriumwith approximately equalamounts of reactants andproducts present in themixture. (c) This reaction goesalmost to completion, as theminimum in Gibbs energy liesvery close to pure products.
O
OPO 32–
H
OH
H
HO
OH
H
H
OH
O
HO
H
H
OH
OHH
OPO 32– OH
1 Glucose-6-phosphate 2 Fructose-6-phosphate
Gib
bs e
nerg
y, G
Purereactants
Pureproducts
∆G∆G∆n
∆rG =
∆n
Composition
Fig. 4.2 The variation ofGibbs energy with progress ofreaction showing how thereaction Gibbs energy, �rG, isrelated to the slope of thecurve at a given composition.When �G and �n are bothinfinitesimal, the slope iswritten dG/dn.
where the �J are the chemical potentials of the species in the reaction mixture. Inthis case, therefore, the reaction Gibbs energy is
�rG � �ddGn� � �Hb(O2)4
� (�Hb � 4�O2) (4.1b)
Note that each chemical potential is multiplied by the corresponding stoichiomet-ric coefficient and that reactants are subtracted from products. For the general reaction C,
�rG � (c�C � d�D) � (a�A � b�B) (4.1c)
The chemical potential of a substance depends on the composition of the mix-ture in which it is present and is high when its concentration or partial pressure ishigh. Therefore, �rG changes as the composition changes (Fig. 4.3). Rememberthat �rG is the slope of G plotted against composition. We see that �rG � 0 andthe slope of G is negative (down from left to right) when the mixture is rich in thereactants A and B because �A and �B are then high. Conversely, �rG 0 and theslope of G is positive (up from left to right) when the mixture is rich in the prod-ucts C and D because �C and �D are then high. At compositions corresponding to�rG � 0 the reaction tends to form more products; where �rG 0, the reverse re-action is spontaneous, and the products tend to decompose into reactants. Where�rG � 0 (at the minimum of the graph where the derivative is zero), the reactionhas no tendency to form either products or reactants. In other words, the reactionis at equilibrium. That is, the criterion for chemical equilibrium at constant temperatureand pressure is
�rG � 0 (4.2)
4.2 The variation of �rG with composition
The reactants and products in a biological cell are rarely at equilibrium, so weneed to know how the reaction Gibbs energy depends on their concentrations.
Thermodynamic background 153
Gib
bs e
nerg
y, G
Purereactants
Pureproducts
Composition
Spontaneous
Equilibrium
Spontaneous
∆rG < 0
∆rG = 0
∆rG > 0
Fig. 4.3 At the minimum of the curve,corresponding to equilibrium, �rG � 0. To theleft of the minimum, �rG � 0, and the forwardreaction is spontaneous. To the right of theminimum, �rG 0, and the reverse reaction isspontaneous.
Our starting point is the general expression for the composition dependence of thechemical potential derived in Section 3.11:
�J � �J� � RT ln aJ (4.3)
where aJ is the activity of the species J. When we are dealing with systems that maybe treated as ideal, which will be the case in this chapter, we use the identifica-tions given in Table 3.3:
For solutes in an ideal solution, aJ � [ J]/c�, the molar concentration of Jrelative to the standard value c� � 1 mol L�1.
For perfect gases, aJ � pJ/p�, the partial pressure of J relative to the standardpressure p� � 1 bar.
For pure solids and liquids, aJ � 1.
As in Chapter 3, to simplify the appearance of expressions in what follows, we shallnot write c� and p� explicitly.
Substitution of eqn 4.3 into eqn 4.1c gives
�rG � {c(�C� � RT ln aC) � d(�D
� � RT ln aD)}� {a(�A
� � RT ln aA) � b(�B� � RT ln aB)}
�rG � {(c�C� � d�D
�) � (a�A� � b�B
�)}� RT{c ln aC � d ln aD � a ln aA � b ln aB}
The first term on the right in the second equality is the standard reaction Gibbsenergy, �rG�:
�rG� � {c�C� � d�D
�} � {a�A� � b�B
�} (4.4a)
Because the standard states refer to the pure materials, the standard chemical po-tentials in this expression are the standard molar Gibbs energies of the (pure)species. Therefore, eqn 4.4a is the same as
�rG� � {cGm�(C) � dGm
�(D)} � {aGm�(A) � bGm
�(B)} (4.4b)
We consider this important quantity in more detail shortly. At this stage, there-fore, we know that
�rG � �rG� � RT{c ln aC � d ln aD � a ln aA � b ln aB}
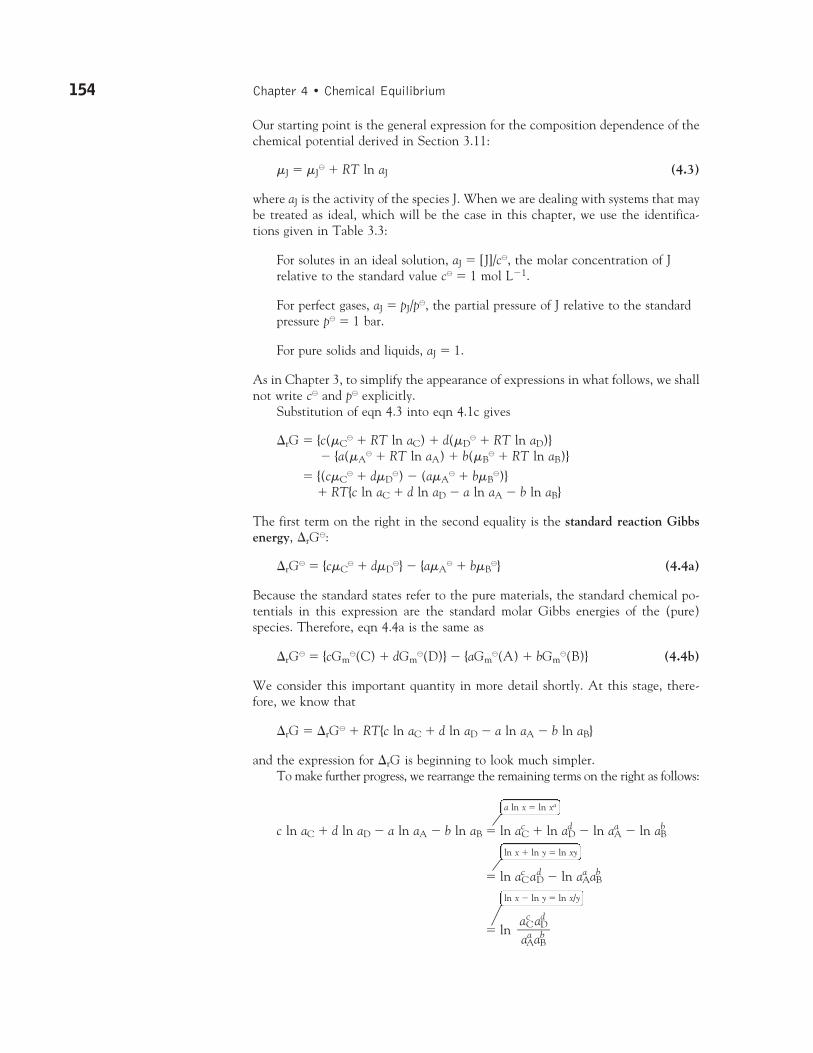
and the expression for �rG is beginning to look much simpler.To make further progress, we rearrange the remaining terms on the right as follows:
a ln x � ln xa
c ln aC � d ln aD � a ln aA � b ln aB � ln acC � ln ad
D � ln aaA � ln ab
B
ln x � ln y � ln xy
� ln acCad
D � ln aaAab
B
ln x � ln y � ln x/y
� ln ac
CadD
�aa
AabB
154 Chapter 4 • Chemical Equilibrium
Thermodynamic background 155
At this point, we have deduced that
�rG � �rG� � RT ln
To simplify the appearance of this expression still further, we introduce the (di-mensionless) reaction quotient, Q, for reaction C:
Q � (4.5)
Note that Q has the form of products divided by reactants, with the activity of eachspecies raised to a power equal to its stoichiometric coefficient in the reaction. Wecan now write the overall expression for the reaction Gibbs energy at any compo-sition of the reaction mixture as
�rG � �rG� � RT ln Q (4.6)
This simple but hugely important equation will occur several times in different disguises.
EXAMPLE 4.1 Formulating a reaction quotientFormulate the reaction quotients for reactions A (the isomerism of glucose-6-phosphate) and B (the binding of oxygen to hemoglobin).
Strategy Use Table 3.3 to express activities in terms of molar concentrations orpressures. Then use eqn 4.5 to write an expression for the reaction quotient Q.In reactions involving gases and solutes, the expression for Q will contain pres-sures and molar concentrations.
Solution The reaction quotient for reaction A is
Q � �aa
G
F6
6
P
P� �
However, we are not writing the standard concentration explicitly, so this ex-pression simplifies to
Q � �[[GF6
6PP]]
�
with [ J] the numerical value of the molar concentration of J in moles per liter (soif [F6P] � 2.0 mmol L�1, corresponding to 2.0 � 10�3 mol L�1, we just write[F6P] � 2.0 � 10�3 when using this expression). For reaction B, the binding ofoxygen to hemoglobin, the reaction quotient is
Q �
Similarly, because we are not writing the standard concentration and pressure ex-plicitly, this expression simplifies to
Q �[Hb(O2)4]��
[Hb]p4O2
[Hb(O2)4]/c�
��([Hb]/c�)(pO2
/p�)4
[F6P]/c�
�[G6P]/c�
acCad
D�aa
AabB
acCad
D�aa
AabB
156 Chapter 4 • Chemical Equilibrium
with pJ the numerical value of the partial pressure of J in bar (so if pO2� 2.0 bar,
we just write pO2� 2.0 when using this expression).
SELF-TEST 4.1 Write the reaction quotient for the esterification reactionCH3COOH � C2H5OH 9̂0̂ CH3COOC2H5 � H2O. (All four components arepresent in the reaction mixture as liquids: the mixture is not an aqueous solution.)
Answer: Q � [CH3COOC2H5][H2O]/[CH3COOH][C2H5OH] �
4.3 Reactions at equilibrium
We need to be able to identify the equilibrium composition of a reaction so thatwe can discuss deviations from equilibrium systematically.
At equilibrium, the reaction quotient has a certain value called the equilibriumconstant, K, of the reaction:
K � � �equilibrium(4.7)
We shall not normally write equilibrium; the context will always make it clear thatQ refers to an arbitrary stage of the reaction, whereas K, the value of Q at equilib-rium, is calculated from the equilibrium composition. It now follows from eqn 4.6that at equilibrium
0 � �rG� � RT ln K
and therefore that
�rG� � �RT ln K (4.8)
This is one of the most important equations in the whole of chemical thermodynam-ics. Its principal use is to predict the value of the equilibrium constant of any reactionfrom tables of thermodynamic data, like those in the Data section. Alternatively, wecan use it to determine �rG� by measuring the equilibrium constant of a reaction.
ILLUSTRATION 4.1 Calculating the equilibrium constant of a biochemical reaction
The first step in the metabolic breakdown of glucose is its phosphorylation to G6P:
glucose(aq) � Pi(aq) ˆ̂ l G6P(aq)
where Pi denotes an inorganic phosphate group, such as H2PO4�. The standard
reaction Gibbs energy for the reaction is �14.0 kJ mol�1 at 37°C, so it followsfrom eqn 4.8 that
ln K � � � �
� ��8.3
11.4404�
7 �
103
4
10�
1.40 � 104 J mol�1����(8.314 47 J K�1 mol�1) � (310 K)
�rG�
�RT
acCad
D�aa
AabB
Thermodynamic background 157
Equ
ilibr
ium
con
stan
t, K
20
15
5
0
10
× 10
−2 201
Standard reaction Gibbsenergy, ∆rG°/RT
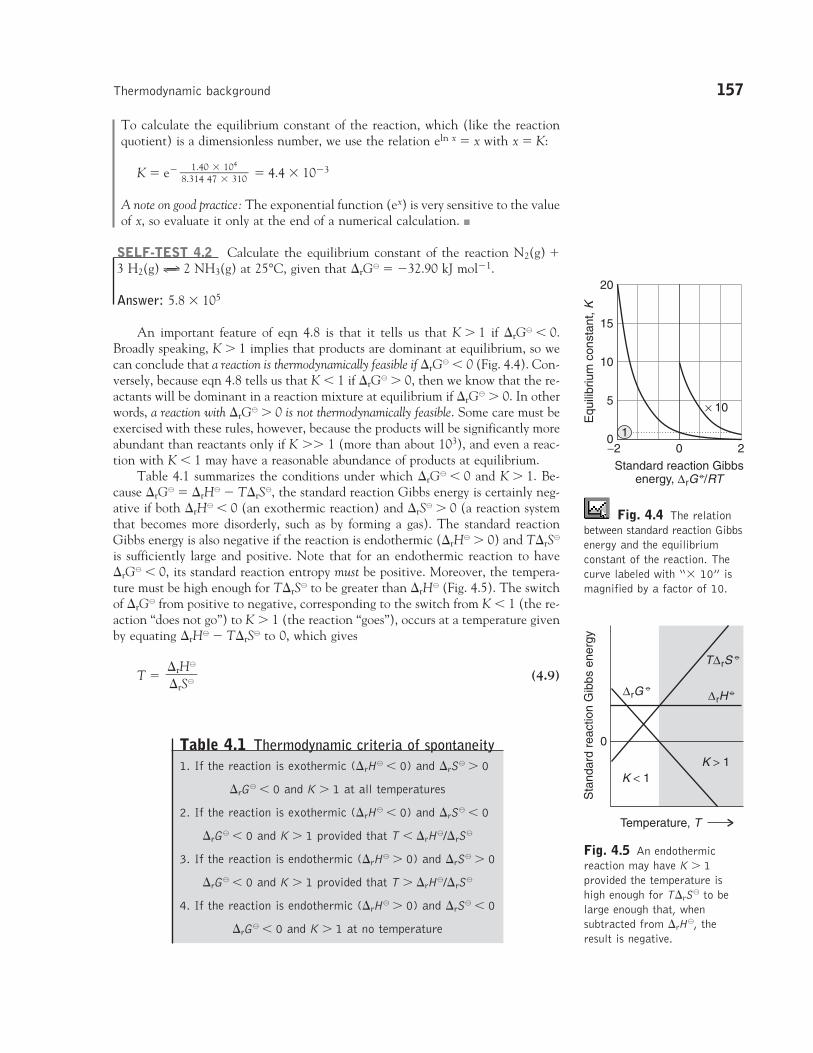
Fig. 4.4 The relationbetween standard reaction Gibbsenergy and the equilibriumconstant of the reaction. Thecurve labeled with “� 10” ismagnified by a factor of 10.
Fig. 4.5 An endothermicreaction may have K 1provided the temperature ishigh enough for T�rS� to belarge enough that, whensubtracted from �rH�, theresult is negative.
Table 4.1 Thermodynamic criteria of spontaneity1. If the reaction is exothermic (�rH� � 0) and �rS� 0
�rG� � 0 and K 1 at all temperatures
2. If the reaction is exothermic (�rH� � 0) and �rS� � 0
�rG� � 0 and K 1 provided that T � �rH�/�rS�
3. If the reaction is endothermic (�rH� 0) and �rS� 0
�rG� � 0 and K 1 provided that T �rH�/�rS�
4. If the reaction is endothermic (�rH� 0) and �rS� � 0
�rG� � 0 and K 1 at no temperature
Temperature, T
K < 1K > 1
Sta
ndar
d re
actio
n G
ibbs
ene
rgy
0
T∆rS °
∆rG ° ∆rH °
To calculate the equilibrium constant of the reaction, which (like the reactionquotient) is a dimensionless number, we use the relation eln x � x with x � K:
K � e� � 4.4 � 10�3
A note on good practice: The exponential function (ex) is very sensitive to the valueof x, so evaluate it only at the end of a numerical calculation. �
SELF-TEST 4.2 Calculate the equilibrium constant of the reaction N2(g) �3 H2(g) 9̂0̂ 2 NH3(g) at 25°C, given that �rG� � �32.90 kJ mol�1.
Answer: 5.8 � 105
An important feature of eqn 4.8 is that it tells us that K 1 if �rG� � 0.Broadly speaking, K 1 implies that products are dominant at equilibrium, so wecan conclude that a reaction is thermodynamically feasible if �rG� � 0 (Fig. 4.4). Con-versely, because eqn 4.8 tells us that K � 1 if �rG� 0, then we know that the re-actants will be dominant in a reaction mixture at equilibrium if �rG� 0. In otherwords, a reaction with �rG� 0 is not thermodynamically feasible. Some care must beexercised with these rules, however, because the products will be significantly moreabundant than reactants only if K 1 (more than about 103), and even a reac-tion with K � 1 may have a reasonable abundance of products at equilibrium.
Table 4.1 summarizes the conditions under which �rG� � 0 and K 1. Be-cause �rG� � �rH� � T�rS�, the standard reaction Gibbs energy is certainly neg-ative if both �rH� � 0 (an exothermic reaction) and �rS� 0 (a reaction systemthat becomes more disorderly, such as by forming a gas). The standard reactionGibbs energy is also negative if the reaction is endothermic (�rH� 0) and T�rS�
is sufficiently large and positive. Note that for an endothermic reaction to have�rG� � 0, its standard reaction entropy must be positive. Moreover, the tempera-ture must be high enough for T�rS� to be greater than �rH� (Fig. 4.5). The switchof �rG� from positive to negative, corresponding to the switch from K � 1 (the re-action “does not go”) to K 1 (the reaction “goes”), occurs at a temperature givenby equating �rH� � T�rS� to 0, which gives
T � (4.9)�rH�
��rS�
1.40 � 104
��8.314 47 � 310
158 Chapter 4 • Chemical Equilibrium
SELF-TEST 4.3 Calculate the decomposition temperature, the temperature atwhich the decomposition becomes spontaneous, of calcium carbonate given that�rH� � �178 kJ mol�1 and �rS� � �161 J K�1 mol�1 for the reactionCaCO3(s) l̂ CaO(s) � CO2(g).
Answer: 1.11 � 103 K
An equilibrium constant expresses the composition of an equilibrium mixtureas a ratio of products of activities. Even if we confine our attention to ideal sys-tems, it is still necessary to do some work to extract the actual equilibrium con-centrations or partial pressures of the reactants and products given their initial val-ues (see, for example, Example 4.5).
EXAMPLE 4.2 Calculating an equilibrium compositionConsider reaction A, for which �rG� � �1.7 kJ mol�1 at 25°C. Estimate thefraction f of F6P in equilibrium with G6P at 25°C, where f is defined as
f ��[F6P]
[F�
6P[]G6P]
�
Strategy Express f in terms of K. To do so, recognize that if the numerator anddenominator in the expression for f are both divided by [G6P]; then the ratios[F6P]/[G6P] can be replaced by K. Calculate the value of K by using eqn 4.8.
Solution Division of the numerator and denominator by [G6P] gives
f � �
We find the equilibrium constant by using K � eln K and rearranging eqn 4.8 into
K � e��rG�/RT
First, note that because �1.7 kJ mol�1 is the same as �1.7 � 103 J mol�1,
� �
Therefore,
K � e� � 0.50
and
f � � 0.33
That is, at equilibrium, 33% of the solute is F6P and 67% is G6P.
SELF-TEST 4.4 Estimate the composition of a solution in which two isomersA and B are in equilibrium (A 9̂0̂ B) at 37°C and �rG� � �2.2 kJ mol�1.
Answer: The fraction of B at equilibrium is feq � 0.30. �
0.50�1 � 0.50
1.7 � 103
��8.3145 � 298
1.7 � 103��8.3145 � 298
1.7 � 103 J mol�1����(8.3145 J K�1 mol�1) � (298 K)
�rG�
�RT
K�K � 1
[F6P]/[G6P]��([F6P]/[G6P]) � 1
CASE STUDY 4.1 Binding of oxygen to myoglobin and hemoglobin
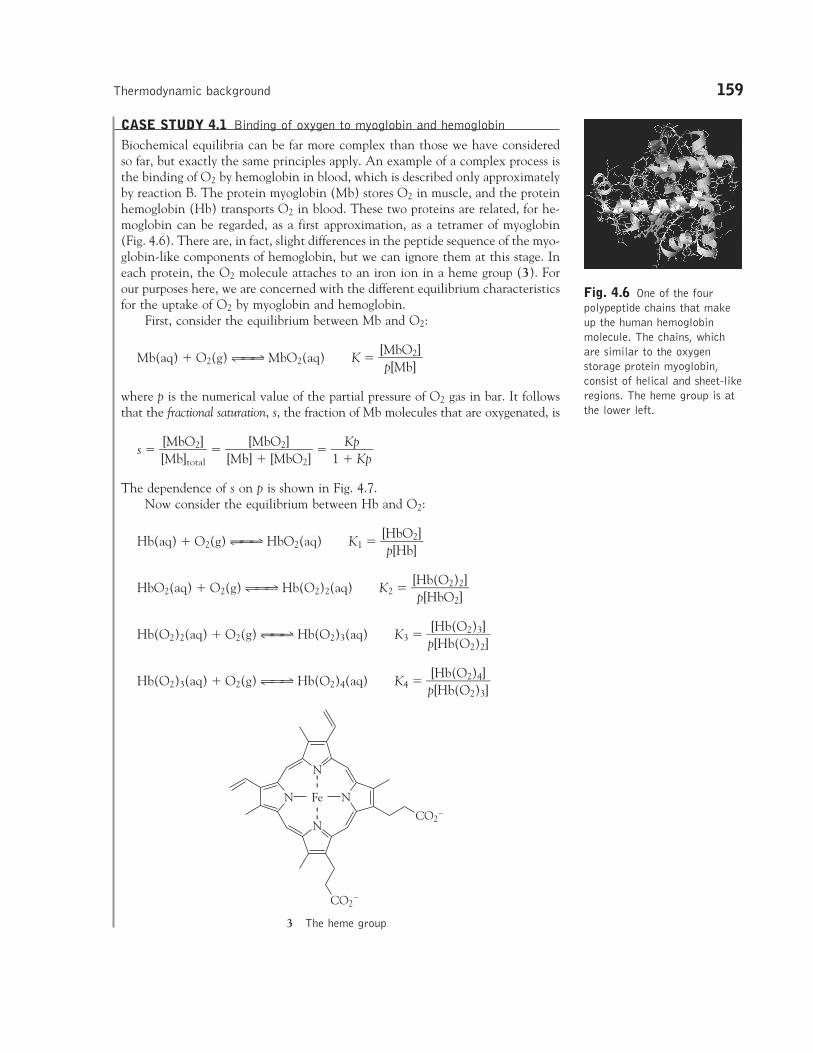
Biochemical equilibria can be far more complex than those we have consideredso far, but exactly the same principles apply. An example of a complex process isthe binding of O2 by hemoglobin in blood, which is described only approximatelyby reaction B. The protein myoglobin (Mb) stores O2 in muscle, and the proteinhemoglobin (Hb) transports O2 in blood. These two proteins are related, for he-moglobin can be regarded, as a first approximation, as a tetramer of myoglobin(Fig. 4.6). There are, in fact, slight differences in the peptide sequence of the myo-globin-like components of hemoglobin, but we can ignore them at this stage. Ineach protein, the O2 molecule attaches to an iron ion in a heme group (3). Forour purposes here, we are concerned with the different equilibrium characteristicsfor the uptake of O2 by myoglobin and hemoglobin.
First, consider the equilibrium between Mb and O2:
Mb(aq) � O2(g) ˆ̂ 90̂ ˆ MbO2(aq) K � �[Mp[M
bOb
2
]]
�
where p is the numerical value of the partial pressure of O2 gas in bar. It followsthat the fractional saturation, s, the fraction of Mb molecules that are oxygenated, is
s � �[[MM
bb]Otot
2
a
]l
� ��[Mb
[]M�
b[OM
2
b]O2]
�� �1 �
KpKp�
The dependence of s on p is shown in Fig. 4.7.Now consider the equilibrium between Hb and O2:
Hb(aq) � O2(g) ˆ̂ 90̂ ˆ HbO2(aq) K1 � �[Hp[
bHOb
2
]]
�
HbO2(aq) � O2(g) ˆ̂ 90̂ ˆ Hb(O2)2(aq) K2 � �[Hp[
bH(bOO2)
2
2
]]
�
Hb(O2)2(aq) � O2(g) ˆ̂ 90̂ ˆ Hb(O2)3(aq) K3 � �p[[HH
bb((OO
2
2
))3
2
]]
�
Hb(O2)3(aq) � O2(g) ˆ̂ 90̂ ˆ Hb(O2)4(aq) K4 � �p[[HH
bb((OO
2
2
))4
3
]]
�
Thermodynamic background 159
Fig. 4.6 One of the fourpolypeptide chains that makeup the human hemoglobinmolecule. The chains, whichare similar to the oxygenstorage protein myoglobin,consist of helical and sheet-likeregions. The heme group is atthe lower left.
N
N
N
N
CO2–
CO2–
Fe
3 The heme group
To develop an expression for s, we express [Hb(O2)2] in terms of [HbO2] by us-ing K2, then express [HbO2] in terms of [Hb] by using K1, and likewise for all theother concentrations of Hb(O2)3 and Hb(O2)4. It follows that
[HbO2] � K1p[Hb] [Hb(O2)2] � K1K2p2[Hb]
[Hb(O2)3] � K1K2K3p3[Hb] [Hb(O2)4] � K1K2K3 K4p4[Hb]
The total concentration of bound O2 is
[O2]bound � [HbO2] � 2[Hb(O2)2] � 3[Hb(O2)3] � 4[Hb(O2)4]
� (1 � 2K2p � 3K2K3p2 � 4K2K3K4p3)K1p[Hb]
where we have used the fact that n O2 molecules are bound in Hb(O2)n, so theconcentration of bound O2 in Hb(O2)2 is 2[Hb(O2)2], and so on. The total con-centration of hemoglobin is
[Hb]total � (1 � K1p � K1K2p2 � K1K2K3p3 � K1K2K3K4p4)[Hb]
Because each Hb molecule has four sites at which O2 can attach, the fractionalsaturation is
s � �
A reasonable fit of the experimental data can be obtained with K1 � 0.01, K2 � 0.02, K3 � 0.04, and K4 � 0.08 when p is expressed in torr.
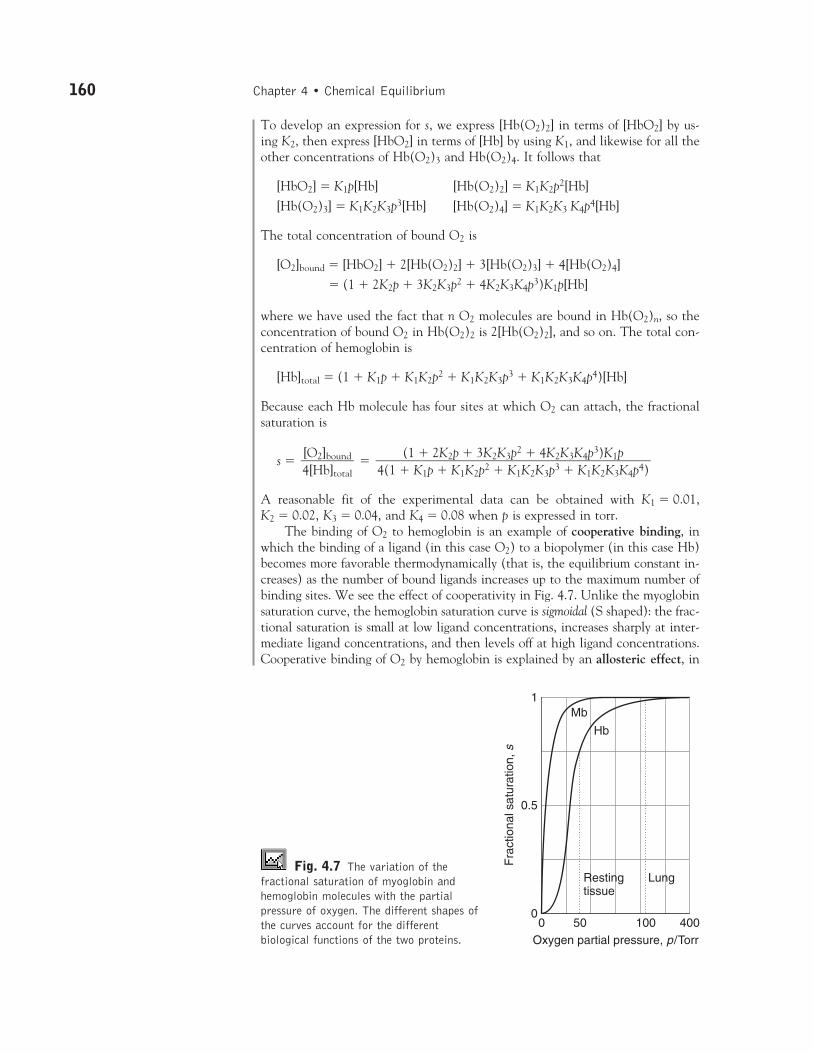
The binding of O2 to hemoglobin is an example of cooperative binding, inwhich the binding of a ligand (in this case O2) to a biopolymer (in this case Hb)becomes more favorable thermodynamically (that is, the equilibrium constant in-creases) as the number of bound ligands increases up to the maximum number ofbinding sites. We see the effect of cooperativity in Fig. 4.7. Unlike the myoglobinsaturation curve, the hemoglobin saturation curve is sigmoidal (S shaped): the frac-tional saturation is small at low ligand concentrations, increases sharply at inter-mediate ligand concentrations, and then levels off at high ligand concentrations.Cooperative binding of O2 by hemoglobin is explained by an allosteric effect, in
(1 � 2K2p � 3K2K3p2 � 4K2K3K4p3)K1p������4(1 � K1p � K1K2p2 � K1K2K3p3 � K1K2K3K4p4)
[O2]bound�4[Hb]total
160 Chapter 4 • Chemical Equilibrium
Oxygen partial pressure, p/Torr
Restingtissue
Lung
Mb
Hb
400500 100
Fra
ctio
nal s
atur
atio
n, s
1
0
0.5
Fig. 4.7 The variation of thefractional saturation of myoglobin andhemoglobin molecules with the partialpressure of oxygen. The different shapes ofthe curves account for the differentbiological functions of the two proteins.
Thermodynamic background 161
which an adjustment of the conformation of a molecule when one substrate bindsaffects the ease with which a subsequent substrate molecule binds. The details ofthe allosteric effect in hemoglobin will be explored in Case study 10.4.
The differing shapes of the saturation curves for myoglobin and hemoglobinhave important consequences for the way O2 is made available in the body: in particular, the greater sharpness of the Hb saturation curve means that Hb canload O2 more fully in the lungs and unload it more fully in different regions of the organism. In the lungs, where p � 105 Torr (14 kPa), s � 0.98, representingalmost complete saturation. In resting muscular tissue, p is equivalent to about 38 Torr (5 kPa), corresponding to s � 0.75, implying that sufficient O2 is still avail-able should a sudden surge of activity take place. If the local partial pressure fallsto 22 Torr (3 kPa), s falls to about 0.1. Note that the steepest part of the curvefalls in the range of typical tissue oxygen partial pressure. Myoglobin, on the otherhand, begins to release O2 only when p has fallen below about 22 Torr, so it actsas a reserve to be drawn on only when the Hb oxygen has been used up. �
4.4 The standard reaction Gibbs energy
The standard reaction Gibbs energy is central to the discussion of chemical equilibriaand the calculation of equilibrium constants. It is also a useful indicator of the energyavailable from catabolism to drive anabolic processes, such as the synthesis of proteins.
We have seen that standard reaction Gibbs energy, �rG�, is defined as the differ-ence in standard molar Gibbs energies of the products and the reactants weightedby the stoichiometric coefficients, �, in the chemical equation
�rG� � ��Gm�(products) � ��Gm
�(reactants) (4.10)
For example, the standard reaction Gibbs energy for reaction A is the differencebetween the molar Gibbs energies of fructose-6-phosphate and glucose-6-phosphatein solution at 1 mol L�1 and 1 bar.
We cannot calculate �rG� from the standard molar Gibbs energies themselves,because these quantities are not known. One practical approach is to calculate thestandard reaction enthalpy from standard enthalpies of formation (Section 1.14),the standard reaction entropy from Third-Law entropies (Section 2.8), and thento combine the two quantities by using
�rG� � �rH� � T�rS� (4.11)
EXAMPLE 4.3 Calculating the standard reaction Gibbs energy of an enzyme-catalyzed reaction
Evaluate the standard reaction Gibbs energy at 25°C for the reaction CO2(g) �H2O(l) l̂ H2CO3(aq) catalyzed by the enzyme carbonic anhydrase in red bloodcells.
Strategy Obtain the relevant standard enthalpies and entropies of formation fromthe Data section. Then calculate the standard reaction enthalpy and the standardreaction entropy from
�rH� � ���fH�(products) � ���fH�(reactants)
�rS� � ��Sm�(products) � ��Sm
�(reactants)
and the standard reaction Gibbs energy from eqn 4.11.
Solution The standard reaction enthalpy is
�rH� � �fH�(H2CO3, aq) � {�fH�(CO2, g) � �fH�(H2O, l)}
�rH� � �699.65 kJ mol�1 � {(�110.53 kJ mol�1) � (�285.83 kJ mol�1)}
�rH� � �303.29 kJ mol�1
The standard reaction entropy was calculated in Illustration 2.4:
�rS� � �96.3 J K�1 mol�1
which, because 96.3 J is the same as 9.63 � 10�2 kJ, corresponds to �9.63 �10�2 kJ K�1 mol�1. Therefore, from eqn 4.11,
�rG� � (�303.29 kJ mol�1) � (298.15 K) � (�9.63 � 10�2 kJ K�1 mol�1)
�rG� � �274.6 kJ mol�1
SELF-TEST 4.5 Use the information in the Data section to determine the stan-dard reaction Gibbs energy for 3 O2(g) l̂ 2 O3(g) from standard enthalpies offormation and standard entropies.
Answer: �326.4 kJ mol�1�
We saw in Section 1.14 how to use standard enthalpies of formation of sub-stances to calculate standard reaction enthalpies. We can use the same techniquefor standard reaction Gibbs energies. To do so, we list the standard Gibbs energyof formation, �fG�, of a substance, which is the standard reaction Gibbs energy(per mole of the species) for its formation from the elements in their referencestates. The concept of reference state was introduced in Section 1.14; the temper-ature is arbitrary, but we shall almost always take it to be 25°C (298 K). For ex-ample, the standard Gibbs energy of formation of liquid water, �fG�(H2O, l), is thestandard reaction Gibbs energy for
H2(g) � 1⁄2O2(g) ˆ̂ l H2O(l)
and is �237 kJ mol�1 at 298 K. Some standard Gibbs energies of formation arelisted in Table 4.2 and more can be found in the Data section. It follows from thedefinition that the standard Gibbs energy of formation of an element in its refer-ence state is zero because reactions such as
C(s, graphite) ˆ̂ l C(s, graphite)
are null (that is, nothing happens). The standard Gibbs energy of formation of anelement in a phase different from its reference state is nonzero:
C(s, graphite) ˆ̂ l C(s, diamond) �fG�(C, diamond) � �2.90 kJ mol�1
Many of the values in the tables have been compiled by combining the standardenthalpy of formation of the species with the standard entropies of the compoundand the elements, as illustrated above, but there are other sources of data and weencounter some of them later.
162 Chapter 4 • Chemical Equilibrium
Thermodynamic background 163
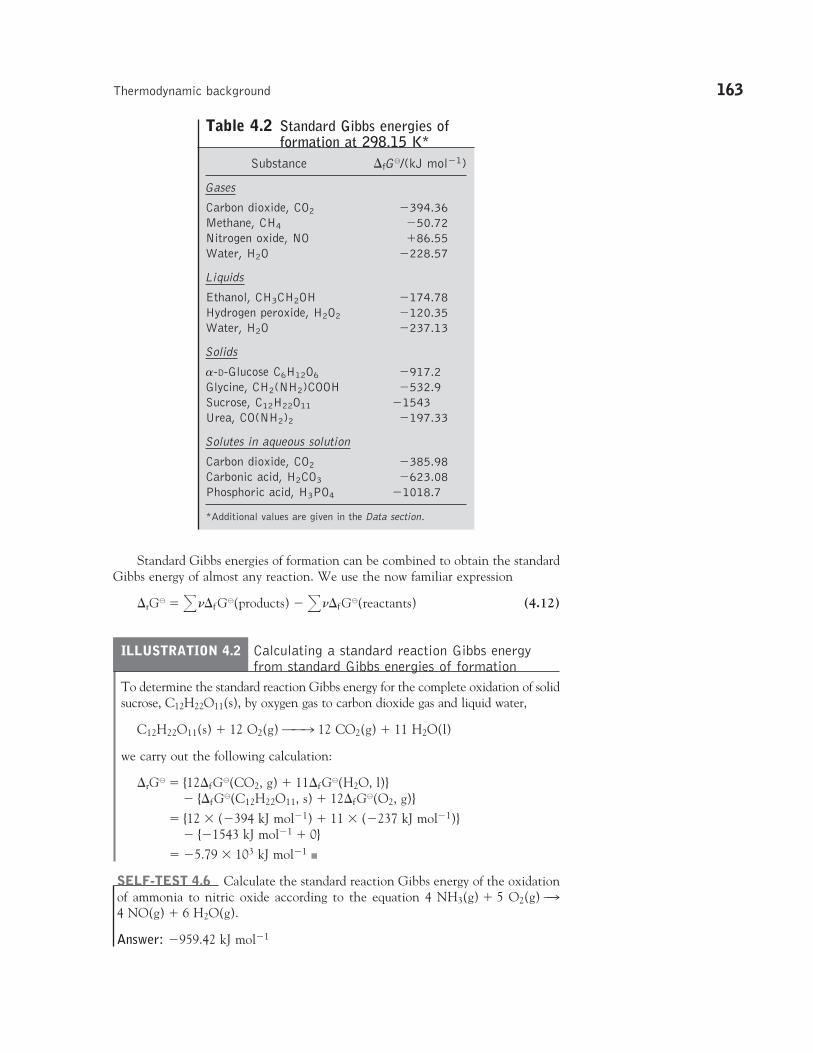
Table 4.2 Standard Gibbs energies offormation at 298.15 K*
Substance �fG�/(kJ mol�1)
Gases
Carbon dioxide, CO2 �394.36Methane, CH4 �50.72Nitrogen oxide, NO �86.55Water, H2O �228.57
Liquids
Ethanol, CH3CH2OH �174.78Hydrogen peroxide, H2O2 �120.35Water, H2O �237.13
Solids
�-D-Glucose C6H12O6 �917.2Glycine, CH2(NH2)COOH �532.9Sucrose, C12H22O11 �1543Urea, CO(NH2)2 �197.33
Solutes in aqueous solution
Carbon dioxide, CO2 �385.98Carbonic acid, H2CO3 �623.08Phosphoric acid, H3PO4 �1018.7
*Additional values are given in the Data section.
Standard Gibbs energies of formation can be combined to obtain the standardGibbs energy of almost any reaction. We use the now familiar expression
�rG� � ���f G�(products) � ���fG�(reactants) (4.12)
ILLUSTRATION 4.2 Calculating a standard reaction Gibbs energyfrom standard Gibbs energies of formation
To determine the standard reaction Gibbs energy for the complete oxidation of solidsucrose, C12H22O11(s), by oxygen gas to carbon dioxide gas and liquid water,
C12H22O11(s) � 12 O2(g) ˆ̂ l 12 CO2(g) � 11 H2O(l)
we carry out the following calculation:
�rG� � {12�fG�(CO2, g) � 11�fG�(H2O, l)}� {�fG�(C12H22O11, s) � 12�fG�(O2, g)}
� {12 � (�394 kJ mol�1) � 11 � (�237 kJ mol�1)}� {�1543 kJ mol�1 � 0}
� �5.79 � 103 kJ mol�1�
SELF-TEST 4.6 Calculate the standard reaction Gibbs energy of the oxidationof ammonia to nitric oxide according to the equation 4 NH3(g) � 5 O2(g) l̂4 NO(g) � 6 H2O(g).
Answer: �959.42 kJ mol�1
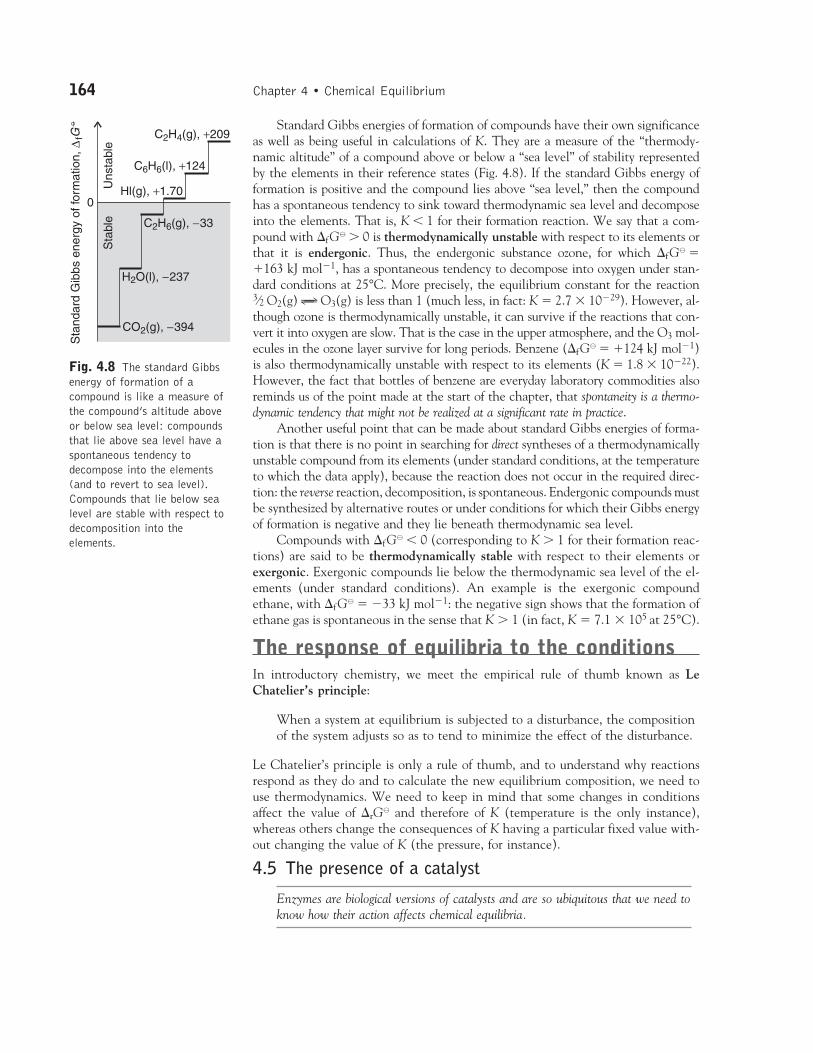
Standard Gibbs energies of formation of compounds have their own significanceas well as being useful in calculations of K. They are a measure of the “thermody-namic altitude” of a compound above or below a “sea level” of stability representedby the elements in their reference states (Fig. 4.8). If the standard Gibbs energy offormation is positive and the compound lies above “sea level,” then the compoundhas a spontaneous tendency to sink toward thermodynamic sea level and decomposeinto the elements. That is, K � 1 for their formation reaction. We say that a com-pound with �fG� 0 is thermodynamically unstable with respect to its elements orthat it is endergonic. Thus, the endergonic substance ozone, for which �fG� ��163 kJ mol�1, has a spontaneous tendency to decompose into oxygen under stan-dard conditions at 25°C. More precisely, the equilibrium constant for the reaction 3⁄2 O2(g) 9̂0̂ O3(g) is less than 1 (much less, in fact: K � 2.7 � 10�29). However, al-though ozone is thermodynamically unstable, it can survive if the reactions that con-vert it into oxygen are slow. That is the case in the upper atmosphere, and the O3 mol-ecules in the ozone layer survive for long periods. Benzene (�fG� � �124 kJ mol�1)is also thermodynamically unstable with respect to its elements (K � 1.8 � 10�22).However, the fact that bottles of benzene are everyday laboratory commodities alsoreminds us of the point made at the start of the chapter, that spontaneity is a thermo-dynamic tendency that might not be realized at a significant rate in practice.
Another useful point that can be made about standard Gibbs energies of forma-tion is that there is no point in searching for direct syntheses of a thermodynamicallyunstable compound from its elements (under standard conditions, at the temperatureto which the data apply), because the reaction does not occur in the required direc-tion: the reverse reaction, decomposition, is spontaneous. Endergonic compounds mustbe synthesized by alternative routes or under conditions for which their Gibbs energyof formation is negative and they lie beneath thermodynamic sea level.
Compounds with �fG� � 0 (corresponding to K 1 for their formation reac-tions) are said to be thermodynamically stable with respect to their elements orexergonic. Exergonic compounds lie below the thermodynamic sea level of the el-ements (under standard conditions). An example is the exergonic compoundethane, with �fG� � �33 kJ mol�1: the negative sign shows that the formation ofethane gas is spontaneous in the sense that K 1 (in fact, K � 7.1 � 105 at 25°C).
The response of equilibria to the conditionsIn introductory chemistry, we meet the empirical rule of thumb known as Le Chatelier’s principle:
When a system at equilibrium is subjected to a disturbance, the compositionof the system adjusts so as to tend to minimize the effect of the disturbance.
Le Chatelier’s principle is only a rule of thumb, and to understand why reactionsrespond as they do and to calculate the new equilibrium composition, we need touse thermodynamics. We need to keep in mind that some changes in conditionsaffect the value of �rG� and therefore of K (temperature is the only instance),whereas others change the consequences of K having a particular fixed value with-out changing the value of K (the pressure, for instance).
4.5 The presence of a catalyst
Enzymes are biological versions of catalysts and are so ubiquitous that we need toknow how their action affects chemical equilibria.
164 Chapter 4 • Chemical EquilibriumU
nsta
ble
Sta
ble
C2H4(g), +209
Hl(g), +1.70
C6H6(l), +124
C2H6(g), −33
H2O(l), −237
CO2(g), −394
0
Sta
ndar
d G
ibbs
ene
rgy
of fo
rmat
ion,
∆fG
°
Fig. 4.8 The standard Gibbsenergy of formation of acompound is like a measure ofthe compound’s altitude aboveor below sea level: compoundsthat lie above sea level have aspontaneous tendency todecompose into the elements(and to revert to sea level).Compounds that lie below sealevel are stable with respect todecomposition into theelements.
We study the action of catalysts (a substance that accelerates a reaction withoutitself appearing in the overall chemical equation) in Chapter 8 and at this stage donot need to know in detail how they work other than that they provide an alter-native, faster route from reactants to products. Although the new route from reac-tants to products is faster, the initial reactants and the final products are the same.The quantity �rG� is defined as the difference of the standard molar Gibbs ener-gies of the reactants and products, so it is independent of the path linking the two.It follows that an alternative pathway between reactants and products leaves �rG�
and therefore K unchanged. That is, the presence of a catalyst does not change the equi-librium constant of a reaction.
4.6 The effect of temperature
In organisms, biochemical reactions occur over a very narrow range oftemperatures, and changes by only a few degrees can have serious consequences,including death. Therefore, it is important to know how changes in temperature,such as those brought about by infections, affect biological processes.
According to Le Chatelier’s principle, we can expect a reaction to respond to alowering of temperature by releasing heat and to respond to an increase of tem-perature by absorbing heat. That is:
When the temperature is raised, the equilibrium composition of anexothermic reaction will tend to shift toward reactants; the equilibriumcomposition of an endothermic reaction will tend to shift toward products.
In each case, the response tends to minimize the effect of raising the temperature.But why do reactions at equilibrium respond in this way? Le Chatelier’s principleis only a rule of thumb and gives no clue to the reason for this behavior. As weshall now see, the origin of the effect is the dependence of �rG�, and therefore ofK, on the temperature.
First, we consider the effect of temperature on �rG�. We use the relation�rG� � �rH� � T�rS� and make the assumption that neither the reaction enthalpynor the reaction entropy varies much with temperature (over small ranges, at least).It follows that
Change in �rG� � �(change in T) � �rS� (4.13)
This expression is easy to apply when there is a consumption or formation of gasbecause, as we have seen (Section 2.8), gas formation dominates the sign of the re-action entropy.
Now consider the effect of temperature on K itself. At first, this problem lookstroublesome, because both T and �rG� appear in the expression for K. However,in fact the effect of temperature can be expressed very simply as the van ’t Hoffequation.1
ln K � ln K � � � � (4.14)1
�T
1�T
�rH�
�R
The response of equilibria to the conditions 165
1There are several “van ’t Hoff equations.” To distinguish them, this one is sometimescalled the van ’t Hoff isochore.
166 Chapter 4 • Chemical Equilibrium
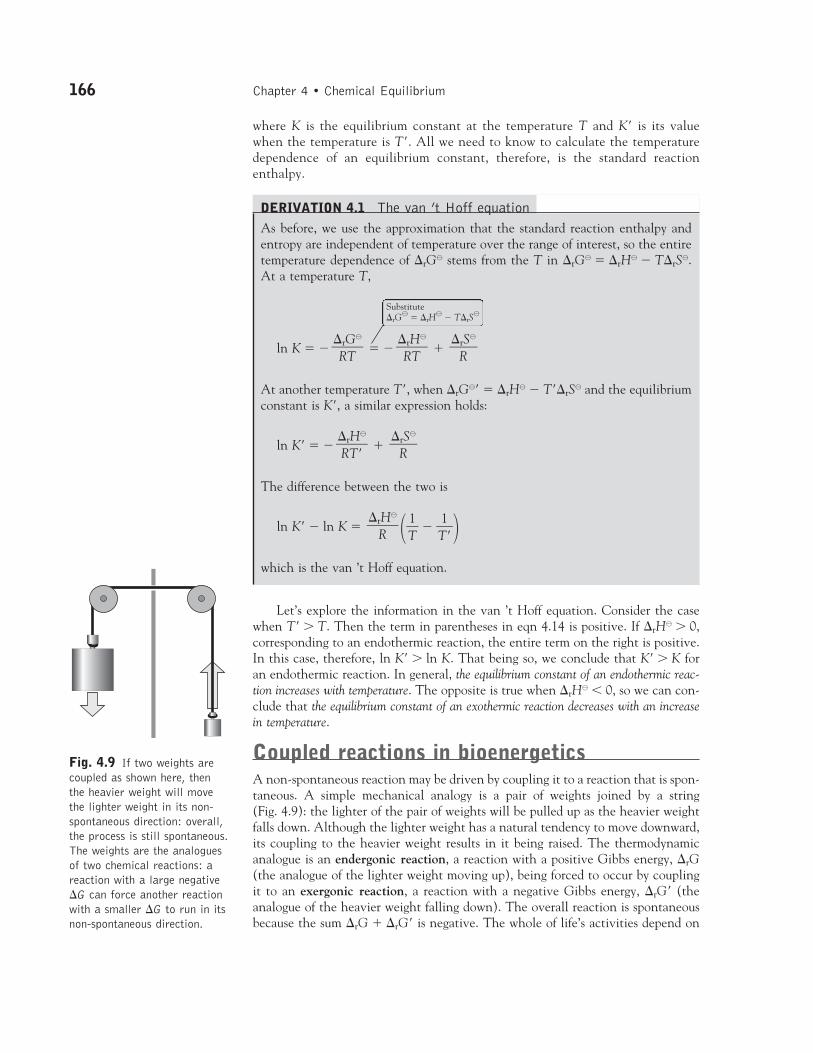
Fig. 4.9 If two weights arecoupled as shown here, thenthe heavier weight will movethe lighter weight in its non-spontaneous direction: overall,the process is still spontaneous.The weights are the analoguesof two chemical reactions: areaction with a large negative�G can force another reactionwith a smaller �G to run in itsnon-spontaneous direction.
where K is the equilibrium constant at the temperature T and K is its valuewhen the temperature is T. All we need to know to calculate the temperaturedependence of an equilibrium constant, therefore, is the standard reaction enthalpy.
DERIVATION 4.1 The van ’t Hoff equationAs before, we use the approximation that the standard reaction enthalpy andentropy are independent of temperature over the range of interest, so the entiretemperature dependence of �rG� stems from the T in �rG� � �rH� � T�rS�.At a temperature T,
Substitute �rG
� � �rH� � T�rS
�
ln K � � � � �
At another temperature T, when �rG� � �rH� � T�rS� and the equilibriumconstant is K, a similar expression holds:
ln K � � �
The difference between the two is
ln K � ln K � ��T1
� � �T1
��which is the van ’t Hoff equation.
Let’s explore the information in the van ’t Hoff equation. Consider the casewhen T T. Then the term in parentheses in eqn 4.14 is positive. If �rH� 0,corresponding to an endothermic reaction, the entire term on the right is positive.In this case, therefore, ln K ln K. That being so, we conclude that K K foran endothermic reaction. In general, the equilibrium constant of an endothermic reac-tion increases with temperature. The opposite is true when �rH� � 0, so we can con-clude that the equilibrium constant of an exothermic reaction decreases with an increasein temperature.
Coupled reactions in bioenergeticsA non-spontaneous reaction may be driven by coupling it to a reaction that is spon-taneous. A simple mechanical analogy is a pair of weights joined by a string (Fig. 4.9): the lighter of the pair of weights will be pulled up as the heavier weightfalls down. Although the lighter weight has a natural tendency to move downward,its coupling to the heavier weight results in it being raised. The thermodynamicanalogue is an endergonic reaction, a reaction with a positive Gibbs energy, �rG(the analogue of the lighter weight moving up), being forced to occur by couplingit to an exergonic reaction, a reaction with a negative Gibbs energy, �rG (theanalogue of the heavier weight falling down). The overall reaction is spontaneousbecause the sum �rG � �rG is negative. The whole of life’s activities depend on
�rH�
�R
�rS�
�R
�rH�
�RT
�rS�
�R
�rH�
�RT
�rG�
�RT
Coupled reactions in bioenergetics 167
couplings of this kind, for the oxidation reactions of food act as the heavy weightsthat drive other reactions forward and result in the formation of proteins from aminoacids, the actions of muscles for propulsion, and even the activities of the brain forreflection, learning, and imagination.
4.7 The function of adenosine triphosphate
The compound adenosine triphosphate is of central importance in bioenergetics,and it is essential to understand its thermodynamic role.
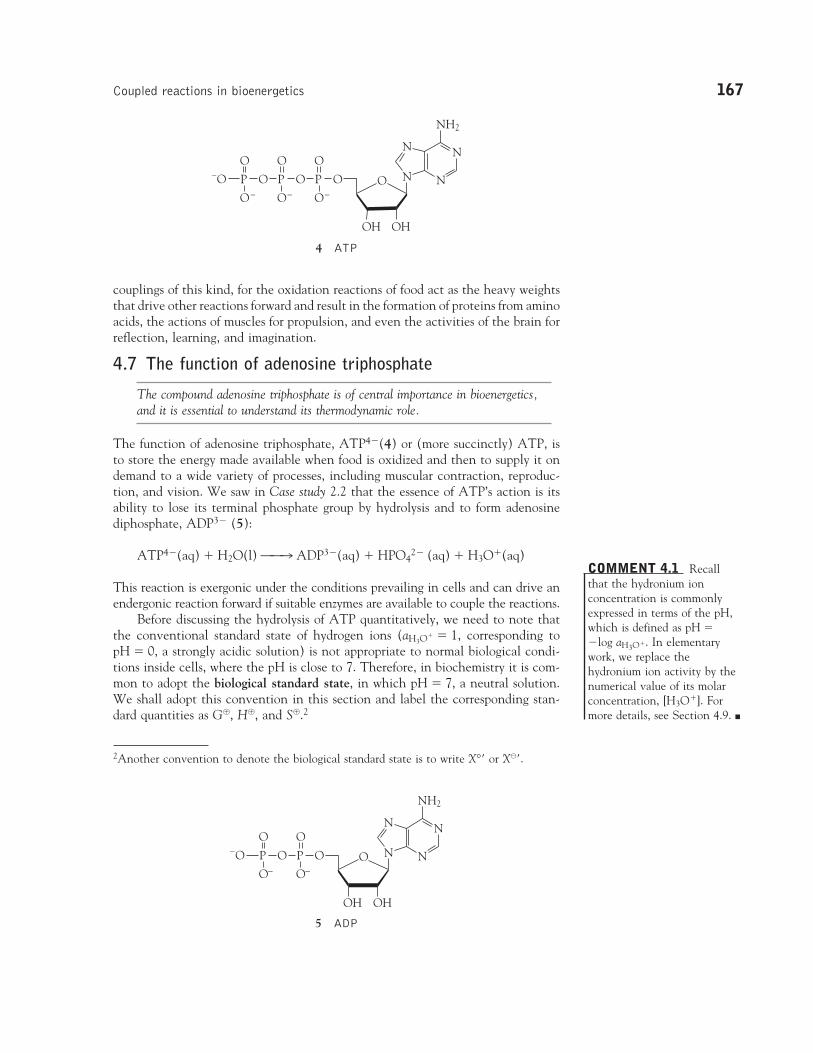
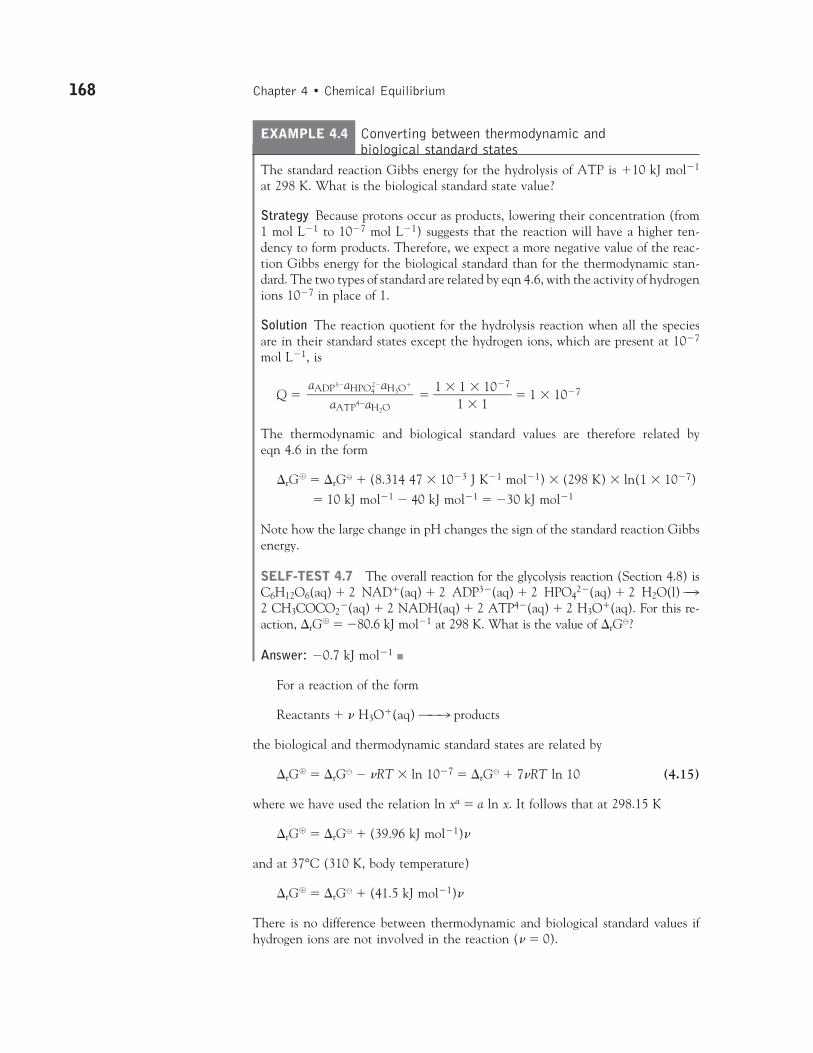
The function of adenosine triphosphate, ATP4�(4) or (more succinctly) ATP, isto store the energy made available when food is oxidized and then to supply it ondemand to a wide variety of processes, including muscular contraction, reproduc-tion, and vision. We saw in Case study 2.2 that the essence of ATP’s action is itsability to lose its terminal phosphate group by hydrolysis and to form adenosinediphosphate, ADP3� (5):
ATP4�(aq) � H2O(l) ˆ̂ l ADP3�(aq) � HPO42� (aq) � H3O�(aq)
This reaction is exergonic under the conditions prevailing in cells and can drive anendergonic reaction forward if suitable enzymes are available to couple the reactions.
Before discussing the hydrolysis of ATP quantitatively, we need to note thatthe conventional standard state of hydrogen ions (aH3O
� � 1, corresponding topH � 0, a strongly acidic solution) is not appropriate to normal biological condi-tions inside cells, where the pH is close to 7. Therefore, in biochemistry it is com-mon to adopt the biological standard state, in which pH � 7, a neutral solution.We shall adopt this convention in this section and label the corresponding stan-dard quantities as G�, H�, and S�.2
NH2
O
O
O––
P
O
O–
O
N
NN
N
O
OHOH
OPO
O–
O
P
NH2
O–O
O–
N
NN
N
O
OHOH
OPO
O–
O
P
2Another convention to denote the biological standard state is to write X° or X�.
4 ATP
5 ADP
COMMENT 4.1 Recallthat the hydronium ionconcentration is commonlyexpressed in terms of the pH,which is defined as pH ��log aH3O�. In elementarywork, we replace thehydronium ion activity by thenumerical value of its molarconcentration, [H3O�]. Formore details, see Section 4.9. �
168 Chapter 4 • Chemical Equilibrium
EXAMPLE 4.4 Converting between thermodynamic and biological standard states
The standard reaction Gibbs energy for the hydrolysis of ATP is �10 kJ mol�1
at 298 K. What is the biological standard state value?
Strategy Because protons occur as products, lowering their concentration (from1 mol L�1 to 10�7 mol L�1) suggests that the reaction will have a higher ten-dency to form products. Therefore, we expect a more negative value of the reac-tion Gibbs energy for the biological standard than for the thermodynamic stan-dard. The two types of standard are related by eqn 4.6, with the activity of hydrogenions 10�7 in place of 1.
Solution The reaction quotient for the hydrolysis reaction when all the speciesare in their standard states except the hydrogen ions, which are present at 10�7
mol L�1, is
Q � � �1 �
11
�
�
110�7
� � 1 � 10�7
The thermodynamic and biological standard values are therefore related by eqn 4.6 in the form
�rG� � �rG� � (8.314 47 � 10�3 J K�1 mol�1) � (298 K) � ln(1 � 10�7)
� 10 kJ mol�1 � 40 kJ mol�1 � �30 kJ mol�1
Note how the large change in pH changes the sign of the standard reaction Gibbsenergy.
SELF-TEST 4.7 The overall reaction for the glycolysis reaction (Section 4.8) isC6H12O6(aq) � 2 NAD�(aq) � 2 ADP3�(aq) � 2 HPO4
2�(aq) � 2 H2O(l) l̂2 CH3COCO2
�(aq) � 2 NADH(aq) � 2 ATP4�(aq) � 2 H3O�(aq). For this re-action, �rG
� � �80.6 kJ mol�1 at 298 K. What is the value of �rG�?
Answer: �0.7 kJ mol�1�
For a reaction of the form
Reactants � � H3O�(aq) ˆ̂ l products
the biological and thermodynamic standard states are related by
�rG� � �rG� � �RT � ln 10�7 � �rG� � 7�RT ln 10 (4.15)
where we have used the relation ln xa � a ln x. It follows that at 298.15 K
�rG� � �rG� � (39.96 kJ mol�1)�
and at 37°C (310 K, body temperature)
�rG� � �rG� � (41.5 kJ mol�1)�
There is no difference between thermodynamic and biological standard values ifhydrogen ions are not involved in the reaction (� � 0).
aADP3�aHPO42�aH3O
�
���aATP4�aH2O
Coupled reactions in bioenergetics 169
COMMENT 4.2 From nowon, we shall representbiochemical reactions withchemical equations writtenwith a shorthand method, inwhich some substances aregiven “nicknames” and chargesare not always given explicitly.For example, H2PO4
2� iswritten as Pi, ATP4� as ATP,and so on. �
NH2+
N CO2H3C
HN
PO O
O–
–
–
6 Creatine phosphate
Now we are ready to explore the action of ATP quantitatively. The biologicalstandard values for the hydrolysis of ATP at 37°C are
�rG� � �31 kJ mol�1 �rH
� � �20 kJ mol�1 �rS� � �34 J K�1 mol�1
The hydrolysis is therefore exergonic (�rG � 0) under these conditions, and 31 kJmol�1 is available for driving other reactions. On account of its exergonic charac-ter, the ADP-phosphate bond has been called a “high-energy phosphate bond.” Thename is intended to signify a high tendency to undergo reaction and should not beconfused with “strong” bond in its normal chemical sense (that of a high bond en-thalpy). In fact, even in the biological sense it is not of very “high energy.” Theaction of ATP depends on the bond being intermediate in strength. Thus ATP actsas a phosphate donor to a number of acceptors (such as glucose) but is rechargedwith a new phosphate group by more powerful phosphate donors in the phospho-rylation steps in the respiration cycle.
CASE STUDY 4.2 The biosynthesis of proteins
In the cell, each ATP molecule can be used to drive an endergonic reaction forwhich �rG
� does not exceed �31 kJ mol�1. For example, the biosynthesis of su-crose from glucose and fructose can be driven by plant enzymes because the re-action is endergonic to the extent �rG
� � �23 kJ mol�1. The biosynthesis ofproteins is strongly endergonic, not only on account of the enthalpy change butalso on account of the large decrease in entropy that occurs when many aminoacids are assembled into a precisely determined sequence. For instance, the for-mation of a peptide link is endergonic, with �rG
� � �17 kJ mol�1, but the biosyn-thesis occurs indirectly and is equivalent to the consumption of three ATP mol-ecules for each link. In a moderately small protein such as myoglobin, with about150 peptide links, the construction alone requires 450 ATP molecules and there-fore about 12 mol of glucose molecules for 1 mol of protein molecules. �
SELF-TEST 4.8 Fats yield almost twice as much energy per gram as carbohy-drates. What mass of fat would need to be metabolized to synthesize 1.0 mol ofmyoglobin molecules?
Answer: 7.6 kg
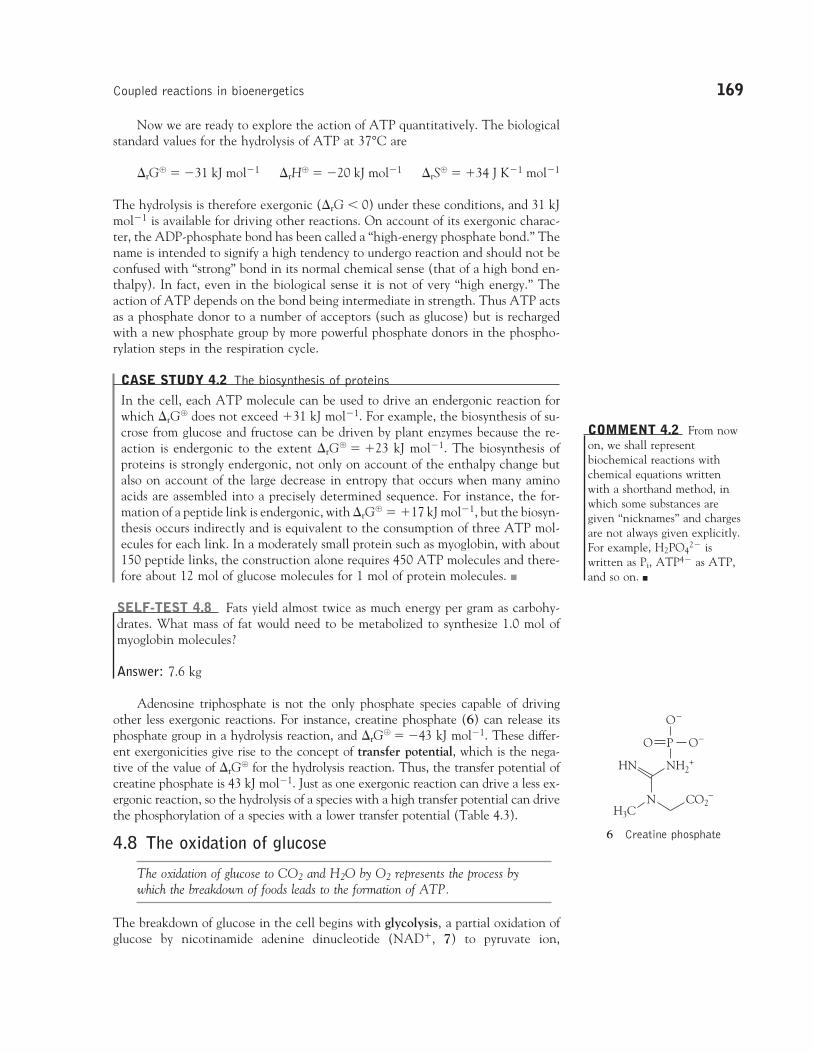
Adenosine triphosphate is not the only phosphate species capable of drivingother less exergonic reactions. For instance, creatine phosphate (6) can release itsphosphate group in a hydrolysis reaction, and �rG
� � �43 kJ mol�1. These differ-ent exergonicities give rise to the concept of transfer potential, which is the nega-tive of the value of �rG
� for the hydrolysis reaction. Thus, the transfer potential ofcreatine phosphate is 43 kJ mol�1. Just as one exergonic reaction can drive a less ex-ergonic reaction, so the hydrolysis of a species with a high transfer potential can drivethe phosphorylation of a species with a lower transfer potential (Table 4.3).
4.8 The oxidation of glucose
The oxidation of glucose to CO2 and H2O by O2 represents the process bywhich the breakdown of foods leads to the formation of ATP.
The breakdown of glucose in the cell begins with glycolysis, a partial oxidation ofglucose by nicotinamide adenine dinucleotide (NAD�, 7) to pyruvate ion,
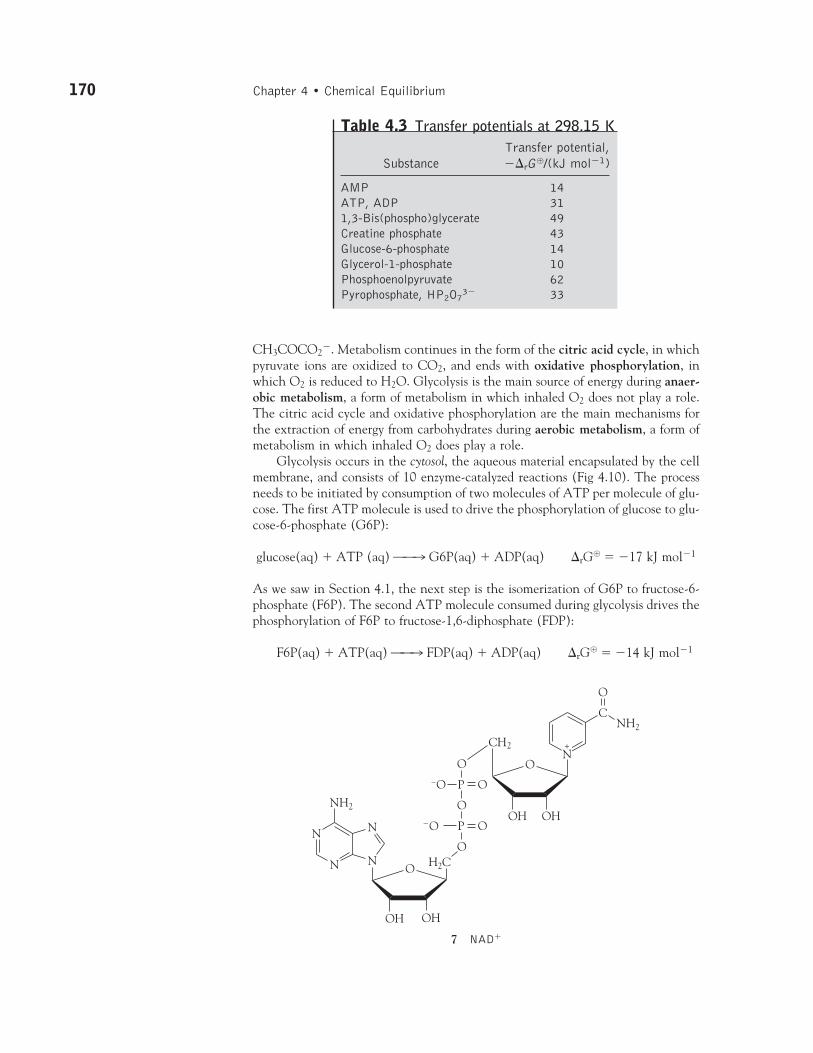
CH3COCO2�. Metabolism continues in the form of the citric acid cycle, in which
pyruvate ions are oxidized to CO2, and ends with oxidative phosphorylation, inwhich O2 is reduced to H2O. Glycolysis is the main source of energy during anaer-obic metabolism, a form of metabolism in which inhaled O2 does not play a role.The citric acid cycle and oxidative phosphorylation are the main mechanisms forthe extraction of energy from carbohydrates during aerobic metabolism, a form ofmetabolism in which inhaled O2 does play a role.
Glycolysis occurs in the cytosol, the aqueous material encapsulated by the cellmembrane, and consists of 10 enzyme-catalyzed reactions (Fig 4.10). The processneeds to be initiated by consumption of two molecules of ATP per molecule of glu-cose. The first ATP molecule is used to drive the phosphorylation of glucose to glu-cose-6-phosphate (G6P):
glucose(aq) � ATP (aq) ˆ̂ l G6P(aq) � ADP(aq) �rG� � �17 kJ mol�1
As we saw in Section 4.1, the next step is the isomerization of G6P to fructose-6-phosphate (F6P). The second ATP molecule consumed during glycolysis drives thephosphorylation of F6P to fructose-1,6-diphosphate (FDP):
F6P(aq) � ATP(aq) ˆ̂ l FDP(aq) � ADP(aq) �rG� � �14 kJ mol�1
170 Chapter 4 • Chemical Equilibrium
Table 4.3 Transfer potentials at 298.15 KTransfer potential,
Substance ��rG�/(kJ mol�1)
AMP 14ATP, ADP 311,3-Bis(phospho)glycerate 49Creatine phosphate 43Glucose-6-phosphate 14Glycerol-1-phosphate 10Phosphoenolpyruvate 62Pyrophosphate, HP2O7
3� 33
O
P
OOH OH
NH2
OO
OO–
CNH2
O
H2C
OH OH
O
P
O
CH2
O
N
NN
N
–
+N+
7 NAD�
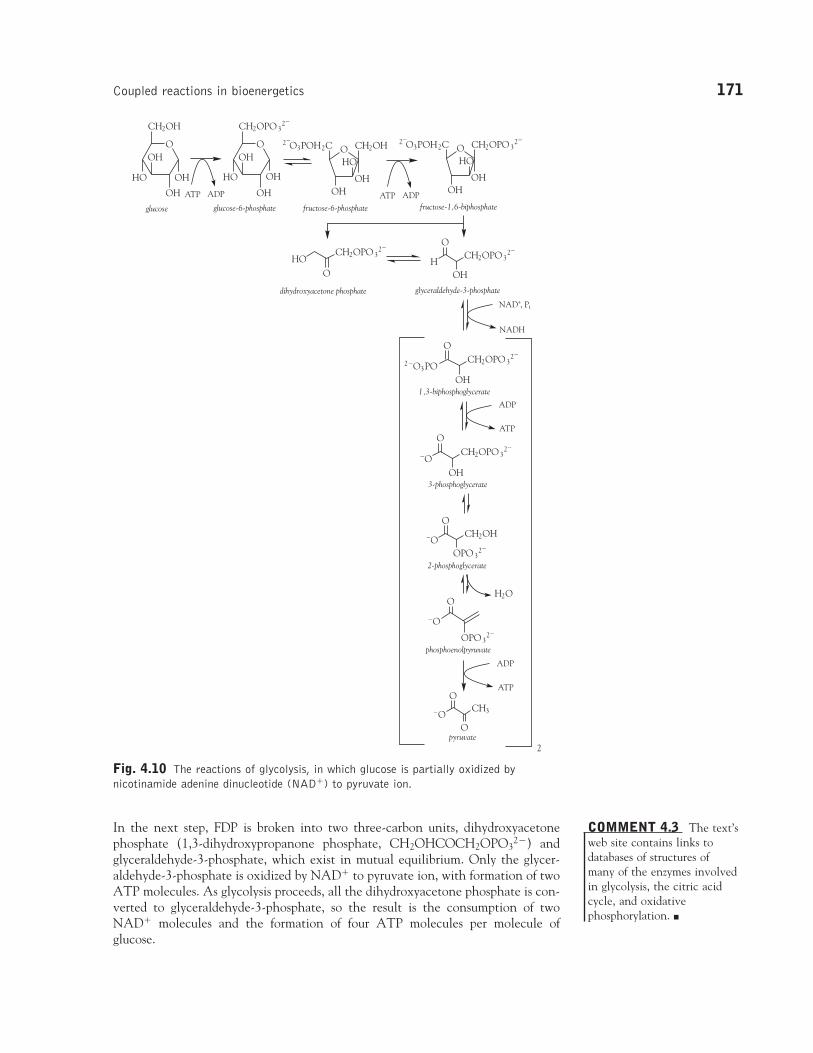
In the next step, FDP is broken into two three-carbon units, dihydroxyacetonephosphate (1,3-dihydroxypropanone phosphate, CH2OHCOCH2OPO3
2�) andglyceraldehyde-3-phosphate, which exist in mutual equilibrium. Only the glycer-aldehyde-3-phosphate is oxidized by NAD� to pyruvate ion, with formation of twoATP molecules. As glycolysis proceeds, all the dihydroxyacetone phosphate is con-verted to glyceraldehyde-3-phosphate, so the result is the consumption of twoNAD� molecules and the formation of four ATP molecules per molecule of glucose.
Coupled reactions in bioenergetics 171
COMMENT 4.3 The text’sweb site contains links todatabases of structures of many of the enzymes involvedin glycolysis, the citric acidcycle, and oxidativephosphorylation. �
O
CH2OH
OH
OH
OHHO
O
CH2OPO 32–
OH
OH
OHHO
O
OH
HO
OH
CH2OH2–O3POH2C O
OH
HO
OH
CH2OPO 32–2–
O3POH2C
HOCH2OPO 3
2–
OH
CH2OPO 32–
OH
O
–O32 PO
CH2OPO 32–
OH
O
OCH2OPO 3
2–
OH
O
O
OPO 32–
O
OCH3
O
O
H2O
OCH2OH
OPO 32–
O
ATP ADP ATP ADP
NAD+, Pi
NADH
ATP
ADP
ATP
ADP
glucose glucose-6-phosphate fructose-6-phosphate fructose-1,6-biphosphate
glyceraldehyde-3-phosphatedihydroxyacetone phosphate
1,3-biphosphoglycerate
3-phosphoglycerate
pyruvate
phosphoenolpyruvate
2-phosphoglycerate
2
–
–
–
–
Fig. 4.10 The reactions of glycolysis, in which glucose is partially oxidized bynicotinamide adenine dinucleotide (NAD�) to pyruvate ion.
The oxidation of glucose by NAD� to pyruvate ions has �rG� � �147 kJ mol�1
at blood temperature. In glycolysis, the oxidation of one glucose molecule is coupledto the net conversion of two ADP molecules to two ATP molecules (two ATP mole-cules are consumed and four are formed), so the net reaction of glycolysis is
glucose(aq) � 2 NAD�(aq) � 2 ADP(aq) � 2 Pi(aq) � 2 H2O(l) ˆ̂ l
2 CH3COCO2�(aq) � 2 NADH(aq) � 2 ATP(aq) � 2 H3O�(aq)
The biological standard reaction Gibbs energy is (�147) � 2(�31) kJ mol�1 ��85 kJ mol�1. The reaction is exergonic and therefore spontaneous under
172 Chapter 4 • Chemical Equilibrium
O N
N
NN
NH2
OHO
OP
OP
O
CH3
CH3
O
HN
O
NH
SO
CH3
PO
–OO–
O O–O O–
HO
H
H2C
OH OH
O
O P O P
O
H2C
N
NN
N
NH2
O
O–
O
O–
C
C
C
CH2
HHO
HHO
HHO
N
N
N
NH
O
O
H3C
H3C
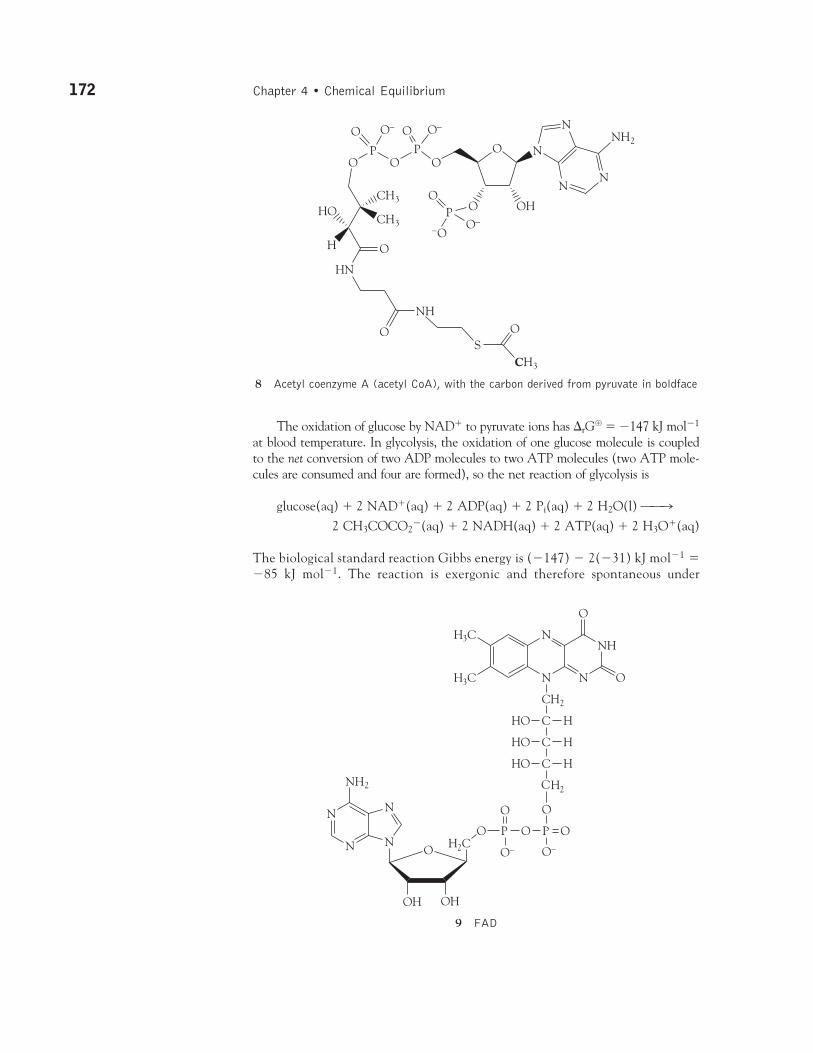
8 Acetyl coenzyme A (acetyl CoA), with the carbon derived from pyruvate in boldface
9 FAD
biological standard conditions: the oxidation of glucose is used to “recharge”the ATP.
In cells that are deprived of O2, pyruvate ion is reduced to lactate ion,CH3C(OH)CO2
�, by NADH.3 Very strenuous exercise, such as bicycle racing, candecrease sharply the concentration of O2 in muscle cells, and the condition knownas muscle fatigue results from increased concentrations of lactate ion.
The standard Gibbs energy of combustion of glucose is �2880 kJ mol�1, soterminating its oxidation at pyruvate is a poor use of resources, akin to the partialcombustion of hydrocarbon fuels in a badly tuned engine. In the presence of O2,pyruvate is oxidized further during the citric acid cycle and oxidative phosphory-lation, which occur in the mitochondria of cells.
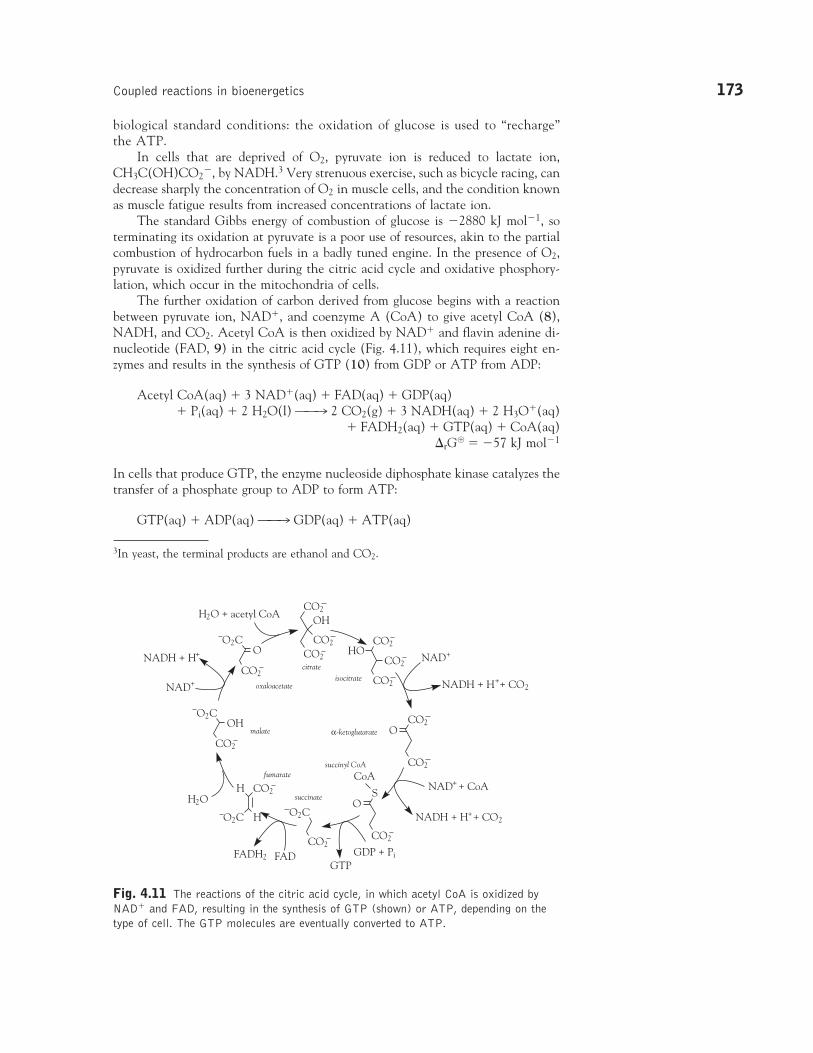
The further oxidation of carbon derived from glucose begins with a reactionbetween pyruvate ion, NAD�, and coenzyme A (CoA) to give acetyl CoA (8),NADH, and CO2. Acetyl CoA is then oxidized by NAD� and flavin adenine di-nucleotide (FAD, 9) in the citric acid cycle (Fig. 4.11), which requires eight en-zymes and results in the synthesis of GTP (10) from GDP or ATP from ADP:
Acetyl CoA(aq) � 3 NAD�(aq) � FAD(aq) � GDP(aq)� Pi(aq) � 2 H2O(l) ˆ̂ l 2 CO2(g) � 3 NADH(aq) � 2 H3O�(aq)
� FADH2(aq) � GTP(aq) � CoA(aq)�rG
� � �57 kJ mol�1
In cells that produce GTP, the enzyme nucleoside diphosphate kinase catalyzes thetransfer of a phosphate group to ADP to form ATP:
GTP(aq) � ADP(aq) ˆ̂ l GDP(aq) � ATP(aq)
Coupled reactions in bioenergetics 173
CO2
CO2
OH
CO2
CO2
CO2
CO2
HO
CO2
OCO2
CO2
OS
CoA
O2C
CO2
CO2H
HO2C
O2C
CO2
OH
CO2
O2CO
FAD
H2O
NAD+
NADH + H+ + CO2
NAD+ + CoA
NADH + H+ + CO2
GDP + PiGTP
FADH2
NAD+
NADH + H+
H2O + acetyl CoA
citrateisocitrate
α-ketoglutarate
succinyl CoA
succinate
fumarate
malate
oxaloacetate
Fig. 4.11 The reactions of the citric acid cycle, in which acetyl CoA is oxidized byNAD� and FAD, resulting in the synthesis of GTP (shown) or ATP, depending on thetype of cell. The GTP molecules are eventually converted to ATP.
3In yeast, the terminal products are ethanol and CO2.
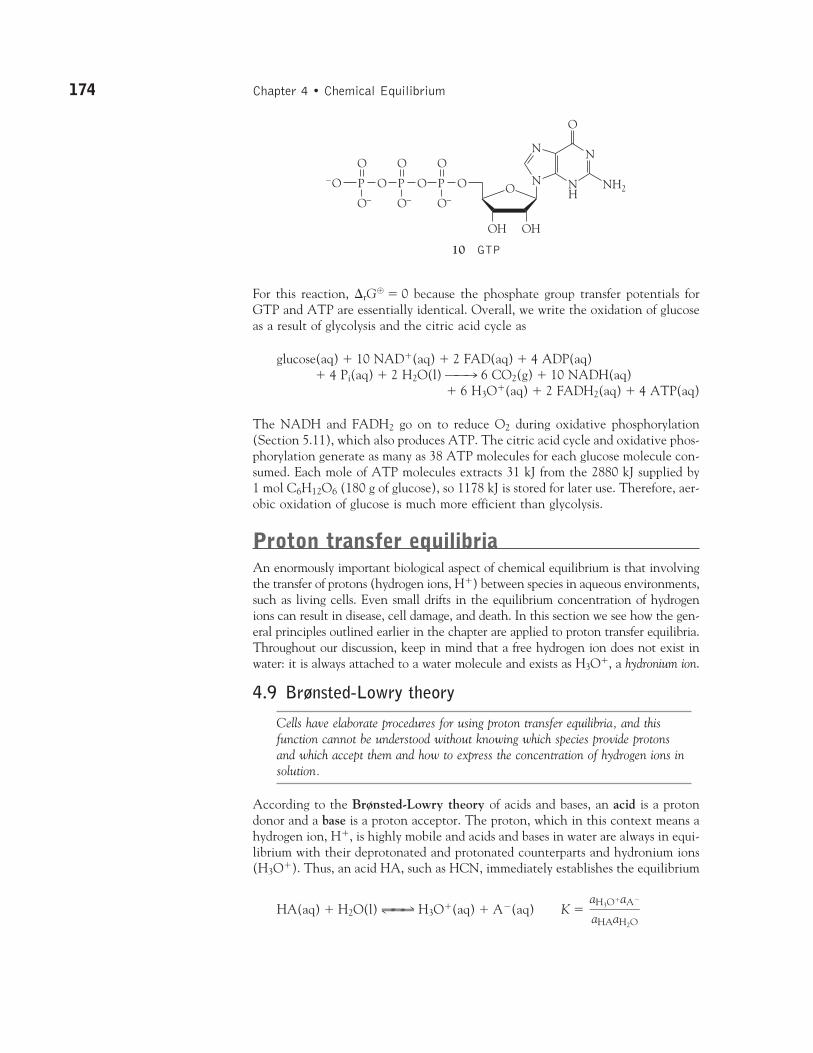
For this reaction, �rG� � 0 because the phosphate group transfer potentials for
GTP and ATP are essentially identical. Overall, we write the oxidation of glucoseas a result of glycolysis and the citric acid cycle as
glucose(aq) � 10 NAD�(aq) � 2 FAD(aq) � 4 ADP(aq)� 4 Pi(aq) � 2 H2O(l) ˆ̂ l 6 CO2(g) � 10 NADH(aq)
� 6 H3O�(aq) � 2 FADH2(aq) � 4 ATP(aq)
The NADH and FADH2 go on to reduce O2 during oxidative phosphorylation(Section 5.11), which also produces ATP. The citric acid cycle and oxidative phos-phorylation generate as many as 38 ATP molecules for each glucose molecule con-sumed. Each mole of ATP molecules extracts 31 kJ from the 2880 kJ supplied by1 mol C6H12O6 (180 g of glucose), so 1178 kJ is stored for later use. Therefore, aer-obic oxidation of glucose is much more efficient than glycolysis.
Proton transfer equilibriaAn enormously important biological aspect of chemical equilibrium is that involvingthe transfer of protons (hydrogen ions, H�) between species in aqueous environments,such as living cells. Even small drifts in the equilibrium concentration of hydrogenions can result in disease, cell damage, and death. In this section we see how the gen-eral principles outlined earlier in the chapter are applied to proton transfer equilibria.Throughout our discussion, keep in mind that a free hydrogen ion does not exist inwater: it is always attached to a water molecule and exists as H3O�, a hydronium ion.
4.9 Brønsted-Lowry theory
Cells have elaborate procedures for using proton transfer equilibria, and thisfunction cannot be understood without knowing which species provide protonsand which accept them and how to express the concentration of hydrogen ions insolution.
According to the Brønsted-Lowry theory of acids and bases, an acid is a protondonor and a base is a proton acceptor. The proton, which in this context means ahydrogen ion, H�, is highly mobile and acids and bases in water are always in equi-librium with their deprotonated and protonated counterparts and hydronium ions(H3O�). Thus, an acid HA, such as HCN, immediately establishes the equilibrium
HA(aq) � H2O(l) ˆ̂ 90̂ ˆ H3O�(aq) � A�(aq) K �aH3O�aA�
�aHAaH2O
174 Chapter 4 • Chemical Equilibrium
10 GTP
O
O
O
O–
P
O
O–
O–
N
NH
N
N
O
OHOH
OPO
O–
O
P NH2
Proton transfer equilibria 175
4Autoprotolysis is also called autoionization.
A base B, such as NH3, immediately establishes the equilibrium
B(aq) � H2O(l) ˆ̂ 90̂ ˆ BH�(aq) � OH�(aq) K �
In these equilibria, A� is the conjugate base of the acid HA, and BH� is the con-jugate acid of the base B. Even in the absence of added acids and bases, protontransfer occurs between water molecules, and the autoprotolysis equilibrium4
2 H2O(l) ˆ̂ 90̂ ˆ H3O�(aq) � OH�(aq) K �
is always present.As will be familiar from introductory chemistry, the hydronium ion concen-
tration is commonly expressed in terms of the pH, which is defined formally as
pH � �log aH3O� (4.16)
where the logarithm is to base 10. In elementary work, the hydronium ion activ-ity is replaced by the numerical value of its molar concentration, [H3O�], whichis equivalent to setting the activity coefficient � equal to 1. For example, if the mo-lar concentration of H3O� is 2.0 mmol L�1 (where 1 mmol � 10�3 mol), then
pH � �log(2.0 � 10�3) � 2.70
If the molar concentration were 10 times less, at 0.20 mmol L�1, then the pH wouldbe 3.70. Notice that the higher the pH, the lower the concentration of hydronium ionsin the solution and that a change in pH by 1 unit corresponds to a 10-fold changein their molar concentration. However, it should never be forgotten that the re-placement of activities by molar concentration is invariably hazardous. Because ionsinteract over long distances, the replacement is unreliable for all but the most di-lute solutions.
SELF-TEST 4.9 Death is likely if the pH of human blood plasma changes bymore than �0.4 from its normal value of 7.4. What is the approximate range ofmolar concentrations of hydrogen ions for which life can be sustained?
Answer: 16 nmol L�1 to 100 nmol L�1 (1 nmol � 10�9 mol)
4.10 Protonation and deprotonation
The protonation and deprotonation of molecules are key steps in manybiochemical reactions, and we need to be able to describe procedures for treatingprotonation and deprotonation processes quantitatively.
All the solutions we consider are so dilute that we can regard the water present asbeing a nearly pure liquid and therefore as having unit activity (see Table 3.3).
aH3O�aOH�
��a2
H2O
aBH�aOH�
�aBaH2O
When we set aH2O � 1 for all the solutions we consider, the resulting equilibriumconstant is called the acidity constant, Ka, of the acid HA:5
Ka � � �[H3O
[H
�
A][]A�]
� (4.17)
Data are widely reported in terms of the negative common (base 10) logarithm ofthis quantity:
pKa � �log Ka (4.18)
It follows from eqn 4.8 (�rG� � �RT ln K) that pKa is proportional to �rG�
for the proton transfer reaction. More explicitly, pKa � �rG�/(RT ln 10), with ln 10 � 2.303… . Therefore, manipulations of pKa and related quantities are ac-tually manipulations of standard reaction Gibbs energies in disguise.
SELF-TEST 4.10 Show that pKa � �rG�/(RT ln 10). Hint: ln x � ln 10 �log x.
The value of the acidity constant indicates the extent to which proton trans-fer occurs at equilibrium in aqueous solution. The smaller the value of Ka, and there-fore the larger the value of pKa, the lower is the concentration of deprotonatedmolecules. Most acids have Ka � 1 (and usually much less than 1), with pKa 0,indicating only a small extent of deprotonation in water. These acids are classifiedas weak acids. A few acids, most notably, in aqueous solution, HCl, HBr, HI, HNO3,H2SO4 and HClO4, are classified as strong acids and are commonly regarded as be-ing completely deprotonated in aqueous solution.6
The corresponding expression for a base is called the basicity constant, Kb:
Kb � � �[BH�
[]B[O]
H�]� pKb � �log Kb (4.19)
A strong base is fully protonated in solution in the sense that Kb 1. One exam-ple is the oxide ion, O2�, which cannot survive in water but is immediately andfully converted into its conjugate acid OH�. A weak base is not fully protonatedin water in the sense that Kb � 1 (and usually much less than 1). Ammonia, NH3,and its organic derivatives the amines are all weak bases in water, and only a smallproportion of their molecules exist as the conjugate acid (NH4
� or RNH3�).
The autoprotolysis constant for water, Kw, is
Kw � aH3O�aOH� (4.20)
At 25°C, the only temperature we consider in this chapter, Kw � 1.0 � 10�14 andpKw � �log Kw � 14.00. As may be confirmed by multiplying the two constantstogether, the acidity constant of the conjugate acid, BH�, and the basicity con-stant of a base B (the equilibrium constant for the reaction B � H2O 9̂0̂ BH� �OH�) are related by
KaKb � � � aH3O�aOH� � Kw (4.21a)
aBH�aOH�
��aB
aH3O�aB
�aBH�
aBH�aOH�
�aB
aH3O�aA�
�aHA
176 Chapter 4 • Chemical Equilibrium
5Acidity constants are also called acid ionization constants and, less appropriately,dissociation constants.6 Sulfuric acid, H2SO4, is strong with respect only to its first deprotonation; HSO4
� is weak.
The implication of this relation is that Ka increases as Kb decreases to maintain aproduct equal to the constant Kw. That is, as the strength of a base decreases, thestrength of its conjugate acid increases and vice versa. On taking the negative com-mon logarithm of both sides of eqn 4.21a, we obtain
pKa � pKb � pKw (4.21b)
The great advantage of this relation is that the pKb values of bases may be ex-pressed as the pKa of their conjugate acids, so the strengths of all weak acids andbases may be listed in a single table (Table 4.4). For example, if the acidity con-stant of the conjugate acid (CH3NH3
�) of the base methylamine (CH3NH2) isreported as pKa � 10.56, we can infer that the basicity constant of methylamineitself is
pKb � pKw � pKa � 14.00 � 10.56 � 3.44
Another useful relation is obtained by taking the negative common logarithm ofboth sides of the definition of Kw in eqn 4.20, which gives
pH � pOH � pKw (4.22)
where pOH � �log aOH�. This enormously important relation means that the ac-tivities (in elementary work, the molar concentrations) of hydronium and hydrox-ide ions are related by a seesaw relation: as one goes up, the other goes down topreserve the value of pKw.
SELF-TEST 4.11 The molar concentration of OH� ions in a certain solutionis 0.010 mmol L�1. What is the pH of the solution?
Answer: 9.00
The extent of deprotonation of a weak acid in solution depends on the acid-ity constant and the initial concentration of the acid, its concentration as prepared.The fraction deprotonated, the fraction of acid molecules HA that have donateda proton, is
Fraction deprotonated �
f � (4.23)
The extent to which a weak base B is protonated is reported in terms of the frac-tion protonated:
Fraction protonated �
f � (4.24)
The most precise way to estimate the pH of a solution of a weak acid is to con-sider the contributions from deprotonation of the acid and autoprotolysis of water
[BH�]equilibrium��
[B]as prepared
equilibrium molar concentration of conjugate acid������
molar concentration of base as prepared
[A�]equilibrium��[HA]as prepared
equilibrium molar concentration of conjugate base������
molar concentration of acid as prepared
Proton transfer equilibria 177
to the total concentration of hydronium ion in solution (see Further information4.1). Autoprotolysis may be ignored if the weak acid is the main contributor of hy-dronium ions, a condition that is satisfied if the acid is not very weak and is pres-ent at not too low a concentration. Then we can estimate the pH of a solution ofa weak acid and calculate either of these fractions by using the following strategy.
178 Chapter 4 • Chemical Equilibrium
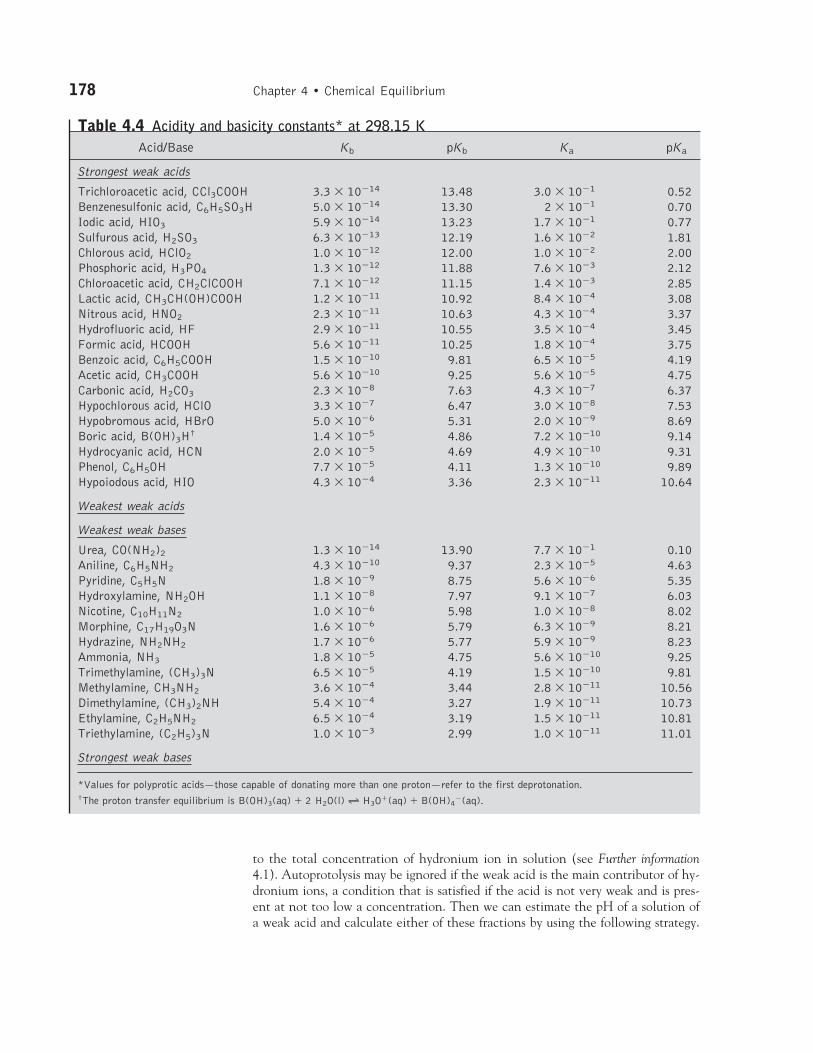
Table 4.4 Acidity and basicity constants* at 298.15 KAcid/Base Kb pKb Ka pKa
Strongest weak acids
Trichloroacetic acid, CCl3COOH 3.3 � 10�14 13.48 3.0 � 10�1 0.52Benzenesulfonic acid, C6H5SO3H 5.0 � 10�14 13.30 2 � 10�1 0.70Iodic acid, HIO3 5.9 � 10�14 13.23 1.7 � 10�1 0.77Sulfurous acid, H2SO3 6.3 � 10�13 12.19 1.6 � 10�2 1.81Chlorous acid, HClO2 1.0 � 10�12 12.00 1.0 � 10�2 2.00Phosphoric acid, H3PO4 1.3 � 10�12 11.88 7.6 � 10�3 2.12Chloroacetic acid, CH2ClCOOH 7.1 � 10�12 11.15 1.4 � 10�3 2.85Lactic acid, CH3CH(OH)COOH 1.2 � 10�11 10.92 8.4 � 10�4 3.08Nitrous acid, HNO2 2.3 � 10�11 10.63 4.3 � 10�4 3.37Hydrofluoric acid, HF 2.9 � 10�11 10.55 3.5 � 10�4 3.45Formic acid, HCOOH 5.6 � 10�11 10.25 1.8 � 10�4 3.75Benzoic acid, C6H5COOH 1.5 � 10�10 9.81 6.5 � 10�5 4.19Acetic acid, CH3COOH 5.6 � 10�10 9.25 5.6 � 10�5 4.75Carbonic acid, H2CO3 2.3 � 10�8 7.63 4.3 � 10�7 6.37Hypochlorous acid, HClO 3.3 � 10�7 6.47 3.0 � 10�8 7.53Hypobromous acid, HBrO 5.0 � 10�6 5.31 2.0 � 10�9 8.69Boric acid, B(OH)3H† 1.4 � 10�5 4.86 7.2 � 10�10 9.14Hydrocyanic acid, HCN 2.0 � 10�5 4.69 4.9 � 10�10 9.31Phenol, C6H5OH 7.7 � 10�5 4.11 1.3 � 10�10 9.89Hypoiodous acid, HIO 4.3 � 10�4 3.36 2.3 � 10�11 10.64
Weakest weak acids
Weakest weak bases
Urea, CO(NH2)2 1.3 � 10�14 13.90 7.7 � 10�1 0.10Aniline, C6H5NH2 4.3 � 10�10 9.37 2.3 � 10�5 4.63Pyridine, C5H5N 1.8 � 10�9 8.75 5.6 � 10�6 5.35Hydroxylamine, NH2OH 1.1 � 10�8 7.97 9.1 � 10�7 6.03Nicotine, C10H11N2 1.0 � 10�6 5.98 1.0 � 10�8 8.02Morphine, C17H19O3N 1.6 � 10�6 5.79 6.3 � 10�9 8.21Hydrazine, NH2NH2 1.7 � 10�6 5.77 5.9 � 10�9 8.23Ammonia, NH3 1.8 � 10�5 4.75 5.6 � 10�10 9.25Trimethylamine, (CH3)3N 6.5 � 10�5 4.19 1.5 � 10�10 9.81Methylamine, CH3NH2 3.6 � 10�4 3.44 2.8 � 10�11 10.56Dimethylamine, (CH3)2NH 5.4 � 10�4 3.27 1.9 � 10�11 10.73Ethylamine, C2H5NH2 6.5 � 10�4 3.19 1.5 � 10�11 10.81Triethylamine, (C2H5)3N 1.0 � 10�3 2.99 1.0 � 10�11 11.01
Strongest weak bases
*Values for polyprotic acids—those capable of donating more than one proton—refer to the first deprotonation.†The proton transfer equilibrium is B(OH)3(aq) � 2 H2O(l) 90 H3O�(aq) � B(OH)4
�(aq).
Proton transfer equilibria 179
We organize the necessary work into a table with columns headed by the speciesand, in successive rows:
1. The initial molar concentrations of the species, ignoring any contributions tothe concentration of H3O� or OH� from autoprotolysis of water
2. The changes in these quantities that must take place for the system to reachequilibrium
3. The resulting equilibrium values
Similar arguments apply to the estimation of the pH of a solution of a weak base.In most cases, we do not know the change that must occur for the system to reachequilibrium, so the change in the concentration is written as x and the reaction sto-ichiometry is used to write the corresponding changes in the other species. Whenthe values at equilibrium (the last row of the table) are substituted into the expres-sion for the equilibrium constant, we obtain an equation for x in terms of K. Thisequation can be solved for x, and hence the concentrations of all the species at equi-librium can be found. In general, solution of the equation for x results in severalmathematically possible values of x. We select the chemically acceptable solutionby considering the signs of the predicted concentrations: they must be positive.
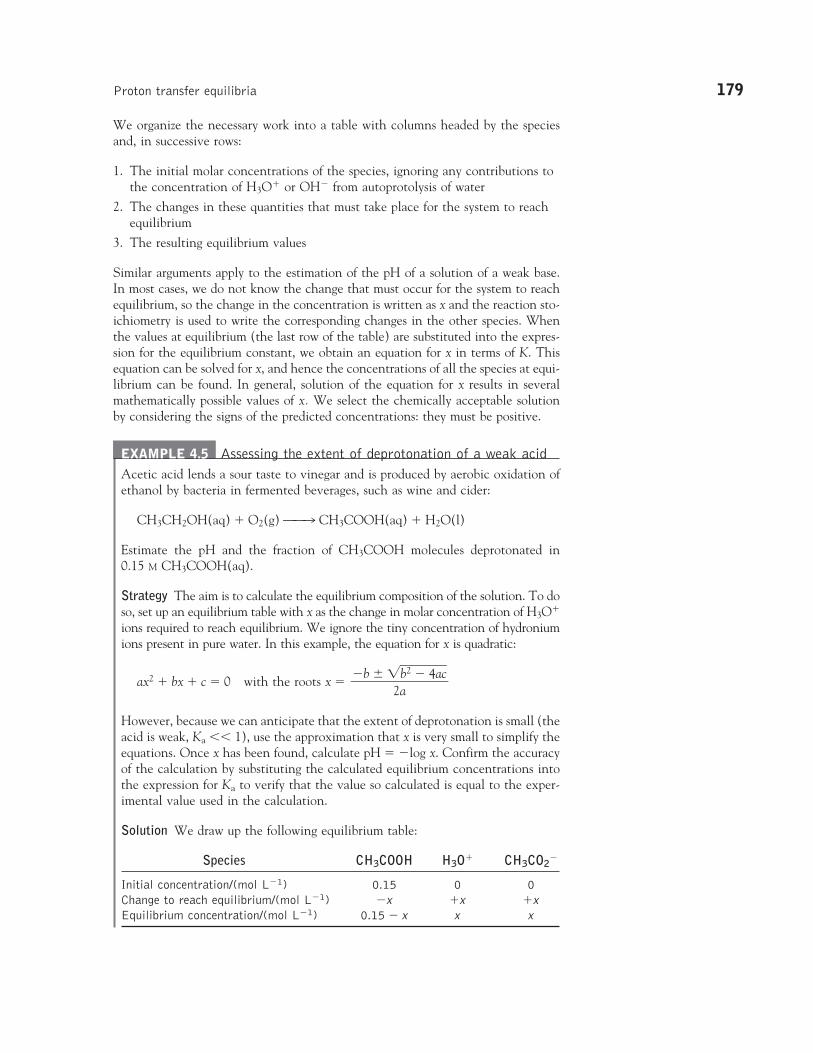
EXAMPLE 4.5 Assessing the extent of deprotonation of a weak acidAcetic acid lends a sour taste to vinegar and is produced by aerobic oxidation ofethanol by bacteria in fermented beverages, such as wine and cider:
CH3CH2OH(aq) � O2(g) ˆ̂ l CH3COOH(aq) � H2O(l)
Estimate the pH and the fraction of CH3COOH molecules deprotonated in 0.15 M CH3COOH(aq).
Strategy The aim is to calculate the equilibrium composition of the solution. To doso, set up an equilibrium table with x as the change in molar concentration of H3O�
ions required to reach equilibrium. We ignore the tiny concentration of hydroniumions present in pure water. In this example, the equation for x is quadratic:
ax2 � bx � c � 0 with the roots x �
However, because we can anticipate that the extent of deprotonation is small (theacid is weak, Ka �� 1), use the approximation that x is very small to simplify theequations. Once x has been found, calculate pH � �log x. Confirm the accuracyof the calculation by substituting the calculated equilibrium concentrations intothe expression for Ka to verify that the value so calculated is equal to the exper-imental value used in the calculation.
Solution We draw up the following equilibrium table:
Species CH3COOH H3O� CH3CO2�
Initial concentration/(mol L�1) 0.15 0 0Change to reach equilibrium/(mol L�1) �x �x �xEquilibrium concentration/(mol L�1) 0.15 � x x x
�b � �b2 � 4�ac���
2a
180 Chapter 4 • Chemical Equilibrium
N
11 Quinoline
The value of x is found by inserting the equilibrium concentrations into the ex-pression for the acidity constant:
Ka � �
We could arrange the expression into a quadratic equation. However, it is moreinstructive to make use of the smallness of x to replace 0.15 � x by 0.15 (this ap-proximation is valid if x �� 0.15). Then the simplified equation rearranges firstto 0.15 � Ka � x2 and then to
x � (0.15 � Ka)1/2 � (0.15 � 1.8 � 10�5)1/2 � 1.6 � 10�3
where we have used Ka � 1.8 � 10�5 (Table 4.4). Therefore, pH � 2.80. Calcu-lations of this kind are rarely accurate to more than one decimal place in the pH(and even that may be too optimistic) because the effects of ion-ion interactionshave been ignored, so this answer would be reported as pH � 2.8. The fractiondeprotonated, f, is
f � � � � 0.011
That is, only 1.1% of the acetic acid molecules have donated a proton.
A note on good practice: When an approximation has been made, verify at the endof the calculation that the approximation is consistent with the result obtained.In this case, we assumed that x �� 0.15 and have found that x � 1.6 � 10�3,which is consistent.
Another note on good practice: Acetic acid (ethanoic acid) is written CH3COOHbecause the two O atoms are inequivalent; its conjugate base, the acetate ion(ethanoate ion), is written CH3CO2
� because the two O atoms are now equiva-lent (by resonance).
SELF-TEST 4.12 Estimate the pH of 0.010 M CH3CH(OH)COOH(aq) (lac-tic acid) from the data in Table 4.4. Before carrying out the numerical calcula-tion, decide whether you expect the pH to be higher or lower than that calcu-lated for the same concentration of acetic acid.
Answer: 2.5 �
The calculation of the pH of a solution of a base involves an additional step.The first step is to calculate the concentration of OH� ions in the solution fromthe value of Kb by using the equilibrium-table technique and to express it as thepOH of the solution. The additional step is to convert that pOH into a pH by us-ing the water autoprotolysis equilibrium, eqn 4.22, in the form pH � pKw � pOH,with pKw � 14.00 at 25°C.
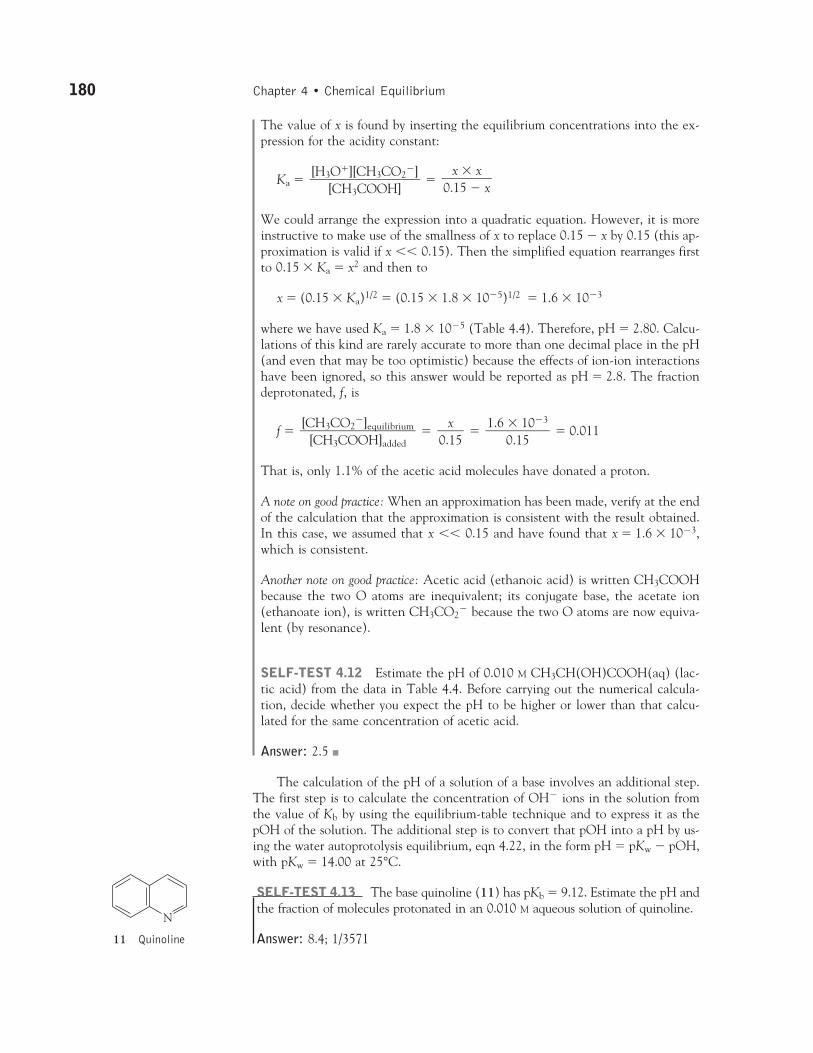
SELF-TEST 4.13 The base quinoline (11) has pKb � 9.12. Estimate the pH andthe fraction of molecules protonated in an 0.010 M aqueous solution of quinoline.
Answer: 8.4; 1/3571
1.6 � 10�3��
0.15x
�0.15
[CH3CO2�]equilibrium���
[CH3COOH]added
x � x�0.15 � x
[H3O�][CH3CO2�]
���[CH3COOH]
The ions present when a salt is added to water may themselves be either acidsor bases and consequently affect the pH of the solution. For example, when am-monium chloride is added to water, it provides both an acid (NH4
�) and a base(Cl�). The solution consists of a weak acid (NH4
�) and a very weak base (Cl�).The net effect is that the solution is acidic. Similarly, a solution of sodium acetateconsists of a neutral ion (the Na� ion) and a base (CH3CO2
�). The net effect isthat the solution is basic, and its pH is greater than 7.
To estimate the pH of the solution, we proceed in exactly the same way as forthe addition of a “conventional” acid or base, for in the Brønsted-Lowry theory,there is no distinction between “conventional” acids such as acetic acid and the conjugate acids of bases (such as NH4
�). For example, to calculate the pH of0.010 M NH4Cl(aq) at 25°C, we proceed exactly as in Example 4.5, taking the ini-tial concentration of the acid (NH4
�) to be 0.010 mol L�1. The Ka to use is theacidity constant of the acid NH4
�, which is listed in Table 4.4. Alternatively, weuse Kb for the conjugate base (NH3) of the acid and convert that quantity to Ka
by using eqn 4.21 (KaKb � Kw). We find pH � 5.63, which is on the acid side ofneutral. Exactly the same procedure is used to find the pH of a solution of a salt ofa weak acid, such as sodium acetate. The equilibrium table is set up by treating theanion CH3CO2
� as a base (which it is) and using for Kb the value obtained fromthe value of Ka for its conjugate acid (CH3COOH).
SELF-TEST 4.14 Estimate the pH of 0.0025 M NH(CH3)3Cl(aq) at 25°C.
Answer: 6.2
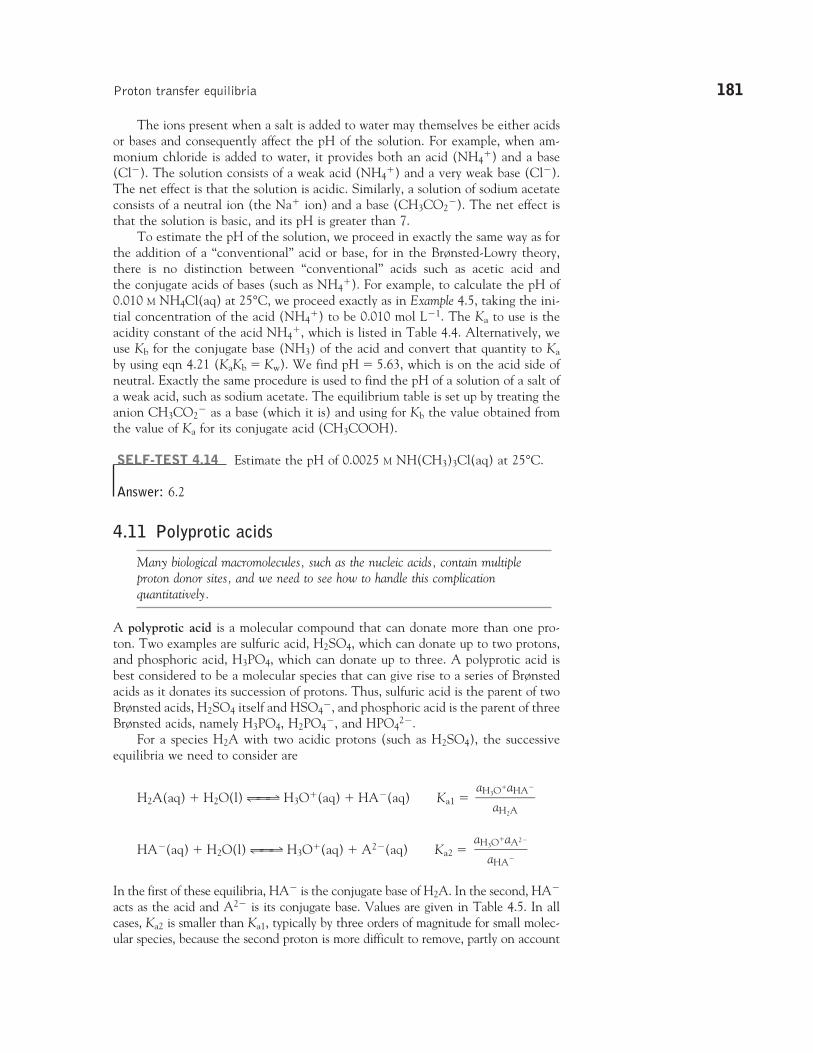
4.11 Polyprotic acids
Many biological macromolecules, such as the nucleic acids, contain multipleproton donor sites, and we need to see how to handle this complicationquantitatively.
A polyprotic acid is a molecular compound that can donate more than one pro-ton. Two examples are sulfuric acid, H2SO4, which can donate up to two protons,and phosphoric acid, H3PO4, which can donate up to three. A polyprotic acid isbest considered to be a molecular species that can give rise to a series of Brønstedacids as it donates its succession of protons. Thus, sulfuric acid is the parent of twoBrønsted acids, H2SO4 itself and HSO4
�, and phosphoric acid is the parent of threeBrønsted acids, namely H3PO4, H2PO4
�, and HPO42�.
For a species H2A with two acidic protons (such as H2SO4), the successiveequilibria we need to consider are
H2A(aq) � H2O(l) ˆ̂ 90̂ ˆ H3O�(aq) � HA�(aq) Ka1 �
HA�(aq) � H2O(l) ˆ̂ 90̂ ˆ H3O�(aq) � A2�(aq) Ka2 �
In the first of these equilibria, HA� is the conjugate base of H2A. In the second, HA�
acts as the acid and A2� is its conjugate base. Values are given in Table 4.5. In allcases, Ka2 is smaller than Ka1, typically by three orders of magnitude for small molec-ular species, because the second proton is more difficult to remove, partly on account
aH3O�aA2�
�aHA�
aH3O�aHA�
��aH2A
Proton transfer equilibria 181
182 Chapter 4 • Chemical Equilibrium
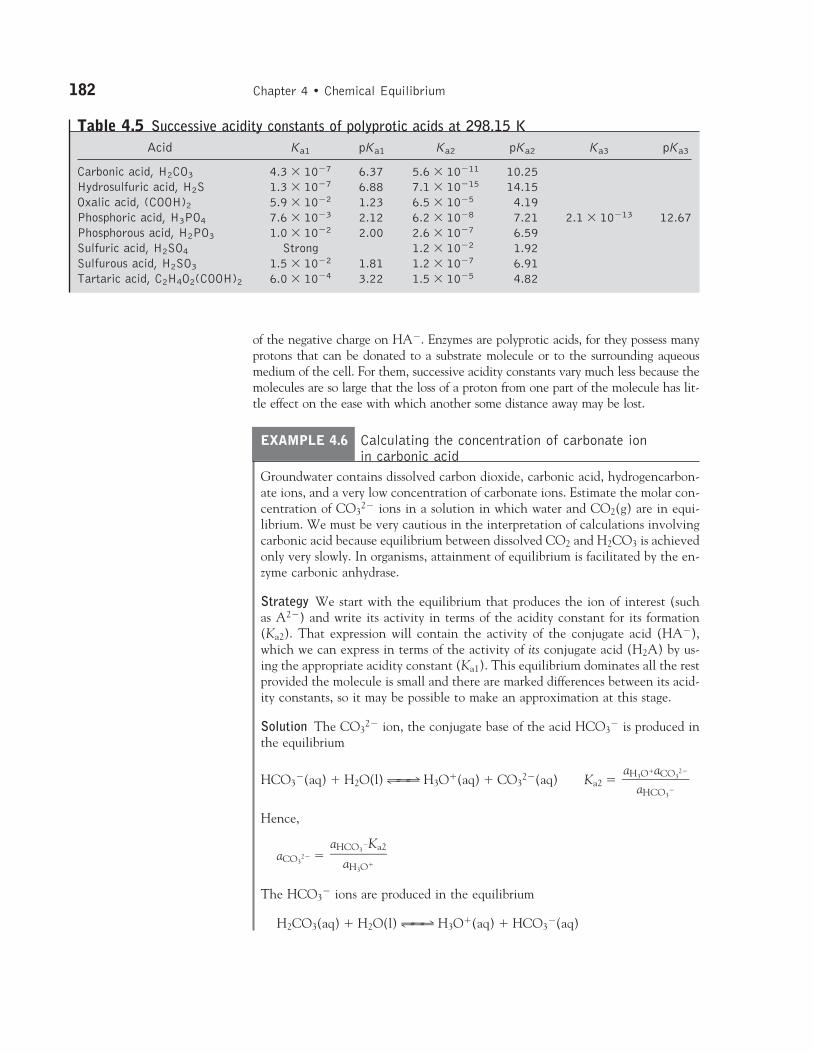
Table 4.5 Successive acidity constants of polyprotic acids at 298.15 KAcid Ka1 pKa1 Ka2 pKa2 Ka3 pKa3
Carbonic acid, H2CO3 4.3 � 10�7 6.37 5.6 � 10�11 10.25Hydrosulfuric acid, H2S 1.3 � 10�7 6.88 7.1 � 10�15 14.15Oxalic acid, (COOH)2 5.9 � 10�2 1.23 6.5 � 10�5 4.19Phosphoric acid, H3PO4 7.6 � 10�3 2.12 6.2 � 10�8 7.21 2.1 � 10�13 12.67Phosphorous acid, H2PO3 1.0 � 10�2 2.00 2.6 � 10�7 6.59Sulfuric acid, H2SO4 Strong 1.2 � 10�2 1.92Sulfurous acid, H2SO3 1.5 � 10�2 1.81 1.2 � 10�7 6.91Tartaric acid, C2H4O2(COOH)2 6.0 � 10�4 3.22 1.5 � 10�5 4.82
of the negative charge on HA�. Enzymes are polyprotic acids, for they possess manyprotons that can be donated to a substrate molecule or to the surrounding aqueousmedium of the cell. For them, successive acidity constants vary much less because themolecules are so large that the loss of a proton from one part of the molecule has lit-tle effect on the ease with which another some distance away may be lost.
EXAMPLE 4.6 Calculating the concentration of carbonate ion in carbonic acid
Groundwater contains dissolved carbon dioxide, carbonic acid, hydrogencarbon-ate ions, and a very low concentration of carbonate ions. Estimate the molar con-centration of CO3
2� ions in a solution in which water and CO2(g) are in equi-librium. We must be very cautious in the interpretation of calculations involvingcarbonic acid because equilibrium between dissolved CO2 and H2CO3 is achievedonly very slowly. In organisms, attainment of equilibrium is facilitated by the en-zyme carbonic anhydrase.
Strategy We start with the equilibrium that produces the ion of interest (suchas A2�) and write its activity in terms of the acidity constant for its formation(Ka2). That expression will contain the activity of the conjugate acid (HA�),which we can express in terms of the activity of its conjugate acid (H2A) by us-ing the appropriate acidity constant (Ka1). This equilibrium dominates all the restprovided the molecule is small and there are marked differences between its acid-ity constants, so it may be possible to make an approximation at this stage.
Solution The CO32� ion, the conjugate base of the acid HCO3
� is produced inthe equilibrium
HCO3�(aq) � H2O(l) ˆ̂ 90̂ ˆ H3O�(aq) � CO3
2�(aq) Ka2 �
Hence,
aCO32� �
The HCO3� ions are produced in the equilibrium
H2CO3(aq) � H2O(l) ˆ̂ 90̂ ˆ H3O�(aq) � HCO3�(aq)
aHCO3�Ka2
��aH3O�
aH3O�aCO32�
��aHCO3
�
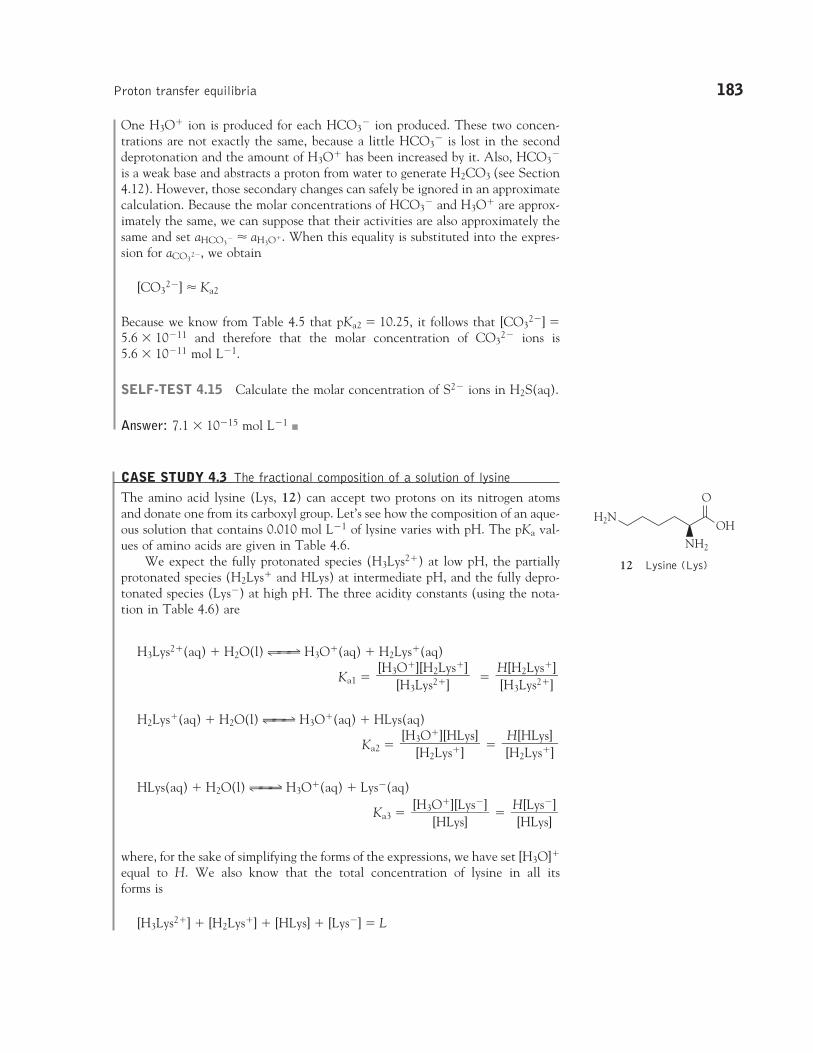
Proton transfer equilibria 183
H2N
NH2
O
OH
12 Lysine (Lys)
One H3O� ion is produced for each HCO3� ion produced. These two concen-
trations are not exactly the same, because a little HCO3� is lost in the second
deprotonation and the amount of H3O� has been increased by it. Also, HCO3�
is a weak base and abstracts a proton from water to generate H2CO3 (see Section4.12). However, those secondary changes can safely be ignored in an approximatecalculation. Because the molar concentrations of HCO3
� and H3O� are approx-imately the same, we can suppose that their activities are also approximately thesame and set aHCO3
� � aH3O�. When this equality is substituted into the expres-sion for aCO3
2�, we obtain
[CO32�] � Ka2
Because we know from Table 4.5 that pKa2 � 10.25, it follows that [CO32�] �
5.6 � 10�11 and therefore that the molar concentration of CO32� ions is
5.6 � 10�11 mol L�1.
SELF-TEST 4.15 Calculate the molar concentration of S2� ions in H2S(aq).
Answer: 7.1 � 10�15 mol L�1�
CASE STUDY 4.3 The fractional composition of a solution of lysine
The amino acid lysine (Lys, 12) can accept two protons on its nitrogen atomsand donate one from its carboxyl group. Let’s see how the composition of an aque-ous solution that contains 0.010 mol L�1 of lysine varies with pH. The pKa val-ues of amino acids are given in Table 4.6.
We expect the fully protonated species (H3Lys2�) at low pH, the partiallyprotonated species (H2Lys� and HLys) at intermediate pH, and the fully depro-tonated species (Lys�) at high pH. The three acidity constants (using the nota-tion in Table 4.6) are
H3Lys2�(aq) � H2O(l) ˆ̂ 90̂ ˆ H3O�(aq) � H2Lys�(aq)
Ka1 � �
H2Lys�(aq) � H2O(l) ˆ̂ 90̂ ˆ H3O�(aq) � HLys(aq)
Ka2 � �
HLys(aq) � H2O(l) ˆ̂ 90̂ ˆ H3O�(aq) � Lys�(aq)
Ka3 � �
where, for the sake of simplifying the forms of the expressions, we have set [H3O]�
equal to H. We also know that the total concentration of lysine in all its forms is
[H3Lys2�] � [H2Lys�] � [HLys] � [Lys�] � L
H[Lys�]�[HLys]
[H3O�][Lys�]��
[HLys]
H[HLys]��[H2Lys�]
[H3O�][HLys]��
[H2Lys�]
H[H2Lys�]��[H3Lys2�]
[H3O�][H2Lys�]��
[H3Lys2�]
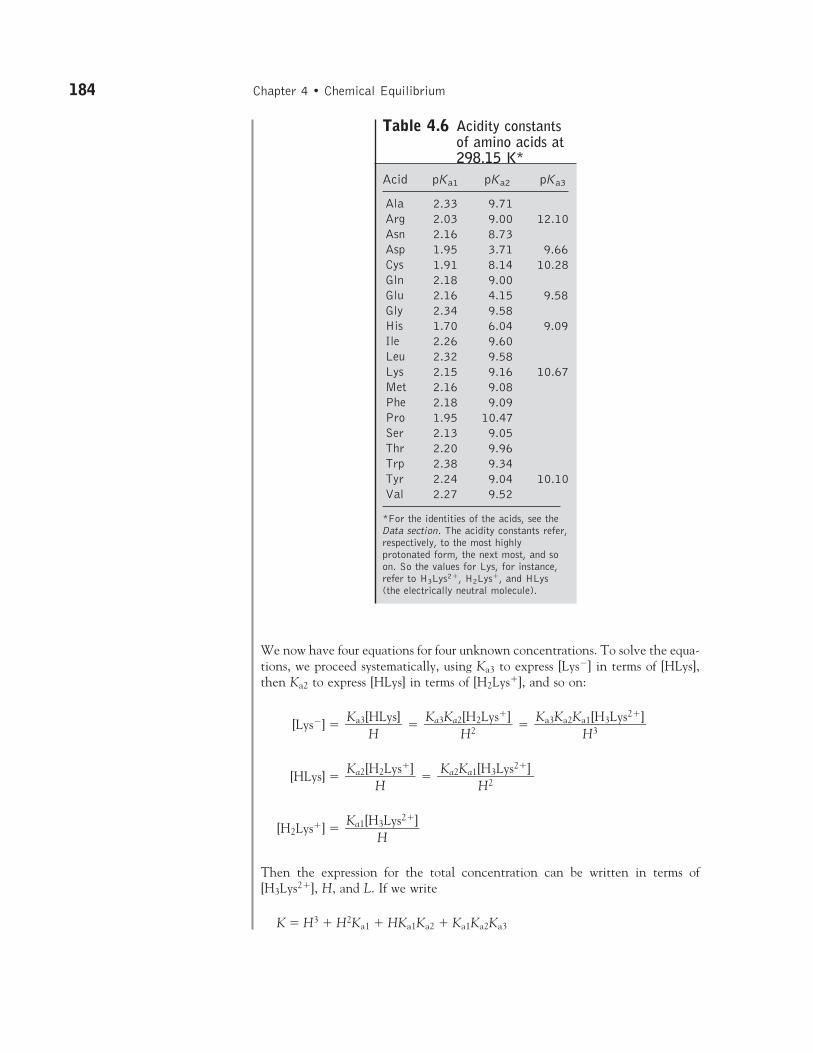
We now have four equations for four unknown concentrations. To solve the equa-tions, we proceed systematically, using Ka3 to express [Lys�] in terms of [HLys],then Ka2 to express [HLys] in terms of [H2Lys�], and so on:
[Lys�] � � �
[HLys] � �
[H2Lys�] �
Then the expression for the total concentration can be written in terms of[H3Lys2�], H, and L. If we write
K � H3 � H2Ka1 � HKa1Ka2 � Ka1Ka2Ka3
Ka1[H3Lys2�]��
H
Ka2Ka1[H3Lys2�]��
H2Ka2[H2Lys�]��
H
Ka3Ka2Ka1[H3Lys2�]���
H3Ka3Ka2[H2Lys�]��
H2Ka3[HLys]��
H
184 Chapter 4 • Chemical Equilibrium
Table 4.6 Acidity constantsof amino acids at298.15 K*
Acid pKa1 pKa2 pKa3
Ala 2.33 9.71Arg 2.03 9.00 12.10Asn 2.16 8.73Asp 1.95 3.71 9.66Cys 1.91 8.14 10.28Gln 2.18 9.00Glu 2.16 4.15 9.58Gly 2.34 9.58His 1.70 6.04 9.09Ile 2.26 9.60Leu 2.32 9.58Lys 2.15 9.16 10.67Met 2.16 9.08Phe 2.18 9.09Pro 1.95 10.47Ser 2.13 9.05Thr 2.20 9.96Trp 2.38 9.34Tyr 2.24 9.04 10.10Val 2.27 9.52
*For the identities of the acids, see theData section. The acidity constants refer,respectively, to the most highlyprotonated form, the next most, and soon. So the values for Lys, for instance,refer to H3Lys2�, H2Lys�, and HLys(the electrically neutral molecule).
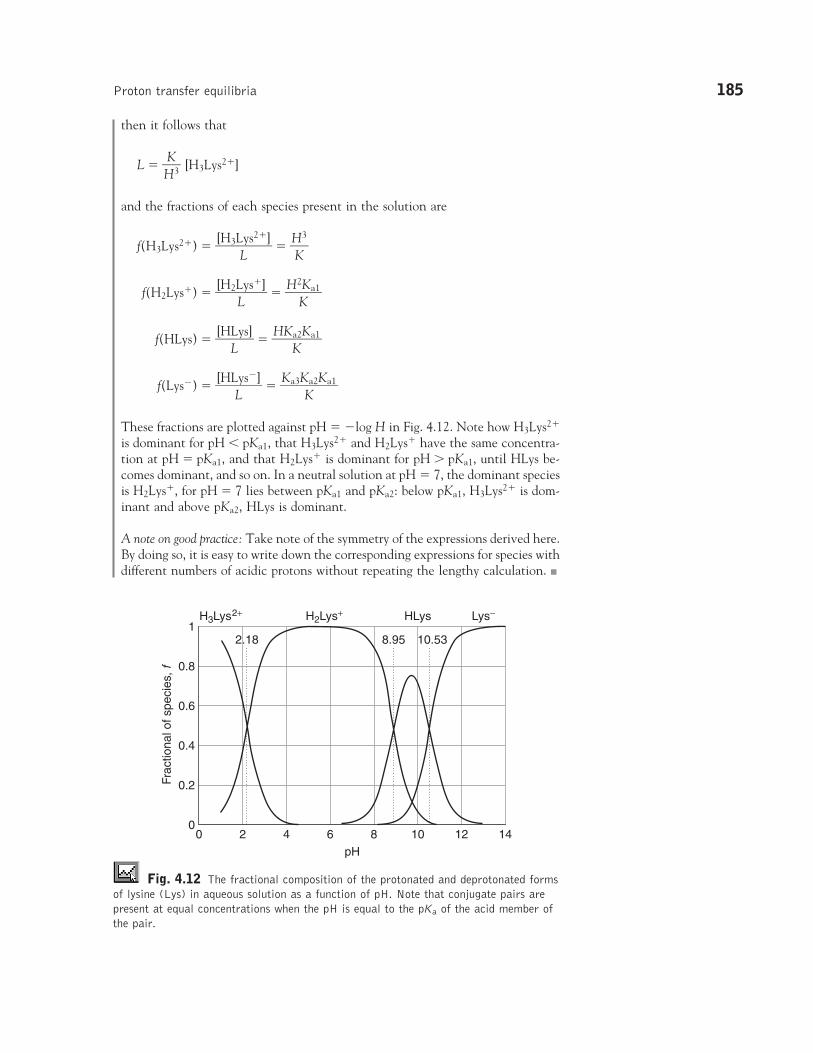
then it follows that
L � �HK
3� [H3Lys2�]
and the fractions of each species present in the solution are
f(H3Lys2�) � �[H3L
Lys2�]� � �
HK
3�
f(H2Lys�) � �[H2L
Lys�]� � �
H2
KKa1�
f(HLys) � �[H
LLys]� � �
HKKa2Ka1�
f(Lys�) � �[HL
Lys�]� � �
Ka3KKa2Ka1�
These fractions are plotted against pH � �log H in Fig. 4.12. Note how H3Lys2�
is dominant for pH � pKa1, that H3Lys2� and H2Lys� have the same concentra-tion at pH � pKa1, and that H2Lys� is dominant for pH pKa1, until HLys be-comes dominant, and so on. In a neutral solution at pH � 7, the dominant speciesis H2Lys�, for pH � 7 lies between pKa1 and pKa2: below pKa1, H3Lys2� is dom-inant and above pKa2, HLys is dominant.
A note on good practice: Take note of the symmetry of the expressions derived here.By doing so, it is easy to write down the corresponding expressions for species withdifferent numbers of acidic protons without repeating the lengthy calculation. �
Proton transfer equilibria 185
Frac
tiona
l of s
peci
es, f
0.2
0.4
0.6
0.8
1
pH6 8 10 12 1420 4
H3Lys2+ H2Lys+ Lys−HLys
2.18 8.95 10.53
0
Fig. 4.12 The fractional composition of the protonated and deprotonated formsof lysine (Lys) in aqueous solution as a function of pH. Note that conjugate pairs arepresent at equal concentrations when the pH is equal to the pKa of the acid member ofthe pair.
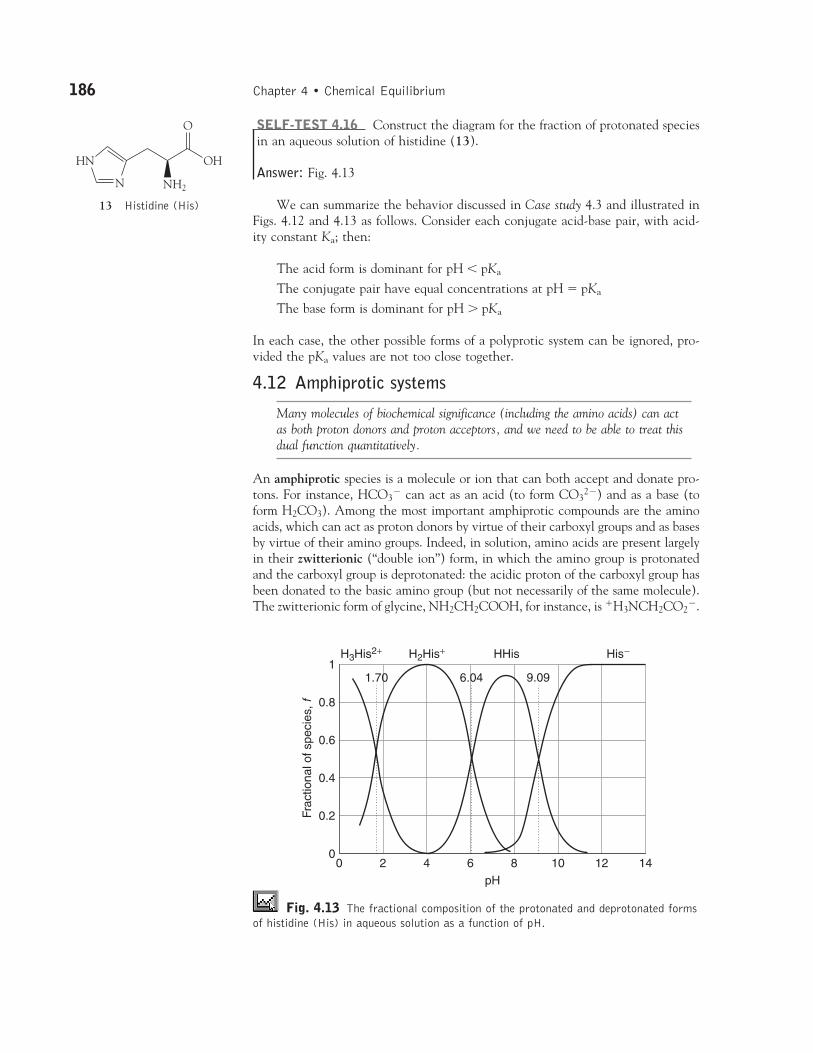
186 Chapter 4 • Chemical Equilibrium
N
HN OH
O
NH2
13 Histidine (His)
Frac
tiona
l of s
peci
es, f
0.2
0.4
0.6
0.8
1
0
pH6 8 10 12 1420 4
H3His2+ H2His+ His−HHis
1.70 6.04 9.09
Fig. 4.13 The fractional composition of the protonated and deprotonated formsof histidine (His) in aqueous solution as a function of pH.
SELF-TEST 4.16 Construct the diagram for the fraction of protonated speciesin an aqueous solution of histidine (13).
Answer: Fig. 4.13
We can summarize the behavior discussed in Case study 4.3 and illustrated inFigs. 4.12 and 4.13 as follows. Consider each conjugate acid-base pair, with acid-ity constant Ka; then:
The acid form is dominant for pH � pKa
The conjugate pair have equal concentrations at pH � pKa
The base form is dominant for pH pKa
In each case, the other possible forms of a polyprotic system can be ignored, pro-vided the pKa values are not too close together.
4.12 Amphiprotic systems
Many molecules of biochemical significance (including the amino acids) can actas both proton donors and proton acceptors, and we need to be able to treat thisdual function quantitatively.
An amphiprotic species is a molecule or ion that can both accept and donate pro-tons. For instance, HCO3
� can act as an acid (to form CO32�) and as a base (to
form H2CO3). Among the most important amphiprotic compounds are the aminoacids, which can act as proton donors by virtue of their carboxyl groups and as basesby virtue of their amino groups. Indeed, in solution, amino acids are present largelyin their zwitterionic (“double ion”) form, in which the amino group is protonatedand the carboxyl group is deprotonated: the acidic proton of the carboxyl group hasbeen donated to the basic amino group (but not necessarily of the same molecule).The zwitterionic form of glycine, NH2CH2COOH, for instance, is �H3NCH2CO2
�.
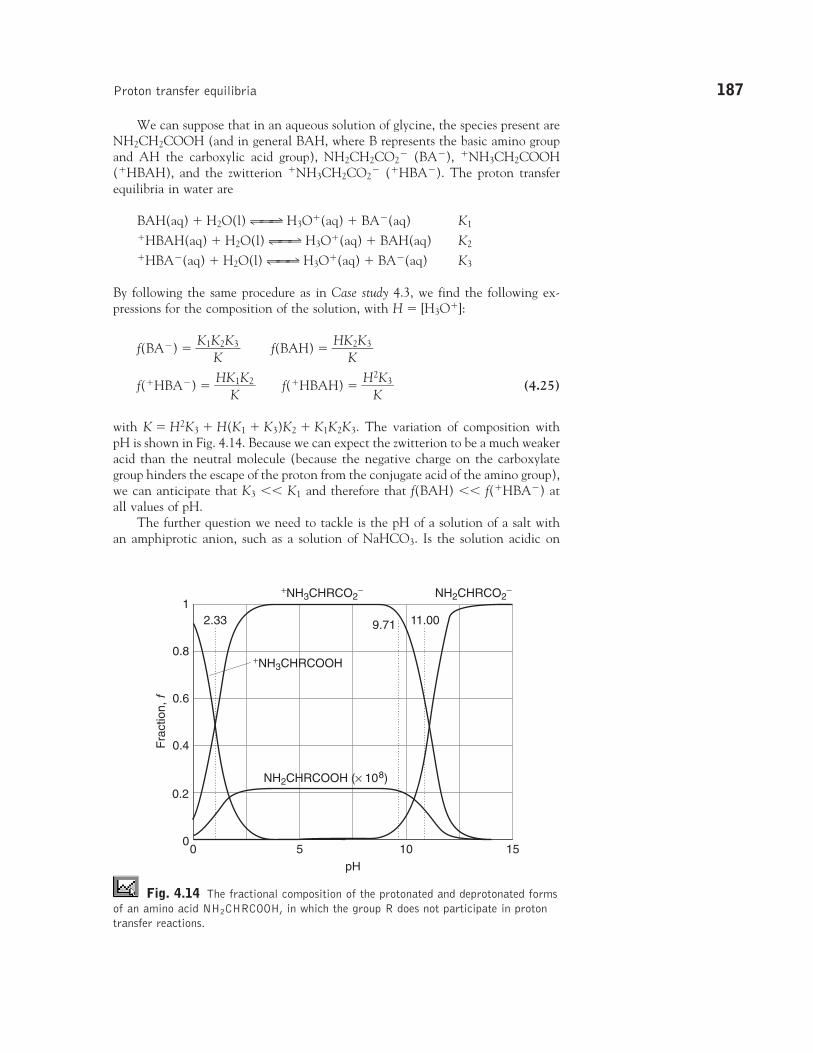
We can suppose that in an aqueous solution of glycine, the species present areNH2CH2COOH (and in general BAH, where B represents the basic amino groupand AH the carboxylic acid group), NH2CH2CO2
� (BA�), �NH3CH2COOH(�HBAH), and the zwitterion �NH3CH2CO2
� (�HBA�). The proton transferequilibria in water are
BAH(aq) � H2O(l) ˆ̂ 90̂ ˆ H3O�(aq) � BA�(aq) K1�HBAH(aq) � H2O(l) ˆ̂ 90̂ ˆ H3O�(aq) � BAH(aq) K2�HBA�(aq) � H2O(l) ˆ̂ 90̂ ˆ H3O�(aq) � BA�(aq) K3
By following the same procedure as in Case study 4.3, we find the following ex-pressions for the composition of the solution, with H � [H3O�]:
f(BA�) � �K1K
K2K3� f(BAH) � �
HKK2K3�
f(�HBA�) � �HK
K1K2� f(�HBAH) � �
HK
2K3� (4.25)
with K � H2K3 � H(K1 � K3)K2 � K1K2K3. The variation of composition withpH is shown in Fig. 4.14. Because we can expect the zwitterion to be a much weakeracid than the neutral molecule (because the negative charge on the carboxylategroup hinders the escape of the proton from the conjugate acid of the amino group),we can anticipate that K3 �� K1 and therefore that f(BAH) �� f(�HBA�) atall values of pH.
The further question we need to tackle is the pH of a solution of a salt withan amphiprotic anion, such as a solution of NaHCO3. Is the solution acidic on
Proton transfer equilibria 187
Fra
ctio
n, f
0.2
0.4
0.6
0.8
1
00 10
pH155
+NH3CHRCO2−
+NH3CHRCOOH
NH2CHRCO2−
NH2CHRCOOH (× 108)
2.33 9.71 11.00
Fig. 4.14 The fractional composition of the protonated and deprotonated formsof an amino acid NH2CHRCOOH, in which the group R does not participate in protontransfer reactions.
188 Chapter 4 • Chemical Equilibrium
account of the acid character of HCO3�, or is it basic on account of the anion’s
basic character? As we show in the following Derivation, the pH of such a solutionis given by
pH � 1⁄2(pKa1 � pKa2) (4.26)
DERIVATION 4.2 The pH of an amphiprotic salt solutionLet’s suppose that we make up a solution of the salt MHA, where HA� is theamphiprotic anion (such as HCO3
�) and M� is a cation (such as Na�). Toreach equilibrium, in which HA�, A2�, and H2A are all present, some HA�
(we write it x) is protonated to form H2A and some HA� (this we write y) de-protonates to form A2�. The equilibrium table is as follows:
Species H2A HA� A2� H3O�
Initial molar concentration/(mol L�1) 0 A 0 0Change to reach equilibrium/(mol L�1) �x �(x � y) �y �(y � x)Equilibrium concentration/(mol L�1) x A � x � y y y � x
The two acidity constants are
Ka1 ��[H3O
[H
�
2
][AH]A�]
��
Ka2 � �[H3
[OH
�
A][�
A]
2�]� � �
A(y
�
�
xx�
)yy
�
Multiplication of these two expressions, noting from the equilibrium table thatat equilibrium y � x is just [H3O�], gives
Ka1Ka2 � �(y �
xx)2y� � [H3O�]2 � �
yx
�
Next, we show that, to a good approximation, y/x � 1 and therefore that[H3O�] � (Ka1Ka2)1/2. For this step we expand Ka1 as follows:
xKa1 � Ay � y2 � Ax � x2
Because xKa1, x2, and y2 are all very small compared with terms that have A inthem, this expression reduces to
0 � Ay � Ax
We conclude that x � y and therefore that y/x � 1, as required. Equation 4.26now follows by taking the negative common logarithm of both sides of [H3O�] �(Ka1Ka2)1/2.
As an application of eqn 4.26, consider the pH of an aqueous solution of so-dium hydrogencarbonate. Using values from Table 4.5, we can immediately con-clude that the pH of the solution of any concentration is
pH � 1⁄2(6.37 � 10.25) � 8.31
(y � x)(A � x � y)���
x
Proton transfer equilibria 189
The solution is basic. We can treat a solution of potassium dihydrogenphosphatein the same way, taking into account only the second and third acidity constantsof H3PO4 because protonation as far as H3PO4 is negligible (see Table 4.5):
pH � 1⁄2(7.21 � 12.67) � 9.94
4.13 Buffer solutions
Cells cease to function and may be damaged irreparably if the pH changessignificantly, so we need to understand how the pH is stabilized by a buffer.
Suppose that we make an aqueous solution by dissolving known amounts of a weakacid and its conjugate base. To calculate the pH of this solution, we make use ofthe expression for Ka of the weak acid and write
Ka � �
which rearranges first to
aH3O� � �K[a
b[aasceid]]
�
and then, by taking negative common logarithms, to the Henderson-Hasselbalchequation:
pH � pKa � log �[[bacaisde]]
� (4.27)
When the concentrations of the conjugate acid and base are equal, the second termon the right of eqn 4.27 is log 1 � 0, so under these conditions pH � pKa.
ILLUSTRATION 4.3 Using the Henderson-Hasselbalch equationTo calculate the pH of a solution formed from equal amounts of CH3COOH(aq)and NaCH3CO2(aq), we note that the latter dissociates (in the sense of separat-ing into ions) fully in water, yielding the ions Na�(aq) and CH3CO2
�(aq), theconjugate base of CH3COOH(aq). The equilibrium of interest is
CH3COOH(aq) � H2O(l) ˆ̂ 90̂ ˆ H3O�(aq) � CH3CO2�(aq)
Ka �
Because the pKa of CH3COOH(aq) is 4.75 (Table 4.4), it follows from eqn 4.27that pH � 4.8 (more realistically, pH � 5). �
SELF-TEST 4.17 Calculate the pH of an aqueous buffer solution that containsequal amounts of NH3 and NH4Cl.
Answer: 9.25; more realistically: 9
[H3O�][CH3CO2�]
���[CH3COOH]
aH3O�[base]��
[acid]aH3O�abase��
aacid
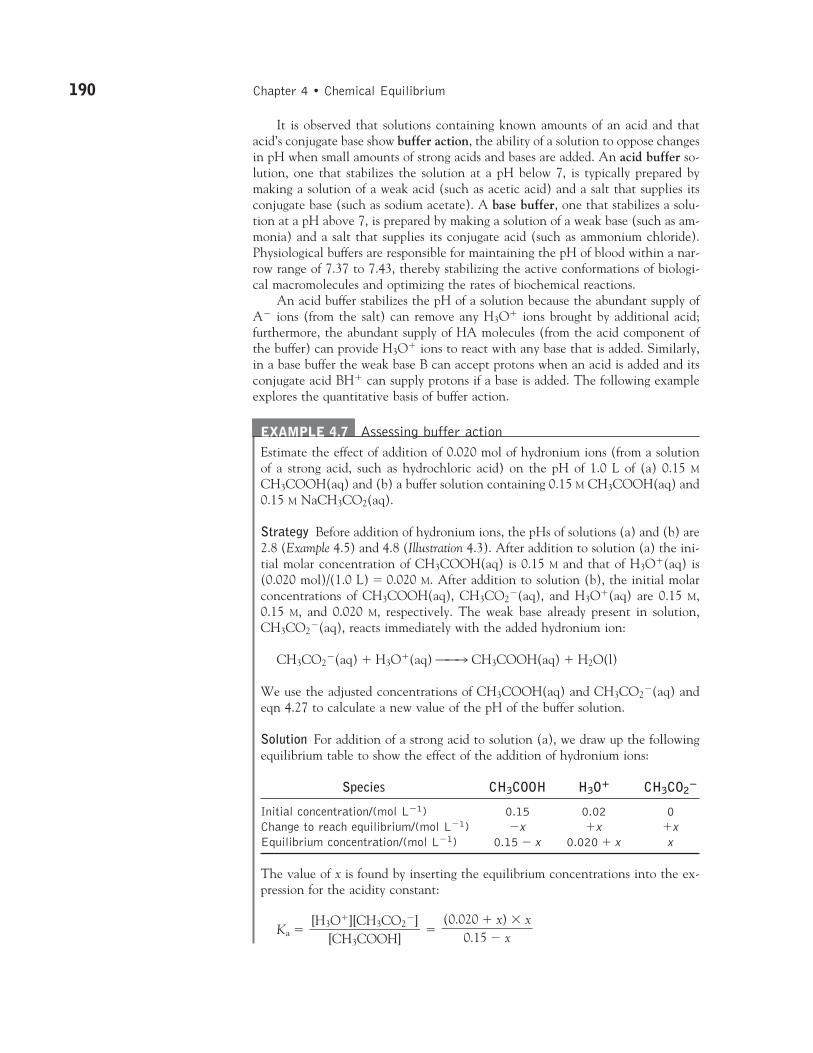
190 Chapter 4 • Chemical Equilibrium
It is observed that solutions containing known amounts of an acid and thatacid’s conjugate base show buffer action, the ability of a solution to oppose changesin pH when small amounts of strong acids and bases are added. An acid buffer so-lution, one that stabilizes the solution at a pH below 7, is typically prepared bymaking a solution of a weak acid (such as acetic acid) and a salt that supplies itsconjugate base (such as sodium acetate). A base buffer, one that stabilizes a solu-tion at a pH above 7, is prepared by making a solution of a weak base (such as am-monia) and a salt that supplies its conjugate acid (such as ammonium chloride).Physiological buffers are responsible for maintaining the pH of blood within a nar-row range of 7.37 to 7.43, thereby stabilizing the active conformations of biologi-cal macromolecules and optimizing the rates of biochemical reactions.
An acid buffer stabilizes the pH of a solution because the abundant supply ofA� ions (from the salt) can remove any H3O� ions brought by additional acid;furthermore, the abundant supply of HA molecules (from the acid component ofthe buffer) can provide H3O� ions to react with any base that is added. Similarly,in a base buffer the weak base B can accept protons when an acid is added and itsconjugate acid BH� can supply protons if a base is added. The following exampleexplores the quantitative basis of buffer action.
EXAMPLE 4.7 Assessing buffer actionEstimate the effect of addition of 0.020 mol of hydronium ions (from a solutionof a strong acid, such as hydrochloric acid) on the pH of 1.0 L of (a) 0.15 M
CH3COOH(aq) and (b) a buffer solution containing 0.15 M CH3COOH(aq) and0.15 M NaCH3CO2(aq).
Strategy Before addition of hydronium ions, the pHs of solutions (a) and (b) are2.8 (Example 4.5) and 4.8 (Illustration 4.3). After addition to solution (a) the ini-tial molar concentration of CH3COOH(aq) is 0.15 M and that of H3O�(aq) is(0.020 mol)/(1.0 L) � 0.020 M. After addition to solution (b), the initial molarconcentrations of CH3COOH(aq), CH3CO2
�(aq), and H3O�(aq) are 0.15 M,0.15 M, and 0.020 M, respectively. The weak base already present in solution,CH3CO2
�(aq), reacts immediately with the added hydronium ion:
CH3CO2�(aq) � H3O�(aq) ˆ̂ l CH3COOH(aq) � H2O(l)
We use the adjusted concentrations of CH3COOH(aq) and CH3CO2�(aq) and
eqn 4.27 to calculate a new value of the pH of the buffer solution.
Solution For addition of a strong acid to solution (a), we draw up the followingequilibrium table to show the effect of the addition of hydronium ions:
Species CH3COOH H3O� CH3CO2�
Initial concentration/(mol L�1) 0.15 0.02 0Change to reach equilibrium/(mol L�1) �x �x �xEquilibrium concentration/(mol L�1) 0.15 � x 0.020 � x x
The value of x is found by inserting the equilibrium concentrations into the ex-pression for the acidity constant:
Ka � �(0.020 � x) � x��
0.15 � x[H3O�][CH3CO2
�]���
[CH3COOH]
Proton transfer equilibria 191
As in Example 4.5, we assume that x is very small; in this case x �� 0.020, andwrite
Ka �
Then
x � (0.15/0.020) � Ka � 7.5 � 1.8 � 10�5 � 1.4 � 10 �4
We see that our approximation is valid and, therefore, [H3O�] � 0.020 � x �0.020 and pH � 1.7. It follows that the pH of the unbuffered solution (a) changesdramatically from 4.8 to 1.7 upon addition of 0.020 M H3O�(aq).
Now we consider the addition of 0.020 M H3O�(aq) to solution (b). Reactionbetween the strong acid and weak base consumes the added hydronium ions andchanges the concentration of CH3CO2
�(aq) to 0.13 M and the concentration ofCH3COOH(aq) to 0.17 M. It follows from eqn 4.27 that
pH � pKa � log � 4.75 � log � 4.6
The pH of the buffer solution (b) changes only slightly from 4.8 to 4.6 upon ad-dition of 0.020 M H3O�(aq).
SELF-TEST 4.18 Estimate the change in pH of solution (b) from Example 4.7after addition of 0.020 mol of OH�(aq).
Answer: 4.9 �
CASE STUDY 4.4 Buffer action in blood
The pH of blood in a healthy human being varies from 7.37 to 7.43. There aretwo buffer systems that help maintain the pH of blood relatively constant: onearising from a carbonic acid/bicarbonate (hydrogencarbonate) ion equilibrium andanother involving protonated and deprotonated forms of hemoglobin, the proteinresponsible for the transport of O2 in blood (Case study 4.1).
Carbonic acid forms in blood from the reaction between water and CO2
gas, which comes from inhaled air and is also a by-product of metabolism (Section 4.8):
CO2(g) � H2O(l) ˆ̂ 90̂ ˆ H2CO3(aq)
In red blood cells, this reaction is catalyzed by the enzyme carbonic anhydrase.Aqueous carbonic acid then deprotonates to form bicarbonate (hydrogencarbon-ate) ion:
H2CO3(aq) ˆ̂ 90̂ ˆ H�(aq) � HCO3�(aq)
The fact that the pH of normal blood is approximately 7.4 implies that[HCO3
�]/[H2CO3] � 20. The body’s control of the pH of blood is an example ofhomeostasis, the ability of an organism to counteract environmental changes with
0.17�0.13
[CH3COOH]��[CH3CO2
�]
0.020 � x��
0.15
Checklist of Key IdeasYou should now be familiar with the following concepts:
� 1. The reaction Gibbs energy, �rG, is the slope of aplot of Gibbs energy against composition.
� 2. The condition of chemical equilibrium atconstant temperature and pressure is �rG � 0.
� 3. The reaction Gibbs energy is related to thecomposition by �rG � �rG� � RT ln Q, where Q isthe reaction quotient.
� 4. The standard reaction Gibbs energy is thedifference of the standard Gibbs energies offormation of the products and reactants weighted by
the stoichiometric coefficients in the chemicalequation �rG� � ���fG�(products) �
���fG�(reactants).
� 5. The equilibrium constant is the value of thereaction quotient at equilibrium; it is related to thestandard Gibbs energy of reaction by �rG� ��RT ln K.
� 6. A compound is thermodynamically stable withrespect to its elements if �fG� � 0.
� 7. The equilibrium constant of a reaction isindependent of the presence of a catalyst.
physiological responses. For instance, the concentration of carbonic acid can becontrolled by respiration: exhaling air depletes the system of CO2(g) andH2CO3(aq) so the pH of blood rises when air is exhaled. Conversely, inhalationincreases the concentration of carbonic acid in blood and lowers its pH. The kid-neys also play a role in the control of the concentration of hydronium ions. There,ammonia formed by the release of nitrogen from some amino acids (such as glu-tamine) combines with excess hydronium ions and the ammonium ion is excretedthrough urine.
The condition known as alkalosis occurs when the pH of blood rises aboveabout 7.45. Respiratory alkalosis is caused by hyperventilation, or excessive respi-ration. The simplest remedy consists of breathing into a paper bag in order to in-crease the levels of inhaled CO2. Metabolic alkalosis may result from illness, poi-soning, repeated vomiting, and overuse of diuretics. The body may compensatefor the increase in the pH of blood by decreasing the rate of respiration.
Acidosis occurs when the pH of blood falls below about 7.35. In respiratoryacidosis, impaired respiration increases the concentration of dissolved CO2 andlowers the blood’s pH. The condition is common in victims of smoke inhalationand patients with asthma, pneumonia, and emphysema. The most efficient treat-ment consists of placing the patient in a ventilator. Metabolic acidosis is caused bythe release of large amounts of lactic acid or other acidic by-products of metabo-lism (Section 4.8), which react with bicarbonate ion to form carbonic acid, thuslowering the blood’s pH. The condition is common in patients with diabetes andsevere burns.
The concentration of hydronium ion in blood is also controlled by hemo-globin, which can exist in deprotonated (basic) or protonated (acidic) forms, de-pending on the state of protonation of several histidines (13) on the protein’s sur-face (see Fig. 4.13 for a diagram of the fraction of protonated species in an aqueoussolution of histidine). The carbonic acid/bicarbonate ion equilibrium and protonequilibria in hemoglobin also regulate the oxygenation of blood. The key to thisregulatory mechanism is the Bohr effect, the observation that hemoglobin bindsO2 strongly when it is deprotonated and releases O2 when it is protonated. It fol-lows that when dissolved CO2 levels are high and the pH of blood falls slightly,hemoglobin becomes protonated and releases bound O2 to tissue. Conversely,when CO2 is exhaled and the pH rises slightly, hemoglobin becomes deproton-ated and binds O2. �
192 Chapter 4 • Chemical Equilibrium
Further information 4.1 193
Further information 4.1 The complete expression for the pH of a solution of a weak acid
Some acids are so weak and undergo so little deproto-nation that the autoprotolysis of water can contributesignificantly to the pH. We must also take autoprotoly-sis into account when we find by using the proceduresin Example 4.5 that the pH of a solution of a weak acidis greater than 6.
We begin the calculation by noting that, apart fromwater, there are four species in solution, HA, A�, H3O�,and OH�. Because there are four unknown quantities,we need four equations to solve the problem. Two of theequations are the expressions for Ka and Kw (eqns 4.17and 4.20), written here in terms of molar concentrations:
Ka � �[H3O
[H
�
A][]A�]
� (4.28)
Kw � [H3O�][OH�] (4.29)
A third equation takes charge balance, the requirementthat the solution be electrically neutral, into account.That is, the sum of the concentrations of the cationsmust be equal to the sum of the concentrations of theanions. In our case, the charge balance equation is
[H3O�] � [OH�] � [A�] (4.30)
We also know that the total concentration of A groupsin all forms in which they occur, which we denote as A,
must be equal to the initial concentration of the weakacid. This condition, known as material balance, givesour final equation:
A � [HA] � [A�] (4.31)
Now we are ready to proceed with a calculation of thehydronium ion concentration in the solution. First, wecombine eqns 4.29 and 4.31 and write
[A�] � [H3O�] � �[H
K
3Ow
�]� (4.32)
We continue by substituting this expression into eqn4.31 and solving for [HA]:
[HA] � A � [H3O�] � �[H
K
3Ow
�]� (4.33)
Upon substituting the expressions for [A�] (eqn 4.32)and HA (eqn 4.33) into eqn 4.28, we obtain
Ka �
[H3O�]�[H3O�] � �[H
K
3Ow
�]��
A � [H3O�] � �[H
K
3Ow
�]� (4.34)
� 8. The variation of an equilibrium constant withtemperature is expressed by the van ’t Hoffequation, ln K � ln K � (�rH�/R){(1/T) � (1/T)}.
� 9. The equilibrium constant K increases withtemperature if �rH� 0 (an endothermic reaction)and decreases if �rH� � 0 (an exothermic reaction).
� 10. An endergonic reaction has a positive Gibbsenergy; an exergonic reaction has a negative Gibbsenergy.
� 11. The biological standard state corresponds topH � 7; the biological and thermodynamic standardreaction Gibbs energies of the reaction Reactants �� H3O�(aq) l̂ products are related by �rG
� ��rG� � 7�RT ln 10.
� 12. An endergonic reaction may be driven forwardby coupling it to an exergonic reaction.
� 13. The strength of an acid HA is reported interms of its acidity constant, Ka � aH3O�aA�/aHA,
and that of a base B in terms of its basicityconstant, Kb � aBH�aOH�/aB.
� 14. The autoprotolysis constant of water is Kw � aH3O�aOH�; this relation implies that pH � pOH � pKw.
� 15. The basicity constant of a base is related to theacidity constant of its conjugate acid by KaKb � Kw
(or pKa � pKb � pKw).
� 16. The acid form of a species is dominant if pH �pKa, and the base form is dominant if pH pKa.
� 17. The pH of the solution of an amphiprotic saltis pH � 1⁄2(pKa1 � pKa2).
� 18. The pH of a mixed solution of a weak acid andits conjugate base is given by the Henderson-Hasselbalch equation, pH � pKa � log([acid]/[base]).
� 19. The pH of a buffer solution containing equalconcentrations of a weak acid and its conjugate baseis pH � pKa.
194 Chapter 4 • Chemical Equilibrium
Discussion questions4.1 Explain how the mixing of reactants and
products affects the position of chemicalequilibrium.
4.2 Explain how a reaction that is not spontaneousmay be driven forward by coupling to a spontaneousreaction.
4.3 At blood temperature, �rG� � �218 kJ mol�1 and
�rH� � �120 kJ mol�1 for the production of
lactate ion during glycolysis. Provide a molecularinterpretation for the observation that the reactionis more exergonic than it is exothermic.
4.4 Explain Le Chatelier’s principle in terms ofthermodynamic quantities.
4.5 Describe the basis of buffer action.
4.6 State the limits to the generality of the followingexpressions: (a) pH � 1⁄2(pKa1 � pKa2), (b) pH � pKa � log([acid]/[base]), and (c) the van ’t Hoff equation, written as
ln K � ln K � � � �1�T
1�T
�rH�
�R
Exercises4.7 Write the expressions for the equilibrium
constants for the following reactions, making theapproximation of replacing activities by molarconcentrations or partial pressures:
(a) G6P(aq) � H2O(l) 9̂0̂ G(aq) � Pi(aq),where G6P is glucose-6-phosphate, G is glucose,and Pi is inorganic phosphate.
(b) Gly(aq) � Ala(aq) 9̂0̂ Gly–Ala(aq) �H2O(l)
(c) Mg2�(aq) � ATP4�(aq) 9̂0̂ MgATP2�(aq)
(d) 2 CH3COCOOH(aq) � 5 O2(g) 9̂0̂6 CO2(g) � 4 H2O(l)
4.8 The equilibrium constant for the reaction A � B9̂0̂ 2 C is reported as 3.4 � 104. What would it
be for the reaction written as (a) 2 C 9̂0̂ A � B,(b) 2 A � 2 B 9̂0̂ 4 C, (c) 1⁄2 A � 1⁄2 B 9̂0̂ C?
4.9 The equilibrium constant for the hydrolysis ofthe dipeptide alanylglycine by a peptidaseenzyme is K � 8.1 � 102 at 310 K. Calculate thestandard reaction Gibbs energy for the hydrolysis.
4.10 One enzyme-catalyzed reaction in a biochemicalcycle has an equilibrium constant that is 10 timesthe equilibrium constant of a second reaction. Ifthe standard Gibbs energy of the former reactionis �300 kJ mol�1, what is the standard reactionGibbs energy of the second reaction?
4.11 What is the value of the equilibrium constant ofa reaction for which �rG� � 0?
Rearrangement of this expression gives
[H3O�]3 � Ka[H3O�]2 � (Kw � KaA)[H3O�]� KaKw � 0 (4.35)
and we see that [H3O�] is determined by solving this cu-bic equation, a task that is best accomplished with a cal-culator or mathematical software.
There are several experimental conditions that allowus to simplify eqn 4.34. For example, when [H3O�] 10�6 M (or pH � 6), Kw/[H3O�] � 10�8 M and we can ig-nore this term in eqn 4.34. The resulting expression is
Ka � �A
[�
H3
[OH
�
3O]2
�]� (4.36)
Rearrangement of eqn 4.36 gives a quadratic equation:
[H3O�]2 � Ka[H3O�] � KaA � 0 (4.37)
which can be solved for [H3O�]. If the extent of de-protonation is very small, we let [H3O�] �� A andwrite
Ka � �[H3
AO�]2� (4.38a)
[H3O�] � (KaA)1/2 (4.38b)
Equations 4.36 and 4.38 are similar to the expressionsused in Example 4.5, where we set [H3O�] equal to x.
Exercises 195
4.12 The standard reaction Gibbs energies (at pH � 7)for the hydrolysis of glucose-1-phosphate,glucose-6-phosphate, and glucose-3-phosphateare �21, �14, and �9.2 kJ mol�1, respectively.Calculate the equilibrium constants for thehydrolyses at 37°C.
4.13 The standard Gibbs energy for the hydrolysis ofATP to ADP is �31 kJ mol�1; what is theGibbs energy of reaction in an environment at37°C in which the ATP, ADP, and Pi
concentrations are all (a) 1.0 mmol L�1, (b) 1.0 �mol L�1?
4.14 The distribution of Na� ions across a typicalbiological membrane is 10 mmol L�1 inside thecell and 140 mmol L�1 outside the cell. Atequilibrium the concentrations are equal. Whatis the Gibbs energy difference across themembrane at 37°C? The difference inconcentration must be sustained by coupling toreactions that have at least that difference ofGibbs energy.
4.15 For the hydrolysis of ATP at 37°C, �rH� �
�20 kJ mol�1 and �rS� � �34 J K�1 mol�1.
Assuming that these quantities remain constant,estimate the temperature at which theequilibrium constant for the hydrolysis of ATPbecomes greater than 1.
4.16 Two polynucleotides with sequences AnUn
(where A and U denote adenine and uracil,respectively) interact through A–U base pairs,forming a double helix. When n � 5 and n � 6,the equilibrium constants for formation of thedouble helix are 5.0 � 103 and 2.0 � 105,respectively. (a) Suggest an explanation for theincrease in the value of the equilibrium constantwith n. (b) Calculate the contribution of a singleA–U base pair to the Gibbs energy of formationof a double helix between AnUn polypeptides.
4.17 Under biochemical standard conditions, aerobicrespiration produces approximately 38 moleculesof ATP per molecule of glucose that iscompletely oxidized. (a) What is the percentageefficiency of aerobic respiration underbiochemical standard conditions? (b) Thefollowing conditions are more likely to beobserved in a living cell: pCO2 � 5.3 � 10�2 atm,pO2 � 0.132 atm, [glucose] � 5.6 � 10�2 molL�1, [ATP] � [ADP] � [Pi] � 1.0 � 10�4 molL�1, pH � 7.4, T � 310 K. Assuming that
activities can be replaced by the numericalvalues of molar concentrations, calculate theefficiency of aerobic respiration under thesephysiological conditions.
4.18 The second step in glycolysis is the isomerizationof glucose-6-phosphate (G6P) to fructose-6-phosphate (F6P). Example 4.2 considered theequilibrium between F6P and G6P. Draw a graphto show how the reaction Gibbs energy varieswith the fraction f of F6P in solution. Label theregions of the graph that correspond to theformation of F6P and G6P being spontaneous,respectively.
4.19 The saturation curves shown Fig. 4.7 may also bemodeled mathematically by the equation
log �1 �
ss
� � � log p � � log K
where s is the saturation, p is the partial pressureof O2, K is a constant (not the equilibriumconstant for binding of one ligand), and � is theHill coefficient, which varies from 1, for nocooperativity, to N for all-or-none binding of Nligands (N � 4 in Hb). The Hill coefficient forMb is 1, and for Hb it is 2.8. (a) Determine theconstant K for both Mb and Hb from the graphof fractional saturation (at s � 0.5) and thencalculate the fractional saturation of Mb and Hbfor the following values of p/kPa: 1.0, 1.5, 2.5,4.0, 8.0. (b) Calculate the value of s at the samep values assuming � has the theoretical maximumvalue of 4.
4.20 Classify the following compounds as endergonicor exergonic: (a) glucose, (b) urea, (c) octane,(d) ethanol.
4.21 Consider the combustion of sucrose:
C12H22O11(s) � 12 O2(g) ˆ̂ 90̂ ˆ12 CO2(g) � 11 H2O(l)
(a) Combine the standard reaction entropy withthe standard reaction enthalpy and calculate thestandard reaction Gibbs energy at 298 K. (b) Inassessing metabolic processes, we are usuallymore interested in the work that may beperformed for the consumption of a given massof compound than the heat it can produce(which merely keeps the body warm). Recall
196 Chapter 4 • Chemical Equilibrium
from Chapter 2 that the change in Gibbs energy can be identified with themaximum non-expansion work that can beextracted from a process. What is the maximumenergy that can be extracted as (i) heat, (ii) non-expansion work when 1.0 kg of sucroseis burned under standard conditions at 298 K?
4.22 Is it more energy effective to ingest sucrose orglucose? Calculate the non-expansion work, theexpansion work, and the total work that can beobtained from the combustion of 1.0 kg ofglucose under standard conditions at 298 K whenthe product includes liquid water. Compare youranswer with your results from Exercise 4.21b.
4.23 The oxidation of glucose in the mitochondria ofenergy-hungry brain cells leads to the formationof pyruvate ions, which are then decarboxylatedto ethanal (acetaldehyde, CH3CHO) in thecourse of the ultimate formation of carbondioxide. (a) The standard Gibbs energies offormation of pyruvate ions in aqueous solutionand gaseous ethanal are �474 and �133 kJmol�1, respectively. Calculate the Gibbs energyof the reaction in which pyruvate ions areconverted to ethanal by the action of pyruvatedecarboxylase with the release of carbon dioxide.(b) Ethanal is soluble in water. Would youexpect the standard Gibbs energy of the enzyme-catalyzed decarboxylation of pyruvate ions toethanal in solution to be larger or smaller thanthe value for the production of gaseous ethanal?
4.24 Calculate the standard biological Gibbs energyfor the reaction
Pyruvate� � NADH � H� ˆ̂ llactate� � NAD�
at 310 K given that �rG� � �66.6 kJ mol�1.(NAD� is the oxidized form of nicotinamidedinucleotide.) This reaction occurs in musclecells deprived of oxygen during strenuousexercise and can lead to cramping.
4.25 The standard biological reaction Gibbs energyfor the removal of the phosphate group fromadenosine monophosphate is �14 kJ mol�1 at298 K. What is the value of the thermodynamicstandard reaction Gibbs energy?
4.26 Estimate the values of the biological standardGibbs energies of the following phosphatetransfer reactions:
(a) GTP(aq) � ADP(aq) l̂GDP(aq) � ATP(aq)
(b) Glycerol(aq) � ATP(aq) l̂glycerol-1-phosphate � ADP(aq)
(c) 3-Phosphoglycerate(aq) � ATP(aq) l̂1,3-bis(phospho)glycerate(aq) � ADP(aq)
4.27 Show that if the logarithm of an equilibriumconstant is plotted against the reciprocal of thetemperature, then the standard reaction enthalpymay be determined.
4.28 The conversion of fumarate ion to malate ion iscatalyzed by the enzyme fumarase:
Fumarate2�(aq) � H2O(l) ˆ̂ l malate�(aq)
Use the following data to determine the standardreaction enthalpy:
�/°C 15 20 25 30 35 40 45 50K 4.786 4.467 4.074 3.631 3.311 3.090 2.754 2.399
4.29 What is the standard enthalpy of a reaction forwhich the equilibrium constant is (a) doubled,(b) halved when the temperature is increased by10 K at 298 K?
4.30 Numerous acidic species are found in livingsystems. Write the proton transfer equilibria forthe following biochemically important acids inaqueous solution: (a) H2PO4
�
(dihydrogenphosphate ion), (b) lactic acid(CH3CHOHCOOH), (c) glutamic acid(HOOCCH2CH2CH(NH2)COOH), (d) glycine(NH2CH2COOH), (e) oxalic acid(HOOCCOOH).
4.31 For biological and medical applications we oftenneed to consider proton transfer equilibria atbody temperature (37°C). The value of Kw forwater at body temperature is 2.5 � 10�14. (a) What is the value of [H3O�] and the pH ofneutral water at 37°C? (b) What is the molarconcentration of OH� ions and the pOH ofneutral water at 37°C?
4.32 Suppose that something had gone wrong in theBig Bang, and instead of ordinary hydrogen therewas an abundance of deuterium in the universe.There would be many subtle changes inequilibria, particularly the deuteron transferequilibria of heavy atoms and bases. The Kw forD2O, heavy water, at 25°C is 1.35 � 10�15.
Exercises 197
(a) Write the chemical equation for theautoprotolysis (more precisely, autodeuterolysis)of D2O. (b) Evaluate pKw for D2O at 25°C. (c) Calculate the molar concentrations of D3O�
and OD� in neutral heavy water at 25°C. (d) Evaluate the pD and pOD of neutral heavywater at 25°C. (e) Formulate the relationbetween pD, pOD, and pKw(D2O).
4.33 The molar concentration of H3O� ions in thefollowing solutions was measured at 25°C.Calculate the pH and pOH of the solution: (a) 1.5 � 10�5 mol L�1 (a sample of rainwater),(b) 1.5 mmol L�1, (c) 5.1 � 10�14 mol L�1, (d) 5.01 � 10�5 mol L�1.
4.34 Calculate the molar concentration of H3O� ionsand the pH of the following solutions: (a) 25.0 cm3 of 0.144 M HCl(aq) was added to25.0 cm3 of 0.125 M NaOH(aq), (b) 25.0 cm3 of0.15 M HCl(aq) was added to 35.0 cm3 of 0.15 M
KOH(aq), (c) 21.2 cm3 of 0.22 M HNO3(aq) wasadded to 10.0 cm3 of 0.30 M NaOH(aq).
4.35 Determine whether aqueous solutions of thefollowing salts have a pH equal to, greater than,or less than 7; if pH 7 or pH � 7, write achemical equation to justify your answer. (a) NH4Br, (b) Na2CO3, (c) KF, (d) KBr.
4.36 (a) A sample of potassium acetate, KCH3CO2, ofmass 8.4 g is used to prepare 250 cm3 of solution.What is the pH of the solution? (b) What is thepH of a solution when 3.75 g of ammoniumbromide, NH4Br, is used to make 100 cm3 ofsolution? (c) An aqueous solution of volume 1.0 L contains 10.0 g of potassium bromide. Whatis the percentage of Br� ions that are protonated?
4.37 There are many organic acids and bases in ourcells, and their presence modifies the pH of thefluids inside them. It is useful to be able to assessthe pH of solutions of acids and bases and tomake inferences from measured values of the pH.A solution of equal concentrations of lactic acidand sodium lactate was found to have pH � 3.08.(a) What are the values of pKa and Ka of lacticacid? (b) What would the pH be if the acid hadtwice the concentration of the salt?
4.38 Calculate the pH, pOH, and fraction of soluteprotonated or deprotonated in the followingaqueous solutions: (a) 0.120 M
CH3CH(OH)COOH(aq) (lactic acid), (b) 1.4 �10�4 M CH3CH(OH)COOH(aq), (c) 0.15 M
NH4Cl(aq), (d) 0.15 M NaCH3CO2(aq), (e) 0.112 M (CH3)3N(aq) (trimethylamine).
4.39 Show how the composition of an aqueoussolution that contains 0.010 mol L�1 glycinevaries with pH.
4.40 Show how the composition of an aqueoussolution that contains 0.010 mol L�1 tyrosinevaries with pH.
4.41 Calculate the pH of the following acid solutionsat 25°C; ignore second deprotonations onlywhen that approximation is justified. (a) 1.0 � 10�4 M H3BO3(aq) (boric acid acts asa monoprotic acid), (b) 0.015 M H3PO4(aq), (c) 0.10 M H2SO3(aq).
4.42 The amino acid tyrosine has pKa � 2.20 fordeprotonation of its carboxylic acid group. Whatare the relative concentrations of tyrosine and itsconjugate base at a pH of (a) 7, (b) 2.2, (c) 1.5?
4.43 Appreciable concentrations of the potassium andcalcium salts of oxalic acid, (COOH)2, are foundin many leafy green plants, such as rhubarb andspinach. (a) Calculate the molar concentrationsof HOOCCO2
�, (CO2)22�, H3O�, and OH� in
0.15 M (COOH)2(aq). (b) Calculate the pH of asolution of potassium hydrogenoxalate.
4.44 In green sulfur bacteria, hydrogen sulfide, H2S, isthe agent that brings about the reduction of CO2
to carbohydrates during photosynthesis. Calculatethe molar concentrations of H2S, HS�, S2�,H3O�, and OH� in 0.065 M H2S(aq).
4.45 The isoelectric point, pI, of an amino acid is thepH at which the predominant species in solutionis the zwitterionic form of the amino acid andonly small but equal concentrations of positivelyand negatively charged forms of the amino acidare present. It follows that at the isoelectricpoint, the average charge on the amino acid iszero. Show that (a) pI � 1⁄2(pKa1 � pKa2) foramino acids with side chains that are neitheracidic nor basic (such as glycine and alanine),(b) pI � 1⁄2(pKa1 � pKa2) for amino acids withacidic side chains (such as aspartic acid andglutamic acid), and (c) pI � 1⁄2(pKa2 � pKa3) for amino acids with basic side chains (such aslysine and histidine), where pKa1, pKa2, and pKa3
are given in Table 4.6. Hint: See Case study 4.3and Derivation 4.2.
4.46 Predict the pH region in which each of thefollowing buffers will be effective, assuming equal
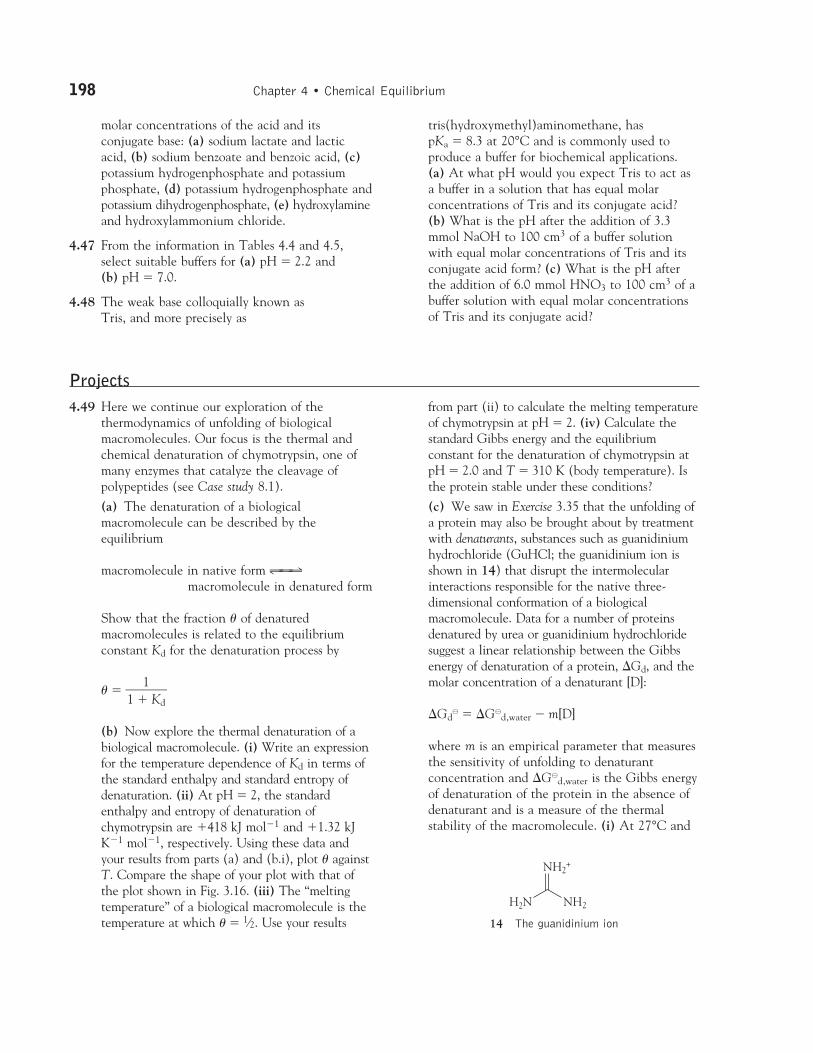
198 Chapter 4 • Chemical Equilibrium
Projects4.49 Here we continue our exploration of the
thermodynamics of unfolding of biologicalmacromolecules. Our focus is the thermal andchemical denaturation of chymotrypsin, one ofmany enzymes that catalyze the cleavage ofpolypeptides (see Case study 8.1).
(a) The denaturation of a biologicalmacromolecule can be described by theequilibrium
macromolecule in native form ˆ̂ 90̂ ˆmacromolecule in denatured form
Show that the fraction � of denaturedmacromolecules is related to the equilibriumconstant Kd for the denaturation process by
� � �1 �
1Kd
�
(b) Now explore the thermal denaturation of abiological macromolecule. (i) Write an expressionfor the temperature dependence of Kd in terms ofthe standard enthalpy and standard entropy ofdenaturation. (ii) At pH � 2, the standardenthalpy and entropy of denaturation ofchymotrypsin are �418 kJ mol�1 and �1.32 kJK�1 mol�1, respectively. Using these data andyour results from parts (a) and (b.i), plot � againstT. Compare the shape of your plot with that ofthe plot shown in Fig. 3.16. (iii) The “meltingtemperature” of a biological macromolecule is thetemperature at which � � 1⁄2. Use your results
from part (ii) to calculate the melting temperatureof chymotrypsin at pH � 2. (iv) Calculate thestandard Gibbs energy and the equilibriumconstant for the denaturation of chymotrypsin atpH � 2.0 and T � 310 K (body temperature). Isthe protein stable under these conditions?
(c) We saw in Exercise 3.35 that the unfolding ofa protein may also be brought about by treatmentwith denaturants, substances such as guanidiniumhydrochloride (GuHCl; the guanidinium ion isshown in 14) that disrupt the intermolecularinteractions responsible for the native three-dimensional conformation of a biologicalmacromolecule. Data for a number of proteinsdenatured by urea or guanidinium hydrochloridesuggest a linear relationship between the Gibbsenergy of denaturation of a protein, �Gd, and themolar concentration of a denaturant [D]:
�Gd� � �G�
d,water � m[D]
where m is an empirical parameter that measuresthe sensitivity of unfolding to denaturantconcentration and �G�
d,water is the Gibbs energyof denaturation of the protein in the absence ofdenaturant and is a measure of the thermalstability of the macromolecule. (i) At 27°C and
molar concentrations of the acid and itsconjugate base: (a) sodium lactate and lacticacid, (b) sodium benzoate and benzoic acid, (c)potassium hydrogenphosphate and potassiumphosphate, (d) potassium hydrogenphosphate andpotassium dihydrogenphosphate, (e) hydroxylamineand hydroxylammonium chloride.
4.47 From the information in Tables 4.4 and 4.5,select suitable buffers for (a) pH � 2.2 and (b) pH � 7.0.
4.48 The weak base colloquially known as Tris, and more precisely as
tris(hydroxymethyl)aminomethane, has pKa � 8.3 at 20°C and is commonly used toproduce a buffer for biochemical applications. (a) At what pH would you expect Tris to act asa buffer in a solution that has equal molarconcentrations of Tris and its conjugate acid? (b) What is the pH after the addition of 3.3mmol NaOH to 100 cm3 of a buffer solutionwith equal molar concentrations of Tris and itsconjugate acid form? (c) What is the pH afterthe addition of 6.0 mmol HNO3 to 100 cm3 of abuffer solution with equal molar concentrationsof Tris and its conjugate acid?
NH2+
NH2H2N
14 The guanidinium ion
pH 6.5, the fraction � of denatured chymotrypsinmolecules varies with the concentration ofGuHCl as follows:
� 1.00 0.99 0.78 0.44 0.23 0.08 0.06 0.01[GuHCl]/ 0.00 0.75 1.35 1.70 2.00 2.35 2.70 3.00
(mol L�1)
Calculate m and �G�d,water for chymotrypsin
under these experimental conditions. (ii) Usingthe same data, plot � against [GnHCl].Comment on the shape of the curve. (iii) Togain insight into your results from part (c.ii), youwill now derive an equation that relates � to [D].Begin by showing that �G�
d,water � m[D]1/2,where [D]1/2 is the concentration of denaturantcorresponding to � � 1⁄2. Then write anexpression for � as a function of [D], [D]1/2, m,and T. Finally, plot the expression using thevalues of [D]1/2, m, and T from part (c.i). Is theshape of your plot consistent with your resultsfrom part (c.ii)?
4.50 In Case study 4.4, we discussed the role ofhemoglobin in regulating the pH of blood. Nowwe explore the mechanism of regulation in detail.
(a) If we denote the protonated anddeprotonated forms of hemoglobin as HbH andHb�, respectively, then the proton transferequilibria for deoxygenated and fully oxygenatedhemoglobin can be written as:
HbH ˆ̂ 90̂ ˆ Hb� � H� pKa � 6.62
HbHO2 ˆ̂ 90̂ ˆ HbO2� � H� pKa � 8.18
Projects 199
where we take the view (for the sake ofsimplicity) that the protein contains only oneacidic proton. (i) What fraction of deoxygenatedhemoglobin is deprotonated at pH � 7.4, thevalue for normal blood? (ii) What fraction ofoxygenated hemoglobin is deprotonated at pH � 7.4? (iii) Use your results from parts (a.i)and (a.ii) to show that deoxygenation ofhemoglobin is accompanied by the uptake ofprotons by the protein.
(b) It follows from the discussion in Case study4.4 and part (a) that the exchange of CO2 forO2 in tissue is accompanied by complex protontransfer equilibria: the release of CO2 into bloodproduces hydronium ions that can be boundtightly to hemoglobin once it releases O2. Theseprocesses prevent changes in the pH of blood.To treat the problem more quantitatively, let uscalculate the amount of CO2 that can betransported by blood without a change in pHfrom its normal value of 7.4. (i) Begin bycalculating the amount of hydronium ion boundper mole of oxygenated hemoglobin molecules atpH � 7.4. (ii) Now calculate the amount ofhydronium ion bound per mole of deoxygenatedhemoglobin molecules at pH � 7.4. (iii) Fromyour results for parts (b.i) and (b.ii), calculatethe amount of hydronium ion that can be boundper mole of hemoglobin molecules as a result ofthe release of O2 by the fully oxygenated proteinat pH � 7.4. (iv) Finally, use the result from part(b.iii) to calculate the amount of CO2 that canbe released into the blood per mole ofhemoglobin molecules at pH � 7.4.