Embed Size (px)
Citation preview
Chemical modification of polysaccharides with hydrophilic polymers for CaCO3 crystal growth modification and filler
retention, for paper applications
by
Howard Matahwa
Dissertation presented for the degree of
PhD (Polymer Science)
Promoter: Prof. R.D. Sanderson
Stellenbosch University
December 2008
Declaration By submitting this dissertation electronically, I declare that the entirety of the work
contained therein is my own, original work, that I am the owner of the copyright thereof
(unless to the extent explicitly otherwise stated) and that I have not previously in its entirety
or in part submitted it for obtaining any qualification.
Date: 19 November 2008
Copyright © 2008 Stellenbosch University
All rights reserved
i
Abstract
Polysaccharides were modified with selected polymers via the grafting technique. Both
anionic and cationic polysaccharides were prepared. Random and crosslinked graft
copolymers were also prepared. The percentage grafting was determined by gravimetric
analysis and results were confirmed by cross-polarization magic angle spinning carbon-13
nuclear magnetic resonance microscopy (CP/MAS 13C NMR). These modified biodegradable
polymers were then used to flocculate precipitated calcium carbonate (PCC). The effects of
pH, percentage grafting, crosslinker concentration and polysaccharide concentration on PCC
flocculation were evaluated. Furthermore, the effects of anionic and cationic starch, either
added to PCC sequentially or simultaneously, on PCC flocculation were also investigated.
Generally, anionically modified starch showed excellent flocculation properties, which are
desirable for the end application of PCC retention.
The effect of polyacrylic acid (PAA) and polyacrylamide (PAM) modified cellulose fibers on
calcium carbonate crystal nucleation and growth modification was investigated. When the
heterogeneous crystallization of CaCO3 was carried out in the presence of modified cellulose
fibers the CaCO3 crystals were found to be residing on the surface of the fibers. The
morphologies of the crystallized CaCO3, polymorph and fiber surface coverage were different
for cellulose materials grafted with polymers of different functionalities, meaning that there is
interaction between the crystal growth modifier and the growing nuclei.
The effect of the modified starch on the crystallization of calcium carbonate gave useful
insight into designing CaCO3 filler morphologies. It was found that the filler size,
morphology and surface properties of fillers can be tailor-made by choosing suitable CaCO3
crystallization conditions as well as a suitable crystal growth modifier. The crystallized
CaCO3 had a negatively charged surface. Results of fluorescence studies showed that the
PAA modified starch (polymeric additive used) resided on the surface of the crystals. Thus
the presence of the polysaccharide on the surface of a filler could be advantageous for
strengthening fiber–filler bonding in paper applications.
Anionic starch materials were also used to prepare anionic-starch-coated starch particles. Both
the anionic starch and anionic-starch-coated starch particles were evaluated for PCC retention
and other properties of hand sheets. When anionic-starch-coated starch particles were used
there was generally an improvement in the PCC retention, while the other paper properties
remained desirable. The success achieved with the use of anionic-starch-coated starch
particles now opens the way for the further preparation and testing of various modified starch
particles, for optimization of filler retention.
ii
Opsomming
Wysiging van polisakkariede met ‘n verskeidenheid polimere is uitgevoer deur gebruik te
maak van die entkopolimerisasietegniek. Beide kationiese en anioniese polisakkariede is
berei, sowel as willekeurige kopolimere en gekruisbinde kopolimere. ’Cross-polarization
magic angle spinning carbon-13 nuclear magnetic resonance' (CP/MAS 13C NMR) is gebruik
om die persentasie enting, bepaal deur gravimetriese analise, te bevestig. Hierdie gewysigde
afbreekbare polimere is gebruik om neergeslaande kalsiumkarbonaat (NKK) uit te vlok. Die
invloed van pH, persentasie enting, kruisbinderkonsentrasie en polisakkariedkonsentrasie is
ondersoek. Die invloed van opeenvolgend en gelyktydige kationiese en anioniese
styseladdisie op NKK is ook ondersoek. Oor die algemeen is bevind dat anioniese stysel die
beste uitvlokking van NKK tot gevolg het, wat voordelig is.
Die effek van poliakrielsuur (PAA) en poliakrielamied (PAM) gewysigde sellulosevesel op
CaCO3 kernvorming en groei modifikasie is ondersoek. Die heterogene kristallisering van
CaCO3 wat uitgevoer is in die teenwoordigheid van gemodifiseerde sellulose vesel het tot
gevolg gehad dat die CaCO3 kristalle op die oppervlak van die vesels te vinde was. Die
morfologie, polimorf en vesel oppervlakbedekking is verskillend vir elke tipe entpolimeer wat
aan die polisakkariede geheg is. Dit dui aan dat daar ‘n interaksie plaasvind tussen die
betrokke entpolimeer en die groeiende vulstofkern.
Die invloed van die natuurlike wateroplosbare gemodifiseerde polisakkariede op die
kristallisasie van CaCO3 het insig gebied op die wyse waarop die vulstof ontwerp moet word.
Die vulstof kristalgrootte, morfologie en die oppervlakeienskappe kan voorspel word deur ’n
keuse van die reaksie kondisies sowel as die tipe kristalgroeimodifiseerder. Die
gekristalliseerde CaCO3 toon ‘n negatiewe oppervlakte lading. Fluoressensie studies het
getoon dat PAA-gewysigde stysel (polimeriese bymiddel gebuik) op die oppervlak van die
kristalle teenwoordig is. Derhalwe kan die teenwoordigheid van polisakkariede op die
oppervlak van die vulstof voordelig wees om die vesel–vulstof komponent in
papieraanweding te versterk.
Anioniese stysel is ook gebruik om anioniese styselbedekte styselpartikels te berei en beide
die gewone anioniese stysel sowel as die anioniese styselbedekte styselpartikels is gebruik om
die invloed daarvan op vulstofretensie en ander eienskappe in papier handblaaie te ondersoek.
Daar is oor die algemeen gevind dat die byvoeging van anioniese styselbedekte styselpartikels
die NKK retensie verbeter het sonder 'n negatiewe impak op ander papiereienskappe. Die
sukses wat hier behaal is baan die weg vir verdere toetse wat uitgevoer kan word op anioniese
styselpartikels onder verskeie toestande met die oog op optimisering van vulstofretensie.

iii
Dedication
I dedicate this work to my family, friends and my wife Blessing.
iv
Acknowledgements
Firstly, I would like to thank God for blessing me with the gift of life during my study. I know
that God gave me guidance, courage, strength and joy in times of despair. May the honor and
glory be unto His name.
I would like to thank the following people and organizations for their contributions to this
project:
Prof. RD Sanderson for being my promoter, his knowledge input, motivation and
encouragement during this study,
Prof. B Klumperman for his assistance in this project,
Prof. Mathias for providing the internship to study at the University of Southern Mississippi,
Dr. JB McLeary for his input in the beginning of this project,
The Mondi Uncoated Fine Paper innovation team,
Athol and his research group for their assistance in the hand sheet making,
Dr. Hurndall for assisting with the preparation of this manuscript,
Dr. Jarret for solid state NMR analysis,
Ben Loos,
The following people: Christo, Vernon, Mingxuan, Helen, Ingrid, Carin, Ashwell, and all the
polymer students and staff, for all their help and for being so friendly.
Mondi Business Paper, the NRF and US are thanked for funding this project
May the good Lord bless you all, Amen
v
List of contents
Abstract.................................................................................................................................. i
Opsomming........................................................................................................................... ii
Dedication............................................................................................................................ iii
Acknowledgements .............................................................................................................. iv
List of contents.......................................................................................................................v
List of Figures ........................................................................................................................x
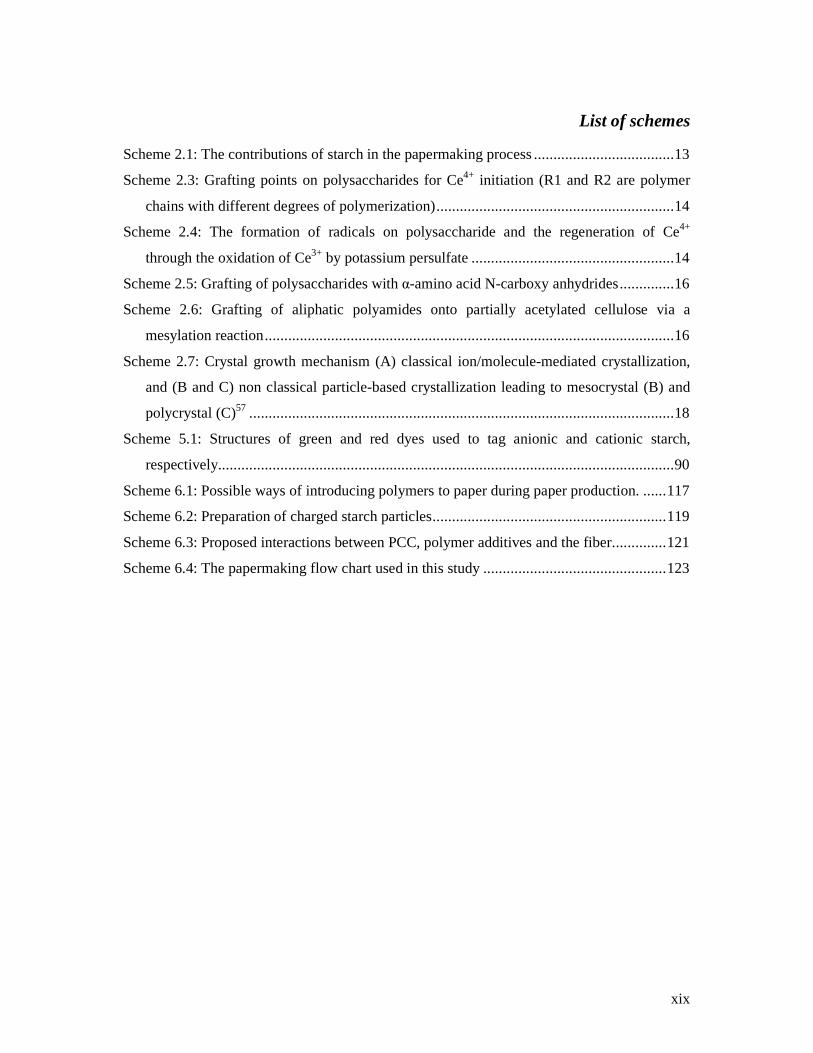
List of schemes....................................................................................................................xix
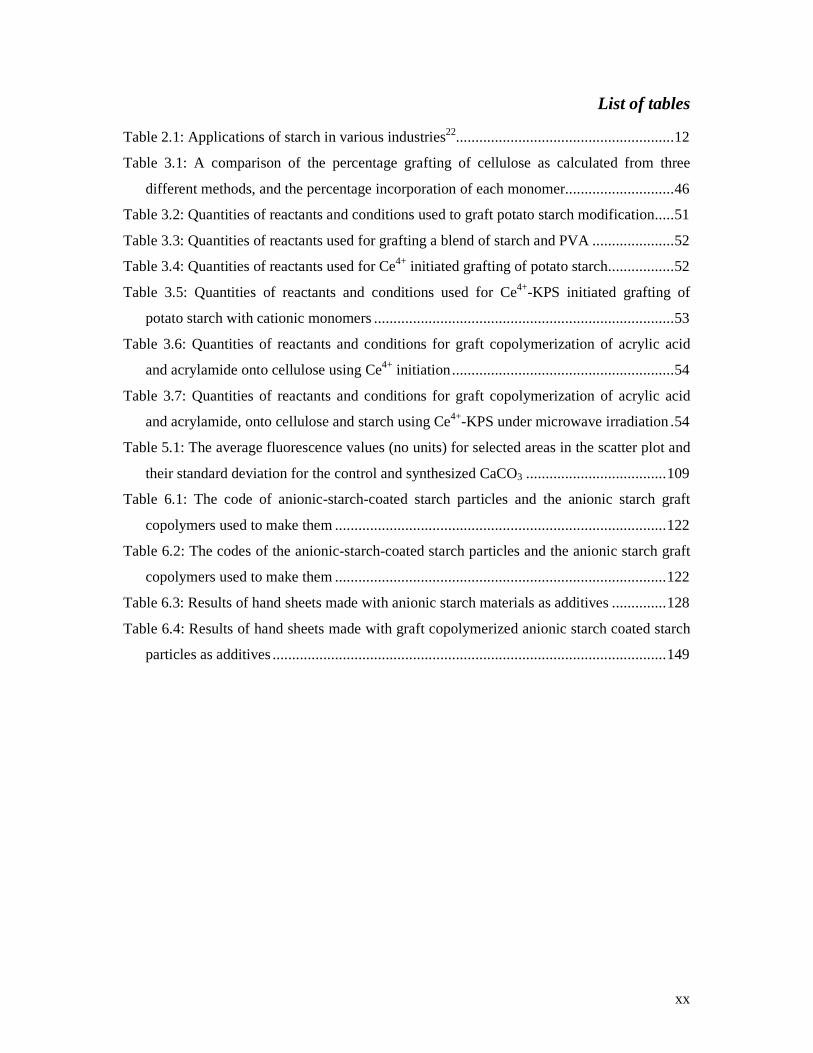
List of tables.........................................................................................................................xx
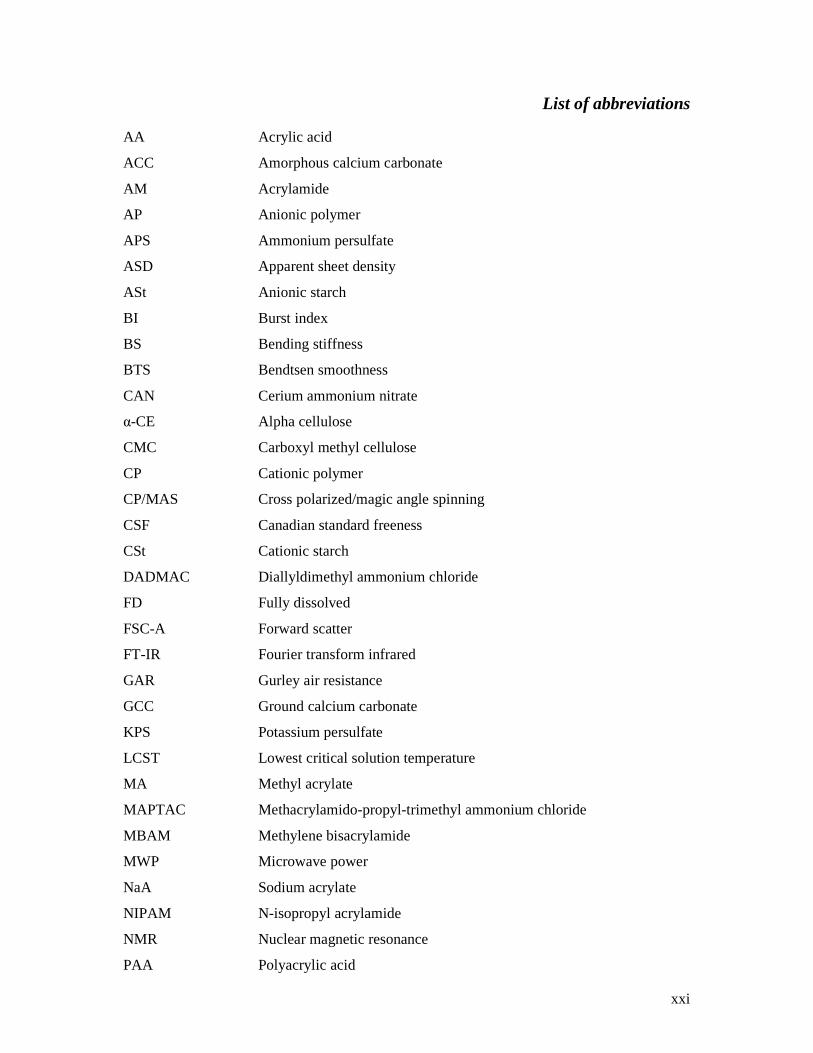
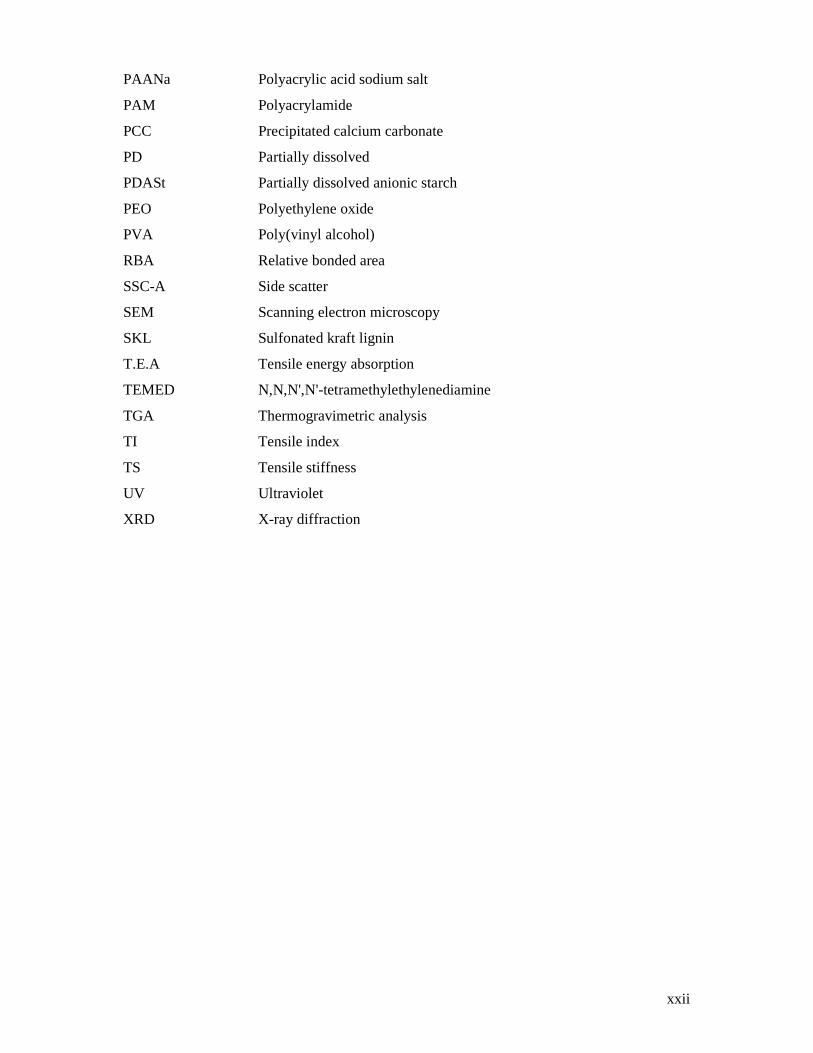
List of abbreviations............................................................................................................xxi
Scientific contributions emanating from this study............................................................ xxiii
Chapter 1: Introduction and objectives....................................................................................1
1.1: Introduction .............................................................................................................2
1.2: Natural polymers .....................................................................................................2
1.3: Modification of polysaccharides ..............................................................................3
1.4: Crystal growth modification.....................................................................................3
1.5: The paper industry ...................................................................................................3
1.6: Fillers ......................................................................................................................4
1.7: Objectives................................................................................................................4
1.8: Layout of the thesis..................................................................................................5
1.9: References ...............................................................................................................6
Chapter 2: Historical and theoretical background....................................................................8
2.1: Introduction .............................................................................................................9
2.1.1: Polysaccharides.................................................................................................9
2.1.2: Cellulose ...........................................................................................................9
2.1.3: Starch..............................................................................................................10
2.1.3.1: The structure of amylopectin ....................................................................11
2.1.3.2: Starch applications ...................................................................................12
2.2: Grafting of polysaccharides....................................................................................13
2.2.1: Grafting using vinyl monomers .......................................................................13
2.2.2: Other grafting techniques ................................................................................15
2.2.2.1: Grafting by ring opening polymerization ..................................................15
2.2.2.2: Grafting of a preformed polymer ..............................................................16
vi
2.3: Biominerization: Crystal growth modification........................................................17
2.3.1: Origin of biominerization ................................................................................17
2.3.2: Nucleation and crystal growth mechanisms .....................................................17
2.3.3: Crystallization of calcium carbonate................................................................19
2.4: Paper production....................................................................................................21
2.4.1: Pulp cellulose fiber..........................................................................................21
2.4.2: Bonding aspect of fibers..................................................................................22
2.4.2.1: Capillary forces ........................................................................................23
2.4.2.2: Inter-fiber bond strength ...........................................................................23
2.4.2.3: Enhancement of inter-fiber bonds .............................................................24
2.4.3: Fillers..............................................................................................................25
2.4.3.1: Functions of fillers in paper ......................................................................26
2.4.3.2: Characteristics of fillers............................................................................26
2.4.3.3: The calcium carbonate filler .....................................................................29
2.4.3.4: Filler retention and flocculation................................................................30
2.5: References .............................................................................................................32
Chapter 3: Grafting of polysaccharides with hydrophilic vinyl monomers using various
initiator systems..............................................................................................................38
3.1: Introduction and objectives ....................................................................................39
3.1.1: Microwave-assisted graft copolymerization.....................................................39
3.1.2: Conventional free radical grafting techniques..................................................39
3.1.3: The choice of monomer...................................................................................39
3.1.4: Objectives .......................................................................................................40
3.2: Experimental..........................................................................................................41
3.2.1: Microwave-assisted grafting............................................................................41
3.2.2: Conventional grafting......................................................................................41
3.2.2.1: APS-TEMED initiation ............................................................................41
3.2.2.2: Ce4+ and Ce4+-KPS initiation ....................................................................42
3.2.3: Flocculation of precipitated calcium carbonate................................................42
3.3: Analysis.................................................................................................................43
3.3.1: Gravimetric analysis........................................................................................43
3.3.2: Cationic degree of graft copolymers ................................................................43
3.3.3: FT-IR spectroscopy.........................................................................................44
3.3.4: Thermogravimetric analysis ............................................................................44
3.3.5: Cross polarization magic angle spinning 13C NMR analysis.............................44
vii
3.3.6: Flocculation ....................................................................................................45
3.4: Results and discussion ...........................................................................................45
3.4.1: Microwave assisted grafting of polysaccharides ..............................................45
3.4.2: Conventional grafting of polysaccharides........................................................49
3.4.3: PCC flocculation using modified starch...........................................................55
3.4.3.1: Flocculation using anionic starch and cationic starch ................................55
3.4.3.2: Effect of pH on Flocculation of PCC ........................................................57
3.4.3.3: Partially dissolved grafted anionic starch..................................................57
3.4.3.4: Effect of order of addition of oppositely charged starch and percentage
grafting .................................................................................................................59
3.4.3.5: Flocculation of PCC using carboxylmethyl cellulose ................................59
3.4.3.6: Flocculation of PCC using crosslinked PAA grafted starch.......................60
3.4.3.7: Flocculation properties of St/PVA blends and cationic starch ...................61
3.5: Conclusions ...........................................................................................................61
3.6: References .............................................................................................................62
Chapter 4: Crystallization of CaCO3 in the presence of polymeric additives .........................64
4.1: Introduction ...........................................................................................................65
4.2: Experimental..........................................................................................................66
4.2.1: Crystallization of CaCO3.................................................................................66
4.2.2: Rates of crystallization ....................................................................................66
4.2.3: Characterization of CaCO3 crystals .................................................................67
4.3: Results and discussion ...........................................................................................67
4.3.1: Crystallization in the presence of PAM and PAA homopolymers ....................67
4.3.2: Crystallization of CaCO3 in the presence of cellulose and cellulose graft
copolymerized with MA and NIPAM........................................................................72
4.3.3: Crystallization in the presence of PAA and PAM grafted cellulose..................74
4.3.4: Crystallization in the presence of starch and PAA modified starch ..................80
4.4: Implications of results of this study in the paper industry .......................................83
4.5: Conclusions ...........................................................................................................84
4.6: References .............................................................................................................84
Chapter 5: Determination of surface properties and statistical evaluation of crystallized
CaCO3 ............................................................................................................................86
5.1: Introduction ...........................................................................................................87
5.1.1: Fluorescence ...................................................................................................87
5.1.2: Zeta potential ..................................................................................................88

viii
5.2: Experimental..........................................................................................................89
5.2.1: Synthesis of fluorescein-tagged anionic and cationic starch.............................89
5.2.3.1: Fluorescein-tagged anionic starch.............................................................89
5.2.3.1: Rhodamine B-tagged cationic starch.........................................................90
5.2.2: Crystallization experiments .............................................................................90
5.3: Analysis.................................................................................................................91
5.3.1: Fluorescence ...................................................................................................91
5.3.2: Zeta potentials.................................................................................................92
5.4: Results and discussion ...........................................................................................92
5.4.1: Fluorescence and morphology of CaCO3 crystals ............................................92
5.4.2: TGA and zeta potential measurements.............................................................99
5.4.3: CaCO3 crystal size in aqueous solution..........................................................100
5.4.4: Statistical analysis of CaCO3 crystals ............................................................101
5.4.5: Crystal nucleation and growth mechanisms ...............................................110
5.4: Conclusions .........................................................................................................112
5.6: References ...........................................................................................................113
Chapter 6: Testing modified polysaccharides in paper production.......................................115
6.1: Introduction .........................................................................................................116
6.2: Addition of PCC retention aids ............................................................................117
6.3: Experimental........................................................................................................119
6.3.1: Preparation of anionic-starch-coated starch particles .....................................119
6.3.2: Hand sheet making procedure .......................................................................123
6.3.3: Instrumentation .............................................................................................123
6.4: Results and discussion .........................................................................................125
6.4.1: Effect of fiber refining on paper properties....................................................125
6.4.1.1: Fiber refining .............................................................................................125
6.4.1.2: The effect of fiber refining on unfilled paper properties..............................125
6.4.1.3: The effect of fiber refining on filled paper properties..................................126
6.4.2: The effect of anionically modified polysaccharides on filled paper properties127
6.4.3: The effect of modified starch coated starch particles......................................129
6.4.3.1: The effect of anionic starch particles HM 366.1 .......................................129
6.4.3.2: The effect of anionic starch particles HM 376.1 .......................................131
6.4.3.3: Comparison between polymer HM 366.1 and HM 376.1............................134
6.4.3.4: Comparison plots of properties against apparent sheet density ................135
6.4.3.5: Comparison of anionic starch to anionic starch particles .........................137

ix
6.4.3.6: Effect of anionic starch to starch maize particles ratio.............................139
6.4.3.7: The effect of anionic and cationic polymer additive concentrations ........140
6.4.3.8: Anionic-starch-coated cationic starch particles .......................................145
6.4.4: Other modified starch particles......................................................................147
6.5: Conclusions .........................................................................................................150
6.6: References ...........................................................................................................150
Chapter 7: Conclusions and recommendations....................................................................151
7.1: Conclusions .........................................................................................................152
7.2: Recommendations for future work .......................................................................153
Appendix A: FT-IR spectra of modified polysaccharides....................................................155
Appendix B: TGA curves of modified polysaccharides and hand sheets .............................156
Appendix C: Absorption properties of crosslinked PAA grafted starch ...............................158
Appendix D: SEM images of crystallized CaCO3 ...............................................................159
Appendix E: SEM images and flocculation curves of anionic-starch-coated starch particles161
Appendix F: SEM images and flocculation curves of starch particles..................................164
Appendix G: Grammage of all the hand sheets ...................................................................165
Appendix H: Effect of fiber refining on properties of unfilled and filled paper....................166
Appendix I: Change in properties of hand sheets against the apparent sheet density of hand
sheets............................................................................................................................169
Appendix J: Bar graphs for hand sheets made with polymeric additives HM 13, HM 36, HM
37 and HM 38...............................................................................................................170
x
List of Figures
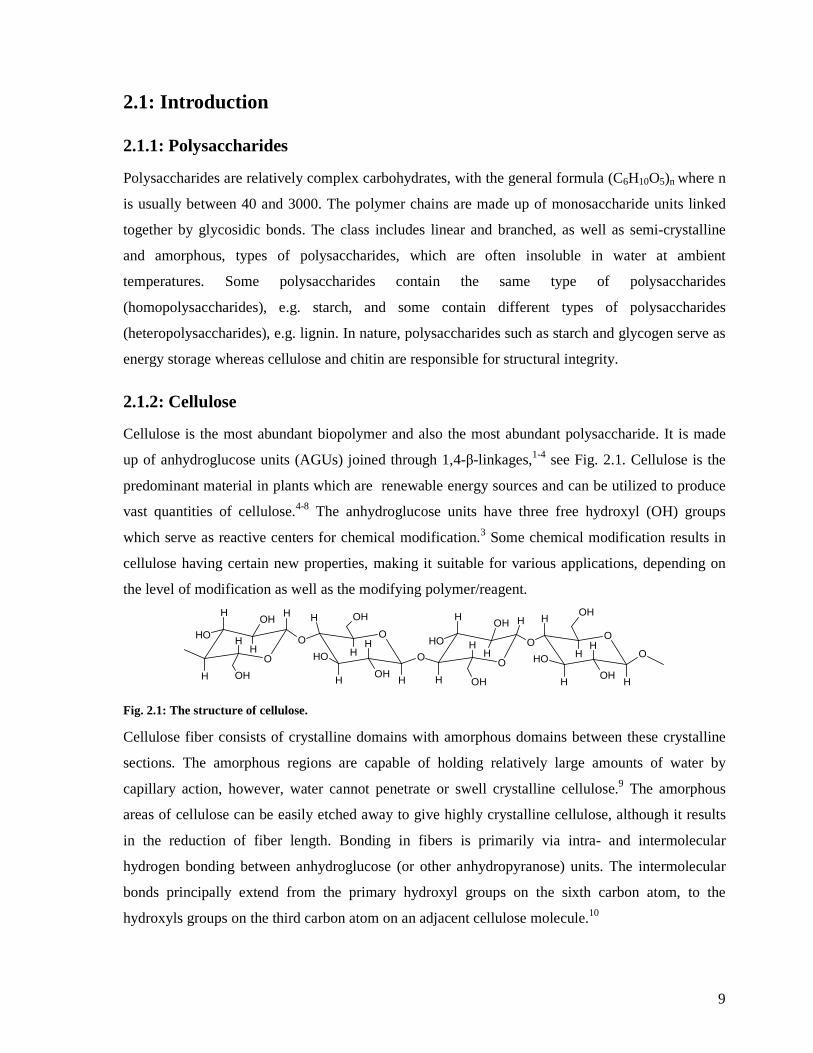
Fig. 2.1: The structure of cellulose..........................................................................................9
Fig. 2.2: The structure of amylopectin (amylose is linear).....................................................11
Fig. 2.3: A) Schematic representation of the branching nature of amylopectin in a starch
granule. B) Orientation of amylopectin molecules in an ideal granule.21..........................11
Fig. 2.4: The effect of fiber surface roughness on the fiber-fiber contact.91 ...........................22
Fig. 2.5: Schematic representation of a drop of water between two planes of paper, wetting the
surface completely. .........................................................................................................23
Fig. 2.6: Diagrammatic illustration of the adsorption of polyelectrolytes of different charge
density on the surface of a fiber: A) a high cationic charge density polyelectrolyte giving
the polymer a flat conformation on the surface of the fiber and B) a low cationic charge
density polyelectrolyte giving the polymer a greater degree of molecular extension. .......25
Fig. 3.1: 13C CP-MAS NMR spectra of α-CE and the graft copolymers G1, G2 and G3: a) and
c) carbonyl side bands, b) carbonyl peak, d) anomeric carbon, e) C2-C6 of cellulose, f)
CH3 carbon peak of MA, g) the carbon peaks of the grafted copolymer (NIPAM-co-MA),
h) 2x CH3 carbons of NIPAM. ........................................................................................46
Fig. 3.2: Correlation between area of resonance C1 (Anomeric carbon) of α-cellulose and the
area of resonance C* (NIPAM/MA) of the two monomers used and the contact time for
the three graft copolymers G1, G2 and G3. .....................................................................46
Fig. 3.3: A comparison of the FT-IR spectra of α-CE and the graft copolymers G1, G2 and
G3, showing the carbonyl peaks due to the grafted polymers. .........................................47
Fig. 3.4: TGA curves of α-CE and the graft copolymers G1, G2 and G3, showing an increase
in thermal stability with an increase in % G. ...................................................................47
Fig. 3.5: A) TGA curves of α-CE and α-CE grafted with NIPAM showing the thermally more
stable ungrafted material. C and B) 13C NMR of α-CE and α-CE grafted with NIPAM and
MA (α-CE-g-NIPAM-co-MA), respectively. ..................................................................48
Fig. 3.6: PCC flocculation using different anionic starch contents and mixtures of anionic
starch and cationic starch (Mondi Business Paper). (0.00 % is pure PCC). ......................55
Fig. 3.7: The effect of HM 13.2 and two HM 13.2/CSt (Mondi Business Paper) blend ratios on
the average particle size of PCC flocculants....................................................................56
Fig. 3.8: The effect of pH on PCC flocculation using 1.3% total polymer content of (A) HM
23.2 and (B) HM 23.2 /CSt blend.......................................................................................57
xi
Fig. 3.9: PCC flocculation using different concentrations of (A) HM 143.3 and (B)
HM143.3/CSt (Mondi business Paper) blends, in the ratio f 1:1 content, at different
polymer content. (0.00 % is pure PCC). ..........................................................................58
Fig. 3.10: A comparison of PCC flocculation using fully and partially dissolved anionic
starches, HM 23.2 and HM 143.3, and their blends with cationic starch (Mondi Business
Paper). ............................................................................................................................58
Fig. 3.11: The effect of; (A) the order of addition of cationic and anionic polymers to PCC
and B) the % G of starch on the size of PCC flocculants. ................................................59
Fig. 3.12: PCC flocculation using different CMC and CMC/CSt (Mondi Business Paper)
blends; 0.00% is pure PCC..............................................................................................60
Fig. 3.13: The effect of crosslinking agent MBAM on flocculant size distribution (A) and the
average flocculant size (B). (HM 63.2–HM 93.2 were used and polymer content in these
experiments was 0.65%. .................................................................................................60
Fig. 3.14: Flocculation of PCC using (A) P(AA-co-NaAA) grafted starch/PVA blends and (B)
cationic starches HM 203.5 and HM 25.3.5.......................................................................61
Fig. 4.1: Rate of CaCO3 crystallization in the presence of PAA and PAM. ...........................68
Fig. 4.2: SEM images of (A) CaCO3 crystals, (B) PAM modified CaCO3 and (C) PAA
modified CaCO3 crystals. (polymeric additive concentration 0.32g/L, pH 8.5.)...............69
Fig. 4.3: XRD spectra of CaCO3 crystals obtained in the absence and presence of polymeric
additives (c and v represent calcite and vaterite polymorphs, respectively.).....................70
Fig. 4.4: SEM images of CaCO3 crystals obtained in the presence of (A) cellulose at different
magnifications (A1-A3).and (B) NIPAM & MA graft copolymerized on CE (G2). .........73
Fig. 4.5: FT-IR spectra of α-CE, α-CE-CaCO3 and the graft copolymer G2-CaCO3, showing
the peaks due to the calcite..............................................................................................74
Fig. 4.6: SEM images of CaCO3 crystals obtained in the presence of (A) PAM grafted
cellulose (HM 293.6) and (B) PAA grafted cellulose (HM313.6). ......................................75
Fig. 4.7: SEM images of CaCO3 crystals obtained in the presence of PAA grafted α-cellulose
(HM 313.6): (A) [Ca+2] = 0.0125 M and B) [Ca+2] = 0.0500 M. .......................................76
Fig. 4.8: SEM images of CaCO3 crystals obtained in the presence of (A) PAM grafted
cellulose (HM 293.6) and B) PAA grafted cellulose (HM 313.6) at 80 oC. A2 and B2 show
CaCO3 crystals that were not attached to the fiber surface...............................................77
Fig. 4.9: XRD spectra of α-cellulose (i), and CaCO3 crystals obtained in the presence of (ii) α-
CE, (iii) PAM grafted cellulose (HM 293.6) and (iv) PAA grafted cellulose (HM 313.6) at
A) 25 oC and B) 80 oC. ([Ca2+] = [CO32-], pH 8.5, [polymeric additives] = 0.77 g/L.) ......78
xii
Fig. 4.10: TGA curves of (A) CaCO3 and CaCO3 synthesized in the presence of (B) acrylic
acid grafted cellulose (HM 313.6), (C) acrylamide grafted cellulose (HM 293.6) and (D)
cellulose. ([Ca2+] = [CO32-] = 0.025 M, pH = 8.5 and [polymeric additive] = 0.77g/L.) ...79
Fig. 4.11: SEM images of CaCO3 crystals obtained in the presence of starch and PAA grafted
starch. .............................................................................................................................80
Fig. 4.12: (A) XRD spectra of CaCO3 crystals obtained in the presence of: (i) starch at 25 oC,
(ii) PAA grafted starch (HM 13.2) at 25 oC, (iii) PAA grafted starch (HM 13.2) at 80 oC and
(B) XRD spectra of CaCO3 crystals obtained in the presence of PAA grafted starch (HM
13.2) at 25 oC and [Ca2+] (i) 0.0125 M, (ii) 0.025 M and (iii) 0.05 M. ([Ca2+] = [CO32-], pH
8.5 and [polymeric additives] = 0.77 g/L.) ......................................................................82
Fig. 4.13: TGA curves of CaCO3 synthesized in the presence of starch. (A) [Ca2+] = 0.025 M
and PAA grafted starch (HM 13.2); (B) [Ca2+] = 0.0500 M; (C) [Ca2+] = 0.0250 M and (D)
[Ca2+] = 0.0125 M at 25 oC. The polymer content in composites B, C, D was 11, 8 and 6%
respectively. ([Ca2+] = [CO32-], pH = 8.5 and [polymeric additive] = 0.77 g/L.) ..............83
Fig. 5.1: Schematic representation of: A) electric double layer B) variation of the potential
with distance from the electric double layer. ...................................................................88
Fig. 5.2: Fluorescence images of CaCO3 (control): (A) transmission, (B) fluorescence mode,
(C) overlay of A and B, and (D) SEM image of the crystals. ...........................................93
Fig. 5.3: Fluorescence images of CaCO3 (1): (A) transmission, (B) fluorescence mode, (C)
overlay of A and B, and (D) SEM image of the crystals. .................................................94
Fig. 5.4: Fluorescence images of CaCO3 (2): (A) transmission, (B) fluorescence mode, (C)
overlay of A and B, and (D) SEM image of the crystals. .................................................94
Fig. 5.5: Fluorescence images of CaCO3 (3): (A) transmission, (B) fluorescence mode, (C)
overlay of A and B, and (D) SEM image of the crystals. .................................................95
Fig. 5.6: Fluorescence images of CaCO3 (1) with rhodamine modified cationic starch
deposited on the surface: (A) transmission mode, (B) fluorescence mode (fluorescein), (C)
fluorescence mode (rhodamine) and (D) overlay of A, B and C. .....................................96
Fig. 5.7: Fluorescence images of CaCO3 (2) with rhodamine modified cationic starch
deposited on the surface: (A) transmission mode, (B) fluorescence mode (fluorescein), (C)
fluorescence mode (rhodamine), (D) overlay of A, B and C. ...........................................96
Fig. 5.8: Fluorescence images of CaCO3 (3) with rhodamine modified cationic starch
deposited on the surface: (A) transmission mode, B) fluorescence mode (fluorescein), (C)
fluorescence mode (rhodamine), (D) overlay of A, B and C. ...........................................97
xiii
Fig. 5.9: XRD spectra of PCC, CaCO3 (1), CaCO3 (2) and CaCO3 (3) showing the polymorph
present. Polymeric additive concentrations for the synthesis of CaCO3 (1), CaCO3 (2),
CaCO3 (3) were 1.4, 1.0, and 0.65 g/L, respectively. .......................................................98
Fig. 5.10: FT-IR spectra of PCC, CaCO3 (1) and CaCO3 (2) and CaCO3 (3). (Concentrations of
polymeric additives for the synthesis of CaCO3 (1), CaCO3 (2), CaCO3 (3) were 1.4, 1.0,
and 0.65 g/L respectively.)..............................................................................................98
Fig. 5.11: TGA curves of PCC, CaCO3 (1), CaCO3 (2) and CaCO3 (3). ................................99
Fig. 5.12: The effect of increasing the concentration of cationic starch on the zeta potentials of
PCC and the synthesized CaCO3 (1), CaCO3 (2) and CaCO3 (3) particles. (A 1% (w/v)
solution of cationic starch was used.) ............................................................................100
Fig. 5.13: A) Aqueous particle size distribution for PCC and the synthesized CaCO3 (1) and
CaCO3 (2), and B) the effect of cationic starch on the synthesized CaCO3 (1) particles. 100
Fig. 5.14: Fluorescence scatter graphs for the control sample and CaCO3 (1): A1, A2 and A3
show the population, granularity vs fluorescence, and size vs fluorescence curves for the
control, respectively; B1, B2 and B3 show the selected population, granularity vs
fluorescence, and size vs fluorescence curves for the CaCO3 (1), respectively...............102
Fig. 5.15: Fluorescence scatter graphs for the control sample and CaCO3 (1): A1, A2 and A3
show the selected population, granularity vs fluorescence, and size vs fluorescence curves
for the control, respectively; B1, B2 and B3 show the selected population, granularity vs
fluorescence, and size vs fluorescence curves for the CaCO3 (1), respectively ..............103
Fig. 5.16: Fluorescence scatter graphs for the control sample and CaCO3 (2): A1, A2 and A3
show the population, granularity vs fluorescence, and size vs fluorescence curves for the
control, respectively; B1, B2 and B3 show the selected population, granularity vs
fluorescence, and size vs fluorescence curves for the CaCO3 (2), respectively...............104
Fig. 5.17: Fluorescence scatter graphs for the control sample and CaCO3 (2): A1, A2 and A3
show the selected population, granularity vs fluorescence, and size vs fluorescence curves
for the control, respectively; B1, B2 and B3 shows the selected population, granularity vs
fluorescence, and size vs fluorescence curves for the CaCO3 (2) ,respectively...............105
Fig. 5.18: Fluorescence scatter graphs for the control sample and CaCO3 (3): A1, A2 and A3
show the population, granularity vs fluorescence, and size vs fluorescence curves for the
control, respectively; B1, B2 and B3 show the selected population, granularity vs
fluorescence, and size vs fluorescence curves for the CaCO3 (3), respectively...............106
Fig. 5.19: Fluorescence scatter graphs for the control sample and CaCO3 (3): A1, A2 and A3
show the selected population, granularity vs fluorescence, and size vs fluorescence curves
xiv
for the control, respectively; B1, B2 and B3 shows the selected population, granularity vs
fluorescence, and size vs fluorescence curves for the CaCO3 (3), respectively...............107
Fig. 5.20: Images for fluorescence scatter populations P3, P4, and P5 for CaCO3 (2)–(3) ...108
Fig. 5.21: Fluorescence distribution curves of (A) control sample and CaCO3 crystals
synthesized in the presence of fluorescence tagged anionic starch, (B) CaCO3 (3), (C)
CaCO3 (2) and (D) CaCO3 (1). (P2 denotes events in population P1.)............................109
Fig. 6.1: Schematic representation of different types of bonding: (A) no bonding, (B) fiber-
fiber bonding, (C) fiber-filler bonding and (D) filler-filler bonding.1.............................116
Fig. 6.2: SEM images of anionic-starch-coated starch particles in the ratios (A) 1:1, labeled
HM 36, (B) 1:2, labeled HM 37 and (C) 1:3, labeled HM 38.........................................120
Fig. 6.3: The flocculation properties of modified starch coated starch particles. ..................121
Fig. 6.4: Comparison of drainage and apparent sheet density between hand sheets made with
and without anionic polymer additive (anionic-starch-coated starch particles HM 366.1
used).............................................................................................................................129
Fig. 6.5: A comparison in the thickness and PCC retention for hand sheets made without
anionic starch additives and with anionic-starch-coated starch particles HM 366.1 at
different fiber refining levels.........................................................................................130
Fig. 6.6: Comparison between hand sheets made with and without anionic polymer additive
(anionic-starch-coated starch particles HM 366.1). .........................................................131
Fig. 6.7: Comparison between hand sheets made with and without anionic polymer additive
(anionic-starch-coated starch particles HM 376.1 used). .................................................132
Fig. 6.8: Comparison of the thickness and PCC retention for hand sheets made without
anionic starch additives and with anionic-starch-coated starch particles HM 376.1, at
different fiber refining levels. (AST: anionic starch additive.) .......................................132
Fig. 6.9: Comparison between hand sheets made with and without anionic polymer additive
(anionic-starch-coated starch particles HM 376.1 used). .................................................133
Fig. 6.10: Comparison between hand sheets made with different anionic-starch-coated starch
particles (HM 366.1 and HM 376.1) in terms of the drainage and sheet density................134
Fig. 6.11: Comparison in the thickness and PCC retention for hand sheets made with anionic-
starch-coated starch particles HM 366.1 and HM 376.1, at different fiber refining levels. 134
Fig. 6.12: Comparison between hand sheets made with different anionic-starch-coated starch
particles (HM 366.1 and HM 376.1).................................................................................135
Fig. 6.13: Change in properties of paper with apparent sheet density and fiber refining. (C.F:
control sheets for filled paper, i.e. paper made without anionic polymeric additive.) .....136
xv
Fig. 6.14: Comparison of the thickness and PCC retention of hand sheets made without
anionic starch additives, anionic starch (HM 13), and with anionic-starch-coated starch
particles of different ratios of modified starch to starch particles (HM 366.1 and HM 376.1).
137
Fig. 6.15: Comparison of hand sheets made with different anionic polymer additives in terms
of the ratio of modified starch to starch granules...........................................................138
Fig. 6.16: Comparison in the thickness and PCC retention for hand sheets made without
anionic starch additives and with anionic-starch-coated starch particles of different ratio of
modified starch to starch granules, at 3000 rev. fiber refining level. ..............................139
Fig. 6.17: Comparison between hand sheets made with different anionic-starch-coated starch
particles in terms of the ratio of modified starch to starch granules. ..............................140
Fig. 6.18: Comparison between hand sheets made with different amounts of anionic-starch-
coated starch particles HM 386.1 (expressed as a % relative to PCC) and the effect of
cationic starch additive (expressed as % relative to the pulp mass)................................141
Fig. 6.19: A comparison in the thickness and PCC retention for hand sheets made with
different amounts of anionic-starch-coated starch particles HM 3876.1 (expressed as a %
relative to PCC) and the effect of cationic starch additive (expressed as % relative to the
pulp mass). ...................................................................................................................142
Fig. 6.20: Comparison between hand sheets made with different quantities of anionic-starch-
coated starch particles HM 386.1 (expressed as a % relative to PCC) and the effect of
cationic starch additive (expressed as % relative to the pulp mass)................................143
Fig. 6.21: Comparison of hand sheets made with different amounts of anionic-starch-coated
starch particles HM 386.1 (expressed as a % relative to PCC) and the effect of cationic
starch (CS) additive (expressed as % relative to the pulp mass) with 2% of HM 386.1 and
HM 376.1. ......................................................................................................................144
Fig. 6.22: Comparison of drainage and apparent sheet density between hand sheets made with
different (in terms of modified starch to cationic starch granules ratio) anionic polymer
additive blended with cationic particles.........................................................................145
Fig. 6.23: A comparison in the thickness and PCC retention for hand sheets made without
anionic starch additives and with different ratios (in terms of anionic starch to cationic
starch granules ratio) of anionic-starch-coated cationic starch particles. ........................146
Fig. 6.24: Comparison of drainage and apparent sheet density between hand sheets made with
different ratios (in terms of modified starch to cationic starch granules ratio) of anionic-
starch-coated cationic starch particles. ..........................................................................147
xvi
Fig. A1: Examples of FT-IR spectra of cellulose modified with polyacrylamide and
polyacrylic acid polymers via the grafting reactions, showing the characteristic carbonyl
carbon peak of the grafted polymers. ............................................................................155
Fig. A2: Examples of FT-IR spectra of starch grafted with polyacrylic acid polymer, showing
the characteristic carbonyl carbon peak of the grafted PAA...........................................155
Fig. B1: Examples of TGA profiles of cellulose modified with polyacrylamide and
polyacrylic acid polymers prepared via the grafting reactions. ......................................156
Fig. B2: Examples of TGA profiles of hand sheets made with and without polymeric additives
(the PCC filler retention was calculated from these curves)...........................................157
Fig. C1: Absorption of crosslinked PAA/PAANa grafted starch. ........................................158
Fig. D1: SEM images of CaCO3 crystals obtained in the presence of microcrystalline
cellulose, at different magnifications (A & B) (Crystals were synthesized at 25 oC, [Ca2+]
= [CO32-] = 0.025 M, pH 8.5 and [polymeric additives] = 0.77 g/L). .............................159
Fig. D2: SEM images of CaCO3 crystals obtained in the presence of (A) PAA and (B) PAA
grafted starch, after six days (Crystals were synthesized at 25 oC, [Ca2+] = [CO32-] = 0.025
M, pH 8.5 and [polymeric additives] = 0.77 g/L). .........................................................159
Fig. D3: SEM images of CaCO3 crystals obtained in the presence PAA grafted partially-
dissolved starch at different magnifications (A & B) (Crystals were synthesized at 25 oC,
[Ca2+] = [CO32-] = 0.025 M, pH 8.5 and [polymeric additives] = 0.77 g/L)....................160
Fig. E1: SEM images of (A) anionic-starch-coated cationic starch particles (Mondi) in the
ratio 1:1 (labeled HM 396.1) and (B) Anionic starch coated cationic starch particles
(Mondi) in the ratio 1:2 (labeled HM 406.1). The graph shows the flocculation properties
of HM66.1, HM 396.1 and HM 406.1
.; 2 g PCC was flocculated using about 0.8% anionic
starch polymer solution.................................................................................................161
Fig. E2: SEM images of anionic-starch-coated starch particles at three different ratios: HM
416.3– HM 436.3. The graph shows the particle size distribution for flocculated PCC using
the anionic starch particles; 2 g PCC was flocculated using about 0.8% anionic starch
polymer solution. ..........................................................................................................162
Fig. E3: SEM images of anionic starch particles at three different ratios (HM 446.3–HM 466.3.
The graph shows the particle size distribution for flocculated PCC using the anionic starch
particles; 2 g of PCC was flocculated using about 0.8% of anionic starch polymer
solution.........................................................................................................................162
Fig. E4: SEM images of anionic-starch-coated starch particles at three different ratios HM
476.3–HM 496.3. The graph shows the particle size distribution for flocculated PCC using
xvii
the anionic starch particles; 2 g of PCC was flocculated using about 0.8% of anionic
starch polymer solution.................................................................................................163
Fig. F1: SEM images of swollen anionic starch coated starch particles at different
magnifications (A & B). ...............................................................................................164
Fig. F2: The effect of dilution on particle size distribution of flocculated PCC prepared using
anionic starch particles HM 416.3. .................................................................................164
Fig. G1: Grammage of all the hand sheets made with PCC additions as well as with and
without anionic or cationic polymer additions (the grammage of most of the hand sheets
was in the range 80 ± 2 g/m2)........................................................................................165
Fig. H1: SEM images showing the morphology of fibers refined at different revolutions
(rev.); A) 0, B) 1500 and C) 3000, at different magnifications.......................................166
Fig. H2: Variation of paper properties with fiber refining for unfilled paper. ......................167
Fig. H3: Change in the thickness of paper with fiber refining (no PCC). .............................167
Fig. H3: The thickness and PCC retention for hand sheets made without anionic starch
additives at different fiber refining levels. .....................................................................168
Fig. H4: Changes in paper properties with PCC loading and fiber refining..........................168
Fig. I1: Change in properties of paper against the apparent sheet density of hand sheets made
with different (in terms of modified starch to cationic starch granules ratio) anionic
polymer additives blended with cationic particles. The fiber refining of 3000 rev. was
used. The shaded star represents hand sheet made without PCC and without anionic
polymer additive at a fiber refining range of 0-3000 rev................................................169
Fig. J1: Comparison in the PCC retention of hand sheets made with polymeric additives HM
13, HM 36, HM 37 and HM 38.....................................................................................170
Fig. J2: Comparison in Gurley air resistance of hand sheets made with polymeric additives
HM 13, HM 36, HM 37 and HM 38..............................................................................170
Fig. J3: Comparison in the bending stiffness of hand sheets made with polymeric additives
HM 13, HM 36, HM 37 and HM 38..............................................................................171
Fig. J4: Comparison in the apparent sheet density of hand sheets made with polymeric
additives HM 13, HM 36, HM 37 and HM 38...............................................................171
Fig. J5: Comparison in the drainage of hand sheets made with polymeric additives HM 13,
HM 36, HM 37 and HM 38...........................................................................................172
Fig. J6: Comparison in the CSF of hand sheets made with polymeric additives HM 13, HM
36, HM 37 and HM 38..................................................................................................172
Fig. J7: Comparison in the Bendtsen porosity of hand sheets made with polymeric additives
HM 13, HM 36, HM 37 and HM 38..............................................................................173
xviii
Fig. J8: Comparison in the burst index of hand sheets made with polymeric additives HM 13,
HM 36, HM 37 and HM 38...........................................................................................173
Fig. J9: Comparison in the tensile index of hand sheets made with polymeric additives HM
13, HM 36, HM 37 and HM 38.....................................................................................174
Fig. J10: Comparison in the stretch of hand sheets made with polymeric additives HM 13,
HM 36, HM 37 and HM 38...........................................................................................174
Fig. J11: Comparison in tensile stiffness of hand sheets made with polymeric additives HM
13, HM 36, HM 37 and HM 38.....................................................................................175
Fig. J12: Comparison in the thickness of hand sheets made with polymeric additives HM 13,
HM 36, HM 37 and HM 38...........................................................................................175
xix
List of schemes
Scheme 2.1: The contributions of starch in the papermaking process ....................................13
Scheme 2.3: Grafting points on polysaccharides for Ce4+ initiation (R1 and R2 are polymer
chains with different degrees of polymerization).............................................................14
Scheme 2.4: The formation of radicals on polysaccharide and the regeneration of Ce4+
through the oxidation of Ce3+ by potassium persulfate ....................................................14
Scheme 2.5: Grafting of polysaccharides with α-amino acid N-carboxy anhydrides..............16
Scheme 2.6: Grafting of aliphatic polyamides onto partially acetylated cellulose via a
mesylation reaction.........................................................................................................16
Scheme 2.7: Crystal growth mechanism (A) classical ion/molecule-mediated crystallization,
and (B and C) non classical particle-based crystallization leading to mesocrystal (B) and
polycrystal (C)57 .............................................................................................................18
Scheme 5.1: Structures of green and red dyes used to tag anionic and cationic starch,
respectively.....................................................................................................................90
Scheme 6.1: Possible ways of introducing polymers to paper during paper production. ......117
Scheme 6.2: Preparation of charged starch particles............................................................119
Scheme 6.3: Proposed interactions between PCC, polymer additives and the fiber..............121
Scheme 6.4: The papermaking flow chart used in this study ...............................................123
xx
List of tables
Table 2.1: Applications of starch in various industries22........................................................12
Table 3.1: A comparison of the percentage grafting of cellulose as calculated from three
different methods, and the percentage incorporation of each monomer............................46
Table 3.2: Quantities of reactants and conditions used to graft potato starch modification.....51
Table 3.3: Quantities of reactants used for grafting a blend of starch and PVA .....................52
Table 3.4: Quantities of reactants used for Ce4+ initiated grafting of potato starch.................52
Table 3.5: Quantities of reactants and conditions used for Ce4+-KPS initiated grafting of
potato starch with cationic monomers .............................................................................53
Table 3.6: Quantities of reactants and conditions for graft copolymerization of acrylic acid
and acrylamide onto cellulose using Ce4+ initiation.........................................................54
Table 3.7: Quantities of reactants and conditions for graft copolymerization of acrylic acid
and acrylamide, onto cellulose and starch using Ce4+-KPS under microwave irradiation .54
Table 5.1: The average fluorescence values (no units) for selected areas in the scatter plot and
their standard deviation for the control and synthesized CaCO3 ....................................109
Table 6.1: The code of anionic-starch-coated starch particles and the anionic starch graft
copolymers used to make them .....................................................................................122
Table 6.2: The codes of the anionic-starch-coated starch particles and the anionic starch graft
copolymers used to make them .....................................................................................122
Table 6.3: Results of hand sheets made with anionic starch materials as additives ..............128
Table 6.4: Results of hand sheets made with graft copolymerized anionic starch coated starch
particles as additives .....................................................................................................149
xxi
List of abbreviations
AA Acrylic acid
ACC Amorphous calcium carbonate
AM Acrylamide
AP Anionic polymer
APS Ammonium persulfate
ASD Apparent sheet density
ASt Anionic starch
BI Burst index
BS Bending stiffness
BTS Bendtsen smoothness
CAN Cerium ammonium nitrate
α-CE Alpha cellulose
CMC Carboxyl methyl cellulose
CP Cationic polymer
CP/MAS Cross polarized/magic angle spinning
CSF Canadian standard freeness
CSt Cationic starch
DADMAC Diallyldimethyl ammonium chloride
FD Fully dissolved
FSC-A Forward scatter
FT-IR Fourier transform infrared
GAR Gurley air resistance
GCC Ground calcium carbonate
KPS Potassium persulfate
LCST Lowest critical solution temperature
MA Methyl acrylate
MAPTAC Methacrylamido-propyl-trimethyl ammonium chloride
MBAM Methylene bisacrylamide
MWP Microwave power
NaA Sodium acrylate
NIPAM N-isopropyl acrylamide
NMR Nuclear magnetic resonance
PAA Polyacrylic acid
xxii
PAANa Polyacrylic acid sodium salt
PAM Polyacrylamide
PCC Precipitated calcium carbonate
PD Partially dissolved
PDASt Partially dissolved anionic starch
PEO Polyethylene oxide
PVA Poly(vinyl alcohol)
RBA Relative bonded area
SSC-A Side scatter
SEM Scanning electron microscopy
SKL Sulfonated kraft lignin
T.E.A Tensile energy absorption
TEMED N,N,N',N'-tetramethylethylenediamine
TGA Thermogravimetric analysis
TI Tensile index
TS Tensile stiffness
UV Ultraviolet
XRD X-ray diffraction
xxiii
Scientific contributions emanating from this study
Journal articles
1) Matahwa H., Ramiah V., Jarrett W.L., McLeary J.B., Sanderson R.D. Microwave
assisted graft copolymerization of N-isopropyl acrylamide and methyl acrylate on
cellulose: Solid state NMR analysis and CaCO3 crystallization. Macromolecular
symposia 2007, 255, 50–56.
2) Matahwa H., Ramiah V., Sanderson. CaCO3 crystallization in the presence of
modified polysaccharides and linear polymeric additives. Journal of Crystal Growth
2008, 310, 4561-4569
3) Matahwa H., Sanderson R.D. Surface and statistical analysis of CaCO3 crystals
synthesized in the presence of florescein tagged starch grafted with polyacrylic acid
Journal of Crystal Growth 2008 (accepted)
Oral Presentation
1) Grafting of Polysaccharides with acrylamide and polyacrylic acid for CaCO3 crystal
growth. Presented at United Nations Education, Scientific and Cultural Organization
(UNESCO) conference 2006, Stellenbosch.
2) CaCO3 crystallization in the presence of modified polysaccharides and linear
polymeric additives. Presented at the 42nd IUPAC World Polymer Congress, Macro
2008, Taipei, Taiwan.
Poster Presentations
1) H. Matahwa, V. Ramiah, W.L. Jarrett*, J.B. McLeary, R.D. Sanderson, Graft
copolymerization of NIPAM and MA on α-cellulose by the ceric ion redox initiating
system under microwave irradiation. Presented at The 4th IUPAC Sponsored
International Symposium on Free Radical Polymerization: Kinetics and Mechanism,
Lucca (Italy); 3-8 September 2006
2) H. Matahwa, R.D. Sanderson, Synthesis of CaCO3 crystals in the presence of a
fluorescein tagged crystal growth modifier. Poster to be presented at The 10th Annual
UNESCO/IUPAC Conference on Macromolecules & Materials Berg-en-Dal, Kruger
National Park, Mpumalanga, South Africa 7-11 September 2008

1
Chapter 1: Introduction and objectives
2
1.1: Introduction
Polymeric raw materials can be classified as synthetic polymers and natural polymers. In the early
days, natural polymers were used to fulfill technological needs.1 As the depletion of natural
materials became inevitable, research moved towards synthetic polymers. Today polymeric
materials are well known for their diversity and usefulness in modern technology. Polymer products
are found in almost all aspects of technology, from simple household utilities to advanced
polymeric composites in high-tech engineering such as computers, space ships, etc.
Synthetic polymers gained momentum over natural polymers because they can be easily tailored to
offer properties superior to those of natural materials. Such properties enable synthetic materials to
be easily processed and thereby readily transformed into products. Notwithstanding this advantage
of synthetic polymers, the disadvantages include the fact that they are expensive and non-
biodegradable, and some are considered ‘toxic’ when compared to natural polymers. Natural
polymers are limited in their applications mainly because they are difficult to process and the
products have poor properties. Therefore, modification of natural polymers is used to obtain
materials with better properties and that are easier to process. Thus, in modern research,
incorporating natural polymers to improve the performance of synthetic materials in their required
applications will be cost effective. Moreover, the products will be biodegradable and safer to the
environment.
1.2: Natural polymers
Natural polymers play critical roles in all animals and plants. Natural polymers include the
following materials, mostly derived from plants: cellulose, starch and natural rubber and biological
polymers derived from animals: chitin, DNA/RNA and proteins. Plant derived natural polymers
(e.g. natural rubber, polysaccharides) are mostly found in abundance and are readily available, and
therefore they are used in many industrial applications.
In this study, the focus is also on the modification of naturally occurring plant or cereal derived
polysaccharides, and other related materials, for applications in CaCO3 crystal growth modification
and the paper industry.
3
1.3: Modification of polysaccharides
Various methods are used to modify polysaccharides in order to obtain useful products. The viscose
process is a widely used method for the modification of polysaccharides, especially cellulose, to
make them processable.2 Other methods include esterification and etherification of polysaccharides
by simple organic molecules,3-5 and grafting of polysaccharides with polymers.6,7 In most cases the
nature of the etherifying/esterifying reagent or grafted polymer determines the final properties of
the modified polysaccharide. Ultimately polymer design will come into effect to predict the
properties of the final material with respect to the intended application.
1.4: Crystal growth modification
Biominerization is a process by which organisms synthesize minerals. In the process of
biominerization, biological systems provide a chemical environment that controls the nucleation
and growth of unique mineral phases.8,9 Often these minerals exhibit hierarchical structural order,
leading to superior physical properties, not found either in their inorganic counterparts or in
synthetic materials. One particular aspect of interest to the material chemist is the means by which
these biological organisms use organic constituents to mediate the growth of the mineral phases.
Biominerals are grown under environmentally friendly conditions and have potential industrial and
biomedical applications.10 Thus, the controlled synthesis of inorganic materials with specific size
and morphology can contribute to the development of new materials in various fields such as
catalysis,11-13 medicine,14 electronics,12 cosmetics,12 etc. The biomimetics of CaCO3 is currently
being studied intensively due to its wide applications in industries such as rubber,15 paper,16
plastics17 and paint.18 CaCO3 fillers are one of the most abundant minerals and, like most filler
materials, its size, structure, specific surface area and morphology are of paramount importance.
1.5: The paper industry
The paper industry uses natural polysaccharides to produce all types of paper materials, mostly
cellulose fiber and starch based materials. In order to reduce the cost of raw materials, and therefore
increasing profits, low cost fillers, such as precipitated calcium carbonate (PCC) and ground
calcium carbonate (GCC), are added to more expensive pulped cellulose fiber during the production
of paper.19
4
1.6: Fillers
Fillers improve paper properties such as opacity, brightness and printability, and decrease the
drainage time. However, there is a limit in terms of the filler loading to which fillers can be added.
An excess of filler leads to deterioration of paper properties such as stiffness and strength.
Introduction of filler (above a certain level) in paper thus requires additives to promote paper
strength. Starch based materials are suitable for this purpose. Research is now underway to increase
filler loadings in paper without compromising the properties of paper.19-22 The use of materials that
promote fiber-fiber bonding, fiber-filler bonding and filler-filler bonding is a key factor in
increasing filler loadings in paper.
1.7: Objectives
The main aim of this study was to increase the PCC loading in paper without causing detrimental
effects to the properties of the paper. Since polysaccharides form hydrogen bonds with pulp
cellulose, they can be used as PCC retention aids when modification with polymers that can bind to
PCC. Towards this aim, several aspects of polysaccharide modification and the effects of their use
for paper application were investigated. The effects of the modified polysaccharides on the
following were investigated: calcium carbonate crystal growth modification during crystallization;
surface properties of the crystallized calcium carbonate, which is critical to fiber–filler bonding
strength; and filler retention in paper.
The objectives of the study are as follows:
1. Study the graft copolymerization of cellulose using a double initiator system (Ce+4–
KPS) under microwave irradiation so as to shorten the grafting reaction times and carry
out conventional grafting of polysaccharides using different initiator systems and
monomers.
2. Study the PCC flocculation properties of the grafted polysaccharides. This study
involved determining the effects of different modified polysaccharides, polymer
concentration and pH on the size of the PCC flocculants.
3. Study the effect of the modified polysaccharides on the crystallization of calcium
carbonate in terms of crystal morphology and size. This study included investigating the
possibility of using an alternative route for filler addition (alternate to adding already
formed PCC filler to pulp during papermaking), namely in-situ crystallization of calcium
5
carbonate (filler) in the presence of modified pulp or a starch-derived polymeric
additive.
4. Test the performance of the modified polysaccharides on paper. The work involved
preparation of hand sheets and evaluating the resulting properties such as the bending
stiffness, tensile strength, including the determination of the filler retention in the hand
sheets.
1.8: Layout of the thesis
The document is composed of seven chapters. Four chapters describe the experimental work done
on the grafting of polysaccharides, crystallization of calcium carbonate, determination of surface
properties and statistical analysis of crystallized calcium carbonate, and the use of modified starch
as PCC retention aid in papermaking.
Chapter 1: Introduction and objectives
Chapter 2: Historical and Theoretical background
Chapter 3: Grafting of polysaccharides with vinyl monomers using various initiator systems
The chapter describes the use of microwave in conjunction with cerium (IV)-potassium persulfate
double initiation for graft copolymerization. It describes the conventional grafting of
polysaccharides with both anionic and cationic monomers, and results on PCC flocculation using
modified polysaccharides are also discussed.
Chapter 4: Crystallization of CaCO3 in the presence of polymer template
This chapter describes the effect of the polymer template on size, polymorph and morphology of
CaCO3 crystals. The study evaluates the interactions between calcium carbonate and the modified
polysaccharides.
Chapter 5: Surface studies of the crystallized CaCO3
This chapter describes the surface properties of crystallized calcium carbonate. Fluorescent tagged
crystal growth modifiers and the measurement of particle zeta potentials was carried out. The work
also included coating of crystallized calcium carbonate with cationic and fluorescent tagged starch.
6
Chapter 6: Polymer testing in paper application
Synthesized polysaccharides graft copolymers were used in papermaking and the results discussed.
The work involved the use of modified starch and modified starch particles in hand sheet making in
order to increase PCC filler retention and improved the other properties, such as the tensile strength
and the bending stiffness. Thus, a comparison of the effect of different polymers and modified
starch particles on their performance in paper in terms of PCC filler retention and properties of the
hand sheets is reported.
Chapter 7: Conclusions and recommendations for future work.
1.9: References
(1) Guyoy, A., Tauer K. Reactions and Synthesis in Surfactant Systems, 2001, New York.
(2) Engström, A. C., Ek M., Henriksson G. Biomacromolecules 2006, 7(6), 2027-2031.
(3) Antova, G., Vasvasova P., Zlatanov M. Carbohydrate Polymers 2004, 57, 131-134.
(4) Satge, C., Veneuil B., Branland P., Granet R., Krausz P., Rozier J., Petit C. Carbohydrate
Polymers 2002, 49, 373-376.
(5) Wu, J., Zhang J., Zhang H., He J., Ren Q., Guo M. Biomacromolecules 2004, 5, 266-268.
(6) Gupta, K. C., Khandekar K. Biomacromolecules 2003, 4, 758-765.
(7) Sinn, C. G., Dimora R., Huin C., Sel O., Antonietti M. Macromolecules 2006 39(18), 6310-
6312. .
(8) Colfen, H., Qi L. Chemistry - A Euroupian Journal 2001, 7, 106-116.
(9) Yu, H., Lei M., Cheng B., Zhao X. Journal of Solid State Chemistry 2004, 177, 681-689.
(10) Murphy, W. L., Mooney D.J. Journal of the American Chemical Society 2002, 124(9),
1910-1917.
(11) Piccolo, A., Conte P., Tagliatesta P. Biomacromolecules 2005, 6(1), 351-358.
(12) Corma, A., Moliner M., Diaz-Cabanas M. J., Serna P., Femenia B., Primo J., Garcia H. New
Journal of Chemistry 2008, 32(8), 1338-1345.
(13) Coelfen, H., Antonietti M. Metal Ions in Life Sciences 2008, 4 607-643.
(14) Venkatesh, S., Byrne M. E., Peppas N. A., Hilt J. Z. Expert Opinion on Drug Delivery 2005,
2(6), 1085-1096.
(15) Skelhorn, D. A. Rubber World 1997, 216(1), 32-34.
(16) Dougherty, M. J., Neogi A. N., Park D. W. US Patent 2005, no. 20050247421.
7
(17) Krysztafkiewicz, A., Grodzka J., Jesionowski T., Rager B. Composite Interfaces 2001, 8(3-
4), 227-232.
(18) Luedecke, W., Aumann G. European Coatings Journal 2005, 9, 70-71.
(19) Klungness, J. H., Pianta F., Stroika M. L., Sykes M., Tan F., AbuBakr S. AIChE Symposium
Series 1999, 95(322), 99-102.
(20) Scallan, A. M., Middleton S.R. Papermaking Raw Materials 1985, Oxford
(21) Green, H. V., Scallan A.M. Pulp and Paper Canada 1982, 83(7), 203-207.
(22) Allen, G. G., Negri A.R., Ritzenthaler P. Tappi Journal 1992, 75(3), 239-244.

8
Chapter 2: Historical and theoretical background
9
2.1: Introduction
2.1.1: Polysaccharides
Polysaccharides are relatively complex carbohydrates, with the general formula (C6H10O5)n where n
is usually between 40 and 3000. The polymer chains are made up of monosaccharide units linked
together by glycosidic bonds. The class includes linear and branched, as well as semi-crystalline
and amorphous, types of polysaccharides, which are often insoluble in water at ambient
temperatures. Some polysaccharides contain the same type of polysaccharides
(homopolysaccharides), e.g. starch, and some contain different types of polysaccharides
(heteropolysaccharides), e.g. lignin. In nature, polysaccharides such as starch and glycogen serve as
energy storage whereas cellulose and chitin are responsible for structural integrity.
2.1.2: Cellulose
Cellulose is the most abundant biopolymer and also the most abundant polysaccharide. It is made
up of anhydroglucose units (AGUs) joined through 1,4-β-linkages,1-4 see Fig. 2.1. Cellulose is the
predominant material in plants which are renewable energy sources and can be utilized to produce
vast quantities of cellulose.4-8 The anhydroglucose units have three free hydroxyl (OH) groups
which serve as reactive centers for chemical modification.3 Some chemical modification results in
cellulose having certain new properties, making it suitable for various applications, depending on
the level of modification as well as the modifying polymer/reagent.
O
HOH
HH
H
H
OOH
O
OH
O
O
OH
HH
H
H H
OH
OH
O
HOH
HH
H
H
OOH
OH
O
OH
HH
H
H H
OH
OH
Fig. 2.1: The structure of cellulose.
Cellulose fiber consists of crystalline domains with amorphous domains between these crystalline
sections. The amorphous regions are capable of holding relatively large amounts of water by
capillary action, however, water cannot penetrate or swell crystalline cellulose.9 The amorphous
areas of cellulose can be easily etched away to give highly crystalline cellulose, although it results
in the reduction of fiber length. Bonding in fibers is primarily via intra- and intermolecular
hydrogen bonding between anhydroglucose (or other anhydropyranose) units. The intermolecular
bonds principally extend from the primary hydroxyl groups on the sixth carbon atom, to the
hydroxyls groups on the third carbon atom on an adjacent cellulose molecule.10
10
Natural cellulose (referred as cellulose I) is a metastable type of cellulose whose crystal structure
consists of parallel cellulose strands with no inter-sheet hydrogen bonding. Cellulose I exists in two
phases, namely cellulose Iα (triclinic) and cellulose Iβ (monoclinic). However, the proportions of
each phase are different, and depend on the origin of cellulose I. Cellulose Iα is more predominately
found in algae whilst Iβ is the major form in higher plants. The fiber repeat distance (1.043 nm for
the repeat dimer interior to the crystal, 1.029 nm on the surface11) are the same for the two types of
cellulose I but the displacements of their sheets relative to one another are different.12
The structure of cellulose fibers is best represented by a fibrillar network model.12 The model
considers the cellulose fibers as a network of elementary fibrils with random aggregation into micro
and macro-fibrils. Important structural characteristic of these cellulose fibers include:
i) the size of the crystallites
ii) the degree of crystallinity
iii) the molecular length of the polymer chains
iv) the degree of orientation of the fibrils and fibrillar aggregation along the fiber axis
Other types of cellulose allomorphs are cellulose II and cellulose III. Cellulose II can be obtained
by mercerization of cellulose I or regeneration from solubilized cellulose I. The structure of
cellulose II has been reported to consist of a two chain unit cell and a P21 space group where, the
two chains are in parallel arrangement and are cryptographically independent.13,14 Regeneration of
cellulose I gives the thermodynamically more stable cellulose II structure, with some inter-sheet
hydrogen-bonding. Cellulose II contains two different types of anhydroglucose units (A and B) with
different backbone structures and the chains consist of -A-A- or -B-B- repeat units15. Cellulose III is
formed from cellulose mercerized in ammonia and is similar to cellulose II but with the chains
parallel, as in cellulose Iα and cellulose Iβ.16
2.1.3: Starch
Starch consists of two major polymeric components, amylose and amylopectin, and is mainly
obtained from cereal grains, root crops, leaves, etc. Amylose is a linear polymer with glucose units
joined together by α(1–4) linkages.17 Physical characteristics important to functionality are starch
granule shape and size. The overall properties of starch are also a function of the
amylose/amylopectin ratio.18,19 The two polymers are very different structurally, amylose is linear
and amylopectin is highly branched, and each plays a critical role in the ultimate functionality of the
native starch.17 Some of the properties affected by the amylose/amylopectin ratio include solubility,
viscosity, gelatinization, shear resistance, texture, tackiness, gel stability and cold swelling.

11
2.1.3.1: The structure of amylopectin
Amylopectin is a branched polymer with glucose units linked together by α(1–4) glycosidic bonds
with branching taking place after every 24 to 30 glucose units, see Fig. 2.2. The branching occurs
through α(1–6) linkages and each amylopectin molecule contains up to two million glucose residues
in a compact structure.20
Fig. 2.2: The structure of amylopectin (amylose is linear).
The molecules are oriented radially in the starch granule and as the radius increases so does the
number of branches. This results in the formation of concentric regions of alternating amorphous
and crystalline structures, which contribute to growth rings. The Fig. 2.3A shows the organization
of the amorphous and crystalline domains of the structure.
Fig. 2.3: A) Schematic representation of the branching nature of amylopectin in a starch granule. B) Orientation
of amylopectin molecules in an ideal granule.21
Amorphous regions
crystalline regions
? -1,4 linked D-glucose
A-1,4,6 D-glucose branch points
Reducing end
Hilum
A
B
Amorphous regions
crystalline regions
? -1,4 linked D-glucose
A-1,4,6 D-glucose branch points
Reducing end
Hilum
A
B
α
α
Amorphous regions
crystalline regions
? -1,4 linked D-glucose
A-1,4,6 D-glucose branch points
Reducing end
Hilum
A
B
Amorphous regions
crystalline regions
? -1,4 linked D-glucose
A-1,4,6 D-glucose branch points
Reducing end
Hilum
A
B
Amorphous regions
crystalline regions
? -1,4 linked D-glucose
A-1,4,6 D-glucose branch points
Reducing end
Hilum
A
B
Amorphous regions
crystalline regions
? -1,4 linked D-glucose
A-1,4,6 D-glucose branch points
Reducing end
Hilum
A
B
α
α
O
OH
H
OOH
H OH
H
O
O
HH
H
OOH
H OH
H
OH
O
HH
H
OOH
H OH
OH
O
OH
HOH
H OH
H
OH
HHO
HH
H
OH
H OH
H
OH
.
.
O
OH
H
OOH
H OH
H
O
O
HH
H
OOH
H OH
H
OH
O
HH
H
OOH
H OH
OH
O
OH
HOH
H OH
H
OH
HHO
HH
H
OH
H OH
H
OH
.
.
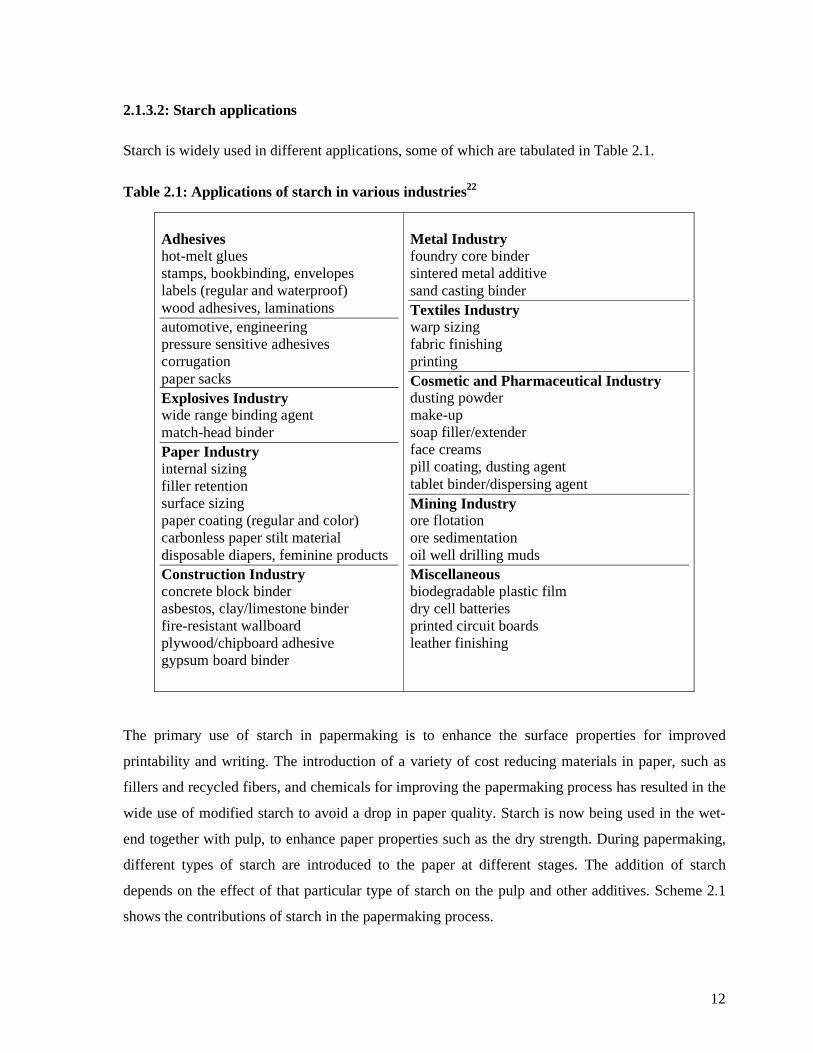
12
2.1.3.2: Starch applications
Starch is widely used in different applications, some of which are tabulated in Table 2.1.
Table 2.1: Applications of starch in various industries22
Adhesives hot-melt glues stamps, bookbinding, envelopes labels (regular and waterproof) wood adhesives, laminations automotive, engineering pressure sensitive adhesives corrugation paper sacks Explosives Industry wide range binding agent match-head binder Paper Industry internal sizing filler retention surface sizing paper coating (regular and color) carbonless paper stilt material disposable diapers, feminine products Construction Industry concrete block binder asbestos, clay/limestone binder fire-resistant wallboard plywood/chipboard adhesive gypsum board binder
Metal Industry foundry core binder sintered metal additive sand casting binder Textiles Industry warp sizing fabric finishing printing Cosmetic and Pharmaceutical Industry dusting powder make-up soap filler/extender face creams pill coating, dusting agent tablet binder/dispersing agent Mining Industry ore flotation ore sedimentation oil well drilling muds Miscellaneous biodegradable plastic film dry cell batteries printed circuit boards leather finishing
The primary use of starch in papermaking is to enhance the surface properties for improved
printability and writing. The introduction of a variety of cost reducing materials in paper, such as
fillers and recycled fibers, and chemicals for improving the papermaking process has resulted in the
wide use of modified starch to avoid a drop in paper quality. Starch is now being used in the wet-
end together with pulp, to enhance paper properties such as the dry strength. During papermaking,
different types of starch are introduced to the paper at different stages. The addition of starch
depends on the effect of that particular type of starch on the pulp and other additives. Scheme 2.1
shows the contributions of starch in the papermaking process.
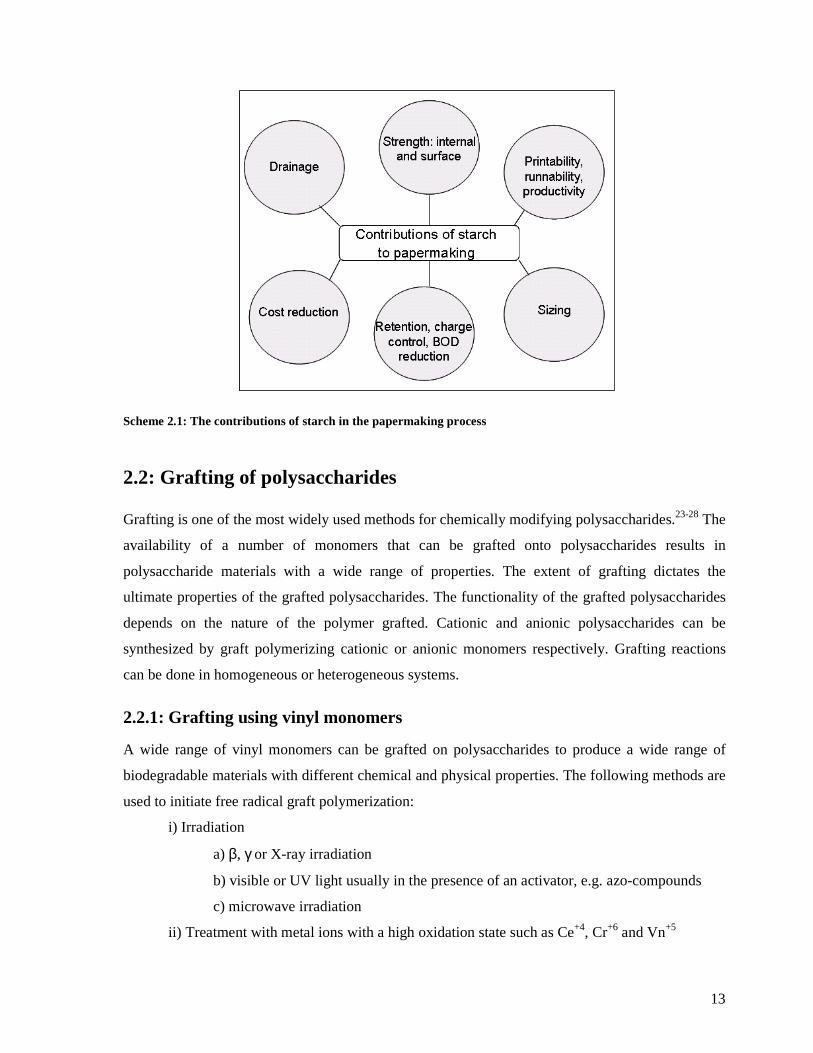
13
Scheme 2.1: The contributions of starch in the papermaking process
2.2: Grafting of polysaccharides
Grafting is one of the most widely used methods for chemically modifying polysaccharides.23-28 The
availability of a number of monomers that can be grafted onto polysaccharides results in
polysaccharide materials with a wide range of properties. The extent of grafting dictates the
ultimate properties of the grafted polysaccharides. The functionality of the grafted polysaccharides
depends on the nature of the polymer grafted. Cationic and anionic polysaccharides can be
synthesized by graft polymerizing cationic or anionic monomers respectively. Grafting reactions
can be done in homogeneous or heterogeneous systems.
2.2.1: Grafting using vinyl monomers
A wide range of vinyl monomers can be grafted on polysaccharides to produce a wide range of
biodegradable materials with different chemical and physical properties. The following methods are
used to initiate free radical graft polymerization:
i) Irradiation
a) β, γ or X-ray irradiation
b) visible or UV light usually in the presence of an activator, e.g. azo-compounds
c) microwave irradiation
ii) Treatment with metal ions with a high oxidation state such as Ce+4, Cr+6 and Vn+5
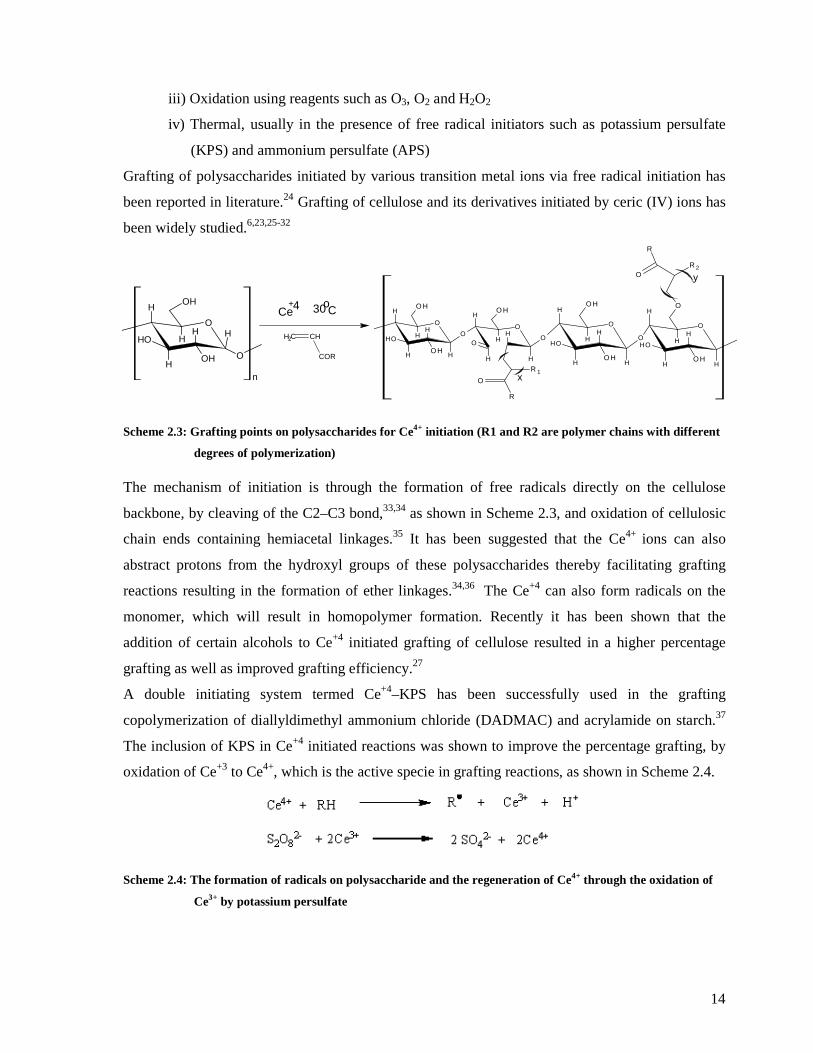
14
iii) Oxidation using reagents such as O3, O2 and H2O2
iv) Thermal, usually in the presence of free radical initiators such as potassium persulfate
(KPS) and ammonium persulfate (APS)
Grafting of polysaccharides initiated by various transition metal ions via free radical initiation has
been reported in literature.24 Grafting of cellulose and its derivatives initiated by ceric (IV) ions has
been widely studied.6,23,25-32
Scheme 2.3: Grafting points on polysaccharides for Ce4+ initiation (R1 and R2 are polymer chains with different
degrees of polymerization)
The mechanism of initiation is through the formation of free radicals directly on the cellulose
backbone, by cleaving of the C2–C3 bond,33,34 as shown in Scheme 2.3, and oxidation of cellulosic
chain ends containing hemiacetal linkages.35 It has been suggested that the Ce4+ ions can also
abstract protons from the hydroxyl groups of these polysaccharides thereby facilitating grafting
reactions resulting in the formation of ether linkages.34,36 The Ce+4 can also form radicals on the
monomer, which will result in homopolymer formation. Recently it has been shown that the
addition of certain alcohols to Ce+4 initiated grafting of cellulose resulted in a higher percentage
grafting as well as improved grafting efficiency.27
A double initiating system termed Ce+4–KPS has been successfully used in the grafting
copolymerization of diallyldimethyl ammonium chloride (DADMAC) and acrylamide on starch.37
The inclusion of KPS in Ce+4 initiated reactions was shown to improve the percentage grafting, by
oxidation of Ce+3 to Ce4+, which is the active specie in grafting reactions, as shown in Scheme 2.4.
Scheme 2.4: The formation of radicals on polysaccharide and the regeneration of Ce4+ through the oxidation of
Ce3+ by potassium persulfate
x
y
R 1
O
R
O
HO H
HH
H
H
OH
O H
OO
HO H
HH
H
H
OH
O H
O
H
HH
H
H
O
O H
O O
O
HO H
HH
H
H
OH
O
R 2O
R
Ce4+ 30oC
CH2 CH
COR
O
OH
HH
H
H
OH
OH
O
H
n

15
Grafting of itaconic acid on cellulose was also carried out using KPS as initiator and the mechanism
of radical formation on the cellulose backbone was explained to be via proton abstraction by
initiator radicals.38 Microwave assisted grafting of chitosan39 and guar gum40 has been carried out
with and without the redox system AgNO3/KPS/ascorbic acid. Microwave activation was also used
in the homogeneous esterification of cellulose.41,42 The use of microwave in grafting reactions
offers shorter reaction times compared to conventional methods.
In conventional free radical graft copolymerization, free radical sites are produced along the
polysaccharide backbone either by chemical reactions or radiation.36,37 Then the radicals formed
initiate the graft polymerization of vinyl monomers. The major drawbacks of these methods include
chain degradation of the polysaccharide backbone during the formation of free radical grafting
sites,43-45 the presence of a considerable amount of ungrafted material in the product, as well as
little control over the grafting process in terms of yield and the molar mass of the graft
copolymers.43-45 The synthesis of grafted block copolymers is also not possible because the chain
ends of the first block are not reactive. The living radical polymerization techniques permit the
synthesis of well-defined cellulosic graft copolymers of predetermined molar mass, thus giving us
the opportunity to tailor the surface properties of the cellulose for the required properties. Although
living polymerization methods such as RAFT mediated polymerization46 and ATRP44,47 can be used
to overcome some of the above-mentioned drawbacks of conventional free radical polymerization
systems, the living processes requires multiple steps of modifying the polysaccharide with either a
RAFT agent, macro initiator or vinyl monomer. Thus the graft density depends very much on the
degree of substitution by these reactive modifiers. The method of choice for polysaccharides
modification thus depends entirely on the end application intended for the material and practical
considerations.
2.2.2: Other grafting techniques
Grafting processes that do not involve the use of vinyl monomers are classified in two groups:
grafting by ring opening polymerization and grafting of a preformed polymer.
2.2.2.1: Grafting by ring opening polymerization
Cyclic monomers can be grafted onto polysaccharides via the ring opening polymerization
technique.48 Four classes of cyclic monomers that can undergo ring opening graft copolymerization
include:
i) epoxides
ii) lactones
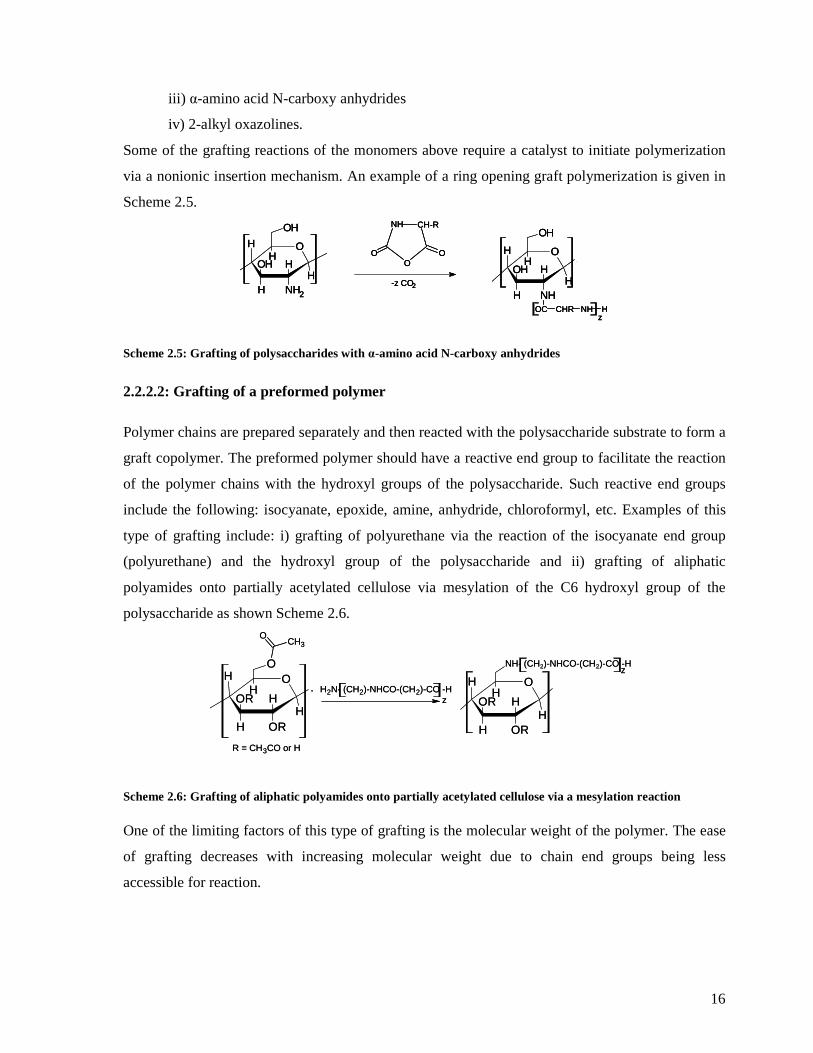
16
iii) α-amino acid N-carboxy anhydrides
iv) 2-alkyl oxazolines.
Some of the grafting reactions of the monomers above require a catalyst to initiate polymerization
via a nonionic insertion mechanism. An example of a ring opening graft polymerization is given in
Scheme 2.5.
Scheme 2.5: Grafting of polysaccharides with α-amino acid N-carboxy anhydrides
2.2.2.2: Grafting of a preformed polymer
Polymer chains are prepared separately and then reacted with the polysaccharide substrate to form a
graft copolymer. The preformed polymer should have a reactive end group to facilitate the reaction
of the polymer chains with the hydroxyl groups of the polysaccharide. Such reactive end groups
include the following: isocyanate, epoxide, amine, anhydride, chloroformyl, etc. Examples of this
type of grafting include: i) grafting of polyurethane via the reaction of the isocyanate end group
(polyurethane) and the hydroxyl group of the polysaccharide and ii) grafting of aliphatic
polyamides onto partially acetylated cellulose via mesylation of the C6 hydroxyl group of the
polysaccharide as shown Scheme 2.6.
Scheme 2.6: Grafting of aliphatic polyamides onto partially acetylated cellulose via a mesylation reaction
One of the limiting factors of this type of grafting is the molecular weight of the polymer. The ease
of grafting decreases with increasing molecular weight due to chain end groups being less
accessible for reaction.
O
HH
H
OH
H NH2
H
OH
O.
HH
H
OH
H NHH
OH
OC CHR NH Hz
-z CO2
NH CH-R
OO O
O
HH
H
OH
H NH2
H
OH
O.
HH
H
OH
H NHH
OH
OC CHR NH Hz
-z CO2
NH CH-R
OO O
O
HH
H
OH
H NH2
H
OH
O.
HH
H
OH
H NHH
OH
OC CHR NH Hz
-z CO2
NH CH-R
OO O
H2N- (CH2)-NHCO-(CH2)-CO -H
zO .
HH
H
.OR
H ORH
NH- (CH2)-NHCO-(CH2)-CO -H
z
O.
HH
H
OR
H ORH
O
CH3O
R = CH3CO or H
H2N- (CH2)-NHCO-(CH2)-CO -H
zO .
HH
H
.OR
H ORH
NH- (CH2)-NHCO-(CH2)-CO -H
z
O.
HH
H
OR
H ORH
O
CH3O
R = CH3CO or H
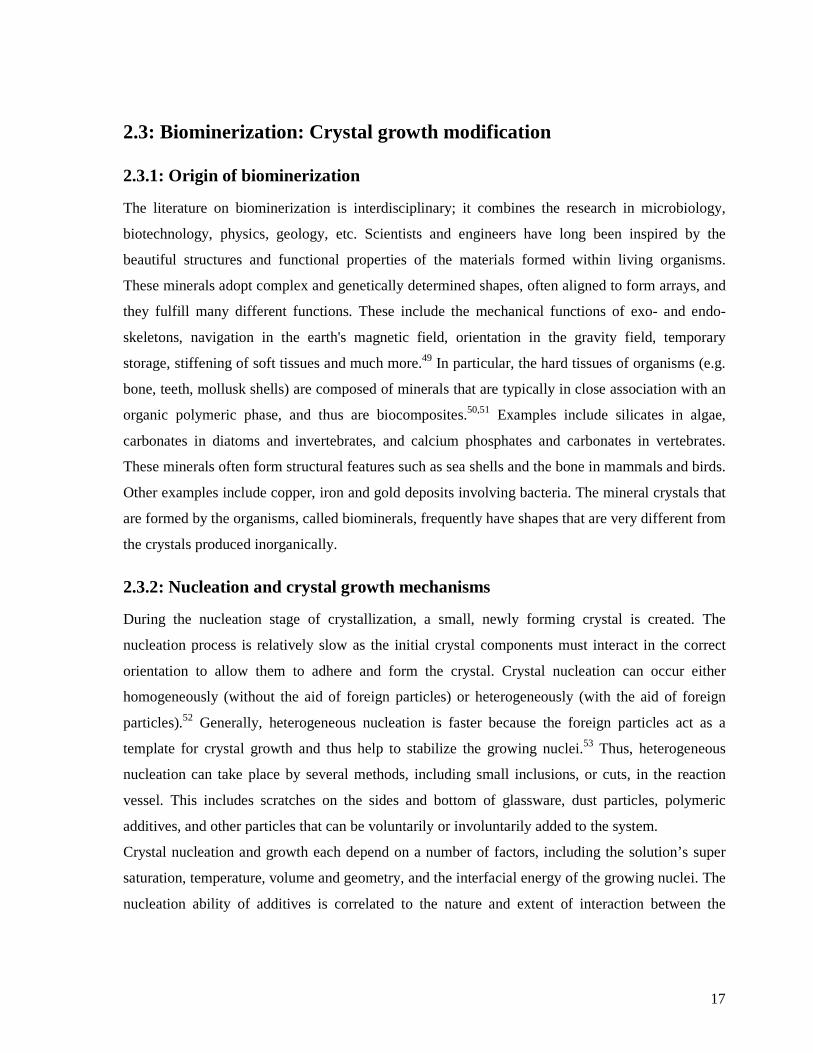
17
2.3: Biominerization: Crystal growth modification
2.3.1: Origin of biominerization
The literature on biominerization is interdisciplinary; it combines the research in microbiology,
biotechnology, physics, geology, etc. Scientists and engineers have long been inspired by the
beautiful structures and functional properties of the materials formed within living organisms.
These minerals adopt complex and genetically determined shapes, often aligned to form arrays, and
they fulfill many different functions. These include the mechanical functions of exo- and endo-
skeletons, navigation in the earth's magnetic field, orientation in the gravity field, temporary
storage, stiffening of soft tissues and much more.49 In particular, the hard tissues of organisms (e.g.
bone, teeth, mollusk shells) are composed of minerals that are typically in close association with an
organic polymeric phase, and thus are biocomposites.50,51 Examples include silicates in algae,
carbonates in diatoms and invertebrates, and calcium phosphates and carbonates in vertebrates.
These minerals often form structural features such as sea shells and the bone in mammals and birds.
Other examples include copper, iron and gold deposits involving bacteria. The mineral crystals that
are formed by the organisms, called biominerals, frequently have shapes that are very different from
the crystals produced inorganically.
2.3.2: Nucleation and crystal growth mechanisms
During the nucleation stage of crystallization, a small, newly forming crystal is created. The
nucleation process is relatively slow as the initial crystal components must interact in the correct
orientation to allow them to adhere and form the crystal. Crystal nucleation can occur either
homogeneously (without the aid of foreign particles) or heterogeneously (with the aid of foreign
particles).52 Generally, heterogeneous nucleation is faster because the foreign particles act as a
template for crystal growth and thus help to stabilize the growing nuclei.53 Thus, heterogeneous
nucleation can take place by several methods, including small inclusions, or cuts, in the reaction
vessel. This includes scratches on the sides and bottom of glassware, dust particles, polymeric
additives, and other particles that can be voluntarily or involuntarily added to the system.
Crystal nucleation and growth each depend on a number of factors, including the solution’s super
saturation, temperature, volume and geometry, and the interfacial energy of the growing nuclei. The
nucleation ability of additives is correlated to the nature and extent of interaction between the
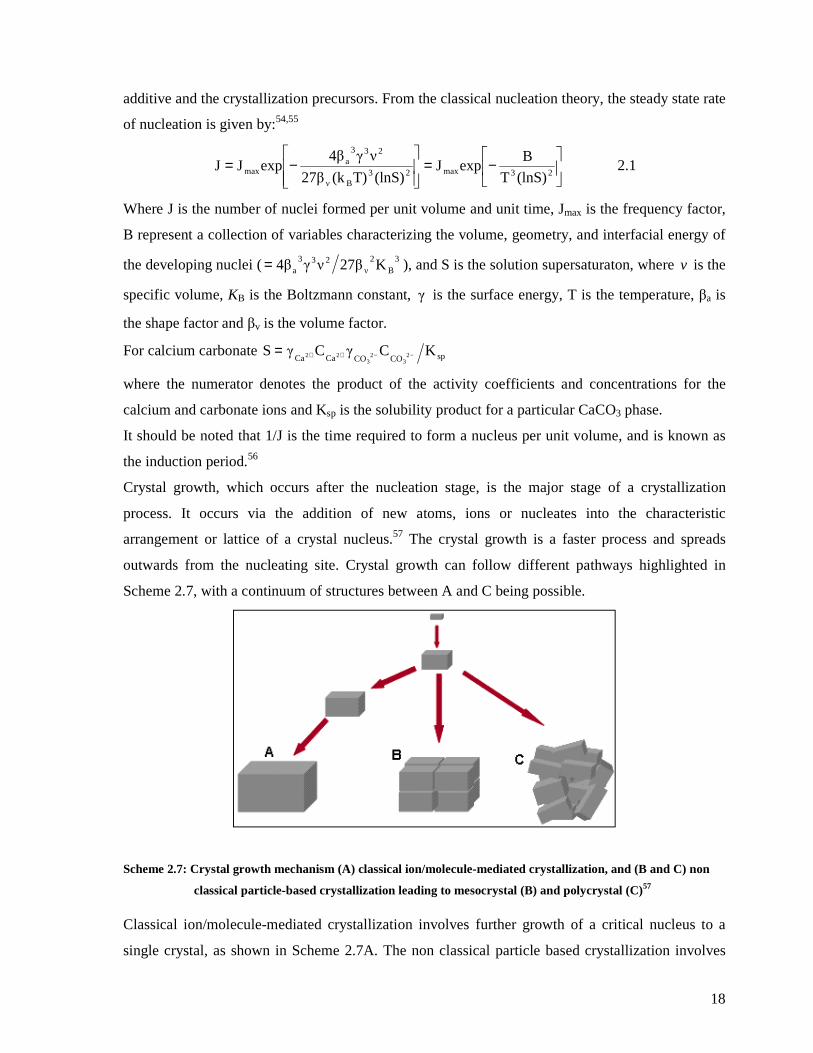
18
additive and the crystallization precursors. From the classical nucleation theory, the steady state rate
of nucleation is given by:54,55
−=
−=
23max23Bν
233a
max (lnS)T
BexpJ
(lnS)T)(k27β
νγ4βexpJJ 2.1
Where J is the number of nuclei formed per unit volume and unit time, Jmax is the frequency factor,
B represent a collection of variables characterizing the volume, geometry, and interfacial energy of
the developing nuclei ( 3B
2ν
233a K27βνγ4β= ), and S is the solution supersaturaton, where v is the
specific volume, KB is the Boltzmann constant, γ is the surface energy, T is the temperature, βa is
the shape factor and βv is the volume factor.
For calcium carbonate spCOCOCaCaKCγCγS 2
32
322 −−++=
where the numerator denotes the product of the activity coefficients and concentrations for the
calcium and carbonate ions and Ksp is the solubility product for a particular CaCO3 phase.
It should be noted that 1/J is the time required to form a nucleus per unit volume, and is known as
the induction period.56
Crystal growth, which occurs after the nucleation stage, is the major stage of a crystallization
process. It occurs via the addition of new atoms, ions or nucleates into the characteristic
arrangement or lattice of a crystal nucleus.57 The crystal growth is a faster process and spreads
outwards from the nucleating site. Crystal growth can follow different pathways highlighted in
Scheme 2.7, with a continuum of structures between A and C being possible.
Scheme 2.7: Crystal growth mechanism (A) classical ion/molecule-mediated crystallization, and (B and C) non
classical particle-based crystallization leading to mesocrystal (B) and polycrystal (C)57
Classical ion/molecule-mediated crystallization involves further growth of a critical nucleus to a
single crystal, as shown in Scheme 2.7A. The non classical particle based crystallization involves
19
aggregation of preformed crystals to form a thermodynamic stable crystal either through uniform
packing (Scheme 2.7B) or random packing of these crystals (Scheme 2.7C). The driving force for
this packing is the reduction in the surface energy of the system. Kulak et al.57 found that the
polycrystals was favored by high solution super saturation, whereby rapid nucleation generates a
large number of precursor nanoparticles. The nano precursors will then aggregate, forming
polycrystalline structures held together by van der Waals forces. Reduction in super saturation
allows the formation of mesocrystals due to slower aggregation effected by a smaller number of the
nano precursor ions.
The presence of polymeric additives leads to modification of the size and shape of the primary
nanoparticles as well as the number of particles produced. Thus, aggregation of different nano
precursors gives crystals of different sizes and shapes. Moreover, polymorph selectivity can be
effected by polymeric additives depending on the level of interaction of the additive and the
calcium carbonate precursors.
2.3.3: Crystallization of calcium carbonate
The aim of biomimetics is to mimic the natural manner in which organisms produce minerals.49 One
particular area of interest is the molecular control mechanisms that biological systems use to form
the well-defined inorganic solid state materials. Much of modern materials science is concerned
with hybrid materials, which leads to some overlap in the techniques used in these fields. One
property of biominerals must be that of low solubility under physiological conditions. Calcium
carbonate deposition is generally controlled by an equilibrium shift due to the consumption of CO2
but there are many processes with greater control for the formation of other biominerals.58 Careful
control of nucleation and crystal growth of these processes can be achieved via highly regulated
active transport mechanisms and via specific modulation of surface reactivity.59
Calcium carbonate has various applications in the paper, textile, paint, rubber and adhesive
industries. Therefore there is a growing interest in CaCO3 crystallization using polymeric additives
as crystal growth modifiers or nucleating agents.60-66 Calcium carbonate exists in three polymorphs:
vaterite, aragonite and calcite (in order of decreasing thermodynamic stability). The crystal type of
calcite is trigonic, with three common modifications: rhombohedral (cubic), scalenohedral
(columnar), and an intermediary prismatic (barrel-shaped) structure. The density of calcite is 2.72
kg/dm3. The crystal type of aragonite is orthorhombic, needle-formed (acircular), forming rhombic
double-pyramids, which are more dense (density 2.94 kg/dm3) and harder than calcite. Both
aragonite and calcite are bi-refringent, and the refractive index of aragonite is slightly higher than
20
that of calcite because of the higher density. Vaterite is an unstable hexagonal calcium carbonate,
with a round particle shape.
The presence of polymers with functional groups during CaCO3 crystallization directs nucleation
and growth of CaCO3 crystals.51,67,68 Polymeric additives with polar groups influence CaCO3
crystallization by an adsorption mechanism, through the interaction between the polar groups and
the growing nuclei.51,60,68 Studies carried out on the crystallization of CaCO3 revealed that crystal
growth and morphology are a function of a number of parameters, including the pH,50,63,69
temperature,50,63 reaction time,50,63,70,71 stoichiometry of reactants,57,70,72 concentration of the
polymeric or organic additive,50,59,64,69,70,73,74 and the nature of the polymeric additives.57,59-
61,64,66,71,73-76 In general, some polymeric additives such as polyacrylic acid, carboxymethylcellulose,
and those containing the carboxylate group may act as inhibitors of CaCO3 crystal growth.77-80
The use of polymeric or organic additives of different functionalities as crystal growth modifiers for
CaCO3 crystallization may result in CaCO3 crystals of different sizes and morphologies, as well as
polymorphs. In some cases, polymeric additives direct the synthesis of the less thermodynamic
stable CaCO3 polymorphs.50,61-63,70,73,81,82 Takiguchi et al.83 grew CaCO3 crystals on the surface of a
cation-exchange membrane and obtained mostly calcite crystals that self-assembled to form tubular
agglomerates. Anionic dendrimers, e.g. poly(amidoamine), were also used by Naka et al.80 to
modify CaCO3 crystals and predominantly calcite spherical crystals were obtained. Jada and
Verraes84 obtained spherical particles (1-5.5µm) when anionic polyelectrolytes were used to
influence the growth of CaCO3 and the polymorphs formed were a mixture of calcite and aragonite.
Spherical particles were also synthesized in the presence of hyperbranched polyesters,85 anionic
surfactants,73 modified carbon nanotubes,86 and polyacrylic acid.70 The effect of polyacrylamide
polymers was studied by Yu et al;63 aragonite nanorods were obtained after 12 hours at a
crystallization temperature of 80 oC, and pH 7. At pH 10, the crystal morphology changed to
hexagonal disks that were mostly vaterite, and to a lesser extent, aragonite. Kim et al.74 also
obtained aragonite nanorods when polyvinyl alcohol was used as crystal growth modifier. The
nanorods were formed through the transformation of vaterite to aragonite after several days. Naka et
al.70 obtained spherical vaterite crystals when polyacrylic acid was used as polymeric additive. The
synthesis of CaCO3 was also carried out in microemulsions by Liu et al.87 They used surfactants to
stabilize the emulsions. Hexagonal vaterite crystals were obtained after a day and rod-shaped
prismatic calcite crystals after six days. Biopolymers, xanthan, gellan, k-carrageenan, sodium
alginate and pectin were also used as additives in CaCO3 crystallization by Butler et al.,59 and
different crystal morphologies were obtained. Chitin, a nitrogen containing polysaccharide, was also
used as a crystal growth modifier of CaCO3 crystallization by Manoli et al.,51 and calcite crystals
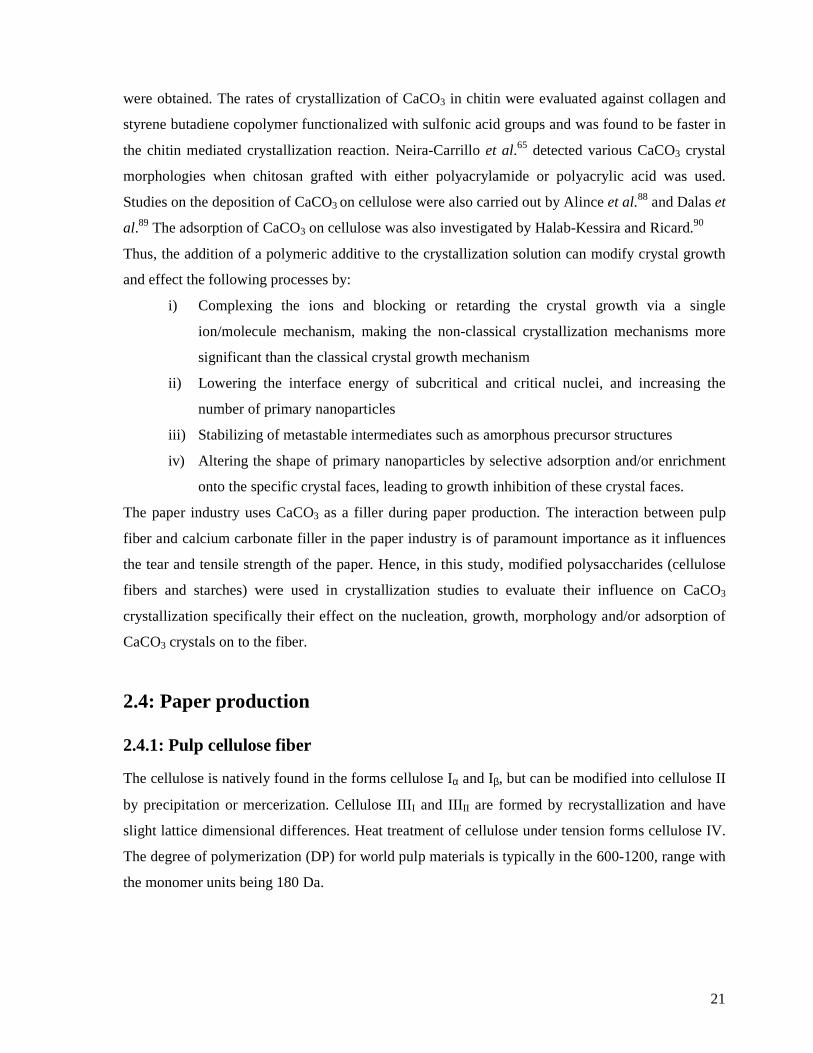
21
were obtained. The rates of crystallization of CaCO3 in chitin were evaluated against collagen and
styrene butadiene copolymer functionalized with sulfonic acid groups and was found to be faster in
the chitin mediated crystallization reaction. Neira-Carrillo et al.65 detected various CaCO3 crystal
morphologies when chitosan grafted with either polyacrylamide or polyacrylic acid was used.
Studies on the deposition of CaCO3 on cellulose were also carried out by Alince et al.88 and Dalas et
al.89 The adsorption of CaCO3 on cellulose was also investigated by Halab-Kessira and Ricard.90
Thus, the addition of a polymeric additive to the crystallization solution can modify crystal growth
and effect the following processes by:
i) Complexing the ions and blocking or retarding the crystal growth via a single
ion/molecule mechanism, making the non-classical crystallization mechanisms more
significant than the classical crystal growth mechanism
ii) Lowering the interface energy of subcritical and critical nuclei, and increasing the
number of primary nanoparticles
iii) Stabilizing of metastable intermediates such as amorphous precursor structures
iv) Altering the shape of primary nanoparticles by selective adsorption and/or enrichment
onto the specific crystal faces, leading to growth inhibition of these crystal faces.
The paper industry uses CaCO3 as a filler during paper production. The interaction between pulp
fiber and calcium carbonate filler in the paper industry is of paramount importance as it influences
the tear and tensile strength of the paper. Hence, in this study, modified polysaccharides (cellulose
fibers and starches) were used in crystallization studies to evaluate their influence on CaCO3
crystallization specifically their effect on the nucleation, growth, morphology and/or adsorption of
CaCO3 crystals on to the fiber.
2.4: Paper production
2.4.1: Pulp cellulose fiber
The cellulose is natively found in the forms cellulose Iα and Iβ, but can be modified into cellulose II
by precipitation or mercerization. Cellulose IIII and IIIII are formed by recrystallization and have
slight lattice dimensional differences. Heat treatment of cellulose under tension forms cellulose IV.
The degree of polymerization (DP) for world pulp materials is typically in the 600-1200, range with
the monomer units being 180 Da.
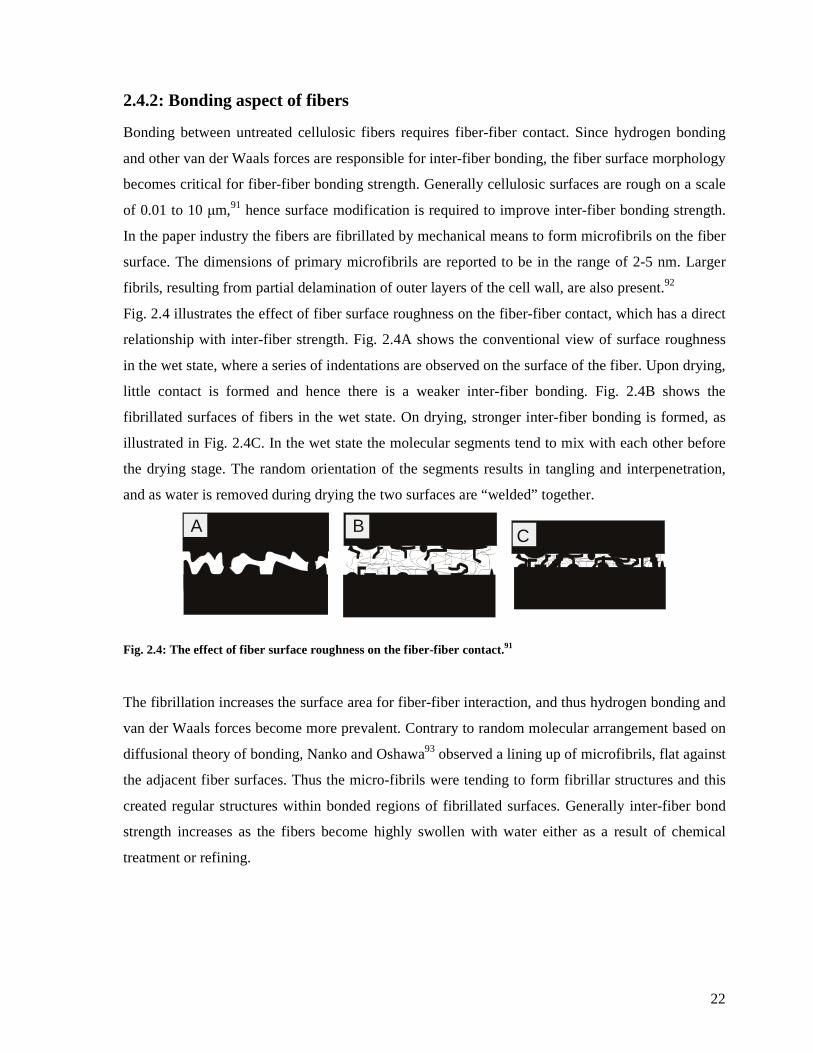
22
2.4.2: Bonding aspect of fibers
Bonding between untreated cellulosic fibers requires fiber-fiber contact. Since hydrogen bonding
and other van der Waals forces are responsible for inter-fiber bonding, the fiber surface morphology
becomes critical for fiber-fiber bonding strength. Generally cellulosic surfaces are rough on a scale
of 0.01 to 10 µm,91 hence surface modification is required to improve inter-fiber bonding strength.
In the paper industry the fibers are fibrillated by mechanical means to form microfibrils on the fiber
surface. The dimensions of primary microfibrils are reported to be in the range of 2-5 nm. Larger
fibrils, resulting from partial delamination of outer layers of the cell wall, are also present.92
Fig. 2.4 illustrates the effect of fiber surface roughness on the fiber-fiber contact, which has a direct
relationship with inter-fiber strength. Fig. 2.4A shows the conventional view of surface roughness
in the wet state, where a series of indentations are observed on the surface of the fiber. Upon drying,
little contact is formed and hence there is a weaker inter-fiber bonding. Fig. 2.4B shows the
fibrillated surfaces of fibers in the wet state. On drying, stronger inter-fiber bonding is formed, as
illustrated in Fig. 2.4C. In the wet state the molecular segments tend to mix with each other before
the drying stage. The random orientation of the segments results in tangling and interpenetration,
and as water is removed during drying the two surfaces are “welded” together.
BA C
Fig. 2.4: The effect of fiber surface roughness on the fiber-fiber contact.91
The fibrillation increases the surface area for fiber-fiber interaction, and thus hydrogen bonding and
van der Waals forces become more prevalent. Contrary to random molecular arrangement based on
diffusional theory of bonding, Nanko and Oshawa93 observed a lining up of microfibrils, flat against
the adjacent fiber surfaces. Thus the micro-fibrils were tending to form fibrillar structures and this
created regular structures within bonded regions of fibrillated surfaces. Generally inter-fiber bond
strength increases as the fibers become highly swollen with water either as a result of chemical
treatment or refining.
23
2.4.2.1: Capillary forces
Capillary forces were used to explain the development of paper strength during drying.94,95 The
ability of the wet paper to withstand significant tensile stress is due to capillary forces that tend to
pull adjacent fibers together. The forces normal to the plane on the sheet lend strength within the
plane of the sheet. Fig. 2.5 is an illustration showing a drop of water between two planes of paper
and that the water perfectly wets the surfaces.
Fig. 2.5: Schematic representation of a drop of water between two planes of paper, wetting the surface
completely.
Cambell95 showed that the magnitude of the negative pressure (∆P) within the meniscus can be
estimated using the following equation:
xγγ 2r∆P ≈≈ 2.2 where γ is the water-vapour interfacial tension, r is the smaller radius of curvature at the edge of
the film of water, and x is the distance between the solids.
The capillary forces, including the one defined by the equation 2.2, were found to result in a
reduction in the thickness of the wet paper as water is removed.95 In general, fiber surface
modification with surface active compounds results in weaker paper. There are two explanations for
this: firstly, from equation 2.2, surface modification with surface active compounds results in a
reduction of γ , thus decreasing the capillary forces that draw the paper together, and secondly, the
presence of the surface modifiers on the fiber surface may hinder the formation of hydrogen bonds
between surfaces.
2.4.2.2: Inter-fiber bond strength
The strength of the inter-fiber bonds is of paramount importance as it contributes to tensile failure.
The tensile strength of paper can be related to the strengths of individual fibers as well as to the
inter-fiber bonds. Light scattering techniques have been used to determine the relative bonded area
(RBA) of paper.96,97 The concept is based on the scattering of light as it passes through the paper
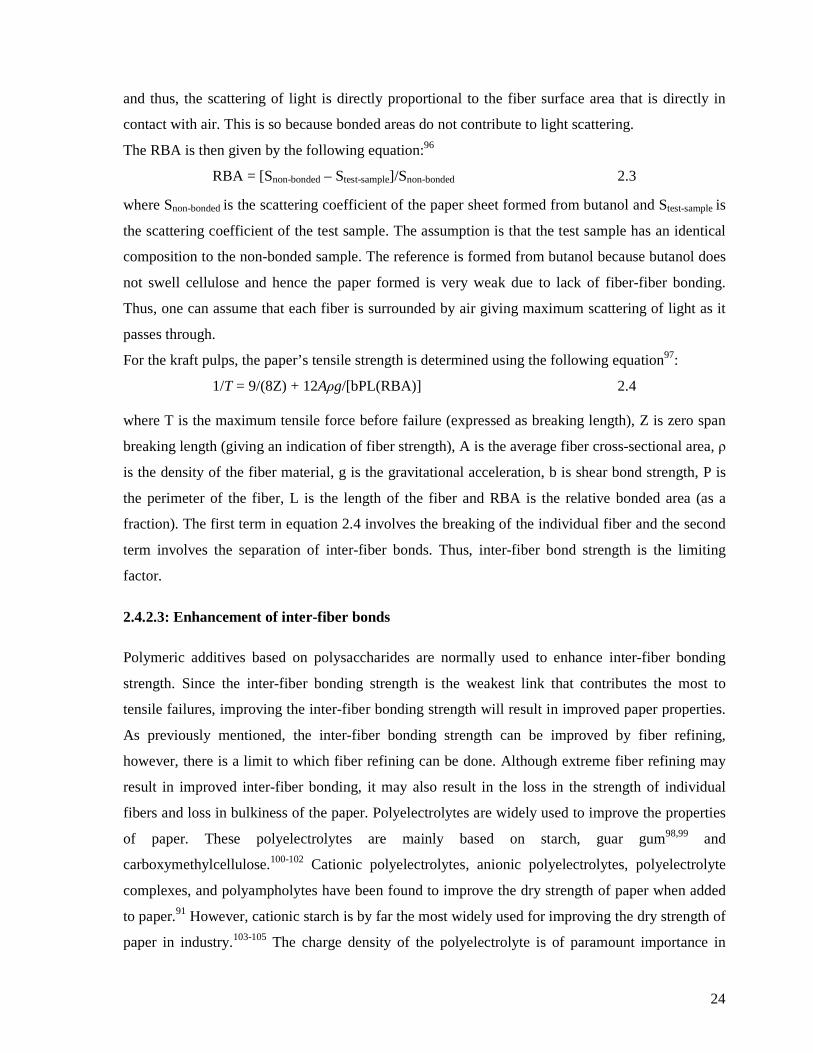
24
and thus, the scattering of light is directly proportional to the fiber surface area that is directly in
contact with air. This is so because bonded areas do not contribute to light scattering.
The RBA is then given by the following equation:96
RBA = [Snon-bonded – Stest-sample]/Snon-bonded 2.3
where Snon-bonded is the scattering coefficient of the paper sheet formed from butanol and Stest-sample is
the scattering coefficient of the test sample. The assumption is that the test sample has an identical
composition to the non-bonded sample. The reference is formed from butanol because butanol does
not swell cellulose and hence the paper formed is very weak due to lack of fiber-fiber bonding.
Thus, one can assume that each fiber is surrounded by air giving maximum scattering of light as it
passes through.
For the kraft pulps, the paper’s tensile strength is determined using the following equation97:
1/T = 9/(8Z) + 12Aρg/[bPL(RBA)] 2.4
where T is the maximum tensile force before failure (expressed as breaking length), Z is zero span
breaking length (giving an indication of fiber strength), A is the average fiber cross-sectional area, ρ
is the density of the fiber material, g is the gravitational acceleration, b is shear bond strength, P is
the perimeter of the fiber, L is the length of the fiber and RBA is the relative bonded area (as a
fraction). The first term in equation 2.4 involves the breaking of the individual fiber and the second
term involves the separation of inter-fiber bonds. Thus, inter-fiber bond strength is the limiting
factor.
2.4.2.3: Enhancement of inter-fiber bonds
Polymeric additives based on polysaccharides are normally used to enhance inter-fiber bonding
strength. Since the inter-fiber bonding strength is the weakest link that contributes the most to
tensile failures, improving the inter-fiber bonding strength will result in improved paper properties.
As previously mentioned, the inter-fiber bonding strength can be improved by fiber refining,
however, there is a limit to which fiber refining can be done. Although extreme fiber refining may
result in improved inter-fiber bonding, it may also result in the loss in the strength of individual
fibers and loss in bulkiness of the paper. Polyelectrolytes are widely used to improve the properties
of paper. These polyelectrolytes are mainly based on starch, guar gum98,99 and
carboxymethylcellulose.100-102 Cationic polyelectrolytes, anionic polyelectrolytes, polyelectrolyte
complexes, and polyampholytes have been found to improve the dry strength of paper when added
to paper.91 However, cationic starch is by far the most widely used for improving the dry strength of
paper in industry.103-105 The charge density of the polyelectrolyte is of paramount importance in
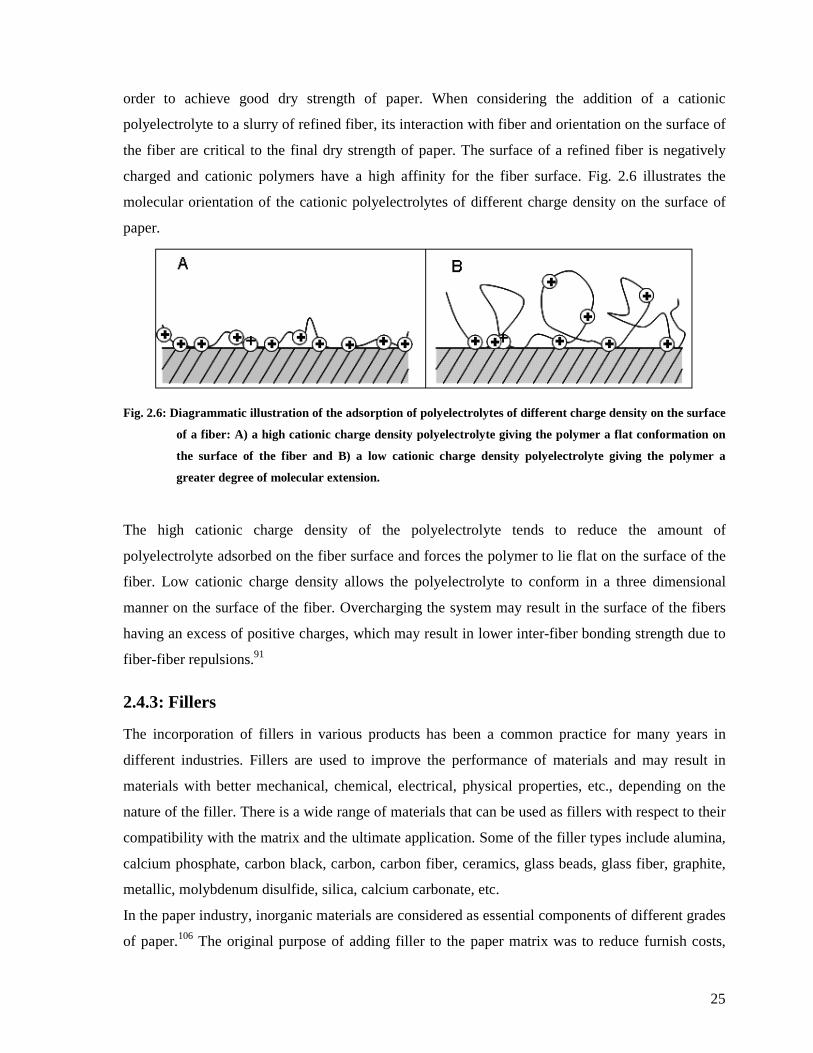
25
order to achieve good dry strength of paper. When considering the addition of a cationic
polyelectrolyte to a slurry of refined fiber, its interaction with fiber and orientation on the surface of
the fiber are critical to the final dry strength of paper. The surface of a refined fiber is negatively
charged and cationic polymers have a high affinity for the fiber surface. Fig. 2.6 illustrates the
molecular orientation of the cationic polyelectrolytes of different charge density on the surface of
paper.
Fig. 2.6: Diagrammatic illustration of the adsorption of polyelectrolytes of different charge density on the surface
of a fiber: A) a high cationic charge density polyelectrolyte giving the polymer a flat conformation on
the surface of the fiber and B) a low cationic charge density polyelectrolyte giving the polymer a
greater degree of molecular extension.
The high cationic charge density of the polyelectrolyte tends to reduce the amount of
polyelectrolyte adsorbed on the fiber surface and forces the polymer to lie flat on the surface of the
fiber. Low cationic charge density allows the polyelectrolyte to conform in a three dimensional
manner on the surface of the fiber. Overcharging the system may result in the surface of the fibers
having an excess of positive charges, which may result in lower inter-fiber bonding strength due to
fiber-fiber repulsions.91
2.4.3: Fillers
The incorporation of fillers in various products has been a common practice for many years in
different industries. Fillers are used to improve the performance of materials and may result in
materials with better mechanical, chemical, electrical, physical properties, etc., depending on the
nature of the filler. There is a wide range of materials that can be used as fillers with respect to their
compatibility with the matrix and the ultimate application. Some of the filler types include alumina,
calcium phosphate, carbon black, carbon, carbon fiber, ceramics, glass beads, glass fiber, graphite,
metallic, molybdenum disulfide, silica, calcium carbonate, etc.
In the paper industry, inorganic materials are considered as essential components of different grades
of paper.106 The original purpose of adding filler to the paper matrix was to reduce furnish costs,
26
with the amount of filler limited only by strength considerations. Today the principal need for fillers
is to impart specific quality improvements to the sheet. Depending on the performance
characteristics of the fillers and the amount added to the paper, these products can improve the
optical, physical, and aesthetic properties of the finished sheet. Moreover, the practice of utilizing
fillers is based on choosing materials that will provide both cost and quality improvements.
2.4.3.1: Functions of fillers in paper
Fillers are added to paper in various percentages, typically 10-20%, to perform many different
functions.106,107 The choice of which filler or blend of fillers to use depends upon the specific
properties desired.108 While fillers are used in many different grades of paper they find their greatest
utility in printing and writing paper grades. Fillers can contribute the following properties to paper:
o Reduce costs by replacing higher cost fibre with lower cost fillers
o Improve dimensional stability
o Provide a smoother surface
o Increase opacity and brightness
o Provide enhanced printability
o Improve sheet formation by filling in the void areas around fibre crossings.
The properties exhibited by fillers in paper are mainly dependent on two factors: i) the
characteristics of the filler and ii) the way in which it is used. Filler characteristics of importance are
their refractive index, particle morphology, particle size and distribution of size, specific surface
area, brightness/whiteness, particle charge (zeta potential), and abrasiveness. The manner in which
fillers are incorporated into paper varies considerably from machine to machine. The pulp species,
type and amount of refining, wet-end furnish components (such as starch, retention aids, and sizing
agents), and addition point of the fillers can cause the filler to behave quite differently depending on
the furnish conditions. Certainly the amount of filler incorporated into the sheet will have a
dramatic impact on sheet properties. More detailed information on the important characteristics of
fillers is presented in Section 2.4.3.2 as well as the specific properties of the two widely used filler
materials: precipitated calcium carbonate (PCC) and ground calcium carbonate (GCC).
2.4.3.2: Characteristics of fillers
Refractive index
The refractive index is a fundamental property of a filler, which is governed by its chemical
composition and molecular structure. Atomic structure has a direct influence upon light scattering
27
(opacity), because light entering the filler is refracted from its principal path several times within
the particle rather than transmitted through it. The greater the refractive index of a filler the greater
the amount of reflected light, which increases the opacity of the paper.
Particle morphology
The morphology of filler particles has been shown to be a significant characteristic of fillers. The
shape of the particles will influence the way light is scattered. This in turn will affect the optical
performance of the filler in paper. It has been proven in studies by Gill,109 Passaretti and Gill110 and
Fairchild107 that different morphologies within PCC cause different behaviors, in their ability to
scatter light. It is the size of the air microvoids that optimize light scattering, and not directly the
size of the particle, hence there is a different optimum for light scattering based on particle size
among the different morphologies.
The Mie theory111 predicts that the maximum scattering of light is obtained by spherical particles
that are one half the wavelength of light or 0.20–0.30 µm in diameter. Particles outside of this size
range scatter light with less efficiency. However, the Mie theory only holds true for spherical
particles such as plastic pigments, titanium dioxide, and certain types of ‘spherical’ calcium
carbonates. Fillers of a non-spherical nature such as kaolin and talc, and some precipitated forms of
calcium carbonates, do not behave in a way predicted by the classical Mie theory. Particle shape
also dictates the packing nature of the filler particles and greatly affects the fiber structure of the
sheet, influencing sheet bulk and porosity.108,112
Particle size and size distribution
The optical properties of all fillers are strongly influenced by the particle size, size distribution, and
the degree of agglomeration of the filler particles. Studies have shown that a narrow particle size
distribution promotes better light scattering efficiency, especially when the filler is uniformly
distributed throughout the sheet. Koppelman113 found that for plate-like particles like kaolin, the
optimum opacity was obtained when particles were between 0.70–1.5 µm equivalent spherical
diameters. Results of independent studies by Zeller114 and Gill109 showed that maximum opacity
was obtained when the particle size for prismatic-PCC was 0.40–0.50µm equivalent spherical
diameters and 0.9–1.5µm equivalent spherical diameters for scelenohedral-PCC. Furthermore, the
more narrow the particle size distribution around the optimum particle size for these fillers the
greater will be their contribution to paper opacity.
In the paper mill situation, the use of retention aids helps to retain fillers within the sheet, however,
they also cause the fillers to agglomerate. Agglomeration has been shown to have a negative effect
28
on opacity. Filler agglomeration can be controlled by proper use of all wet-end chemicals,
especially retention aids and starches, and optimizing the method and order of addition of the filler
with the rest of the papermaking furnish. Some fillers have a greater tendency to agglomerate than
others.
Specific surface area
The particle size, size distribution and shape of the filler have a direct impact on the specific surface
area.108,112 The filler’s surface area affects light scattering and also influences the strength and
printing characteristics of the paper. In general, high surface area fillers lend enhanced printability
to the sheet but at the expense of strength and ease of sizing. The principle cause of this weakening
effect is related to the filler interfering with fiber to fiber bonding within the matrix of the sheet.
Particle charge
The electrostatic charge, which surrounds a filler particle, plays an important role both in
maintaining proper dispersion of the filler as it is fed to the paper machine and in retaining the filler
within the paper.115 The non-hydrodynamic forces, which affect the behavior of particles, are of
three basic types: van der Waals (always attractive), electrostatic (requires unbalanced electrostatic
charge–may be attractive or repulsive) and steric (between adsorbed molecules or polymers–usually
repulsive if the molecules or polymers are water soluble). The balance between these forces (which
varies with inter-particle distance) determines whether the particles will remain dispersed or
flocculated. Zeta potential is a convenient measure of the electrostatic charge on the colloidal
particle, which arises from the interaction of the particle surface with its solution environment.115,116
It is important to point out here that the chemical nature of a particle surface is not given by
knowledge of its bulk composition or is it necessarily consistent from one sample of a given
material to the next. It is equally important to take into account the contribution of the solution
environment around the particle to the zeta potential. Both specific ion concentrations and total
ionic strength affect zeta potential and thereby the electrostatic contribution to colloidal behavior.
Abrasion
Abrasion is an important characteristic of all filler pigments. Highly abrasive pigments will cause
excess wear of both paper machine wires and printing plates.108 The abrasiveness of a filler is
principally caused by the crystalline nature or hardness of the filler. The strength of the atomic
bonds, spatial arrangements, impurities, etc., together with the filler’s physical characteristics (size,
particle size distribution, shape, surface area, etc.) are key factors.113 Small quantities of impurities
29
such as silica and quartz can cause severe abrasion problems, and larger particles tend to be more
abrasive than smaller particles of the same crystalline form.
2.4.3.3: The calcium carbonate filler
Calcium carbonates fall into two general classifications, the natural product made by grinding
limestone (GCC) and the precipitated product made synthetically (PCC). The two types of calcium
carbonate not only differ in their shapes but also, more importantly, in their surface properties.
Ground calcium carbonate (GCC) is treated with a dispersant that imparts a negative charge to it,
whilst precipitated calcium carbonate (PCC) is often used without treatment. As a result, their
colloidal behaviors differ: GCC forms a stable suspension in water (no aggregation) whilst PCC is
unstable and aggregates spontaneously. These properties may have a considerable effect on
retention, when filtration is the main mechanism affecting filler retention during papermaking.116
Ground calcium carbonate (GCC)
GCC is a commonly used abbreviation referring to refined, ground grades of calcium carbonates
obtained from chalk, limestone, and marble.117,118 Chalk (whiting) is a sedimentary rock of soft
texture, which consists almost exclusively of calcium carbonate in the form of calcite and aragonite.
Typical properties for chalk are softness and porosity. The color varies from white to slightly
grey.117
Limestone is a consolidated sedimentary calcium carbonate rock. The exertion of overlying earth
layers has led to compression of the nano-fossils, resulting in reshaping, partly dissolving, and
recrystallization of the mineral. Limestone is thus harder and less porous than chalk.117
Marble is a metamorphous rock. Owing to high pressure and temperature, the original calcite,
aragonite, or dolomite re-crystallized, giving rise to dense, mainly coarse-grained, highly indurate
masses of calcite or dolomite crystals. Impurities such as iron oxide and other substances cause
frequent yellow to brownish red streaks in marbles.117
Precipitated calcium carbonate (PCC)
PCC is a fully synthetic product. The properties of PCC differ considerably from those of natural
calcium carbonates, and PCC can often be used to improve paper quality by tailoring specific
mineral properties (crystal form, size, shape, etc.).118 In contrast to most other fillers used in
papermaking, the surface of PCC can possess a cationic charge.
The starting material in the manufacture of PCC is normally crushed limestone. This is burned
(calcined) in an oven at temperatures around 1000 °C, resulting in the formation of calcium oxide
30
("burnt lime", CaO). The calcium oxide is slaked with water to form a calcium hydroxide slurry into
which carbon dioxide gas is introduced under controlled conditions (gas flow, temperature,
concentration, time, additives, etc.) to yield precipitated crystals of calcium carbonate.119
The crystal forms of PCC are aragonite and calcite, depending upon manufacturing conditions.
Typical aragonite morphology is needle-like and aggregates of needles, whereas calcite precipitates
as scalenohedral or rhombohedral agglomerates, or prismatic particles.
2.4.3.4: Filler retention and flocculation
In many paper grades fillers are incorporated into the paper sheets to improve paper properties or
reduce costs. It is essential for the filler to be well dispersed in the matrix to avoid zones of weaker
cohesion, which may facilitate defects during stress conditions. The retention of fillers in the sheet
requires retention aids, usually cationic polyelectrolytes. Usually when a suspension of fibres and
filler is poured on a screen to form a sheet, the pigment particles may be too small to be captured
mechanically and therefore pass into the effluent. To improve retention, the logical approach would
be to introduce a polyelectrolyte. The absorption of the fillers to the fibres can either be by
heteroflocculation or heterocoagulation. The former results in a bridging of the fibres and the fillers
and the latter will result in a reduction in the electrical charges resulting in high deposits of the
fillers on the fibres. Another solution would be to utilize a polymer that would flocculate only the
filler and, owing to the increased sizes, the flocculants would be captured more efficiently. Anionic
soluble and colloidal substances should be avoided in the system to prevent interactions with the
cationic polymer, resulting in the greater availability of the cationic polymer to the filler.116
For systems that are heavily contaminated with anionic soluble and colloidal substances, non-ionic
polyethylene oxide (PEO) can be used as a retention aid. Due to the non-ionic nature of PEO, it may
act by either flocculating the pigment (homoflocculation), which is retained by filtration, or by
forming a bridge between the fiber and the pigment (heteroflocculation). It was shown that GCC is
not affected by PEO or sulfonated kraft lignin (SKL), indicating that absorption and bridging
flocculation occur between GCC and the fibre. PCC is affected marginally by PEO but mainly by
SKL, whereby SKL promotes its stability.116
With the increasing speeds of paper machines, the complexity of wet-end papermaking due to the
large usage of additives and the high degree of water recirculation, retention aids that overcome
these effects are required. This has resulted in dual and multi-component retention aid systems, one
of which is the combination of a cationic polyelectrolyte and microparticles (colloidal silica,
bentonite, aluminium hydroxide). The polyelectrolyte adsorbs onto the fiber and filler, resulting in
31
the formation of aggregates that may provide anchoring spots for the microparticles. The
microparticles reflocculate the entire system and act as a bridge between all the components,
thereby increasing the attachment of filler to fibre. It has been shown that at the optimum
concentrations of bentonite increases the bond strength of cationic polyacrylamide, precipitated
calcium carbonate and fibres. 88
The flocculation performance of cationic starches on calcite pretreated with anionic sodium
polyacrylate (NaPA) was investigated by measuring the mean particle size and the dynamic
mobility of the calcite dispersion.120 By varying the amount of NaPA (which has a strong affinity
for calcium carbonate) one is able to anionically modify the particles and reverse the charge
character of the originally cationic calcium carbonate. Via this mechanism, flocculation of cationic
starch on calcite was shown to be highly efficient.120 Similarly, cationic polyacrylamide was shown
to have little effect on the flocculation of PCC in the absence of dextran sulphate (DS). The DS
adsorbed on the surface of PCC reverses the particle net surface charge allowing much enhanced
polyacrylamide (PAM) adsorption and bridging flocculation.115 Another study investigated the
effect of dextran on PAM–PCC flocculations when the mixtures were exposed to anionic colloidal
substances that interfere with the cofactor (dextran)/PEO-induced PCC flocculations. Dextran was
shown to enhance PAM-induced PCC flocculation and retention by increasing the calcium ion
concentration near the PCC water interface, which in turn facilitates PAM adsorption.121
Another option for enhancing filler retention would be to introduce two oppositely charged
polyelectrolytes which may be necessary for optimizing the filler flocculation and retention of
calcium carbonate in the wet-end of paper machines. It was shown that the flocculation behavior of
calcium carbonate was strongly influenced by mixtures of cationic starch and anionic NaPA.122
Small quantities of added polyelectrolyte increased the flocculation and ionic strength, more
specifically at lower NaPA to starch ratios. At higher concentrations of polyelectrolytes the
increased amounts of deposited complexes at the particle surfaces overshadowed the effects of the
properties of the individual complexes.122
The presence of other inorganic or organic surface-active agents, either as additives to the filler
(slurry or dry) or to the papermaking system, will affect the colloidal behavior of the particles if
they are absorbed on the particle surface. Such agents may modify the zeta potential and/or may
contribute to steric repulsive forces. Low molecular weight polyelectrolytes (polyphosphates,
polyacrylates) act as strong dispersants by both strong electrostatic and steric repulsion. Moderate to
high molecular weight polymeric papermaking additives (starches, polyacrylamides) may act as
dispersants or flocculants depending, on the exact methods of their use.
32
Although filler retention is important, the bonding between the fibers and fillers is critical. The
introduction of fillers into paper results in the reduction of paper strength mainly due to disruption
of fiber-fiber bonds. The effectiveness of intermolecular forces acting between fibers is reduced and
a weaker paper is formed. Thus future additives that are created to promote filler retention should
be purposefully designed to also promote filler-fiber bonding, to ensure that paper strength is
maintained or improved.
2.5: References
(1) Roman-Aguirre, M., Marquez-Lucero A., Zaragoza-Contreras E. Carbohydrate Polymers
2004, 55, 201-210.
(2) Okeke, B., Obi S. Bioresources Technology 1995, 51, 23-27.
(3) Klemm, D., Philipp B., Heinze T., Wagenknecht W. Comprehensive Cellulose Chemistry.
1998, Wiley-vch, Germany.
(4) Kiran, E., Pohler H. Supercritical Fluids 1998, 13, 135-147.
(5) Lee, S., Koepsel R., Morley W., Matyjaszewski K., Russel A. Biomacromolecules 2004, 5,
877-882.
(6) Gupta, K. C., Khandekar K. Biomacromolecules 2003, 4, 758-765.
(7) Nishioka, N., Yamaguchi H., Kosai K. Journal of Applied Polymer Science. 1990, 40, 2007-
2017.
(8) Stenzel, M. H., Davis T. P., Fane A. G. Journal of Materials Chemistry 2003, 13, 2090-
2097.
(9) Princi, E., Vicini S., Pedemonte E., Arrighi V., McEwen I. Journal of Thermal Analysis and
Calorimetry 2005, 80(2), 369-373.
(10) Nishiyama, Y., Langan P., Chanzy H. Journal of the American Chemical Society 2002,
124(31), 9074-9082.
(11) Andrievsky, G. V., Klochkov V. K., Karyakina E. L., Mchedlov-Petrossyan N. O. Chemical
Physics Letters 1999, 300, 392-396.
(12) Dumitriu, S. Polysaccharides: Structural Diversity and Function Versatility. 2004, CRC
Press, Germany.
(13) Stipanovic, A. J., Sarko A. Macromolecules 1976, 9, 851-857.
(14) Kolpak, F. J., Blackweel J. Macromolecules 1976, 9, 273-278.
(15) Kono, H., Numata Y., Erata T., Takai M. Polymer 2004, 45, 2843-2852.
(16) Wada, M., Chancy H., Nishiyama Y., Langan P. Macromolecules, 8548-8555.
33
(17) Jane, J., Chen Y. Y., Lee L. F. , McPherson A. E. , Wong K. S., Radosavljevic M.,
Kasemsuwan T. Cereal Chemistry 1999, 76, 629–637.
(18) Park, I. M., Ibanez A. M., Shoemaker C. F. Starch 2007, 59, 69-77.
(19) Champagne, E. T. Cereal Food World 1996, 41, 833-838.
(20) Parker, R. R. Cereal Science 2001, 34, 1-17.
(21) Smith, A. M., Denyer K., Martin C. Annual Review of Plant Physiology and Plant
Molecular Biology 1997, 48, 67-87.
(22) Yuryev, V. P., Cesàro A., Bergthaller W. J. Starch and starch containing origins - structure,
properties and new technologies. 2002, Nova Science Publishers, New York.
(23) Ali, F., Saikia C. N., Sen S. R. Industrial Crops and Products 1997, 6, 121-129.
(24) Chauhan, G. S., Guleria L. Sharma R. Cellulose 2005, 12, 97-110.
(25) Gupta, K. C., Sahoo S. Biomacromolecules 2001, 2, 239-247.
(26) Halab-kessira, L., Ricard A. European Polymer Journal 1999, 35, 1065-1071.
(27) Okieimen, F. E. Journal of Applied Polymer Science 2003, 89, 913-923.
(28) Princi, E., Vicini S., Proietti N., Capitani D. European Polymer Journal 2005, 41, 1196-
1203.
(29) Zahran, M. K. Journal of Polymer Research 2006, 13, 65-71.
(30) Gurdag, G., Yasar M., Gurkaynak M. A. Journal of Applied Polymer Science 1997, 66, 929-
934.
(31) Okiemen, F. E., Ogbeifun D. E. Journal of Applied Polymer Science 1996, 59, 981-986.
(32) Majumdar, S., Dey J., Adhikari B. Talanta 2006, 69, 131–139.
(33) Mino, G., Kaizeman S., Rasmussen E. Jounal of Polymer Science 1959, 39, 523-529.
(34) Gaylord, N. Journal of Polymer Science, Polymer Symposia 1972, 37, 153-173.
(35) Iwakura Y., K. T., Imai Y. Journal of Polymer Science, Part A 1965, 3, 1185-1193.
(36) Mino, G., Kaizeman S. Journal of Polymer Science 1958, 31, 242-243.
(37) Lu, S., Lin S., Yao K. Starch 2004, 56, 138-143.
(38) Sabaa, M. W., Mokhtar S. M. Polymer Testing 2002, 21, 337-343.
(39) Singh, V., Tiwari A., Tripathi D. N., Sanghi R. Polymer 2006, 47, 254-260.
(40) Singh, V., Tiwari A., Tripathi D. N., Sanghi R. Carbohydrate 2004, 58, 1-6.
(41) Satge, C., Verneuil B., Branland P., Granet R., Krausz P., Rozier J., Petit C. Carbohydrate
Polymers 2002, 49, 373-376.
(42) Antova G., V. P., Zlatanov M. Carbohydrate Polymers . 2004, 57, 131-134.
(43) Koenig, H., Roberts W. Journal of Polymer Science 1974, 18, 651-666.
(44) Carlmark, A., Malmström E. Biomacromolecules 2003, 4, 1740-1745.
34
(45) Biermann, J., Chung B., Narayan R. Macromolecules 1987, 20, 954-957.
(46) Roy, D., Guthrie, J. T., Perrier, S. Macromolecules 2005, 38, 10363-10372.
(47) Vlcek, P., Janata M., Kriz J., Toman L. Polymer 2006, 47, 2587-2595.
(48) Li C., Y. N., Xinchao B., Xueyu Q., Xiuli Z., Xuesi C., .Xiabin J. Carbohydrate Polymers
2005, 60(1), 103-109.
(49) Mann, S. Biomimetic Materials Chemistry 1995, John Wiley and Sons.
(50) Yu, H., Lei M., Cheng B., Zhao X. Journal of Solid State Chemistry 2004, 177, 681-689.
(51) Manoli, F., Koutsopoulos S., Dalas E. Journal of Crystal Growth 1997, 182, 116-124.
(52) Mercer, K. L., Lin Y., Singer P. C. American Water Works Association 2005, 97(12), 116-
125
(53) Zhang, F., Hou Z., Sheng K., Deng B., Xie L. Journal of Materials Chemistry 2006, 16,
1215-1221.
(54) Mulin, J. W. Crystallization. 2001, Butterworth heinemann, Oxford.
(55) Dirksen, J. A., Ring T. A. Chemical Engineering Science 1991, 46, 2389-2391.
(56) Guo, J., Stevertson S. J. Industrial and Engineering Chemistry Research 2003, 42, 3480-
3486.
(57) Kulak, A. N., Iddon P., Li Y., Armes S. P., Colfen H., Paris O., Wilson R. M. Meldrum F.
C. Journal of the American Chemical Society 2007, 129, 3729-3736.
(58) Dickinson, S. R., Henderson G. E., McGrath K. M. Journal of Crystal Growth 2002, 244,
369-378.
(59) Butler, M. F., Glaser N., Weaver A. C., Kirkland M., Heppenstall-Butler M. Crystal Growth
and Design 2006, 6, 781-794.
(60) Pai, R. K., Hild S., Ziegler A., Marti O. Langmuir 2004, 3123-3128.
(61) Wei, H., Shen Q., Wang H., Gao Y., Zhao Y., Xu D., Wang D. Journal of Crystal Growth
2007, 303, 537-545.
(62) Pan, Y., Zhao X., Sheng Y., Wang C., Deng Y., Ma X., Liu X., Wang Z. Colloids and
Surfaces, A: Physicochemical Engineering Aspects 2007, 297, 198-202.
(63) Yu, Q., Ou H-D., Song R-Q., Xu A-W. Journal of Crystal Growth 2006, 286, 178-183.
(64) Jayaraman, A., Subrambramyam G., Sindhu S., Ajikumar P. K., Valiyaveettil S. Crystal
Growth and Design 2007, 7, 142-146.
(65) Neira-Carrillo, A., Yazdani-Pedram M., Retuert J., Diaz-Dosque M., Gallois S., Arias J. L.
Journal of Colloid and Interface Science 2005, 286, 134-141.
(66) Colfen, H., Antonietti M. Langmuir 1998, 14, 582-589.

35
(67) Ueyama, N., Hosoi T., Yamada Y., Doi M., Okamura T., Nakamura A. Macromolecules
1998, 91, 7119-7126.
(68) Manoli, F., Dalas E. Journal of Crystal Growth 1999, 204, 369-375.
(69) Colfen, H., Qi L. Chemistry - A European Journal 2001, 7, 106-116.
(70) Naka, K., Huang S-C., Chuyo Y. Langmuir 2006, 22, 7760-7767.
(71) Sedlak, M., Colfen H. Macromolecular Chemistry and Physics 2001, 202, 587-597.
(72) Jung, T., Kim T., Choi C. K. Crystal Growth Design. 2004, 4, 491-495.
(73) Wei, H., Shen Q., Zhao Y., Zhou Y., Wang D., Xu D. Journal of Crystal Growth 2005,
279, 439-446.
(74) Kim, I. W., Robertson R. E., Zand R. Crystal Growth and Design 2005, 5, 513-522.
(75) Ajikumar, P. K., Lakshminarayanan R., Valiyaveettil S. Crystal Growth and Design 2004,
4, 331-335.
(76) Agarwal, P., Berglund K. A. Crystal Growth and Design 2003, 3, 941-946.
(77) Kato, T., Suzuki T., Amamiya Y,. Irie T. Supramolecular Science 1998, 5, 411-415.
(78) Zhang, S., Gonsalves K. E. Langmuir 1998, 14, 6761-6766.
(79) Boggavarapu, S., Chang J., Calvert P. Material Science Engineering 2000, 11, 47-49.
(80) Naka, K., Tanaka Y., Chujo Y., Ito Y. Chemical Communication 1999, 1931-1932.
(81) Hosoda, N., Sugawara A., Kato T. Macromolecules 2003, 36, 6449-6452.
(82) Gopal, K., Lu Z., de Villiers M. M., Lvov Y. Journal of Physical Chemistry 2006, 110,
2471-2474.
(83) Takiguchi, M., Igarashi K., Azuma M., Ooshima H. Crystal Growth and Design 2006, 6,
1611-1614.
(84) Jada, A., Verraes A. Colloids and Surfaces, A: Physicochemical Engineering Aspects 2003,
219(1-3), 7-15.
(85) Meng, Q., Chen D.,Yue L., Fang J., Zhao H., Wang L. Macromolecular Chemistry and
Physics 2007, 208, 474-484.
(86) Li, W., Gao C. Langmuir 2007, 23, 4575-4582.
(87) Liu, D., Yates M. Z. Langmuir 2006, 22, 5566-5569.
(88) Alince, B., Bednar F., van de Ven T. G. M. Colloids and Surfaces, A: Physicochemical
Engineering Aspects 2001, 190, 71-80.
(89) Dalas, E., Klepetsanis P. G., Koutsoukos P. G. Journal of Colloid and Interface Science
2000, 224, 56-62.
(90) Halab-Kessira, L., Ricard A. Journal of Colloid and Interface Science 1996, 184, 437-442.
(91) Hubbe, M. A. Bioresources 2006, 1(2), 281-318.

36
(92) Hon, D. N. S., Shiraishi N. Wood and Cellulosic Chemistry. 2000, Marcel Dekker, New
York.
(93) Nanko, H., Ohsawa J. Journal of Pulp Paper Science 1989, 15(1), J17-J23.
(94) Campbell, W. B. Technical Association Papers 1947, 30(6), 177-180.
(95) Campbell, W. B. TAPPI 1959, 42(12), 999-1001.
(96) Parsons, S. R. Paper Trade Journal 1942, 115(25), 314-322.
(97) Page, D. H. TAPPI 1969, 52(4), 674-681.
(98) Leech, H. J. TAPPI 1954, 37(8), 343-349.
(99) Dugal, H. S., Swanson J. W. TAPPI 1972, 55(9), 1362-1367.
(100) Watanabe, M., Gondo T., Kitao O. TAPPI Journal 2004, 3(5), 15-19.
(101) Hubbe, M. A., Jackson T. L., Zhang M. TAPPI Journal 2003, 2(11), 7-12.
(102) Lofton, M. C., Moore S. M., Hube M. A., Lee S. Y. TAPPI Journal 2005, 4(9), 3-7.
(103) Marton, J., Marton T. TAPPI 1976, 59(12), 121-124.
(104) Roberts, J. C., Au C. O., Clay G. A., Lough C. TAPPI Journal 1986, 69(10), 88-93.
(105) Formento, J. C., Maximino M. G., Mina L. R., Srayh M. I., Martinez M. J. Appita 1994,
47(4), 305-308.
(106) Xu, Y., Chen X., Pelton R. Tappi Journal 2005, 4, 8-12.
(107) Fairchild, G. H. TAPPI Journal 1992, 75, 85-90.
(108) Hagemayer, R. W. TAPPI Journal 1960, 43, 277-288.
(109) Gill, R. A. Nordic Pulp and Paper Research Journal 1989, 4, 120-127.
(110) Passaretti, J. D., Gill R. A. TAPPI Papermakers Conference Proceedings 1991, 293-298.
(111) Maron, S. H., Lando J. B. Fundamentals of Physical Chemistry. 1974, Macmillan, New
York.
(112) Gill, R. A. TAPPI International Paper Physics Conference Proceedings 1991, 211-218.
(113) Koppelman, M. H. TAPPI Papermakers Conference Proceedings 1981, 197-199.
(114) Zeller, R. C. TAPPI Coating Conference Proceedings 1980, 103-109.
(115) Smith-Palmer, T., Pelton R. Colloids and Surfaces A: Physicochemical and Engineering
Aspects 2001, 181, 171-181.
(116) Cechova, M., Alince B., van de Ven T. G. M. Colloids and Surfaces A: Physicochemical
and Engineering Aspects 1998, 141, 153-160.
(117) Bergandy, W. Cement-Wapno-Gips 1980, 3, 72-74.
(118) Dimmick, A. C. Tappi Journal 2007, 6(11), 16-22.
(119) Cho, S. H., Park J. K., Lee S. K., Joo S. M., Kim I. H., Ahn, J. W., Kim H. Materials
Science Forum 2007, 8, 881-884.
37
(120) Nyström, R., Backfolkc K., Rosenholm J. B., Nurmic K. Journal of Colloid and Interface
Science 2003, 262, 48-54.
(121) Gibbs, A., Pelton R., Cong R. Colloids and Surfaces A: Physicochemical and Engineering
Aspects 1999, 159, 31-45.
(122) Nyström, R., Hedström G., Gustafsson J., Rosenholm J. B. Colloids and Surfaces A:
Physicochemical and Engineering Aspects 2004, 234, 85-93.
38
Chapter 3: Grafting of polysaccharides with hydrophilic vinyl monomers
using various initiator systems

39
3.1: Introduction and objectives
3.1.1: Microwave-assisted graft copolymerization
The use of microwave irradiation is viewed as one of the facile ways to make modified
polysaccharides within reasonable time and yields, compared to conventional grafting methods.1,2
Microwave irradiation result in radicals being formed on the backbone of the polysaccharide via O–
H bond cleavage. Microwaves are also reported to lower the activation energy of reactions.1-4
Microwave assisted grafting of chitosin1 and guar gum2 has been carried out with and without the
redox system silver nitrate/potassium persulfate (KPS)/ascorbic acid. When a redox initiator was
used the reaction times were shorter and the yields were higher compared to reactions that were
carried out without a redox initiator.
3.1.2: Conventional free radical grafting techniques
Grafting of cellulose, starch and related materials can be done via free radical polymerization using
various vinyl monomers as well as different initiator systems. The initators used are capable of
creating radicals on the backbone by either C–C homolytic bond cleavage or hydrogen abstraction.
The following redox initiators are widely used in the grafting of polysaccharides: Ce4+–KPS (other
metals such as Fe3+, Cu2+, V5+, etc. can be used),5 Ag+–ascorbic acid1,2 and APS–N,N,N',N'-
tetramethylethylenediamine (TEMED). After grafting, it is necessary to remove homopolymers
from the grafted materials by means of extraction. Acrylic acid has been used to prepare anionic
polysaccharides,6,7 whereas monomers such as diallyldimethyl ammonium chloride (DADMAC)8
and methacrylamido-propyl-trimethyl ammonium chloride (MAPTAC)9 were used to prepare
cationic polysaccharides. Some anionic starches have been crosslinked during grafting using the
free radical crosslinker N,N-methylene bisacrylamide (MBAM). Acrylamide monomer has also
been used in the graft polymerization of acrylic acid and DADMAC. It has been found that the
inclusion of acrylamide in the graft copolymerization of DADMAC using a modified batch process
increases the grafting efficiency.8 The most important parameter of the modified polysaccharides is
the percentage grafting (% G). The parameter is mainly calculated from gravimetric analysis,1,2,6,7,10
and in some cases, NMR.11,12
3.1.3: The choice of monomer
The choice of monomers to be grafted depends on the end use of the modified polysaccharide.
Gupta and Khandekar13 grafted N-isopropyl acrylamide (NIPAM) onto cellulose to form a
temperature responsive gel. The poly(NIPAM) shows a thermally reversible soluble-insoluble

40
change in response at its lower critical solution temperature (LCST) of 32 oC in aqueous solution.
The phase transition behavior has applications in drug delivery systems. Ethyl methacrylate has
been used by Gupta and Sahoo7 in the synthesis of cellulose based antimicrobial materials since
polyethylmethacrylate has some antimicrobial properties. Yeng et al.14 synthesized starch based
coatings by grafting polyacrylamide (PAM) onto starch. The grafted PAM increased the viscosity as
well as the stability of the coating. PAM was also used to synthesize guar gum based hydrogels for
controlled drug release applications by Soppirmath and Aminabhavi.15 Navarro et al.16 grafted
polyethyleneimine onto cellulose to produce chelating adsorbents for metal ions. Polyacrylic (PAA)
grafted cellulose and other polysaccharide materials are widely used as super adsorbents (water
retention).6,17 Starch modified with polymers such as PAM, PAA and some cationic polymers can
be used as dry-strength additives.18,19
3.1.4: Objectives
In this study, a new redox initiator system under microwave irradiation was studied. Graft
copolymerization of N-isopropyl acrylamide and methyl acrylate on α-cellulose was carried out
under microwave irradiation with cerium (IV) ammonium nitrate and KPS as the initiating system.
The role of KPS was to oxidize Ce3+ to Ce4+, which is the active species in radical formation. The
monomers were chosen as they have characteristic 13C NMR peaks that are easy to identify and this
simplifies characterization. The redox system was chosen on the basis of the action of Ce+4 on
polysaccharides during conventional grafting, whereby radicals are created on the backbone of the
polysaccharide via C2–C3 bond cleavage. Thus, the grafted polymers are linked to the
polysaccharide polymer backbone through strong C–C bonds in addition to ether linkages.
Conventional grafting of polysaccharides using vinyl monomers was also carried out using different
initiators and initiator systems. The materials were then tested for their ability to flocculate PCC.
The PCC flocculation is important for paper applications, whereby the interaction of modified
polysaccharides with PCC and pulp is essential for the retention of PCC. The focus of this chapter
was also on the synthesis of grafted polysaccharides for calcium carbonate crystal growth
modification and PCC retention in paper application.
41
3.2: Experimental
Materials
Methyl acrylate (MA) (Aldrich) was purified by first extracting stabilizers with aqueous sodium
hydroxide (0.3 M), drying over magnesium sulfate, and then distilling under vacuum. The purified
MA was stored below 5 oC until use. NIPAM (Sigma) was recrystallized from methanol and stored
below 5 oC. Cerium (IV) ammonium nitrate (CAN) (Fluka), KPS (Aldrich), APS, TEMED
(Aldrich) were used as received. Acrylic acid (AA, Acros) was purified by vacuum distillation at
30 oC, and stored below 5 oC. Acrylamide (AM) (Merck) was recrystallized from methanol and
stored below 5 oC. MAPTAC (Aldrich), DADMAC (Aldrich), MBAM (Labchem) were used as
received. α-Cellulose (α-CE) was washed with water and then ethanol and vacuum dried at 60 oC to
a constant weight. Potato starch (Acros) was used as received. Nitric acid (55%, R & S Enterprises)
was used as received. PCC and cationic starch (DS = 0.02) were provided by Mondi Business
Paper.
3.2.1: Microwave-assisted grafting
Procedure. In a typical reaction, α-cellulose (0.5g, 3.08 x10⁻³ moles of anhydroglucose unit) was
dispersed in 2.5 x 10⁻³ M HNO3 (45 mL), CAN (0.025g, 9.5 x10⁻⁵ moles) was added and the
mixture was stirred for 30 minutes. The two monomers (total moles 5.0 x 10⁻³, mole ratio MA:
NIPAM = 1) were then added whilst vigorously stirring. The microwave oven was set at the
appropriate microwave power (MWP), temperature, and run time of 10 minutes and the reaction
mixture was microwaved. After 10 minutes, the products were precipitated from a 1:4 mixture of
water and methanol. The homopolymers were soxlet extracted using a 1:4 water/THF mixture until
there was no weight loss, signaling complete removal of homopolymers. The resulting graft
copolymer was then dried to constant weight and the percentage grafting was calculated
gravimetrically and using solid state 13C NMR data. The graft copolymers (α-CE-g-NIPAM-co-
MA) are referred as G1, G2 and G3, in order of an increasing percentage grafting (% G).
3.2.2: Conventional grafting
3.2.2.1: APS-TEMED initiation
Procedure. The grafting reactions were carried out according to literature,6,8,10,13,15,20 with some
modifications. The starch was dissolved in deionized water at 80 oC until the solution became clear
42
under nitrogen purging. The starch solution was cooled to 60 oC and then the monomer(s), initiator
(APS) and co-initiator (TEMED) were added. The reactions were carried out under nitrogen for 8 h.
In the case of grafting starch/PVA blends, both starch and PVA were dissolved at 80 oC,
simultaneously. For grafting reactions where crosslinking was done, the crosslinker (MBAM) was
added together with the monomer(s). The grafted polysaccharides were precipitated out using
suitable solvents and the homopolymers were soxlet extracted using suitable solvents
(methanol/water or morpholine for PAANa and PAA) until there was no weight loss of the grafted
material due to homopolymer removal. The quantities of reactants used and the % G are shown in
Tables 3.2 and 3.3.
3.2.2.2: Ce4+ and Ce4+-KPS initiation
Procedure. The grafting reactions were carried out according to literature,6,8,10,13,15,20 with some
modifications. These reactions were initiated using the Ce4+ and/or the Ce4+-KPS initiator system
for both cellulose and potato starch. Cellulose was swelled in an aqueous solution of 2.5 x 10⁻³ M
HNO3 at 50 oC whereas the starch was dissolved in deionized water at 80 oC. Both solutions were
cooled to 30 oC before addition of the monomer and initiator. The reactions were carried out under
nitrogen for 4 h. The graft copolymerization of AM and DADMAC was done using a modified
batch process8 to avoid copolymer composition drift due to different reactivity rations, r1 = 5 and r2
= 0.04 for AM and DADMAC, respectively. The grafted polysaccharides were precipitated out
using suitable solvents and the homopolymers were soxlet extracted using suitable solvents
(methanol/water for PAM, DADMAC and MAPTAC, and morpholine for PAA) until there was no
weight loss in the grafted material due to homopolymer removal.
Grafting of partially dissolved starch (PDSt) was done using the procedure for grafting fully
dissolved starch. The only difference was that the partially dissolved starch was prepared by
swelling the starch at 75 oC for about 45 minutes (or until the viscosity began to increase). The
quantity of reactants used and the % G are shown in Tables 3.4–3.7
3.2.3: Flocculation of precipitated calcium carbonate
The modified starch and other carboxylate polysaccharides/polymers were tested for their ability to
flocculate PCC. The effect of modified starch and other carboxylated polysaccharides/polymers on
the flocculation of calcium carbonate is of paramount important when it comes to paper application.
Flocculation is required for the retention of PCC during papermaking. However, the size of the
flocculants is critical and it should therefore be optimized. Too much flocculation may have a
detrimental effect on the quality of paper. Thus, the distribution of PCC in paper should be uniform
43
and hence the PCC should be well dispersed. In this study, PCC flocculation is used as an indicative
measure of the binding efficiency of modified polysaccharides on PCC, and does not necessarily
mean that the larger the size of flocculants the better the polymeric additive in paper application.
Procedure. The grafted materials were used in flocculation experiments. Samples of different
polymer content were prepared in distilled deionized water in order to investigate the effect of
polymer concentration on the flocculant size. A solution of polymer sample of known mass was
placed into glass bottles and then 20% PCC (10 mL) was added whilst stirring, using a magnetic
stirrer. The final volume of the samples after pH adjustment was 20 mL. The mixture was then
stirred for 48 h, after which flocculant sizes were measured.
3.3: Analysis
3.3.1: Gravimetric analysis
The weight of the grafted cellulose after homopolymer extraction was used to calculate the % G as
well as the grafting efficiency (% GE), using the following equations:
100W
WW(%G)
o
o1 ×−
= (3.1)
100W
WW(%G.E)
2
o1 ×−
= (3.2)
Where Wo, W1 and W2 denote the weight of the original α-cellulose, grafted α-cellulose and
monomer used respectively.
3.3.2: Cationic degree of graft copolymers
The degree was calculated from chlorine analysis. The chlorine content was determined by the
titration method reported by Lu et al.8 In a typical titration, a dry sample (0.2 g) was dissolved in
distilled water then 1 mL of aqueous potassium chromate solution (0.5 M) was added. The latter
was then titrated using 0.5 M silver nitrate solution until the color of solution turned brick red.
The cationic degree (DC) was then calculated from the following equation:
1001000W
Vo-V0.05MDC monomerw, ××= (3.3)
where Mw, monomer is the molecular weight of the cationic monomer, V and Vo are the volumes of
silver nitrate consumed for the sample and blank respectively, and W is the weight of the sample.
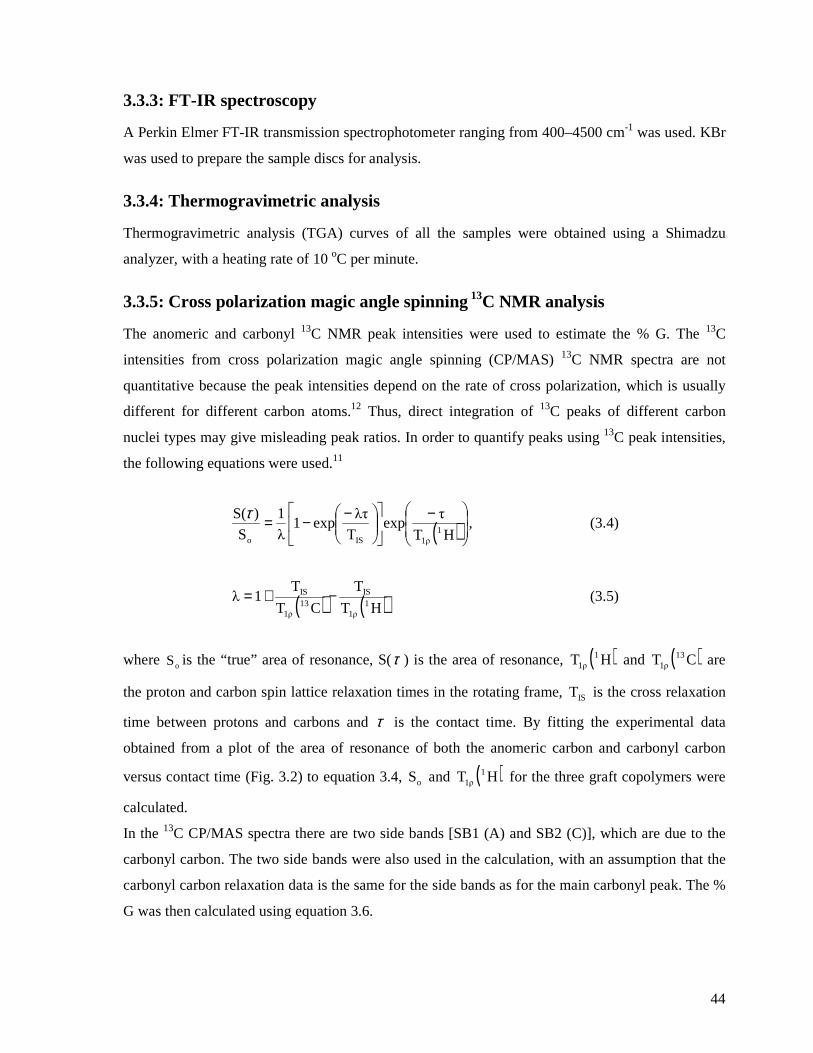
44
3.3.3: FT-IR spectroscopy
A Perkin Elmer FT-IR transmission spectrophotometer ranging from 400–4500 cm-1 was used. KBr
was used to prepare the sample discs for analysis.
3.3.4: Thermogravimetric analysis
Thermogravimetric analysis (TGA) curves of all the samples were obtained using a Shimadzu
analyzer, with a heating rate of 10 oC per minute.
3.3.5: Cross polarization magic angle spinning 13C NMR analysis
The anomeric and carbonyl 13C NMR peak intensities were used to estimate the % G. The 13C
intensities from cross polarization magic angle spinning (CP/MAS) 13C NMR spectra are not
quantitative because the peak intensities depend on the rate of cross polarization, which is usually
different for different carbon atoms.12 Thus, direct integration of 13C peaks of different carbon
nuclei types may give misleading peak ratios. In order to quantify peaks using 13C peak intensities,
the following equations were used.11
( )
−
−−=HT
τexp
T
λτexp1
λ
1
S
)S(1
1ρISo
τ, (3.4)
( ) ( )HT
T
CT
T1λ
11ρ
IS13
1ρ
IS −+= (3.5)
where oS is the “true” area of resonance, S(τ ) is the area of resonance, ( )HT 1
1ρ and ( )CT 131ρ are
the proton and carbon spin lattice relaxation times in the rotating frame, IST is the cross relaxation
time between protons and carbons and τ is the contact time. By fitting the experimental data
obtained from a plot of the area of resonance of both the anomeric carbon and carbonyl carbon
versus contact time (Fig. 3.2) to equation 3.4, oS and ( )HT 11ρ for the three graft copolymers were
calculated.
In the 13C CP/MAS spectra there are two side bands [SB1 (A) and SB2 (C)], which are due to the
carbonyl carbon. The two side bands were also used in the calculation, with an assumption that the
carbonyl carbon relaxation data is the same for the side bands as for the main carbonyl peak. The %
G was then calculated using equation 3.6.
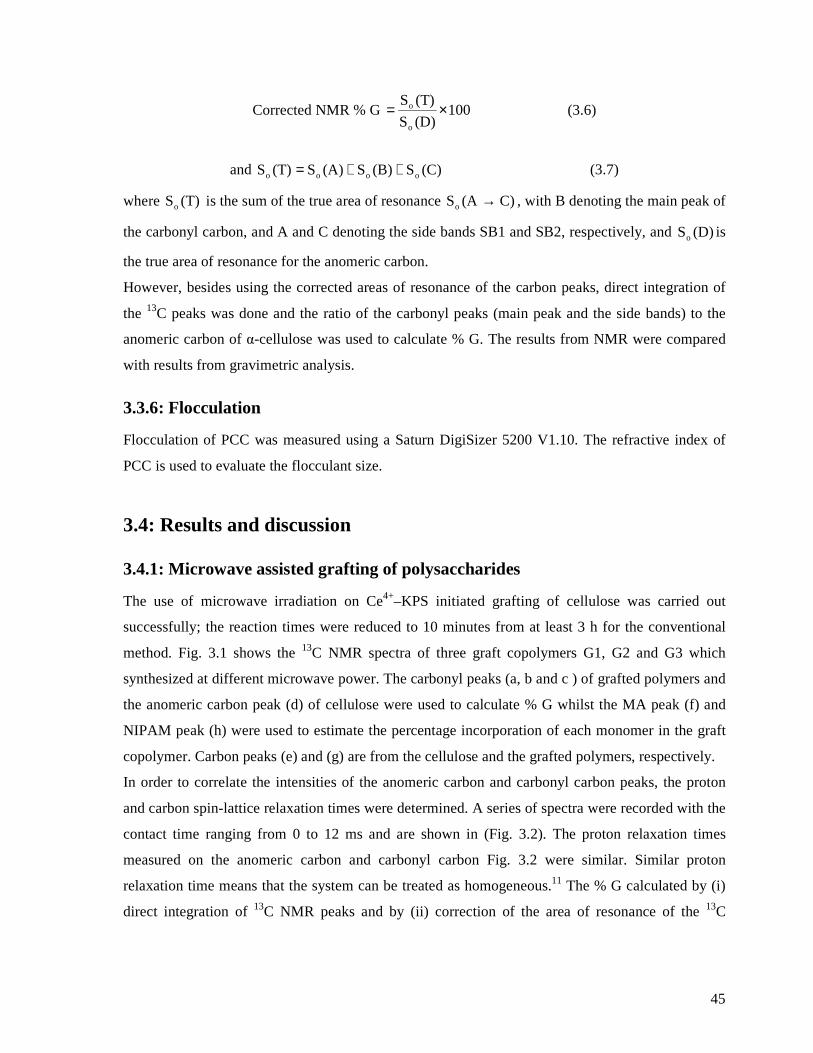
45
Corrected NMR % G 100(D)S
(T)S
o
o ×= (3.6)
and (C)S(B)S(A)S(T)S oooo ++= (3.7)
where (T)So is the sum of the true area of resonance C)(ASo → , with B denoting the main peak of
the carbonyl carbon, and A and C denoting the side bands SB1 and SB2, respectively, and (D)So is
the true area of resonance for the anomeric carbon.
However, besides using the corrected areas of resonance of the carbon peaks, direct integration of
the 13C peaks was done and the ratio of the carbonyl peaks (main peak and the side bands) to the
anomeric carbon of α-cellulose was used to calculate % G. The results from NMR were compared
with results from gravimetric analysis.
3.3.6: Flocculation
Flocculation of PCC was measured using a Saturn DigiSizer 5200 V1.10. The refractive index of
PCC is used to evaluate the flocculant size.
3.4: Results and discussion
3.4.1: Microwave assisted grafting of polysaccharides
The use of microwave irradiation on Ce4+–KPS initiated grafting of cellulose was carried out
successfully; the reaction times were reduced to 10 minutes from at least 3 h for the conventional
method. Fig. 3.1 shows the 13C NMR spectra of three graft copolymers G1, G2 and G3 which
synthesized at different microwave power. The carbonyl peaks (a, b and c ) of grafted polymers and
the anomeric carbon peak (d) of cellulose were used to calculate % G whilst the MA peak (f) and
NIPAM peak (h) were used to estimate the percentage incorporation of each monomer in the graft
copolymer. Carbon peaks (e) and (g) are from the cellulose and the grafted polymers, respectively.
In order to correlate the intensities of the anomeric carbon and carbonyl carbon peaks, the proton
and carbon spin-lattice relaxation times were determined. A series of spectra were recorded with the
contact time ranging from 0 to 12 ms and are shown in (Fig. 3.2). The proton relaxation times
measured on the anomeric carbon and carbonyl carbon Fig. 3.2 were similar. Similar proton
relaxation time means that the system can be treated as homogeneous.11 The % G calculated by (i)
direct integration of 13C NMR peaks and by (ii) correction of the area of resonance of the 13C
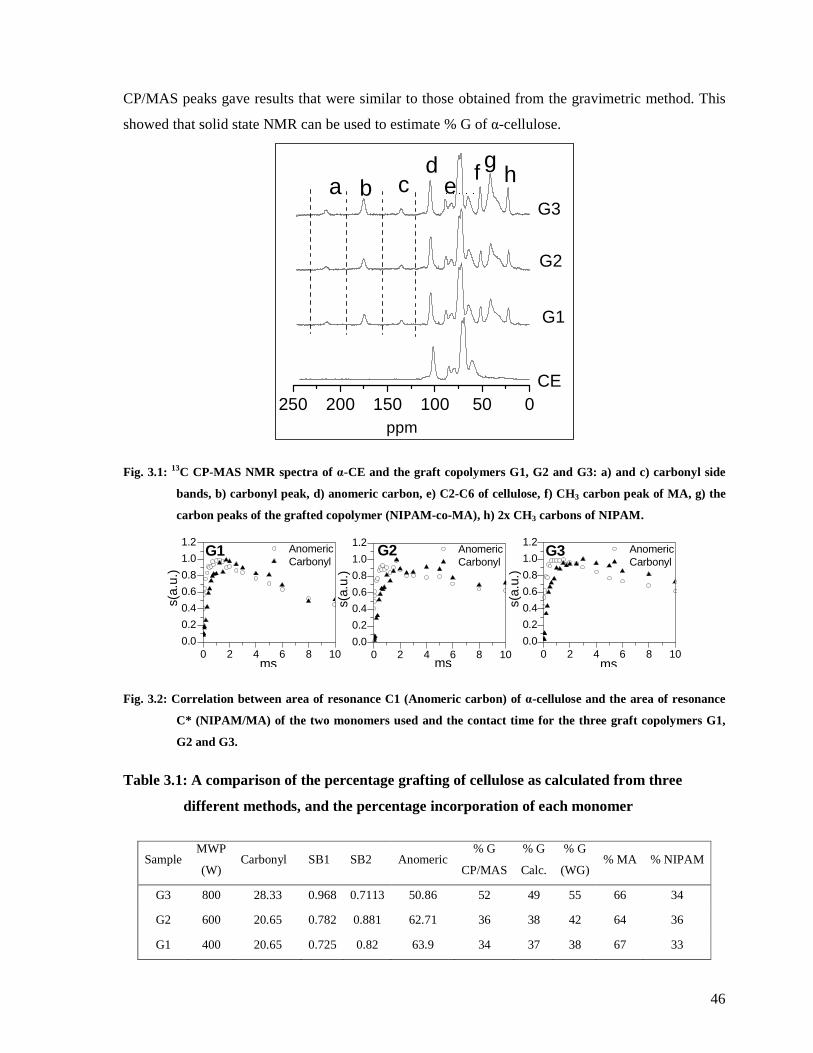
46
CP/MAS peaks gave results that were similar to those obtained from the gravimetric method. This
showed that solid state NMR can be used to estimate % G of α-cellulose.
250 200 150 100 50 0
cba h
ppm
G2
G1
CE
G3
de
f g
Fig. 3.1: 13C CP-MAS NMR spectra of α-CE and the graft copolymers G1, G2 and G3: a) and c) carbonyl side
bands, b) carbonyl peak, d) anomeric carbon, e) C2-C6 of cellulose, f) CH3 carbon peak of MA, g) the
carbon peaks of the grafted copolymer (NIPAM-co-MA), h) 2x CH3 carbons of NIPAM.
0 2 4 6 8 100.0
0.2
0.4
0.6
0.8
1.0
1.2
ms
G3 Anomeric Carbonyl
s(a.
u.)
0 2 4 6 8 100.0
0.2
0.4
0.6
0.8
1.0
1.2
ms
G2 Anomeric Carbonyl
s(a.
u.)
0 2 4 6 8 100.0
0.2
0.4
0.6
0.8
1.0
1.2
Anomeric Carbonyl
ms
s(a.
u.)
G1
Fig. 3.2: Correlation between area of resonance C1 (Anomeric carbon) of α-cellulose and the area of resonance
C* (NIPAM/MA) of the two monomers used and the contact time for the three graft copolymers G1,
G2 and G3.
Table 3.1: A comparison of the percentage grafting of cellulose as calculated from three
different methods, and the percentage incorporation of each monomer
Sample MWP
(W) Carbonyl SB1 SB2 Anomeric
% G
CP/MAS
% G
Calc.
% G
(WG) % MA % NIPAM
G3 800 28.33 0.968 0.7113 50.86 52 49 55 66 34
G2 600 20.65 0.782 0.881 62.71 36 38 42 64 36
G1 400 20.65 0.725 0.82 63.9 34 37 38 67 33

47
The percentage incorporation of each monomer was also determined from CP/MAS spectra: MA
incorporation was much higher than that of NIPAM (Table 3.1). This is expected, as MA has higher
polymerization constant (kp) than NIPAM. The microwave power had no effect on the percentage
incorporation of the monomers and only a small effect on % G. The FT-IR spectra of the graft
copolymers (Fig. 3.3) show the MA and NIPAM carbonyl absorption peaks of the grafted
copolymers polymers at 1736 and 1650 cm-1, respectively. The peak at 2900 cm-1 is due to sp3 C–H
(stretch) of cellulose and grafted polymers. The peak at 1638 cm-1 for cellulose is due to C–O
(bending) for adsorbed water. In the region 1300–1000 cm-1 is where the C–O (stretch) absorption
peaks of cellulose and grafted the polymers.
Fig. 3.3: A comparison of the FT-IR spectra of α-CE and the graft copolymers G1, G2 and G3, showing the
carbonyl peaks due to the grafted polymers.
The TGA curves (Fig. 3.4) show an increase in thermal stability with an increase in percentage
grafting.
Fig. 3.4: TGA curves of α-CE and the graft copolymers G1, G2 and G3, showing an increase in thermal stability
with an increase in % G.
280 320 360 4000
20
40
60
80
100
Wei
ght l
oss
%
Temp oC
aCE G1 G2 G3
CE
280 320 360 4000
20
40
60
80
100
Wei
ght l
oss
%
Temp oC
aCE G1 G2 G3
CE
3500 3000 2500 2000 1500
aC E
G 3
G 2
G 1
1800 1750 1700 1650 1600
C = O (M A )
W ave num bers (cm -1)
G 3
G 2
G 1
W ave num bers (cm -1)
aC E
C =O (N IP A M ) & C E
Inte
nsity
3500 3000 2500 2000 1500
aC E
G 3
G 2
G 1
1800 1750 1700 1650 1600
C = O (M A )
W ave num bers (cm -1)
G 3
G 2
G 1
W ave num bers (cm -1)
aC E
C =O (N IP A M ) & C E
Inte
nsity
48
Solid state NMR spectra (Fig. 3.5) for analogous reactions carried out at microwave reaction
temperature set at 80 oC for grafting α-cellulose with monomers, NIPAM and MA, showed that
there was no grafting. The NMR results were in conflict with the results from TGA, where there
was an increase in thermal stability of the grafted materials (Fig. 3.5A), which is typical for grafted
materials. However, the carbonyl peak of the polymers was also not observed in the 13C NMR
spectrum (Fig. 3.5B) as well as in FT-IR spectrum (spectrum not shown).
Fig. 3.5: A) TGA curves of α-CE and α-CE grafted with NIPAM showing the thermally more stable ungrafted
material. C and B) 13C NMR of α-CE and α-CE grafted with NIPAM and MA ( α-CE-g-NIPAM-co-
MA), respectively.
The reason for the increase in thermal stability of the cellulose grafted materials is suggested here to
be due to the crosslinking of cellulose. Previous studies on conventional Ce4+ initiation, a decrease
in % G and an increase in homopolymer formation as the temperature was increased to 60 oC, was
observed.6,13 It is, therefore, proposed here that the Ce4+-KPS initiation system is not suitable for
microwave reactions above 60 oC as only homopolymer was formed. The presence of a water
soluble initiator, KPS, can also contribute to homopolymer formation rather than grafting at this
high temperature.
250 300 350 400 450 5000
20
40
60
80
100 aCE aCE-g-NIPAM
Temprature (oC)
% W
eigh
t Los
eA
250 200 150 100 50 0
alCE
ppm
C
250 200 150 100 50 0
alCE-g-NIPAM
B
No C=O peaks
α-CE-g-NIPAM-co-MA
α-CE-g-NIPAM-co-MA
α-CE
α-CE
250 300 350 400 450 5000
20
40
60
80
100 aCE aCE-g-NIPAM
Temprature (oC)
% W
eigh
t Los
eA
250 200 150 100 50 0
alCE
ppm
C
250 200 150 100 50 0
alCE-g-NIPAM
B
No C=O peaks
α-CE-g-NIPAM-co-MA
α-CE-g-NIPAM-co-MA
α-CE
α-CE
49
3.4.2: Conventional grafting of polysaccharides
Conventional grafting of polysaccharides was done using various monomers to produce materials
for CaCO3 crystal growth modification and paper application as filler retention aids. A number of
factors were observed to affect the % G of starch. Table 3.2 shows the effect monomer
concentration as well as the effect of adding a free radical crosslinking agent on % G and % GE. It
was shown (Table 3.2) that increasing the monomer concentration results in an increase in the % G.
However, the grafting efficiency decreases with increasing monomer concentration. The increase in
viscosity of the medium is prevalent at high monomer concentration, and negatively affects the
diffusion of monomers to the active sites.7 The % G values are related to the monomer conversion,
and the presence of residual homopolymer may lead to high values. Thus, homopolymer removal is
of paramount importance. It was also observed (Table 3.2) that addition of a crosslinking agent
results in higher % G. Thus, crosslinking will result in improved grafting since growing
homopolymer chains (polymeric radicals) have a possibility of adding to a grafted polymer via the
double bond of a crosslinker, or vice versa. Moreover, crosslinked homopolymers will be difficult
to remove using extraction methods due to their high molecular weight, which favors the formation
of strong entanglements with grafted starch, in addition to hydrogen bonding. An increase in the
crosslinking agent concentration resulted in an increase in the % G values.
Grafting of starch with monomers such as acrylic acid and sodium acrylate gives superabsorbent
materials. The super absorption property is not required for some paper products because moisture
absorption will be inevitable, and will compromise the strength of paper. The addition of small
quantities of a free radical crosslinker will result in a decrease in the absorption of water, as shown
in Appendix C, Fig. C1. The crosslinks prohibit the material from expanding during water
absorption, thereby limiting the amount of water that can be absorbed. The more crosslinks there
are the less water is absorbed, and vice versa.15,21 However, the solubility of the crosslinked starch
and the mobility of the chains are also reduced by the introduction of crosslinks.
Table 3.3 shows the effect of increasing the poly(vinyl alcohol) (PVA) concentration in the
starch/PVA blend on the % G and % GE. When the blends (starch/PVA) were grafted, it was
observed that decreasing the starch to PVA ratio resulted in a decrease in the value of % G,
suggesting that it easier to abstract protons from the polysaccharide than from PVA (Table 3.3). A
similar grafting reaction, with no PVA added, gave a higher % G. This means that it is easier to
graft starch than polyvinyl alcohol.
Graft copolymerization of DADMAC and AM was done at various monomers feed ratios. Table 3.5
shows the influence of monomer ratios on the DC. Increasing the DADMAC concentration whilst

50
decreasing the AM concentration resulted in a decrease in the DC. This is because inclusion of AM
in DADMAC polymerization results in an improvement of conversion of DADMAC to polymer,
and a high molecular weight polymer. However, the author disagrees that an increase in DADMAC
concentration will result in more inhibition of the polymerization by the chloride ions of the
DADMAC.8 The % G was found to increase with an increase in AM concentrations.
The cationic monomer MAPTAC was also grafted copolymerized with AM on starch and Table 3.5
shows the effect of the concentration of MAPTAC on DC. DC increased as the MAPTAC
concentration increased. However, the % G did not change much with increasing MAPTAC
concentration.
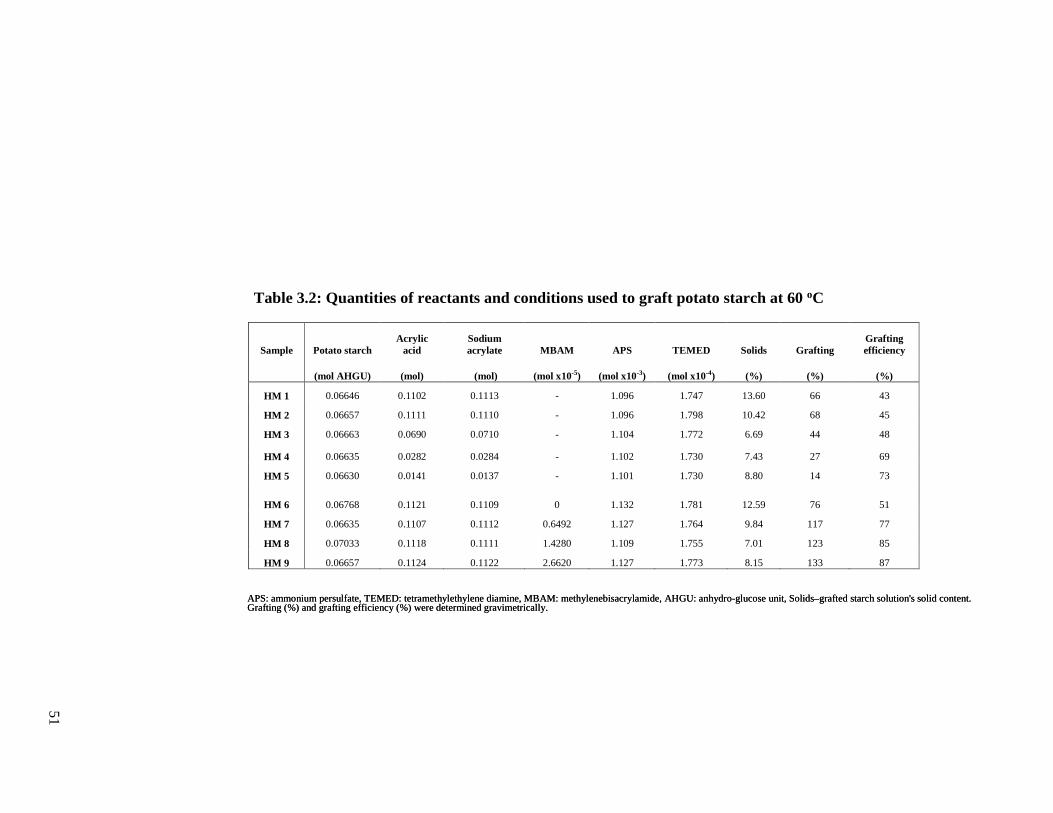
5
1
Table 3.2: Q
uantities of reactants and conditions used to graft potato starch modification
Sample Potato starch Acrylic
acid Sodium acrylate MBAM APS TEMED Solids Grafting
Grafting efficiency
(mol AHGU) (mol) (mol) (mol x10-5) (mol x10-3) (mol x10-4) (%) (%) (%)
HM 1 0.06646 0.1102 0.1113 - 1.096 1.747 13.60 66 43
HM 2 0.06657 0.1111 0.1110 - 1.096 1.798 10.42 68 45
HM 3 0.06663 0.0690 0.0710 - 1.104 1.772 6.69 44 48
HM 4 0.06635 0.0282 0.0284 - 1.102 1.730 7.43 27 69
HM 5 0.06630 0.0141 0.0137 - 1.101 1.730 8.80 14 73
HM 6 0.06768 0.1121 0.1109 0 1.132 1.781 12.59 76 51
HM 7 0.06635 0.1107 0.1112 0.6492 1.127 1.764 9.84 117 77
HM 8 0.07033 0.1118 0.1111 1.4280 1.109 1.755 7.01 123 85
HM 9 0.06657 0.1124 0.1122 2.6620 1.127 1.773 8.15 133 87
Table 3.2: Quantities of reactants and conditions used to graft potato starch at 60 oC
APS: ammonium persulfate, TEMED: tetramethylethylene diamine, MBAM: methylenebisacrylamide, AHGU: anhydro-glucose unit, Solids–grafted starch solution's solid content.Grafting (%) and grafting efficiency (%) were determined gravimetrically.APS: ammonium persulfate, TEMED: tetramethylethylene diamine, MBAM: methylenebisacrylamide, AHGU: anhydro-glucose unit, Solids–grafted starch solution's solid content.Grafting (%) and grafting efficiency (%) were determined gravimetrically.
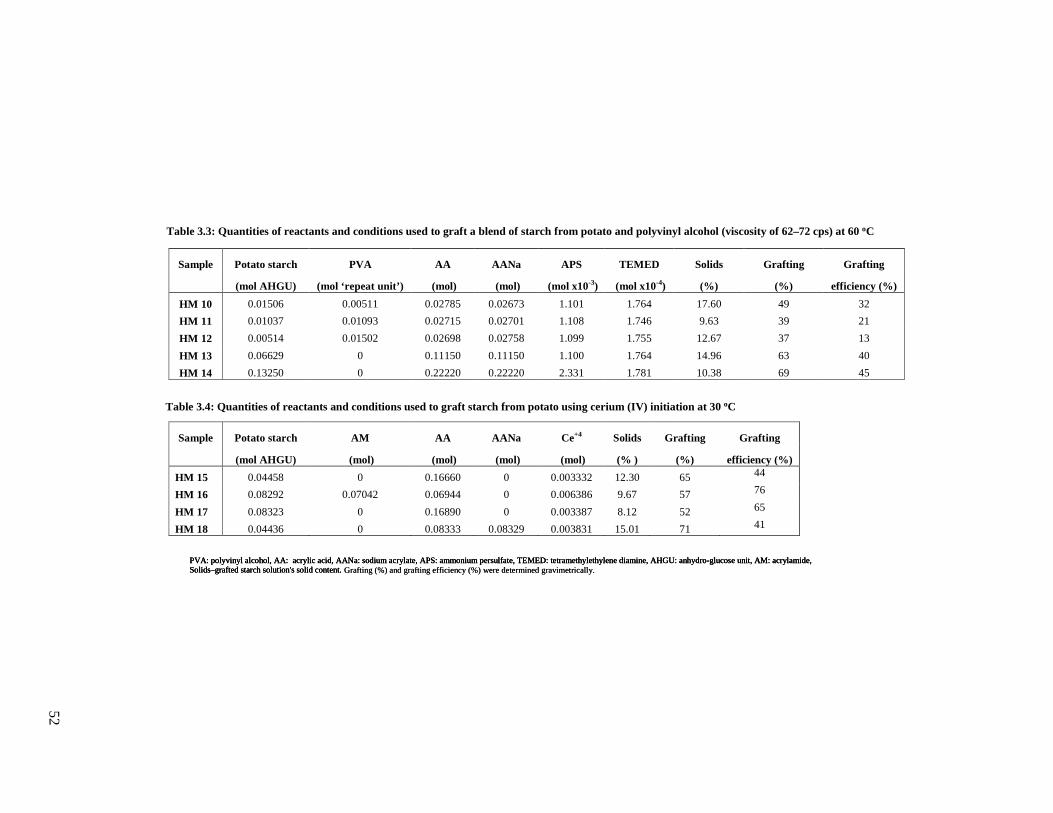
5
2
Table 3.3: Q
uantities of reactants used for grafting a blend of starch and PV
A
Table 3.4: Q
uantities of reactants used for Ce 4+ initiated grafting of potato starch
Sample Potato starch PVA AA AANa APS TEMED Solids Grafting Grafting
(mol AHGU) (mol ‘repeat unit’) (mol) (mol) (mol x10-3) (mol x10-4) (%) (%) efficiency (%)
HM 10 0.01506 0.00511 0.02785 0.02673 1.101 1.764 17.60 49 32
HM 11 0.01037 0.01093 0.02715 0.02701 1.108 1.746 9.63 39 21
HM 12 0.00514 0.01502 0.02698 0.02758 1.099 1.755 12.67 37 13
HM 13 0.06629 0 0.11150 0.11150 1.100 1.764 14.96 63 40
HM 14 0.13250 0 0.22220 0.22220 2.331 1.781 10.38 69 45
Sample Potato starch AM AA AANa Ce+4 Solids Grafting Grafting
(mol AHGU) (mol) (mol) (mol) (mol) (% ) (%) efficiency (%) HM 15 0.04458 0 0.16660 0 0.003332 12.30 65 44
HM 16 0.08292 0.07042 0.06944 0 0.006386 9.67 57 76
HM 17 0.08323 0 0.16890 0 0.003387 8.12 52 65
HM 18 0.04436 0 0.08333 0.08329 0.003831 15.01 71 41
Table 3.3: Quantities of reactants and conditions used to graft a blend of starch from potato and polyvinyl alcohol (viscosity of 62–72 cps) at 60 oC
Table 3.4: Quantities of reactants and conditions used to graft starch from potato using cerium (IV) initiation at 30 oC
PVA: polyvinyl alcohol, AA: acrylic acid, AANa: sodium acrylate, APS: ammonium persulfate, TEMED: tetramethylethylene diamine, AHGU: anhydro-glucose unit, AM: acrylamide, Solids–grafted starch solution's solid content. Grafting (%) and grafting efficiency (%) were determined gravimetrically.PVA: polyvinyl alcohol, AA: acrylic acid, AANa: sodium acrylate, APS: ammonium persulfate, TEMED: tetramethylethylene diamine, AHGU: anhydro-glucose unit, AM: acrylamide, Solids–grafted starch solution's solid content. PVA: polyvinyl alcohol, AA: acrylic acid, AANa: sodium acrylate, APS: ammonium persulfate, TEMED: tetramethylethylene diamine, AHGU: anhydro-glucose unit, AM: acrylamide, Solids–grafted starch solution's solid content. Grafting (%) and grafting efficiency (%) were determined gravimetrically.
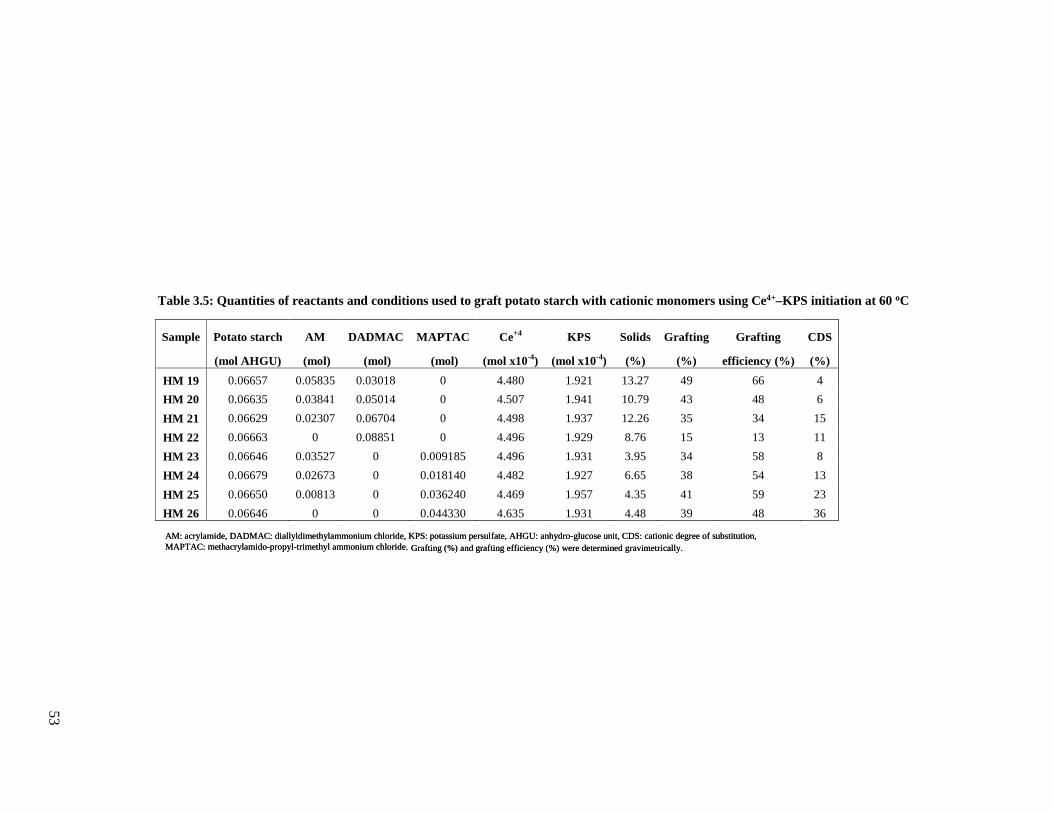
53
Table
3.5: Quantities of reactants and conditions used for C
e4+-K
PS
initiated grafting of
potato starch with cationic m
onomers
AM: acrylamide, DADMAC: diallyldimethylammonium chloride, KPS: potassium persulfate, AHGU: anhydro-glucose unit, CDS: cationic degree of substitution, MAPTAC: methacrylamido-propyl-trimethyl ammonium chloride.Grafting (%) and grafting efficiency (%) were determined gravimetrically.AM: acrylamide, DADMAC: diallyldimethylammonium chloride, KPS: potassium persulfate, AHGU: anhydro-glucose unit, CDS: cationic degree of substitution, MAPTAC: methacrylamido-propyl-trimethyl ammonium chloride.Grafting (%) and grafting efficiency (%) were determined gravimetrically.
Sample Potato starch AM DADMAC MAPTAC Ce+4 KPS Solids Grafting Grafting CDS
(mol AHGU) (mol) (mol) (mol) (mol x10-4) (mol x10-4) (%) (%) efficiency (%) (%)
HM 19 0.06657 0.05835 0.03018 0 4.480 1.921 13.27 49 66 4
HM 20 0.06635 0.03841 0.05014 0 4.507 1.941 10.79 43 48 6
HM 21 0.06629 0.02307 0.06704 0 4.498 1.937 12.26 35 34 15
HM 22 0.06663 0 0.08851 0 4.496 1.929 8.76 15 13 11
HM 23 0.06646 0.03527 0 0.009185 4.496 1.931 3.95 34 58 8
HM 24 0.06679 0.02673 0 0.018140 4.482 1.927 6.65 38 54 13
HM 25 0.06650 0.00813 0 0.036240 4.469 1.957 4.35 41 59 23
HM 26 0.06646 0 0 0.044330 4.635 1.931 4.48 39 48 36
Table 3.5: Quantities of reactants and conditions used to graft potato starch with cationic monomers using Ce4+–KPS initiation at 60 oC
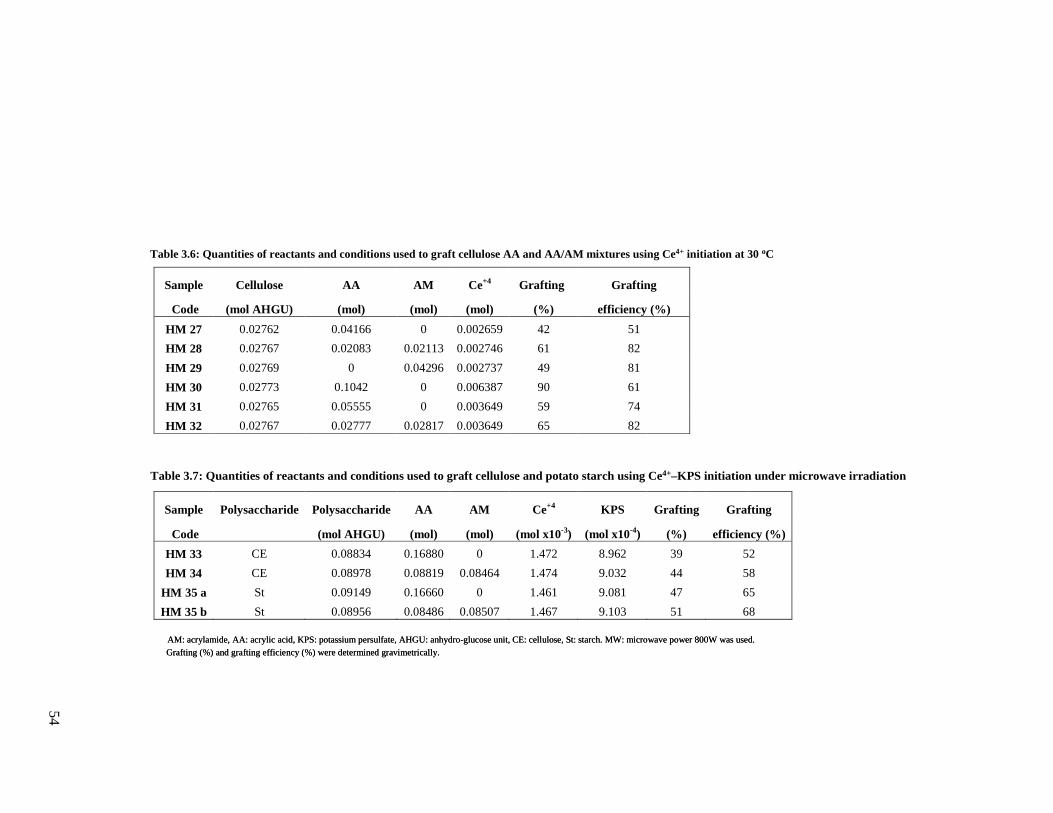
5
4
Table 3.6: Q
uantities of reactants and conditions for graft copolymerization of acrylic acid
and acrylamide onto cellulose using C
e 4+ initiation
Table 3.7: Q
uantities of reactants and conditions for graft copolymerization of acrylic acid
and acrylamide, onto cellulose and starch using C
e 4+-KP
S under m
icrowave
irradiation
Sample Cellulose AA AM Ce+4 Grafting Grafting
Code (mol AHGU) (mol) (mol) (mol) (%) efficiency (%)
HM 27 0.02762 0.04166 0 0.002659 42 51
HM 28 0.02767 0.02083 0.02113 0.002746 61 82
HM 29 0.02769 0 0.04296 0.002737 49 81
HM 30 0.02773 0.1042 0 0.006387 90 61
HM 31 0.02765 0.05555 0 0.003649 59 74
HM 32 0.02767 0.02777 0.02817 0.003649 65 82
Sample Polysaccharide Polysaccharide AA AM Ce+4 KPS Grafting Grafting
Code (mol AHGU) (mol) (mol) (mol x10-3) (mol x10-4) (%) efficiency (%)
HM 33 CE 0.08834 0.16880 0 1.472 8.962 39 52
HM 34 CE 0.08978 0.08819 0.08464 1.474 9.032 44 58
HM 35 a St 0.09149 0.16660 0 1.461 9.081 47 65
HM 35 b St 0.08956 0.08486 0.08507 1.467 9.103 51 68
Table 3.6: Quantities of reactants and conditions used to graft cellulose AA and AA/AM mixtures using Ce4+ initiation at 30 oC
Table 3.7: Quantities of reactants and conditions used to graft cellulose and potato starch using Ce4+–KPS initiation under microwave irradiation
AM: acrylamide, AA: acrylic acid, KPS: potassium persulfate, AHGU: anhydro-glucose unit, CE: cellulose, St: starch. MW: microwave power 800W was used.
Grafting (%) and grafting efficiency (%) were determined gravimetrically.
AM: acrylamide, AA: acrylic acid, KPS: potassium persulfate, AHGU: anhydro-glucose unit, CE: cellulose, St: starch. MW: microwave power 800W was used.
Grafting (%) and grafting efficiency (%) were determined gravimetrically.
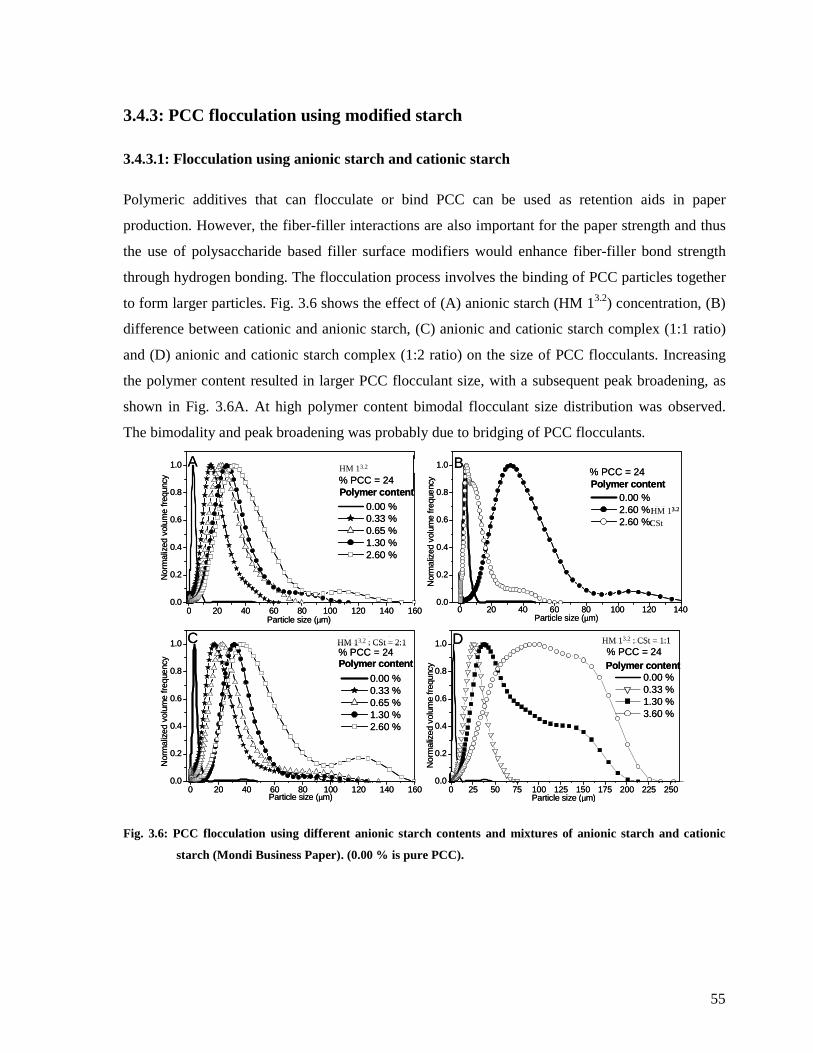
55
3.4.3: PCC flocculation using modified starch
3.4.3.1: Flocculation using anionic starch and cationic starch
Polymeric additives that can flocculate or bind PCC can be used as retention aids in paper
production. However, the fiber-filler interactions are also important for the paper strength and thus
the use of polysaccharide based filler surface modifiers would enhance fiber-filler bond strength
through hydrogen bonding. The flocculation process involves the binding of PCC particles together
to form larger particles. Fig. 3.6 shows the effect of (A) anionic starch (HM 13.2) concentration, (B)
difference between cationic and anionic starch, (C) anionic and cationic starch complex (1:1 ratio)
and (D) anionic and cationic starch complex (1:2 ratio) on the size of PCC flocculants. Increasing
the polymer content resulted in larger PCC flocculant size, with a subsequent peak broadening, as
shown in Fig. 3.6A. At high polymer content bimodal flocculant size distribution was observed.
The bimodality and peak broadening was probably due to bridging of PCC flocculants.
Fig. 3.6: PCC flocculation using different anionic starch contents and mixtures of anionic starch and cationic
starch (Mondi Business Paper). (0.00 % is pure PCC).
0 20 40 60 80 100 120 140 1600.0
0.2
0.4
0.6
0.8
1.0
0 20 40 60 80 100 120 140 1600.0
0.2
0.4
0.6
0.8
1.0
0 20 40 60 80 100 120 1400.0
0.2
0.4
0.6
0.8
1.0
0 25 50 75 100 125 150 175 200 225 2500.0
0.2
0.4
0.6
0.8
1.0
A
Particle size (µm)
Nor
mal
ized
vol
ume
freq
uncy
Anionic Starch (FD)% PCC = 24 Polymer content
0.00 % 0.33 % 0.65 % 1.30 % 2.60 %
C
Nor
mal
ized
vol
ume
freq
uenc
y
Particle size (µm)
0.00 % 0.33 % 0.65 % 1.30 % 2.60 %
ASt: CSt = 2:1
Polymer content% PCC = 24
B
Nor
mal
ized
vol
ume
freq
uenc
y
Particle size (µm)
0.00 % 2.60 % CSt 2.60 % ASt
Polymer content% PCC = 24
D% PCC = 24
Nor
mal
ized
vol
ume
freq
uncy
Particle size (µm)
ASt/CSt = 1:1
Polymer content 0.00 % 0.33 % 1.30 % 3.60 %
HM 13.2
HM 13.2 : CSt = 2:1 HM 13.2 : CSt = 1:1
HM 13.2
CSt
0 20 40 60 80 100 120 140 1600.0
0.2
0.4
0.6
0.8
1.0
0 20 40 60 80 100 120 140 1600.0
0.2
0.4
0.6
0.8
1.0
0 20 40 60 80 100 120 1400.0
0.2
0.4
0.6
0.8
1.0
0 25 50 75 100 125 150 175 200 225 2500.0
0.2
0.4
0.6
0.8
1.0
A
Particle size (µm)
Nor
mal
ized
vol
ume
freq
uncy
Anionic Starch (FD)% PCC = 24 Polymer content
0.00 % 0.33 % 0.65 % 1.30 % 2.60 %
C
Nor
mal
ized
vol
ume
freq
uenc
y
Particle size (µm)
0.00 % 0.33 % 0.65 % 1.30 % 2.60 %
ASt: CSt = 2:1
Polymer content% PCC = 24
B
Nor
mal
ized
vol
ume
freq
uenc
y
Particle size (µm)
0.00 % 2.60 % CSt 2.60 % ASt
Polymer content% PCC = 24
D% PCC = 24
Nor
mal
ized
vol
ume
freq
uncy
Particle size (µm)
ASt/CSt = 1:1
Polymer content 0.00 % 0.33 % 1.30 % 3.60 %
HM 13.2
HM 13.2 : CSt = 2:1 HM 13.2 : CSt = 1:1
HM 13.2
CSt
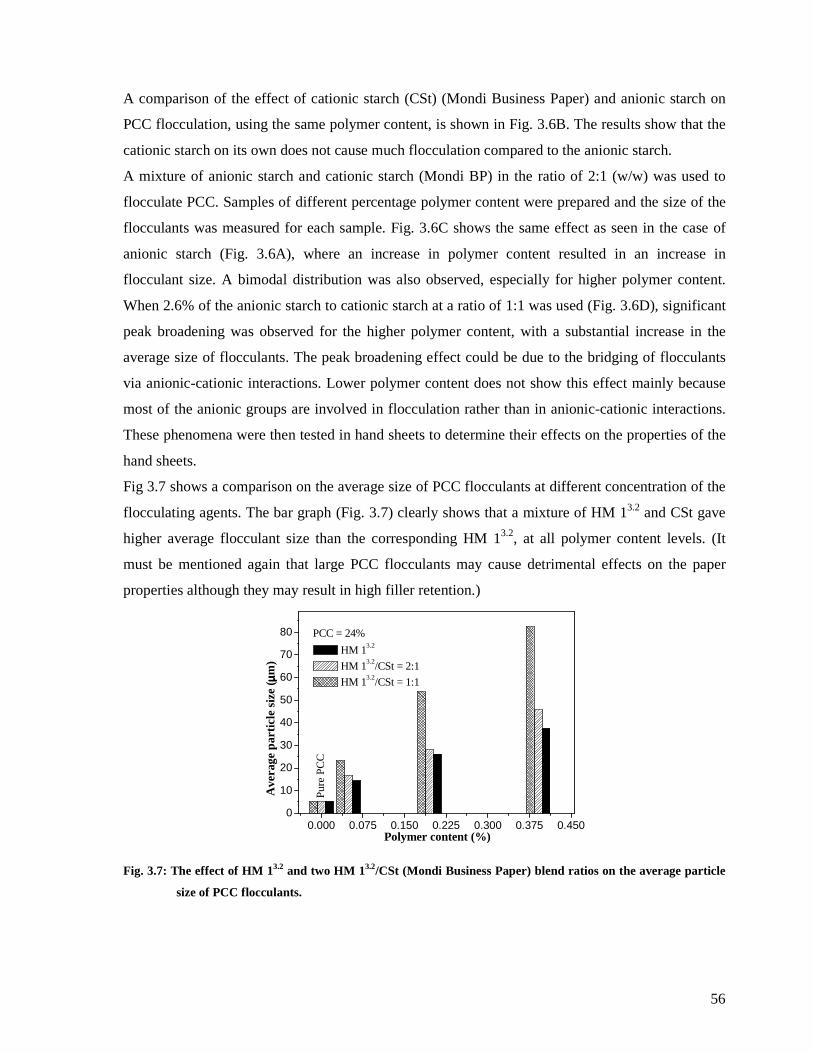
56
A comparison of the effect of cationic starch (CSt) (Mondi Business Paper) and anionic starch on
PCC flocculation, using the same polymer content, is shown in Fig. 3.6B. The results show that the
cationic starch on its own does not cause much flocculation compared to the anionic starch.
A mixture of anionic starch and cationic starch (Mondi BP) in the ratio of 2:1 (w/w) was used to
flocculate PCC. Samples of different percentage polymer content were prepared and the size of the
flocculants was measured for each sample. Fig. 3.6C shows the same effect as seen in the case of
anionic starch (Fig. 3.6A), where an increase in polymer content resulted in an increase in
flocculant size. A bimodal distribution was also observed, especially for higher polymer content.
When 2.6% of the anionic starch to cationic starch at a ratio of 1:1 was used (Fig. 3.6D), significant
peak broadening was observed for the higher polymer content, with a substantial increase in the
average size of flocculants. The peak broadening effect could be due to the bridging of flocculants
via anionic-cationic interactions. Lower polymer content does not show this effect mainly because
most of the anionic groups are involved in flocculation rather than in anionic-cationic interactions.
These phenomena were then tested in hand sheets to determine their effects on the properties of the
hand sheets.
Fig 3.7 shows a comparison on the average size of PCC flocculants at different concentration of the
flocculating agents. The bar graph (Fig. 3.7) clearly shows that a mixture of HM 13.2 and CSt gave
higher average flocculant size than the corresponding HM 13.2, at all polymer content levels. (It
must be mentioned again that large PCC flocculants may cause detrimental effects on the paper
properties although they may result in high filler retention.)
Fig. 3.7: The effect of HM 13.2 and two HM 13.2/CSt (Mondi Business Paper) blend ratios on the average particle
size of PCC flocculants.
0.000 0.075 0.150 0.225 0.300 0.375 0.4500
10
20
30
40
50
60
70
80
Pur
e P
CC
Ave
rage
par
ticle
siz
e ( µµ µµm
)
Polymer content (%)
HM 13.2
HM 13.2/CSt = 2:1
HM 13.2/CSt = 1:1
PCC = 24%
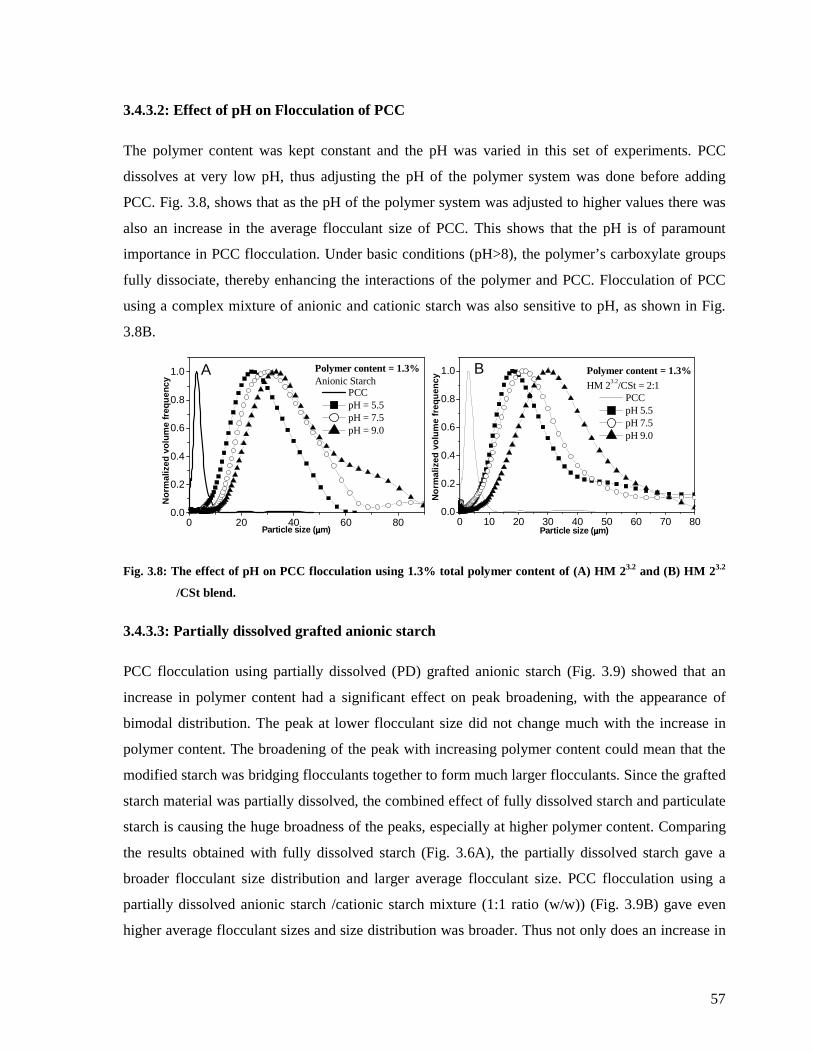
57
3.4.3.2: Effect of pH on Flocculation of PCC
The polymer content was kept constant and the pH was varied in this set of experiments. PCC
dissolves at very low pH, thus adjusting the pH of the polymer system was done before adding
PCC. Fig. 3.8, shows that as the pH of the polymer system was adjusted to higher values there was
also an increase in the average flocculant size of PCC. This shows that the pH is of paramount
importance in PCC flocculation. Under basic conditions (pH>8), the polymer’s carboxylate groups
fully dissociate, thereby enhancing the interactions of the polymer and PCC. Flocculation of PCC
using a complex mixture of anionic and cationic starch was also sensitive to pH, as shown in Fig.
3.8B.
Fig. 3.8: The effect of pH on PCC flocculation using 1.3% total polymer content of (A) HM 23.2 and (B) HM 23.2
/CSt blend.
3.4.3.3: Partially dissolved grafted anionic starch
PCC flocculation using partially dissolved (PD) grafted anionic starch (Fig. 3.9) showed that an
increase in polymer content had a significant effect on peak broadening, with the appearance of
bimodal distribution. The peak at lower flocculant size did not change much with the increase in
polymer content. The broadening of the peak with increasing polymer content could mean that the
modified starch was bridging flocculants together to form much larger flocculants. Since the grafted
starch material was partially dissolved, the combined effect of fully dissolved starch and particulate
starch is causing the huge broadness of the peaks, especially at higher polymer content. Comparing
the results obtained with fully dissolved starch (Fig. 3.6A), the partially dissolved starch gave a
broader flocculant size distribution and larger average flocculant size. PCC flocculation using a
partially dissolved anionic starch /cationic starch mixture (1:1 ratio (w/w)) (Fig. 3.9B) gave even
higher average flocculant sizes and size distribution was broader. Thus not only does an increase in
0 10 20 30 40 50 60 70 800.0
0.2
0.4
0.6
0.8
1.0
0 20 40 60 800.0
0.2
0.4
0.6
0.8
1.0 B Polymer content = 1.3%HM 23.2/CSt = 2:1
Particle size (µµµµm)
No
rmal
ized
vo
lum
e fr
equ
ency
PCC pH 5.5 pH 7.5 pH 9.0
A
No
rmal
ized
vo
lum
e fr
equ
ency
Particle size (µµµµm)
Polymer content = 1.3%Anionic Starch
PCC pH = 5.5 pH = 7.5 pH = 9.0
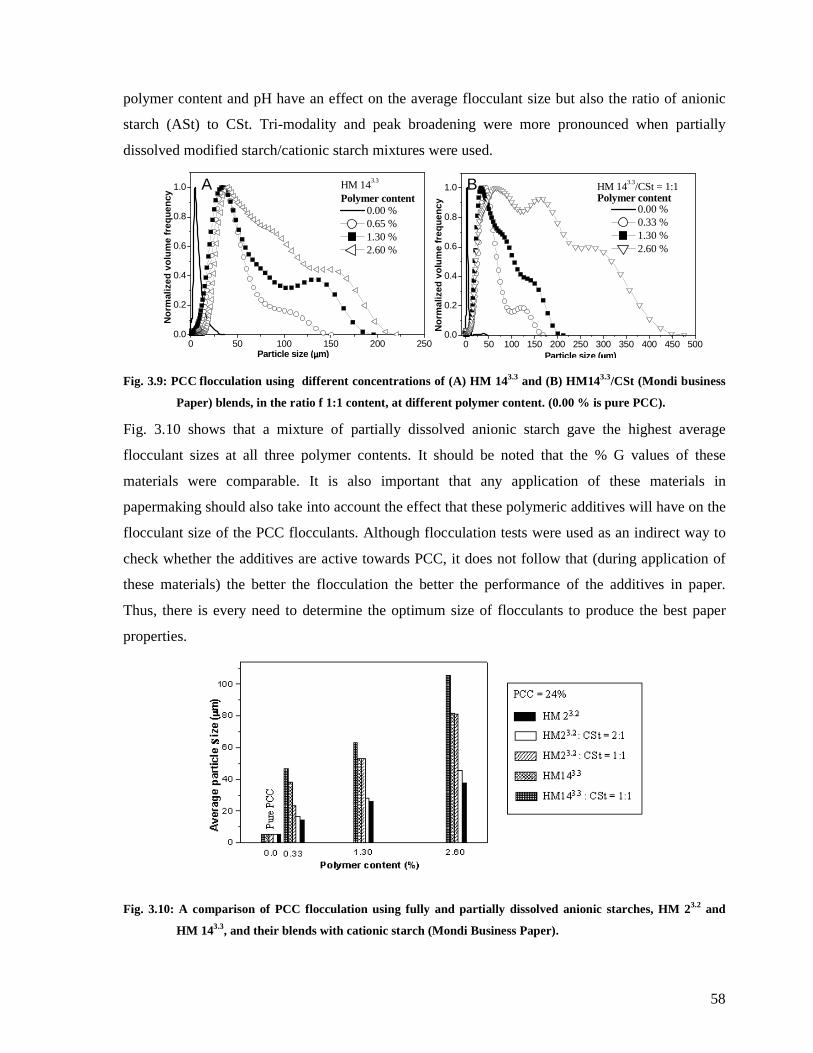
58
polymer content and pH have an effect on the average flocculant size but also the ratio of anionic
starch (ASt) to CSt. Tri-modality and peak broadening were more pronounced when partially
dissolved modified starch/cationic starch mixtures were used.
Fig. 3.9: PCC flocculation using different concentrations of (A) HM 143.3 and (B) HM143.3/CSt (Mondi business
Paper) blends, in the ratio f 1:1 content, at different polymer content. (0.00 % is pure PCC).
Fig. 3.10 shows that a mixture of partially dissolved anionic starch gave the highest average
flocculant sizes at all three polymer contents. It should be noted that the % G values of these
materials were comparable. It is also important that any application of these materials in
papermaking should also take into account the effect that these polymeric additives will have on the
flocculant size of the PCC flocculants. Although flocculation tests were used as an indirect way to
check whether the additives are active towards PCC, it does not follow that (during application of
these materials) the better the flocculation the better the performance of the additives in paper.
Thus, there is every need to determine the optimum size of flocculants to produce the best paper
properties.
Fig. 3.10: A comparison of PCC flocculation using fully and partially dissolved anionic starches, HM 23.2 and
HM 143.3, and their blends with cationic starch (Mondi Business Paper).
0 50 100 150 200 250 300 350 400 450 5000.0
0.2
0.4
0.6
0.8
1.0
0 50 100 150 200 2500.0
0.2
0.4
0.6
0.8
1.0 B HM 143.3/CSt = 1:1Polymer content
No
rmal
ized
vo
lum
e fr
equ
ency
Particle size (µµµµm)
0.00 % 0.33 % 1.30 % 2.60 %
AN
orm
aliz
ed v
olu
me
freq
uen
cy
Particle size (µµµµm)
HM 143.3
Polymer content 0.00 % 0.65 % 1.30 % 2.60 %
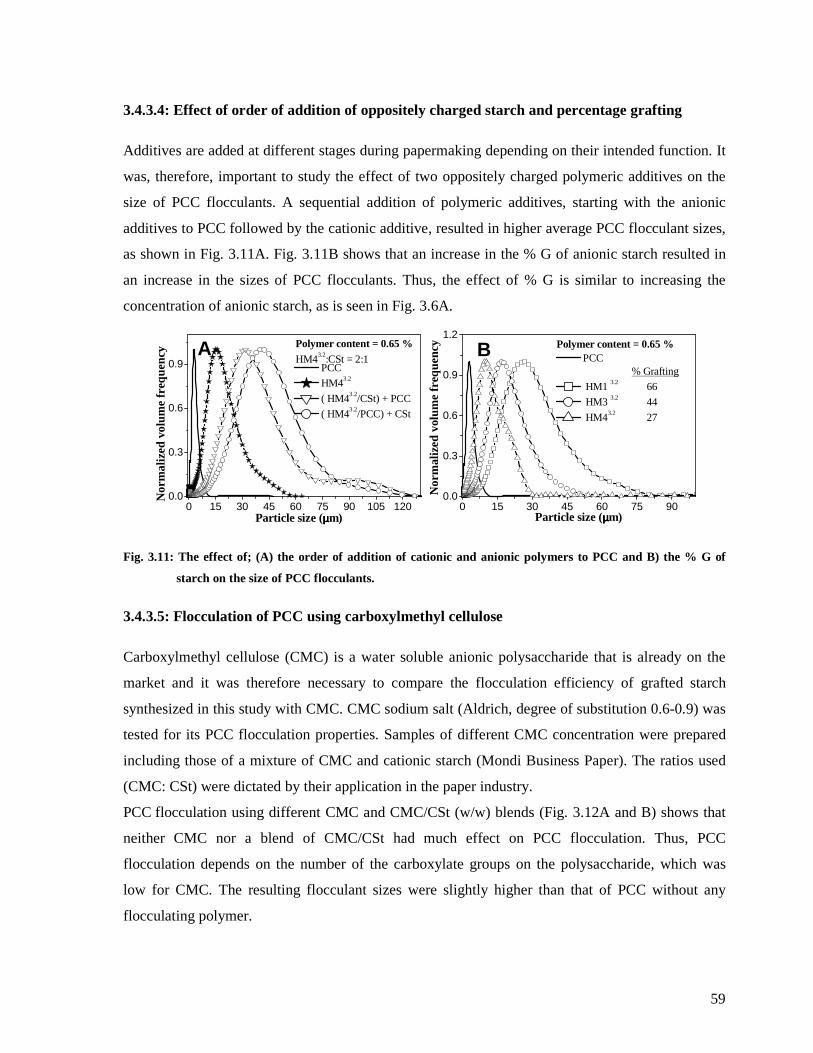
59
3.4.3.4: Effect of order of addition of oppositely charged starch and percentage grafting
Additives are added at different stages during papermaking depending on their intended function. It
was, therefore, important to study the effect of two oppositely charged polymeric additives on the
size of PCC flocculants. A sequential addition of polymeric additives, starting with the anionic
additives to PCC followed by the cationic additive, resulted in higher average PCC flocculant sizes,
as shown in Fig. 3.11A. Fig. 3.11B shows that an increase in the % G of anionic starch resulted in
an increase in the sizes of PCC flocculants. Thus, the effect of % G is similar to increasing the
concentration of anionic starch, as is seen in Fig. 3.6A.
Fig. 3.11: The effect of; (A) the order of addition of cationic and anionic polymers to PCC and B) the % G of
starch on the size of PCC flocculants.
3.4.3.5: Flocculation of PCC using carboxylmethyl cellulose
Carboxylmethyl cellulose (CMC) is a water soluble anionic polysaccharide that is already on the
market and it was therefore necessary to compare the flocculation efficiency of grafted starch
synthesized in this study with CMC. CMC sodium salt (Aldrich, degree of substitution 0.6-0.9) was
tested for its PCC flocculation properties. Samples of different CMC concentration were prepared
including those of a mixture of CMC and cationic starch (Mondi Business Paper). The ratios used
(CMC: CSt) were dictated by their application in the paper industry.
PCC flocculation using different CMC and CMC/CSt (w/w) blends (Fig. 3.12A and B) shows that
neither CMC nor a blend of CMC/CSt had much effect on PCC flocculation. Thus, PCC
flocculation depends on the number of the carboxylate groups on the polysaccharide, which was
low for CMC. The resulting flocculant sizes were slightly higher than that of PCC without any
flocculating polymer.
0 15 30 45 60 75 90 105 1200.0
0.3
0.6
0.9
0 15 30 45 60 75 900.0
0.3
0.6
0.9
1.2
A Polymer content = 0.65 %HM43.2:CSt = 2:1
Nor
mal
ized
vol
ume
freq
uenc
y
Particle size (µµµµm)
PCC
HM43.2
( HM43.2/CSt) + PCC
( HM43.2/PCC) + CSt
Polymer content = 0.65 %
Particle size (µµµµm)
Nor
mal
ized
vol
ume
freq
uenc
y
PCC % Grafting
HM1 3.2 66
HM3 3.2 44
HM43.2 27
B
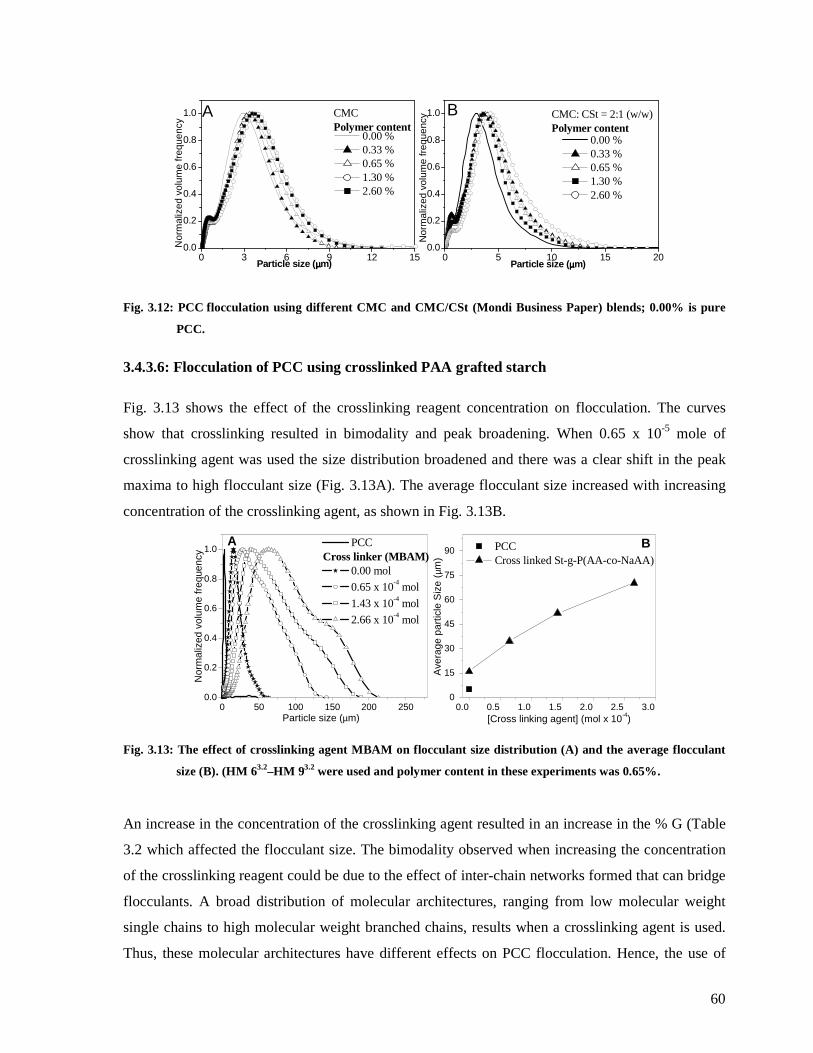
60
Fig. 3.12: PCC flocculation using different CMC and CMC/CSt (Mondi Business Paper) blends; 0.00% is pure
PCC.
3.4.3.6: Flocculation of PCC using crosslinked PAA grafted starch
Fig. 3.13 shows the effect of the crosslinking reagent concentration on flocculation. The curves
show that crosslinking resulted in bimodality and peak broadening. When 0.65 x 10⁻⁵ mole of
crosslinking agent was used the size distribution broadened and there was a clear shift in the peak
maxima to high flocculant size (Fig. 3.13A). The average flocculant size increased with increasing
concentration of the crosslinking agent, as shown in Fig. 3.13B.
Fig. 3.13: The effect of crosslinking agent MBAM on flocculant size distribution (A) and the average flocculant
size (B). (HM 63.2–HM 93.2 were used and polymer content in these experiments was 0.65%.
An increase in the concentration of the crosslinking agent resulted in an increase in the % G (Table
3.2 which affected the flocculant size. The bimodality observed when increasing the concentration
of the crosslinking reagent could be due to the effect of inter-chain networks formed that can bridge
flocculants. A broad distribution of molecular architectures, ranging from low molecular weight
single chains to high molecular weight branched chains, results when a crosslinking agent is used.
Thus, these molecular architectures have different effects on PCC flocculation. Hence, the use of
0 50 100 150 200 2500.0
0.2
0.4
0.6
0.8
1.0 PCC
Cross linker (MBAM) 0.00 mol
0.65 x 10⁻⁴ mol
1.43 x 10⁻⁴ mol
2.66 x 10⁻⁴ mol
Nor
mal
ized
vol
ume
freq
uenc
y
Particle size (µm)
Ave
rage
par
ticle
Siz
e (µ
m)
A
0.0 0.5 1.0 1.5 2.0 2.5 3.00
15
30
45
60
75
90B
PCC Cross linked St-g-P(AA-co-NaAA)
[Cross linking agent] (mol x 10-4)
0 3 6 9 12 150.0
0.2
0.4
0.6
0.8
1.0
0 5 10 15 200.0
0.2
0.4
0.6
0.8
1.0A
Nor
mal
ized
vol
ume
freq
uenc
y
Particle size (µµµµm)
CMCPolymer content
0.00 % 0.33 % 0.65 % 1.30 % 2.60 %
B CMC: CSt = 2:1 (w/w)Polymer content
Particle size (µµµµm)
Nor
mal
ized
vol
ume
freq
uenc
y
0.00 % 0.33 % 0.65 % 1.30 % 2.60 %
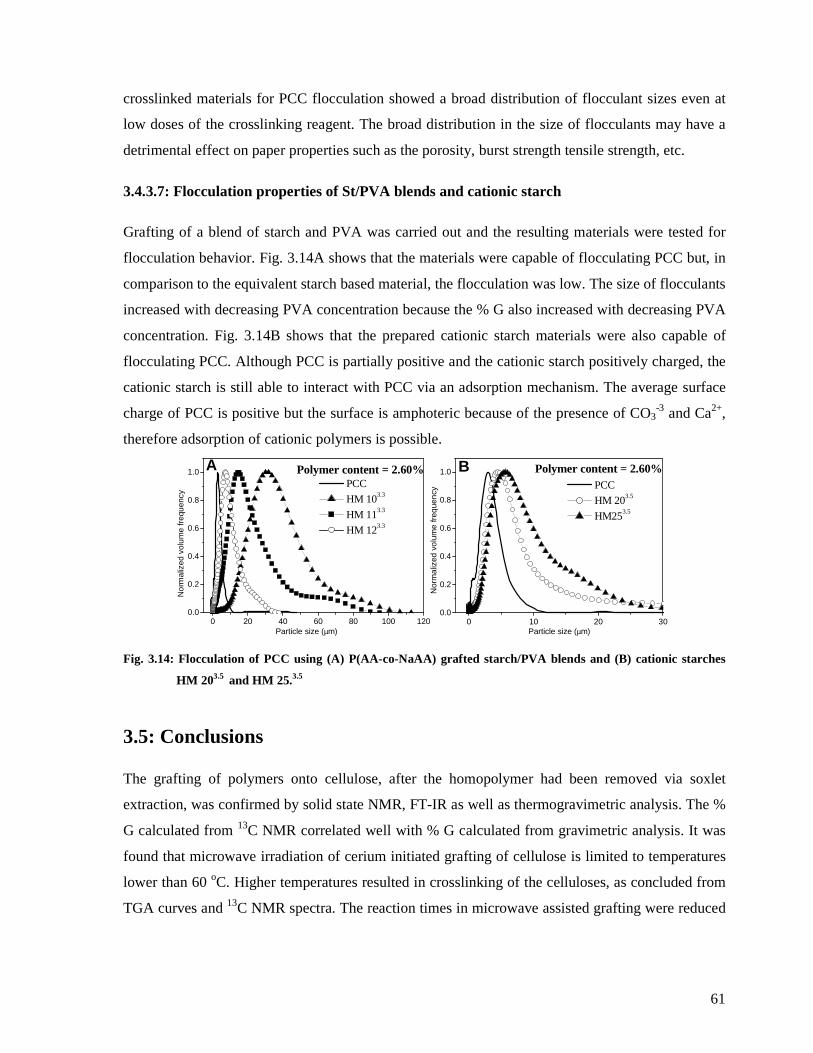
61
crosslinked materials for PCC flocculation showed a broad distribution of flocculant sizes even at
low doses of the crosslinking reagent. The broad distribution in the size of flocculants may have a
detrimental effect on paper properties such as the porosity, burst strength tensile strength, etc.
3.4.3.7: Flocculation properties of St/PVA blends and cationic starch
Grafting of a blend of starch and PVA was carried out and the resulting materials were tested for
flocculation behavior. Fig. 3.14A shows that the materials were capable of flocculating PCC but, in
comparison to the equivalent starch based material, the flocculation was low. The size of flocculants
increased with decreasing PVA concentration because the % G also increased with decreasing PVA
concentration. Fig. 3.14B shows that the prepared cationic starch materials were also capable of
flocculating PCC. Although PCC is partially positive and the cationic starch positively charged, the
cationic starch is still able to interact with PCC via an adsorption mechanism. The average surface
charge of PCC is positive but the surface is amphoteric because of the presence of CO3-3 and Ca2+,
therefore adsorption of cationic polymers is possible.
Fig. 3.14: Flocculation of PCC using (A) P(AA-co-NaAA) grafted starch/PVA blends and (B) cationic starches
HM 203.5 and HM 25.3.5
3.5: Conclusions
The grafting of polymers onto cellulose, after the homopolymer had been removed via soxlet
extraction, was confirmed by solid state NMR, FT-IR as well as thermogravimetric analysis. The %
G calculated from 13C NMR correlated well with % G calculated from gravimetric analysis. It was
found that microwave irradiation of cerium initiated grafting of cellulose is limited to temperatures
lower than 60 oC. Higher temperatures resulted in crosslinking of the celluloses, as concluded from
TGA curves and 13C NMR spectra. The reaction times in microwave assisted grafting were reduced
0 10 20 300.0
0.2
0.4
0.6
0.8
1.0
0 20 40 60 80 100 1200.0
0.2
0.4
0.6
0.8
1.0
Particle size (µm)
Nor
mal
ized
vol
ume
freq
uenc
y
B PCC
HM 203.5
HM253.5
Polymer content = 2.60%
Particle size (µm)
Nor
mal
ized
vol
ume
freq
uenc
y
PCC
HM 103.3
HM 113.3
HM 123.3
A Polymer content = 2.60%
62
significantly when compared to conventional grafting methods and the effect of microwave
irradiation power on % G was less significant.
Anionic and cationic polysaccharides were synthesized successfully via conventional grafting of
anionic and cationic monomers, respectively. All the initiation methods (Ce4+, Ce4+–KPS, and
APS–TEMED) used yielded grafted materials with considerable % G. A comparison between the
initiator systems is, however, not simple as the grafting efficiency depends on a number of factors,
including the time of reaction, initiator and reactants concentrations, temperature and even the
purity of the reactants such as the monomers and polysaccharides. Modified polysaccharides of
different % G were obtained by varying the polysaccharide to monomer ratio. Inclusion of a
crosslinking agent resulted in higher % G values. In general, any of the initiator systems used and
described in this study can be used to modify polysaccharides via the grafting technique.
It was also shown that the prepared anionic starch materials were good flocculating agents for PCC.
The average size of flocculants could be varied by varying the modified starch concentration and
pH. The effect of % G on the size of PCC flocculants was equivalent to that of varying the
concentration of the modified starch. Thus, the higher the % G of the modified starch and the
concentration of anionic starch, the larger the average sizes of PCC flocculants.
Selected modified starch materials were used for CaCO3 crystal growth modification (see Chapter
4). Some of the modified polysaccharides were also tested for PCC retention in paper and were also
used in the preparation of anionic starch coated starch particles for filler-fiber bonding in paper
application (see Chapter 6).
3.6: References
(1) Singh, V., Tiwari A., Tripathi D. N., Sanghi R. Polymer 2006, 47, 254-260.
(2) Singh, V., Tiwari A., Tripathi D. N., Sanghi R. Carbohydrate 2004, 58, 1-6.
(3) Satge, C., Verneuil B., Branland P., Granet R., Krausz P., Rozier J., Petit C. Carbohydrate
Polymers 2002, 49, 373-376.
(4) Antova, G., Vasvasova P., Zlatanov M. Carbohydrate Polymers 2004, 57, 131-134.
(5) Chauhan, G. S., Guleria L. Sharma R. Cellulose 2005, 12, 97-110.
(6) Gurdag, G., Yasar M., Gurkaynak M. A. Journal of Applied Polymer Science 1997, 66, 929-
934.
(7) Gupta, K. C., Sahoo S. Biomacromolecules 2001, 2, 239-247.
(8) Lu, S., Lin S., Yao K. Starch 2004, 56, 138-143.
(9) Chen, T.-S. R., DeVito V. L., Frederick K. V. US patent 2006, no. 7001953.
63
(10) Princi, E., Vicini S., Proietti N., Capitani D. European Polymer Journal 2005, 41, 1196-
1203.
(11) Stejskal, E. O., Memory J. D. High Resolution NMR in the Solid State Fundamentals of CP-
MAS. 1994, NewYork: Oxford University Press.
(12) Haris, R. K., Granger P. H. Multinuclear Magnetic Resonance in Liquids and Solids-
Chemical Application. 1990, Kluwer Academic Publishers, Dordrecht.
(13) Gupta, K. C., Khandekar K. Biomacromolecules 2003, 4, 758-765.
(14) Yeng, W. S., Tahir P. M., Chiang L. K., Yunus W. M. Z. W. Journal of Applied Polymer
Science 2004, 94, 154-158.
(15) Soppirnath, K. S., Aminabhavi T. M. European Journal of Pharmaceutics and
Biopharmaceutics 2002, 53, 87-98.
(16) Navarro, R. R., Sumi K., Matsumura M. Water Research 1999, 33(9), 2037-2044.
(17) Athawale, V. D., Lele V. Starch 2001, 53, 7-13.
(18) Marton, J., Marton T. Tappi 1976, 59(12), 121-124.
(19) Roberts, J. C., Au C. O., Clay G. A., Lough C. Tappi Journal 1986, 69(10), 88-93.
(20) Okieimen, F. E. Journal of Applied Polymer Science 2003, 89, 913-923.
(21) Soppirnath, K. S., Kulkarni A. R., Aminabhavi T. M. Journal of Biomaterials Science,
Polymer Edition 2000, 11, 27-43.
64
Chapter 4: Crystallization of CaCO3 in the presence of polymeric
additives
65
4.1: Introduction
CaCO3 is often used as filler in various industries, including the paper industry. The properties of
the main crystal morphologies of CaCO3 fillers have been highlighted in Chapter 2. Precipitated
calcium carbonate (PCC) and ground calcium carbonate (GCC) are widely used in the paper
industry. The papermaker can improve drainage by blending PCC with GCC, which can translate
into increased machine speeds. Inclusion of GCC has less effect on the bulkiness of the paper but
the paper stiffness and tensile strength are improved when compared to using a 100% PCC filler.
PCC is a mixture of two CaCO3 polymorphs, calcite and aragonite, which are more
thermodynamically stable than vaterite. Calcite is the most thermodynamic stable polymorph and is
abundant. The crystal morphologies of calcite and aragonite in PCC are different. Calcite crystals
exist in two crystal shapes, scalenohedral and prismatic, whereas aragonite typically has an
orthorhombic (needle-like) morphology. In general, fillers should be compatible with the matrix
and, in the case of paper; filler-fiber bonding should be promoted.
The efficiency of a polymeric crystal growth modifier in nucleation is correlated to its binding
capacity towards the Ca2+ and this is essential for the formation of sub-critical nuclei that will then
grow to the required size for crystal growth. The presence of a polymeric additive may inhibit
crystal growth during the nucleation stage, resulting in an induction period. The relationship
between the induction period, surface energy and super saturation for calcite nuclei is given below:1
( ) ( )23B
2s
2
logS
1
T2.303k
γβlogτ
∝
ϑ 4.1
Where τ is the induction time, β is a shape factor for the calcite nuclei (16π /3 for spherical
shapes), ϑ is the molar volume of calcite (=1.89 x 10⁻⁵ m-3), γ is the surface energy of the nuclei,
Bk is the Boltzmann’s constant, T is the reaction temperature and S is the solution
supersaturation.
The induction time depends mainly on the solution supersaturation and the surface energy of the
growing nuclei. Thus, the induction time is correlated to the effect of the polymeric additive or any
other contaminant present on nucleation and crystal growth.
In this study, crystallization experiments were carried out to investigate the effect of polymeric
additives on the morphology of CaCO3 and the extent of interaction between polymeric additives
and CaCO3. The effect of the crystallization temperature on the crystal morphology was also
investigated. Thus, CaCO3 crystallization was performed using different polymeric additives. The
study explores the feasibility of performing in situ crystallization of calcium carbonate in the
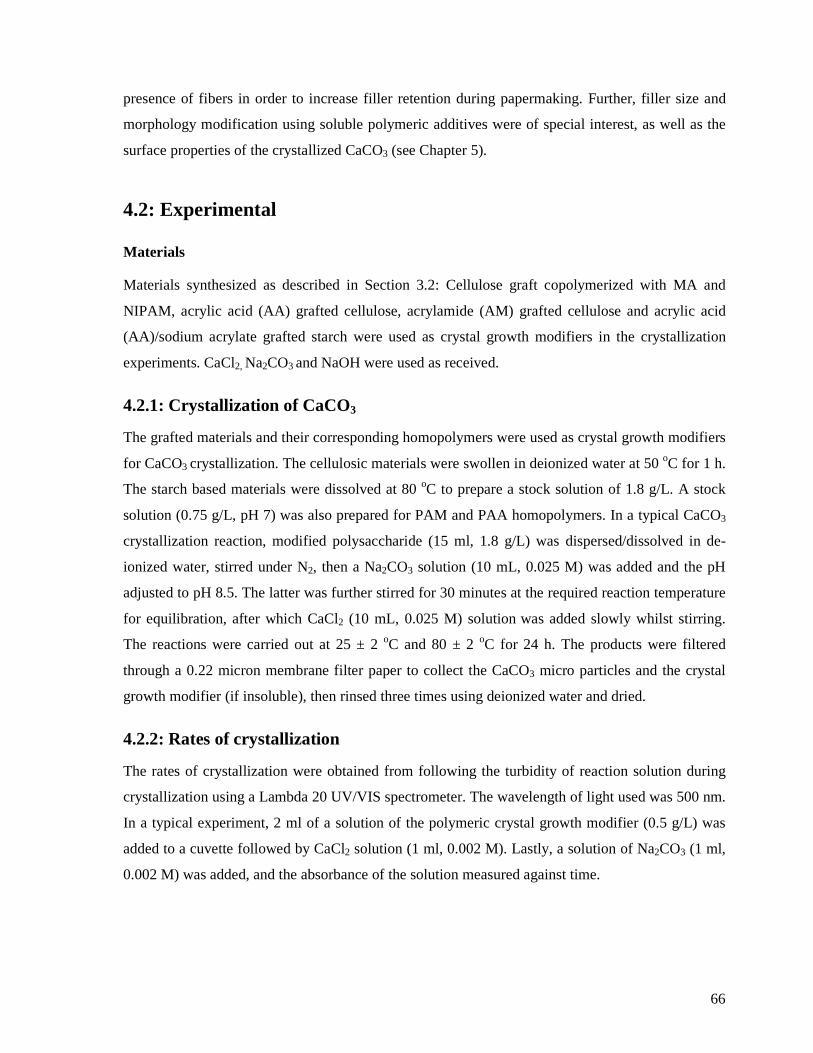
66
presence of fibers in order to increase filler retention during papermaking. Further, filler size and
morphology modification using soluble polymeric additives were of special interest, as well as the
surface properties of the crystallized CaCO3 (see Chapter 5).
4.2: Experimental
Materials
Materials synthesized as described in Section 3.2: Cellulose graft copolymerized with MA and
NIPAM, acrylic acid (AA) grafted cellulose, acrylamide (AM) grafted cellulose and acrylic acid
(AA)/sodium acrylate grafted starch were used as crystal growth modifiers in the crystallization
experiments. CaCl2, Na2CO3 and NaOH were used as received.
4.2.1: Crystallization of CaCO3
The grafted materials and their corresponding homopolymers were used as crystal growth modifiers
for CaCO3 crystallization. The cellulosic materials were swollen in deionized water at 50 oC for 1 h.
The starch based materials were dissolved at 80 oC to prepare a stock solution of 1.8 g/L. A stock
solution (0.75 g/L, pH 7) was also prepared for PAM and PAA homopolymers. In a typical CaCO3
crystallization reaction, modified polysaccharide (15 ml, 1.8 g/L) was dispersed/dissolved in de-
ionized water, stirred under N2, then a Na2CO3 solution (10 mL, 0.025 M) was added and the pH
adjusted to pH 8.5. The latter was further stirred for 30 minutes at the required reaction temperature
for equilibration, after which CaCl2 (10 mL, 0.025 M) solution was added slowly whilst stirring.
The reactions were carried out at 25 ± 2 oC and 80 ± 2 oC for 24 h. The products were filtered
through a 0.22 micron membrane filter paper to collect the CaCO3 micro particles and the crystal
growth modifier (if insoluble), then rinsed three times using deionized water and dried.
4.2.2: Rates of crystallization
The rates of crystallization were obtained from following the turbidity of reaction solution during
crystallization using a Lambda 20 UV/VIS spectrometer. The wavelength of light used was 500 nm.
In a typical experiment, 2 ml of a solution of the polymeric crystal growth modifier (0.5 g/L) was
added to a cuvette followed by CaCl2 solution (1 ml, 0.002 M). Lastly, a solution of Na2CO3 (1 ml,
0.002 M) was added, and the absorbance of the solution measured against time.
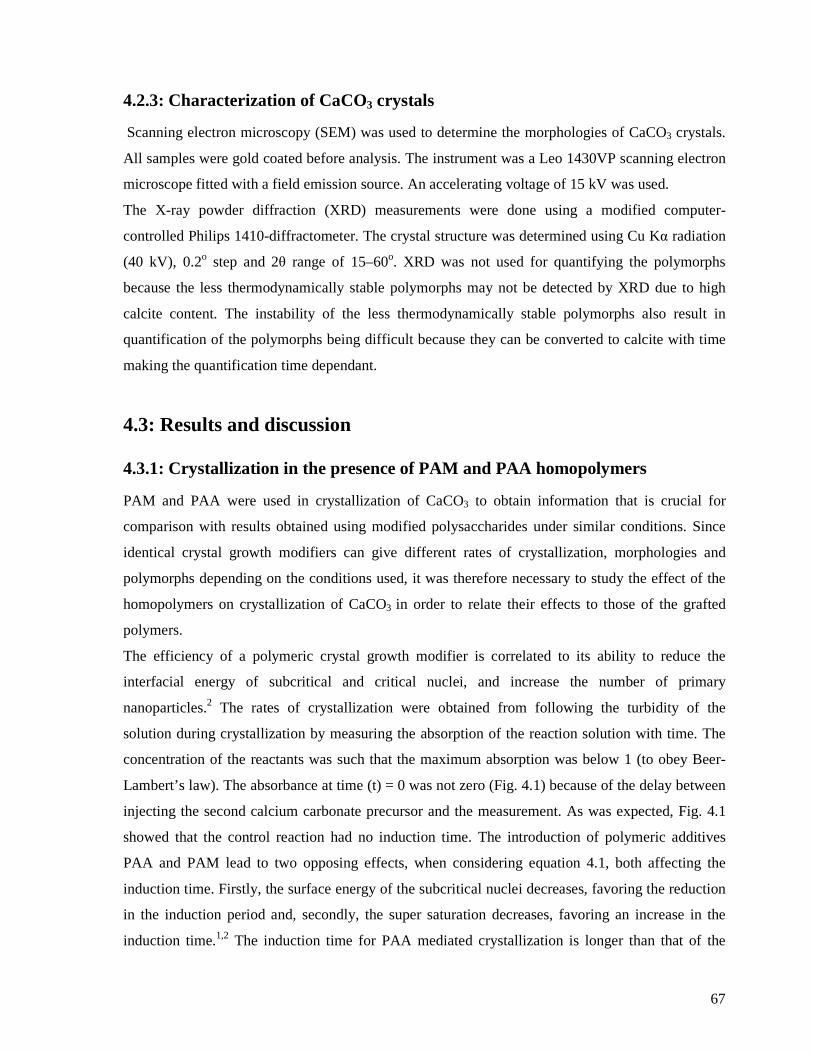
67
4.2.3: Characterization of CaCO3 crystals
Scanning electron microscopy (SEM) was used to determine the morphologies of CaCO3 crystals.
All samples were gold coated before analysis. The instrument was a Leo 1430VP scanning electron
microscope fitted with a field emission source. An accelerating voltage of 15 kV was used.
The X-ray powder diffraction (XRD) measurements were done using a modified computer-
controlled Philips 1410-diffractometer. The crystal structure was determined using Cu Kα radiation
(40 kV), 0.2o step and 2θ range of 15–60o. XRD was not used for quantifying the polymorphs
because the less thermodynamically stable polymorphs may not be detected by XRD due to high
calcite content. The instability of the less thermodynamically stable polymorphs also result in
quantification of the polymorphs being difficult because they can be converted to calcite with time
making the quantification time dependant.
4.3: Results and discussion
4.3.1: Crystallization in the presence of PAM and PAA homopolymers
PAM and PAA were used in crystallization of CaCO3 to obtain information that is crucial for
comparison with results obtained using modified polysaccharides under similar conditions. Since
identical crystal growth modifiers can give different rates of crystallization, morphologies and
polymorphs depending on the conditions used, it was therefore necessary to study the effect of the
homopolymers on crystallization of CaCO3 in order to relate their effects to those of the grafted
polymers.
The efficiency of a polymeric crystal growth modifier is correlated to its ability to reduce the
interfacial energy of subcritical and critical nuclei, and increase the number of primary
nanoparticles.2 The rates of crystallization were obtained from following the turbidity of the
solution during crystallization by measuring the absorption of the reaction solution with time. The
concentration of the reactants was such that the maximum absorption was below 1 (to obey Beer-
Lambert’s law). The absorbance at time (t) = 0 was not zero (Fig. 4.1) because of the delay between
injecting the second calcium carbonate precursor and the measurement. As was expected, Fig. 4.1
showed that the control reaction had no induction time. The introduction of polymeric additives
PAA and PAM lead to two opposing effects, when considering equation 4.1, both affecting the
induction time. Firstly, the surface energy of the subcritical nuclei decreases, favoring the reduction
in the induction period and, secondly, the super saturation decreases, favoring an increase in the
induction time.1,2 The induction time for PAA mediated crystallization is longer than that of the
68
control and PAM mediated crystallization (Fig. 4.1). This can be explained by considering the
strong interactions of PAA with the metal ions before formation of sub-critical crystals, resulting in
reduction in the super saturation leading to an increase in induction time.
Fig. 4.1: Rate of CaCO3 crystallization in the presence of PAA and PAM.
The functional group on the polyacrylamide polymer does interact with the metal ions but to a much
lesser extent (less effect on super saturation) when compared to the functional group on PAA, hence
a shorter induction time was observed. The solution absorbance increased with time as crystal
growth occurred with more crystals being formed. The absorbance reached a plateau, signaling the
completion of the inorganic reactants and the particles formed were colloidally stable. However,
particle growth continues via Ostwald ripening, resulting in unstable colloids that tend to sediment,
and resulting in a decrease in the absorbance of the solution. The driving force behind Ostwald
ripening is the decrease in the surface energy of the colloids. The control reaction showed an
immediate decrease in the absorbance soon after the plateau compared to the case of PAM and
PAA, indicating that the polymeric additives stabilized the colloids with PAA giving more stability
to crystals. Similar experiments were not done for the modified polymers due to the particulate
nature of cellulose and the high flocculation of modified starch. The modified cellulose does not
form a stable suspension and tends to drop to the bottom of the cuvette, distorting the UV signal.
On the other hand, modified starch flocculates the CaCO3 crystals resulting in large particles that
are colloidally unstable and thus the UV signal is distorted as well. However, the effect of the
grafted polymers (PAA and PAM) on CaCO3 crystallization was expected to be similar to the one
effected by the homopolymers since the functionality polymers that controls the crystallization
69
process is the same. It was expected that PAA grafted polysaccharides will give longer inhibition
periods than PAM grafted polysaccharides. However, this is subject to the solution super saturation
and the concentration of the polymeric additive. A combination of high solution super saturation
and low concentration of polymeric additive (or low metal ion binding efficiency polymeric
additive) may lead to masking of the induction period.
Fig 4.2 shows the SEM images of CaCO3 crystals synthesized in the absence of polymeric additive
and in the presence of PAM and PAA at 25 oC and 80 oC. The calcium carbonate crystals
synthesized in the absence of any polymeric additive (blank) at 25 oC were rhombohedral in shape
Fig. 4.2(A1) and were mostly calcite, as seen in the XRD spectrum in Fig. 4.3 (labeled blank).
Fig. 4.2: SEM images of (A) CaCO3 crystals, (B) PAM modified CaCO3 and (C) PAA modified CaCO3 crystals.
(polymeric additive concentration 0.32g/L, pH 8.5.)
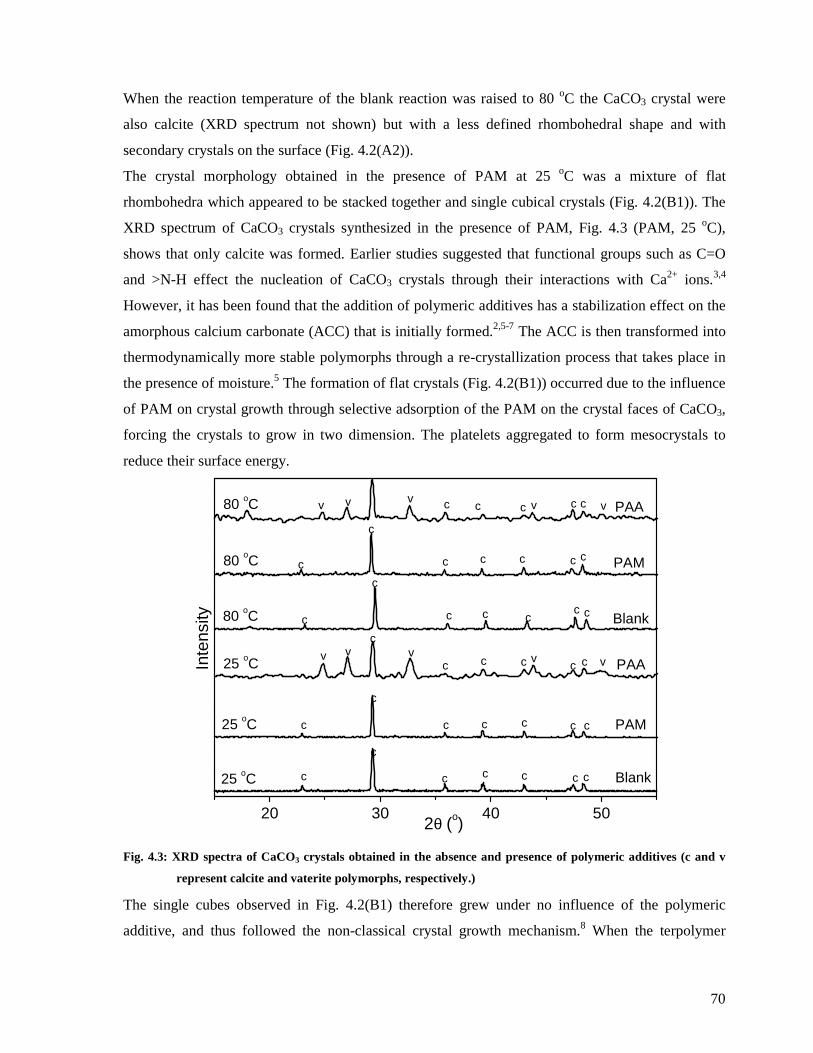
70
When the reaction temperature of the blank reaction was raised to 80 oC the CaCO3 crystal were
also calcite (XRD spectrum not shown) but with a less defined rhombohedral shape and with
secondary crystals on the surface (Fig. 4.2(A2)).
The crystal morphology obtained in the presence of PAM at 25 oC was a mixture of flat
rhombohedra which appeared to be stacked together and single cubical crystals (Fig. 4.2(B1)). The
XRD spectrum of CaCO3 crystals synthesized in the presence of PAM, Fig. 4.3 (PAM, 25 oC),
shows that only calcite was formed. Earlier studies suggested that functional groups such as C=O
and >N-H effect the nucleation of CaCO3 crystals through their interactions with Ca2+ ions.3,4
However, it has been found that the addition of polymeric additives has a stabilization effect on the
amorphous calcium carbonate (ACC) that is initially formed.2,5-7 The ACC is then transformed into
thermodynamically more stable polymorphs through a re-crystallization process that takes place in
the presence of moisture.5 The formation of flat crystals (Fig. 4.2(B1)) occurred due to the influence
of PAM on crystal growth through selective adsorption of the PAM on the crystal faces of CaCO3,
forcing the crystals to grow in two dimension. The platelets aggregated to form mesocrystals to
reduce their surface energy.
20 30 40 50
Inte
nsity
c
c
c
c
cc
c
v
v
v
vvvv
vvv c
c
c
c
c
c
c
c
c
c
c
c c
c c
c c
c c
cc
c
c
c
c
c
c
c
c
cc
Blank
PAM
PAA
25 oC
25 oC
25 oC
80 oC
80 oC
2θ (o)
80 oC
PAA
PAM
Blank
c
Fig. 4.3: XRD spectra of CaCO3 crystals obtained in the absence and presence of polymeric additives (c and v
represent calcite and vaterite polymorphs, respectively.)
The single cubes observed in Fig. 4.2(B1) therefore grew under no influence of the polymeric
additive, and thus followed the non-classical crystal growth mechanism.8 When the terpolymer
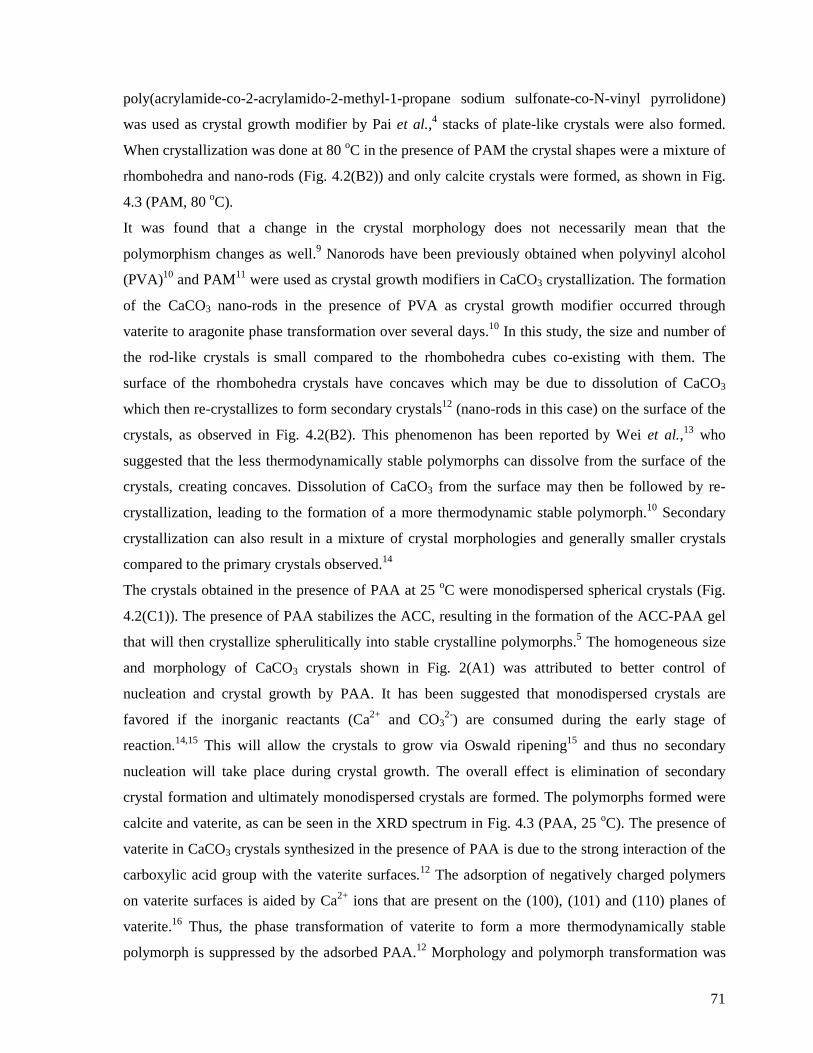
71
poly(acrylamide-co-2-acrylamido-2-methyl-1-propane sodium sulfonate-co-N-vinyl pyrrolidone)
was used as crystal growth modifier by Pai et al.,4 stacks of plate-like crystals were also formed.
When crystallization was done at 80 oC in the presence of PAM the crystal shapes were a mixture of
rhombohedra and nano-rods (Fig. 4.2(B2)) and only calcite crystals were formed, as shown in Fig.
4.3 (PAM, 80 oC).
It was found that a change in the crystal morphology does not necessarily mean that the
polymorphism changes as well.9 Nanorods have been previously obtained when polyvinyl alcohol
(PVA)10 and PAM11 were used as crystal growth modifiers in CaCO3 crystallization. The formation
of the CaCO3 nano-rods in the presence of PVA as crystal growth modifier occurred through
vaterite to aragonite phase transformation over several days.10 In this study, the size and number of
the rod-like crystals is small compared to the rhombohedra cubes co-existing with them. The
surface of the rhombohedra crystals have concaves which may be due to dissolution of CaCO3
which then re-crystallizes to form secondary crystals12 (nano-rods in this case) on the surface of the
crystals, as observed in Fig. 4.2(B2). This phenomenon has been reported by Wei et al.,13 who
suggested that the less thermodynamically stable polymorphs can dissolve from the surface of the
crystals, creating concaves. Dissolution of CaCO3 from the surface may then be followed by re-
crystallization, leading to the formation of a more thermodynamic stable polymorph.10 Secondary
crystallization can also result in a mixture of crystal morphologies and generally smaller crystals
compared to the primary crystals observed.14
The crystals obtained in the presence of PAA at 25 oC were monodispersed spherical crystals (Fig.
4.2(C1)). The presence of PAA stabilizes the ACC, resulting in the formation of the ACC-PAA gel
that will then crystallize spherulitically into stable crystalline polymorphs.5 The homogeneous size
and morphology of CaCO3 crystals shown in Fig. 2(A1) was attributed to better control of
nucleation and crystal growth by PAA. It has been suggested that monodispersed crystals are
favored if the inorganic reactants (Ca2+ and CO32-) are consumed during the early stage of
reaction.14,15 This will allow the crystals to grow via Oswald ripening15 and thus no secondary
nucleation will take place during crystal growth. The overall effect is elimination of secondary
crystal formation and ultimately monodispersed crystals are formed. The polymorphs formed were
calcite and vaterite, as can be seen in the XRD spectrum in Fig. 4.3 (PAA, 25 oC). The presence of
vaterite in CaCO3 crystals synthesized in the presence of PAA is due to the strong interaction of the
carboxylic acid group with the vaterite surfaces.12 The adsorption of negatively charged polymers
on vaterite surfaces is aided by Ca2+ ions that are present on the (100), (101) and (110) planes of
vaterite.16 Thus, the phase transformation of vaterite to form a more thermodynamically stable
polymorph is suppressed by the adsorbed PAA.12 Morphology and polymorph transformation was
72
observed when the CaCO3 crystals synthesized in the presence of PAA at 25 oC were stirred for six
days. The spherical particles obtained after 24 hrs of reaction were fused together forming 3D net
works (Fig. D2(A), Appendix D). The transformation can be attributed to a further decrease in the
surface energy by the system through the formation of stable structures and one polymorph (since
calcite only was observed). The crystal morphology obtained at 80 oC for PAA mediated
crystallization was a mixture of large spherical-like crystals and smaller regular-shaped crystals that
were on the surface of the large spherical crystals, as shown in Fig. 4.2(C2). A deviation in crystal
morphology may be due to the shift in the kinetic/thermodynamic balance and not necessarily due
to the binding of the polymer on the crystal face as postulated by Dickinson et al.17 The stabilization
effect of the –COOH group was also effective at higher temperature as vaterite crystals, present at
25 oC, were also present at 80 oC, as shown in Fig. 4.3 (PAA, 80 oC). Vaterite is a meta-stable phase
of calcium carbonate and is the less thermodynamically stable polymorph, with a higher solubility
than calcite and aragonite.18 Generally, once vaterite is exposed to water it converts to either calcite
at low temperature or aragonite at high temperature. However, the dissolution of vaterite may also
depend on the extent of stabilization effected by the polymeric additive.12 Pan et al.19 obtained a
mixture of calcite and aragonite crystals when PAA was used as crystal growth modifier in the
temperature range 75–95 oC. Moreover, they showed that the fraction of aragonite gradually
increased with increasing temperature, indicating that aragonite is favored at high temperature.19
Some factors known to influence polymorph selectivity include the [COOH]/[Ca2+] ratio, which
affects phase transformation of the polymorphs, and an increase in the ratio resulted in no
transformation of vaterite to calcite at low temperature.12 The [Ca2+] and [CO32-] were also found to
influence polymorph selectivity, with an excess of [Ca2+] favoring the formation of vaterite.20 Since
vaterite is present at 80 oC, the stabilization of PAA was effective in suppressing the formation of
aragonite which is favored at high temperatures. Thus, the existence of vaterite at high temperature
is likely to be due to a combination of both thermodynamic and kinetic effects.
4.3.2: Crystallization of CaCO3 in the presence of cellulose and cellulose graft
copolymerized with MA and NIPAM
When cellulose was used as a crystal growth modifier in CaCO3 crystallization at 25 oC, the single
crystals formed were rhombohedral in shape and were observed on the surface of the cellulose
fibers (Fig. 4.4). XRD analysis showed that the crystals were calcite, as shown in Fig. 4.9A (ii).
Results for the crystallization of calcium carbonate showed that the cellulose grafted with PMA-co-
NIPAM can nucleate CaCO3 crystal formation much better than ungrafted cellulose can, as shown
73
in Fig. 4.4B. Crystals formed in the presence of cellulose were rhombohedral single crystals,
whereas platelet like crystals that stacked together and cubical single crystals were formed in the
presence of MA and NIPAM graft copolymerized on cellulose.
Fig. 4.4: SEM images of CaCO3 crystals obtained in the presence of (A) cellulose at different magnifications (A1-
A3).and (B) NIPAM & MA graft copolymerized on CE (G2).
Grafting can also enhance the adsorption of CaCO3 crystals on the surface of the fiber as many
particles were adsorbed on the surface of the grafted fibers. However, there was no observed effect
of % G on the morphology of crystals of CaCO3. This could be because the % G values of the
grafted celluloses were close to one another (see Table 3.1). Calcium carbonate exists as three
polymorphs: vaterite, aragonite and calcite, in order of their thermodynamic stability and phase
transformation possible. Fig 4.5 shows that the calcite polymorph was obtained for crystals
synthesized in the presence of cellulose and cellulose graft copolymerized with NIPAM and MA.
The peaks at 876 cm-1 and 711 cm-1 (Fig. 4.5) are due the calcite.21 The absence of the aragonite and
vaterite polymorphs’ characteristic peaks at 1057 and 1082 cm-1, 22 and 745 cm-1,21 respectively,
means that the synthesized CaCO3 consisted of mainly the calcite polymorph. These characteristic
peaks are due to the C–O (stretch) of the different polymorphs.
Crystals were synthesized at 25 oC, [Ca2+] = [ CO32-] = 0.025 M, pH 8.5 and [polymeric additives] =0.77 g/L and
A2 and B2 are enlargements whereas inserts A3 and B3 in A2 and B2 respectively are further enlargements
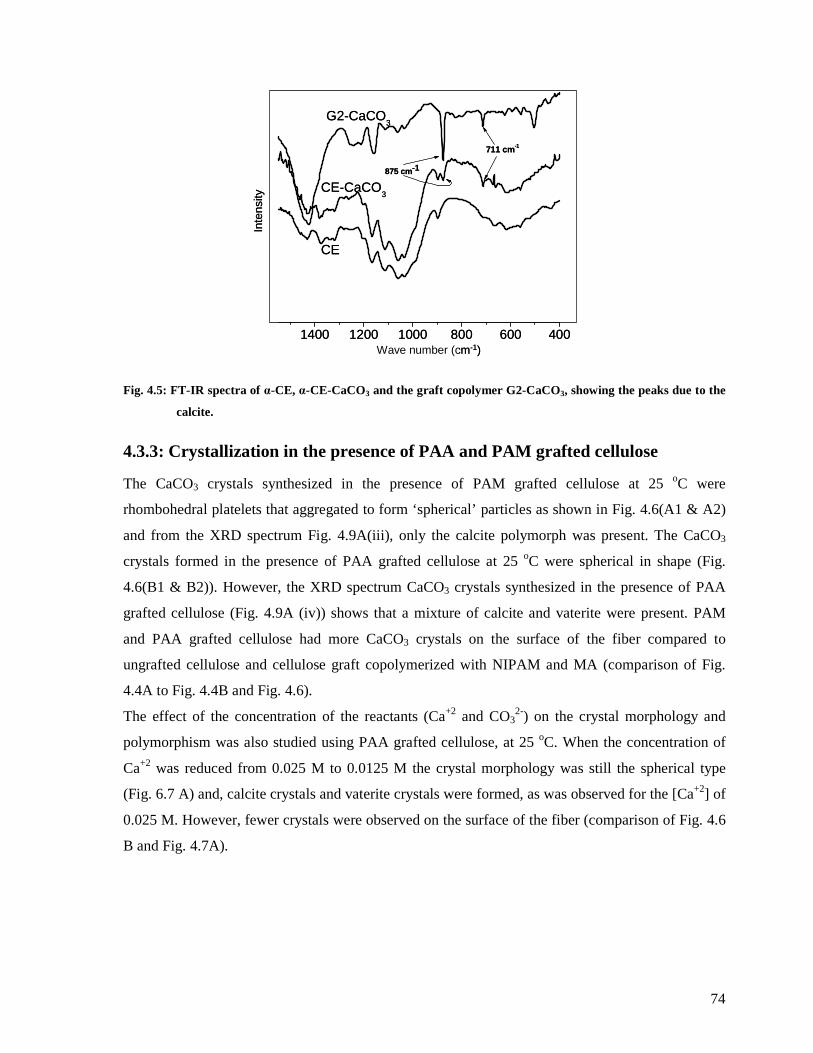
74
Fig. 4.5: FT-IR spectra of α-CE, α-CE-CaCO3 and the graft copolymer G2-CaCO3, showing the peaks due to the
calcite.
4.3.3: Crystallization in the presence of PAA and PAM grafted cellulose
The CaCO3 crystals synthesized in the presence of PAM grafted cellulose at 25 oC were
rhombohedral platelets that aggregated to form ‘spherical’ particles as shown in Fig. 4.6(A1 & A2)
and from the XRD spectrum Fig. 4.9A(iii), only the calcite polymorph was present. The CaCO3
crystals formed in the presence of PAA grafted cellulose at 25 oC were spherical in shape (Fig.
4.6(B1 & B2)). However, the XRD spectrum CaCO3 crystals synthesized in the presence of PAA
grafted cellulose (Fig. 4.9A (iv)) shows that a mixture of calcite and vaterite were present. PAM
and PAA grafted cellulose had more CaCO3 crystals on the surface of the fiber compared to
ungrafted cellulose and cellulose graft copolymerized with NIPAM and MA (comparison of Fig.
4.4A to Fig. 4.4B and Fig. 4.6).
The effect of the concentration of the reactants (Ca+2 and CO32-) on the crystal morphology and
polymorphism was also studied using PAA grafted cellulose, at 25 oC. When the concentration of
Ca+2 was reduced from 0.025 M to 0.0125 M the crystal morphology was still the spherical type
(Fig. 6.7 A) and, calcite crystals and vaterite crystals were formed, as was observed for the [Ca+2] of
0.025 M. However, fewer crystals were observed on the surface of the fiber (comparison of Fig. 4.6
B and Fig. 4.7A).
1400 1200 1000 800 600 400
CE
CE-CaCO3
cm -1
G2-CaCO3
875 cm-1
711 cm-1
Wave number (cm-1)
Inte
nsity
1400 1200 1000 800 600 400
CE
CE-CaCO3
cm -1
G2-CaCO3
875 cm-1
711 cm-1
Wave number (cm-1)
Inte
nsity
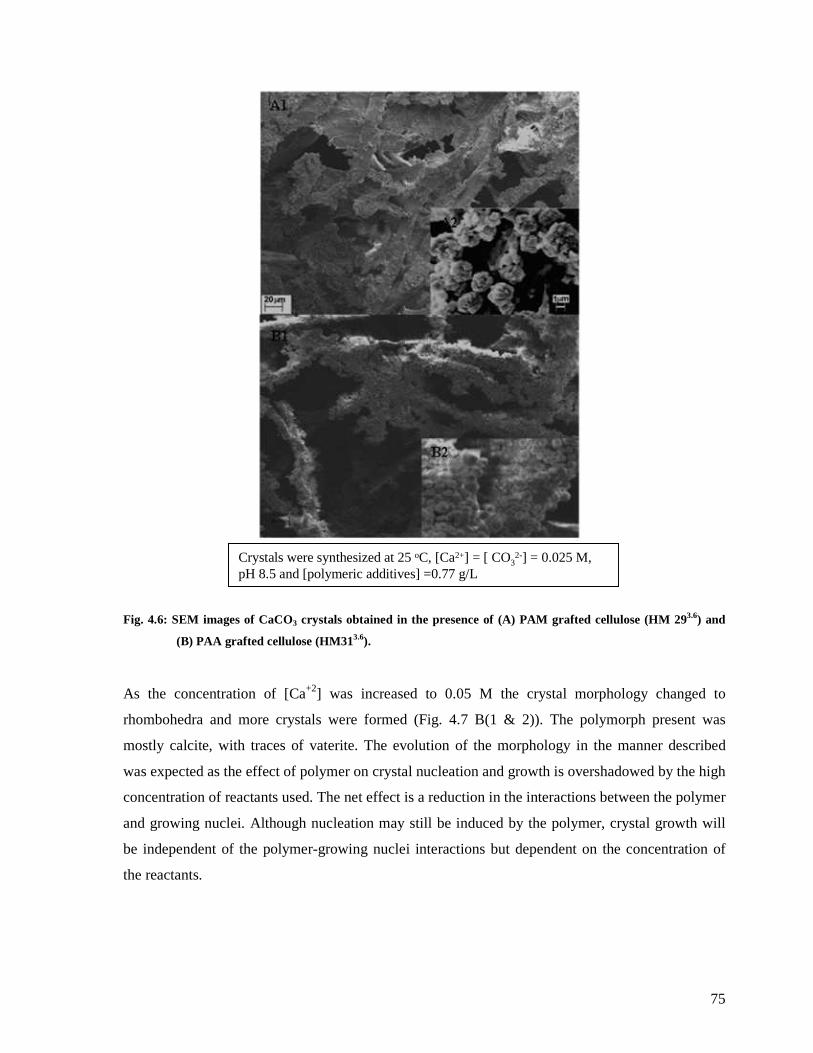
75
Fig. 4.6: SEM images of CaCO3 crystals obtained in the presence of (A) PAM grafted cellulose (HM 293.6) and
(B) PAA grafted cellulose (HM313.6).
As the concentration of [Ca+2] was increased to 0.05 M the crystal morphology changed to
rhombohedra and more crystals were formed (Fig. 4.7 B(1 & 2)). The polymorph present was
mostly calcite, with traces of vaterite. The evolution of the morphology in the manner described
was expected as the effect of polymer on crystal nucleation and growth is overshadowed by the high
concentration of reactants used. The net effect is a reduction in the interactions between the polymer
and growing nuclei. Although nucleation may still be induced by the polymer, crystal growth will
be independent of the polymer-growing nuclei interactions but dependent on the concentration of
the reactants.
Crystals were synthesized at 25 oC, [Ca2+] = [ CO32-] = 0.025 M,
pH 8.5 and [polymeric additives] =0.77 g/LCrystals were synthesized at 25 oC, [Ca2+] = [ CO3
2-] = 0.025 M, pH 8.5 and [polymeric additives] =0.77 g/L
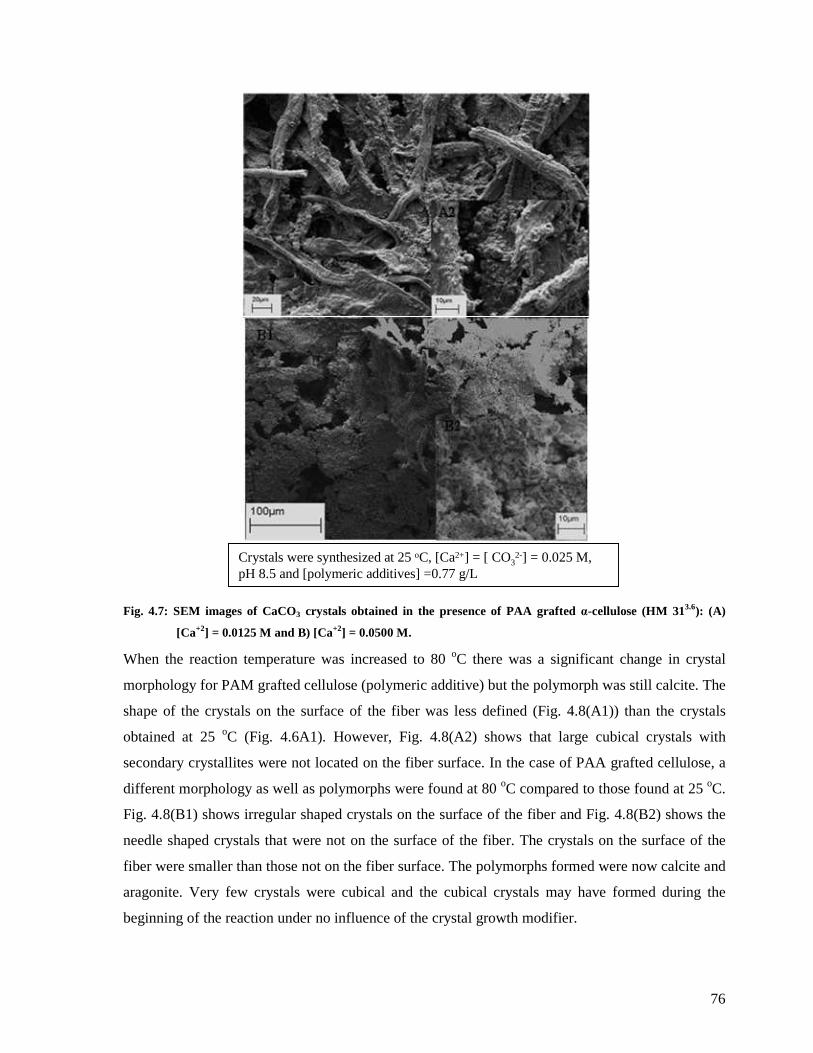
76
Fig. 4.7: SEM images of CaCO3 crystals obtained in the presence of PAA grafted α-cellulose (HM 313.6): (A)
[Ca+2] = 0.0125 M and B) [Ca+2] = 0.0500 M.
When the reaction temperature was increased to 80 oC there was a significant change in crystal
morphology for PAM grafted cellulose (polymeric additive) but the polymorph was still calcite. The
shape of the crystals on the surface of the fiber was less defined (Fig. 4.8(A1)) than the crystals
obtained at 25 oC (Fig. 4.6A1). However, Fig. 4.8(A2) shows that large cubical crystals with
secondary crystallites were not located on the fiber surface. In the case of PAA grafted cellulose, a
different morphology as well as polymorphs were found at 80 oC compared to those found at 25 oC.
Fig. 4.8(B1) shows irregular shaped crystals on the surface of the fiber and Fig. 4.8(B2) shows the
needle shaped crystals that were not on the surface of the fiber. The crystals on the surface of the
fiber were smaller than those not on the fiber surface. The polymorphs formed were now calcite and
aragonite. Very few crystals were cubical and the cubical crystals may have formed during the
beginning of the reaction under no influence of the crystal growth modifier.
Crystals were synthesized at 25 oC, [Ca2+] = [ CO32-] = 0.025 M,
pH 8.5 and [polymeric additives] =0.77 g/LCrystals were synthesized at 25 oC, [Ca2+] = [ CO3
2-] = 0.025 M, pH 8.5 and [polymeric additives] =0.77 g/L
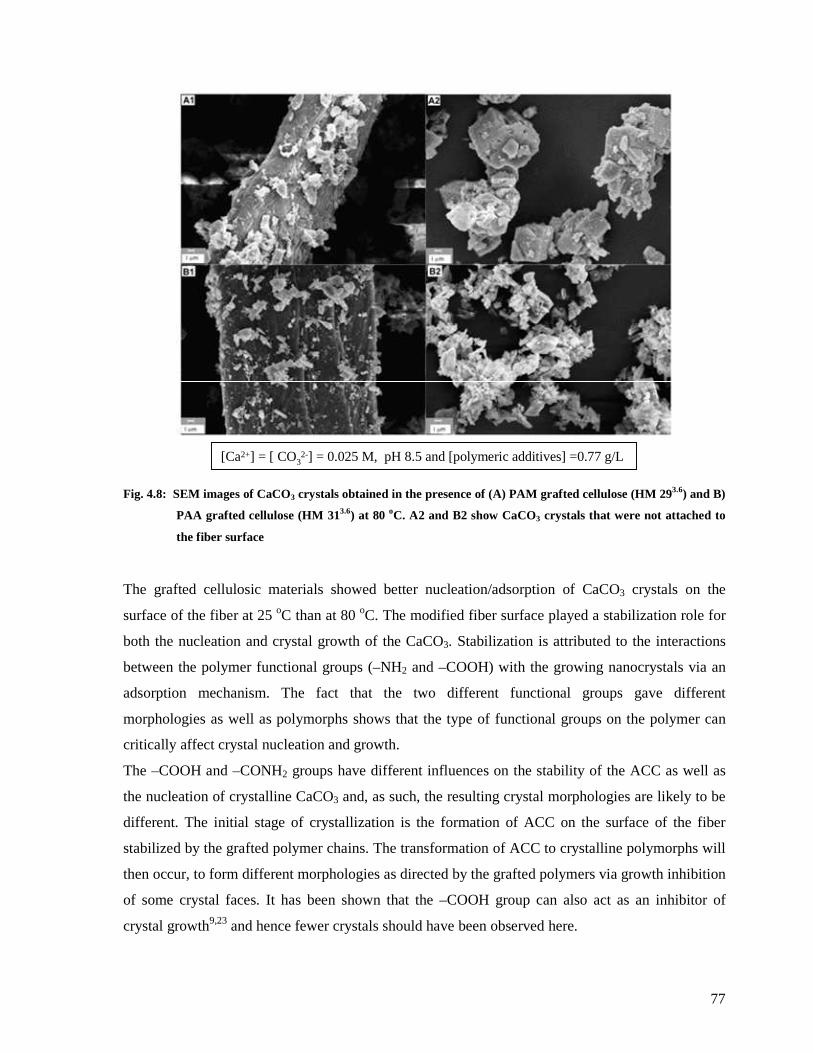
77
Fig. 4.8: SEM images of CaCO3 crystals obtained in the presence of (A) PAM grafted cellulose (HM 293.6) and B)
PAA grafted cellulose (HM 313.6) at 80 oC. A2 and B2 show CaCO3 crystals that were not attached to
the fiber surface
The grafted cellulosic materials showed better nucleation/adsorption of CaCO3 crystals on the
surface of the fiber at 25 oC than at 80 oC. The modified fiber surface played a stabilization role for
both the nucleation and crystal growth of the CaCO3. Stabilization is attributed to the interactions
between the polymer functional groups (–NH2 and –COOH) with the growing nanocrystals via an
adsorption mechanism. The fact that the two different functional groups gave different
morphologies as well as polymorphs shows that the type of functional groups on the polymer can
critically affect crystal nucleation and growth.
The –COOH and –CONH2 groups have different influences on the stability of the ACC as well as
the nucleation of crystalline CaCO3 and, as such, the resulting crystal morphologies are likely to be
different. The initial stage of crystallization is the formation of ACC on the surface of the fiber
stabilized by the grafted polymer chains. The transformation of ACC to crystalline polymorphs will
then occur, to form different morphologies as directed by the grafted polymers via growth inhibition
of some crystal faces. It has been shown that the –COOH group can also act as an inhibitor of
crystal growth9,23 and hence fewer crystals should have been observed here.
[Ca2+] = [ CO32-] = 0.025 M, pH 8.5 and [polymeric additives] =0.77 g/L[Ca2+] = [ CO32-] = 0.025 M, pH 8.5 and [polymeric additives] =0.77 g/L
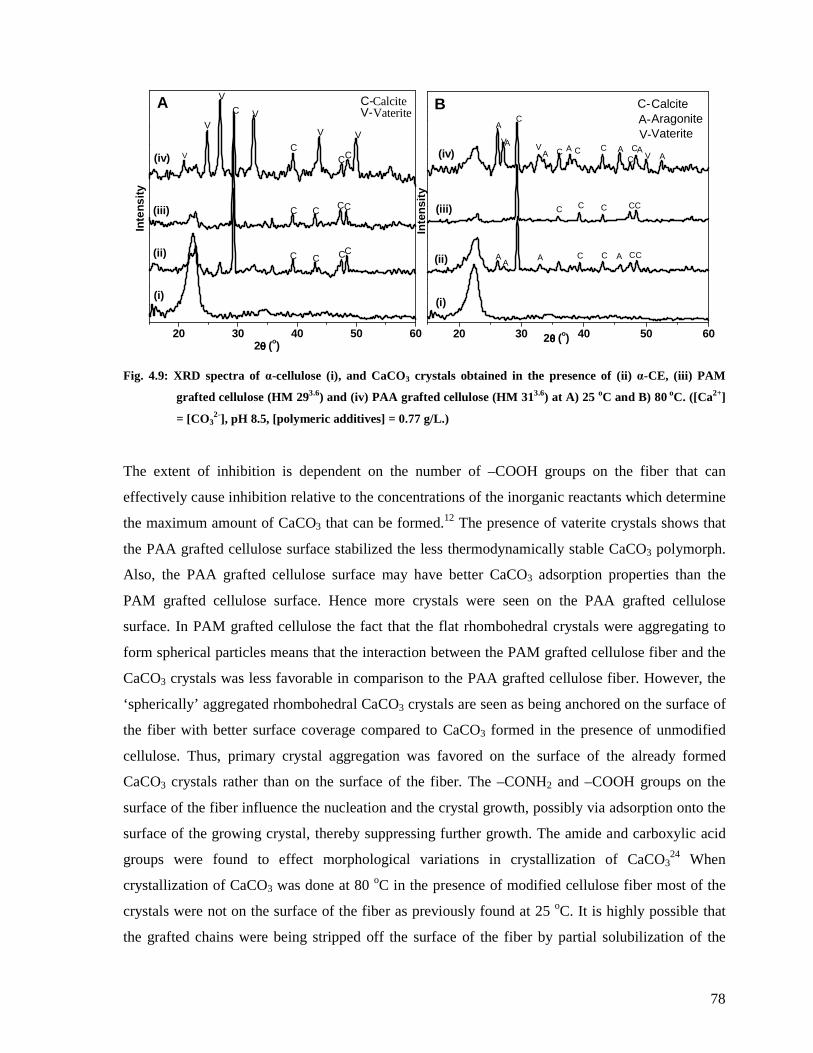
78
20 30 40 50 60
(iv)
(iii)
(ii)
(i)
V-C-
CCC
C C CC
CCC
C
VV
V
V
V
C
V
Inte
nsi
ty
2θθθθ (o)
CalciteVaterite
A
20 30 40 50 60
(i)
(ii)
(iii)
B
C
C
C AV
V AAV
A
AA
A
A
A
A
C
C
C
C
C
C
C
C
C
C
C
C
2θθθθ (o)
Inte
nsi
ty
(iv)
CalciteAragoniteVaterite
A
C-A-V-
Fig. 4.9: XRD spectra of α-cellulose (i), and CaCO3 crystals obtained in the presence of (ii) α-CE, (iii) PAM
grafted cellulose (HM 293.6) and (iv) PAA grafted cellulose (HM 313.6) at A) 25 oC and B) 80 oC. ([Ca2+]
= [CO32-], pH 8.5, [polymeric additives] = 0.77 g/L.)
The extent of inhibition is dependent on the number of –COOH groups on the fiber that can
effectively cause inhibition relative to the concentrations of the inorganic reactants which determine
the maximum amount of CaCO3 that can be formed.12 The presence of vaterite crystals shows that
the PAA grafted cellulose surface stabilized the less thermodynamically stable CaCO3 polymorph.
Also, the PAA grafted cellulose surface may have better CaCO3 adsorption properties than the
PAM grafted cellulose surface. Hence more crystals were seen on the PAA grafted cellulose
surface. In PAM grafted cellulose the fact that the flat rhombohedral crystals were aggregating to
form spherical particles means that the interaction between the PAM grafted cellulose fiber and the
CaCO3 crystals was less favorable in comparison to the PAA grafted cellulose fiber. However, the
‘spherically’ aggregated rhombohedral CaCO3 crystals are seen as being anchored on the surface of
the fiber with better surface coverage compared to CaCO3 formed in the presence of unmodified
cellulose. Thus, primary crystal aggregation was favored on the surface of the already formed
CaCO3 crystals rather than on the surface of the fiber. The –CONH2 and –COOH groups on the
surface of the fiber influence the nucleation and the crystal growth, possibly via adsorption onto the
surface of the growing crystal, thereby suppressing further growth. The amide and carboxylic acid
groups were found to effect morphological variations in crystallization of CaCO324 When
crystallization of CaCO3 was done at 80 oC in the presence of modified cellulose fiber most of the
crystals were not on the surface of the fiber as previously found at 25 oC. It is highly possible that
the grafted chains were being stripped off the surface of the fiber by partial solubilization of the
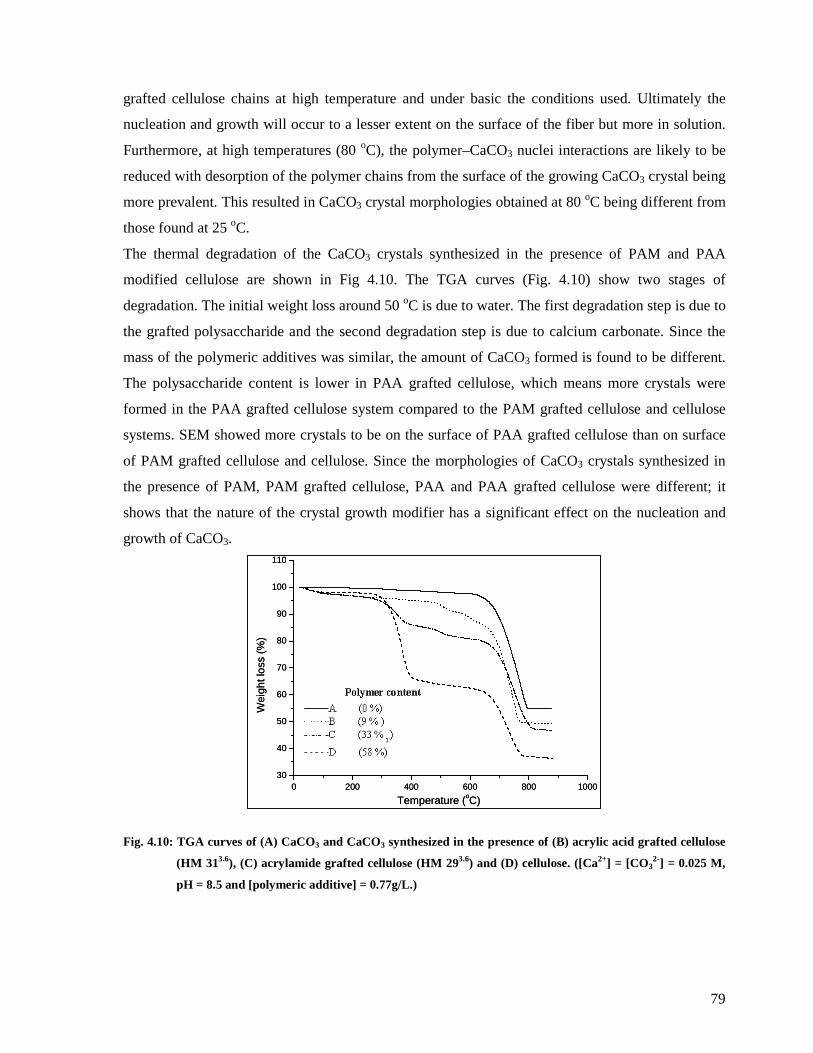
79
grafted cellulose chains at high temperature and under basic the conditions used. Ultimately the
nucleation and growth will occur to a lesser extent on the surface of the fiber but more in solution.
Furthermore, at high temperatures (80 oC), the polymer–CaCO3 nuclei interactions are likely to be
reduced with desorption of the polymer chains from the surface of the growing CaCO3 crystal being
more prevalent. This resulted in CaCO3 crystal morphologies obtained at 80 oC being different from
those found at 25 oC.
The thermal degradation of the CaCO3 crystals synthesized in the presence of PAM and PAA
modified cellulose are shown in Fig 4.10. The TGA curves (Fig. 4.10) show two stages of
degradation. The initial weight loss around 50 oC is due to water. The first degradation step is due to
the grafted polysaccharide and the second degradation step is due to calcium carbonate. Since the
mass of the polymeric additives was similar, the amount of CaCO3 formed is found to be different.
The polysaccharide content is lower in PAA grafted cellulose, which means more crystals were
formed in the PAA grafted cellulose system compared to the PAM grafted cellulose and cellulose
systems. SEM showed more crystals to be on the surface of PAA grafted cellulose than on surface
of PAM grafted cellulose and cellulose. Since the morphologies of CaCO3 crystals synthesized in
the presence of PAM, PAM grafted cellulose, PAA and PAA grafted cellulose were different; it
shows that the nature of the crystal growth modifier has a significant effect on the nucleation and
growth of CaCO3.
Fig. 4.10: TGA curves of (A) CaCO3 and CaCO3 synthesized in the presence of (B) acrylic acid grafted cellulose
(HM 313.6), (C) acrylamide grafted cellulose (HM 293.6) and (D) cellulose. ([Ca2+] = [CO32-] = 0.025 M,
pH = 8.5 and [polymeric additive] = 0.77g/L.)
0 200 400 600 800 100030
40
50
60
70
80
90
100
110
Wei
ght l
oss
(%)
Temperature (oC)
ABCD
0 200 400 600 800 100030
40
50
60
70
80
90
100
110
Wei
ght l
oss
(%)
Temperature (oC)
ABCD
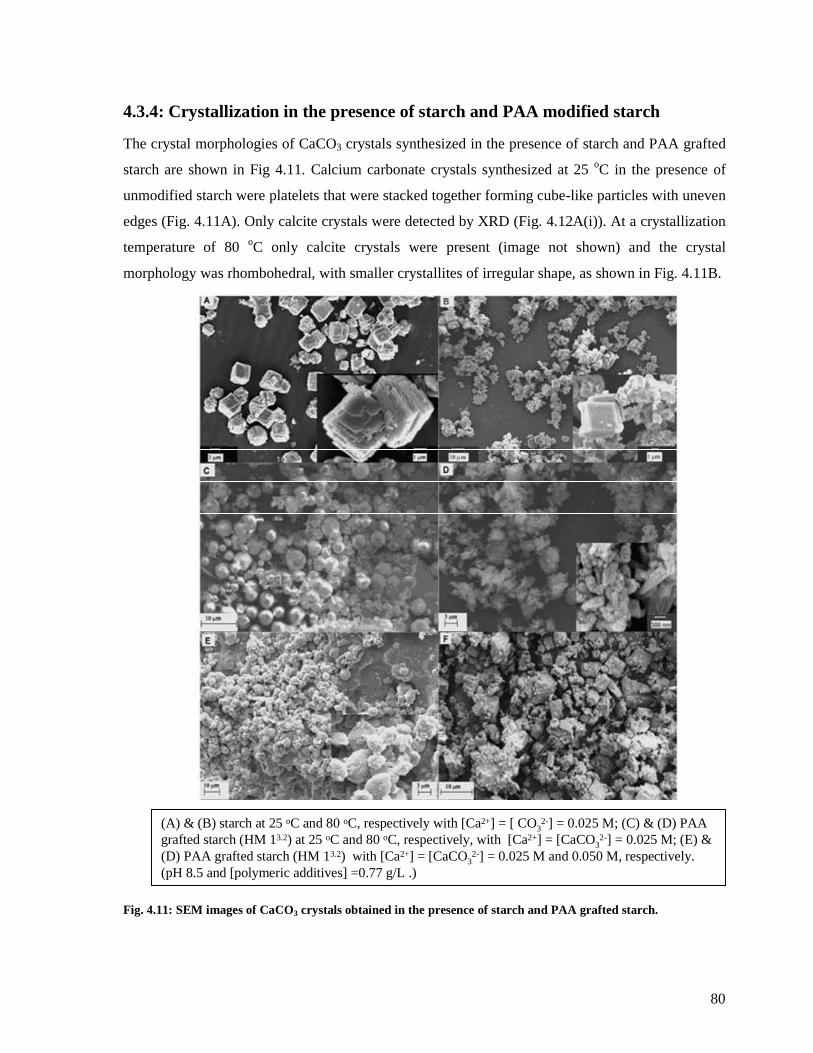
80
4.3.4: Crystallization in the presence of starch and PAA modified starch
The crystal morphologies of CaCO3 crystals synthesized in the presence of starch and PAA grafted
starch are shown in Fig 4.11. Calcium carbonate crystals synthesized at 25 oC in the presence of
unmodified starch were platelets that were stacked together forming cube-like particles with uneven
edges (Fig. 4.11A). Only calcite crystals were detected by XRD (Fig. 4.12A(i)). At a crystallization
temperature of 80 oC only calcite crystals were present (image not shown) and the crystal
morphology was rhombohedral, with smaller crystallites of irregular shape, as shown in Fig. 4.11B.
Fig. 4.11: SEM images of CaCO3 crystals obtained in the presence of starch and PAA grafted starch.
(A) & (B) starch at 25 oC and 80 oC, respectively with [Ca2+] = [ CO32-] = 0.025 M; (C) & (D) PAA
grafted starch (HM 13.2) at 25 oC and 80 oC, respectively, with [Ca2+] = [CaCO32-] = 0.025 M; (E) &
(D) PAA grafted starch (HM 13.2) with [Ca2+] = [CaCO32-] = 0.025 M and 0.050 M, respectively.
(pH 8.5 and [polymeric additives] =0.77 g/L .)
81
However, CaCO3 crystals synthesized in the presence of the PAA grafted starch under the same
conditions were spherical in shape (Fig. 4.11C) and calcite with traces of vaterite crystals were
obtained, as shown in Fig. 4.12A(ii). It should be mentioned that the mechanism of nucleation and
crystal growth in PAA and PAA grafted polysaccharides was likely to be the same since spherical
morphologies were observed in all three systems at 25 oC and [Ca2+] 0.025 M. Thus the morphology
observed was attributed to the effect of the PAA polymer chains on stabilization, nucleation and
crystal growth of CaCO3.
When the temperature of the reaction was increased to 80 oC needle-shaped crystals were obtained
and the polymorphs present were calcite and aragonite (Fig. 4.12A(iii)). The evolutions of CaCO3
polymorphs as well as the crystal morphologies in PAA grafted starch were similar to that of PAA
grafted cellulose at both 25 oC and 80 oC. Generally, crystal morphologies obtained at 80 oC in the
absence or presence of a polymeric additives/crystal growth modifiers were less defined and
secondary crystallites were a common characteristic. It is possible that the irregularity in crystal
shapes may be due to dissolution of the preformed crystals, which then re-crystallized as secondary
crystallites. However, for PAA grafted polysaccharides, the crystal morphologies were mainly
needle-shaped or flake-like and of irregular shapes, and these crystals are likely to have been
formed from the beginning of the reactions rather than through a dissolution and re-crystallization
process.
The effect of the Ca2+ concentration (1:1 molar ratio with CO32-) was also studied for PAA grafted
starch. It was found that spherical crystals were obtained when the [Ca2+] was 0.0125M (Fig.
4.11E), and for [Ca2+] 0.05 M the crystal morphology was a mixture of rhombohedral, irregular
crystals and very small crystallites, as shown in Fig. 4.11F. The average sizes of CaCO3 crystals
were o from the SEM images. The average particle size obtained for [Ca2+] 0.0125 M was estimated
to be 2.9 µm and for [Ca2+] 0.025M 3.5 µm. Low [Ca2+] means that the polymeric additive
concentration is high enough to control crystal growth through adsorption, hence smaller particles
emerged. As the [Ca2+] was increased to 0.05 M the majority of the crystals grew independent of
the polymeric additive and the small crystallites observed could be due to termination of crystal
growth by the polymeric additive. The XRD spectra of crystals (Fig. 4.12B(i) and (ii)) show that
vaterite crystals coexisted with calcite crystals and, from the intensity ratios, more vaterite crystals
were formed at [Ca2+] 0.0125 M than at [Ca2+] 0.025 M. When the [Ca2+] was increased to 0.05 M
no vaterite peaks were detected in the XRD spectrum (Fig. 4.13B(iii)). The existence of vaterite
crystals is due to the stabilization effect of the polymeric additives and, as the concentration of the
[Ca2+] increases, the presence of the polymeric additive becomes insufficient or inefficient to
stabilize less thermodynamically stable polymorphs. Although the small crystallites may contain
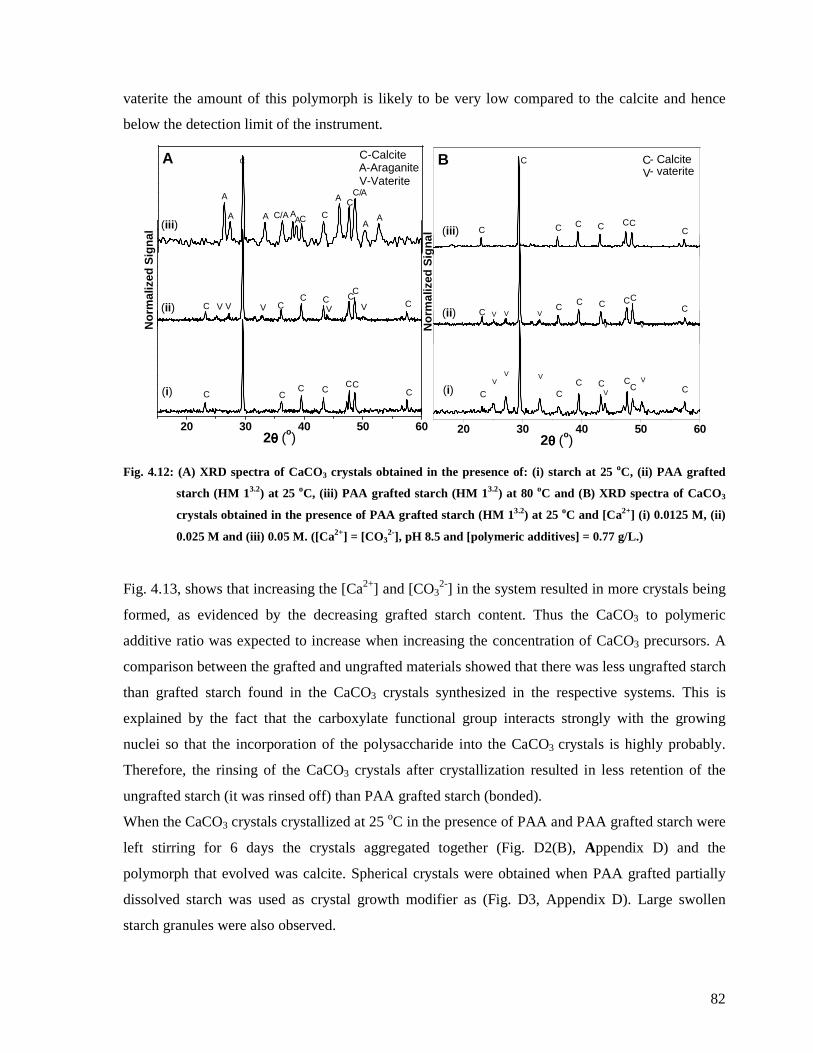
82
vaterite the amount of this polymorph is likely to be very low compared to the calcite and hence
below the detection limit of the instrument.
20 30 40 50 60
C
C(i)
C(ii)
C
CC
C/
C
C
C C
(iii)
V-Vaterite
C-CalciteA-Araganite
A
A
A
AA AAA
A
V VVVV
A
CCCC
CC
C
C/
C
A
20 30 40 50 60
V V
V V
VC
CCC
C
CC(i)
(ii)
No
rmal
ized
Sig
nal
2θθθθ (o)
CC
CC C
C
No
rmal
ized
Sig
nal
2θθθθ (o)
B CV
VV
V
VV
CC
C
C
C
CCC C
- Calcite- vaterite
(iii)
Fig. 4.12: (A) XRD spectra of CaCO3 crystals obtained in the presence of: (i) starch at 25 oC, (ii) PAA grafted
starch (HM 13.2) at 25 oC, (iii) PAA grafted starch (HM 13.2) at 80 oC and (B) XRD spectra of CaCO3
crystals obtained in the presence of PAA grafted starch (HM 13.2) at 25 oC and [Ca2+] (i) 0.0125 M, (ii)
0.025 M and (iii) 0.05 M. ([Ca2+] = [CO32-], pH 8.5 and [polymeric additives] = 0.77 g/L.)
Fig. 4.13, shows that increasing the [Ca2+] and [CO32-] in the system resulted in more crystals being
formed, as evidenced by the decreasing grafted starch content. Thus the CaCO3 to polymeric
additive ratio was expected to increase when increasing the concentration of CaCO3 precursors. A
comparison between the grafted and ungrafted materials showed that there was less ungrafted starch
than grafted starch found in the CaCO3 crystals synthesized in the respective systems. This is
explained by the fact that the carboxylate functional group interacts strongly with the growing
nuclei so that the incorporation of the polysaccharide into the CaCO3 crystals is highly probably.
Therefore, the rinsing of the CaCO3 crystals after crystallization resulted in less retention of the
ungrafted starch (it was rinsed off) than PAA grafted starch (bonded).
When the CaCO3 crystals crystallized at 25 oC in the presence of PAA and PAA grafted starch were
left stirring for 6 days the crystals aggregated together (Fig. D2(B), Appendix D) and the
polymorph that evolved was calcite. Spherical crystals were obtained when PAA grafted partially
dissolved starch was used as crystal growth modifier as (Fig. D3, Appendix D). Large swollen
starch granules were also observed.

83
200 400 600 80050
60
70
80
90
100
200 400 600 80085
90
95
100
105
Wei
ght L
oss
(%)
Temperature (oC)
A B C D
Fig. 4.13: TGA curves of CaCO3 synthesized in the presence of starch. (A) [Ca2+] = 0.025 M and PAA grafted
starch (HM 13.2); (B) [Ca2+] = 0.0500 M; (C) [Ca2+] = 0.0250 M and (D) [Ca2+] = 0.0125 M at 25 oC. The
polymer content in composites B, C, D was 11, 8 and 6% respectively. ([Ca2+] = [CO32-], pH = 8.5 and
[polymeric additive] = 0.77 g/L.)
4.4: Implications of results of this study in the paper industry
In situ CaCO3 crystallization in the presence of modified fiber during paper production could lead
to improved filler retention. The crystallized CaCO3 was found to be nucleated on the surface of the
fiber and, thus, filler loss during drainage can be reduced. Also the fiber-filler bond could be
improved; however, the fiber-fiber bonding strength is likely to be reduced if the surface of the fiber
is completely covered by the filler. Hence there is need to balance all the factors that affect paper
strength. From Fig. 4.10 it can be approximated that the filler content in PAM and PAA grafted
cellulose was 66 and 78%, respectively. Paper currently has 20% filler hence there is room to
reduce fiber surface coverage in these experiments. Reduction in surface coverage can be achieved
by reducing the nucleation points (i.e. % G or the concentration of modified fiber), which would
also pave the way for more fiber-fiber bonding. Thus the challenge will be to optimize the filler
content in order to promote the fiber-fiber bonding whilst more filler is incorporated into the paper.
This may introduce another novel way of adding filler to paper, which involves performing in situ
CaCO3 crystallization in the presence of modified fiber. There are two alternatives for in situ
CaCO3 crystallization, it can be done in the presence of i) a blend of modified fiber and unmodified
fiber or ii) modified fiber that can later be blended with the rest of the pulp fiber to give the
appropriate filler loading in paper.
84
The use of soluble modified polysaccharides such as starch in CaCO3 crystallization could be
another way of improving filler retention. The size of CaCO3 filler can be optimized to give the best
retention and the filler surface can be modified to promote filler retention. The crystallized CaCO3
surface studies and the possible influence in filler retention are discussed in Chapter 5.
4.5: Conclusions
The crystal morphology and polymorph selectivity can be controlled by using different polymeric
additives, the temperature and concentration of reactants. PAA and PAM grafted cellulose gave
different types of morphologies but the dominant polymorph was the most thermodynamically
stable, namely calcite, whereas PAA and PAM grafted polysaccharides gave similar polymorphs,
namely calcite and traces of vaterite, at 25 oC. However, for crystallization reactions done at 80 oC
calcite and aragonite were the dominant polymorphs obtained in PAA grafted polysaccharides
reactions, whereas calcite and vaterite were still the polymorphs present when PAA was used. The
fact that there were more crystals on the surface of the modified fiber in crystallization reactions
done at 25 oC means that the grafted polymer effectively played a role in both nucleation and
stabilization of the crystal nuclei. Crystallization of CaCO3 in the presence of modified fibers can be
applied in the paper industry in order to improve fiber-filler bonding, which may allow more filler
to be incorporated in paper. However, the fiber surface coverage should be optimized to allow fiber-
fiber bonding required for maintaining the strength of paper.
4.6: References
(1) Guo, J., Stevertson S. J. Industrial and Engineering Chemistry Research 2003, 42, 3480-
3486.
(2) Wang, T., Antonietti M., Zhao X., Colfen H. Chemistry - A European Journal 2006, 12,
5722-5730.
(3) Manoli, F., Koutsopoulos S., Dalas E. Journal of Crystal Growth 1997, 182, 116-124.
(4) Pai, R. K., Hild S., Ziegler A., Marti O. Langmuir 2004, 3123-3128.
(5) Ulcinas, A., Butler M. F., Heppenstal-Butler M., Singleton S., Miles M. J. Journal of
Crystal Growth 2007, 307, 378-385.
(6) Han, T. Y., Aizenberg J. Chemistry of Materials 2008, 20, 1064-1068.
(7) Gorna, K., Munoz-Espi R., Grohn F., Wegner G. Macromolecular Bioscience 2007, 7, 163-
173.
85
(8) Kulak, A. N., Iddon P., Li Y., Armes S. P., Colfen H., Paris O., Wilson R. M. Meldrum F.
C. Journal of the American Chemical Society 2007, 129, 3729-3736.
(9) Colfen, H., Qi L. Chemistry - A European Journal 2001, 7, 106-116.
(10) Kim, I. W., Robertson R. E., Zand R. Crystal Growth and Design 2005, 5, 513-522.
(11) Yu, Q., Ou H-D., Song R-Q., Xu A-W. Journal of Crystal Growth 2006, 286, 178-183.
(12) Naka, K., Huang S-C ., Chuyo Y. Langmuir 2006, 22, 7760-7767.
(13) Wei, H., Shen Q., Zhao Y., Zhou Y., Wang D., Xu D. Journal of Crystal Growth 2005, 279,
439-446.
(14) Cheng, B., Lei M., Yu J., Zhao X. Material Letters 2004, 58, 1565-1570.
(15) Yu, H., Lei M., Cheng B., Zhao X. Journal of Solid State Chemistry 2004, 177, 681-689.
(16) Meng, Q., Chen D., Yue L., Fang J., Zhao H., Wang L. Macromolecular Chemistry and
Physics 2007, 208, 474-484.
(17) Dickinson, S. R., Henderson G. E., McGrath K. M. Journal of Crystal Growth 2002, 244,
369-378.
(18) Qiao, L., Feng Q-L., Li Z. Crystal Growth and Design 2007, 7, 275-279.
(19) Pan, Y., Zhao X., Sheng Y., Wang C., Deng Y., Ma X., Liu X., Wang Z. Colloids and
Surfaces, A: Physicochemical Engineering Aspects 2007, 297, 198-202.
(20) Chakraborty, D., Agarwal V. K., Bhatia S. K., Bellare J. Industrial and Engineering
Chemistry Research 1994, 33, 2187-2197.
(21) Liu, D., Yates M. Z. Langmuir 2006, 22, 5566-5569.
(22) Wang, C., Zhao J., Zhao X., Bala H., Wang Z. Powder Technology 2006, 163, 134-138.
(23) Wada, N., Kanamura K., Umegaki T. Journal of Colloid and Interface Science 2001, 233,
65-72.
(24) Tamura, K., Tsuge H. Chemical Engineering Science 2006, 61, 5818-5826.
86
Chapter 5: Determination of surface properties and statistical evaluation
of crystallized CaCO3
87
5.1: Introduction
In the crystallization experiments, described in Chapter 4, it was shown that the nature of the crystal
growth modifier and temperature affect the morphology of crystallized CaCO3. The surface
properties of filler materials are also critical to matrix-filler bonding (e.g. fiber-filler bonding in
filled paper).1 The presence of polysaccharide polymer chains on the surface of the filler results in
improved hydrogen bonding between the fiber and filler. This could result in improved fiber-filler
bonding strength as well as filler retention. The filler surface charge is equally important to both
filler retention as well as colloidal stability. According to thermodynamics, colloidal dispersions are
inherently unstable and tend to coalesce in order to reduce their free energy.2 The PCC used in
papermaking is normally stabilized by dispersion agents such as the alkali metal and ammonium
salts of polyacrylic acid.3 Polysalt solutions of sodium polyacrylate of molecular weight in the
range of 400000–500000 g/mol are also used to stabilize PCC for papermaking.2 The additions of
positive or negatively charged dispersing agents result in charge accumulation on the surface of the
colloidal particles.4 An electric double layer at the solid/liquid interface of particles is formed,
which result in repulsive forces between particles (electrostatic forces) thereby inducing colloidal
stability.5 Thus, the crystal morphology, size and surface properties of CaCO3 filler are important
for the fiber-filler bonding as well as for filler retention.
5.1.1: Fluorescence
Fluorescence is a process that is distinct from emission of light due to high temperatures. When
light is directed on a molecule that absorbs rather than transmits, one or more of the electrons of the
molecule jumps to a higher energy level. These excited electronic states are unstable and eventually
the electrons lose their excess energy and return to the lower energy states. This will result in the
emission of a photon with a longer wavelength than the initially absorbed photon. The excess
energy can then be dissipated as light (fluorescence) or by simply increasing atomic vibrations
within the molecule. Thus, modification or labeling of materials with fluorescence molecules may
help to determine mechanisms of reactions or processes.6 The advantage of fluorescence
measurements is that they can be carried out at very low concentrations or degrees of substitution of
tagged materials.7 In this part of the study, fluorescence was used to see whether the modified starch
moieties were on the surface of crystallized CaCO3. The CaCO3 crystals when exposed to
ultraviolet (UV) light should fluoresce if the fluorescence tagged modified starch molecules are on
the surface of the CaCO3 crystals.

88
5.1.2: Zeta potential
Zeta potential is defined as the electrical potential that exists at the shear plane of a particle that is a
small distance from the surface. The ionic characteristics and dipolar attributes of colloidal
particles, suspended in solution, result in particles that are electrically charged.
Fig. 5.1: Schematic representation of: A) electric double layer B) variation of the potential with distance from the
electric double layer.
Once a particle carries a net charge on its surface the distribution of ions in the interfacial region is
such that an increased concentration of counter ions (ions of charge opposite to that of the particles)
is close to the surface.8,9 Thus, an individual dispersed particle is surrounded by oppositely charged
ions, called a Stern layer (Fig. 5.1A). Outside the fixed layer there are varying compositions of ions
of opposite polarities. Thus, an electrical double layer is formed in the region of the particle-liquid
interface.9 This double layer may be considered to consist of two parts: an inner region, which
includes ions bound relatively strongly to the surface, and an outer or diffuse region, in which the
ion distribution is determined by a balance of electrostatic forces and random thermal motion. The
potential in this region, therefore, decreases with the distance from the surface, until at a certain
distance it becomes zero (Fig. 5.1B). Zeta potential can be calculated using the following Henry
equation:10,11
( )kaεf
6ππµζ E= 5.1
Where Eµ is the electrophoretic mobility, ζ is the zeta potential, ε is the dielectric constant of the
medium, η is the viscosity of the medium and f(ka) is the correction factor that takes in to account
the thickness of the double layer and particle diameter.
89
The potential at the above-mentioned shear plane between the particle with its ion atmosphere and
the surrounding medium is the zeta potential. Zeta potential is a function of the surface charge of a
particle, any adsorbed layer at the interface, and the nature and composition of the surrounding
medium in which the particle is suspended.
An investigation of the surface charge of crystallized CaCO3 was carried out. The polymeric
additives can be incorporated into the crystal or adsorbed on the surface of the crystals. The extent
of both incorporation and adsorption depends on the functional groups of the polymer. The use of a
charged crystal growth modifier can result in charged CaCO3 crystals. Highly surface active anionic
polymers interact more with the metal ions as well as the growing crystal than uncharged polymers,
hence there is a greater chance of the polymer of being firmly bound onto crystal. Similarly, surface
active polymers can be adsorbed onto the surface more readily than polymers whose surface activity
is low. The zeta potential measurements provide data on the overall charge on the CaCO3 crystals.
5.2: Experimental
Materials
Starch from potato (Acros) was used as received. Acrylic acid (Fluka) was purified by vacuum
distillation at 30 oC. Sodium acrylate (Fluka), fluorescein isothiocyanate (Fine Chemicals),
rhodamine B isothiocyanate (Fine Chemicals), cationic starch (Mondi Business Paper), dibutyltin
dilaurate (Sigma-Aldrich), dimethylsulfoxide (DMSO, Acros), CaCl2 (Associated Chemical
Enterprises) and Na2CO3 (Saarchem) were used as received.
5.2.1: Synthesis of fluorescein-tagged anionic and cationic starch
The anionic and cationic starches were tagged with a green dye and a red dye, respectively. The
anionic starch was used as crystal growth modifier and the cationic starch was deposited onto the
surface of the CaCO3 crystals.
5.2.3.1: Fluorescein-tagged anionic starch
Starch was modified using the functionalized fluorescein dye according to a procedure described in
the literature,7 followed by grafting of polyacrylic acid. In a typical reaction potato starch (3 g) was
dissolved in DMSO (40 mL) at room temperature, and a few drops of pyridine were added. Then
fluorescein isothiocyanate (0.15 g) was added to the solution followed by dibutyltin dilaurate (30
mg). The reaction was run for 2 h at 95 oC. The product was precipitated from ethanol several times
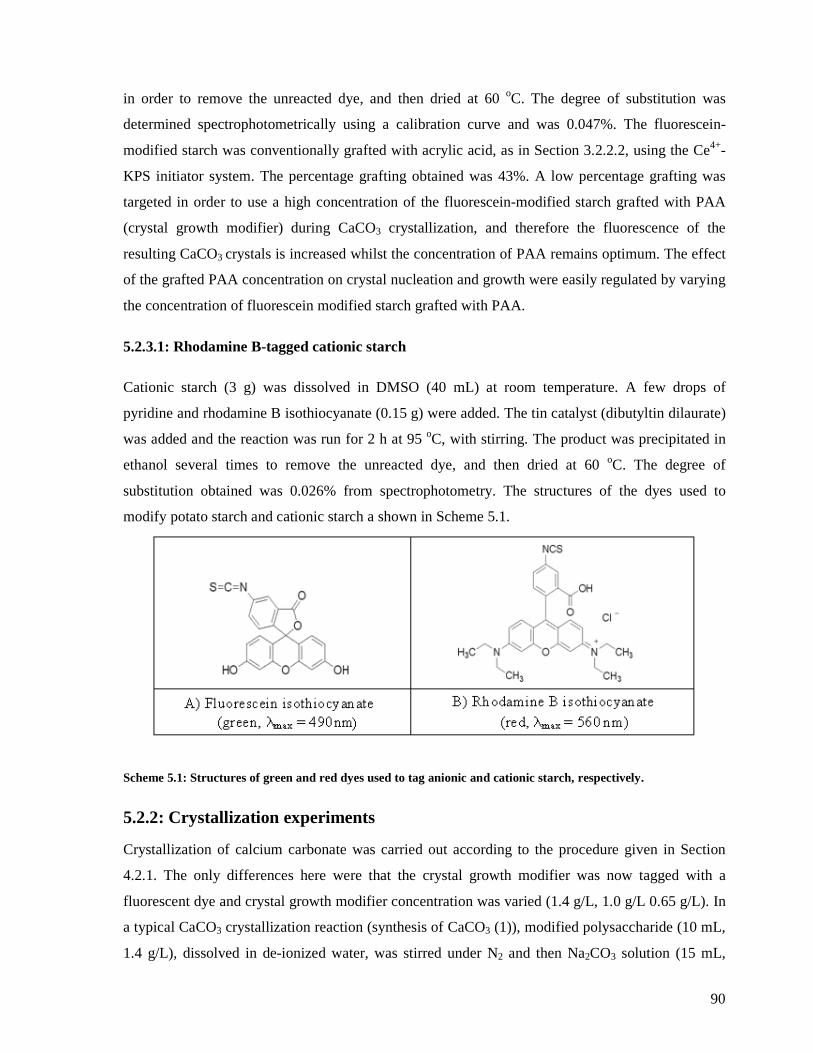
90
in order to remove the unreacted dye, and then dried at 60 oC. The degree of substitution was
determined spectrophotometrically using a calibration curve and was 0.047%. The fluorescein-
modified starch was conventionally grafted with acrylic acid, as in Section 3.2.2.2, using the Ce4+-
KPS initiator system. The percentage grafting obtained was 43%. A low percentage grafting was
targeted in order to use a high concentration of the fluorescein-modified starch grafted with PAA
(crystal growth modifier) during CaCO3 crystallization, and therefore the fluorescence of the
resulting CaCO3 crystals is increased whilst the concentration of PAA remains optimum. The effect
of the grafted PAA concentration on crystal nucleation and growth were easily regulated by varying
the concentration of fluorescein modified starch grafted with PAA.
5.2.3.1: Rhodamine B-tagged cationic starch
Cationic starch (3 g) was dissolved in DMSO (40 mL) at room temperature. A few drops of
pyridine and rhodamine B isothiocyanate (0.15 g) were added. The tin catalyst (dibutyltin dilaurate)
was added and the reaction was run for 2 h at 95 oC, with stirring. The product was precipitated in
ethanol several times to remove the unreacted dye, and then dried at 60 oC. The degree of
substitution obtained was 0.026% from spectrophotometry. The structures of the dyes used to
modify potato starch and cationic starch a shown in Scheme 5.1.
Scheme 5.1: Structures of green and red dyes used to tag anionic and cationic starch, respectively.
5.2.2: Crystallization experiments
Crystallization of calcium carbonate was carried out according to the procedure given in Section
4.2.1. The only differences here were that the crystal growth modifier was now tagged with a
fluorescent dye and crystal growth modifier concentration was varied (1.4 g/L, 1.0 g/L 0.65 g/L). In
a typical CaCO3 crystallization reaction (synthesis of CaCO3 (1)), modified polysaccharide (10 mL,
1.4 g/L), dissolved in de-ionized water, was stirred under N2 and then Na2CO3 solution (15 mL,
91
0.025 M) was added at 25 oC after which CaCl2 solution (15 mL, 0.025 M) was added slowly whilst
stirring. The reactions were carried out at 25 ± 2 oC for 24 h. The crystals in half of the reaction
mixture were filtered through a 0.22 micron membrane filter paper to collect the CaCO3
microcrystals, which were then rinsed and centrifuged three times using deionized water, and
resuspended in deionized water.
The crystallized calcium carbonate crystals (anionic) were coated with cationic starch tagged with a
red dye (rhodamine B). In a typical procedure, 10 mL of 1 % solution of rhodamine tagged cationic
starch was added to 0.3 g of anionic CaCO3 crystals. The mixture was then stirred for two hours
followed by a series of washing (3 xs) via the centrifugation process. The crystals were then dried
and characterized.
A similar procedure was used for the zeta potential measurements. A typical sample preparation
was as follows: Cationic starch (not fluorescence tagged) (1 mL, 1%) was added to a solution of
crystallized CaCO3 (10 mL, 0.1 g/L) and stirred for 15 min. This was followed by washing (3x) via
centrifugation process to remove unattached cationic starch. The particles were then resuspended in
distilled deionized water for zeta potential measurements. Thus the effect of the cationic starch on
the zeta potentials was determined by addition of more cationic starch for each subsequent
measurement.
5.3: Analysis
5.3.1: Fluorescence
Fluorescence images were acquired using an Olympus Cell^R system attached to an IX-81 inverted
fluorescence microscope equipped with a F-view-II cooled CCD camera (Soft Imaging Systems).
For the image frames, an Olympus Plan Apo N 60x/1.4 Oil objective and the Cell^R imaging
software were used for the image acquisition and analysis.
Fluorescence statistical data was acquired using a BD FACSAria flow cytometer. Samples were
suspended in distilled water and acquired with an event rate of 500–1000 events/second. In total, 50
000 events were acquired and analyzed using the BD FACSDiva software and Flowjo. Flow
cytometry is technique used for counting, examining, and sorting microscopic biological cells
suspended in a stream of fluid. The technique gives simultaneous multiparametric analysis of
physical and/or chemical characteristics of particles. The instrument is equipped with multiple light
scattering detectors and a fluorescence detector. The size and granularity of cells data is obtained
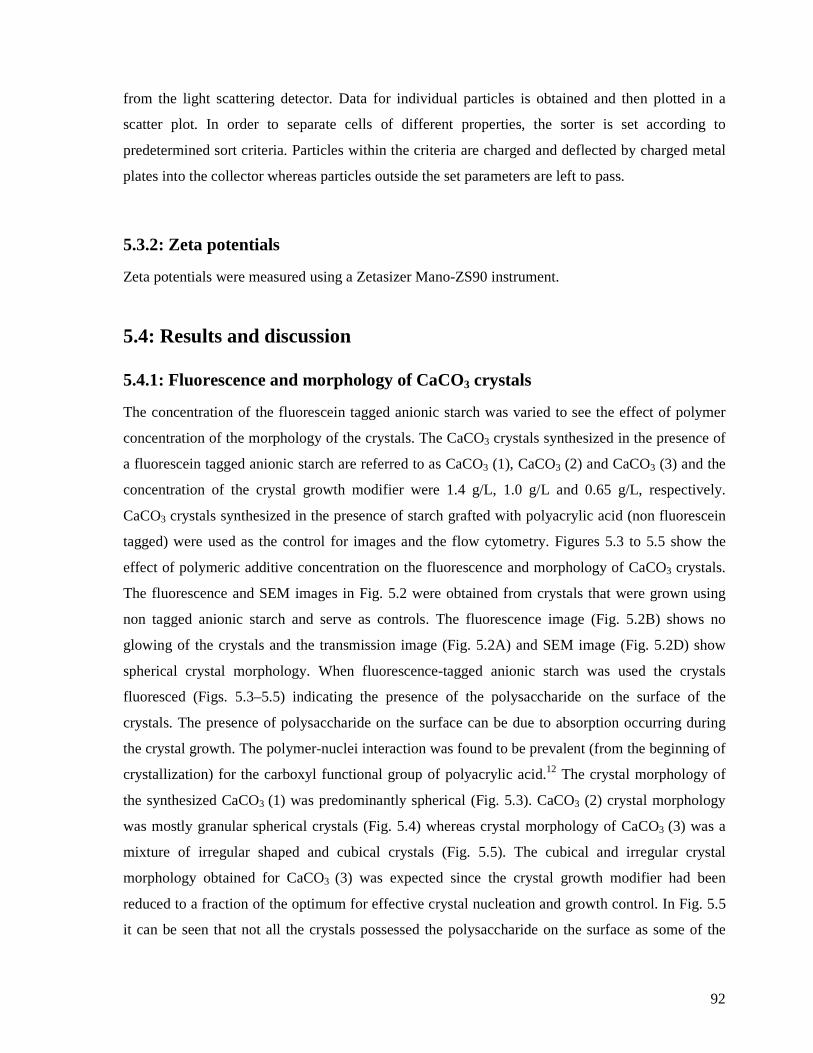
92
from the light scattering detector. Data for individual particles is obtained and then plotted in a
scatter plot. In order to separate cells of different properties, the sorter is set according to
predetermined sort criteria. Particles within the criteria are charged and deflected by charged metal
plates into the collector whereas particles outside the set parameters are left to pass.
5.3.2: Zeta potentials
Zeta potentials were measured using a Zetasizer Mano-ZS90 instrument.
5.4: Results and discussion
5.4.1: Fluorescence and morphology of CaCO3 crystals
The concentration of the fluorescein tagged anionic starch was varied to see the effect of polymer
concentration of the morphology of the crystals. The CaCO3 crystals synthesized in the presence of
a fluorescein tagged anionic starch are referred to as CaCO3 (1), CaCO3 (2) and CaCO3 (3) and the
concentration of the crystal growth modifier were 1.4 g/L, 1.0 g/L and 0.65 g/L, respectively.
CaCO3 crystals synthesized in the presence of starch grafted with polyacrylic acid (non fluorescein
tagged) were used as the control for images and the flow cytometry. Figures 5.3 to 5.5 show the
effect of polymeric additive concentration on the fluorescence and morphology of CaCO3 crystals.
The fluorescence and SEM images in Fig. 5.2 were obtained from crystals that were grown using
non tagged anionic starch and serve as controls. The fluorescence image (Fig. 5.2B) shows no
glowing of the crystals and the transmission image (Fig. 5.2A) and SEM image (Fig. 5.2D) show
spherical crystal morphology. When fluorescence-tagged anionic starch was used the crystals
fluoresced (Figs. 5.3–5.5) indicating the presence of the polysaccharide on the surface of the
crystals. The presence of polysaccharide on the surface can be due to absorption occurring during
the crystal growth. The polymer-nuclei interaction was found to be prevalent (from the beginning of
crystallization) for the carboxyl functional group of polyacrylic acid.12 The crystal morphology of
the synthesized CaCO3 (1) was predominantly spherical (Fig. 5.3). CaCO3 (2) crystal morphology
was mostly granular spherical crystals (Fig. 5.4) whereas crystal morphology of CaCO3 (3) was a
mixture of irregular shaped and cubical crystals (Fig. 5.5). The cubical and irregular crystal
morphology obtained for CaCO3 (3) was expected since the crystal growth modifier had been
reduced to a fraction of the optimum for effective crystal nucleation and growth control. In Fig. 5.5
it can be seen that not all the crystals possessed the polysaccharide on the surface as some of the
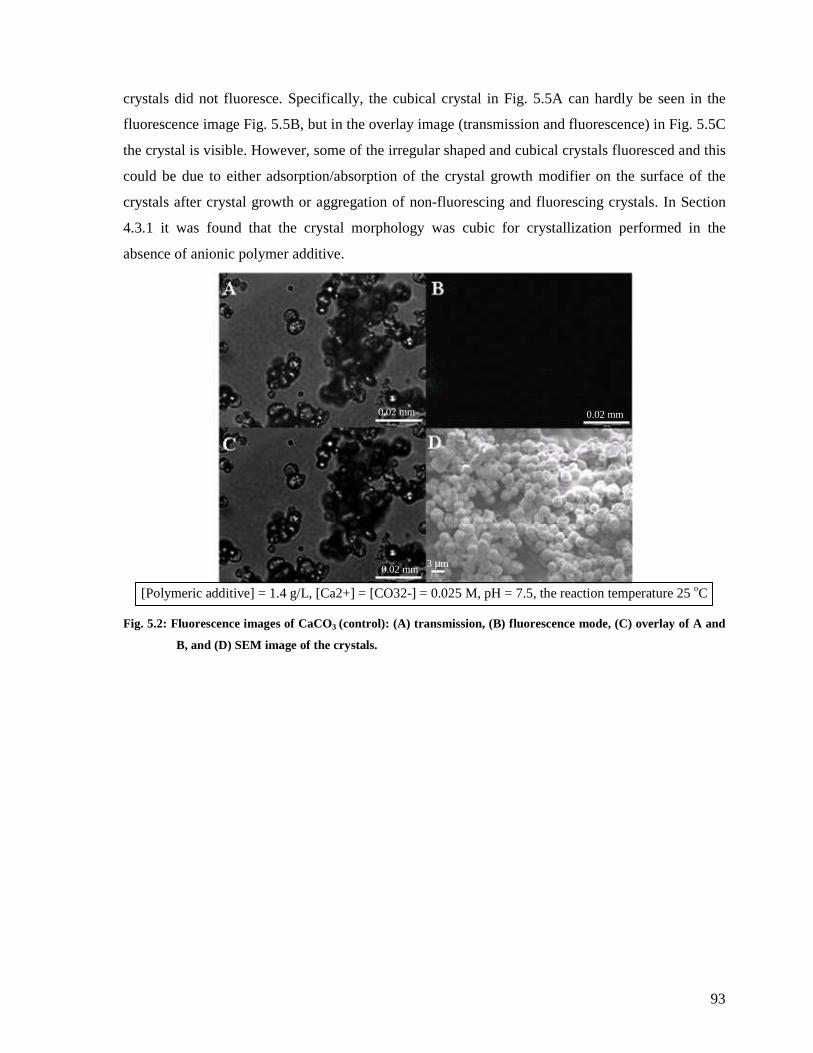
93
crystals did not fluoresce. Specifically, the cubical crystal in Fig. 5.5A can hardly be seen in the
fluorescence image Fig. 5.5B, but in the overlay image (transmission and fluorescence) in Fig. 5.5C
the crystal is visible. However, some of the irregular shaped and cubical crystals fluoresced and this
could be due to either adsorption/absorption of the crystal growth modifier on the surface of the
crystals after crystal growth or aggregation of non-fluorescing and fluorescing crystals. In Section
4.3.1 it was found that the crystal morphology was cubic for crystallization performed in the
absence of anionic polymer additive.
[Polymeric additive] = 1.4 g/L, [Ca2+] = [CO32-] = 0.025 M, pH = 7.5, the reaction temperature 25 oC
Fig. 5.2: Fluorescence images of CaCO3 (control): (A) transmission, (B) fluorescence mode, (C) overlay of A and
B, and (D) SEM image of the crystals.
0.02 mm
0.02 mm 0.02 mm
3 µm0.02 mm
0.02 mm 0.02 mm
3 µm

94
[Polymeric additive] = 1.4 g/L, [Ca2+] = [CO32-] = 0.025 M, pH = 7.5, the reaction temperature 25 oC
Fig. 5.3: Fluorescence images of CaCO3 (1): (A) transmission, (B) fluorescence mode, (C) overlay of A and B, and
(D) SEM image of the crystals.
[Polymeric additive] = 1.0 g/L, [Ca2+] = [CO32-] = 0.025 M, pH = 7.5, the reaction temperature 25 oC
Fig. 5.4: Fluorescence images of CaCO3 (2): (A) transmission, (B) fluorescence mode, (C) overlay of A and B, and
(D) SEM image of the crystals.
0.02 mm
0.02 mm 0.02 mm
3 µm0.02 mm
0.02 mm 0.02 mm
3 µm
0.02 mm
0.02 mm 0.02 mm
3 µm0.02 mm
0.02 mm 0.02 mm
3 µm

95
[Polymeric additive] = 0.65 g/L, [Ca2+] = [CO32-] = 0.025 M, pH = 7.5, the reaction temperature 25 oC
Fig. 5.5: Fluorescence images of CaCO3 (3): (A) transmission, (B) fluorescence mode, (C) overlay of A and B, and
(D) SEM image of the crystals.
The response of CaCO3 crystals to cationic starch addition is of paramount importance as not only
does it prove that the crystals carry the negative charge but it is important for further filler surface
modification. However, when the pulp, filler and other additives are mixed or blended together
during papermaking, the additive to be added just before papermaking is a solution of cationic
starch. The cationic starch flocculates the pulp and has little effect on the PCC since PCC is
partially positive (see Section 3.4.3.1). The use of negatively charged filler could improve its
dispersion during the blending with pulp. Furthermore, the addition of cationic starch during
papermaking will result in co-flocculation of both the anionic pulp and the anionic filler. The
coating of fluorescing (green) anionic CaCO3 crystals with fluorescing (red) cationic starch allowed
the visualization of the deposition of the cationic starch. By using different fluorescence
wavelengths both the green and red colors can be viewed separately. Figs 5.6, 5.7 and 5.8 show the
separate green and red colors are observed on the surface of the crystals. The overlay of the green
and red images (Fig. 5.6D) showed the red and green areas with some areas showing some
yellowing (red plus green gives a yellow color, but subject to the concentrations of the dyes). Fig.
5.7D shows mostly the yellow color and thus the concentrations of the two dyes were in the
proportion that was able to give the yellow color. In the case of CaCO3 (3), the yellow color was
more intense and red spots were observed, as shown in Fig. 5.8D. This also indicates that the
0.02 mm
0.02 mm 0.02 mm
3 µm0.02 mm
0.02 mm 0.02 mm
3 µm

96
amount of polysaccharides on the surface of the CaCO3 (1, 2 and 3) crystals were different since
different colors emerged when equal concentration of rhodamine B tagged cationic starch was used.
Fig. 5.6: Fluorescence images of CaCO3 (1) with rhodamine modified cationic starch deposited on the surface:
(A) transmission mode, (B) fluorescence mode (fluorescein), (C) fluorescence mode (rhodamine) and
(D) overlay of A, B and C.
Fig. 5.7: Fluorescence images of CaCO3 (2) with rhodamine modified cationic starch deposited on the surface:
(A) transmission mode, (B) fluorescence mode (fluorescein), (C) fluorescence mode (rhodamine), (D)
overlay of A, B and C.
0.02 mm
0.02 mm 0.02 mm
0.02 mm0.02 mm
0.02 mm 0.02 mm
0.02 mm
0.02 mm
0.02 mm 0.02 mm
0.02 mm0.02 mm
0.02 mm 0.02 mm
0.02 mm
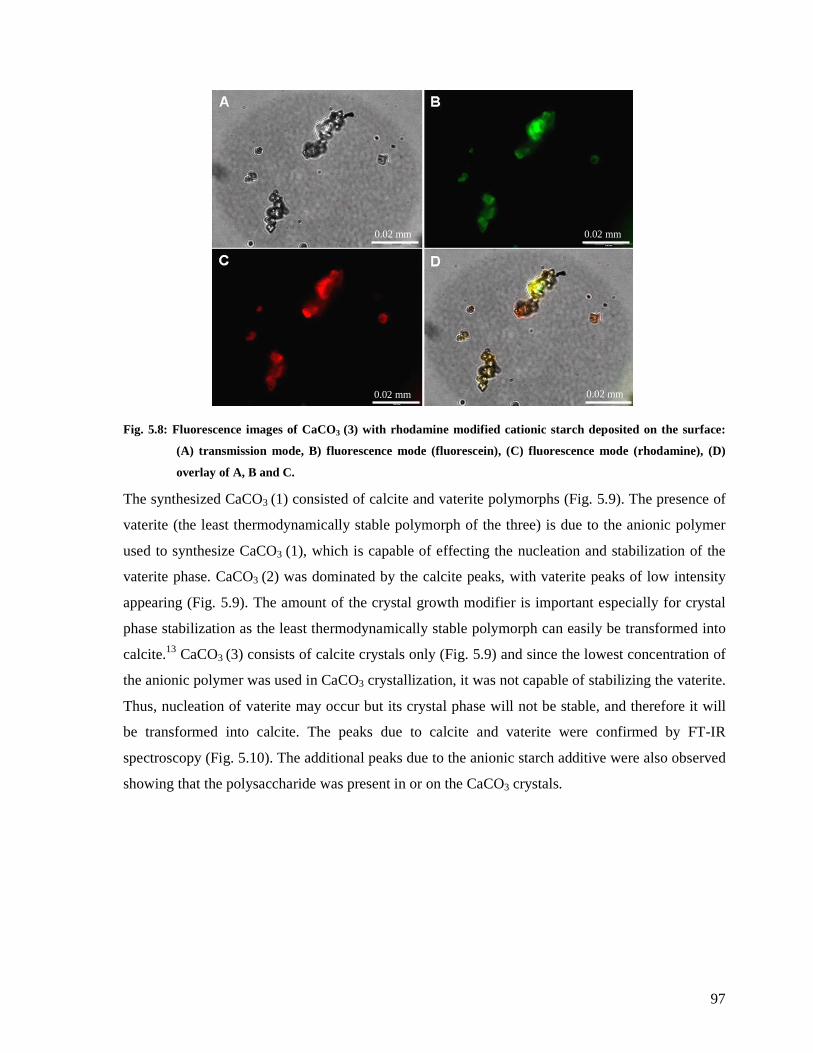
97
Fig. 5.8: Fluorescence images of CaCO3 (3) with rhodamine modified cationic starch deposited on the surface:
(A) transmission mode, B) fluorescence mode (fluorescein), (C) fluorescence mode (rhodamine), (D)
overlay of A, B and C.
The synthesized CaCO3 (1) consisted of calcite and vaterite polymorphs (Fig. 5.9). The presence of
vaterite (the least thermodynamically stable polymorph of the three) is due to the anionic polymer
used to synthesize CaCO3 (1), which is capable of effecting the nucleation and stabilization of the
vaterite phase. CaCO3 (2) was dominated by the calcite peaks, with vaterite peaks of low intensity
appearing (Fig. 5.9). The amount of the crystal growth modifier is important especially for crystal
phase stabilization as the least thermodynamically stable polymorph can easily be transformed into
calcite.13 CaCO3 (3) consists of calcite crystals only (Fig. 5.9) and since the lowest concentration of
the anionic polymer was used in CaCO3 crystallization, it was not capable of stabilizing the vaterite.
Thus, nucleation of vaterite may occur but its crystal phase will not be stable, and therefore it will
be transformed into calcite. The peaks due to calcite and vaterite were confirmed by FT-IR
spectroscopy (Fig. 5.10). The additional peaks due to the anionic starch additive were also observed
showing that the polysaccharide was present in or on the CaCO3 crystals.
0.02 mm 0.02 mm
0.02 mm0.02 mm
0.02 mm 0.02 mm
0.02 mm0.02 mm
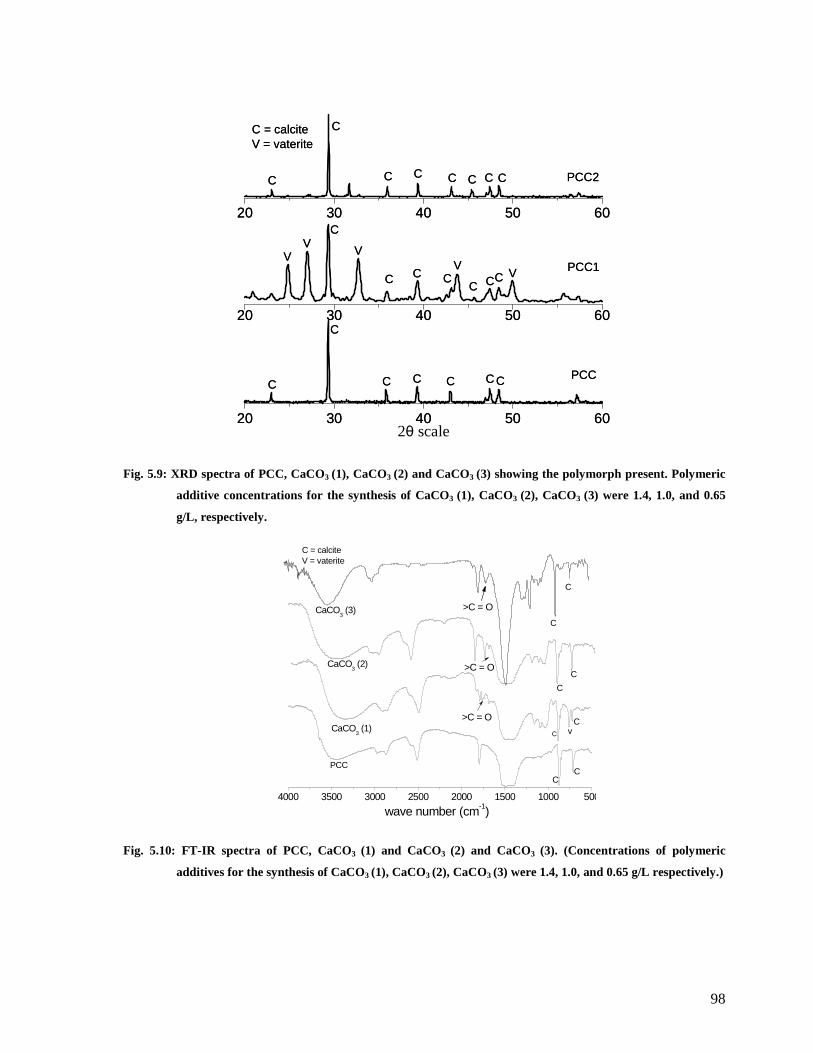
98
Fig. 5.9: XRD spectra of PCC, CaCO3 (1), CaCO3 (2) and CaCO3 (3) showing the polymorph present. Polymeric
additive concentrations for the synthesis of CaCO3 (1), CaCO3 (2), CaCO3 (3) were 1.4, 1.0, and 0.65
g/L, respectively.
Fig. 5.10: FT-IR spectra of PCC, CaCO3 (1) and CaCO3 (2) and CaCO3 (3). (Concentrations of polymeric
additives for the synthesis of CaCO3 (1), CaCO3 (2), CaCO3 (3) were 1.4, 1.0, and 0.65 g/L respectively.)
20 30 40 50 60
VV
VV
V
C
C CCCCCC
PCC1
PCC2
CC = calciteV = vaterite
20 30 40 50 60
CCC
CCC
20 30 40 50 60
C C
C
C CC C
2-Theta scale
PCC
2θ scale
20 30 40 50 60
VV
VV
V
C
C CCCCCC
PCC1
PCC2
CC = calciteV = vaterite
20 30 40 50 60
CCC
CCC
20 30 40 50 60
C C
C
C CC C
2-Theta scale
PCC
2θ scale
CaCO3 (3)
C
C
>C = O
>C = O
C = calciteV = vaterite
>C = OCaCO3 (2)
C
C
C
C
CC
v
4000 3500 3000 2500 2000 1500 1000 500
CaCO3 (1)
PCC
wave number (cm-1)
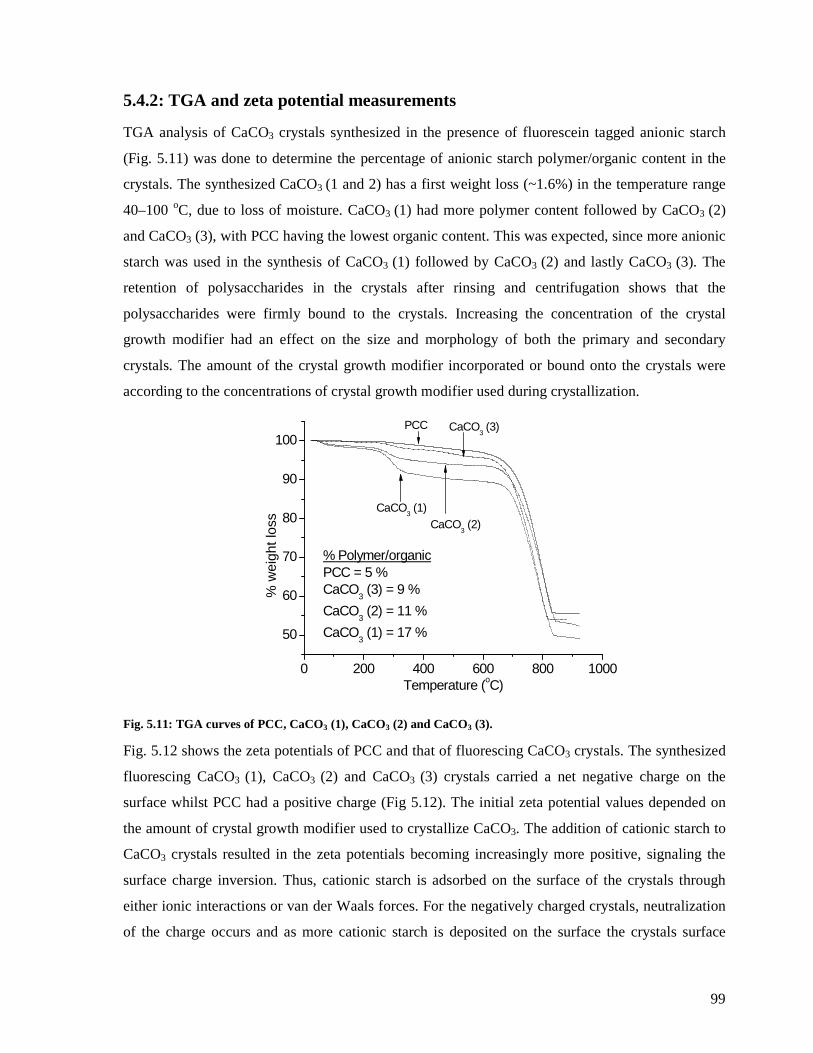
99
5.4.2: TGA and zeta potential measurements
TGA analysis of CaCO3 crystals synthesized in the presence of fluorescein tagged anionic starch
(Fig. 5.11) was done to determine the percentage of anionic starch polymer/organic content in the
crystals. The synthesized CaCO3 (1 and 2) has a first weight loss (~1.6%) in the temperature range
40–100 oC, due to loss of moisture. CaCO3 (1) had more polymer content followed by CaCO3 (2)
and CaCO3 (3), with PCC having the lowest organic content. This was expected, since more anionic
starch was used in the synthesis of CaCO3 (1) followed by CaCO3 (2) and lastly CaCO3 (3). The
retention of polysaccharides in the crystals after rinsing and centrifugation shows that the
polysaccharides were firmly bound to the crystals. Increasing the concentration of the crystal
growth modifier had an effect on the size and morphology of both the primary and secondary
crystals. The amount of the crystal growth modifier incorporated or bound onto the crystals were
according to the concentrations of crystal growth modifier used during crystallization.
Fig. 5.11: TGA curves of PCC, CaCO3 (1), CaCO3 (2) and CaCO3 (3).
Fig. 5.12 shows the zeta potentials of PCC and that of fluorescing CaCO3 crystals. The synthesized
fluorescing CaCO3 (1), CaCO3 (2) and CaCO3 (3) crystals carried a net negative charge on the
surface whilst PCC had a positive charge (Fig 5.12). The initial zeta potential values depended on
the amount of crystal growth modifier used to crystallize CaCO3. The addition of cationic starch to
CaCO3 crystals resulted in the zeta potentials becoming increasingly more positive, signaling the
surface charge inversion. Thus, cationic starch is adsorbed on the surface of the crystals through
either ionic interactions or van der Waals forces. For the negatively charged crystals, neutralization
of the charge occurs and as more cationic starch is deposited on the surface the crystals surface
0 200 400 600 800 1000
50
60
70
80
90
100CaCO
3 (3)
CaCO3 (2)
CaCO3 (1)
% w
eigh
t los
s
Temperature (oC)
PCC
% Polymer/organicPCC = 5 %CaCO
3 (3) = 9 %
CaCO3 (2) = 11 %
CaCO3 (1) = 17 %
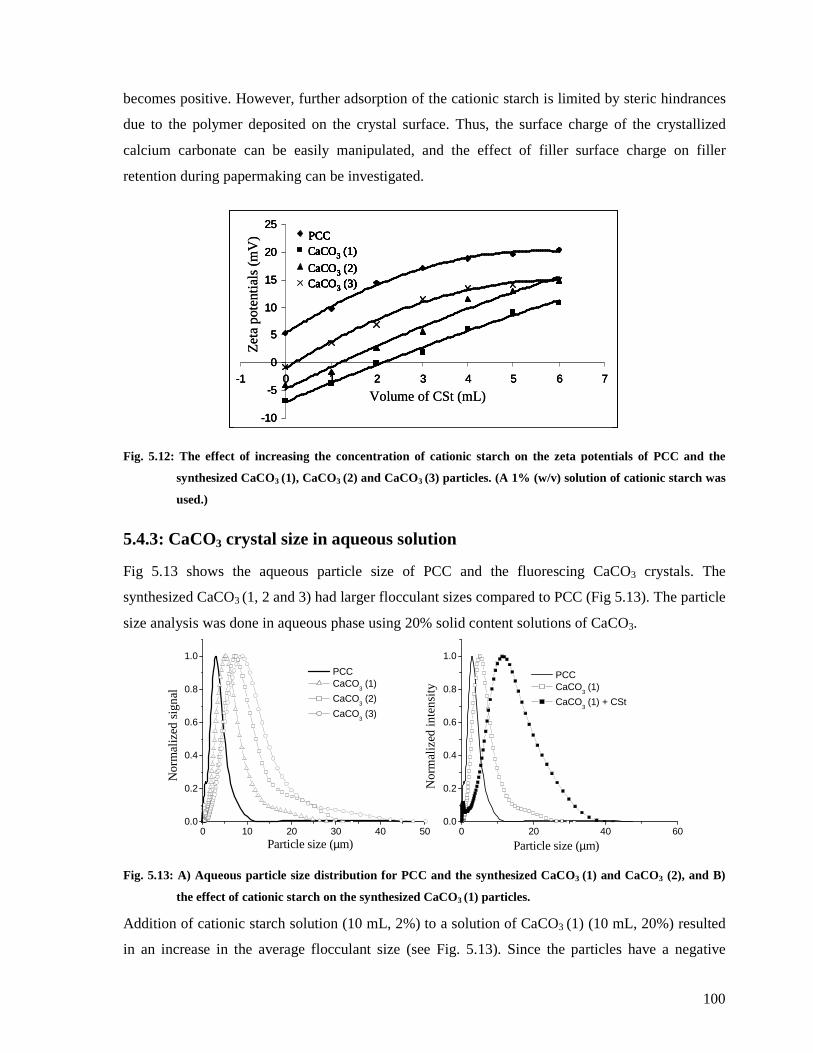
100
becomes positive. However, further adsorption of the cationic starch is limited by steric hindrances
due to the polymer deposited on the crystal surface. Thus, the surface charge of the crystallized
calcium carbonate can be easily manipulated, and the effect of filler surface charge on filler
retention during papermaking can be investigated.
Fig. 5.12: The effect of increasing the concentration of cationic starch on the zeta potentials of PCC and the
synthesized CaCO3 (1), CaCO3 (2) and CaCO3 (3) particles. (A 1% (w/v) solution of cationic starch was
used.)
5.4.3: CaCO3 crystal size in aqueous solution
Fig 5.13 shows the aqueous particle size of PCC and the fluorescing CaCO3 crystals. The
synthesized CaCO3 (1, 2 and 3) had larger flocculant sizes compared to PCC (Fig 5.13). The particle
size analysis was done in aqueous phase using 20% solid content solutions of CaCO3.
Fig. 5.13: A) Aqueous particle size distribution for PCC and the synthesized CaCO3 (1) and CaCO3 (2), and B)
the effect of cationic starch on the synthesized CaCO3 (1) particles.
Addition of cationic starch solution (10 mL, 2%) to a solution of CaCO3 (1) (10 mL, 20%) resulted
in an increase in the average flocculant size (see Fig. 5.13). Since the particles have a negative
-10
-5
0
5
10
15
20
25
-1 0 1 2 3 4 5 6 7
PCCCaCO3 (1)
CaCO3 (2)CaCO3 (3)
PCCCaCO3 (1)
CaCO3 (2)CaCO3 (3)
Volume of CSt (mL)
Ze
ta p
ote
ntia
ls (
mV
)
-10
-5
0
5
10
15
20
25
-1 0 1 2 3 4 5 6 7
PCCCaCO3 (1)
CaCO3 (2)CaCO3 (3)
PCCCaCO3 (1)
CaCO3 (2)CaCO3 (3)
-10
-5
0
5
10
15
20
25
-1 0 1 2 3 4 5 6 7
PCCCaCO3 (1)
CaCO3 (2)CaCO3 (3)
PCCCaCO3 (1)
CaCO3 (2)CaCO3 (3)
Volume of CSt (mL)
Ze
ta p
ote
ntia
ls (
mV
)
0 10 20 30 40 500.0
0.2
0.4
0.6
0.8
1.0
0 20 40 600.0
0.2
0.4
0.6
0.8
1.0
Nor
ma
lized
sig
nal
Particle size (µm)
PCC CaCO
3 (1)
CaCO3 (2)
CaCO3 (3)
Nor
mal
ized
inte
nsi
ty
Particle size (µm)
PCC CaCO
3 (1)
CaCO3 (1) + CSt
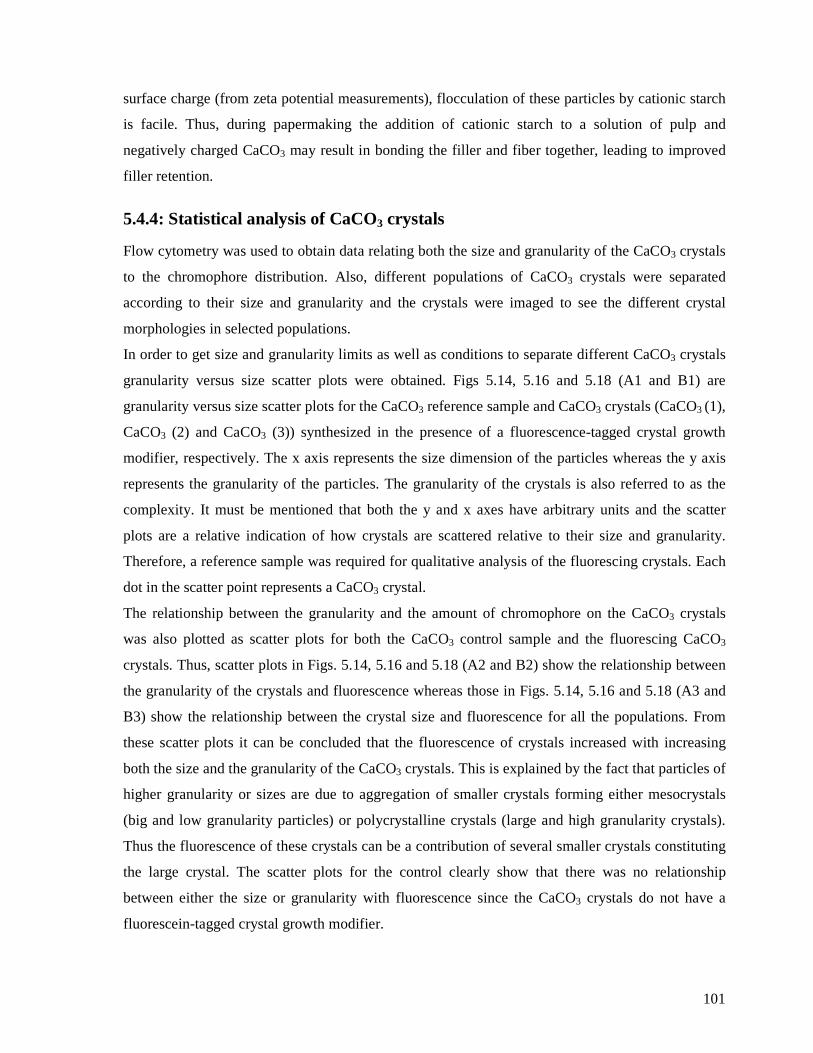
101
surface charge (from zeta potential measurements), flocculation of these particles by cationic starch
is facile. Thus, during papermaking the addition of cationic starch to a solution of pulp and
negatively charged CaCO3 may result in bonding the filler and fiber together, leading to improved
filler retention.
5.4.4: Statistical analysis of CaCO3 crystals
Flow cytometry was used to obtain data relating both the size and granularity of the CaCO3 crystals
to the chromophore distribution. Also, different populations of CaCO3 crystals were separated
according to their size and granularity and the crystals were imaged to see the different crystal
morphologies in selected populations.
In order to get size and granularity limits as well as conditions to separate different CaCO3 crystals
granularity versus size scatter plots were obtained. Figs 5.14, 5.16 and 5.18 (A1 and B1) are
granularity versus size scatter plots for the CaCO3 reference sample and CaCO3 crystals (CaCO3 (1),
CaCO3 (2) and CaCO3 (3)) synthesized in the presence of a fluorescence-tagged crystal growth
modifier, respectively. The x axis represents the size dimension of the particles whereas the y axis
represents the granularity of the particles. The granularity of the crystals is also referred to as the
complexity. It must be mentioned that both the y and x axes have arbitrary units and the scatter
plots are a relative indication of how crystals are scattered relative to their size and granularity.
Therefore, a reference sample was required for qualitative analysis of the fluorescing crystals. Each
dot in the scatter point represents a CaCO3 crystal.
The relationship between the granularity and the amount of chromophore on the CaCO3 crystals
was also plotted as scatter plots for both the CaCO3 control sample and the fluorescing CaCO3
crystals. Thus, scatter plots in Figs. 5.14, 5.16 and 5.18 (A2 and B2) show the relationship between
the granularity of the crystals and fluorescence whereas those in Figs. 5.14, 5.16 and 5.18 (A3 and
B3) show the relationship between the crystal size and fluorescence for all the populations. From
these scatter plots it can be concluded that the fluorescence of crystals increased with increasing
both the size and the granularity of the CaCO3 crystals. This is explained by the fact that particles of
higher granularity or sizes are due to aggregation of smaller crystals forming either mesocrystals
(big and low granularity particles) or polycrystalline crystals (large and high granularity crystals).
Thus the fluorescence of these crystals can be a contribution of several smaller crystals constituting
the large crystal. The scatter plots for the control clearly show that there was no relationship
between either the size or granularity with fluorescence since the CaCO3 crystals do not have a
fluorescein-tagged crystal growth modifier.
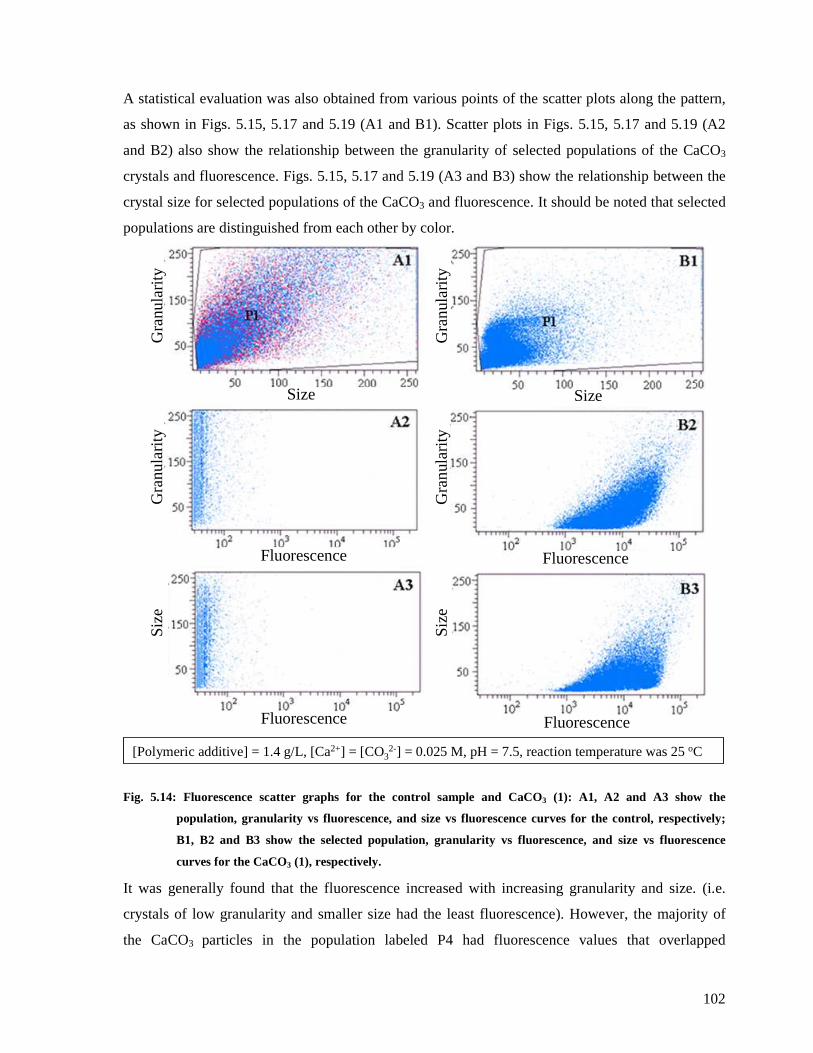
102
A statistical evaluation was also obtained from various points of the scatter plots along the pattern,
as shown in Figs. 5.15, 5.17 and 5.19 (A1 and B1). Scatter plots in Figs. 5.15, 5.17 and 5.19 (A2
and B2) also show the relationship between the granularity of selected populations of the CaCO3
crystals and fluorescence. Figs. 5.15, 5.17 and 5.19 (A3 and B3) show the relationship between the
crystal size for selected populations of the CaCO3 and fluorescence. It should be noted that selected
populations are distinguished from each other by color.
Fig. 5.14: Fluorescence scatter graphs for the control sample and CaCO3 (1): A1, A2 and A3 show the
population, granularity vs fluorescence, and size vs fluorescence curves for the control, respectively;
B1, B2 and B3 show the selected population, granularity vs fluorescence, and size vs fluorescence
curves for the CaCO3 (1), respectively.
It was generally found that the fluorescence increased with increasing granularity and size. (i.e.
crystals of low granularity and smaller size had the least fluorescence). However, the majority of
the CaCO3 particles in the population labeled P4 had fluorescence values that overlapped
[Polymeric additive] = 1.4 g/L, [Ca2+] = [CO32-] = 0.025 M, pH = 7.5, reaction temperature was 25 oC
Gra
nula
rity
Gra
nula
rity
Siz
e
FluorescenceFluorescence
FluorescenceFluorescence
Size Size
Gra
nul
arit
yG
ran
ula
rity
Siz
e
Gra
nula
rity
Gra
nula
rity
Siz
e
FluorescenceFluorescence
FluorescenceFluorescence
Size Size
Gra
nul
arit
yG
ran
ula
rity
Siz
e
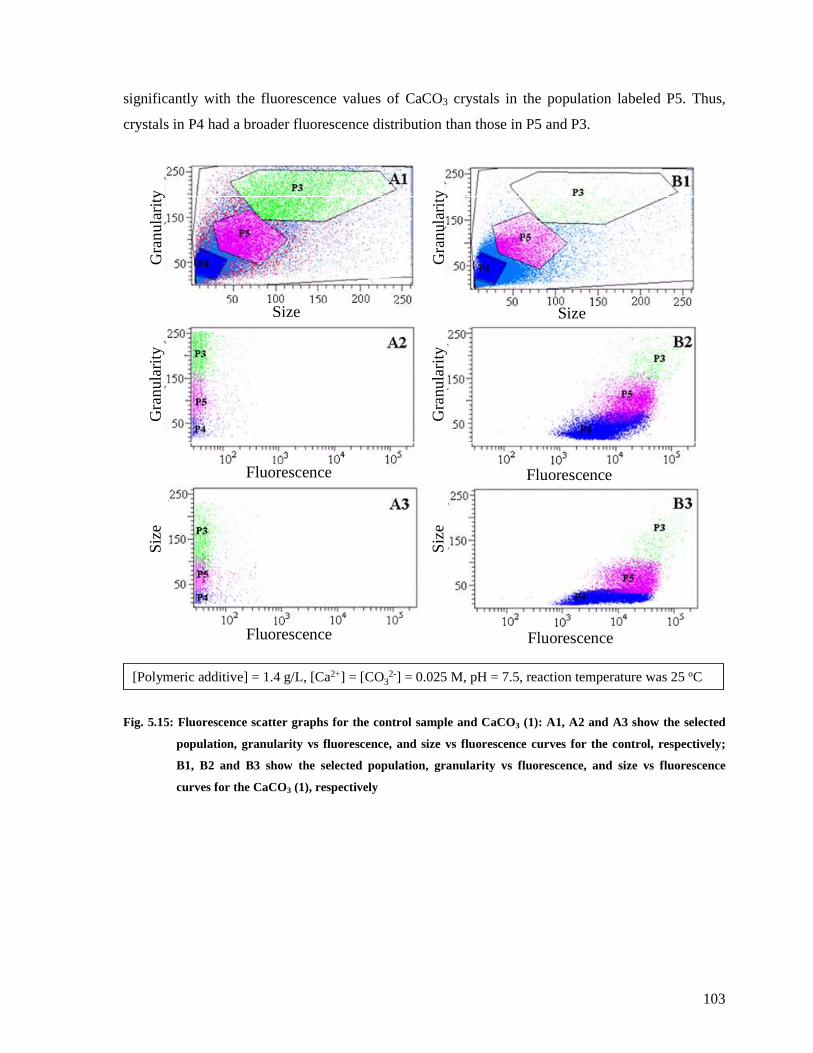
103
significantly with the fluorescence values of CaCO3 crystals in the population labeled P5. Thus,
crystals in P4 had a broader fluorescence distribution than those in P5 and P3.
Fig. 5.15: Fluorescence scatter graphs for the control sample and CaCO3 (1): A1, A2 and A3 show the selected
population, granularity vs fluorescence, and size vs fluorescence curves for the control, respectively;
B1, B2 and B3 show the selected population, granularity vs fluorescence, and size vs fluorescence
curves for the CaCO3 (1), respectively
[Polymeric additive] = 1.4 g/L, [Ca2+] = [CO32-] = 0.025 M, pH = 7.5, reaction temperature was 25 oC
FluorescenceFluorescence
FluorescenceFluorescence
Size Size
Gra
nul
arity
Gra
nula
rity
Siz
e
Gra
nul
arity
Gra
nula
rity
Siz
e
FluorescenceFluorescence
FluorescenceFluorescence
Size Size
Gra
nul
arity
Gra
nula
rity
Siz
e
Gra
nul
arity
Gra
nula
rity
Siz
e
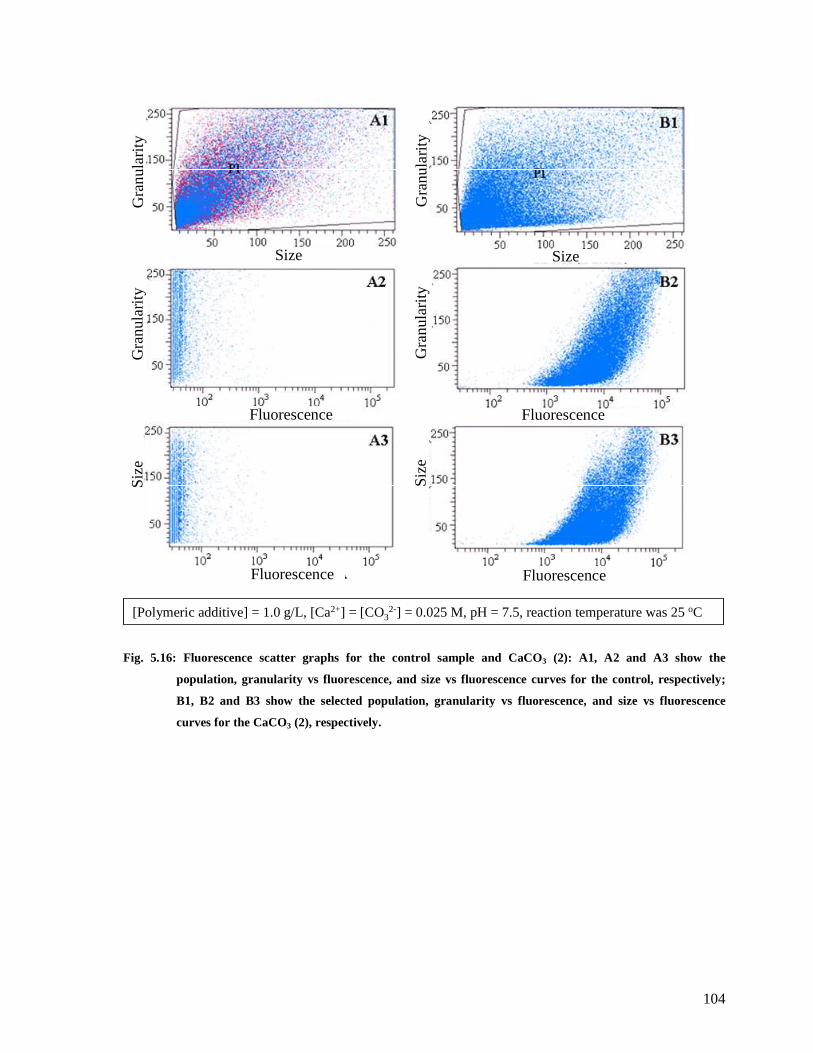
104
Fig. 5.16: Fluorescence scatter graphs for the control sample and CaCO3 (2): A1, A2 and A3 show the
population, granularity vs fluorescence, and size vs fluorescence curves for the control, respectively;
B1, B2 and B3 show the selected population, granularity vs fluorescence, and size vs fluorescence
curves for the CaCO3 (2), respectively.
[Polymeric additive] = 1.0 g/L, [Ca2+] = [CO32-] = 0.025 M, pH = 7.5, reaction temperature was 25 oC
FluorescenceFluorescence
FluorescenceFluorescence
Size Size
Gra
nul
arity
Gra
nul
arity
Siz
e
Gra
nula
rity
Gra
nul
arity
Siz
e
FluorescenceFluorescence
FluorescenceFluorescence
Size Size
Gra
nul
arity
Gra
nul
arity
Siz
e
Gra
nula
rity
Gra
nul
arity
Siz
e

105
Fig. 5.17: Fluorescence scatter graphs for the control sample and CaCO3 (2): A1, A2 and A3 show the selected
population, granularity vs fluorescence, and size vs fluorescence curves for the control, respectively;
B1, B2 and B3 shows the selected population, granularity vs fluorescence, and size vs fluorescence
curves for the CaCO3 (2) ,respectively.
[Polymeric additive] = 1.0 g/L, [Ca2+] = [CO32-] = 0.025 M, pH = 7.5, reaction temperature was 25 oC
FluorescenceFluorescence
FluorescenceFluorescence
Size Size
Gra
nu
larit
yG
ran
ular
ityS
ize
Gra
nul
arity
Gra
nul
arity
Siz
e
FluorescenceFluorescence
FluorescenceFluorescence
Size Size
Gra
nu
larit
yG
ran
ular
ityS
ize
Gra
nul
arity
Gra
nul
arity
Siz
e
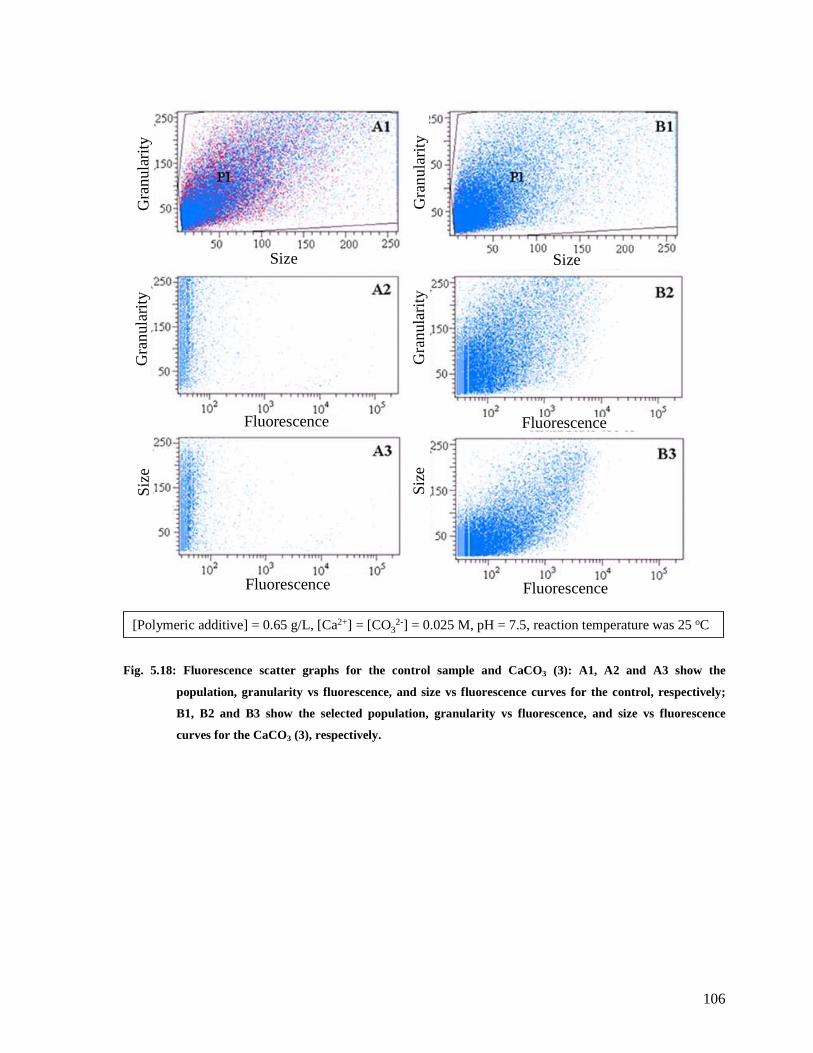
106
Fig. 5.18: Fluorescence scatter graphs for the control sample and CaCO3 (3): A1, A2 and A3 show the
population, granularity vs fluorescence, and size vs fluorescence curves for the control, respectively;
B1, B2 and B3 show the selected population, granularity vs fluorescence, and size vs fluorescence
curves for the CaCO3 (3), respectively.
[Polymeric additive] = 0.65 g/L, [Ca2+] = [CO32-] = 0.025 M, pH = 7.5, reaction temperature was 25 oC
FluorescenceFluorescence
FluorescenceFluorescence
Size Size
Gra
nul
arity
Gra
nul
arity
Siz
e
Gra
nu
larit
yG
ran
ular
ityS
ize
FluorescenceFluorescence
FluorescenceFluorescence
Size Size
Gra
nul
arity
Gra
nul
arity
Siz
e
Gra
nu
larit
yG
ran
ular
ityS
ize
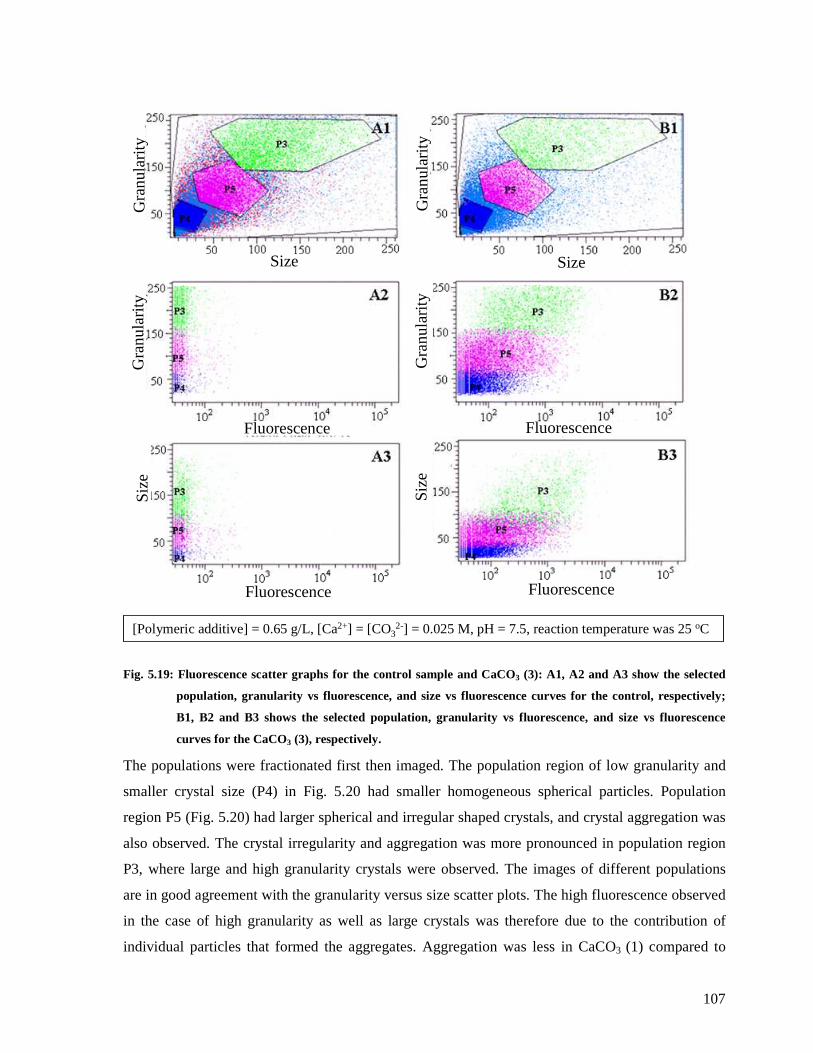
107
Fig. 5.19: Fluorescence scatter graphs for the control sample and CaCO3 (3): A1, A2 and A3 show the selected
population, granularity vs fluorescence, and size vs fluorescence curves for the control, respectively;
B1, B2 and B3 shows the selected population, granularity vs fluorescence, and size vs fluorescence
curves for the CaCO3 (3), respectively.
The populations were fractionated first then imaged. The population region of low granularity and
smaller crystal size (P4) in Fig. 5.20 had smaller homogeneous spherical particles. Population
region P5 (Fig. 5.20) had larger spherical and irregular shaped crystals, and crystal aggregation was
also observed. The crystal irregularity and aggregation was more pronounced in population region
P3, where large and high granularity crystals were observed. The images of different populations
are in good agreement with the granularity versus size scatter plots. The high fluorescence observed
in the case of high granularity as well as large crystals was therefore due to the contribution of
individual particles that formed the aggregates. Aggregation was less in CaCO3 (1) compared to
[Polymeric additive] = 0.65 g/L, [Ca2+] = [CO32-] = 0.025 M, pH = 7.5, reaction temperature was 25 oC
FluorescenceFluorescence
FluorescenceFluorescence
Size Size
Gra
nul
arit
yG
ran
ula
rity
Siz
e
Gra
nul
arity
Gra
nul
arity
Siz
e
FluorescenceFluorescence
FluorescenceFluorescence
Size Size
Gra
nul
arit
yG
ran
ula
rity
Siz
e
Gra
nul
arity
Gra
nul
arity
Siz
e

108
CaCO3 (2) (Figs. 5.15 and 5.17). This is due to the different colloidal stability of the crystals. The
colloidal stability thus decreased with decreasing crystal growth modifier concentration.
Fig. 5.20: Images for fluorescence scatter populations P3, P4, and P5 for CaCO3 (2)–(3)
Table 5.1 shows the average fluorescence values for the entire distribution P1, and the average
florescence values for the selected areas (see Figs. 5.15, 5.17, 5.19(A1 and B1)) P3, P4 and P5. The
crystals synthesized in the presence of 1.4, 1.0 and 0.65 g/L crystal growth modifier gave different
fluorescence distribution curves and scatter plots in terms of their position in the fluorescence scale.
The order of increasing fluorescence in crystals was from the highest to the least concentration of
crystal growth modifier, as shown in Fig. 5.21. The fluorescence results were in good correlation
with results obtained from TGA and zeta potential measurements (Section 5.4.2), which showed
that the retention of the polysaccharide in the crystals increased when the concentration of the
crystal growth modifier in the system was increased.

109
Table 5.1: The average fluorescence values (no units) for selected areas in the scatter plot and
their standard deviation for the control and synthesized CaCO3
P2 denotes the overall fluorescence distribution of all the CaCO3 crystals analyzed. The
fluorescence distributions curves of all the CaCO3 crystals are shown in Fig. 5.21.
Fig. 5.21: Fluorescence distribution curves of (A) control sample and CaCO3 crystals synthesized in the presence
of fluorescence tagged anionic starch, (B) CaCO3 (3), (C) CaCO3 (2) and (D) CaCO3 (1). (P2 denotes
events in population P1.)
FluorescenceFluorescence
110
Statistical evaluation of CaCO3 crystals also revealed the following: (i) large crystals of low
granularity, (ii) smaller crystals of high granularity, (iii) large crystals of high granularity and (iv)
the majority of the crystals were small and of low granularity. It can be concluded therefore that (i)
large crystals of low granularity followed either the classical crystal growth mechanism or the non-
classic crystal growth mechanism, leading to mesocrystals, which results in crystals low of
granularity, (ii) smaller crystals of high granularity followed the non-classical crystal growth
mechanism, leading to polycrystalline crystals due to aggregation of primary crystals, (iii) large
crystals of high granularity followed a non-classical crystal growth mechanism, with aggregation of
primary crystals larger than the primary crystals that formed crystals in (ii) and, lastly (iv) smaller
to medium crystals of low-medium granularity followed either a single crystal growth mechanism
or a non-classical crystal growth mechanism, with even smaller primary ions than those that formed
crystals in (ii). This conclusion is based on the fact that different morphologies were obtained in one
system, meaning that the nucleation and crystal growth mechanisms were different. It was also
noted that the CaCO3 crystals formed in the presence of the highest concentration of crystal growth
modifier had the least number of crystals in both the high granularity and large crystal size region,
which indicates that most crystals grew via a similar mechanism of crystal nucleation and growth.
Previous studies showed that the higher the concentration of the crystal growth modifier the better
is the control of crystal nucleation.14
5.4.5: Crystal nucleation and growth mechanisms
It is widely accepted in literature that the formation of ACC is the initial step in the crystallization
of CaCO3 and it can be formed in the absence of polymeric additives under high supersaturation
conditions.15 The polymeric additives such as PAA was found to stabilize the ACC and an ACC-
PAA gel was observed in which the nucleation of the crystals occurred, resulting in the spherulitic
growth of the nucleus.12 A single crystal nucleus can be formed with or without the aid of additives.
The crystalline nucleus will then grow at the expense of ACC via a dissolution and recrystallization
process.16 The inclusion of crystal growth modifiers alters the growth mechanism of the nuclei and
is also subject to the relative concentrations of both the polymeric additive and precursor ions. The
polymeric additive is capable of increasing the number of primary ions, which leads to smaller and
possibly unstable primary crystals. The polymeric additives also have another role to play during
crystal growth i.e. they are selectively adsorbed on to the surface of growing CaCO3 crystal faces
(depending on their functionality).14,15 Their adsorption on crystal faces results in retardation or
termination of crystal growth on those crystal faces. Thus, crystals are forced to grow in certain
111
dimensions. For PAM and PAM modified cellulose, where flat rhombohedrical crystals were
observed (see Sections 4.3.1 and 4.3.3), the crystals were allowed to grow in 2-dimensions, and
cubical crystals grew without the influence of PAM, as was observed for the control (no polymeric
additive) run. For PAA and PAA grafted polysaccharides where spherical morphology was obtained
the crystal growth of a nucleus is likely to follow the spherulitic mechanism derived from the ACC-
PAA gel. The size and morphology of these primary crystals depends on the nature and
concentration of the crystal growth modifier. The last step in the crystallization process is the
growth of crystals to their ultimate size. Crystal growth can be via a classical or a non-classical
mechanism. Non-classical crystal growth mechanisms occur via Oswald ripening and the driving
force is the reduction of the interfacial energy.12 Thus, for non-classical crystal growth mechanisms
that leads to mesocrystals, secondary crystals retains the morphology of their primary crystals. The
non-classical crystallization mechanism allows smaller crystals to aggregate to form large particles.
These primary crystals have a natural tendency to aggregate, thereby reducing their surface energy.
Theoretically, each primary crystal should have polymer chain(s) attached to it. The aggregation of
these particles could lead to two possibilities, namely (i) incorporation of some polysaccharide
inside the secondary crystals and (ii) polysaccharide residing on the surface of the secondary
crystals caused by an initial or a primary absorption mechanism. Orientation of these particles
during crystal growth could be similar to that of surface active agents in water, where aggregation
occurs in a manner such that the surface energy of particles in the system is minimized. The
classical crystal growth model is more prevalent in systems without crystal growth modifiers at low
CaCO3 precursor concentration or where the interaction of the crystal growth modifier and the
growing crystal are at a minimum,14 i.e. crystal growth will be independent of the polymeric
additives but dependent on the concentration of CaCO3 precursor ions’ concentration. In the
classical crystal growth mechanism, incorporation of the polymeric additive is possible especially
when the polymer is involved in the stabilization of AAC initially formed. Thus, in the case of
spherulitic crystal growth mechanism proposed for PAA system, crystallization will lead to
incorporation of the PAA chains (that are responsible of stabilization of spherical ACC-gel) as the
crystals grow. Crystals that have uniform morphology such as those shown in Fig. 5.2 and Fig. 5.3
are likely to be nucleated and grow via a similar mechanism. However, it is difficult to differentiate
between crystals that followed classical and non-classic mechanism (that result in mesocrystals) if
the size of their primary ions were small enough that with the current tools used to image the
crystals, the crystals appear to be single crystals. The crystals with mixed morphologies are likely to
be nucleated via different mechanisms and the crystal growth mechanism is also different.
112
Statistical analysis and imaging of fractionated crystals showed that large crystals of high
granularity were due to aggregation of primary crystals. The extent of aggregation depended on the
initial concentration of the polymeric additive used. It was also shown by other authors that the
amount of polymeric additive on the surface of the crystals help in crystal stabilization.15 In this
study, it was found hat the crystal growth modifier was not homogeneously distributed in the
crystals since the crystals of the same size or granularity were found to have different amounts of
fluorescence. Although it is reported in literature that monodispersed crystal size would mean that
crystal nucleation and growth was homogenous,17,18 the actual crystal growth process can be
complex. The amount of polymeric additive inside the crystal can be related to the initial amount of
polymeric additive responsible for the stabilization of the ACC and the rest of the polymeric
additive is absorbed (PAA) or adsorbed (starch). Adsorption and/or absorption of polymeric
additive may occur during and after the crystal growth process. The spherical crystal morphology
and size can be close to 1:1 copy of the ACC-PAA gel domains. The ACC is the least stable form of
CaCO3, and it was found to adapt any shape as directed by the polymeric additives.15 Stabilized
spherical nanometer-sized ACC particles were synthesized by Gorna et al.15 The secondary
inclusion of the polymeric additive that occurs during crystallization (after ACC stabilization) may
not change the crystal morphology but have an effect on the stability of the less thermodynamic
stable CaCO3 polymorphs. The polymeric additive can prevent the dissolution (of the least stable
polymorphs) and the recrystallization process (that results in a stable polymorph). When 0.65 g/L
PAA grafted starch concentration was used, the morphology of the ACC was not dictated by the
polymeric additive but by the concentration of the ACC precursor ions. Furthermore, if the ACC
was formed initially, its stability would be low and, could easily dissolve and recrystallize forming
thermodynamically stable polymorphs. Thus, the process of recrystallization occurred under little or
no influence of the polymeric additive resulting in mixed crystal morphologies. Rates of
crystallization are faster when crystal growth is independent of the crystal growth modifier as found
in Section 4.3.1. Thus, fluorescence observed for CaCO3 (3) was due to absorption/adsorption of the
polymeric additive on the surface of the crystals.
5.4: Conclusions
The CaCO3 crystals synthesized in the presence of fluorescence-tagged crystal growth modifier
fluoresced under UV irradiation showing the presence of the polysaccharide on the surface of the
crystals. Fluorescence allowed a study of agglomeration and growth habits of the crystals. A novel
approach for characterization of CaCO3 crystals using flow cytometry was successful. Statistical
113
analysis showed that most of the crystals fluoresced, with crystals of high granularity and large size
fluorescing more than crystals of low granularity and small size. Thus, the fluorescence in crystals
increased with increasing size and granularity of CaCO3 crystals. The non-classical mechanism of
crystal growth leading to polycrystalline crystals was proposed for large crystals with high
granularity as well as smaller crystals with high granularity. Reducing the concentration of the
polymeric additive resulted in an increase in the number of crystals of high granularity and large in
size. The zeta potential measurements showed that the use of anionic starch in CaCO3
crystallization resulted in anionically charged crystals, due to the presence of anionic
polysaccharide. Coating of the crystals with cationic starch inverted the surface charge on the
CaCO3 crystals. TGA and FT-IR results corroborated the presence of polysaccharide in the CaCO3
crystals. The average flocculant size of crystallized calcium carbonate increased when cationic
starch was added. The fluorescing CaCO3 can be used as tagging material for paper products. The
inclusion of these fluorescing filler materials during papermaking will result in their retention
leading to a paper that fluoresces under UV light.
5.6: References
(1) Suty, S., Luzakova V. Colloids and Surfaces A: Physicochemical Engineering Aspects 1998,
139, 271-278.
(2) Knez, S., Klinar D., Golob J. Chemical Engineering Science 2006, 61, 5867-5880.
(3) Rogan, K. R., Bentham A. C., George I. A., Skuse P. R. Colloid and Polymer Science 1994,
272(10), 1175-1189.
(4) Jada, A., Verraes A. Colloids Surf., A: Physicochem. Eng. Aspects 2003, 219(1-3), 7-15.
(5) Attard, P. Current Opinion in Colloid and Interface Science 2001, 6, 366-371.
(6) Dudman, W. F., Bishop C. T. Canadian Journal of Chemistry 1968, 46, 3079-3081.
(7) Horton, D., Philips K. D. Carbohydrate Research 1973, 30, 375-378.
(8) Cai, K., Frant M., Bossert J., Hildebrand G., Liefeith K., Jandt K.D. Colloid and Surfaces B:
Biointerface 2006, 50, 1-8.
(9) Werner, C., Korber H., Zimmermann R., Dukhin S., Jacobasch H-J. Journal of Colloid and
Interface Science 1998, 208, 329-346.
(10) Valdivieso, A. L., Bahena J. L. R., Song S., Urbina R. H. Journal of Colloid and Interface
Science 2006, 298, 1-5.
(11) El-Sadi, H., Carreau P., Esmail N. Journal of Colloid and Interface Science 2004, 271, 496-
503.
114
(12) Ulcinas, A., Butler M. F., Heppenstal-Butler M., Singleton S., Miles M. J. Journal of
Crystal Growth 2007, 307, 378-385.
(13) Naka, K., Huang S-C ., Chuyo Y. Langmuir 2006, 22, 7760-7767.
(14) Wang, T., Antonietti M., Zhao X., Colfen H. Chemistry - A European Journal 2006, 12,
5722-5730.
(15) Gorna, K., Munoz-Espi R., Grohn F., Wegner G. Macromolecular Bioscience 2007, 7, 163-
173.
(16) Han, T. Y., Aizenberg J. Chemistry of Materials 2008, 20, 1064-1068.
(17) Cheng, B., Lei M., Yu J., Zhao X. Material Letters 2004, 58, 1565-1570.
(18) Yu, H., Lei M., Cheng B., Zhao X. Journal of solid state chemistry 2004, 177, 681-689.
115
Chapter 6: Testing modified polysaccharides in paper production
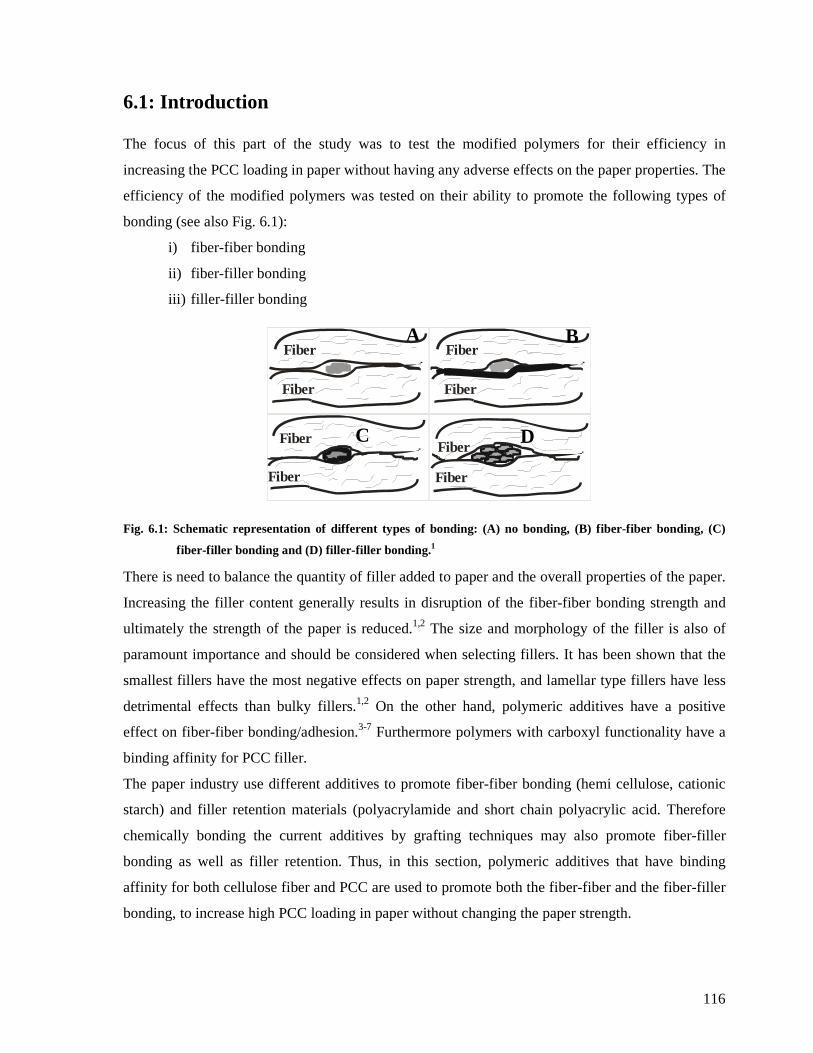
116
6.1: Introduction
The focus of this part of the study was to test the modified polymers for their efficiency in
increasing the PCC loading in paper without having any adverse effects on the paper properties. The
efficiency of the modified polymers was tested on their ability to promote the following types of
bonding (see also Fig. 6.1):
i) fiber-fiber bonding
ii) fiber-filler bonding
iii) filler-filler bonding
Fig. 6.1: Schematic representation of different types of bonding: (A) no bonding, (B) fiber-fiber bonding, (C)
fiber-filler bonding and (D) filler-filler bonding. 1
There is need to balance the quantity of filler added to paper and the overall properties of the paper.
Increasing the filler content generally results in disruption of the fiber-fiber bonding strength and
ultimately the strength of the paper is reduced.1,2 The size and morphology of the filler is also of
paramount importance and should be considered when selecting fillers. It has been shown that the
smallest fillers have the most negative effects on paper strength, and lamellar type fillers have less
detrimental effects than bulky fillers.1,2 On the other hand, polymeric additives have a positive
effect on fiber-fiber bonding/adhesion.3-7 Furthermore polymers with carboxyl functionality have a
binding affinity for PCC filler.
The paper industry use different additives to promote fiber-fiber bonding (hemi cellulose, cationic
starch) and filler retention materials (polyacrylamide and short chain polyacrylic acid. Therefore
chemically bonding the current additives by grafting techniques may also promote fiber-filler
bonding as well as filler retention. Thus, in this section, polymeric additives that have binding
affinity for both cellulose fiber and PCC are used to promote both the fiber-fiber and the fiber-filler
bonding, to increase high PCC loading in paper without changing the paper strength.
D C
A Fiber
Fiber
Fiber
Fiber
Fiber
Fiber
Fiber
Fiber
B
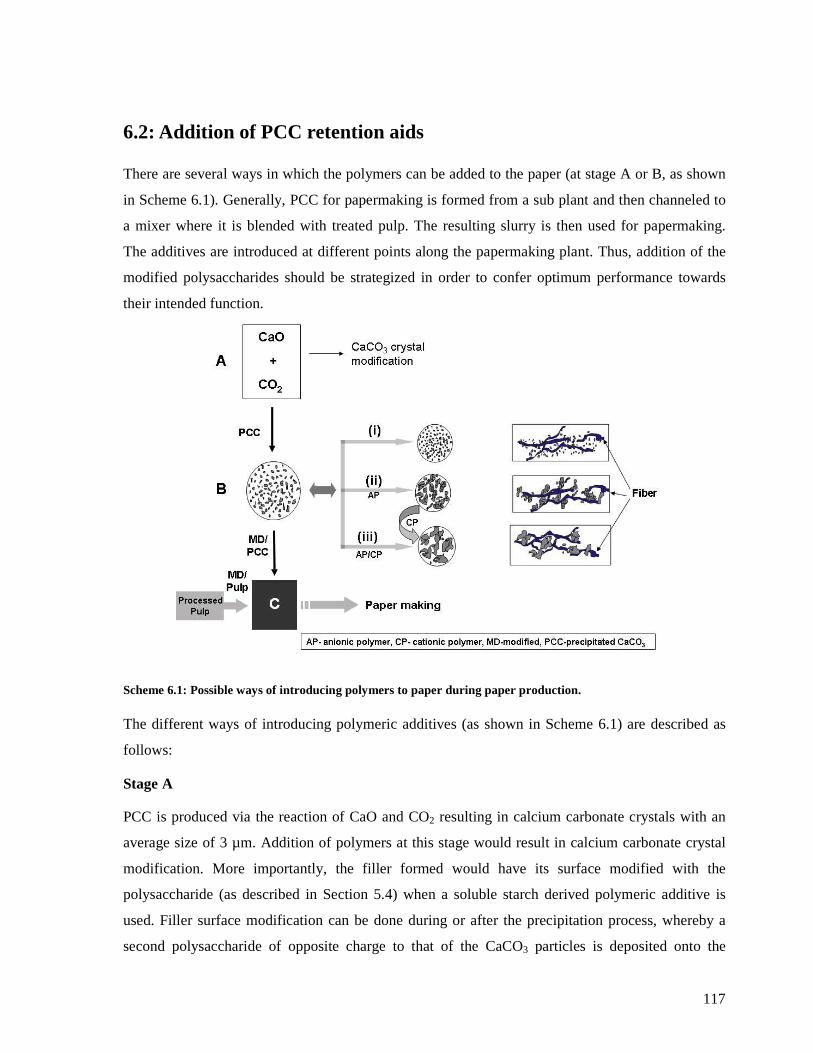
117
6.2: Addition of PCC retention aids
There are several ways in which the polymers can be added to the paper (at stage A or B, as shown
in Scheme 6.1). Generally, PCC for papermaking is formed from a sub plant and then channeled to
a mixer where it is blended with treated pulp. The resulting slurry is then used for papermaking.
The additives are introduced at different points along the papermaking plant. Thus, addition of the
modified polysaccharides should be strategized in order to confer optimum performance towards
their intended function.
Scheme 6.1: Possible ways of introducing polymers to paper during paper production.
The different ways of introducing polymeric additives (as shown in Scheme 6.1) are described as
follows:
Stage A
PCC is produced via the reaction of CaO and CO2 resulting in calcium carbonate crystals with an
average size of 3 µm. Addition of polymers at this stage would result in calcium carbonate crystal
modification. More importantly, the filler formed would have its surface modified with the
polysaccharide (as described in Section 5.4) when a soluble starch derived polymeric additive is
used. Filler surface modification can be done during or after the precipitation process, whereby a
second polysaccharide of opposite charge to that of the CaCO3 particles is deposited onto the
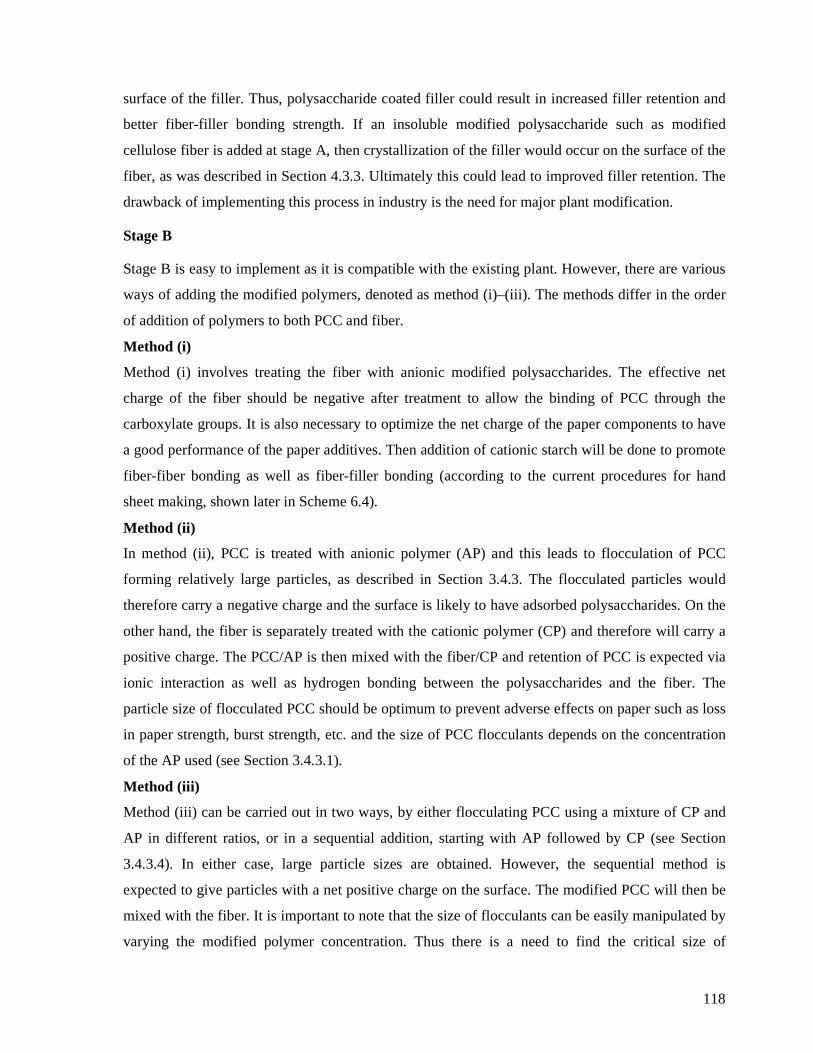
118
surface of the filler. Thus, polysaccharide coated filler could result in increased filler retention and
better fiber-filler bonding strength. If an insoluble modified polysaccharide such as modified
cellulose fiber is added at stage A, then crystallization of the filler would occur on the surface of the
fiber, as was described in Section 4.3.3. Ultimately this could lead to improved filler retention. The
drawback of implementing this process in industry is the need for major plant modification.
Stage B
Stage B is easy to implement as it is compatible with the existing plant. However, there are various
ways of adding the modified polymers, denoted as method (i)–(iii). The methods differ in the order
of addition of polymers to both PCC and fiber.
Method (i)
Method (i) involves treating the fiber with anionic modified polysaccharides. The effective net
charge of the fiber should be negative after treatment to allow the binding of PCC through the
carboxylate groups. It is also necessary to optimize the net charge of the paper components to have
a good performance of the paper additives. Then addition of cationic starch will be done to promote
fiber-fiber bonding as well as fiber-filler bonding (according to the current procedures for hand
sheet making, shown later in Scheme 6.4).
Method (ii)
In method (ii), PCC is treated with anionic polymer (AP) and this leads to flocculation of PCC
forming relatively large particles, as described in Section 3.4.3. The flocculated particles would
therefore carry a negative charge and the surface is likely to have adsorbed polysaccharides. On the
other hand, the fiber is separately treated with the cationic polymer (CP) and therefore will carry a
positive charge. The PCC/AP is then mixed with the fiber/CP and retention of PCC is expected via
ionic interaction as well as hydrogen bonding between the polysaccharides and the fiber. The
particle size of flocculated PCC should be optimum to prevent adverse effects on paper such as loss
in paper strength, burst strength, etc. and the size of PCC flocculants depends on the concentration
of the AP used (see Section 3.4.3.1).
Method (iii)
Method (iii) can be carried out in two ways, by either flocculating PCC using a mixture of CP and
AP in different ratios, or in a sequential addition, starting with AP followed by CP (see Section
3.4.3.4). In either case, large particle sizes are obtained. However, the sequential method is
expected to give particles with a net positive charge on the surface. The modified PCC will then be
mixed with the fiber. It is important to note that the size of flocculants can be easily manipulated by
varying the modified polymer concentration. Thus there is a need to find the critical size of
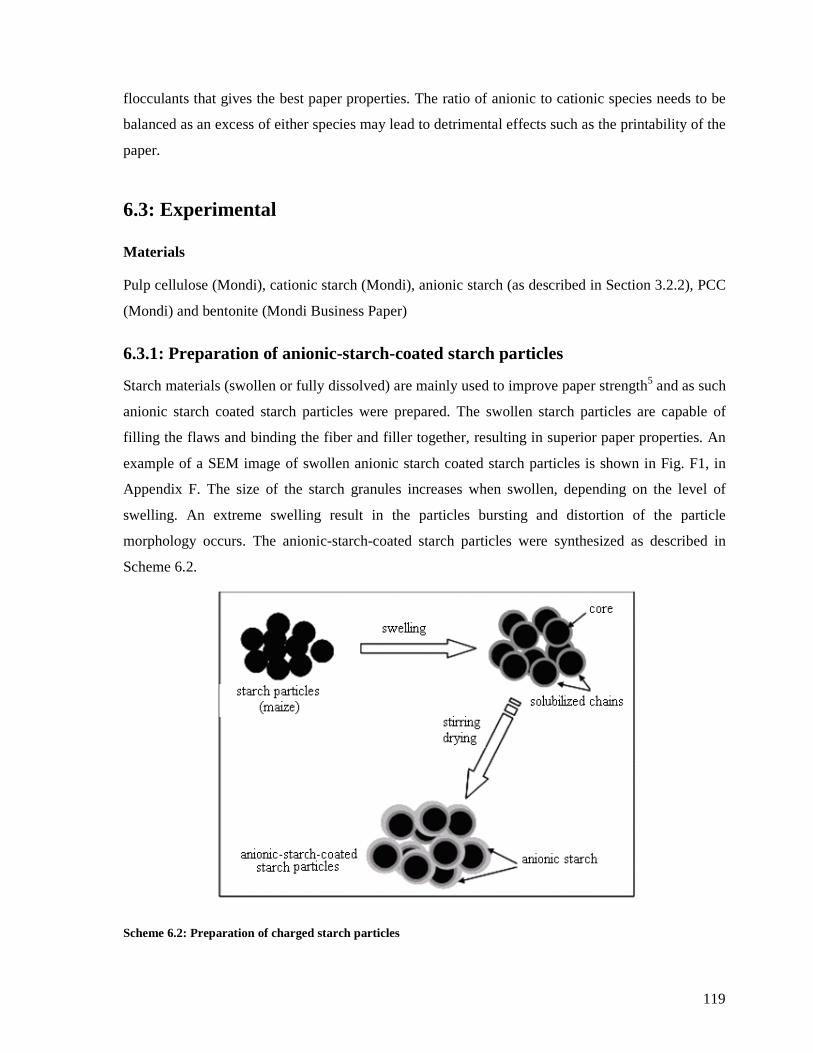
119
flocculants that gives the best paper properties. The ratio of anionic to cationic species needs to be
balanced as an excess of either species may lead to detrimental effects such as the printability of the
paper.
6.3: Experimental
Materials
Pulp cellulose (Mondi), cationic starch (Mondi), anionic starch (as described in Section 3.2.2), PCC
(Mondi) and bentonite (Mondi Business Paper)
6.3.1: Preparation of anionic-starch-coated starch particles
Starch materials (swollen or fully dissolved) are mainly used to improve paper strength5 and as such
anionic starch coated starch particles were prepared. The swollen starch particles are capable of
filling the flaws and binding the fiber and filler together, resulting in superior paper properties. An
example of a SEM image of swollen anionic starch coated starch particles is shown in Fig. F1, in
Appendix F. The size of the starch granules increases when swollen, depending on the level of
swelling. An extreme swelling result in the particles bursting and distortion of the particle
morphology occurs. The anionic-starch-coated starch particles were synthesized as described in
Scheme 6.2.
Scheme 6.2: Preparation of charged starch particles
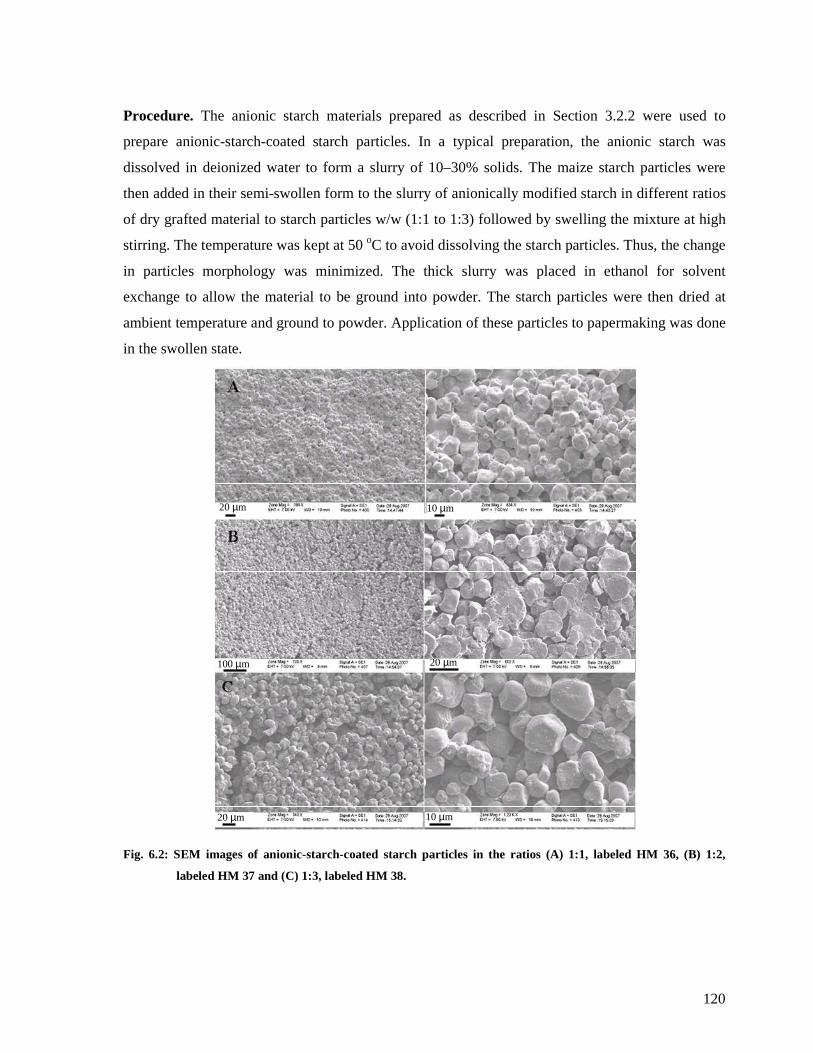
120
Procedure. The anionic starch materials prepared as described in Section 3.2.2 were used to
prepare anionic-starch-coated starch particles. In a typical preparation, the anionic starch was
dissolved in deionized water to form a slurry of 10–30% solids. The maize starch particles were
then added in their semi-swollen form to the slurry of anionically modified starch in different ratios
of dry grafted material to starch particles w/w (1:1 to 1:3) followed by swelling the mixture at high
stirring. The temperature was kept at 50 oC to avoid dissolving the starch particles. Thus, the change
in particles morphology was minimized. The thick slurry was placed in ethanol for solvent
exchange to allow the material to be ground into powder. The starch particles were then dried at
ambient temperature and ground to powder. Application of these particles to papermaking was done
in the swollen state.
Fig. 6.2: SEM images of anionic-starch-coated starch particles in the ratios (A) 1:1, labeled HM 36, (B) 1:2,
labeled HM 37 and (C) 1:3, labeled HM 38.
20 µm 10 µm
100 µm 20 µm
20 µm 10 µm
20 µm 10 µm
100 µm 20 µm
20 µm 10 µm
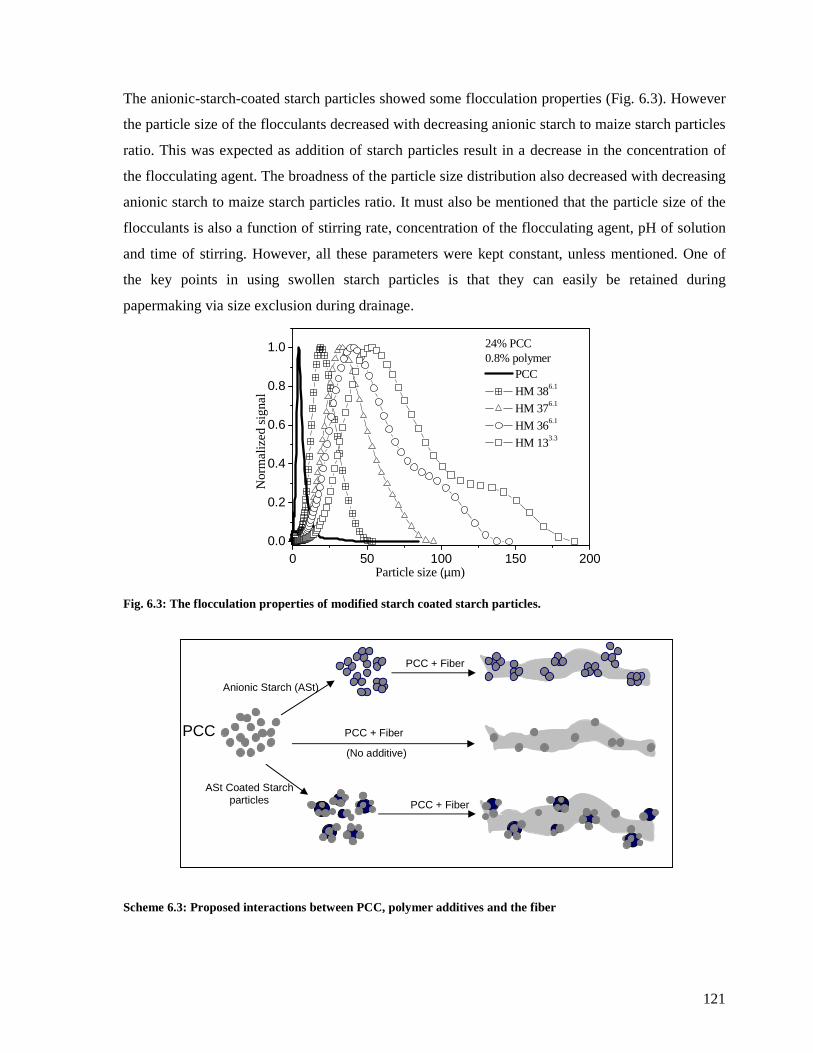
121
The anionic-starch-coated starch particles showed some flocculation properties (Fig. 6.3). However
the particle size of the flocculants decreased with decreasing anionic starch to maize starch particles
ratio. This was expected as addition of starch particles result in a decrease in the concentration of
the flocculating agent. The broadness of the particle size distribution also decreased with decreasing
anionic starch to maize starch particles ratio. It must also be mentioned that the particle size of the
flocculants is also a function of stirring rate, concentration of the flocculating agent, pH of solution
and time of stirring. However, all these parameters were kept constant, unless mentioned. One of
the key points in using swollen starch particles is that they can easily be retained during
papermaking via size exclusion during drainage.
Fig. 6.3: The flocculation properties of modified starch coated starch particles.
Scheme 6.3: Proposed interactions between PCC, polymer additives and the fiber
0 50 100 150 2000.0
0.2
0.4
0.6
0.8
1.0
Particle size (µm)
Nor
ma
lize
d si
gna
l
PCC
HM 386.1
HM 376.1
HM 366.1
HM 133.3
24% PCC0.8% polymer
PCC
Anionic Starch (ASt)
ASt Coated Starch particles
(No additive)
PCC + Fiber
PCC + Fiber
PCC + Fiber
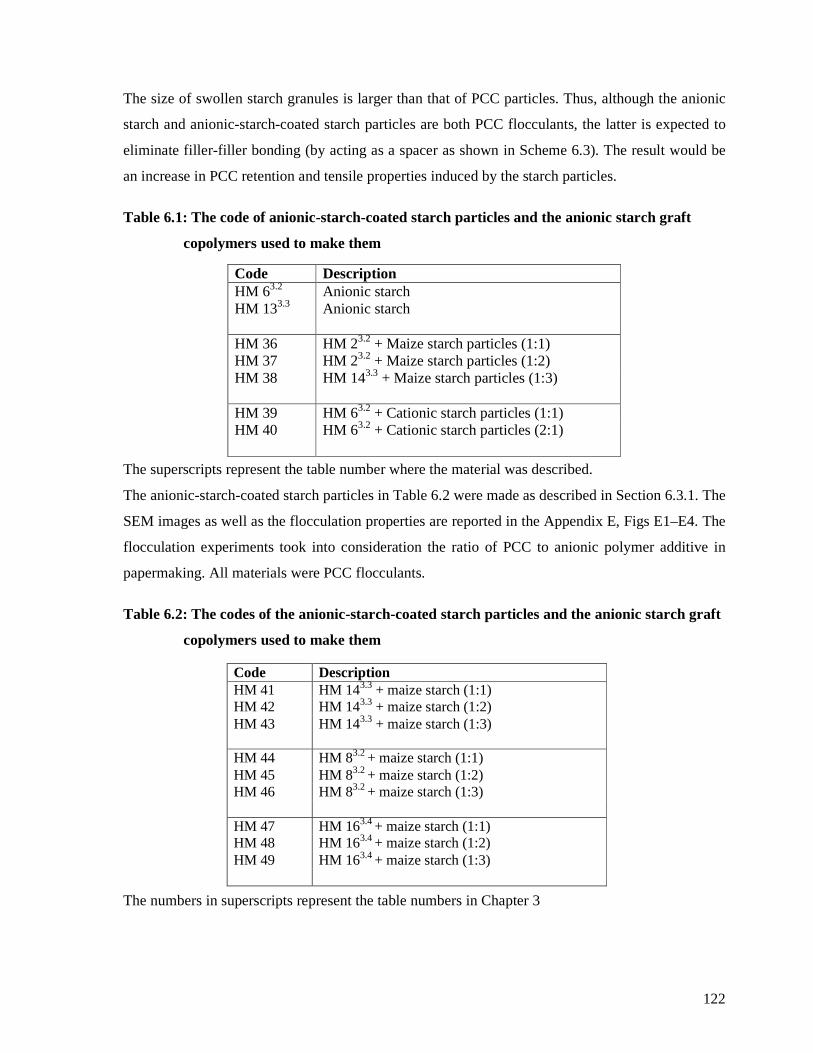
122
The size of swollen starch granules is larger than that of PCC particles. Thus, although the anionic
starch and anionic-starch-coated starch particles are both PCC flocculants, the latter is expected to
eliminate filler-filler bonding (by acting as a spacer as shown in Scheme 6.3). The result would be
an increase in PCC retention and tensile properties induced by the starch particles.
Table 6.1: The code of anionic-starch-coated starch particles and the anionic starch graft
copolymers used to make them
Code Description HM 63.2 Anionic starch HM 133.3 Anionic starch
HM 36 HM 23.2 + Maize starch particles (1:1) HM 37 HM 23.2 + Maize starch particles (1:2) HM 38 HM 143.3 + Maize starch particles (1:3)
HM 39 HM 63.2 + Cationic starch particles (1:1) HM 40 HM 63.2 + Cationic starch particles (2:1)
The superscripts represent the table number where the material was described.
The anionic-starch-coated starch particles in Table 6.2 were made as described in Section 6.3.1. The
SEM images as well as the flocculation properties are reported in the Appendix E, Figs E1–E4. The
flocculation experiments took into consideration the ratio of PCC to anionic polymer additive in
papermaking. All materials were PCC flocculants.
Table 6.2: The codes of the anionic-starch-coated starch particles and the anionic starch graft
copolymers used to make them
Code Description HM 41 HM 143.3 + maize starch (1:1) HM 42 HM 143.3 + maize starch (1:2) HM 43 HM 143.3 + maize starch (1:3) HM 44 HM 83.2 + maize starch (1:1) HM 45 HM 83.2 + maize starch (1:2) HM 46 HM 83.2 + maize starch (1:3) HM 47 HM 163.4 + maize starch (1:1) HM 48 HM 163.4 + maize starch (1:2) HM 49 HM 163.4 + maize starch (1:3)
The numbers in superscripts represent the table numbers in Chapter 3
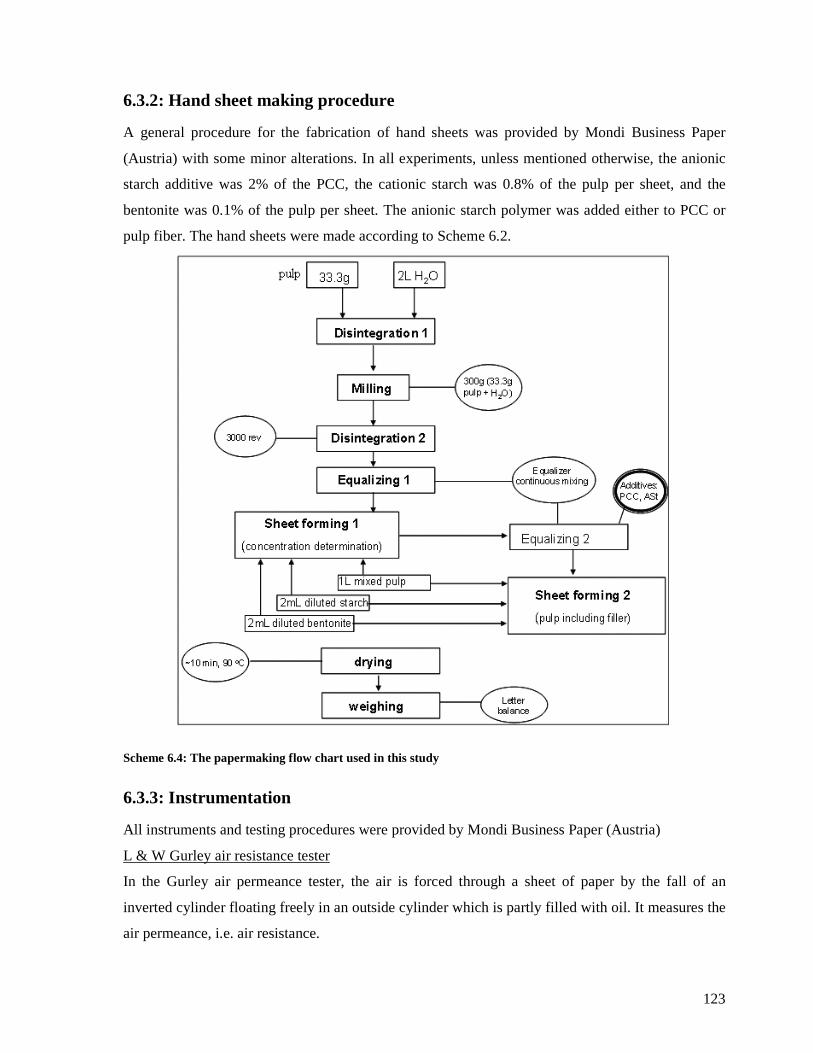
123
6.3.2: Hand sheet making procedure
A general procedure for the fabrication of hand sheets was provided by Mondi Business Paper
(Austria) with some minor alterations. In all experiments, unless mentioned otherwise, the anionic
starch additive was 2% of the PCC, the cationic starch was 0.8% of the pulp per sheet, and the
bentonite was 0.1% of the pulp per sheet. The anionic starch polymer was added either to PCC or
pulp fiber. The hand sheets were made according to Scheme 6.2.
Scheme 6.4: The papermaking flow chart used in this study
6.3.3: Instrumentation
All instruments and testing procedures were provided by Mondi Business Paper (Austria)
L & W Gurley air resistance tester
In the Gurley air permeance tester, the air is forced through a sheet of paper by the fall of an
inverted cylinder floating freely in an outside cylinder which is partly filled with oil. It measures the
air permeance, i.e. air resistance.
124
“Canadian Standard” freeness tester
The tester is designed to provide a measure of the rate at which a dilute pulp suspension may be de-
watered. The Canadian Standard Freeness (CSF) is related to the surface condition and swelling of
fibers. The CSF gives a useful index of the amount of mechanical treatment to which the pulp was
subjected to. Increasing fiber refining level results in a decrease in the CSF. The CSF is also
referred to as ‘drainability’ and is designed to provide a measure of the rate at which a dilute
suspension of pulp can be dewatered.
Bendtsen porosity tester
This instrument measures air permeability (i.e. the flow rate of air through a sheet of paper) at 23 ±
3 oC.
Bursting strength tester
A test piece is placed over a circular diaphragm and rigidly clamped at the periphery but is free to
bulge with the diaphragm. Hydraulic fluid is then pumped at a constant rate, bulging the diaphragm
until the test piece ruptures. Thus the bursting strength of the test piece is the maximum value of the
applied hydraulic pressure at rupture (KPa).
Micrometer (L & W)
The micrometer was used to measure the thickness of the hand sheets.
L & W stiffness tester
This instrument measures the force required to bend a test piece at one end through a given angle.
The force is applied at a constant distance from the time of clamping. Stiffness is the degree of
resistance offered by paper when it is bending under specified conditions.
Alwetron TH1 (computerized) tensile strength tester
For this test the test pieces are cut using a sample cutter D054. The instrument measures the tensile
strength, stretch and tensile energy absorption.
Tensile strength is the maximum tensile force per unit width that a test piece of paper will withstand
before breaking (KN/m).
Stretch is the ratio of the increase in length of the test piece of paper at the moment when maximum
tensile force is reached to its original length before test, expressed as a percentage.
Tensile energy absorption is the total work done per unit area of the paper when stretching it to
rupture (J/m2).
Drainage is the time taken by water to pass through the sieve during papermaking and depends on
the fiber refining and flocculation, as well as filler content (s).
125
6.4: Results and discussion
6.4.1: Effect of fiber refining on paper properties
A study on the effect of fiber refining on the properties of both unfilled (no filler) and filled (filler
added) paper properties was carried out. The results thereof are reported in Sections 6.4.1.1–6.4.1.3
and all the figures are in Appendix H.
6.4.1.1: Fiber refining
The fiber was refined at various revolutions (rev) from 0 rev. (no refining) up to 6000 rev. Fiber
refining changes the morphology of the fiber. As the refining revolutions are increased, the fibers
collapse and fibrillation occurs. At high revolutions total collapsing of the fiber with more
fibrillation will occur. Fig. H1 (Appendix H) shows that the fibrillation (fiber damage) and
collapsing increases with increasing revolutions. Fiber fibrillation and collapsing is essential as it
affects most of the properties of paper. Thus, the fiber refining process results in an increase in
surface area for fiber-fiber and fiber filler interactions.
6.4.1.2: The effect of fiber refining on unfilled paper properties
Fig. H2 (Appendix H) shows the effect of fiber refining on the CSF and the drainage during hand
sheet making. The CSF decreases whilst the drainage increases with increasing fiber refining. The
apparent sheet density of unfilled hand sheets increased with increasing fiber refining (Fig. H2B),
indicating that the sheet became thinner with increasing fiber refining. Thus, the unfilled paper loses
its bulkiness with increasing refining, which is not desired. Fig. H2C shows that there was an
increase in the burst index, stretch and tensile stiffness with increasing refining, which is desired in
most paper grades. The tensile energy absorption also increased with increasing fiber refining,
meaning that the paper strength also increased with increasing fiber refining. The Gurley porosity
and Bendtsen smoothness also improved with increasing fiber refining (Fig. H2D). However, the
trend obtained for bending stiffness was different from the other properties. Maximum bending
stiffness was obtained at 500 rev., after which it decreased and leveled out. Since fiber refining
results in fibers collapsing and fibrillation, ultimately, due to these effects, the surface area for fiber-
fiber interaction increases. An increase in the surface area for interactions favors most of the desired
paper properties except the bending stiffness. This is partially because the thickness of the paper
decreases with increasing refining, as shown in Fig. H3. The results of this study show that the
126
intrinsic properties of fiber have less effect on the bending stiffness of the paper but on the other
properties.
6.4.1.3: The effect of fiber refining on filled paper properties
There was no anionic starch polymer added in these hand sheets and the curves serve as
controls/references. The grammage of the hand sheets are shown in Fig. G1 in Appendix G. The
effect of fiber refining was studied at three different PCC loadings. The drainage (not shown)
decreased with increasing PCC loading and increased with increasing fiber refining. Fig. H4
(Appendix H) shows the effect of increasing the fiber refining level on the thickness of hand sheets.
In the case of unfilled hand sheets, increasing fiber refining resulted in a decrease in the thickness of
the hand sheets. The plot of retention versus PCC loading for hand sheets made with fiber refined at
3000 rev. and 0 rev. have PCC retention values in the expected range for no retention aids. The
hand sheets made with fiber refined at 1000 rev. however had unexpected better retention. The
thickness of the hand sheets was mainly a function of fiber refining rather than the PCC loading.
Fig. H5 shows that increasing fiber refining resulted in an increase in the apparent sheet density (i.e.
reduction in the bulkiness of the hand sheets). The burst index and the apparent sheet density
increased with increasing fiber refining, and slightly decreased with increasing filler loading, as
shown in Fig. H5. The same trend was observed for the tensile index and stretch, as shown in Fig.
H5. The Gurley air resistance and the Bendtsen smoothness improved with increasing refining and
generally did not change much with increasing PCC loading, as shown in Fig. H5. The bending
stiffness improved with increasing levels of fiber refining and decreased with increasing PCC
loading (Fig. H5). An increase in the properties of paper with refining was attributed to the
increased fiber-fiber as well as increased fiber-filler interactions, and a decrease in the properties
with PCC loading was mainly due to disruption of fiber-fiber interactions caused by the presence of
filler (PCC). The bending stiffness also increased with increasing fiber refining regardless of a
decrease in the apparent sheet density. This was in contrast to what was observed for the unfilled
paper (Fig. H2), where an increase in fiber refining did not lead to an increase in the bending
stiffness throughout the entire refining range used. Another factor introduced for filled paper is the
effect of fiber-filler interactions on the bending stiffness. In this case, increasing fiber-filler
interaction (by increasing the level of fiber refining) resulted in an increase in bending stiffness.
127
6.4.2: The effect of anionically modified polysaccharides on filled paper
properties
The modified starches were added to PCC and then the treated pulp was mixed with the pulp. In
general, most of the properties of paper made with the flocculation aid were more or less the same
as the control, as shown in Table 6.3. The polymeric additives HM 283.6, HM 163.4 and HM 173.4
gave better retention at all PCC loadings compared to the control whereas the polymeric additives
HM 13.2, HM 153.4 and HM 273.6 gave PCC retention values that were lower than the control. The
stiffness of paper to which anionic polymeric additives were added was better than the control,
especially at 20% filler loading. Thus, although the materials HM 13.2 HM 153.4 and HM 273.6
showed flocculation capability, their performance in papermaking was poor. The reason for low
PCC retention for HM 153.4 and HM 273.6 was ineffective flocculation of PCC due to low % G.
Polymeric additive HM 173.4 gave good PCC retention at both 25 and 30% PCC loading. However,
the porosity of the resulting paper was higher than that of the control paper. The bending stiffness of
paper made with HM 173.4 was better than that of the control paper with the other properties being
more or less similar to that of the control paper as shown in Table 6.3. When HM 163.4 (acrylic acid
and acrylamide graft copolymerized on potato starch) was used as additive, the resulting paper had
good PCC retention at 25 and 30% PCC loading. Furthermore, the bending stiffness was the best of
all the additives used and the other properties were similar to the control paper. Factors that affect
PCC retention include the size of PCC flocculants which decreases with an increase in the volume
of water added to PCC, i.e. after the equalizing 1 stage (Scheme 6.4). The later tests were done by
adding a constant volume of water (300 mL) to PCC to effectively flocculate PCC, and the rest of
the water for equalization was added directly to pulp. Furthermore, the effect of fiber refining on the
properties of paper is investigated in the later tests.
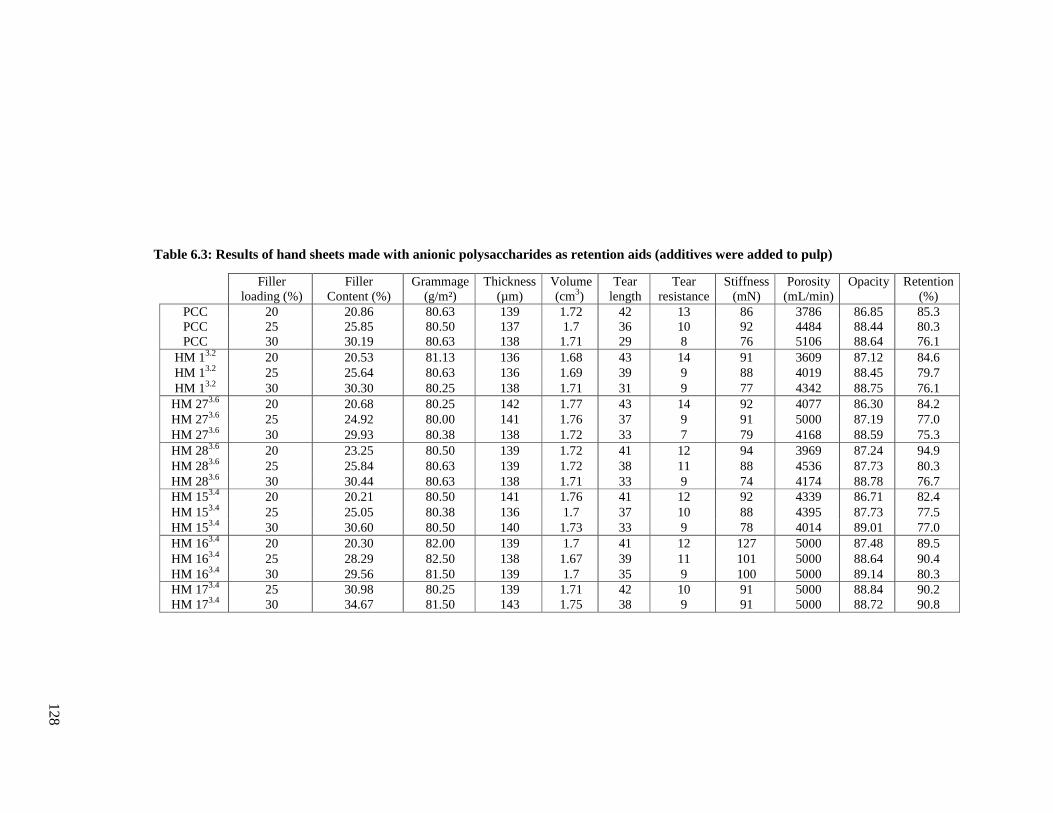
1
28
Table 6.3: R
esults of hand sheets made w
ith anionic starch m
aterials as additives
Table 6.3: Results of hand sheets made with anionic polysaccharides as retention aids (additives were added to pulp)
Filler Filler Grammage Thickness Volume Tear Tear Stiffness Porosity Opacity Retention loading (%) Content (%) (g/m²) (µm) (cm3) length resistance (mN) (mL/min) (%)
PCC 20 20.86 80.63 139 1.72 42 13 86 3786 86.85 85.3 PCC 25 25.85 80.50 137 1.7 36 10 92 4484 88.44 80.3 PCC 30 30.19 80.63 138 1.71 29 8 76 5106 88.64 76.1
HM 13.2 20 20.53 81.13 136 1.68 43 14 91 3609 87.12 84.6 HM 13.2 25 25.64 80.63 136 1.69 39 9 88 4019 88.45 79.7 HM 13.2 30 30.30 80.25 138 1.71 31 9 77 4342 88.75 76.1 HM 273.6 20 20.68 80.25 142 1.77 43 14 92 4077 86.30 84.2 HM 273.6 25 24.92 80.00 141 1.76 37 9 91 5000 87.19 77.0 HM 273.6 30 29.93 80.38 138 1.72 33 7 79 4168 88.59 75.3 HM 283.6 20 23.25 80.50 139 1.72 41 12 94 3969 87.24 94.9 HM 283.6 25 25.84 80.63 139 1.72 38 11 88 4536 87.73 80.3 HM 283.6 30 30.44 80.63 138 1.71 33 9 74 4174 88.78 76.7 HM 153.4 20 20.21 80.50 141 1.76 41 12 92 4339 86.71 82.4 HM 153.4 25 25.05 80.38 136 1.7 37 10 88 4395 87.73 77.5 HM 153.4 30 30.60 80.50 140 1.73 33 9 78 4014 89.01 77.0 HM 163.4 20 20.30 82.00 139 1.7 41 12 127 5000 87.48 89.5 HM 163.4 25 28.29 82.50 138 1.67 39 11 101 5000 88.64 90.4 HM 163.4 30 29.56 81.50 139 1.7 35 9 100 5000 89.14 80.3 HM 173.4 25 30.98 80.25 139 1.71 42 10 91 5000 88.84 90.2 HM 173.4 30 34.67 81.50 143 1.75 38 9 91 5000 88.72 90.8
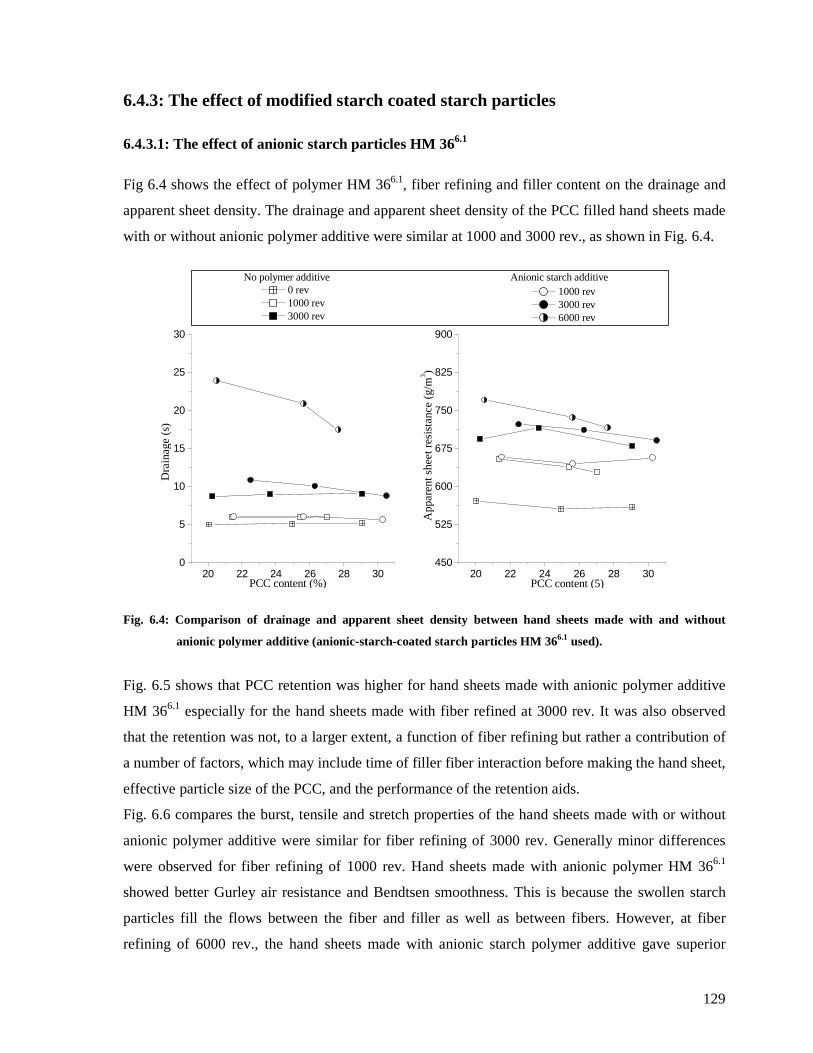
129
6.4.3: The effect of modified starch coated starch particles
6.4.3.1: The effect of anionic starch particles HM 366.1
Fig 6.4 shows the effect of polymer HM 366.1, fiber refining and filler content on the drainage and
apparent sheet density. The drainage and apparent sheet density of the PCC filled hand sheets made
with or without anionic polymer additive were similar at 1000 and 3000 rev., as shown in Fig. 6.4.
Fig. 6.4: Comparison of drainage and apparent sheet density between hand sheets made with and without
anionic polymer additive (anionic-starch-coated starch particles HM 366.1 used).
Fig. 6.5 shows that PCC retention was higher for hand sheets made with anionic polymer additive
HM 366.1 especially for the hand sheets made with fiber refined at 3000 rev. It was also observed
that the retention was not, to a larger extent, a function of fiber refining but rather a contribution of
a number of factors, which may include time of filler fiber interaction before making the hand sheet,
effective particle size of the PCC, and the performance of the retention aids.
Fig. 6.6 compares the burst, tensile and stretch properties of the hand sheets made with or without
anionic polymer additive were similar for fiber refining of 3000 rev. Generally minor differences
were observed for fiber refining of 1000 rev. Hand sheets made with anionic polymer HM 366.1
showed better Gurley air resistance and Bendtsen smoothness. This is because the swollen starch
particles fill the flows between the fiber and filler as well as between fibers. However, at fiber
refining of 6000 rev., the hand sheets made with anionic starch polymer additive gave superior
20 22 24 26 28 300
5
10
15
20
25
30
0 rev 1000 rev 3000 rev
PCC content (%)
Dra
inag
e (
s)
20 22 24 26 28 30450
525
600
675
750
825
900
Anionic starch additive 1000 rev 3000 rev 6000 rev
PCC content (5)
App
are
nt s
hee
t res
ista
nce
(g/
m3 )
No polymer additive
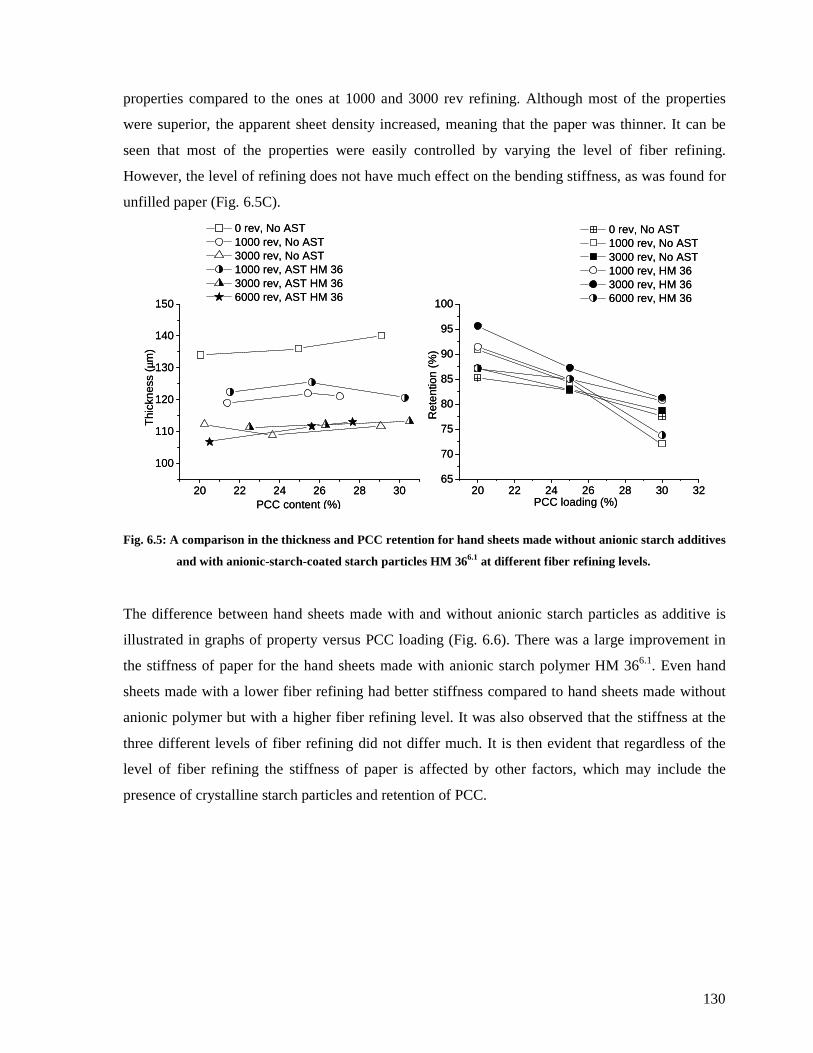
130
properties compared to the ones at 1000 and 3000 rev refining. Although most of the properties
were superior, the apparent sheet density increased, meaning that the paper was thinner. It can be
seen that most of the properties were easily controlled by varying the level of fiber refining.
However, the level of refining does not have much effect on the bending stiffness, as was found for
unfilled paper (Fig. 6.5C).
Fig. 6.5: A comparison in the thickness and PCC retention for hand sheets made without anionic starch additives
and with anionic-starch-coated starch particles HM 366.1 at different fiber refining levels.
The difference between hand sheets made with and without anionic starch particles as additive is
illustrated in graphs of property versus PCC loading (Fig. 6.6). There was a large improvement in
the stiffness of paper for the hand sheets made with anionic starch polymer HM 366.1. Even hand
sheets made with a lower fiber refining had better stiffness compared to hand sheets made without
anionic polymer but with a higher fiber refining level. It was also observed that the stiffness at the
three different levels of fiber refining did not differ much. It is then evident that regardless of the
level of fiber refining the stiffness of paper is affected by other factors, which may include the
presence of crystalline starch particles and retention of PCC.
20 22 24 26 28 30
100
110
120
130
140
150
Thi
ckne
ss (
µm)
PCC content (%)
0 rev, No AST 1000 rev, No AST 3000 rev, No AST 1000 rev, AST HM 36 3000 rev, AST HM 36 6000 rev, AST HM 36
20 22 24 26 28 30 3265
70
75
80
85
90
95
100
Ret
entio
n (%
)
PCC loading (%)
0 rev, No AST 1000 rev, No AST 3000 rev, No AST 1000 rev, HM 36 3000 rev, HM 36 6000 rev, HM 36
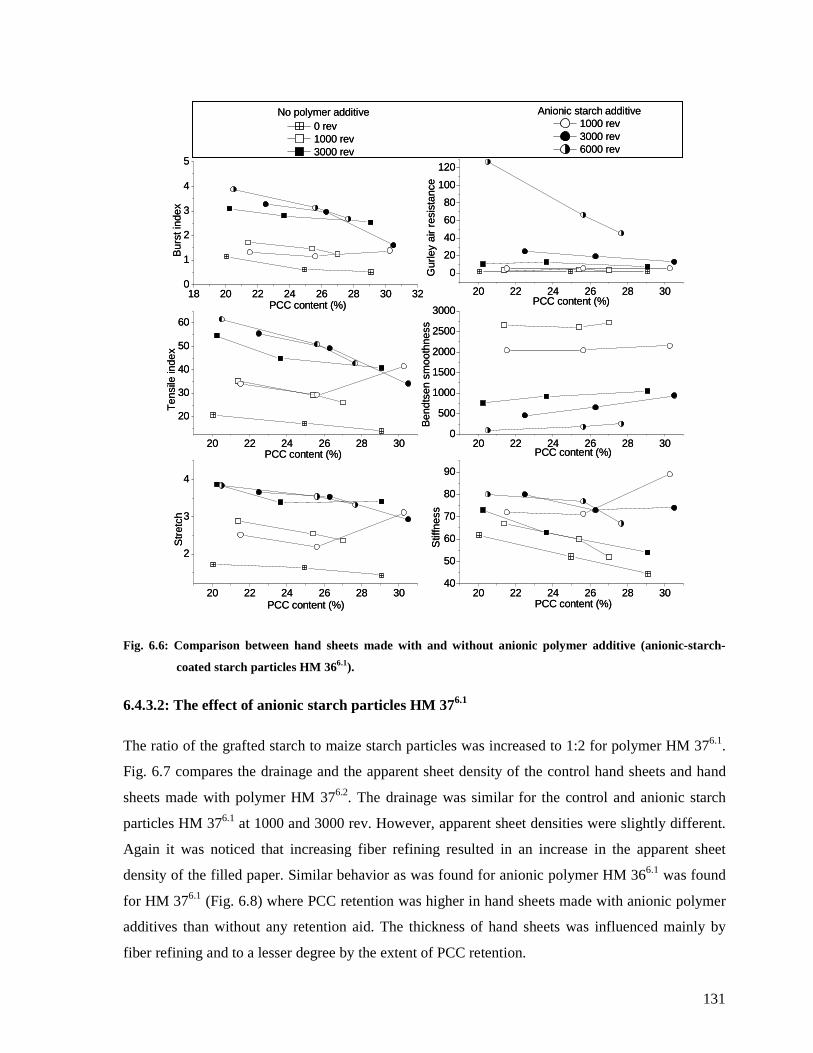
131
Fig. 6.6: Comparison between hand sheets made with and without anionic polymer additive (anionic-starch-
coated starch particles HM 366.1).
6.4.3.2: The effect of anionic starch particles HM 376.1
The ratio of the grafted starch to maize starch particles was increased to 1:2 for polymer HM 376.1.
Fig. 6.7 compares the drainage and the apparent sheet density of the control hand sheets and hand
sheets made with polymer HM 376.2. The drainage was similar for the control and anionic starch
particles HM 376.1 at 1000 and 3000 rev. However, apparent sheet densities were slightly different.
Again it was noticed that increasing fiber refining resulted in an increase in the apparent sheet
density of the filled paper. Similar behavior as was found for anionic polymer HM 366.1 was found
for HM 376.1 (Fig. 6.8) where PCC retention was higher in hand sheets made with anionic polymer
additives than without any retention aid. The thickness of hand sheets was influenced mainly by
fiber refining and to a lesser degree by the extent of PCC retention.
18 20 22 24 26 28 30 320
1
2
3
4
5
0 rev 1000 rev 3000 rev
PCC content (%)
Bur
st in
dex
20 22 24 26 28 30
0
20
40
60
80
100
120
1000 rev 3000 rev 6000 rev
PCC content (%)
Gur
ley
air
resi
stan
ce
No polymer additive Anionic starch additive
20 22 24 26 28 30
20
30
40
50
60
PCC content (%)
Ten
sile
inde
x
20 22 24 26 28 300
500
1000
1500
2000
2500
3000
PCC content (%)
Ben
dtse
n sm
ooth
ness
20 22 24 26 28 30
2
3
4
Str
etch
PCC content (%)20 22 24 26 28 30
40
50
60
70
80
90
PCC content (%)
Stif
fnes
s
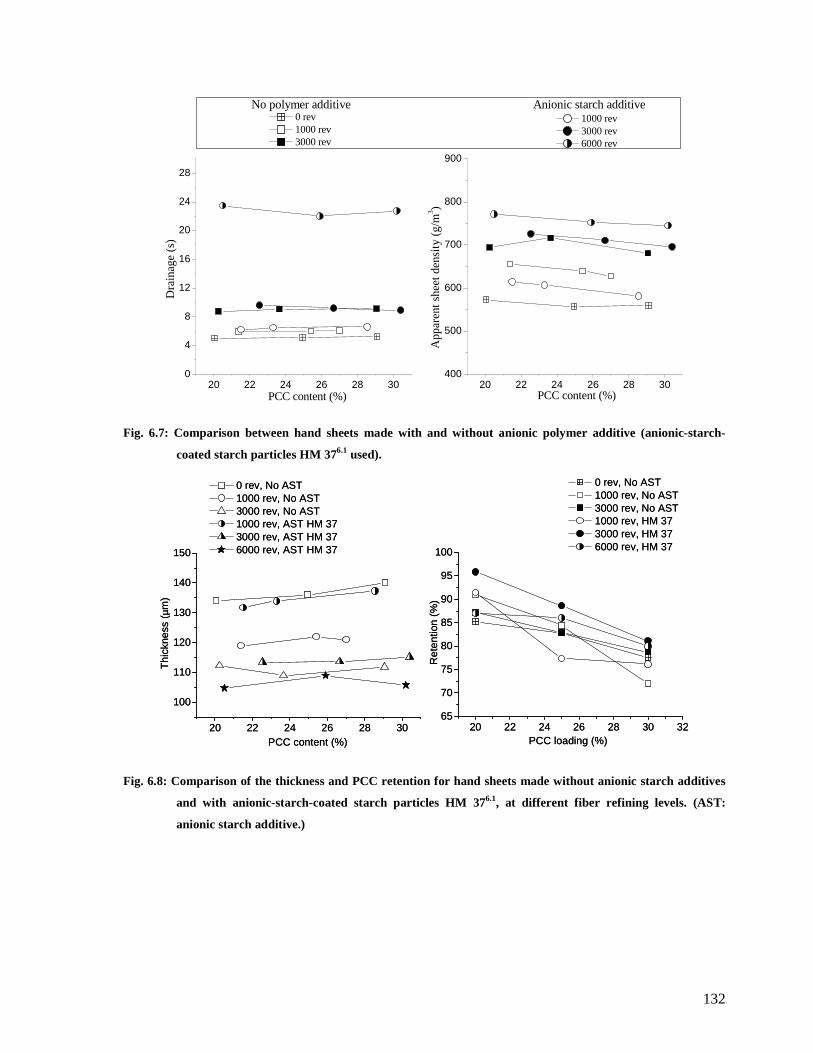
132
Fig. 6.7: Comparison between hand sheets made with and without anionic polymer additive (anionic-starch-
coated starch particles HM 376.1 used).
Fig. 6.8: Comparison of the thickness and PCC retention for hand sheets made without anionic starch additives
and with anionic-starch-coated starch particles HM 376.1, at different fiber refining levels. (AST:
anionic starch additive.)
20 22 24 26 28 300
4
8
12
16
20
24
28
PCC content (%)
Dra
inag
e (s
)
0 rev 1000 rev 3000 rev
1000 rev 3000 rev 6000 rev
Anionic starch additiveNo polymer additive
20 22 24 26 28 30400
500
600
700
800
900
App
aren
t sh
eet
dens
ity (
g/m
3 )
PCC content (%)
20 22 24 26 28 30
100
110
120
130
140
150
0 rev, No AST 1000 rev, No AST 3000 rev, No AST 1000 rev, AST HM 37 3000 rev, AST HM 37 6000 rev, AST HM 37
PCC content (%)
Thi
ckne
ss (
µm)
20 22 24 26 28 30 3265
70
75
80
85
90
95
100
0 rev, No AST 1000 rev, No AST 3000 rev, No AST 1000 rev, HM 37 3000 rev, HM 37 6000 rev, HM 37
Ret
entio
n (%
)
PCC loading (%)20 22 24 26 28 30
100
110
120
130
140
150
0 rev, No AST 1000 rev, No AST 3000 rev, No AST 1000 rev, AST HM 37 3000 rev, AST HM 37 6000 rev, AST HM 37
PCC content (%)
Thi
ckne
ss (
µm)
20 22 24 26 28 30 3265
70
75
80
85
90
95
100
0 rev, No AST 1000 rev, No AST 3000 rev, No AST 1000 rev, HM 37 3000 rev, HM 37 6000 rev, HM 37
Ret
entio
n (%
)
PCC loading (%)
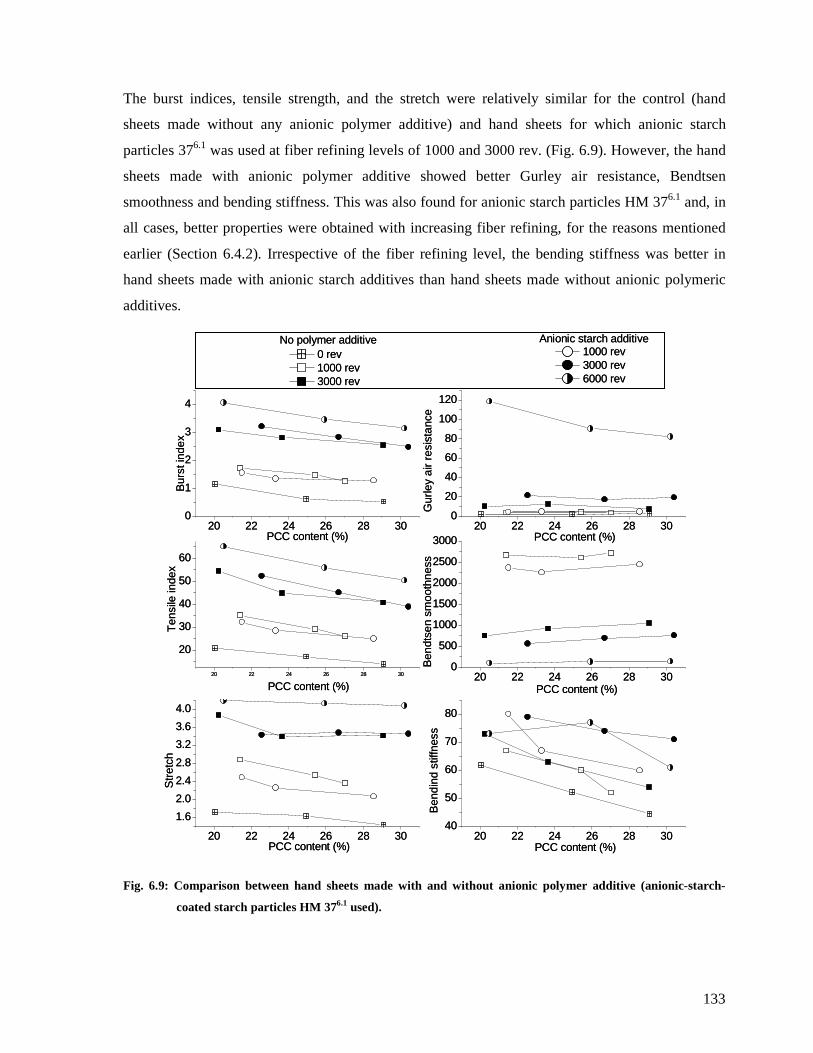
133
The burst indices, tensile strength, and the stretch were relatively similar for the control (hand
sheets made without any anionic polymer additive) and hand sheets for which anionic starch
particles 376.1 was used at fiber refining levels of 1000 and 3000 rev. (Fig. 6.9). However, the hand
sheets made with anionic polymer additive showed better Gurley air resistance, Bendtsen
smoothness and bending stiffness. This was also found for anionic starch particles HM 376.1 and, in
all cases, better properties were obtained with increasing fiber refining, for the reasons mentioned
earlier (Section 6.4.2). Irrespective of the fiber refining level, the bending stiffness was better in
hand sheets made with anionic starch additives than hand sheets made without anionic polymeric
additives.
Fig. 6.9: Comparison between hand sheets made with and without anionic polymer additive (anionic-starch-
coated starch particles HM 376.1 used).
20 22 24 26 28 300
1
2
3
4
PCC content (%)20 22 24 26 28 30
0
20
40
60
80
100
120
PCC content (%)
Gur
ley
air
resi
stan
ce
1000 rev 3000 rev 6000 rev
Anionic starch additive 0 rev 1000 rev 3000 rev
No polymer additive
20 22 24 26 28 30
20
30
40
50
60
PCC content (%)
Bur
st in
dex
20 22 24 26 28 300
500
1000
1500
2000
2500
3000
PCC content (%)
Ben
dtse
n sm
ooth
ness
20 22 24 26 28 30
1.6
2.0
2.4
2.8
3.2
3.6
4.0
PCC content (%)
Ten
sile
inde
xS
tret
ch
20 22 24 26 28 3040
50
60
70
80
PCC content (%)
Ben
dind
stif
fnes
s
20 22 24 26 28 300
1
2
3
4
PCC content (%)20 22 24 26 28 30
0
20
40
60
80
100
120
PCC content (%)
Gur
ley
air
resi
stan
ce
1000 rev 3000 rev 6000 rev
Anionic starch additive 0 rev 1000 rev 3000 rev
No polymer additive
20 22 24 26 28 30
20
30
40
50
60
PCC content (%)
Bur
st in
dex
20 22 24 26 28 300
500
1000
1500
2000
2500
3000
PCC content (%)
Ben
dtse
n sm
ooth
ness
20 22 24 26 28 30
1.6
2.0
2.4
2.8
3.2
3.6
4.0
PCC content (%)
Ten
sile
inde
xS
tret
ch
20 22 24 26 28 3040
50
60
70
80
PCC content (%)
Ben
dind
stif
fnes
s
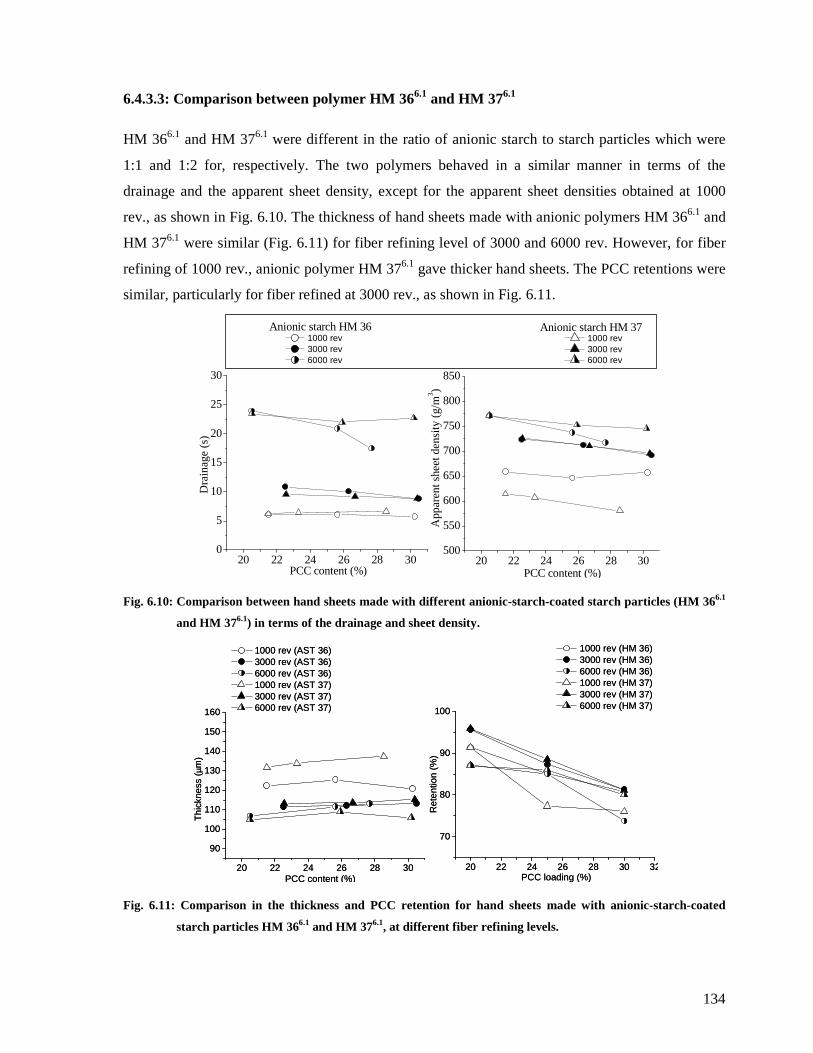
134
6.4.3.3: Comparison between polymer HM 366.1 and HM 376.1
HM 366.1 and HM 376.1 were different in the ratio of anionic starch to starch particles which were
1:1 and 1:2 for, respectively. The two polymers behaved in a similar manner in terms of the
drainage and the apparent sheet density, except for the apparent sheet densities obtained at 1000
rev., as shown in Fig. 6.10. The thickness of hand sheets made with anionic polymers HM 366.1 and
HM 376.1 were similar (Fig. 6.11) for fiber refining level of 3000 and 6000 rev. However, for fiber
refining of 1000 rev., anionic polymer HM 376.1 gave thicker hand sheets. The PCC retentions were
similar, particularly for fiber refined at 3000 rev., as shown in Fig. 6.11.
Fig. 6.10: Comparison between hand sheets made with different anionic-starch-coated starch particles (HM 366.1
and HM 376.1) in terms of the drainage and sheet density.
Fig. 6.11: Comparison in the thickness and PCC retention for hand sheets made with anionic-starch-coated
starch particles HM 366.1 and HM 376.1, at different fiber refining levels.
20 22 24 26 28 30
90
100
110
120
130
140
150
160
Thi
ckne
ss (
µm)
PCC content (%)
1000 rev (AST 36) 3000 rev (AST 36) 6000 rev (AST 36) 1000 rev (AST 37) 3000 rev (AST 37) 6000 rev (AST 37)
20 22 24 26 28 30 32
70
80
90
100
Ret
entio
n (%
)
PCC loading (%)
1000 rev (HM 36) 3000 rev (HM 36) 6000 rev (HM 36) 1000 rev (HM 37) 3000 rev (HM 37) 6000 rev (HM 37)
20 22 24 26 28 300
5
10
15
20
25
30
20 22 24 26 28 30500
550
600
650
700
750
800
850
1000 rev 3000 rev 6000 rev
Dra
inag
e (
s)
PCC content (%)
Anionic starch HM 37 1000 rev 3000 rev 6000 rev
App
aren
t she
et d
ens
ity (
g/m
3 )
PCC content (%)
Anionic starch HM 36
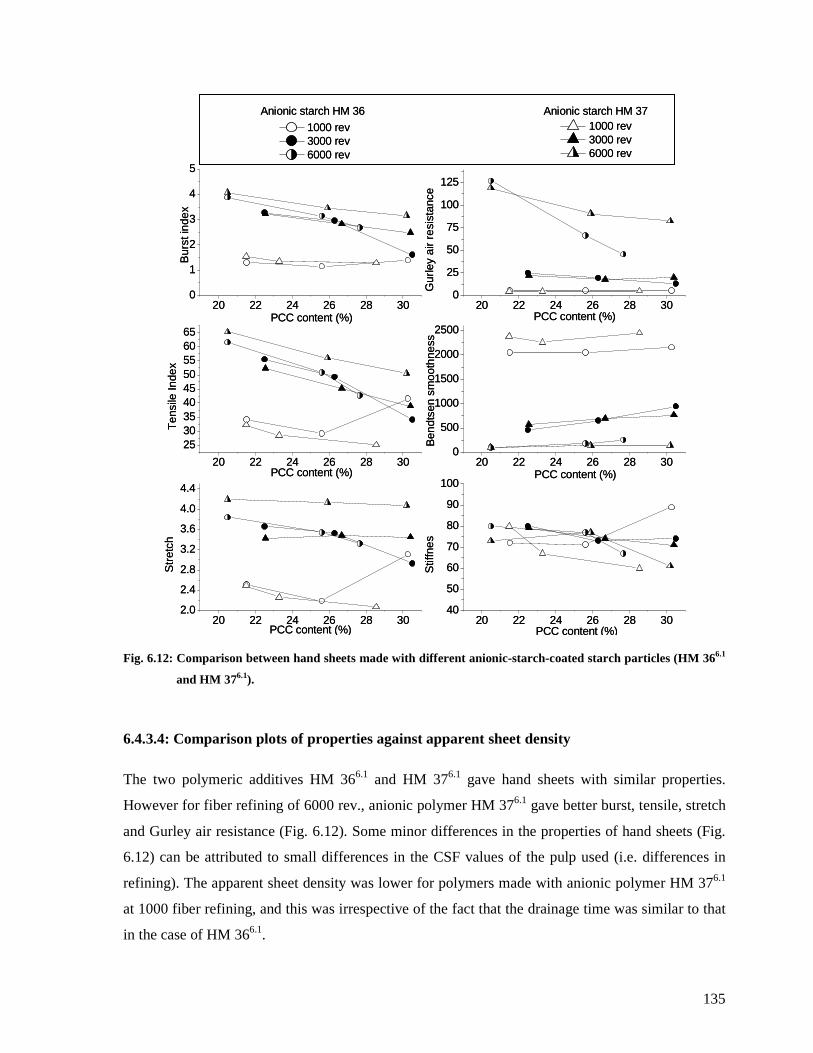
135
Fig. 6.12: Comparison between hand sheets made with different anionic-starch-coated starch particles (HM 366.1
and HM 376.1).
6.4.3.4: Comparison plots of properties against apparent sheet density
The two polymeric additives HM 366.1 and HM 376.1 gave hand sheets with similar properties.
However for fiber refining of 6000 rev., anionic polymer HM 376.1 gave better burst, tensile, stretch
and Gurley air resistance (Fig. 6.12). Some minor differences in the properties of hand sheets (Fig.
6.12) can be attributed to small differences in the CSF values of the pulp used (i.e. differences in
refining). The apparent sheet density was lower for polymers made with anionic polymer HM 376.1
at 1000 fiber refining, and this was irrespective of the fact that the drainage time was similar to that
in the case of HM 366.1.
20 22 24 26 28 300
1
2
3
4
5
Anionic starch HM 36 Anionic starch HM 37
1000 rev 3000 rev 6000 rev
PCC content (%)
Bur
st in
dex
20 22 24 26 28 300
25
50
75
100
125
1000 rev 3000 rev 6000 rev
PCC content (%)
Gur
ley
air
resi
stan
ce
20 22 24 26 28 30
253035404550556065
Ten
sile
Inde
x
20 22 24 26 28 300
500
1000
1500
2000
2500
PCC content (%) PCC content (%)
Ben
dtse
n sm
ooth
ness
20 22 24 26 28 302.0
2.4
2.8
3.2
3.6
4.0
4.4
PCC content (%)
Str
etch
20 22 24 26 28 3040
50
60
70
80
90
100
PCC content (%)
Stif
fnes
20 22 24 26 28 300
1
2
3
4
5
Anionic starch HM 36 Anionic starch HM 37
1000 rev 3000 rev 6000 rev
PCC content (%)
Bur
st in
dex
20 22 24 26 28 300
25
50
75
100
125
1000 rev 3000 rev 6000 rev
PCC content (%)
Gur
ley
air
resi
stan
ce
20 22 24 26 28 30
253035404550556065
Ten
sile
Inde
x
20 22 24 26 28 300
500
1000
1500
2000
2500
PCC content (%) PCC content (%)
Ben
dtse
n sm
ooth
ness
20 22 24 26 28 302.0
2.4
2.8
3.2
3.6
4.0
4.4
PCC content (%)
Str
etch
20 22 24 26 28 3040
50
60
70
80
90
100
PCC content (%)
Stif
fnes

136
Fig. 6.13: Change in properties of paper with apparent sheet density and fiber refining. (C.F: control sheets for
filled paper, i.e. paper made without anionic polymeric additive.)
The drainage increased with increasing fiber refining (Fig. 6.10A), however addition of PCC was
shown to reduce the apparent sheet density, i.e. the paper became more bulky even for fiber refined
at 6000 rev. when compared to the unfilled paper made with fiber refined at 6000 rev. At all levels
of fiber refining the drainage was lower for hand sheets made with filler when compared to the
drainage of hand sheets made without filler. The Gurley air resistance for PCC filled hand sheets
was lower compared to the hand sheets made without PCC, thus the addition of PCC reduces the
porosity of paper. From Fig. 6.13C, D, E and F it is evident that the addition of filler adversely
affects the properties of unfilled paper (see curves with black stars that represent the properties of
550 600 650 700 750
20
40
60
80
100
550 600 650 700 750 800 850
2
3
4
550 600 650 700 750 800 8500
1
2
3
4
5
6550 600 650 700 750 800 850
0
25
50
75
100
125
550 600 650 700 750 800 850
4
8
12
16
20
24
550 600 650 700 750 800
45
60
75
90
105
120
C
Ten
sile
inde
x
Apparent sheet density (g/m3) E
Str
etch
Apparent sheet density (g/m3)
D
Apparent sheet density (g/m3)
Ben
ding
stif
fnes
s
B
Gur
ley
air
resi
stan
ce
Apparent sheet density (g/m3)
0-3000 rev 0 rev, C.F 1000 rev, C.F 3000 rev, C.F 1000 HM 36
3000 HM 36 6000 HM 36 1000 HM 37 3000 HM 37 6000 HM 37
Dra
inag
e (s
)
Aparent sheet density (g/m3)
A
F
Bur
st in
dex
Apparent sheet density (g/m3)
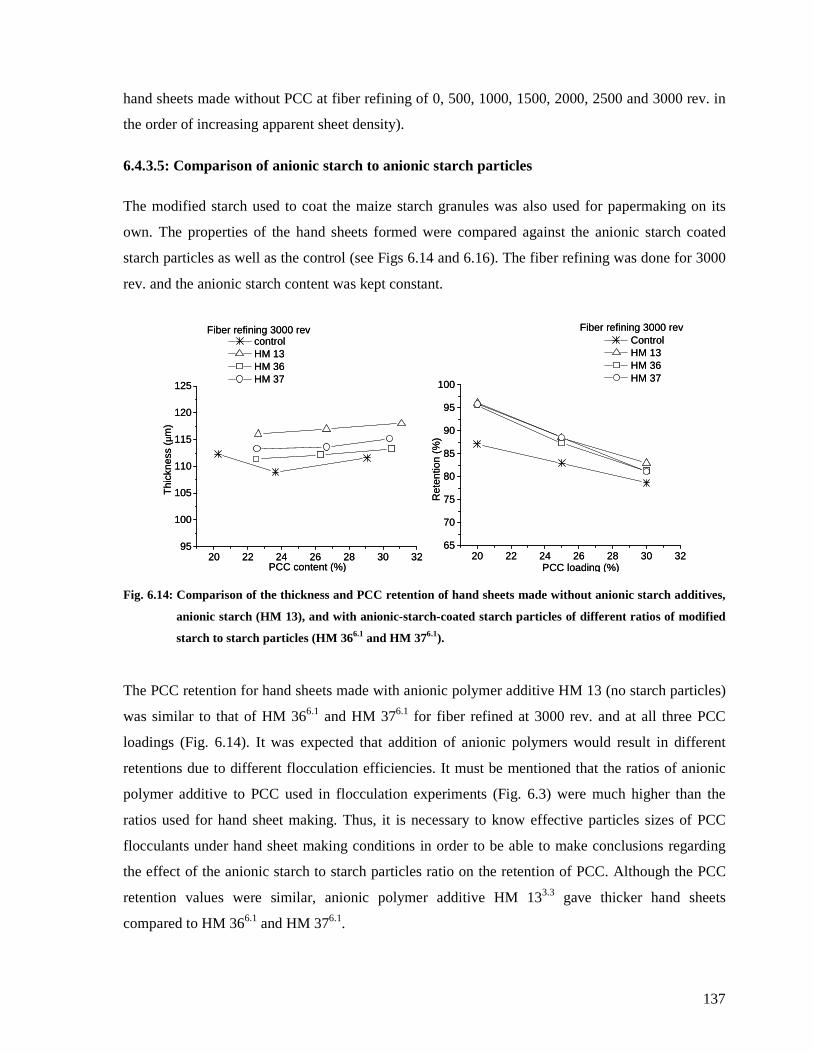
137
hand sheets made without PCC at fiber refining of 0, 500, 1000, 1500, 2000, 2500 and 3000 rev. in
the order of increasing apparent sheet density).
6.4.3.5: Comparison of anionic starch to anionic starch particles
The modified starch used to coat the maize starch granules was also used for papermaking on its
own. The properties of the hand sheets formed were compared against the anionic starch coated
starch particles as well as the control (see Figs 6.14 and 6.16). The fiber refining was done for 3000
rev. and the anionic starch content was kept constant.
Fig. 6.14: Comparison of the thickness and PCC retention of hand sheets made without anionic starch additives,
anionic starch (HM 13), and with anionic-starch-coated starch particles of different ratios of modified
starch to starch particles (HM 366.1 and HM 376.1).
The PCC retention for hand sheets made with anionic polymer additive HM 13 (no starch particles)
was similar to that of HM 366.1 and HM 376.1 for fiber refined at 3000 rev. and at all three PCC
loadings (Fig. 6.14). It was expected that addition of anionic polymers would result in different
retentions due to different flocculation efficiencies. It must be mentioned that the ratios of anionic
polymer additive to PCC used in flocculation experiments (Fig. 6.3) were much higher than the
ratios used for hand sheet making. Thus, it is necessary to know effective particles sizes of PCC
flocculants under hand sheet making conditions in order to be able to make conclusions regarding
the effect of the anionic starch to starch particles ratio on the retention of PCC. Although the PCC
retention values were similar, anionic polymer additive HM 133.3 gave thicker hand sheets
compared to HM 366.1 and HM 376.1.
20 22 24 26 28 30 3265
70
75
80
85
90
95
100
Ret
entio
n (%
)
PCC loading (%)
Control HM 13 HM 36 HM 37
Fiber refining 3000 rev
20 22 24 26 28 30 3295
100
105
110
115
120
125
Thi
ckne
ss (
µm)
PCC content (%)
control HM 13 HM 36 HM 37
Fiber refining 3000 rev
20 22 24 26 28 30 3265
70
75
80
85
90
95
100
Ret
entio
n (%
)
PCC loading (%)
Control HM 13 HM 36 HM 37
Fiber refining 3000 rev
20 22 24 26 28 30 3295
100
105
110
115
120
125
Thi
ckne
ss (
µm)
PCC content (%)
control HM 13 HM 36 HM 37
Fiber refining 3000 rev
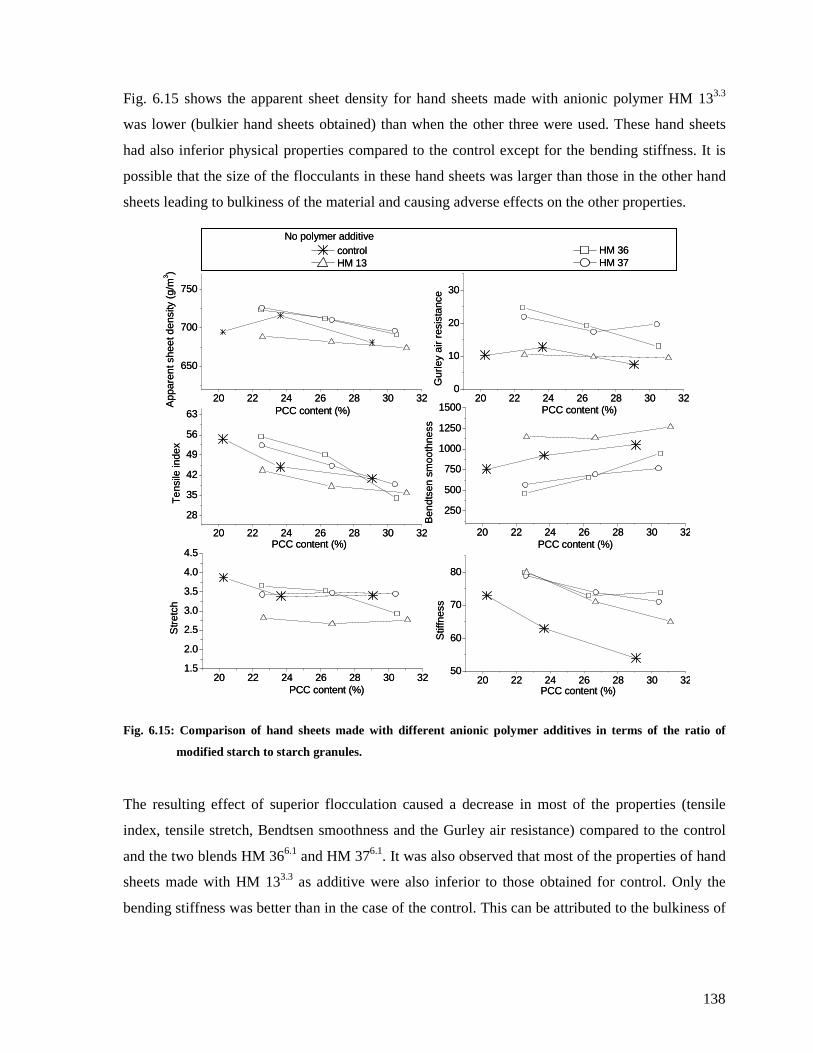
138
Fig. 6.15 shows the apparent sheet density for hand sheets made with anionic polymer HM 133.3
was lower (bulkier hand sheets obtained) than when the other three were used. These hand sheets
had also inferior physical properties compared to the control except for the bending stiffness. It is
possible that the size of the flocculants in these hand sheets was larger than those in the other hand
sheets leading to bulkiness of the material and causing adverse effects on the other properties.
Fig. 6.15: Comparison of hand sheets made with different anionic polymer additives in terms of the ratio of
modified starch to starch granules.
The resulting effect of superior flocculation caused a decrease in most of the properties (tensile
index, tensile stretch, Bendtsen smoothness and the Gurley air resistance) compared to the control
and the two blends HM 366.1 and HM 376.1. It was also observed that most of the properties of hand
sheets made with HM 133.3 as additive were also inferior to those obtained for control. Only the
bending stiffness was better than in the case of the control. This can be attributed to the bulkiness of
20 22 24 26 28 30 32
650
700
750
control HM 13
PCC content (%)
App
aren
t she
et d
ensi
ty (
g/m
3 )
20 22 24 26 28 30 320
10
20
30
HM 36 HM 37
PCC content (%)
No polymer additive
Gur
ley
air
resi
stan
ce
20 22 24 26 28 30 32
28
35
42
49
56
63
PCC content (%)
Ten
sile
inde
x
20 22 24 26 28 30 32
250
500
750
1000
1250
1500
PCC content (%)
Ben
dtse
n sm
ooth
ness
20 22 24 26 28 30 321.5
2.0
2.5
3.0
3.5
4.0
4.5
PCC content (%)
Str
etch
20 22 24 26 28 30 3250
60
70
80
PCC content (%)
Stif
fnes
s
20 22 24 26 28 30 32
650
700
750
control HM 13
PCC content (%)
App
aren
t she
et d
ensi
ty (
g/m
3 )
20 22 24 26 28 30 320
10
20
30
HM 36 HM 37
PCC content (%)
No polymer additive
Gur
ley
air
resi
stan
ce
20 22 24 26 28 30 32
28
35
42
49
56
63
PCC content (%)
Ten
sile
inde
x
20 22 24 26 28 30 32
250
500
750
1000
1250
1500
PCC content (%)
Ben
dtse
n sm
ooth
ness
20 22 24 26 28 30 321.5
2.0
2.5
3.0
3.5
4.0
4.5
PCC content (%)
Str
etch
20 22 24 26 28 30 3250
60
70
80
PCC content (%)
Stif
fnes
s
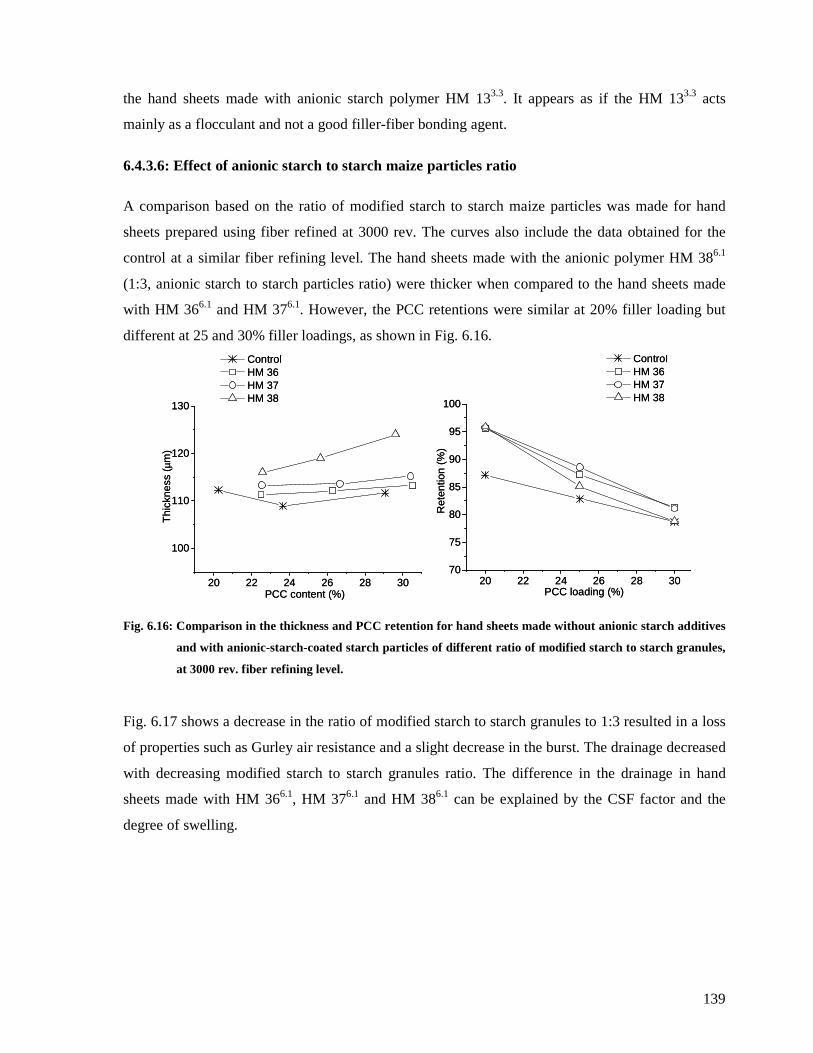
139
the hand sheets made with anionic starch polymer HM 133.3. It appears as if the HM 133.3 acts
mainly as a flocculant and not a good filler-fiber bonding agent.
6.4.3.6: Effect of anionic starch to starch maize particles ratio
A comparison based on the ratio of modified starch to starch maize particles was made for hand
sheets prepared using fiber refined at 3000 rev. The curves also include the data obtained for the
control at a similar fiber refining level. The hand sheets made with the anionic polymer HM 386.1
(1:3, anionic starch to starch particles ratio) were thicker when compared to the hand sheets made
with HM 366.1 and HM 376.1. However, the PCC retentions were similar at 20% filler loading but
different at 25 and 30% filler loadings, as shown in Fig. 6.16.
Fig. 6.16: Comparison in the thickness and PCC retention for hand sheets made without anionic starch additives
and with anionic-starch-coated starch particles of different ratio of modified starch to starch granules,
at 3000 rev. fiber refining level.
Fig. 6.17 shows a decrease in the ratio of modified starch to starch granules to 1:3 resulted in a loss
of properties such as Gurley air resistance and a slight decrease in the burst. The drainage decreased
with decreasing modified starch to starch granules ratio. The difference in the drainage in hand
sheets made with HM 366.1, HM 376.1 and HM 386.1 can be explained by the CSF factor and the
degree of swelling.
20 22 24 26 28 30
100
110
120
130
Thi
ckne
ss (
µm)
PCC content (%)
Control HM 36 HM 37 HM 38
20 22 24 26 28 3070
75
80
85
90
95
100
Ret
entio
n (%
)
PCC loading (%)
Control HM 36 HM 37 HM 38
20 22 24 26 28 30
100
110
120
130
Thi
ckne
ss (
µm)
PCC content (%)
Control HM 36 HM 37 HM 38
20 22 24 26 28 3070
75
80
85
90
95
100
Ret
entio
n (%
)
PCC loading (%)
Control HM 36 HM 37 HM 38
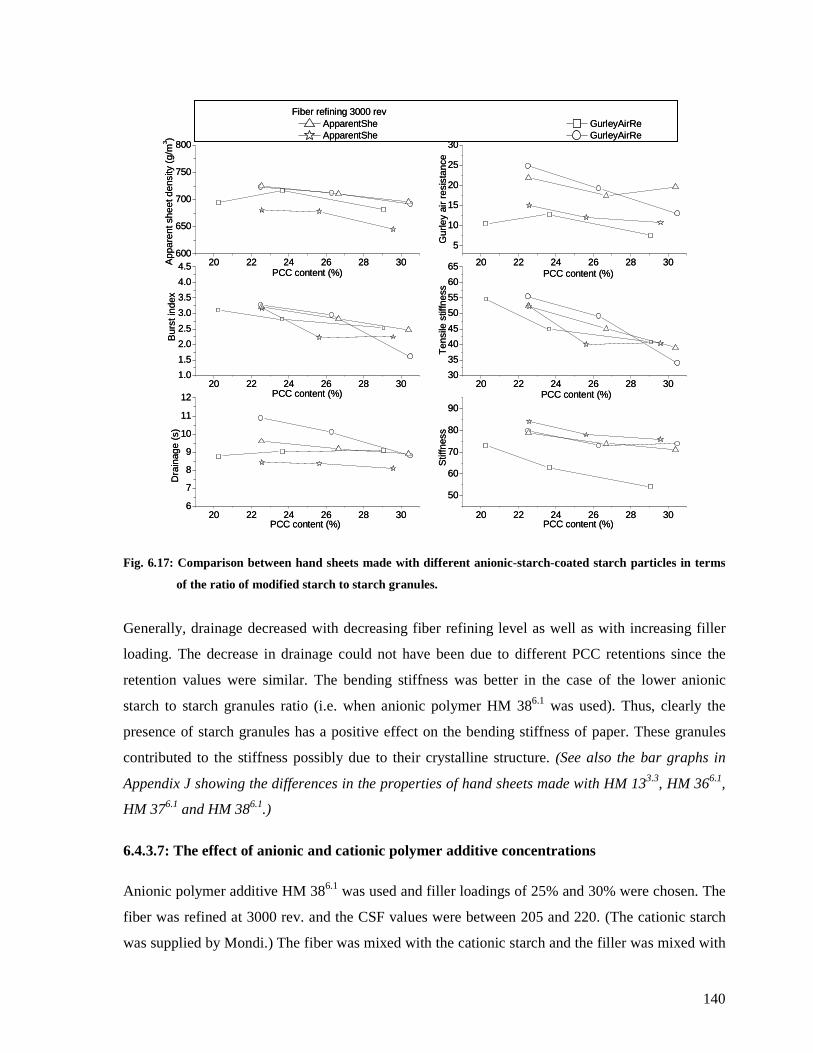
140
Fig. 6.17: Comparison between hand sheets made with different anionic-starch-coated starch particles in terms
of the ratio of modified starch to starch granules.
Generally, drainage decreased with decreasing fiber refining level as well as with increasing filler
loading. The decrease in drainage could not have been due to different PCC retentions since the
retention values were similar. The bending stiffness was better in the case of the lower anionic
starch to starch granules ratio (i.e. when anionic polymer HM 386.1 was used). Thus, clearly the
presence of starch granules has a positive effect on the bending stiffness of paper. These granules
contributed to the stiffness possibly due to their crystalline structure. (See also the bar graphs in
Appendix J showing the differences in the properties of hand sheets made with HM 133.3, HM 366.1,
HM 376.1 and HM 386.1.)
6.4.3.7: The effect of anionic and cationic polymer additive concentrations
Anionic polymer additive HM 386.1 was used and filler loadings of 25% and 30% were chosen. The
fiber was refined at 3000 rev. and the CSF values were between 205 and 220. (The cationic starch
was supplied by Mondi.) The fiber was mixed with the cationic starch and the filler was mixed with
20 22 24 26 28 30600
650
700
750
800
ApparentShe ApparentShe
PCC content (%)
App
aren
t she
et d
ensi
ty (
g/m
3 )
20 22 24 26 28 30
5
10
15
20
25
30
Fiber refining 3000 rev GurleyAirRe GurleyAirRe
PCC content (%)
Gur
ley
air
resi
stan
ce
20 22 24 26 28 301.0
1.5
2.0
2.5
3.0
3.5
4.0
4.5
PCC content (%)
Bur
st in
dex
20 22 24 26 28 3030
35
40
45
50
55
60
65
PCC content (%)
Ten
sile
stif
fnes
s
20 22 24 26 28 306
7
8
9
10
11
12
PCC content (%)PCC content (%)
Dra
inag
e (s
)
20 22 24 26 28 30
50
60
70
80
90
Stif
fnes
s
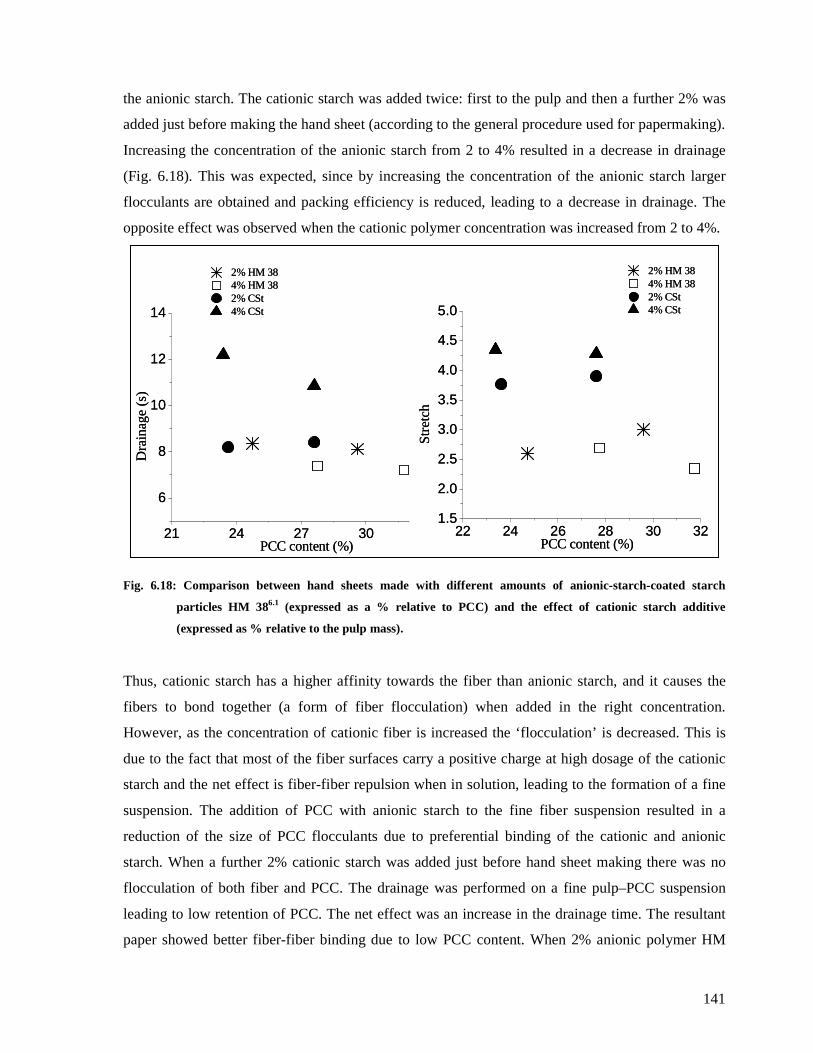
141
the anionic starch. The cationic starch was added twice: first to the pulp and then a further 2% was
added just before making the hand sheet (according to the general procedure used for papermaking).
Increasing the concentration of the anionic starch from 2 to 4% resulted in a decrease in drainage
(Fig. 6.18). This was expected, since by increasing the concentration of the anionic starch larger
flocculants are obtained and packing efficiency is reduced, leading to a decrease in drainage. The
opposite effect was observed when the cationic polymer concentration was increased from 2 to 4%.
Fig. 6.18: Comparison between hand sheets made with different amounts of anionic-starch-coated starch
particles HM 386.1 (expressed as a % relative to PCC) and the effect of cationic starch additive
(expressed as % relative to the pulp mass).
Thus, cationic starch has a higher affinity towards the fiber than anionic starch, and it causes the
fibers to bond together (a form of fiber flocculation) when added in the right concentration.
However, as the concentration of cationic fiber is increased the ‘flocculation’ is decreased. This is
due to the fact that most of the fiber surfaces carry a positive charge at high dosage of the cationic
starch and the net effect is fiber-fiber repulsion when in solution, leading to the formation of a fine
suspension. The addition of PCC with anionic starch to the fine fiber suspension resulted in a
reduction of the size of PCC flocculants due to preferential binding of the cationic and anionic
starch. When a further 2% cationic starch was added just before hand sheet making there was no
flocculation of both fiber and PCC. The drainage was performed on a fine pulp–PCC suspension
leading to low retention of PCC. The net effect was an increase in the drainage time. The resultant
paper showed better fiber-fiber binding due to low PCC content. When 2% anionic polymer HM
21 24 27 30
6
8
10
12
14
2% HM 38 4% HM 38 2% CSt 4% CSt
2% HM 38 4% HM 38 2% CSt 4% CSt
PCC content (%)
Dra
inag
e (s
)
22 24 26 28 30 321.5
2.0
2.5
3.0
3.5
4.0
4.5
5.0
PCC content (%)
Str
etch
21 24 27 30
6
8
10
12
14
2% HM 38 4% HM 38 2% CSt 4% CSt
2% HM 38 4% HM 38 2% CSt 4% CSt
PCC content (%)
Dra
inag
e (s
)
22 24 26 28 30 321.5
2.0
2.5
3.0
3.5
4.0
4.5
5.0
PCC content (%)
Str
etch

142
386.1 was used the hand sheets were thicker compared to when 4% of the same anionic polymer was
used regardless of higher retention in the latter (Fig. 6.19). This could be due to the fact that higher
PCC retention means less fiber per hand sheet resulting in the loss of bulkiness. An increase in the
cationic concentration from 2% to 4% resulted in a decrease in the thickness of hand sheets but the
retention values were similar.
Fig. 6.19: A comparison in the thickness and PCC retention for hand sheets made with different amounts of
anionic-starch-coated starch particles HM 3876.1 (expressed as a % relative to PCC) and the effect of
cationic starch additive (expressed as % relative to the pulp mass).
The stretch properties of the paper made with 2 and 4% anionic starch were similar at 25% filler
loading (the star and unshaded square in Fig. 6.20) but at 30% filler loading the use of 2% anionic
starch gave better tensile stretch. Thus the effect of flocculation was evident at 30% filler loading,
since large flocculants have a negative effect on most paper properties as they disrupt the packing
efficiency of the fiber during drainage creating flaws.
A large increase in the tensile index and stretch was obtained when additional cationic starch was
mixed with pulp (Fig. 6.20). The cationic starch has a tendency to bind fiber together (in the dry
end), leading to high tensile strength and stretch. The fact that PCC retention decreased with
increasing cationic starch concentration shows that an excess of positive charges has detrimental
effects on the filler retention. Increasing the cationic starch concentration resulted in paper with a
high burst index compared to paper made using the standard papermaking procedure with anionic
22 24 26 28 30 3290
100
110
120
130
140
150
Thi
ckne
ss (µ
m)
PCC content (%)
2% HM 38 4% HM 38 2% CSt, 2% HM 384% CSt, 2% HM 38
24 26 28 3065
70
75
80
85
90
95
2% HM 38 4% HM 38 2% CSt, 2% HM 38 4% CSt, 2% HM 38
PCC loading (%)
Re
tent
ion
%
22 24 26 28 30 3290
100
110
120
130
140
150
Thi
ckne
ss (µ
m)
PCC content (%)
2% HM 38 4% HM 38 2% CSt, 2% HM 384% CSt, 2% HM 38
24 26 28 3065
70
75
80
85
90
95
2% HM 38 4% HM 38 2% CSt, 2% HM 38 4% CSt, 2% HM 38
PCC loading (%)
Re
tent
ion
%
22 24 26 28 30 3290
100
110
120
130
140
150
Thi
ckne
ss (µ
m)
PCC content (%)
2% HM 38 4% HM 38 2% CSt, 2% HM 384% CSt, 2% HM 38
24 26 28 3065
70
75
80
85
90
95
2% HM 38 4% HM 38 2% CSt, 2% HM 38 4% CSt, 2% HM 38
PCC loading (%)
Re
tent
ion
%
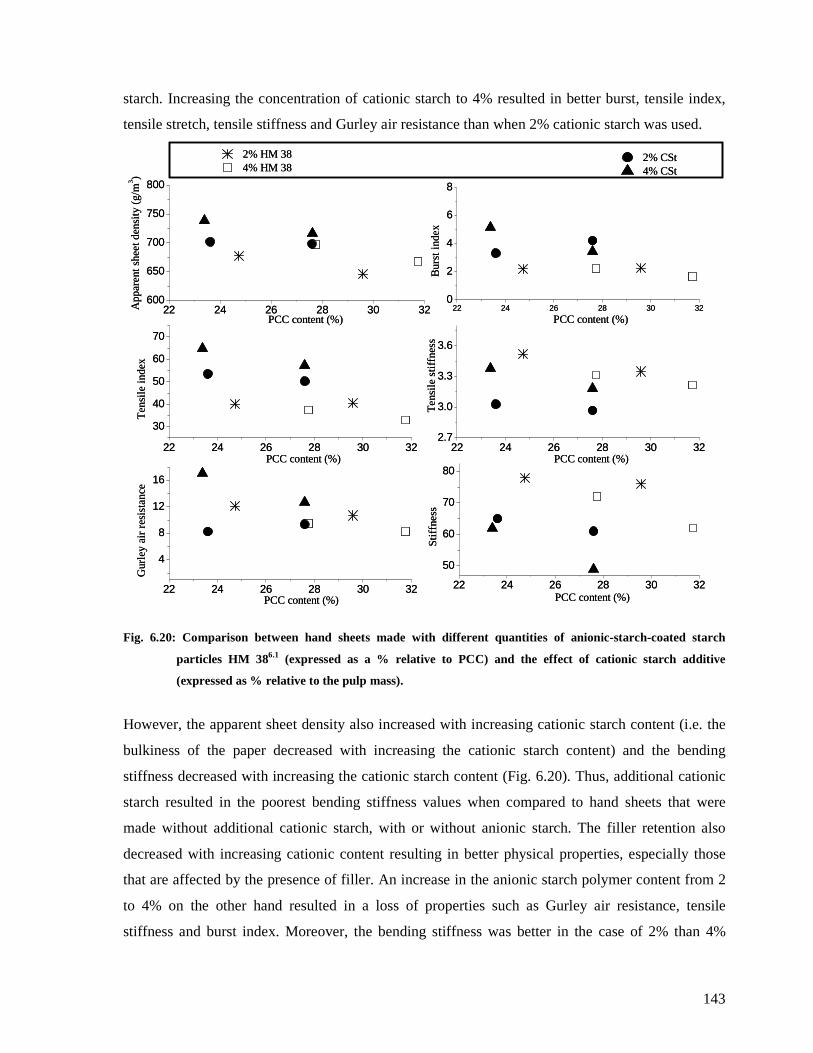
143
starch. Increasing the concentration of cationic starch to 4% resulted in better burst, tensile index,
tensile stretch, tensile stiffness and Gurley air resistance than when 2% cationic starch was used.
Fig. 6.20: Comparison between hand sheets made with different quantities of anionic-starch-coated starch
particles HM 386.1 (expressed as a % relative to PCC) and the effect of cationic starch additive
(expressed as % relative to the pulp mass).
However, the apparent sheet density also increased with increasing cationic starch content (i.e. the
bulkiness of the paper decreased with increasing the cationic starch content) and the bending
stiffness decreased with increasing the cationic starch content (Fig. 6.20). Thus, additional cationic
starch resulted in the poorest bending stiffness values when compared to hand sheets that were
made without additional cationic starch, with or without anionic starch. The filler retention also
decreased with increasing cationic content resulting in better physical properties, especially those
that are affected by the presence of filler. An increase in the anionic starch polymer content from 2
to 4% on the other hand resulted in a loss of properties such as Gurley air resistance, tensile
stiffness and burst index. Moreover, the bending stiffness was better in the case of 2% than 4%
22 24 26 28 30 320
2
4
6
8
PCC content (%)
2% CSt 4% CSt
Bur
st in
dex
22 24 26 28 30 32
30
40
50
60
70
PCC content (%)
PCC content (%)
Ten
sile
inde
x
22 24 26 28 30 322.7
3.0
3.3
3.6
PCC content (%)
22 24 26 28 30 32
4
8
12
16
PCC content (%)
Gur
ley
air
resi
sta
nce
22 24 26 28 30 32
50
60
70
80
PCC content (%)
Te
nsile
stif
fnes
sS
tiffn
ess
22 24 26 28 30 32600
650
700
750
800
2% HM 38 4% HM 38
App
are
nt s
hee
t den
sity
(g/
m3 )
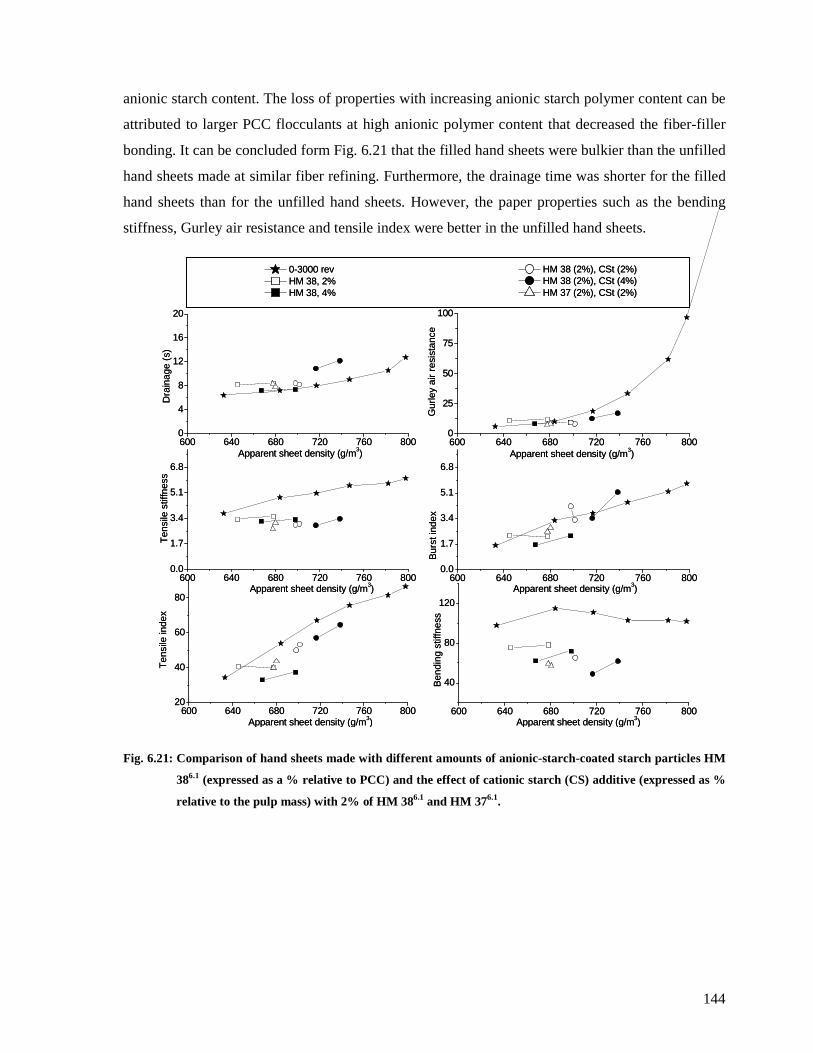
144
anionic starch content. The loss of properties with increasing anionic starch polymer content can be
attributed to larger PCC flocculants at high anionic polymer content that decreased the fiber-filler
bonding. It can be concluded form Fig. 6.21 that the filled hand sheets were bulkier than the unfilled
hand sheets made at similar fiber refining. Furthermore, the drainage time was shorter for the filled
hand sheets than for the unfilled hand sheets. However, the paper properties such as the bending
stiffness, Gurley air resistance and tensile index were better in the unfilled hand sheets.
Fig. 6.21: Comparison of hand sheets made with different amounts of anionic-starch-coated starch particles HM
386.1 (expressed as a % relative to PCC) and the effect of cationic starch (CS) additive (expressed as %
relative to the pulp mass) with 2% of HM 386.1 and HM 376.1.
600 640 680 720 760 8000
4
8
12
16
20
600 640 680 720 760 800
40
80
120
600 640 680 720 760 8000.0
1.7
3.4
5.1
6.8
600 640 680 720 760 80020
40
60
80
600 640 680 720 760 8000
25
50
75
100
600 640 680 720 760 8000.0
1.7
3.4
5.1
6.8
HM 38 (2%), CSt (2%) HM 38 (2%), CSt (4%) HM 37 (2%), CSt (2%)
0-3000 rev HM 38, 2% HM 38, 4%
Dra
inag
e (s
)
Apparent sheet density (g/m3)
Apparent sheet density (g/m3)
Ben
ding
stif
fnes
s
Apparent sheet density (g/m3)
Ten
sile
stif
fnes
s
Apparent sheet density (g/m3)
Apparent sheet density (g/m3)
Ten
sile
inde
x
Gur
ley
air
resi
stan
ce
Apparent sheet density (g/m3)
Bur
st in
dex
600 640 680 720 760 8000
4
8
12
16
20
600 640 680 720 760 800
40
80
120
600 640 680 720 760 8000.0
1.7
3.4
5.1
6.8
600 640 680 720 760 80020
40
60
80
600 640 680 720 760 8000
25
50
75
100
600 640 680 720 760 8000.0
1.7
3.4
5.1
6.8
HM 38 (2%), CSt (2%) HM 38 (2%), CSt (4%) HM 37 (2%), CSt (2%)
0-3000 rev HM 38, 2% HM 38, 4%
Dra
inag
e (s
)
Apparent sheet density (g/m3)
Apparent sheet density (g/m3)
Ben
ding
stif
fnes
s
Apparent sheet density (g/m3)
Ten
sile
stif
fnes
s
Apparent sheet density (g/m3)
Apparent sheet density (g/m3)
Ten
sile
inde
x
Gur
ley
air
resi
stan
ce
Apparent sheet density (g/m3)
Bur
st in
dex

145
6.4.3.8: Anionic-starch-coated cationic starch particles
Cationic starch particles were also coated with anionic starch and used as PCC flocculant (see
Appendix E, Fig. E1). The anionic-starch-coated cationic starch particles were also tested for PCC
retention and their effect on the paper properties. Fig. 6.2 shows that the drainage decreased with a
decrease in the anionic starch to cationic starch particles ratio. Previous studies on the flocculation
of PCC using a mixture of anionic and cationic starch showed that the blend flocculates better than
either the anionic or the cationic starch polymer alone. Thus, the decrease in the drainage was a
result of large flocculants. However the apparent sheet densities of the blends (HM 396.1 and HM
406.1) were similar to that of control and, conversely, the apparent sheet density of the anionic starch
HM 406.1 was lower (Fig. 6.22). This might be due to the effect of the cationic starch on the fiber
whereby fiber-fiber bonding is promoted, resulting in high values of the apparent sheet density as
previously observed (Fig. 6.20).
Fig. 6.22: Comparison of drainage and apparent sheet density between hand sheets made with different (in terms
of modified starch to cationic starch granules ratio) anionic polymer additive blended with cationic
particles.
18 21 24 27 30 333
4
5
6
7
8
9
10
11
12
control HM 6 HM 39 HM 40
App
aren
t sh
eet
dens
ity (
g/m
3 )
Dra
inag
e (s
)
PCC content (%)18 21 24 27 30 33
600
650
700
750
800
control HM 6 HM 39 HM 40
PCC content (%)18 21 24 27 30 33
3
4
5
6
7
8
9
10
11
12
control HM 6 HM 39 HM 40
App
aren
t sh
eet
dens
ity (
g/m
3 )
Dra
inag
e (s
)
PCC content (%)18 21 24 27 30 33
600
650
700
750
800
control HM 6 HM 39 HM 40
PCC content (%)
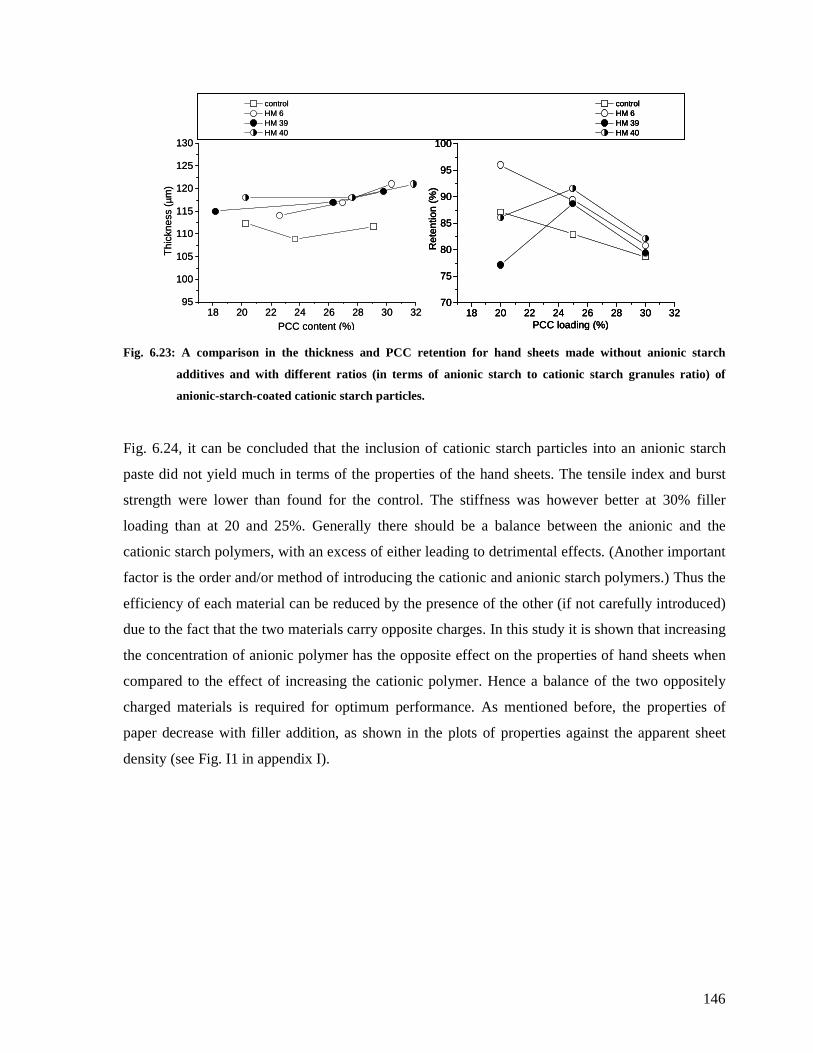
146
Fig. 6.23: A comparison in the thickness and PCC retention for hand sheets made without anionic starch
additives and with different ratios (in terms of anionic starch to cationic starch granules ratio) of
anionic-starch-coated cationic starch particles.
Fig. 6.24, it can be concluded that the inclusion of cationic starch particles into an anionic starch
paste did not yield much in terms of the properties of the hand sheets. The tensile index and burst
strength were lower than found for the control. The stiffness was however better at 30% filler
loading than at 20 and 25%. Generally there should be a balance between the anionic and the
cationic starch polymers, with an excess of either leading to detrimental effects. (Another important
factor is the order and/or method of introducing the cationic and anionic starch polymers.) Thus the
efficiency of each material can be reduced by the presence of the other (if not carefully introduced)
due to the fact that the two materials carry opposite charges. In this study it is shown that increasing
the concentration of anionic polymer has the opposite effect on the properties of hand sheets when
compared to the effect of increasing the cationic polymer. Hence a balance of the two oppositely
charged materials is required for optimum performance. As mentioned before, the properties of
paper decrease with filler addition, as shown in the plots of properties against the apparent sheet
density (see Fig. I1 in appendix I).
18 20 22 24 26 28 30 3295
100
105
110
115
120
125
130
control HM 6 HM 39 HM 40
PCC content (%)
Thi
ckne
ss (
µm)
18 20 22 24 26 28 30 3270
75
80
85
90
95
100
control HM 6 HM 39 HM 40
Ret
entio
n (%
)
PCC loading (%)18 20 22 24 26 28 30 32
95
100
105
110
115
120
125
130
control HM 6 HM 39 HM 40
PCC content (%)
Thi
ckne
ss (
µm)
18 20 22 24 26 28 30 3270
75
80
85
90
95
100
control HM 6 HM 39 HM 40
Ret
entio
n (%
)
PCC loading (%)18 20 22 24 26 28 30 32
70
75
80
85
90
95
100
control HM 6 HM 39 HM 40
Ret
entio
n (%
)
PCC loading (%)
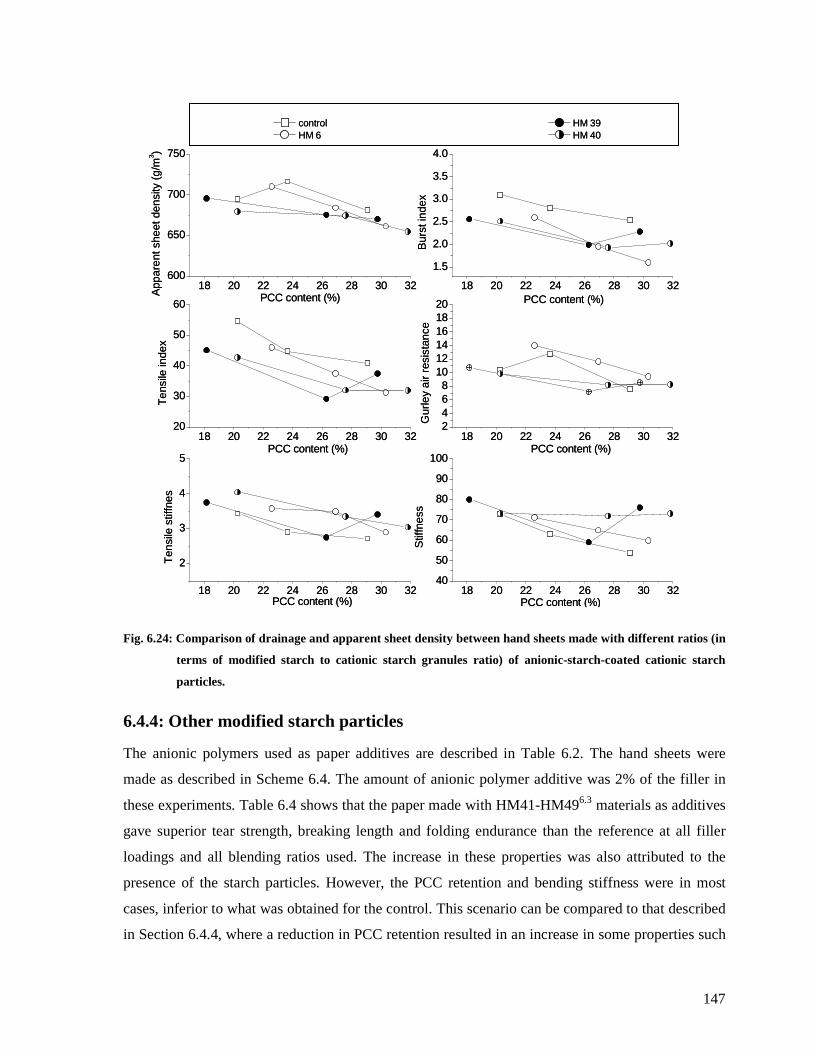
147
Fig. 6.24: Comparison of drainage and apparent sheet density between hand sheets made with different ratios (in
terms of modified starch to cationic starch granules ratio) of anionic-starch-coated cationic starch
particles.
6.4.4: Other modified starch particles
The anionic polymers used as paper additives are described in Table 6.2. The hand sheets were
made as described in Scheme 6.4. The amount of anionic polymer additive was 2% of the filler in
these experiments. Table 6.4 shows that the paper made with HM41-HM496.3 materials as additives
gave superior tear strength, breaking length and folding endurance than the reference at all filler
loadings and all blending ratios used. The increase in these properties was also attributed to the
presence of the starch particles. However, the PCC retention and bending stiffness were in most
cases, inferior to what was obtained for the control. This scenario can be compared to that described
in Section 6.4.4, where a reduction in PCC retention resulted in an increase in some properties such
18 20 22 24 26 28 30 32600
650
700
750A
ppar
ent s
heet
den
sity
(g/
m3 )
PCC content (%)18 20 22 24 26 28 30 32
1.5
2.0
2.5
3.0
3.5
4.0
HM 39 HM 40
control HM 6
Bur
st in
dex
18 20 22 24 26 28 30 3220
30
40
50
60
Ten
sile
inde
x
18 20 22 24 26 28 30 322468
101214161820
PCC content (%)
PCC content (%)
Gur
ley
air
resi
stan
ce
18 20 22 24 26 28 30 32
2
3
4
5PCC content (%)
Ten
sile
stif
fnes
18 20 22 24 26 28 30 3240
50
60
70
80
90
100
PCC content (%) PCC content (%)
Stif
fnes
s
148
as the tensile strength. However, superior tear strength, breaking length and folding endurance was
also obtained for sample HM 47-HM 496.3, which gave a slight increase in PCC retention. The PCC
binding efficiency for sample HM 41-HM 436.3 was expected to be low since acrylamide was used
as a comonomer during the graft copolymerization process. This could have contributed to inferior
retention values. The material HM 41-HM 436.3 was expected to increase the hydrogen bonding to
strengthen fiber filler bonding. The crosslinked material HM 44-HM 466.3 was used in a low anionic
to starch particle ratio in order to reduce its flocculation efficiency but low retention values were
also obtained. Although it was anticipated that the addition of polymeric additives would result in
more PCC retention the results showed that other factors were influencing the PCC retention. These
factors include the ineffective interaction between the additive and the PCC and ineffective size of
flocculants due to dilution and time factors, resulting in a significant decrease in the size of
flocculants.
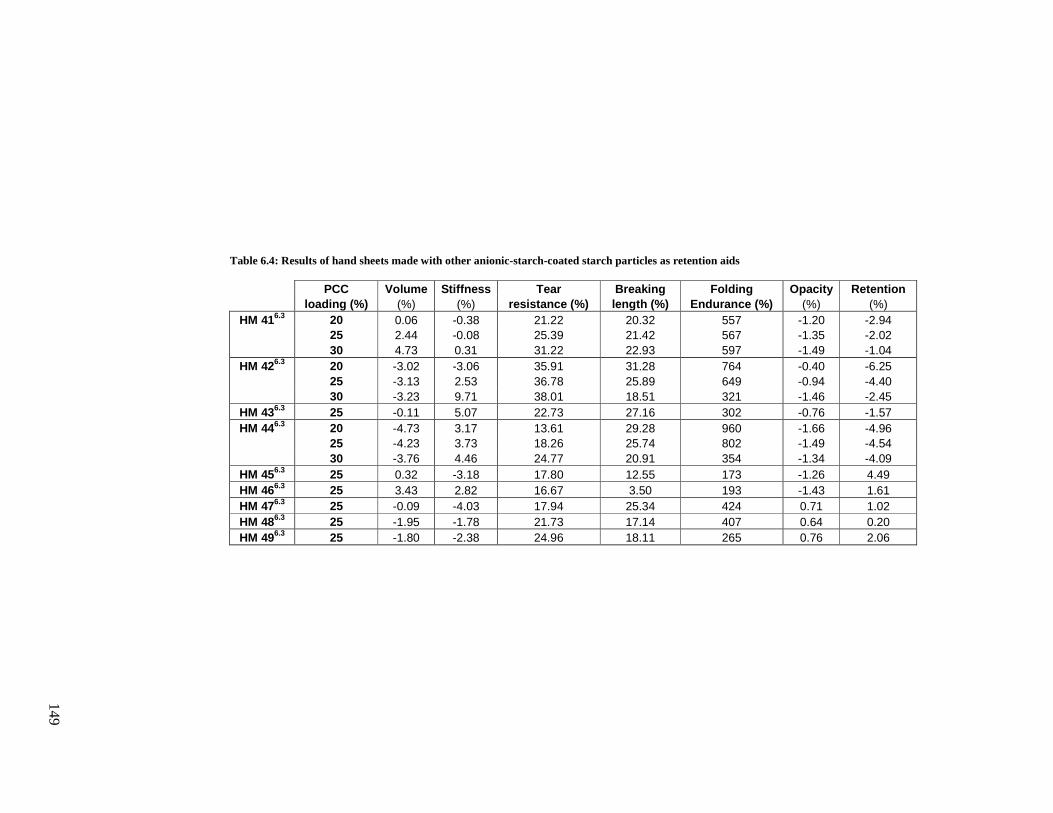
149
Table 6.4: R
esults of hand sheets made w
ith graft copolymerized anionic starch coated starch
particles as additives
PCC Volume Stiffness Tear Breaking Folding Opacity Retention loading (%) (%) (%) resistance (%) length (%) Endurance (%) (%) (%) HM 416.3 20 0.06 -0.38 21.22 20.32 557 -1.20 -2.94
25 2.44 -0.08 25.39 21.42 567 -1.35 -2.02 30 4.73 0.31 31.22 22.93 597 -1.49 -1.04
HM 426.3 20 -3.02 -3.06 35.91 31.28 764 -0.40 -6.25 25 -3.13 2.53 36.78 25.89 649 -0.94 -4.40 30 -3.23 9.71 38.01 18.51 321 -1.46 -2.45
HM 436.3 25 -0.11 5.07 22.73 27.16 302 -0.76 -1.57 HM 446.3 20 -4.73 3.17 13.61 29.28 960 -1.66 -4.96
25 -4.23 3.73 18.26 25.74 802 -1.49 -4.54 30 -3.76 4.46 24.77 20.91 354 -1.34 -4.09
HM 456.3 25 0.32 -3.18 17.80 12.55 173 -1.26 4.49 HM 466.3 25 3.43 2.82 16.67 3.50 193 -1.43 1.61 HM 476.3 25 -0.09 -4.03 17.94 25.34 424 0.71 1.02 HM 486.3 25 -1.95 -1.78 21.73 17.14 407 0.64 0.20 HM 496.3 25 -1.80 -2.38 24.96 18.11 265 0.76 2.06
Table 6.4: Results of hand sheets made with other anionic-starch-coated starch particles as retention aids

150
6.5: Conclusions
The use of anionic-starch-coated starch particles as retention aids resulted in hand sheets with better
bending stiffness over hand sheets made with the anionic starch paste only and without any anionic
starch additive. Moreover, the other properties remained superior to those obtained for the control.
The use of anionic starch resulted in improvement in filler retention but poor paper properties
(tensile strength, burst index and porosity) resulted. However, the use of the anionic-starch-coated
cationic starch particles did not show much effect on the retention of filler and paper properties.
(This is probably due to the unbalanced effect of the cationic and anionic polymers). Flocculation
experiments showed that a mixture of the anionic and cationic starch resulted in more flocculation
and broadness in the particle size distribution and some bimodal distribution were obtained. Thus,
there is need to balance the effect of the cationic and anionic starch additives so as to control the
final properties of hand sheets. It was also shown that the point of addition of the anionic additives
is of paramount importance. The preferred route is to add the anionic additives to PCC rather than
to the pulp. However, the size of PCC flocculants should be optimized in order to obtain the best
properties.
6.6: References
(1) Xu, Y., Chen X., Peltron R. Tappi Journal 2005, 4(11), 8-12.
(2) Li, L., Collis A., Pelton R. Journal of Pulp and Paper Science 2002, 28(8), 267-273.
(3) Alince, B., Lebreton R., St.-Amour S. Tappi Journal 1990, 73(3), 191-193.
(4) Formento, J. C., Maximino M. G., Mina L. R., Srayh M. I., Martinez M. J. Appita 1994,
47(4), 305-308.
(5) Laleg, M. US Patent 2006, no. 7.074.845.
(6) Johnson, K. A. US Patent 1988, no. 4.750.974.
(7) Ide, F., Kodama T., Kotake Y. US Patent 1974, no.3.785.921.
151
Chapter 7: Conclusions and recommendations
152
7.1: Conclusions
The main aim of this study was to increase the PCC loading in paper without negatively impacting
the properties of paper. This was achieved by using anionic-starch-coated starch particles which
resulted in good PCC retention and improved paper properties even at high PCC loading. Several
aspects of polysaccharide modification, their effects on CaCO3 crystal growth modification and,
their effect on PCC retention and paper strength were investigated.
The following conclusions can be made to the objectives as stated in Chapter 1:
1. Modification of polysaccharides was successfully carried out using various methods. The grafting
techniques were found to yield starch based materials that are suitable for application in the
retention of PCC.
2. Anionic starch materials were found to be good PCC flocculating agents. The concentration of
the anionic starch critically affects the size of PCC flocculants. Moreover, use of a mixture of
anionic and cationic starch, as well as the sequential treatment of PCC with the oppositely charged
polymers, had a significant effect on the size of the PCC flocculants.
3. A study on in situ crystallization of CaCO3 in the presence of chemically modified cellulose fiber
showed that the filler particles were nucleated on the surface of the fiber. Modification of CaCO3
crystal morphology and its surface properties can be achieved by carefully choosing the conditions
and the crystal growth modifier. This study revealed new methods of filler synthesis and filler
addition to paper via in situ crystallization of filler in the presence of the chemically modified fiber.
(The use of this method in papermaking could result in improved filler retention although many
factors such as fiber-fiber bonding strength should also be considered.)
Filler surface modification was achieved by using PAA grafted starch as the crystal growth
modifier. This affected the shape polymorph and size of crystals, and resulted in crystals with
functional chemical surfaces. Fluorescence studies revealed that the polysaccharide was also on the
surface of the crystallized calcium carbonate. The surface charge was negative, and addition of
cationic starch reversed the charge. A novel approach for the characterization of fluorescing CaCO3
crystals using flow cytometry gave useful information on the distribution of the chromophore with
granularity and size of the crystals. Surface properties of fillers are critical to fiber–filler
interactions as well as interactions with other additives such as cationic starch that promote fiber–
fiber bonding. The presence of starch and the negative charge on the surface of the crystals could
153
increase filler–fiber bonding when used in combination with cationic starch, and this can lead to
good paper strength.
4. Hand sheets were made and the performance of the modified polysaccharides on paper properties
was tested. The anionic-starch-coated starch particles were used as filler retention aids to produce
paper with better filler loading. Soluble anionic starch gave improved PCC filler retention but the
paper strength decreased when compared to the control paper. However, the use of anionic-starch-
coated starch particles gave improved PCC filler retention and properties such as the bending
stiffness, tensile strength and porosity were superior to those obtained for the control paper. Whilst
addition of retention aids to PCC is easy to implement, it was also found that it is necessary to
optimize the conditions in order to produce better quality paper. For an example, the effective
particle size of the filler depends on a number of factors that require mechanical and chemical
considerations. These variables include the rate of stirring of flocculants, stirring efficiency and
reproducibility, volume water used, extent of modification and adjustment of modification from one
sample to another, degree of swelling of the additives (which can vary from one run to another),
degree of pulp refining, source of the pulp, time of interaction between filler, fiber and additives,
etc. Nevertheless, the data obtained in this study indicates that positive attributes were induced by
inclusion of anionic starch-coated-starch particles in paper. The designed anionic starch particles
can be produced easily and quantitatively, paving the way to new retention aids.
7.2: Recommendations for future work
The following recommendations for future research are made:
1) Investigate the synthesis of PCC in the presence of soluble crystal growth modifiers to study the
effect of size, shape and surface properties on the strength of paper and PCC filler retention. The
present study showed that the surface of the crystallized filler can be easily modified in terms of
both the surface charge as well as the amount of the starch polymer on the surface. Thus it will
be interesting to see the effects of varying the charge and the amount of starch (absorbed or
adsorbed) on the surface on the retention of PCC as well as on the paper strength.
2) Investigate the in situ formation of calcium carbonate filler in the presence of modified pulp
fiber and then study the properties of the paper. In situ synthesis of filler in the presence of
modified pulp and its use for the subsequent formation of hand sheets would also be of great
154
interest especially in terms of filler retention. The in situ crystallization process would result in
filler being absorbed on the surface of the fiber, as was observed in this study. This may lead to
improved filler retention, but measures do have to be taken in order to prevent the weakening of
fiber–fiber bonding. Thus, it was necessary to do an onsite experiment or laboratory-designed
process that includes all the aspects of in situ filler synthesis and hand sheet making which will
indeed be a mammoth task.
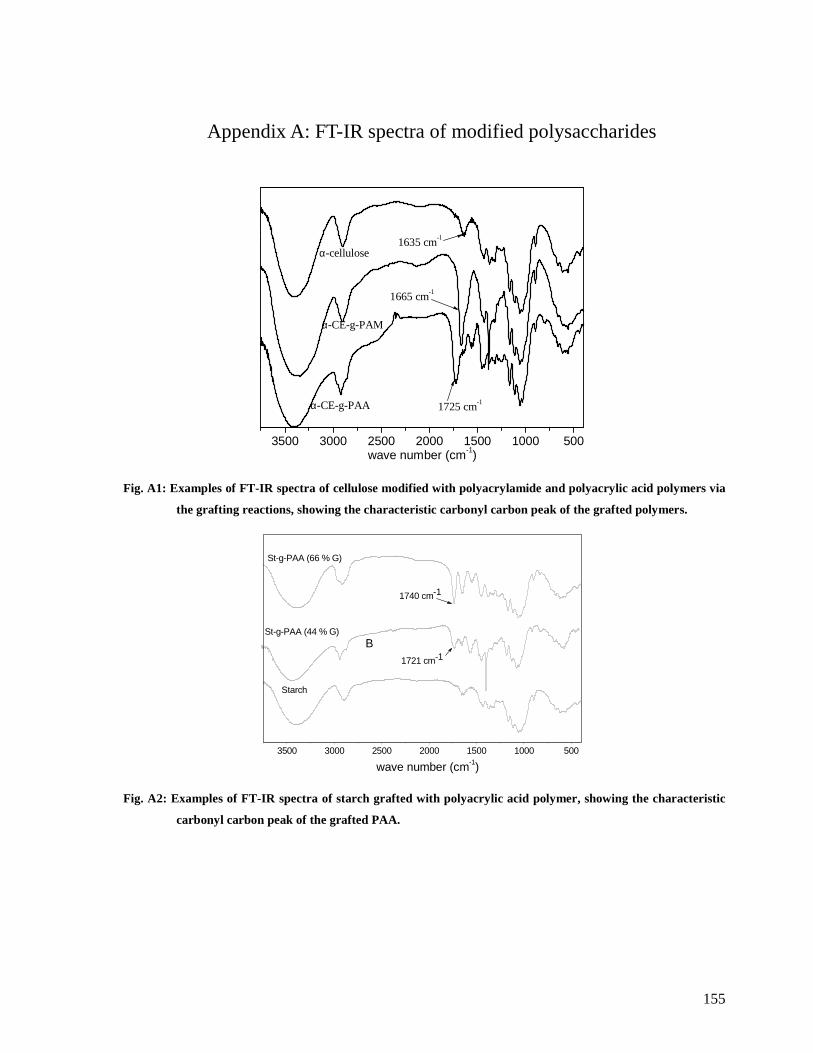
155
Appendix A: FT-IR spectra of modified polysaccharides
Fig. A1: Examples of FT-IR spectra of cellulose modified with polyacrylamide and polyacrylic acid polymers via
the grafting reactions, showing the characteristic carbonyl carbon peak of the grafted polymers.
St-g-PAA (66 % G)
1721 cm-1
1740 cm-1
3500 3000 2500 2000 1500 1000 500
Starch
wave number (cm-1)
St-g-PAA (44 % G)B
Fig. A2: Examples of FT-IR spectra of starch grafted with polyacrylic acid polymer, showing the characteristic
carbonyl carbon peak of the grafted PAA.
3500 3000 2500 2000 1500 1000 500
α-CE-g-PAA
α-CE-g-PAM
α-cellulose
1725 cm-1
1665 cm-1
1635 cm-1
wave number (cm-1)
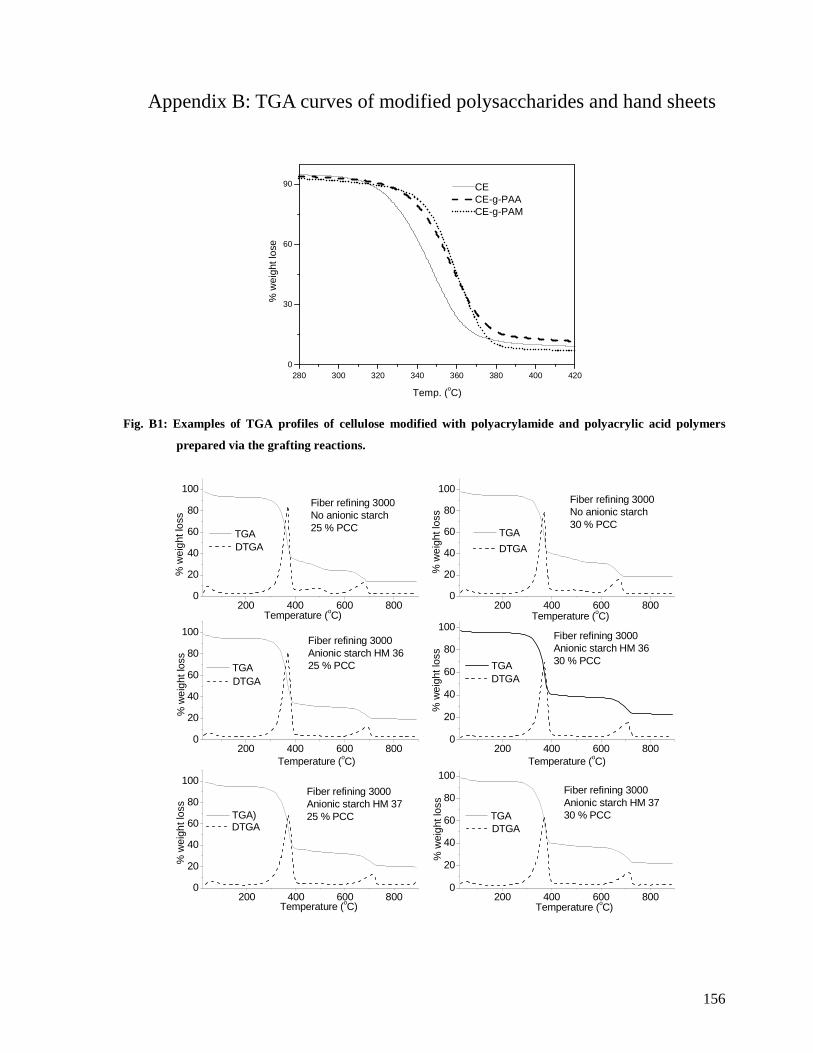
156
Appendix B: TGA curves of modified polysaccharides and hand sheets
280 300 320 340 360 380 400 4200
30
60
90
% w
eigh
t los
e
Temp. (oC)
CECE-g-PAACE-g-PAM
Fig. B1: Examples of TGA profiles of cellulose modified with polyacrylamide and polyacrylic acid polymers
prepared via the grafting reactions.
200 400 600 8000
20
40
60
80
100
TGA
% w
eigh
t los
s
Temperature (oC)200 400 600 800
0
20
40
60
80
100
Temperature (oC)
% w
eigh
t los
s
Fiber refining 3000No anionic starch30 % PCC
TGA
200 400 600 8000
20
40
60
80
100
Temperature (oC)
% w
eigh
t los
s
Fiber refining 3000Anionic starch HM 3625 % PCC TGA
200 400 600 8000
20
40
60
80
100
Temperature (oC)
% w
eigh
t los
s
Fiber refining 3000Anionic starch HM 3630 % PCC TGA
200 400 600 8000
20
40
60
80
100
Temperature (oC)
% w
eigh
t los
s
Fiber refining 3000Anionic starch HM 3725 % PCC TGA)
200 400 600 8000
20
40
60
80
100
Temperature (oC)
% w
eigh
t los
s
Fiber refining 3000Anionic starch HM 3730 % PCC TGA
DTGA
Fiber refining 3000No anionic starch25 % PCC
DTGA
DTGA
DTGA DTGA
DTGA
157
Fig. B2: Examples of TGA profiles of hand sheets made with and without polymeric additives (the PCC filler
retention was calculated from these curves).
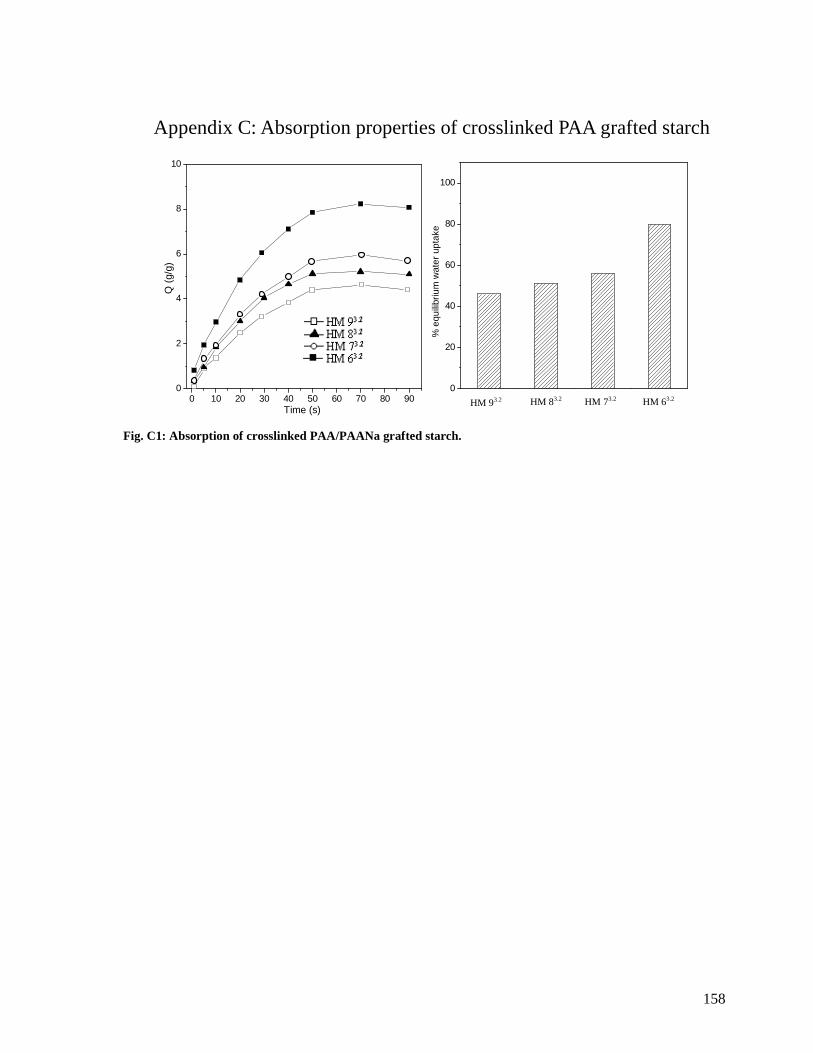
158
Appendix C: Absorption properties of crosslinked PAA grafted starch
Fig. C1: Absorption of crosslinked PAA/PAANa grafted starch.
0 10 20 30 40 50 60 70 80 900
2
4
6
8
10
0
20
40
60
80
100
% e
quili
briu
m w
ater
upt
ake
iviiii ii
Q (
g/g)
Time (s)
i ii iii iv
HM 93.2 HM 83.2 HM 73.2 HM 63.2
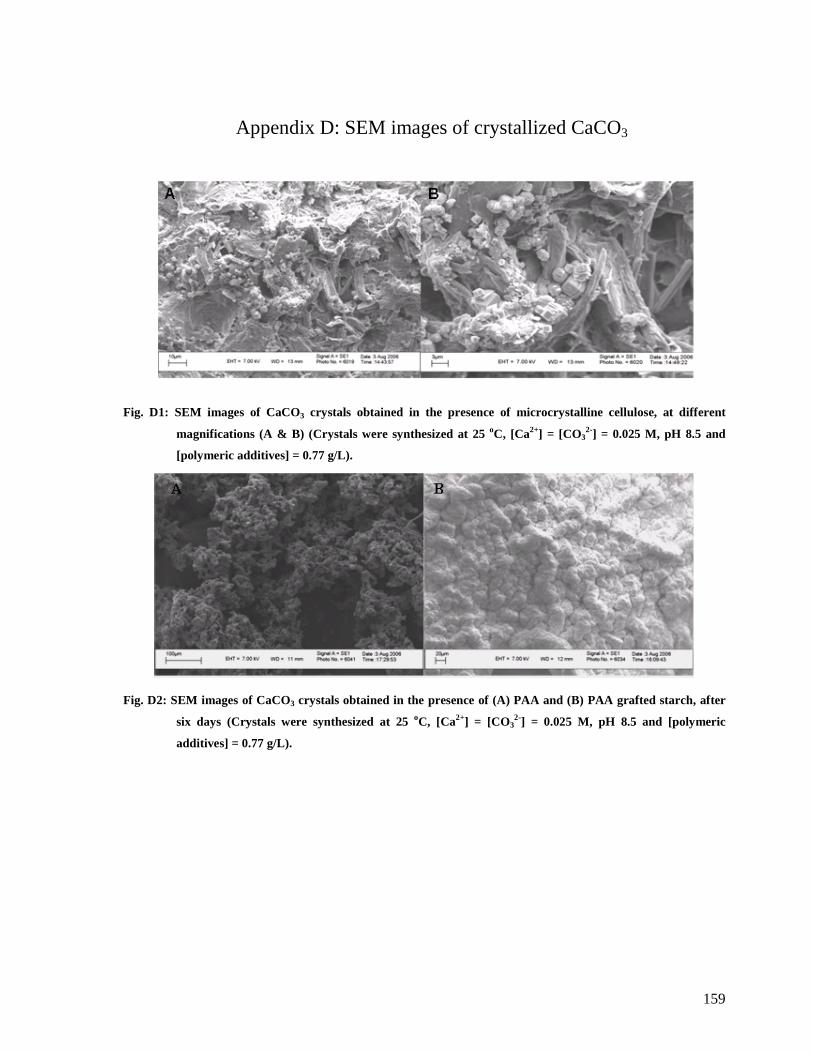
159
Appendix D: SEM images of crystallized CaCO3
Fig. D1: SEM images of CaCO3 crystals obtained in the presence of microcrystalline cellulose, at different
magnifications (A & B) (Crystals were synthesized at 25 oC, [Ca2+] = [CO32-] = 0.025 M, pH 8.5 and
[polymeric additives] = 0.77 g/L).
Fig. D2: SEM images of CaCO3 crystals obtained in the presence of (A) PAA and (B) PAA grafted starch, after
six days (Crystals were synthesized at 25 oC, [Ca2+] = [CO32-] = 0.025 M, pH 8.5 and [polymeric
additives] = 0.77 g/L).
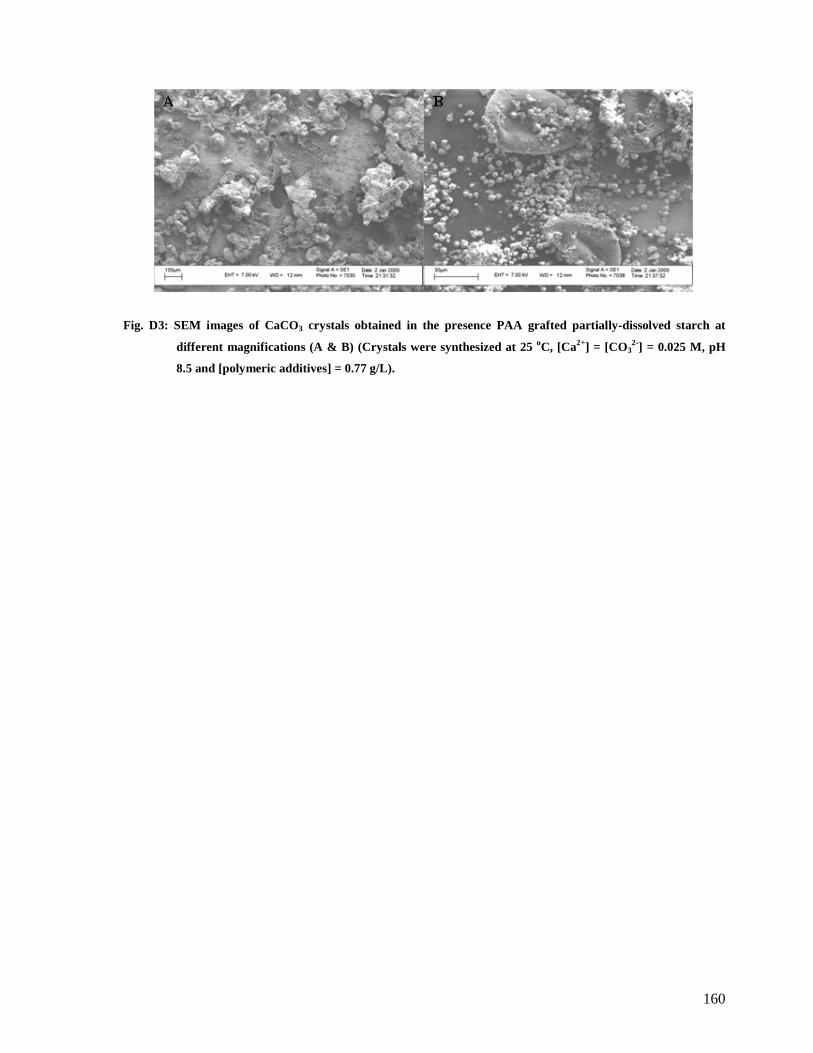
160
Fig. D3: SEM images of CaCO3 crystals obtained in the presence PAA grafted partially-dissolved starch at
different magnifications (A & B) (Crystals were synthesized at 25 oC, [Ca2+] = [CO32-] = 0.025 M, pH
8.5 and [polymeric additives] = 0.77 g/L).
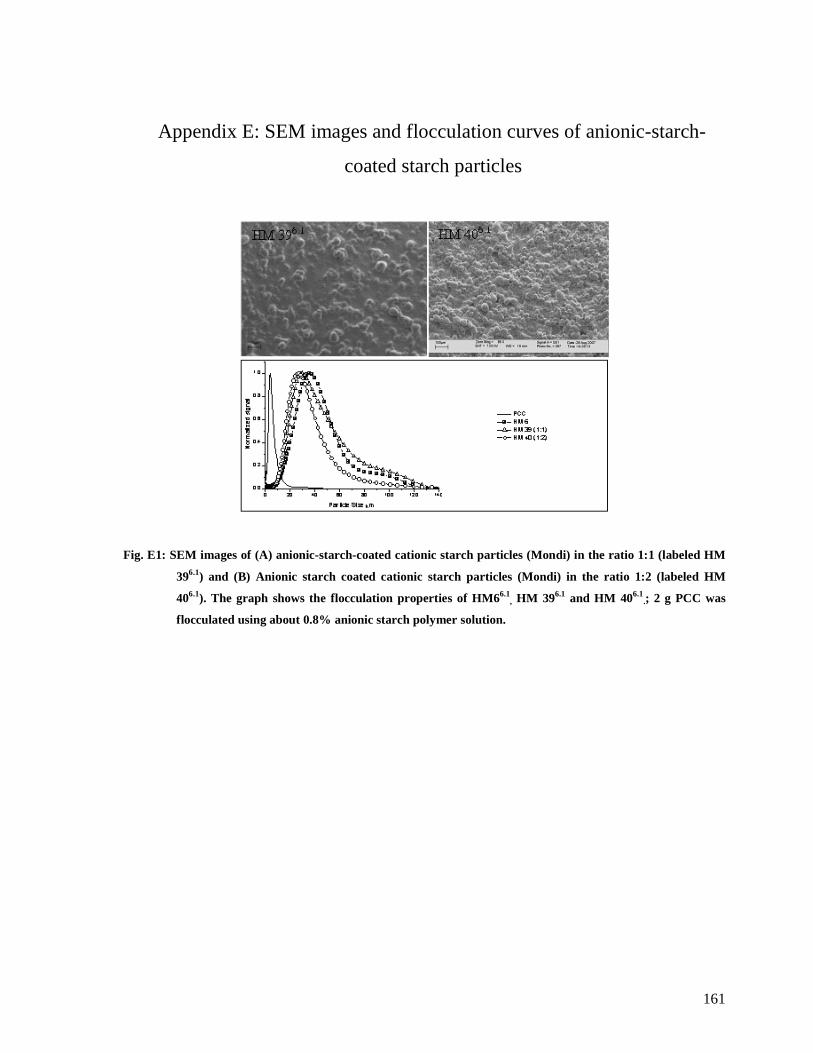
161
Appendix E: SEM images and flocculation curves of anionic-starch-
coated starch particles
Fig. E1: SEM images of (A) anionic-starch-coated cationic starch particles (Mondi) in the ratio 1:1 (labeled HM
396.1) and (B) Anionic starch coated cationic starch particles (Mondi) in the ratio 1:2 (labeled HM
406.1). The graph shows the flocculation properties of HM66.1, HM 396.1 and HM 406.1
.; 2 g PCC was
flocculated using about 0.8% anionic starch polymer solution.
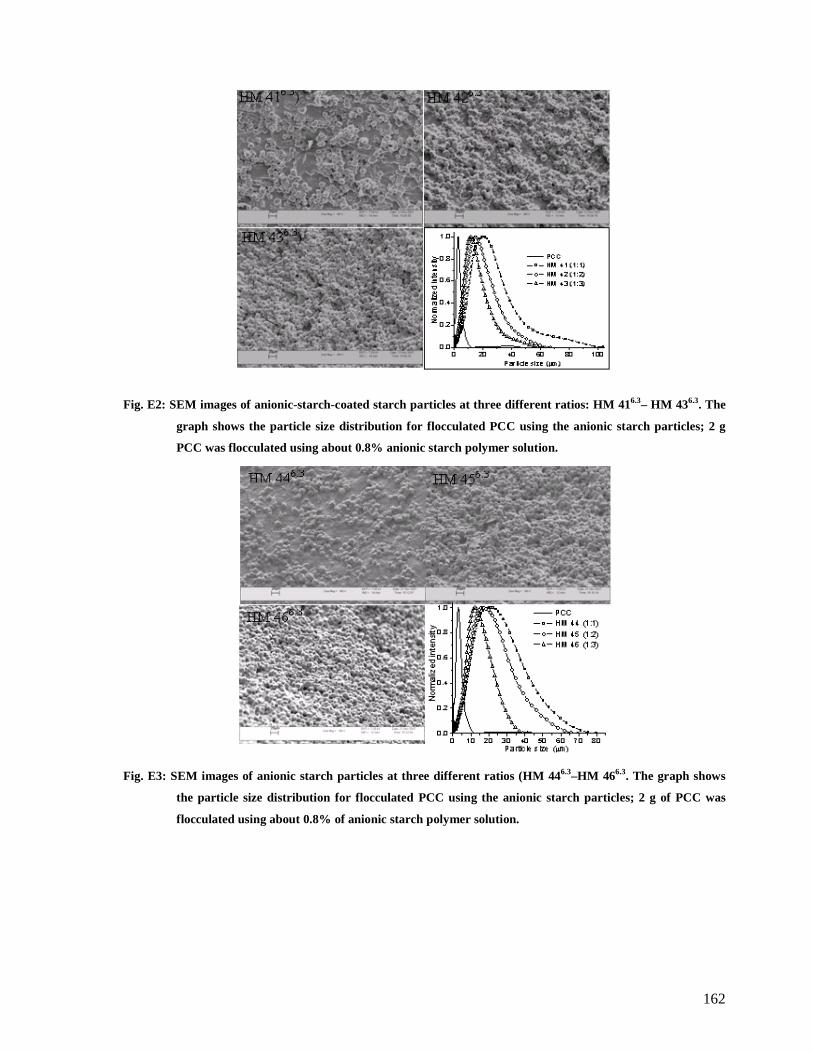
162
Fig. E2: SEM images of anionic-starch-coated starch particles at three different ratios: HM 416.3– HM 436.3. The
graph shows the particle size distribution for flocculated PCC using the anionic starch particles; 2 g
PCC was flocculated using about 0.8% anionic starch polymer solution.
Fig. E3: SEM images of anionic starch particles at three different ratios (HM 446.3–HM 466.3. The graph shows
the particle size distribution for flocculated PCC using the anionic starch particles; 2 g of PCC was
flocculated using about 0.8% of anionic starch polymer solution.
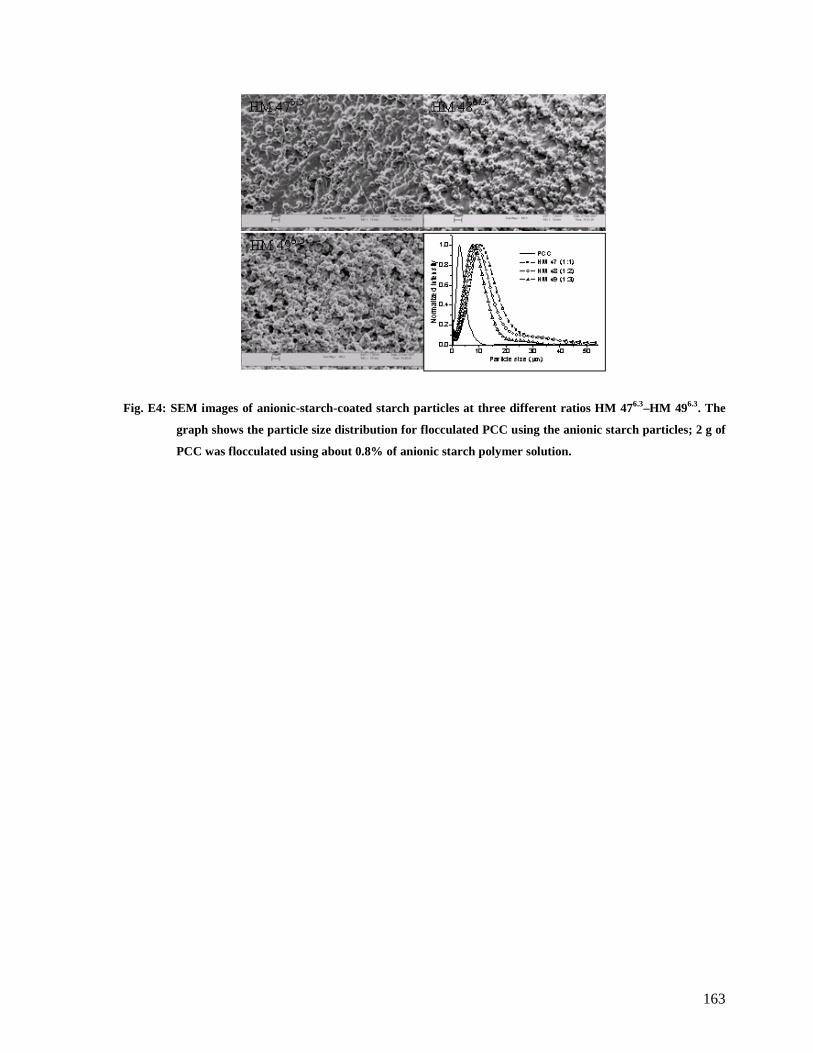
163
Fig. E4: SEM images of anionic-starch-coated starch particles at three different ratios HM 476.3–HM 496.3. The
graph shows the particle size distribution for flocculated PCC using the anionic starch particles; 2 g of
PCC was flocculated using about 0.8% of anionic starch polymer solution.

164
Appendix F: SEM images and flocculation curves of starch particles
Fig. F1: SEM images of swollen anionic starch coated starch particles at different magnifications (A & B).
Fig. F2: The effect of dilution on particle size distribution of flocculated PCC prepared using anionic starch
particles HM 416.3.
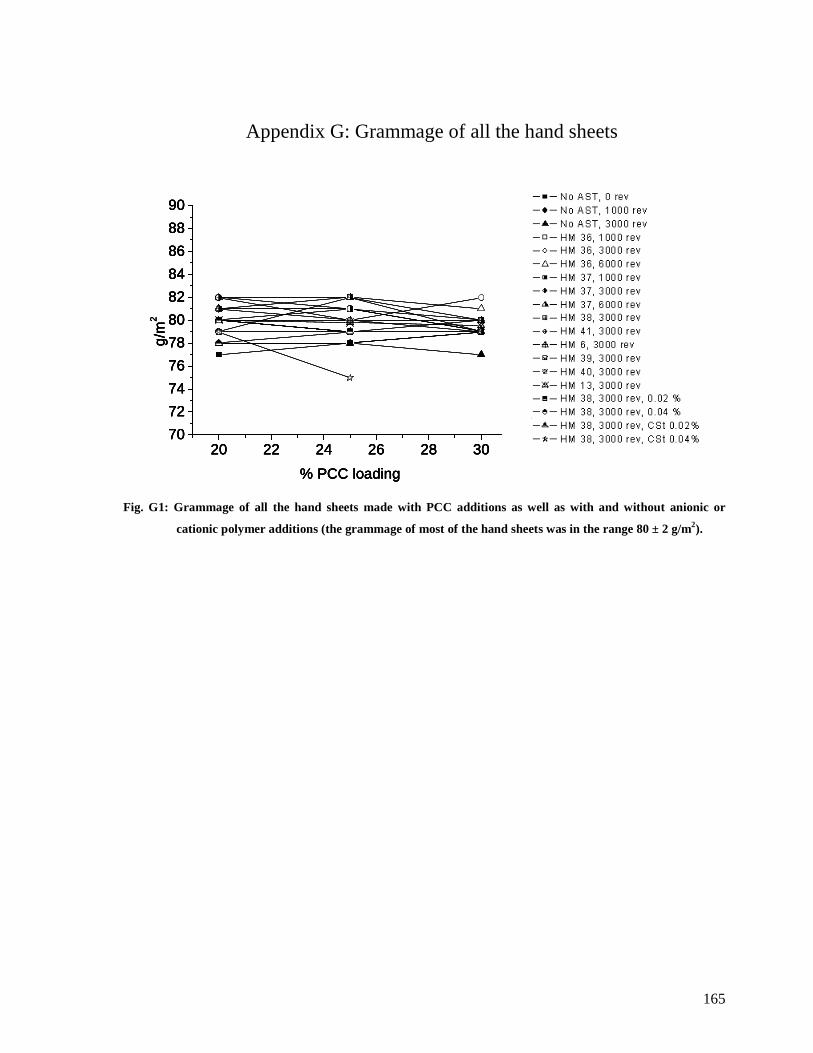
165
Appendix G: Grammage of all the hand sheets
Fig. G1: Grammage of all the hand sheets made with PCC additions as well as with and without anionic or
cationic polymer additions (the grammage of most of the hand sheets was in the range 80 ± 2 g/m2).
20 22 24 26 28 3070
72
74
76
78
80
82
84
86
88
90
g/m
2
% PCC loading
20 22 24 26 28 3070
72
74
76
78
80
82
84
86
88
90
g/m
2
% PCC loading
20 22 24 26 28 3070
72
74
76
78
80
82
84
86
88
90
g/m
2
% PCC loading
20 22 24 26 28 3070
72
74
76
78
80
82
84
86
88
90
g/m
2
% PCC loading

166
Appendix H: Effect of fiber refining on properties of unfilled and filled
paper
Fig. H1: SEM images showing the morphology of fibers refined at different revolutions (rev.); A) 0, B) 1500 and
C) 3000, at different magnifications.
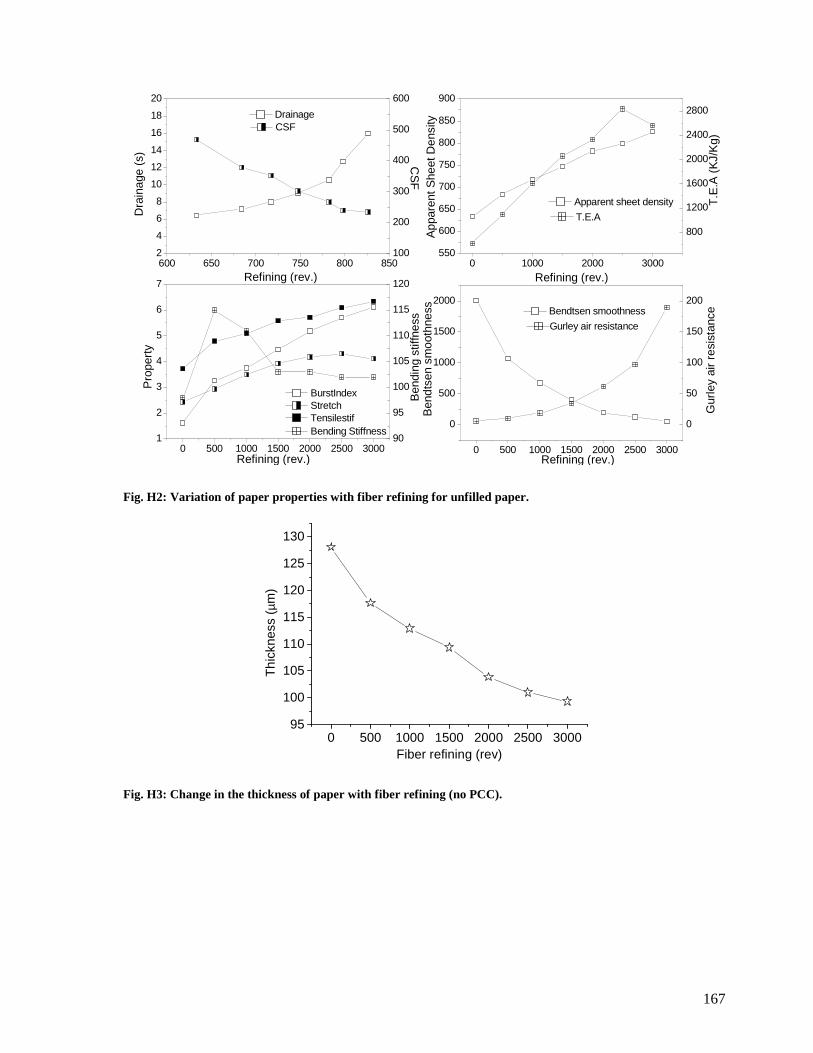
167
Fig. H2: Variation of paper properties with fiber r efining for unfilled paper.
Fig. H3: Change in the thickness of paper with fiber refining (no PCC).
0 500 1000 1500 2000 2500 300095
100
105
110
115
120
125
130
Thi
ckne
ss (
µm)
Fiber refining (rev)
800
1200
1600
2000
2400
2800
100
200
300
400
500
600
90
95
100
105
110
115
120
0
50
100
150
200
600 650 700 750 800 8502
4
6
8
10
12
14
16
18
20
T.E
.A (
KJ/
Kg)
Gur
ley
air
resi
stan
ce
Ben
dtse
n sm
ooth
ness
Ben
ding
stif
fnes
s
Pro
pert
y
Drainage
App
aren
t She
et D
ensi
ty
Dra
inag
e (s
)
Refining (rev.)
CS
F
0 1000 2000 3000550
600
650
700
750
800
850
900
Apparent sheet density
Refining (rev.)
0 500 1000 1500 2000 2500 30001
2
3
4
5
6
7
Refining (rev.)
BurstIndex Stretch Tensilestif
0 500 1000 1500 2000 2500 3000
0
500
1000
1500
2000
Refining (rev.)
Bendtsen smoothness
T.E.A
CSF
Bending Stiffness
Gurley air resistance

168
Fig. H3: The thickness and PCC retention for hand sheets made without anionic starch additives at different
fiber refining levels.
Fig. H4: Changes in paper properties with PCC loading and fiber refining.
0
500
1000
1500
2000
2500
3000
3500
4000
500
550
600
650
700
750
800
1
2
3
4
1.8
2.4
3.0
3.6
20 22 24 26 28 300
1
2
3
4
5S
tret
ch BI (0 rev.) BI (1000 rev.) BI (3000 rev.)
Bur
st in
dex
PCC content (%)
App
aren
t she
et d
ensi
ty
20 22 24 26 28 300
2
4
6
8
10
12
14
16
PCC content (%)
GAR (0 rev.) GAR (1000 rev.) GAR (3000 rev.)
Gur
ley
air
resi
stan
ce
20 22 24 26 28 30
20
30
40
50
60
PCC content (%)
TI (0 rev.) TI (1000 rev.) TI (3000 rev.)
Ten
sile
inde
x
20 22 24 26 28 30
50
60
70
80
PCC content (%)
BS (0 rev.) BS (1000 rev.) BS (3000 rev.)
Ben
ding
stif
fnes
s
BTS (1000 rev) BTS (3000 rev)
ASD (0 rev.) ASD (1000 rev.) ASD (3000 rev.)
STR (0 rev.) STR (1000 rev.) STR (3000 rev.)
TS (0 rev.) TS (100 rev.) TS (3000 rev.)
Ben
dtse
n sm
ooth
ness
Ten
sile
stif
fnes
s
BI – burst index, ASD – apparent sheet density, GAR –Gurley air resistance, BTS – Bendtsen smoothness, TI – tensile index, BS – bending stiffness, TS – tensile stiffnessBI – burst index, ASD – apparent sheet density, GAR –Gurley air resistance, BTS – Bendtsen smoothness, TI – tensile index, BS – bending stiffness, TS – tensile stiffness
20 22 24 26 28 30 3265
70
75
80
85
90
95
Ret
entio
n (%
)
PCC loading (%)
0 rev 1000 rev 3000 rev
20 22 24 26 28 30
100
110
120
130
140
150
0 rev 1000 rev 3000 rev
Thi
ckne
ss (
µm)
PCC content (%)20 22 24 26 28 30 32
65
70
75
80
85
90
95
Ret
entio
n (%
)
PCC loading (%)
0 rev 1000 rev 3000 rev
20 22 24 26 28 30
100
110
120
130
140
150
0 rev 1000 rev 3000 rev
Thi
ckne
ss (
µm)
PCC content (%)20 22 24 26 28 30 32
65
70
75
80
85
90
95
Ret
entio
n (%
)
PCC loading (%)
0 rev 1000 rev 3000 rev
20 22 24 26 28 30
100
110
120
130
140
150
0 rev 1000 rev 3000 rev
Thi
ckne
ss (
µm)
PCC content (%)
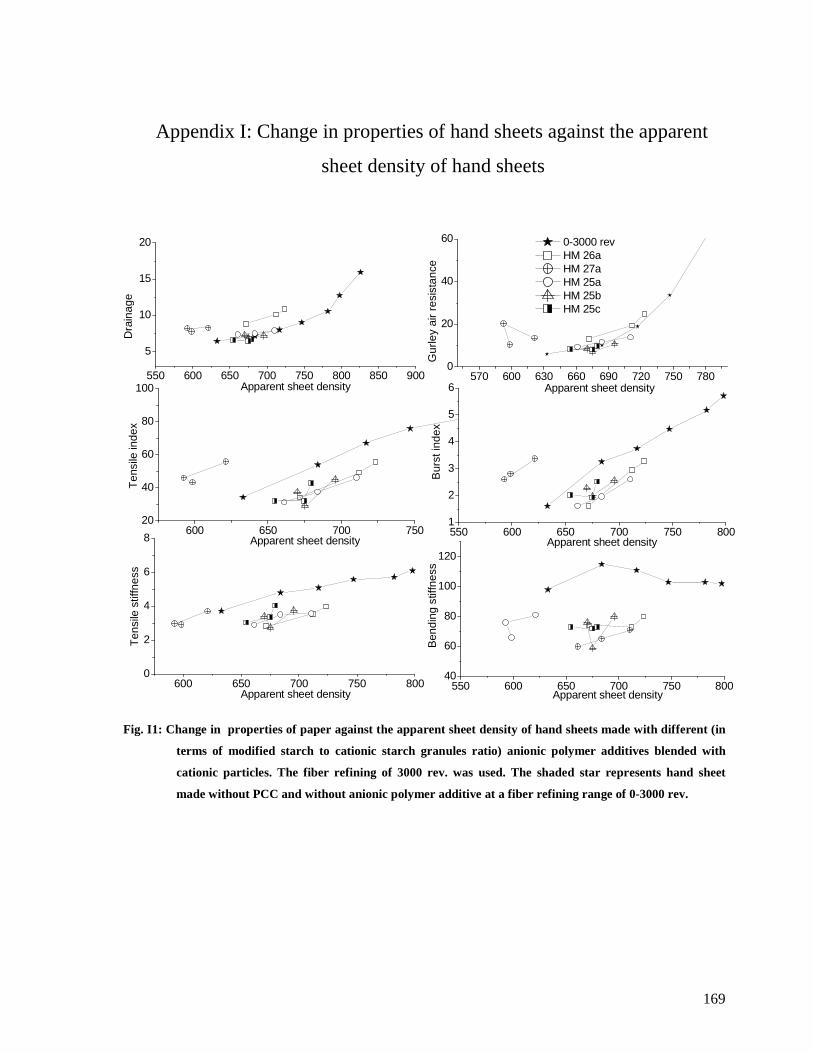
169
Appendix I: Change in properties of hand sheets against the apparent
sheet density of hand sheets
550 600 650 700 750 800 850 900
5
10
15
20
600 650 700 75020
40
60
80
100
550 600 650 700 750 8001
2
3
4
5
6570 600 630 660 690 720 750 780
0
20
40
60
600 650 700 750 8000
2
4
6
8
550 600 650 700 750 80040
60
80
100
120
Dra
inag
e
Apparent sheet density
Bur
st in
dex
Apparent sheet density
Apparent sheet density
Apparent sheet density
0-3000 rev HM 26a HM 27a HM 25a HM 25b HM 25c
Ben
ding
stif
fnes
sG
urle
y ai
r re
sist
ance
Ten
sile
inde
xT
ensi
le s
tiffn
ess
Apparent sheet density
Apparent sheet density
Fig. I1: Change in properties of paper against the apparent sheet density of hand sheets made with different (in
terms of modified starch to cationic starch granules ratio) anionic polymer additives blended with
cationic particles. The fiber refining of 3000 rev. was used. The shaded star represents hand sheet
made without PCC and without anionic polymer additive at a fiber refining range of 0-3000 rev.
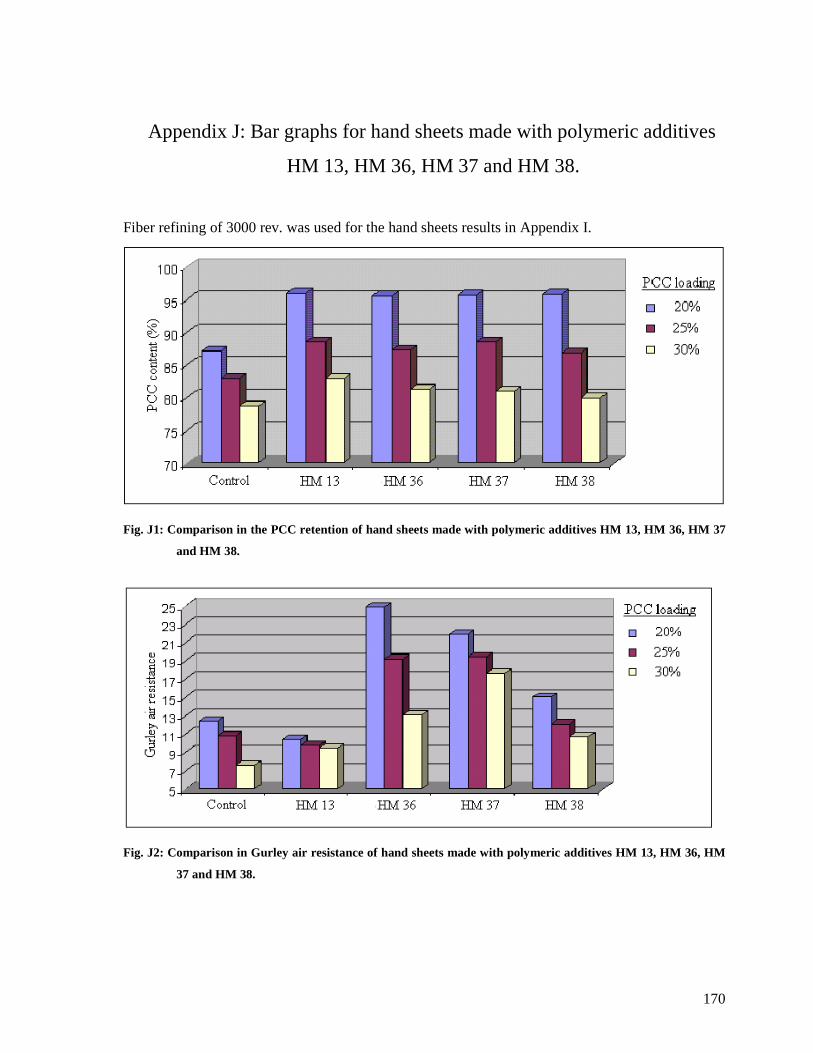
170
Appendix J: Bar graphs for hand sheets made with polymeric additives
HM 13, HM 36, HM 37 and HM 38.
Fiber refining of 3000 rev. was used for the hand sheets results in Appendix I.
Fig. J1: Comparison in the PCC retention of hand sheets made with polymeric additives HM 13, HM 36, HM 37
and HM 38.
Fig. J2: Comparison in Gurley air resistance of hand sheets made with polymeric additives HM 13, HM 36, HM
37 and HM 38.
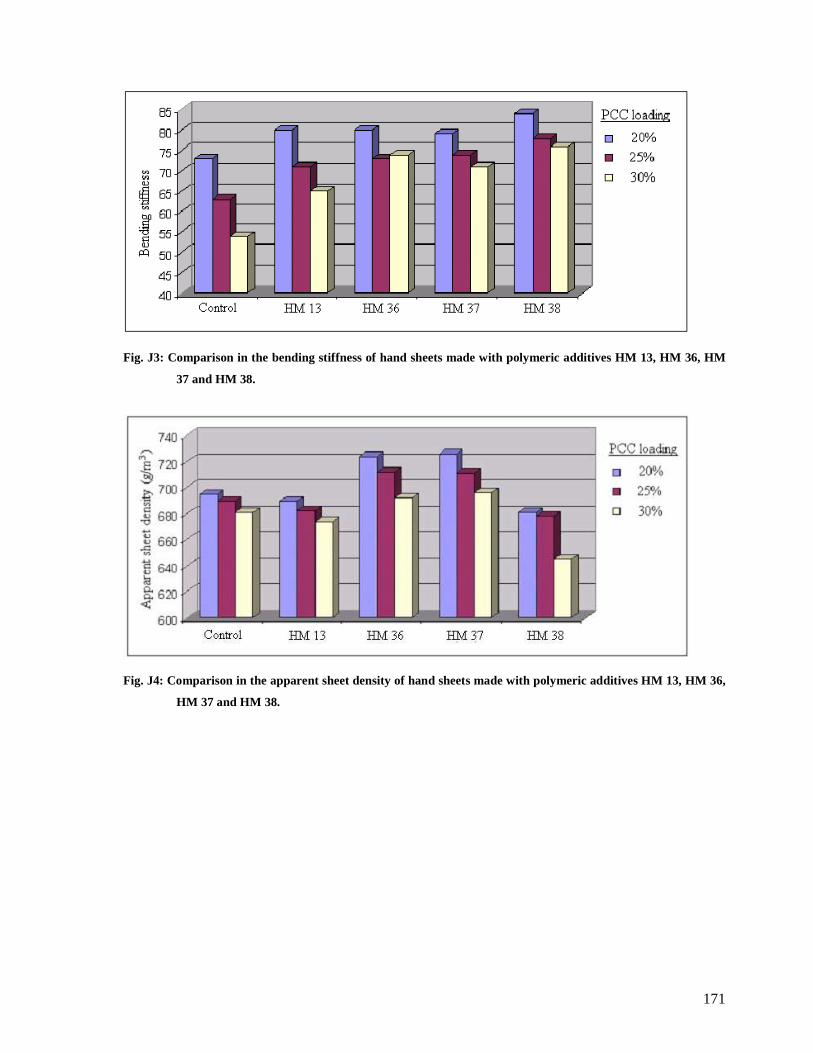
171
Fig. J3: Comparison in the bending stiffness of hand sheets made with polymeric additives HM 13, HM 36, HM
37 and HM 38.
Fig. J4: Comparison in the apparent sheet density of hand sheets made with polymeric additives HM 13, HM 36,
HM 37 and HM 38.
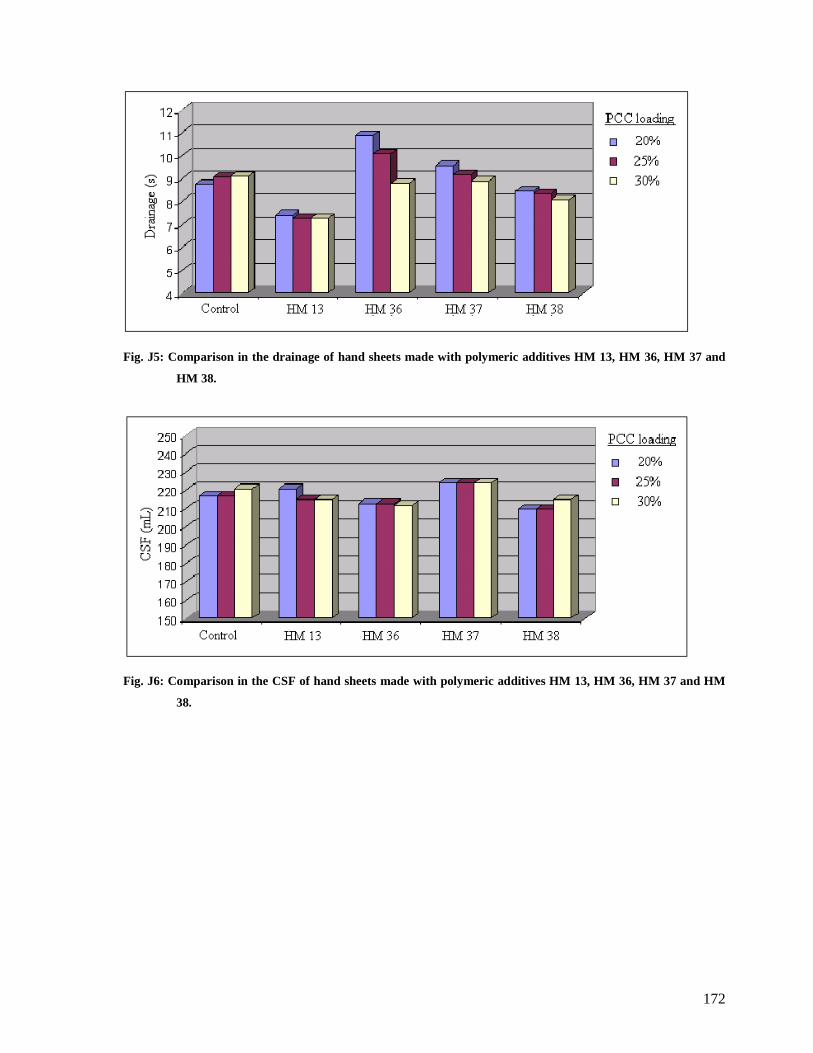
172
Fig. J5: Comparison in the drainage of hand sheets made with polymeric additives HM 13, HM 36, HM 37 and
HM 38.
Fig. J6: Comparison in the CSF of hand sheets made with polymeric additives HM 13, HM 36, HM 37 and HM
38.
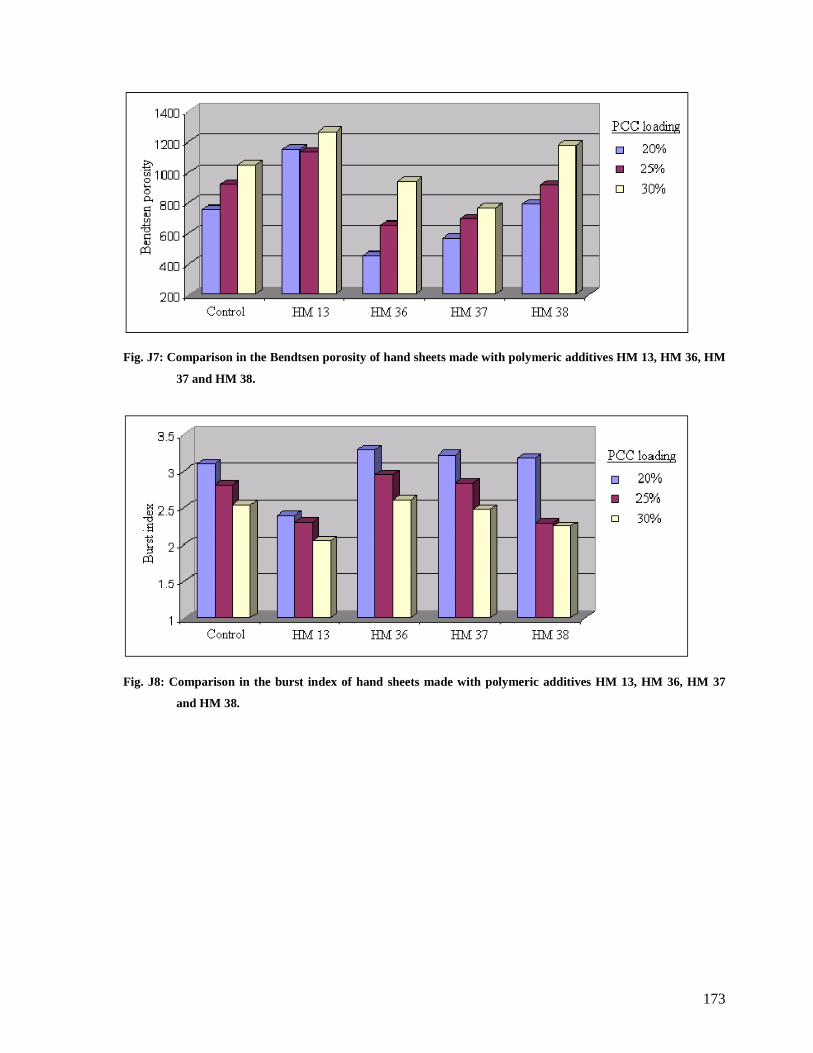
173
Fig. J7: Comparison in the Bendtsen porosity of hand sheets made with polymeric additives HM 13, HM 36, HM
37 and HM 38.
Fig. J8: Comparison in the burst index of hand sheets made with polymeric additives HM 13, HM 36, HM 37
and HM 38.
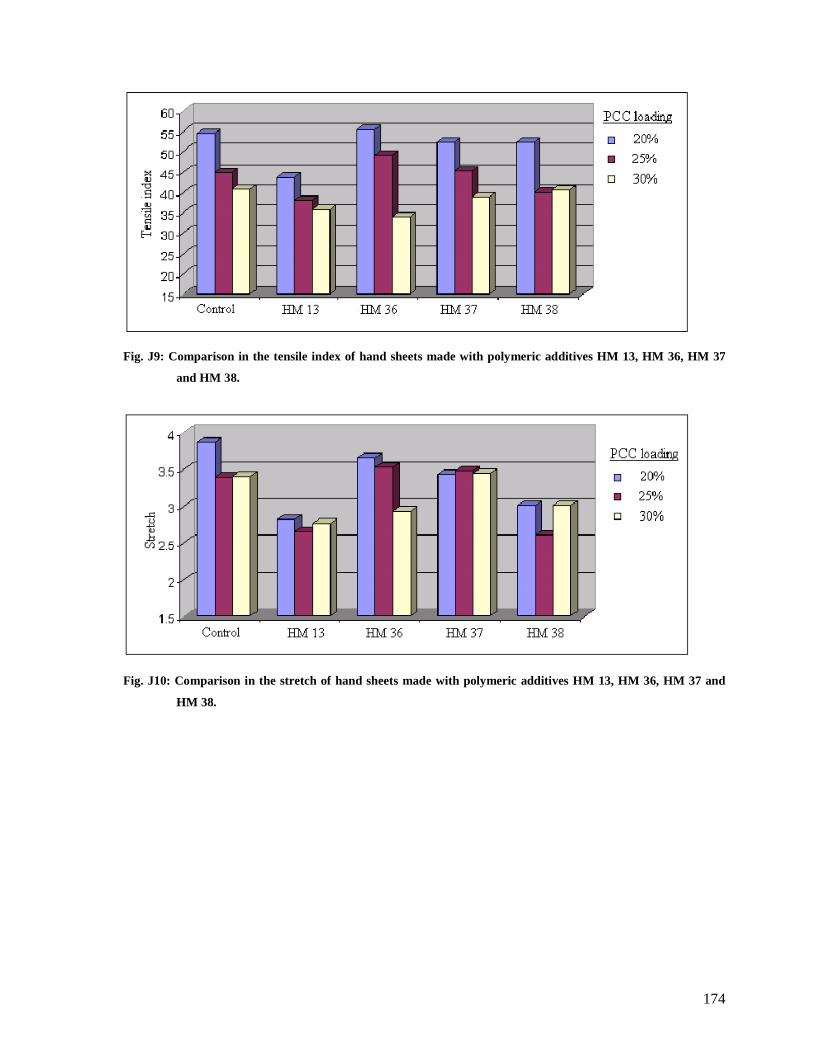
174
Fig. J9: Comparison in the tensile index of hand sheets made with polymeric additives HM 13, HM 36, HM 37
and HM 38.
Fig. J10: Comparison in the stretch of hand sheets made with polymeric additives HM 13, HM 36, HM 37 and
HM 38.
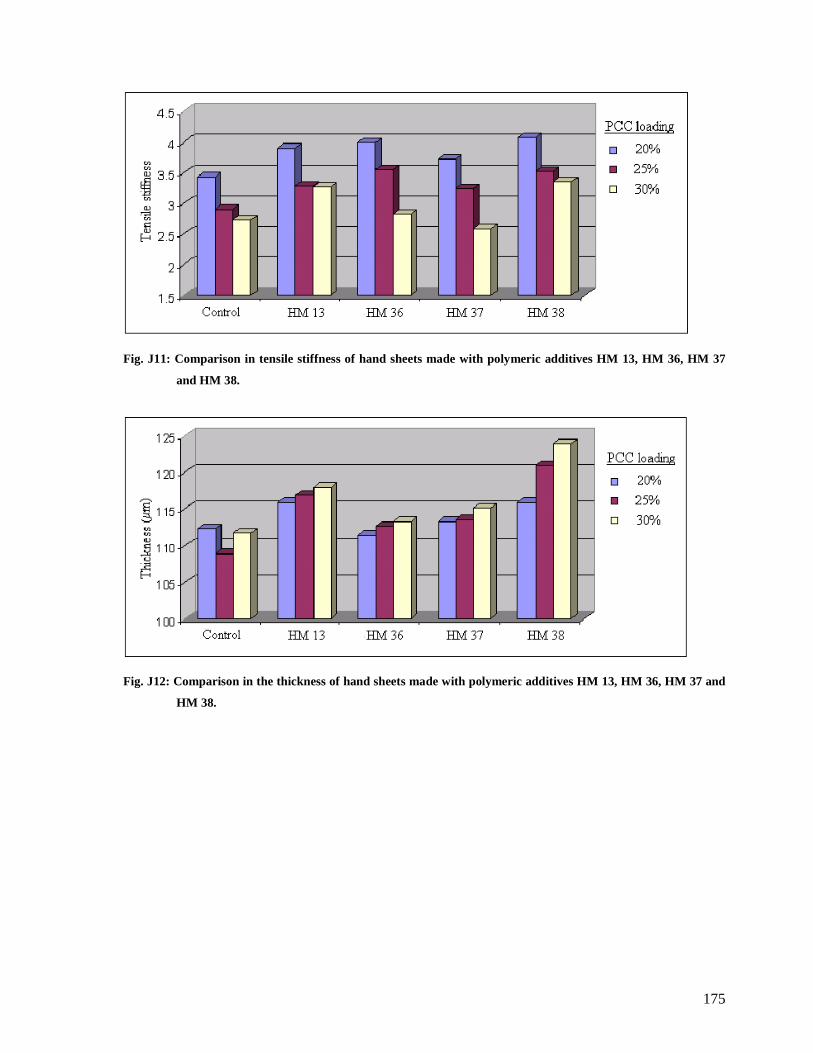
175
Fig. J11: Comparison in tensile stiffness of hand sheets made with polymeric additives HM 13, HM 36, HM 37
and HM 38.
Fig. J12: Comparison in the thickness of hand sheets made with polymeric additives HM 13, HM 36, HM 37 and
HM 38.